Embed Size (px)
Citation preview

CPD Occasional Paper Series
Trade Liberalisation and the Crop Sector in Bangladesh
Paper 23
Mahabub Hossain Uttam Kumar Deb
Price Tk. 35.00
Centre for Policy Dialogue House No 40/C, Road No 11 (new), Dhanmondi R/A, Dhaka-1209
Mailing Address: GPO Box 2129, Dhaka 1000, Bangladesh Tel: (880 2) 8124770, 9141703. 9141734; Fax: (880 2) 8130951
E-mail: [email protected]; Website: www.cpd-bangladesh.orgJune, 2003

CPD Occasional Paper Series 23
The Centre for Policy Dialogue (CPD), established in 1993, is a civil society initiative to promote an ongoing dialogue between the principal partners in the decision-making and implementing process. The dialogues are designed to address important policy issues and to seek constructive solutions to these problems. The Centre has already organised a series of such dialogues at local, regional and national levels. The CPD has also organised a number of South Asian bilateral and regional dialogues as well as some international dialogues. These dialogues have brought together ministers, opposition frontbenchers, MPs, business leaders, NGOs, donors, professionals and other functional groups in civil society within a non-confrontational environment to promote focused discussions. The CPD seeks to create a national policy consciousness where members of civil society will be made aware of critical policy issues affecting their lives and will come together in support of particular policy agendas which they feel are conducive to the well being of the country.
In support of the dialogue process the Centre is engaged in research programmes which are both serviced by and are intended to serve as inputs for particular dialogues organised by the Centre throughout the year. Some of the major research programmes of CPD include The Independent Review of Bangladesh's Development (IRBD), Governance and Development, Population and Sustainable Development, Trade Policy Analysis and Multilateral Trading System and Leadership Programme for the Youth. The CPD also carries out periodic public perception surveys on policy issues and developmental concerns.
Dissemination of information and knowledge on critical developmental issues continues to remain an important component of CPD’s activities. Pursuant to this CPD maintains an active publication programme, both in Bangla and in English. As part of its dissemination programme, CPD has decided to bring out CPD Occasional Paper Series on a regular basis. Dialogue background papers, investigative reports and results of perception surveys which relate to issues of high public interest will be published under its cover. The Occasional Paper Series will also include draft research papers and reports, which may be subsequently published by the CPD.
The present paper, Trade Liberalisation and the Crop Sector in Bangladesh, has been prepared as part of CPD’s on-going agricultural policy research and advocacy activities with the International Rice Research Institute (IRRI) under the Poverty Elimination Through Rice Research Assistance (PETRRA) project.
The present paper titled Trade Liberalisation and the Crop Sector in Bangladesh has been jointly prepared by Dr Mahabub Hossain, Head, Social Sciences Division, International Rice Research Institute, Los Banos, Laguna, Philippines and Dr Uttam Kumar Deb, Research Fellow, Centre for Policy Dialogue (CPD). The paper was presented at the dialogue on Liberalisation of Crop Sector: Can Bangladesh Withstand Regional Competition? held on January 8, 2003 at BRAC centre INN Conference Room, Dhaka. Assistant Editor: Anisatul Fatema Yousuf, Head (Dialogue & Communication), CPD Series Editor: Debapriya Bhattacharya, Executive Director, CPD
Trade Liberalisation and the Crop Sector in Bangladesh i

CPD Occasional Paper Series 23
TRADE LIBERALISATION AND THE CROP SECTOR IN
BANGLADESH1
I. INTRODUCTION Agriculture was brought under the purview of GATT, 1994 with a view to minimise
distortions in global trade in agricultural and food products. Negotiations on
agricultural sector trade had earlier been excluded from GATT on the ground of food
security and socio-political stability, which makes agriculture different from other
sectors of the economy. By the time the Uruguay Round of negotiations began, many
countries had started voicing the need to liberalise agriculture, particularly for
opening this highly protected sector in the developed countries to more efficient
producers from developing countries. For implementation of the rules agreed during
the Uruguay Round of multilateral trade negotiations, the GATT Secretariat has been
transformed into the World Trade Organisation (WTO) on January 1, 1995.
The commitments under the Agreement on Agriculture (AoA) in GATT-UR may be
broadly categorised into thee groups, a) market access, b) domestic support, and c)
export competition.
The provisions under the market access call for conversion of non-tariff trade barriers
to bound tariff equivalents, reduction of bound tariffs over time, and setting of “low”
import tariffs for a fixed quota of imports. In case of commodities for which the
import level was negligible, a minimum level of access of three percent of domestic
consumption during the base year was required to be made for the developing
countries and five percent for the developed countries. Being an LDC, Bangladesh is
not required to undertake any such commitment. However, Bangladesh will not be
allowed to increase its bound tariff. Tariff bound for Bangladesh has been set at a
uniform ceiling rate of 200% for all agricultural goods except 13 items for which
bound rate is 50%. Bound tariff rates for two agricultural products (green and black
tea) were lower than actual operative tariff.
1 This paper is based on data collected under the IRRI Project “Poverty Elimination Through Rice
Research Assistance (PETRRA)” in Bangladesh. Financial assistance received from Department for International Development (DFID), UK is gratefully acknowledged.
Trade Liberalisation and the Crop Sector in Bangladesh 1

CPD Occasional Paper Series 23
Under the provision of domestic support the countries were asked to quantify all trade
distorting domestic policies, translate them into an aggregate measure of support
(AMS) and progressively reduce them. The value of AMS should not exceed five
percent of the value of output for the developed countries and 10% for the developing
countries. Policies that are not trade distorting in nature are excluded from AMS
calculations. These include investments in R&D, development of infrastructure and
marketing information, programs for environmental protection and direct payments
scheme based on fixed area and production that subsidises farmers’ incomes.
Under the provision of export subsidies countries were committed to reduce subsidies
on 22 different agricultural commodities, and the developed countries were required
to reduce the value of export subsidies by 36% and reduce the quantities of subsidised
exports by 21% during 1995 to 2000. The least developed countries (which include
Bangladesh) are exempted from commitments to reduce domestic support and export
subsidy, while the developing countries have been allowed delayed implementation in
these respects.
Developments since the signing of AOA have raised concerns among the developing
and the least developed countries regarding market access to developed countries for
their exports. Instead of reducing agricultural subsidies the developed countries had in
fact raised them in many cases. The OECD producer subsidy equivalent had been
increased from 31% in 1997 to 40% in 1999. The United States (US) farm bill signed
in May 2002 includes over US$135 billion in new subsidies over the next 10 years. It
is estimated that the rice farmers in USA receive US$75,000 per household from the
government in the form of direct payments.
In view of these developments many countries in the Asian region are reconsidering
their policies on trade in agriculture and positioning themselves within the umbrella of
AoA to protect the agricultural sector. Within this context it is important and timely
for Bangladesh to assess its comparative position vis-à-vis other countries in the
region, particularly with regard to India with whom Bangladesh has already had a
huge imbalance in trade.
Trade Liberalisation and the Crop Sector in Bangladesh 2

CPD Occasional Paper Series 23
The objective of this paper is to present a comparative picture of the cost of
production and prices of major crop sector outputs, and to assess the trade policies
presently practiced by India. Hopefully the information will be useful to the
government for devising appropriate policies for protecting the interest of the vast
majority of low-income consumers and farm producers in the country.
II. CROP SECTOR: IMPORTANCE AND CONCERNS The crop sector is of strategic importance to Bangladesh, as in most other low-income
countries. It is the source of staple food for 130 million people and the major means
of livelihood of 13 million farm households in the country. In 2000-01 the crop and
horticulture sector contributed US $8,450 million to the economy, accounting for 18%
of the gross domestic product (GDP) at current market prices. According to the report
of the Household Income and Expenditure Survey-2000 conducted by the Bangladesh
Bureau of Statistics, the consumers spent nearly US $9.8 billion on the crop sector
output (Table 1), which comprises 25% of the private sector consumption expenditure
in Bangladesh. Crop production activities generated 2,065 million person days,
equivalent to full-time yearly employment of 7.9 million people in labor force. The
average import of the crop sector output for the 1998-2000 period is estimated at US
$1.2 billion, about 24% of the export earnings of the country. So any change in the
domestic production and import for the sector following the liberalisation of trade
would make a large impact on producers’ and consumers’ welfare, government’s
revenue earnings, the balance of trade and the rural sector employment situations.
TABLE 1: IMPORTANCE OF THE CROP SECTOR OUTPUT IN NATIONAL
EXPENDITURE AND EMPLOYMENT, 2000
Imports Crop sector output National expenditure
(US$ million)
Employment (million person days) (US$ million,
1998-2000) Percent of
expenditure Cereals 6,030 1,476 547 9.1 Pulses 430 49 85 19.8 Oils 575 52 473 82.3 Vegetables 1,398 266 0 - Spices 1,092 145 30 2.7 Sugar & Gur 279 77 51 18.3 Total 9,804 2,065 1,186 12.1
Source: BBS, Report of the Household Income and the Expenditure Survey, 2000 and IRRI survey on cost and return in crop cultivation, 2000-2001.
A major issue concerned with the crop sector is the inflexibility of resources tied in
production activities. Land is the dominant factor of production. Because of specific
Trade Liberalisation and the Crop Sector in Bangladesh 3

CPD Occasional Paper Series 23
agro-ecological situation that determine the suitability of land for the production of
different crops, land cannot be easily shifted from one crop to another without some
loss in yield. For example rice is the only crop that can be grown in low-lying land
that remains submerged with water during the monsoon season. So whatever be the
price of rice the farmer has no alternative but to grow aman rice during the wet
season, while they can choose among alternative crops during the dry season
depending on the relative productivity and profitability. The crop sector is also
‘employer of last resort’ and the main source of livelihood for the illiterate and low-
educated people who do not have alternative employment opportunities. A reduction
in price and the profitability for the crop sector activities may not necessarily lead to
reallocation of labor to more productive activities outside the sector, an argument
made by proponents of free trade. Under Bangladesh conditions it may lead to lower
earnings for the farmers and lower wage rate for the agricultural laborers, thereby
worsening the poverty situation in the country.
Another important issue regarding the trade and price policy in the crop sector is the
balancing of interests for the producers and consumers. The crop sector is the source
of production of staple food. Too much protection of the sector will raise food prices
out of line in the international market that will benefit farmers at the cost of
consumers, and vice-versa. A major concern for the government is maintaining
stability in food prices, since price instability affects the food security of the poor. The
bottom 40% of the rural households in the per capita income scale spends nearly 52%
of their budget on the crop sector output, 35% on rice and wheat alone (Table 2). The
corresponding numbers for the urban areas are 42% and 25% respectively. While the
top 10% of the households in the income scale allocate 18% and 13% of their budget
on crop sector output. Thus maintaining the price of the crop sector products at an
affordable level is a major element in the strategy for poverty alleviation. Trade
policies that allow consumers to access food
Trade Liberalisation and the Crop Sector in Bangladesh 4

CPD Occasional Paper Series 23
TABLE 2: AVERAGE BUDGET SHARE (%) OF THE CROP SECTOR OUTPUT FOR THE BOTTOM 40% AND THE TOP 10% OF HOUSEHOLDS IN RURAL AND URBAN AREAS
Rural Area Urban Area Crop sector output
Bottom 40% Top 10% Bottom 40% Top 10% Cereals 34.6 9.7 25.0 5.9 Pulses 1.8 1.0 2.1 0.9 Oils 2.4 1.2 2.4 1.1 Vegetables 6.9 2.8 6.4 2.0 Spices 4.9 2.3 4.5 1.8 Sugar & Gur 1.0 0.8 1.1 0.9 Total 51.6 17.8 41.5 12.6
Source: BBS, Household Income and Expenditure Survey-2000. from the lowest cost source in the international market is thus important for the
welfare of the low-income consumers, but it is equally important to protect them from
large fluctuations in the prices of staple food in the world market. It is also important
to maintain an incentive price for farmers to sustain the long-term growth in
production of staple food, and the balance between the demand and supply for
maintaining the stability in prices in the domestic market. A fair price for farm
products is also important for poverty alleviation, since two-thirds of the farmers
operate a size of holding of less than one hectare, which is incapable of generating the
poverty level income.
III. UNIT COST OF PRODUCTION AND PRICES This section provides a comparative picture of the cost of production of Bangladesh
with the major exporting countries in the region for rice, and with India for non-rice
crops. The data will reveal the position of Bangladesh with regards to unit cost of
production and returns to land at current market prices for inputs and output.
The costs and returns data for Bangladesh was collected for 2000 crop seasons from a
nationally representative sample of 1880 farm households from 62 villages belonging
to 57 of the 64 districts. The original sample was drawn by the Bangladesh Institute of
Development Studies (BIDS) in collaboration with the international Rice Research
Institute (IRRI) in 1987 by using a multistage random sampling framework, taking
random samples at the union, village and household levels. The 2000 survey was
conducted by Socio-Consult Ltd for an IRRI sponsored study on determinants of rural
livelihoods in Bangladesh. The data for India are obtained from Reports of the
Commission for Agricultural Costs and Prices (CACP) and refers to the crop seasons
Trade Liberalisation and the Crop Sector in Bangladesh 5

CPD Occasional Paper Series 23
1998-99 and 1999-2000. The data for Thailand and Vietnam are obtained from the
large-scale village studies conducted by IRRI and refer to the 2000 crop year.
The cost includes variables costs of production (all material inputs, irrigation charges
and machine rental) and imputed value of family labor and family supplied animal
power. The rental value of land and the depreciation of other fixed assets are not
included because of the problem of comparing these values across countries. The
Indian data shows that the costs on land and other fixed assets may account for an
additional 60% of the costs. The net returns to land and other fixed factors per ha are
estimated by multiplying the difference of the unit variable cost from the farm-gate
price with the yield per ha, for comparison of returns from crop cultivation per unit of
land across countries. For international comparison the values have been converted in
US dollars using the exchange rate for the reference year. The details of the cost
structure and the farm-gate prices can be seen from appendix tables. Key information
as revealed from the data is reported below.
For rice, the variable cost of production per unit of output is the lowest for Punjab in
India followed by Vietnam and Thailand (Table 3). For Bangladesh the cost of
production is higher in the cultivation of boro rice than in aman rice. However, the
cost for Bangladesh is lower than that in the neighboring Indian state of West Bengal.
Comparison with Punjab and Andhra Pradesh is however more appropriate since most
of the marketable surplus of rice in India is generated in those two States. Compared
to Thailand, which is the largest rice exporter in the world market, the cost of
production in Bangladesh is 62% higher for the dry season crop (boro) and 18%
higher for the wet season (aman).
The farm-gate price as well as the margin for the farmer (price over variable cost) is
however substantially higher in Bangladesh and India compared to Thailand and
Vietnam (Table 3). Thai farmers can offer rice at a lower margin to consumers
because of the substantially larger size of farm compared to other rice growing
countries in Asia. The average farm size in Thailand is over 5 ha, compared to 0.68 ha
in Bangladesh. Thus, even with lower margin per unit of output Thai farms could
have substantially higher household incomes than Bangladeshi farmers. The farm-gate
Trade Liberalisation and the Crop Sector in Bangladesh 6
CPD Occasional Paper Series 23
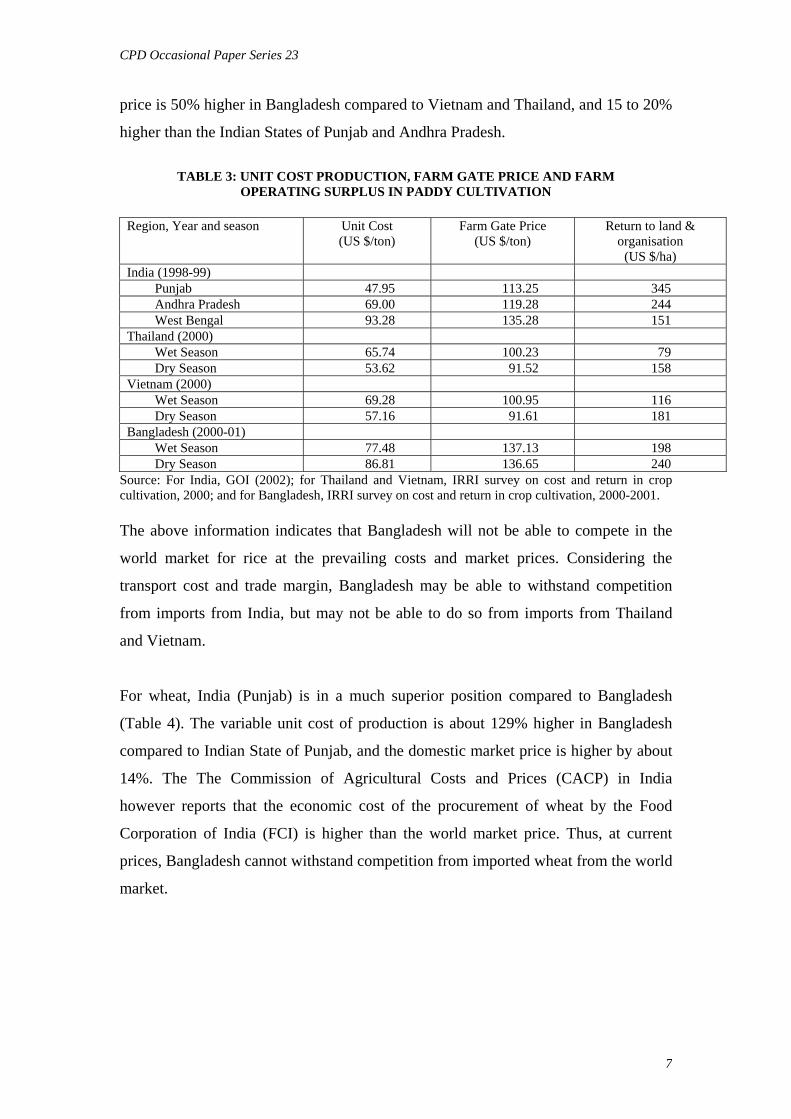
price is 50% higher in Bangladesh compared to Vietnam and Thailand, and 15 to 20%
higher than the Indian States of Punjab and Andhra Pradesh.
TABLE 3: UNIT COST PRODUCTION, FARM GATE PRICE AND FARM
OPERATING SURPLUS IN PADDY CULTIVATION
Region, Year and season Unit Cost (US $/ton)
Farm Gate Price (US $/ton)
Return to land & organisation
(US $/ha) India (1998-99) Punjab 47.95 113.25 345 Andhra Pradesh 69.00 119.28 244 West Bengal 93.28 135.28 151 Thailand (2000) Wet Season 65.74 100.23 79 Dry Season 53.62 91.52 158 Vietnam (2000) Wet Season 69.28 100.95 116 Dry Season 57.16 91.61 181 Bangladesh (2000-01) Wet Season 77.48 137.13 198 Dry Season 86.81 136.65 240
Source: For India, GOI (2002); for Thailand and Vietnam, IRRI survey on cost and return in crop cultivation, 2000; and for Bangladesh, IRRI survey on cost and return in crop cultivation, 2000-2001. The above information indicates that Bangladesh will not be able to compete in the
world market for rice at the prevailing costs and market prices. Considering the
transport cost and trade margin, Bangladesh may be able to withstand competition
from imports from India, but may not be able to do so from imports from Thailand
and Vietnam.
For wheat, India (Punjab) is in a much superior position compared to Bangladesh
(Table 4). The variable unit cost of production is about 129% higher in Bangladesh
compared to Indian State of Punjab, and the domestic market price is higher by about
14%. The The Commission of Agricultural Costs and Prices (CACP) in India
however reports that the economic cost of the procurement of wheat by the Food
Corporation of India (FCI) is higher than the world market price. Thus, at current
prices, Bangladesh cannot withstand competition from imported wheat from the world
market.
Trade Liberalisation and the Crop Sector in Bangladesh 7

CPD Occasional Paper Series 23
TABLE 4: UNIT COST, FARM GATE PICE AND RETURNS TO LAND IN NON-RICE
CROPS
Unit cost (US $/ton)
Farm Gate price (US $/ton)
Returns to land (US $/ha)
Crop
India Bangladesh India Bangladesh India Bangladesh Wheat 46.47 106.49 135 154 428 104 Pulses 106.23 118.64 308 311 180 148 Rape seed & Mustard
110.10 141.96 263 303 213 122
Jute 136.21 129.05 190 185 114 101 Sugarcane 8.26 16.06 15.47 30.19 571 573
Source: For India, GOI (2002); and for Bangladesh, IRRI survey on cost and return in crop cultivation, 2000-2001. For sugarcane, Bangladesh’s position is almost similar to the wheat. The unit cost of
production is almost double in Bangladesh compared to India (Maharastra).
For rapeseed and mustard also India’s (Rajasthan) position is better compared to
Bangladesh. India’s unit cost of production and farm-gate price is about 23% and 13%
respectively lower than those for Bangladesh. India is a major importer of edible oil,
as is Bangladesh. The domestic price of oil is determined more by the world market
price and the rate of import duty, than by the domestic cost of production.
Only for pulses (lentil), Indian unit cost and prices are comparable with Bangladesh.
So is the case with jute.
IV. FACTORS BEHIND THE DIFFERENCE IN UNIT COSTS What are the reasons for the relatively high unit cost of production in Bangladesh for
most of the crops? The most important factor is obviously the agro-ecological
conditions and the development of irrigation infrastructure that determine the
suitability of land for growing a particular crop. The other is the extent of adoption of
improved production technologies. These two factors determine the level of crop
yield. For HYV rice, the yield in Bangladesh is comparable to other countries in the
region (Table 5). But there is potential for increasing the yield in the aman season and
thereby further reducing the unit cost. For all other crops, Bangladesh has lower yield
compared to that for the highest yielding state in India (Table 6). The difference is
large for Wheat and Sugarcane.
Trade Liberalisation and the Crop Sector in Bangladesh 8

CPD Occasional Paper Series 23
TABLE 5: THE YIELD (T/HA) OF HYV RICE IN BANGLADESH COMPARED TO THE EXPORTING COUNTRIES IN THE REGION
Region Yield (t/ha) India Punjab 5.28 Andhra Pradesh 4.86 Thailand 4.17 Vietnam 4.71 Bangladesh Aman Season 3.33 Boro Season 4.83
Source: For India, GOI (2002); for Thailand and Vietnam, IRRI survey on cost and return in crop cultivation, 2000; and for Bangladesh, IRRI survey on cost and return in crop cultivation, 2000-2001.
TABLE 6: THE YIELD RATE (T/HA) OF NON-RICE CROPS IN BANGLADESH COMPARED TO INDIA
Crop Bangladesh India Wheat 2.20 4.83 Lentil 0.77 0.89 Rape Seed & Mustard 0.76 1.39 Sugarcane 40.54 79.21 Jute 1.83 2.12
Source: For India, GOI (2002); and for Bangladesh, IRRI survey on cost and return in crop cultivation, 2000-2001. The other source of the difference in cost is the prices of inputs. The prices of three
major agricultural inputs -- urea fertilizer, irrigation and labor, can be seen from Table
7. The price of urea is about one-third lower in India, but are comparable in Thailand
and Vietnam compared to Bangladesh. The difference in the price of fertilizer would
not however make a large difference in unit cost of production, since chemical
fertilizers account for only 15% of the total variable costs.
TABLE 7: PRICES OF AGRICULTURAL INPUTS
Region Urea (US $/ton)
Wage rate (US $/day)
Irrigation (US $/ha)
India Punjab 107 1.60 32.34 Andhra Pradesh 126 1.41 18.35 Bangladesh 176 1.20 50.98 Thailand 165 5.21 17.93 Vietnam 170 1.64 26.38
Source: For India, GOI (2002); for Thailand and Vietnam, IRRI survey on cost and return in crop cultivation, 2000; and for Bangladesh, IRRI survey on cost and return in crop cultivation, 2000-2001. There is a large difference in the cost of labor across countries. The wage rate varies
from US $5.2 in Thailand to about US $1.2 in Bangladesh. The higher wage rate
however does not necessarily lead to higher cost of production since the farmer adopts
Trade Liberalisation and the Crop Sector in Bangladesh 9

CPD Occasional Paper Series 23
mechanisation in response to the scarcity of labor. The Thai farmers now utilise only
6 to 8 days of labor per ha in rice cultivation, compared to about 140 days in
Bangladesh, and 80 days in Vietnam. Indeed, the substitution of agricultural
machinery for human labor and animal draft power contributes to a reduction in unit
cost of production. In Thailand and Indian Punjab where the extent of mechanisation
is high the cost of production on account of power is the lowest (Table 8).
TABLE 8: COST OF PADDY PRODUCTION ON ACCOUNT OF POWER
Region Machine Rented (US $/ha)
Human & Animal Labor (US $/ha)
Total Cost on Power (US $/ha)
Wage Rate (US $/day)
Thailand 65.71 33.67 99.38 5.21 Punjab 52.45 90.65 143.10 1.60 Andhra Pradesh 28.56 197.29 225.85 1.41 West Bengal 15.24 231.08 246.32 1.23 Bangladesh 22.58 180.67 203.25 1.20 Vietnam 44.40 104.42 148.82 1.64
Source: For India, GOI (2002); for Thailand and Vietnam, IRRI survey on cost and return in crop cultivation, 2000; and for Bangladesh, IRRI survey on cost and return in crop cultivation, 2000-2001. The cost of irrigation is the major contributing factor behind the high-cost of rice
cultivation in Bangladesh, particularly for boro rice. Irrigation accounts for 28% of
the variable costs of rice cultivation, compared to 13% in Punjab, eight per cent in
Thailand, and six per cent in Vietnam. The low cost of irrigation in other countries is
mostly due to the subsidised supply of electricity (India) and the subsidised public
sector investment in the construction and the operation and maintenance of large-scale
irrigation projects. In Indian Punjab electricity is provided free for tube well irrigation
and the farmer is also provided free water from irrigation canals. In Bangladesh the
major source of irrigation is the privately owned shallow tube wells and power
pumps, mostly run by diesel. The diesel has now become a major agricultural input in
the cultivation of boro rice, and the cost of boro cultivation is very sensitive to the
price of diesel.
V. COMPARATIVE ADVANTAGE IN CROP PRODUCTION Whether a country can take advantage of new trading opportunities under the World
Trade Organisation (WTO) would depend on its comparative advantage. In most
developing countries, social or economic profitability deviates from private
profitability because of distortions in the input and output markets, the import and
export duties, and the valuation of the domestic currency. Comparative advantage in
the production of a given crop is measured by imputing the value of production at the
Trade Liberalisation and the Crop Sector in Bangladesh 10

CPD Occasional Paper Series 23
border price (world market price adjusted for transport cost and trade margins) and
comparing it with the social and opportunity cost of producing, processing,
transporting, handling and marketing an incremental unit of the commodity. If the
opportunity cost is less than the border price, then the country has a comparative
advantage in producing that crop.
Several studies (Mahmud et al. 1994; Morris et al. 1997; Roy, 1999; Shahabuddin
2000; Shahabuddin 2002; Shahabuddin and Dorosh 2001; Shahabuddin et al. 2002;
Shilpi 1998) estimated the comparative advantage of various crops in Bangladesh for
different ecologies and irrigation systems. The most recent studies (Shahabuddin et al.
2002; Shahabuddin 2002) using recent input-output prices, market distortions and
production coefficients show that:
• At export parity price Bangladesh has comparative advantage in the production
aman rice, jute and vegetables. Bangladesh can gain from the increase in
production of these crops provided that the surplus production could be exported
in the world market.
• At import parity price Bangladesh has comparative advantage in the production of
boro rice, potato, lentil and onion. Bangladesh will not be able to compete in the
export market for these commodities. But because of the transport cost and trading
margin, the cost of importing these commodities into Bangladesh would be higher
than the opportunity cost of producing them within the country.
• Bangladesh does not have comparative advantage in the production of wheat, oil
seeds, sugarcane and spices. The country will gain by importing these
commodities, if the resources tied in the production of these commodities can be
diverted to the production of other crops.
VI. TRADE POLICY IN INDIA The estimation of comparative advantage assumes complete liberalisation of markets
so that the prices of inputs reflect their true opportunity cost and the prices of output
reflect the opportunity cost of production, processing, transport and trade. But the
countries do not necessarily follow such policies. The countries can raise many
barriers to trade and push subsidised exports without violating the provisions of the
WTO. In Asia, the bindings of tariff permitted by WTO are still higher than the
Trade Liberalisation and the Crop Sector in Bangladesh 11

CPD Occasional Paper Series 23
prevailing tariff rate. For example, for India the bound rate is 114% while the applied
rate is 13%. Since India is the closest neighbor with competitive economic structure,
Indian trade policy must be considered in any design of the trade liberalisation policy
in Bangladesh.
It is well-known that the preferred policy in India has been to provide a minimum
price support within a restrictive trade regime. The Commission of Agricultural Costs
and Prices (CACP) recommend the minimum support prices keeping in view the cost
of production, the gross revenue in competing crops, farmers’ terms of trade, and
three to five yearly average price of the crop in the world market.
The CACP notes, “At current prices US farmers just covers the variable costs and
family wages, and is able to remain in cultivation because of large subsidies unrelated
to prices and production (permitted under WTO) that covers fixed costs. Free imports
would subject Indian farmers to unfair competition since large subsidies cannot be
afforded by a low-income country like India”. In its 1998 report the Commission
noted that if India were required to phase out quotas in international trade in
agricultural commodities domestic prices might become subject to the much more
volatile price movements in the international commodity markets (Table 9). So, there
is a need for greater coordination of trade policy with domestic agricultural price
policy, and establishing a trade regime based on variable tariffs for both imports and
exports.
TABLE 9. WORLD MARKET PRICE (F.O.B.) FOR SELECTED PRODUCTS
(US $/ton) Year Rice Wheat Palm oil Gram
1993-94 191 132 445 475 1994-95 219 145 651 463 1995-96 290 198 523 508 1996-97 276 158 526 315 1997-98 247 129 601 344 1998-99 250 100 486 343 1999-00 211 97 309 288 2000-01 167 101 214 325
In India rice is now freely exportable subject to registration of contracts with
Agriculture and Processed Food Products Export Development Authority (APEDA).
India has accumulated a huge stock of rice and wheat due to the policy of compulsory
procurement of food grain under the minimum support prices. India’s economic cost
Trade Liberalisation and the Crop Sector in Bangladesh 12

CPD Occasional Paper Series 23
of procurement of rice is higher than the price of rice of similar quality in the export
market. In order to push rice exports the government of India has taken a decision to
release stocks from the FCI to private exporters at a subsidised rate of US $127 per
ton (milled rice) while the economic cost is US $253. This policy will expose the
Bangladeshi rice market to dumping by Indian exporters.
Previously, imports of rice were canalised through FCI. The Export Import Policy
(EXIM) of 2001-02 has scrapped the policy of canalisation of rice and other cereals
and reserved their imports only for state trading agencies, and has increased the
import duty of 80% on husked rice and 70% on milled rice. Given the high duty
levels, there is little or no possibility of commercial import of rice even at a very low
level of international prices.
Since 1998-99 Indian wheat has remained uncompetitive in the world market. In 2000
the economic cost of wheat to FCI was US $183 compared to the world market price
of US $114 per ton. The export of wheat continues to be subjected to quantitative
restrictions and is permitted only against a license. The FCI is permitted to export
wheat at the highly subsidised rate of US $90 per ton, which was half the economic
cost of wheat to FCI. This was done in order to relieve the pressure of mounting
stocks in the face of low domestic demand and very low international prices.
To prevent a surge in imports and destabilisation of the domestic market, the
government imposed for wheat an import duty of 50% in November 1999. Like rice,
the import of wheat has also been placed under the state-trading list. As a
consequence of a high level of duty, imports virtually dried up during the 2000-02
period.
Imports of coarse cereals used to be canalised at zero duty. Since April 2000, a basic
duty of 50% plus a supplementary additional duty of four per cent was imposed on the
imports of maize seed, sorghum and millet. With effect from June 2000, the
government fixed a tariff quota of 0.35 tons of maize at a basic duty of 15%,
subjecting such imports to registration cum allocation procedures of APEDA. Under
the policy of 2001-02 coarse cereals are importable only by state trading agencies.
Trade Liberalisation and the Crop Sector in Bangladesh 13

CPD Occasional Paper Series 23
India is an exporter of lentils but a net importer of pulses (Table 10). The import duty
was reduced from 10 to 5% in 1995. During 1998-2000 imports of pulses was allowed
freely at zero duty. In the Union Budget of 2001-02, a duty of five per cent was
imposed on imported pulses.
TABLE 10: IMPORT OF PULSES AND EDIBLE OIL BY INDIA
(‘000 Tons) Pulses Year
Export Import Edible oil (Import)
1991-92 26 313 226 1992-93 34 383 103 1993-94 44 628 114 1994-95 51 554 347 1995-96 61 486 1,062 1996-97 55 655 1,417 1997-98 171 1,008 1,266 1998-99 104 563 2,621 1999-00 182 253 4,196
Source: GOI (2002), pages 255 and 258. The Indian government followed a liberal import policy of edible oils in the 1990s. As
a result the import of edible oils has increased substantially (Table 10). But the policy
has been reversed since 1999 when a 15% duty was imposed. In the budget of 2001-
02, the rate of duty on crude oils was raised from the range of 35 – 50% to a uniform
75%, and on refined oils from the range of 45-65% to 75-85%. The lower rate of 45%
applies to soybean oil on account of WTO binding.
The above review of India’s trade policy suggests three main points:
• India has turned backwards from the policy of liberalisation initiated in the
early 1990s. External trade has been brought back under the state trading
agencies from private traders.
• For staple grains India follows a policy of subsidised exports and highly
restrictive import policy.
• For pulse and oilseeds for which the demand exceeds supply India has
followed a liberal import policy, although in recent years the import duty
has been raised substantially.
Trade Liberalisation and the Crop Sector in Bangladesh 14

CPD Occasional Paper Series 23
VII. IMPLICATIONS FOR BANGLADESH’S TRADE POLICY
Findings of this study have important implications for trade policy of Bangladesh.
Studies on comparative advantage for the crop sector activities in Bangladesh
show that Bangladesh does not have comparative advantage in the production of
wheat, sugarcane, rapeseed and mustard, chilies and certain pulses. Bangladesh
may allow unrestricted import of those commodities for the benefit of the
consumers.
Although Bangladesh has comparative advantage in the production of HYV rice,
the unit cost of production is relatively higher that the rice exporting countries in
the region. India now promotes export of rice and wheat under special incentives
given to the exporters that subsidises almost half of the economic cost.
Government should take appropriate measures to protect the Bangladeshi farmers
from dumping of Indian rice in the domestic market. These may include increase
in tariff rate with in the bound rate. However, increase in tariff rate should not be
very high since it protects the farmers at the cost of consumers and consumption
of poor household decreases when rice price is increased. Bangladesh may also
increase regulatory duty and may even consider imposition of anti-dumping duty. A major factor behind the high unit cost of production of the HYV rice in
Bangladesh is the cost of irrigation compared to the other countries in the region.
As mentioned earlier, Bangladeshi farmers have to spend about 51 US dollars in
irrigating one hectare land whereas the irrigation cost are about 32 dollars in
Punjab, India and 18 dollars in Thailand and 26 dollars in Vietnam. India provides
heavy subsidy on electricity that lowers the cost of irrigation. In other countries,
the government subsidies the large scale public sector irrigation project. Recent
(January 2003) price hike of diesel will surely increase the cost of irrigation.
Considering these realities, Bangladesh should provide subsidy on diesel to reduce
the cost of ground water irrigation and pursue a stable price of diesel. If the
international price is up, the price should remain as it is and the government
should take back the bucks during a slump in the international market. Bangladesh
should also pursue a policy of rapid expansion of rural electrification to facilitate
electricity connection to irrigation and thereby reduce the cost of irrigation.
Trade Liberalisation and the Crop Sector in Bangladesh 15

CPD Occasional Paper Series 23
Rice production drastically falls in Bangladesh during periods of natural disasters
and the supply of rice becomes scarce leading to abnormal rise in prices, which
affects the livelihood of the rural landless and the marginal farmers. The
government allows import by the private sector to cope with the situation.
Government should follow a policy of variable tariff rate in the annual budget on
the basis of the assessment of the previous aman and boro harvest, and the
prevailing world market prices.
India is now importing foodgrain through state trading agency Food Corporation
of India (FCI). Considering the past experience of state trading agencies,
Bangladesh should not follow the path of India for food grain imports rather
government should regularly monitor the export import situation and should
regulate trade through flexible tariff rate and L/C margin.
References: GOI .2002. Reports of the Commission for Agricultural Costs and Prices for the
Crops Sown during 2001-2002 Season. New Delhi: Department of Agriculture and Cooperation, Ministry of Agriculture, Government of India.
GOI .1998. Reports of the Commission for Agricultural Costs and Prices for the
Crops Sown during 1998-99 Season. New Delhi: Department of Agriculture and Cooperation, Ministry of Agriculture, Government of India.
Mahmud W, Rahman SH, Zohir S. 1994. Agricultural growth through crop
diversification Working Paper No. 7. Food Policy in Bangladesh. Washington, D.C. (USA): International Food Policy Research Institute.
Morris ML, Chowdhury N, Meisner C. 1997. Wheat production in Bangladesh.
Research Report No. 106. Washington, D.C. (USA): International Food Policy Research Institute.
Roy, DK .1999.Trade policy and exports of horticultural products from Bangladesh.
Research Report No. 162. Dhaka (Bangladesh): Bangladesh Institute of Development Studies.
Shahabuddin Q. 2000. Assessment of comparative advantage in Bangladesh
agriculture. Bangladesh Development Studies 26(1): 37-76. Shahabuddin Q. 2002. Comparative advantage, diversification and value addition in
Bangladesh agriculture. Paper presented at the Asia Regional Conference on public-private sector partnership for promoting rural development held at Dhaka (Bangladesh) on 2-4 October 2002, jointly organised by Bangladesh
Trade Liberalisation and the Crop Sector in Bangladesh 16

CPD Occasional Paper Series 23
Agricultural Economists Association (BAEA) and International Association of Agricultural Economists (IAAE).
Shahabuddin Q and Dorosh P. 2001. Comparative advantage in Bangladesh
agriculture. FMRSP Working Paper No. 4. Ministry of Food. Government of Bangladesh.
Shahabuddin Q, Hossain M, Mustafi BAA, Narciso C. 2002. Assessment of
comparative advantage in rice cultivation in Bangladesh. In: Sombilla M, Hossain M, Hardy B, editors. Developments in the Asian Rice Economy. Proceedings of the International Workshop on Medium-and Long-term Prospects of Rice Supply and Demand in the 21st Century, 3-5 December 2001, Los Baños, Philippines. Los Baños (Philippines): International Rice Research Institute. p 369-384.
Shilpi F. 1998. Draft report on policy incentives and comparative advantage of
Bangladesh agriculture. Dhaka (Bangladesh): The World Bank. World Trade Organisation. 2000. WTO Agreements Series: Agriculture. Geneva.
Trade Liberalisation and the Crop Sector in Bangladesh 17

CPD Occasional Paper Series 23
Appendix Tables:
TABLE A.1: COST OF PRODUCTION IN THE CULTIVATION OF PADDY IN INDIA & BANGLADESH
(US $/ha) India Bangladesh
Punjab Andhara Pradesh
West Bengal Cost Items
1998-99 1998-99 1998-99
Aman HYV Boro HYV
Seed 11.31 15.38 15.24 15.33 17.78 Fertilizer 40.60 50.74 27.94 38.52 62.00 Manure 4.97 14.56 15.21 2.45 5.22 Pesticides 20.85 10.12 5.52 7.42 13.02 Irrigation 32.34 18.35 26.05 24.90 117.60Machine rental 52.45 28.56 15.24 17.07 22.58 Animal labor 0.57 16.56 39.35 16.07 14.57 Human labor 90.08 180.73 191.73 135.83 166.10 Total cost 253.17 335.00 336.28 257.59 418.87 Yield (t/ha) 5.279 4.855 3.605 3.325 4.825 Unit Cost ($/ton) 47.95 69.00 93.28 77.48 86.81 Price ($/ton) 113.25 119.28 135.28 137.13 136.65 Source: For India, GOI (2002); for Bangladesh, IRRI survey on cost and return in crop cultivation, 2000-2001.
TABLE A 2: COSTS OF CULTIVATION OF PADDY IN THAILAND,
& VIETNAM (US $/ha)
Thailand Vietnam Cost Items Wet Season Dry Season Wet Season Dry Season Seed 18.46 25.79 20.03 21.35 Fertilizer 25.17 56.43 56.08 58.27 Manure 0.54 0.63 0.83 0.81 Pesticides 5.34 24.28 26.52 27.22 Irrigation 1.45 17.94 6.98 17.98 Machine rental 65.71 67.15 42.36 44.40 Human labor 30.44 27.33 102.02 104.42 Other costs 3.23 4.10 - - Total cost ($/ha) 150.34 223.65 254.82 274.45 Yield (t/ha) 2.287 4.171 3.678 4.713 Unit Cost ($/ton) 65.74 53.62 69.28 58.22 Price ($/ton) 100.23 91.52 103.42 100.95 Source: IRRI survey on cost and return in crop cultivation, 2000.
Trade Liberalisation and the Crop Sector in Bangladesh 18

CPD Occasional Paper Series 23
TABLE A 3: COST OF PRODUCTION IN THE CULTIVATION OF WHEAT IN INDIA AND BANGLADESH
(US $/ha) Cost Items
Punjab Haryana Uttar Pradesh Madhya Pradesh Bangladesh
Seed 17.19 22.25 26.83 22.85 34.74 Fertilizer 53.81 44.79 37.39 23.15 55.98 Manure 0.68 - 1.24 0.30 7.71 Pesticides 15.53 10.31 0.21 0.00 0.63 Irrigation 6.19 24.60 28.34 22.22 32.89 Machine rental 60.87 56.12 44.38 25.77 21.81 Animal labor 0.55 3.43 8.73 12.32 16.17 Human labor 69.82 78.18 76.35 50.78 64.14 Total cost 224.64 239.68 223.47 157.39 234.07 Yield (t/ha) 4.834 4.479 3.352 1.985 2.198 Unit Cost ($/ton) 46.47 53.51 66.67 79.29 106.49 Price ($/ton) 134.92 135.06 133.07 156.26 153.86 Source: For India, GOI (2002); for Bangladesh, IRRI survey on cost and return in crop cultivation, 2000-2001.
TABLE A 4: COST OF PRODUCTION OF PULSES IN INDIA & BANGLADESH
(US $/ha) India
Cost Items Mung Maharastra
Black gram Madhya Pradesh
Gram Madhya Pradesh
Lentil Madhya Pradesh
Bangladesh (All pulses)
Seed 9.83 8.18 28.06 20.72 16.61 Fertilizer 8.94 3.36 9.41 8.93 2.27 Manure 3.90 1.62 - - - Pesticides 0.51 - 4.37 0.27 - Machine rental 5.19 5.93 18.34 20.48 8.65 Animal labor 25.78 18.78 12.65 6.97 28.67 Human labor 56.25 46.49 39.25 37.60 35.27 Total cost 110.40 84.40 112.08 94.97 91.47 Yield (t/ha) 0.562 0.507 0.985 0.894 0.771 Unit Cost ($/ton) 196.44 166.46 113.78 106.23 118.64 Price ($/ton) 364.50 259.26 230.10 307.92 311.14 Source: For India, GOI (2002); for Bangladesh, IRRI survey on cost and return in crop cultivation, 2000-2001.
Trade Liberalisation and the Crop Sector in Bangladesh 19

CPD Occasional Paper Series 23
TABLE A 5. COSTS OF PRODUCTION OF RAPE SEED AND MUSTARD IN INDIA & BANGLADESH
(US $/ha) Cost Items Gujarat Uttar Pradesh Rajasthan Bangladesh Seed 2.81 4.08 2.95 3.40 Fertilizer 30.25 21.41 20.60 12.64 Manure 1.65 7.76 0.38 2.17 Pesticides 4.02 0.18 0.35 1.07 Irrigation 62.28 15.81 17.76 0.15 Machine rental 28.94 25.94 35.80 20.84 Animal labor 4.94 7.90 2.91 17.43 Human labor 58.91 69.96 57.48 49.86 Total cost 193.80 153.04 138.23 107.56 Yield (t/ha) 1.204 1.390 1.172 0.757 Unit Cost ($/ton) 160.96 110.10 117.94 141.96 Price ($/ton) 254.58 263.15 259.00 303.20 Source: For India, GOI (2002); for Bangladesh, IRRI survey on cost and return in crop cultivation, 2000-2001.
TABLE A 6: COST OF PRODUCTION OF SUGARCANE AND JUTE IN
INDIA & BANGLADESH
(US $/ha) Sugarcane Jute
Cost Items Uttar Pradesh Maharastra Bangladesh West Bengal Bangladesh Seed 44.08 87.18 193.26 8.53 12.91 Fertilizer 40.63 113.96 114.63 13.86 22.07 Manure 12.97 12.82 5.11 5.31 2.00 Pesticides 0.83 - 27.69 3.85 6.17 Irrigation 28.93 91.50 24.02 2.38 1.54 Machine rental 14.40 67.71 75.28 6.69 23.09 Animal labor 8.92 28.20 25.57 29.50 18.94 Human labor 178.46 252.81 185.67 218.64 149.18 Total cost 329.30 654.18 651.23 288.76 235.90 Yield (t/ha) 49.08 79.12 40.54 2.120 1.828 Unit Cost ($/ton) 6.70 8.26 16.06 136.21 129.05 Price ($/ton) 18.90 15.47 30.19 190.05 184.53 Source: For India, GOI (2002); for Bangladesh, IRRI survey on cost and return in crop cultivation, 2000-2001.
Trade Liberalisation and the Crop Sector in Bangladesh 20