Embed Size (px)
Citation preview
CPD NR 3275 Conceptual Process Design
Process Systems Engineering
DelftChemTech - Faculty of Applied Sciences Delft University of Technology
Subject
Biodiesel Production (from SRM Fat)
& Prion Destruction
Conceptual Process Design
Authors Telephone A.P. Friedrich K.N. Gerstner R. Loef C.A.H. Schuurbiers M.J. Teuling
06-21817581 015-2627498 015-2610391 06-52087875 015-2132840
Keywords Biodiesel, SRM fat., Renewable, Esterification, Green fuel, Multiple feed stock, Ethyl Esters, Prion destruction
Assignment issued : 07-03-2002 Report issued : 31-05-2002 Appraisal : 25-06-2002
- ii -
Table of Contents Chapter & Title page 1. Introduction 1 2. Process Options & Selection 4 2.1 Criteria 4 2.1.1 Principal 4 2.1.2 Government & Consumers 5 2.1.3 Safety, Environmental & Economics 5 2.1.4 Importance of the Criteria 6 2.2 Comparison & Discussion 7 2.2.1 Protein Removal 8 2.2.2 Comparison per Process 9 2.3 Process Option Chosen 10 3. Basis of Design 12 3.1 Introduction 12 3.2 Process Definition 12 3.2.1 Process option chosen 12 3.2.2 Thermodynamic & Pure Component Properties 13 3.3 Basic Assumptions 13 3.3.1 Plant Capacity & Location 13 3.3.2 Definition of Feedstocks 13 3.3.3 Definition of Products 16 3.3.4 Definition of Used Process Water 18 3.3.5 Battery Limit 19 3.4 Margin 20
4. Thermodynamic Properties 21 4.1 Thermodynamic Properties 21 4.2 Vapor-Liquid Equilibria 22 4.3 Liquid-Liquid Separations 24 4.4 Reaction Equilibria 25 4.5 Data Accuracy 27 5. Process Structure & Description 29 5.1 Criteria and selections 29 5.2 Process Flow Scheme 29 5.3 Post Processing 34 5.4 Process Stream Summary 34 5.5 Utilities 35 5.6 Process Yields 35 6. Process Control 37 6.1 Pre-treatment 38 6.1.1 Fat Feed before washing (<1> and <65>) 38 6.1.2 Fat washing (M01 and V08) 38 6.2 Reactors (R01 and R02) 38
- iii -
6.3 Post-treatment 40 6.3.1 Flashing (V12 and V14) 40 6.3.2 Ethanol recycle and purification (C01 and C02) 40 6.3.3 Glycerol separation (V15) 41 6.3.4 Biodiesel purification (M02, V16 and D01) 42 6.4 All sections 43 6.4.1 Heat exchangers (E02, E10, E11 and E13) 43 6.4.2 Valves 43 6.4.3 Pumps 43 6.4.4 Buffer vessels (V01-V07, V09-V11 and V14) 43 7. Mass and Heat Balances 44 7.1 Balance for the total plant 44
7.2 Balance for unit operations 45 7.3 Balance for stream components 45
8. Process and Equipment Design 47 8.1 General Considerations 47 8.2 Process simulation 47
8.2.1 Aspen+ 10.2 47 8.2.2 MathCAD 48 8.3 Reactor Columns 48 8.3.1 Column for Pre-esterification (R01) 48 8.3.2 Demister for Pre-esterification Column (R01) 49 8.3.1 Column for Transesterification (R02) 50 8.3.2 Demister for Transesterification column (R02) 52 8.4 Decanters 52
8.4.1 Decanter 1: (V08) 52 8.4.2 Decanter 2: (V15) 54 8.4.3 Decanter 3: (V16) 55 8.5 Heat Exchangers 56 8.5.1 Heat exchanger 1: (E10) 56 8.5.2 Heat exchanger 2: (E13) 57 8.5.3 Heat exchanger 3: (E11) 58 8.5.4 Heat exchanger 4: (E02) 58 8.6 Mixers 59 8.6.1 Mixer: (M01) 59 8.6.2 Mixer: (M02) 60 8.7 Membrane (S01) 61 8.8 Distillation columns 62 8.8.1 Ether distillation columns: (C01) 62 8.8.2 Ethanol distillation columns: (C02) 63 8.9 Flash vessels 64 8.9.1 Flash vessel: (V12) 64 8.9.1 Flash vessel: (V14) 64
8.10 Buffers (V02-V04, V06, V07, V09-V11 and V13) 65 8.11 Reflux accumulators (V01 and V05) 66 8.12 Storage 66 8.12.1 Fat Storage and Transport 66 8.12.2 Ethanol Storage 66
- iv -
9. Wastes 68 9.1 Waste Streams 68 9.1.1 Water 68 9.1.2 Diethyl ether 69 9.2 Catalyst 69 10. Process Safety 71 10.1 Fire & Explosion Index 71 10.1.1 Material Factors 71 10.1.2 General Process Hazards 72 10.1.3 Special Process Hazards 73
10.1.4 Improvement Options & Conclusions 73 10.2 HAZOP 74 10.2.1 HAZOP Analysis 74 10.2.2 Conclusions & Recommendations 74 11. Economical Evaluation of the Process 76 11.1 Introduction 76 11.2 Purchased Equipment Cost and Total Investment Cost 76 11.3 Annual Production Cost vs. Annual Income 77 11.4 Economical Evaluation 79 11.5 Sensitivity Analysis 80 11.5.1 Cost Components 80 11.5.2 Sensitivity of the economics to Biodiesel price 82 11.5.3 Sensitivity of the process to Glycerol price 84 11.5.4 Sensitivity of the process to change in Total Investment
Cost estimations 84 11.5.5 Comparison of the various cost and income components 85 11.6 Conditions at which the process will be economically feasible 86 11.7 Options for cost reduction 87 12 Conclusions 88 13 Recommendations 90 14 Literature 91 List of Abbreviations 94 List of Symbols 96 Acknowledgements
Biodiesel Production & Prion Destruction Conceptual Process Design
- i -
Summary A design was made for a pilot-plant for biodiesel production from Specified Risk Material (SRM) fat and bio-ethanol with simultaneous prion destruction. Prion destruction had to be absolutely guaranteed. This was done by using two counter-current reactors with heterogeneous catalysts. The first reactor esterifies the free fatty acids at a temperature of 150C and a pressure of 5 bar with an acid catalyst. The second reactor transesterifies the triglycerides at a temperature of 250C and a pressure of 20 bar, with an alkaline catalyst. The residence times in the reactors are respectively 90 and 125 minutes. This process was chosen because it was considered the best for prion destruction. These conditions satisfy the European directives for prion destruction several times (Appendix 1.2). The products still must be tested by a certified lab for the presence of prions before they can be sold. The products should not be used for human or animal consumption or as fertilizer. The biodiesel will be sold as fuel for automobiles. Using the current assumptions, the biodiesel will meet the European norms (Appendix 1.1). Glycerol is produced as a valuable by-product and can be sold for use in dynamite or alkyd resins etc.. The plant will handle 9.776 tons of SRM fat per year, producing 10.317 tons of biodiesel per year. A yearly on-stream time of 8760 stream hours/annum was assumed. Several water streams leaving the system have to be given a heat-treatment to ensure total prion destruction. The steam produced by this treatment could be used for the heating of process streams. A by-reaction in the pre-esterification reactor creates a small amount of ether that has to be burned in a flare. The process used is currently not yet implemented in the industry, but created on the basis of other processes. The two catalysts were found in patents (lit. P17, P19), but not in the literature on biodiesel production processes. Experiments will have to be carried out to obtain more information on thermodynamic properties and kinetics before the definite plant can be built. As a EU resolution states that 2% of the markets of gasoline and diesel of each country should be composed out of biofuel by the year 2006, this represents the creation of a market of 240.000 tons / year in the Netherlands alone, where no biodiesel production occurs at the moment. If the biodiesel is to be sold at the current diesel price of € 257 per ton, the process has a yield of 0.82 € / €, and is not economically feasible. The economics are very sensitive to the price of biodiesel, however. If the biodiesel can be sold at a price above €401 / ton the process becomes possible. At a price of € 450 / ton a payback time of 4.63 years was calculated, and a 22% Rate of Return. The profits generated by the process at this price would be € 6,254,000. The profits can be larger if private capital is used instead of a loan on which interest is due. The Total Investment Cost will be € 5,176,000, and the economical plant life 13 years. The price of € 450 / ton could be reached by a reduction of the duty on biodiesel of ~33% or when subsidies are set in place.
Biodiesel Production & Prion Destruction Conceptual Process Design
- page 1 -
1. Introduction This report shows the design of a plant for the production of biodiesel from Specified Risk Material (SRM) fat. Two historical factors play a part in this project. The first is the recent Bovine Spongiform Encephalopathy (BSE) scare, and the consequent ban of the use of butchery waste in animal feed. The second factor is the depletion of the world’s fossil resources, making fuel a valuable commodity. These two factors were combined: use the waste animal fat to produce biodiesel. A design will be made for a plant capable of processing approximately 10.000 tons per year of SRM fat. This plant should be capable of handling different feedstocks. Pure vegetable oil, animal fat, or a mixture of the two. This way it won’t be dependent on SRM fat as feedstock alone. The biodiesel produced must meet the quality norms of the European Union (EU) for direct use as fuel in automotive diesel engines. This means that the produced biodiesel might still have to be mixed with other components to improve the cold flow properties and stability (Appendix 1.1). Depending on the viscosity and cold flow properties application in large ship engines might be preferable. One of the major factors in the production of this design was the processing of the feedstock. The SRM fat could possibly contain prions, proteins that can cause BSE, or Creutzfeld-Jakob disease in humans. The European Union has specific guidelines for the treatment of waste containing prions (Appendix 1.2). SRM fat must be incinerated or buried. But it can be used in a process, such as hydrolysis or trans-esterification at a temperature of at least 200C for 20 minutes. After which it still has to be incinerated or buried. The guidelines for burial and incineration do not apply to products not meant for human or animal consumption or as fertilizer. There are process conditions that have to be met at some point during our process, however to ensure prion destruction (Appendix 1.3). The wastewater coming from the washing of the crude fat feed stream needs to be evaporated and burned to ensure the destruction of any prions in that stream. The water streams leaving the ethanol purification section will also be evaporated and burned. Waste production is avoided as much as possible by extensive recycling of ethanol and where possible of water and heat. The steam from the contaminated streams can be used for heating. Biodiesel will be burned, and certainly not consumed, therefore posing no threat to public health. The by-product, glycerol, could possibly be sold to the dynamite industry, a destination in which it would be incinerated. This is not strictly necessary, it is important that it does not end up in food applications, however. The options for selling the glycerol partly determine the economic feasibility of the process. The glycerol produced in the plant is not very pure, purification will not be done in our design, instead a reduced price is taken (Chapter 11.3). All currently existing plants use a safe feedstock for their triglycerides supply. The use of SRM fat as a feedstock means that the process has to be designed very carefully. But it also means that the feedstock is quite cheap and currently readily available. A price of 60 €/ton was taken. Circumstances may arise in which the price may decrease. For instance a lack of storage capacity on the part of the destruction company.
Biodiesel Production & Prion Destruction Conceptual Process Design
- page 2 -
Biodiesel is produced on a large scale in France, Germany and Austria. The main process at the moment is the homogeneous alkaline-catalyzed process. In Germany biodiesel can be sold tax-free. Of course, if the German companies want to sell their biodiesel in the Netherlands, they will be subject to the same taxes as any plant built here. The market price used in the economical evaluation is the current diesel price, excluding taxes. Currently legislation is being prepared stating that by the year 2006, 2% of the diesel sales of every member country of the EU must consist of biodiesel. As the Netherlands have no production capacity at the moment, the market situation would seem very good, with a market of 240.000 tons per year being created by the legislation. Compared to this scale, the addition of a pilot plant of 10.000 tons per year will hardly make an impact. On a European level, the impact would be even smaller, as the European biodiesel production is currently approximately 1.091.000 tons per year (lit. C3). In the course of the design several problems were encountered. The main problem was the neutralisation of prions in the process. Much thought was given to this problem, and it was decided that the process with the most likelihood of removing the prions is the one having two counter current reactors with heterogeneous catalysts, one for esterification of the free fatty acids (FFA) and the second for the transesterification of the triglycerides. The conditions of the two reactors would be extreme enough, with elevated pressures and temperatures of 150C and 250C, and residence times of 90 and 120 minutes respectively. Precautions have been taken to ensure that all the products will have passed through the whole process or be burned before leaving the system, making prion neutralization a certainty. The physical data for the ethyl esters (FAEE) and triglycerides were difficult to obtain. Especially in the case of the triglycerides the molecules were so large that the estimation methods produced values twice as large as the occasional literature value found for physical properties. This problem was overcome by taking any known values for one triglyceride to be the values of the whole fat. In modeling the reactors, the estimated vapor pressure of fat was far too high. The Antoine parameters of -cholesterol were taken as estimates for the parameters of triglyceride. Also the kinetics of the process were unknown. Several conversions for different catalysts, feedstocks, temperatures, pressures and residence times were found in the literature (lit. P17, P19). Based on these, an estimate was made for the conversion per tray. Many different process options were found in the literature (Table 2.2.1). The Alkaline-catalyzed transesterification is most often used in practice. In the end a process was chosen with two countercurrent reactors with heterogeneous catalysts. One acid-catalyzed for the esterification of the free fatty acids, and one alkaline-catalyzed for the transesterification of the fat (triglycerides). The process conditions were still severe enough and there was no chance for the prions to escape from the process before passing through it all. The block scheme for the process can be seen in Appendix 2.5. The reasons for this choice are explained in more detail in Chapter 2.
Biodiesel Production & Prion Destruction Conceptual Process Design
- page 3 -
The process of transesterification with this heterogeneous catalyst has been tested in batches, but the set-up as stated before is not in use in the industry at this moment, to our knowledge. The catalyst used in the second reactor is patented (lit. P17), included in the claims is also any process which uses the catalyst. The catalyst has to be bought from the Engelhard Company, the holders of the patent. The reaction columns are also patented (lit. P19). It is possible to experiment with different catalysts, however, to determine which is most effective, both in conversion and costs.
Biodiesel Production & Prion Destruction Conceptual Process Design
- page 4 -
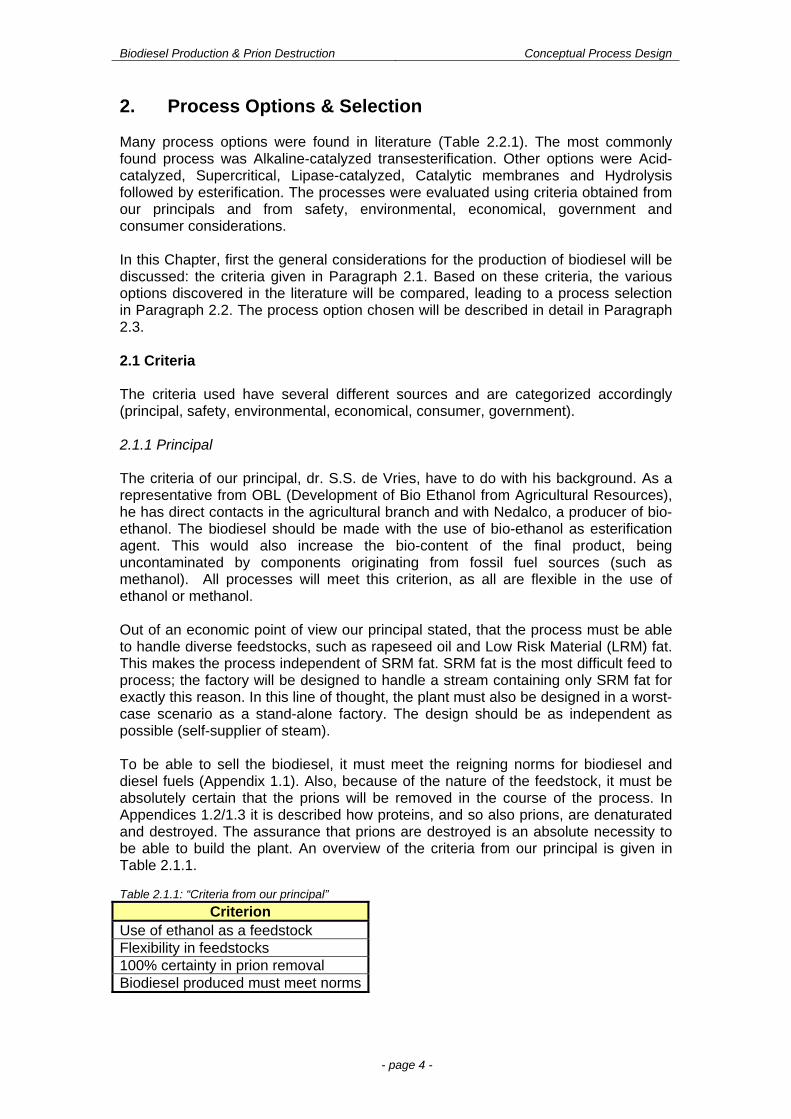
2. Process Options & Selection Many process options were found in literature (Table 2.2.1). The most commonly found process was Alkaline-catalyzed transesterification. Other options were Acid-catalyzed, Supercritical, Lipase-catalyzed, Catalytic membranes and Hydrolysis followed by esterification. The processes were evaluated using criteria obtained from our principals and from safety, environmental, economical, government and consumer considerations. In this Chapter, first the general considerations for the production of biodiesel will be discussed: the criteria given in Paragraph 2.1. Based on these criteria, the various options discovered in the literature will be compared, leading to a process selection in Paragraph 2.2. The process option chosen will be described in detail in Paragraph 2.3. 2.1 Criteria The criteria used have several different sources and are categorized accordingly (principal, safety, environmental, economical, consumer, government). 2.1.1 Principal The criteria of our principal, dr. S.S. de Vries, have to do with his background. As a representative from OBL (Development of Bio Ethanol from Agricultural Resources), he has direct contacts in the agricultural branch and with Nedalco, a producer of bio-ethanol. The biodiesel should be made with the use of bio-ethanol as esterification agent. This would also increase the bio-content of the final product, being uncontaminated by components originating from fossil fuel sources (such as methanol). All processes will meet this criterion, as all are flexible in the use of ethanol or methanol. Out of an economic point of view our principal stated, that the process must be able to handle diverse feedstocks, such as rapeseed oil and Low Risk Material (LRM) fat. This makes the process independent of SRM fat. SRM fat is the most difficult feed to process; the factory will be designed to handle a stream containing only SRM fat for exactly this reason. In this line of thought, the plant must also be designed in a worst-case scenario as a stand-alone factory. The design should be as independent as possible (self-supplier of steam). To be able to sell the biodiesel, it must meet the reigning norms for biodiesel and diesel fuels (Appendix 1.1). Also, because of the nature of the feedstock, it must be absolutely certain that the prions will be removed in the course of the process. In Appendices 1.2/1.3 it is described how proteins, and so also prions, are denaturated and destroyed. The assurance that prions are destroyed is an absolute necessity to be able to build the plant. An overview of the criteria from our principal is given in Table 2.1.1. Table 2.1.1: “Criteria from our principal”
Criterion Use of ethanol as a feedstock Flexibility in feedstocks 100% certainty in prion removal Biodiesel produced must meet norms
Biodiesel Production & Prion Destruction Conceptual Process Design
- page 5 -
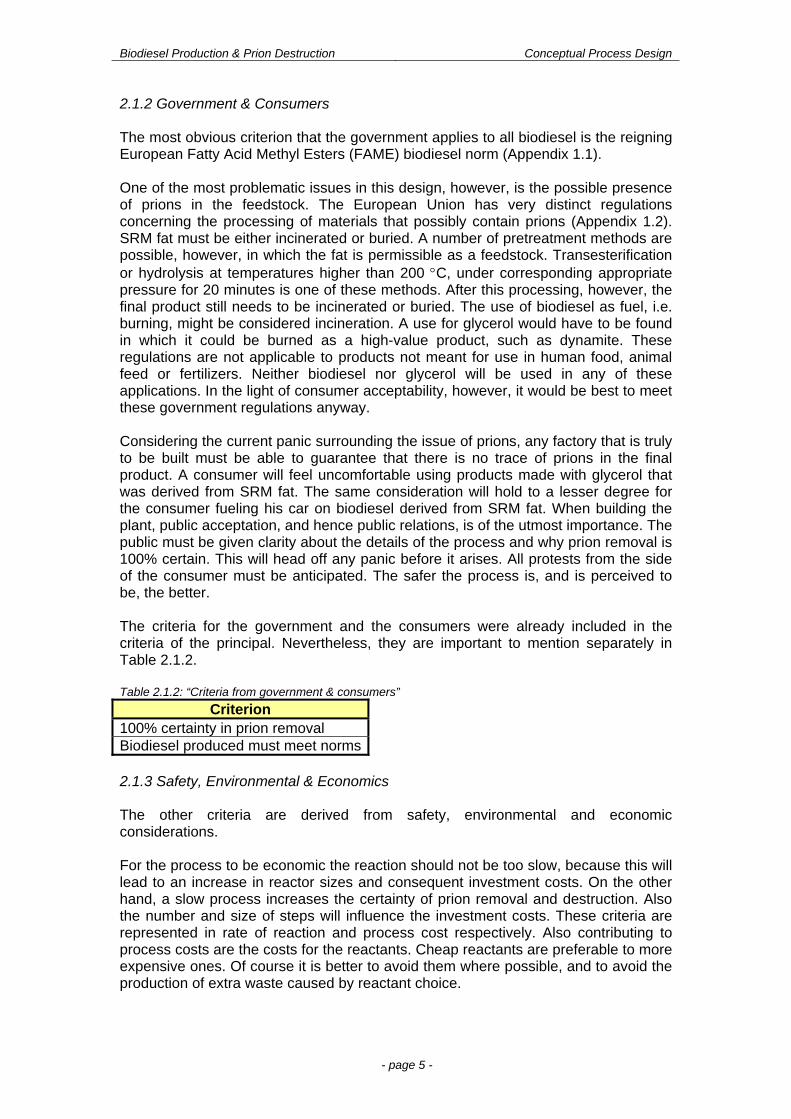
2.1.2 Government & Consumers The most obvious criterion that the government applies to all biodiesel is the reigning European Fatty Acid Methyl Esters (FAME) biodiesel norm (Appendix 1.1). One of the most problematic issues in this design, however, is the possible presence of prions in the feedstock. The European Union has very distinct regulations concerning the processing of materials that possibly contain prions (Appendix 1.2). SRM fat must be either incinerated or buried. A number of pretreatment methods are possible, however, in which the fat is permissible as a feedstock. Transesterification or hydrolysis at temperatures higher than 200 C, under corresponding appropriate pressure for 20 minutes is one of these methods. After this processing, however, the final product still needs to be incinerated or buried. The use of biodiesel as fuel, i.e. burning, might be considered incineration. A use for glycerol would have to be found in which it could be burned as a high-value product, such as dynamite. These regulations are not applicable to products not meant for use in human food, animal feed or fertilizers. Neither biodiesel nor glycerol will be used in any of these applications. In the light of consumer acceptability, however, it would be best to meet these government regulations anyway. Considering the current panic surrounding the issue of prions, any factory that is truly to be built must be able to guarantee that there is no trace of prions in the final product. A consumer will feel uncomfortable using products made with glycerol that was derived from SRM fat. The same consideration will hold to a lesser degree for the consumer fueling his car on biodiesel derived from SRM fat. When building the plant, public acceptation, and hence public relations, is of the utmost importance. The public must be given clarity about the details of the process and why prion removal is 100% certain. This will head off any panic before it arises. All protests from the side of the consumer must be anticipated. The safer the process is, and is perceived to be, the better. The criteria for the government and the consumers were already included in the criteria of the principal. Nevertheless, they are important to mention separately in Table 2.1.2. Table 2.1.2: “Criteria from government & consumers”
Criterion 100% certainty in prion removal Biodiesel produced must meet norms 2.1.3 Safety, Environmental & Economics The other criteria are derived from safety, environmental and economic considerations. For the process to be economic the reaction should not be too slow, because this will lead to an increase in reactor sizes and consequent investment costs. On the other hand, a slow process increases the certainty of prion removal and destruction. Also the number and size of steps will influence the investment costs. These criteria are represented in rate of reaction and process cost respectively. Also contributing to process costs are the costs for the reactants. Cheap reactants are preferable to more expensive ones. Of course it is better to avoid them where possible, and to avoid the production of extra waste caused by reactant choice.
Biodiesel Production & Prion Destruction Conceptual Process Design
- page 6 -
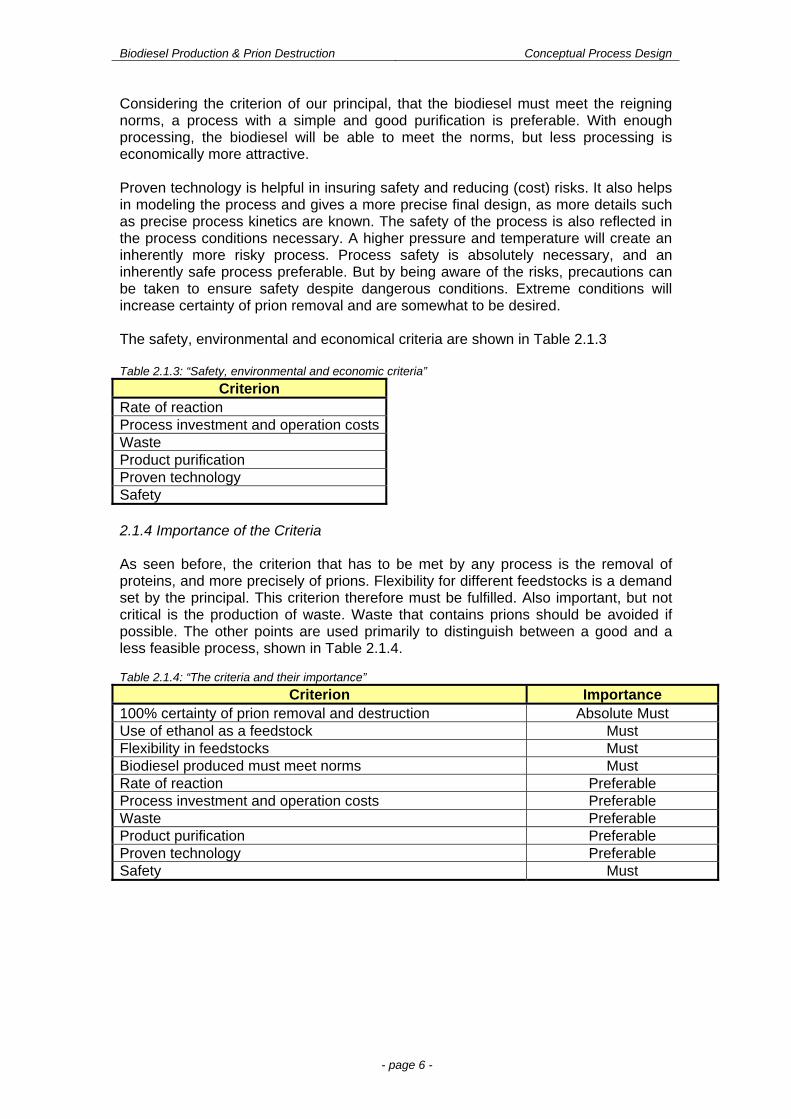
Considering the criterion of our principal, that the biodiesel must meet the reigning norms, a process with a simple and good purification is preferable. With enough processing, the biodiesel will be able to meet the norms, but less processing is economically more attractive. Proven technology is helpful in insuring safety and reducing (cost) risks. It also helps in modeling the process and gives a more precise final design, as more details such as precise process kinetics are known. The safety of the process is also reflected in the process conditions necessary. A higher pressure and temperature will create an inherently more risky process. Process safety is absolutely necessary, and an inherently safe process preferable. But by being aware of the risks, precautions can be taken to ensure safety despite dangerous conditions. Extreme conditions will increase certainty of prion removal and are somewhat to be desired. The safety, environmental and economical criteria are shown in Table 2.1.3 Table 2.1.3: “Safety, environmental and economic criteria”
Criterion Rate of reaction Process investment and operation costsWaste Product purification Proven technology Safety 2.1.4 Importance of the Criteria As seen before, the criterion that has to be met by any process is the removal of proteins, and more precisely of prions. Flexibility for different feedstocks is a demand set by the principal. This criterion therefore must be fulfilled. Also important, but not critical is the production of waste. Waste that contains prions should be avoided if possible. The other points are used primarily to distinguish between a good and a less feasible process, shown in Table 2.1.4. Table 2.1.4: “The criteria and their importance”
Criterion Importance 100% certainty of prion removal and destruction Absolute Must Use of ethanol as a feedstock Must Flexibility in feedstocks Must Biodiesel produced must meet norms Must Rate of reaction Preferable Process investment and operation costs Preferable Waste Preferable Product purification Preferable Proven technology Preferable Safety Must
Biodiesel Production & Prion Destruction Conceptual Process Design
- page 7 -
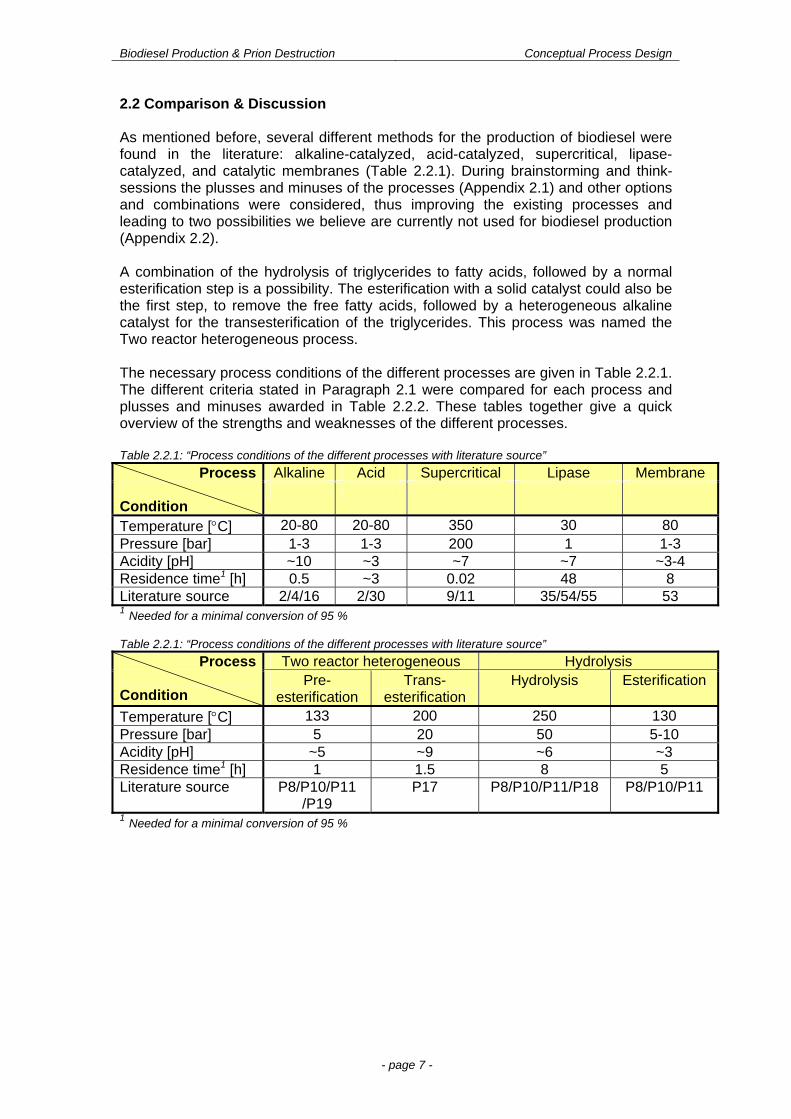
2.2 Comparison & Discussion As mentioned before, several different methods for the production of biodiesel were found in the literature: alkaline-catalyzed, acid-catalyzed, supercritical, lipase-catalyzed, and catalytic membranes (Table 2.2.1). During brainstorming and think-sessions the plusses and minuses of the processes (Appendix 2.1) and other options and combinations were considered, thus improving the existing processes and leading to two possibilities we believe are currently not used for biodiesel production (Appendix 2.2). A combination of the hydrolysis of triglycerides to fatty acids, followed by a normal esterification step is a possibility. The esterification with a solid catalyst could also be the first step, to remove the free fatty acids, followed by a heterogeneous alkaline catalyst for the transesterification of the triglycerides. This process was named the Two reactor heterogeneous process. The necessary process conditions of the different processes are given in Table 2.2.1. The different criteria stated in Paragraph 2.1 were compared for each process and plusses and minuses awarded in Table 2.2.2. These tables together give a quick overview of the strengths and weaknesses of the different processes. Table 2.2.1: “Process conditions of the different processes with literature source”
Process Condition
Alkaline Acid Supercritical Lipase Membrane
Temperature [C] 20-80 20-80 350 30 80 Pressure [bar] 1-3 1-3 200 1 1-3 Acidity [pH] ~10 ~3 ~7 ~7 ~3-4 Residence time1 [h] 0.5 ~3 0.02 48 8 Literature source 2/4/16 2/30 9/11 35/54/55 53 1 Needed for a minimal conversion of 95 % Table 2.2.1: “Process conditions of the different processes with literature source”
Process Condition
Two reactor heterogeneous Hydrolysis Pre-
esterification Trans-
esterification Hydrolysis Esterification
Temperature [C] 133 200 250 130 Pressure [bar] 5 20 50 5-10 Acidity [pH] ~5 ~9 ~6 ~3 Residence time1 [h] 1 1.5 8 5 Literature source P8/P10/P11
/P19 P17 P8/P10/P11/P18 P8/P10/P11
1 Needed for a minimal conversion of 95 %
Biodiesel Production & Prion Destruction Conceptual Process Design
- page 8 -
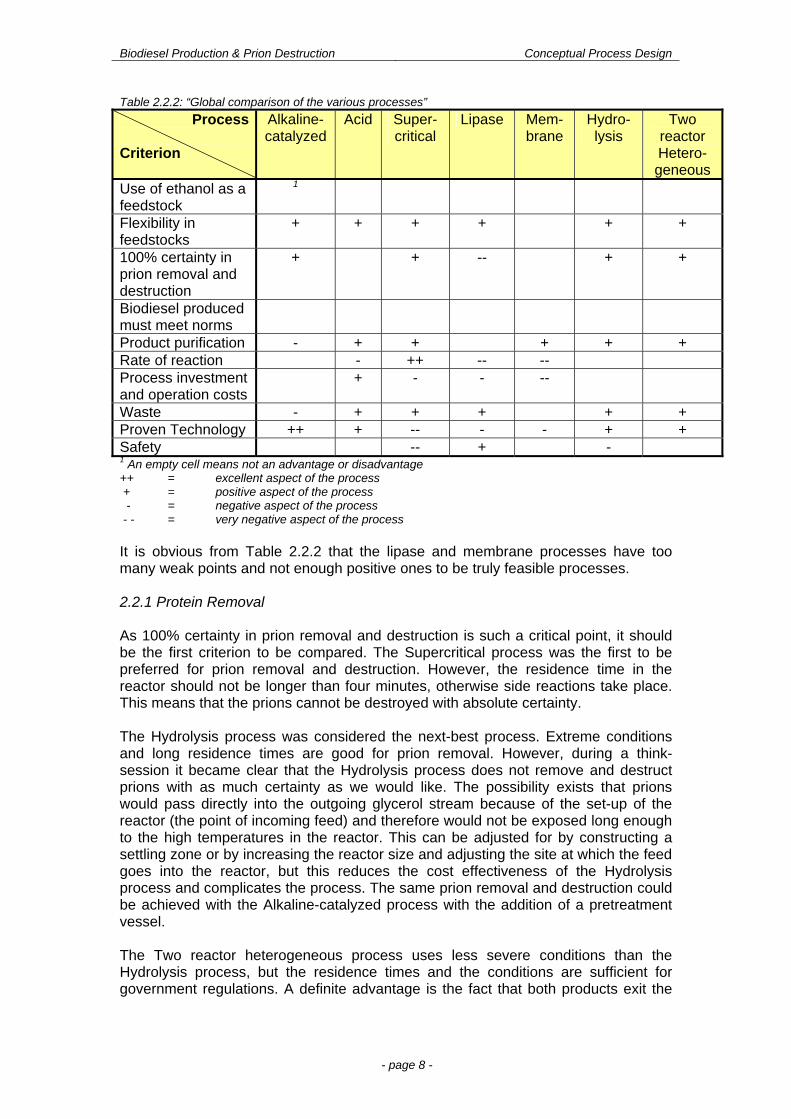
Table 2.2.2: “Global comparison of the various processes”
Process Criterion
Alkaline-catalyzed
Acid Super-critical
Lipase Mem-brane
Hydro-lysis
Two reactor Hetero-geneous
Use of ethanol as a feedstock
1
Flexibility in feedstocks
+ + + + + +
100% certainty in prion removal and destruction
+ + -- + +
Biodiesel produced must meet norms
Product purification - + + + + + Rate of reaction - ++ -- -- Process investment and operation costs
+ - - --
Waste - + + + + + Proven Technology ++ + -- - - + + Safety -- + - 1 An empty cell means not an advantage or disadvantage ++ = excellent aspect of the process + = positive aspect of the process - = negative aspect of the process - - = very negative aspect of the process It is obvious from Table 2.2.2 that the lipase and membrane processes have too many weak points and not enough positive ones to be truly feasible processes. 2.2.1 Protein Removal As 100% certainty in prion removal and destruction is such a critical point, it should be the first criterion to be compared. The Supercritical process was the first to be preferred for prion removal and destruction. However, the residence time in the reactor should not be longer than four minutes, otherwise side reactions take place. This means that the prions cannot be destroyed with absolute certainty. The Hydrolysis process was considered the next-best process. Extreme conditions and long residence times are good for prion removal. However, during a think-session it became clear that the Hydrolysis process does not remove and destruct prions with as much certainty as we would like. The possibility exists that prions would pass directly into the outgoing glycerol stream because of the set-up of the reactor (the point of incoming feed) and therefore would not be exposed long enough to the high temperatures in the reactor. This can be adjusted for by constructing a settling zone or by increasing the reactor size and adjusting the site at which the feed goes into the reactor, but this reduces the cost effectiveness of the Hydrolysis process and complicates the process. The same prion removal and destruction could be achieved with the Alkaline-catalyzed process with the addition of a pretreatment vessel. The Two reactor heterogeneous process uses less severe conditions than the Hydrolysis process, but the residence times and the conditions are sufficient for government regulations. A definite advantage is the fact that both products exit the
Biodiesel Production & Prion Destruction Conceptual Process Design
- page 9 -
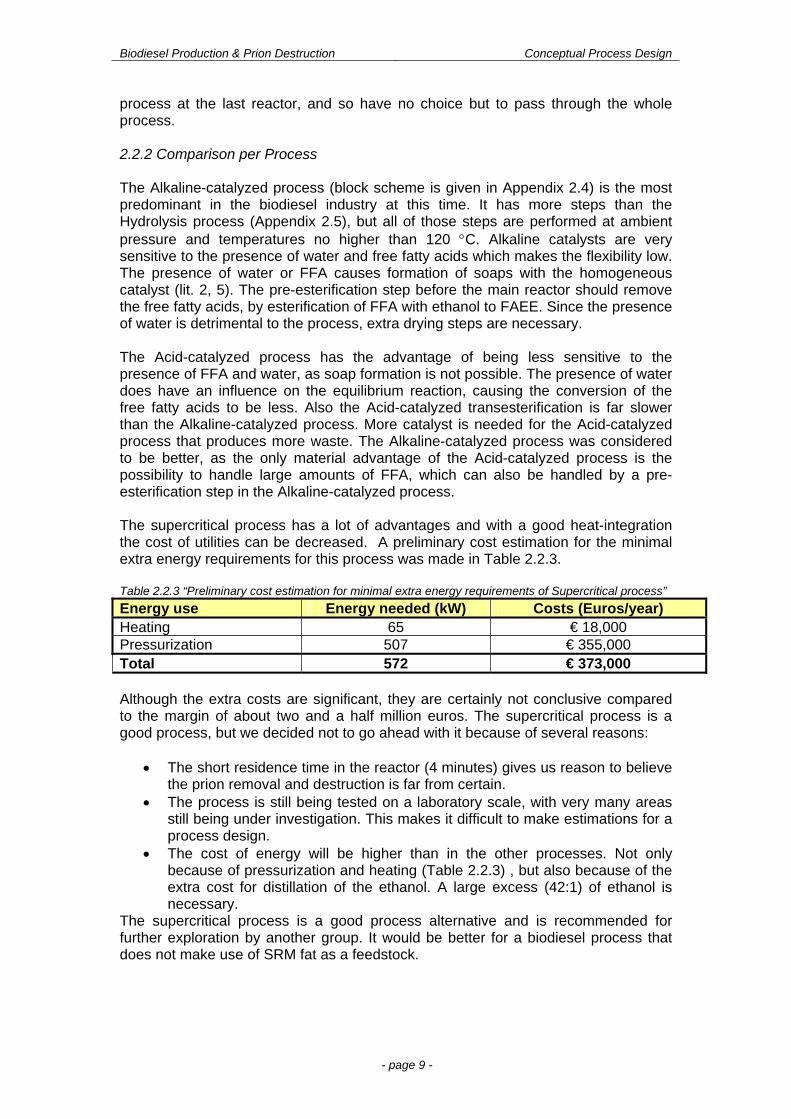
process at the last reactor, and so have no choice but to pass through the whole process. 2.2.2 Comparison per Process The Alkaline-catalyzed process (block scheme is given in Appendix 2.4) is the most predominant in the biodiesel industry at this time. It has more steps than the Hydrolysis process (Appendix 2.5), but all of those steps are performed at ambient pressure and temperatures no higher than 120 C. Alkaline catalysts are very sensitive to the presence of water and free fatty acids which makes the flexibility low. The presence of water or FFA causes formation of soaps with the homogeneous catalyst (lit. 2, 5). The pre-esterification step before the main reactor should remove the free fatty acids, by esterification of FFA with ethanol to FAEE. Since the presence of water is detrimental to the process, extra drying steps are necessary. The Acid-catalyzed process has the advantage of being less sensitive to the presence of FFA and water, as soap formation is not possible. The presence of water does have an influence on the equilibrium reaction, causing the conversion of the free fatty acids to be less. Also the Acid-catalyzed transesterification is far slower than the Alkaline-catalyzed process. More catalyst is needed for the Acid-catalyzed process that produces more waste. The Alkaline-catalyzed process was considered to be better, as the only material advantage of the Acid-catalyzed process is the possibility to handle large amounts of FFA, which can also be handled by a pre-esterification step in the Alkaline-catalyzed process. The supercritical process has a lot of advantages and with a good heat-integration the cost of utilities can be decreased. A preliminary cost estimation for the minimal extra energy requirements for this process was made in Table 2.2.3. Table 2.2.3 “Preliminary cost estimation for minimal extra energy requirements of Supercritical process”
Energy use Energy needed (kW) Costs (Euros/year) Heating 65 € 18,000 Pressurization 507 € 355,000 Total 572 € 373,000 Although the extra costs are significant, they are certainly not conclusive compared to the margin of about two and a half million euros. The supercritical process is a good process, but we decided not to go ahead with it because of several reasons:
The short residence time in the reactor (4 minutes) gives us reason to believe the prion removal and destruction is far from certain.
The process is still being tested on a laboratory scale, with very many areas still being under investigation. This makes it difficult to make estimations for a process design.
The cost of energy will be higher than in the other processes. Not only because of pressurization and heating (Table 2.2.3) , but also because of the extra cost for distillation of the ethanol. A large excess (42:1) of ethanol is necessary.
The supercritical process is a good process alternative and is recommended for further exploration by another group. It would be better for a biodiesel process that does not make use of SRM fat as a feedstock.
Biodiesel Production & Prion Destruction Conceptual Process Design
- page 10 -
The Hydrolysis process is relatively slow and needs higher temperatures and pressures (lit. P18) than the Alkaline-catalyzed process (lit. 2, 26, 34), though still below the conditions of the supercritical process (lit. 11, 13). The advantage of the Hydrolysis process is its ability to process large quantities of free fatty acids, and the fact that it is not sensitive to the presence of water in the system (block scheme is given in Appendix 2.5). It became clear that the Hydrolysis process does not remove and destruct prions with as much certainty as we would like. The fat with prions enters the reactor near the bottom. The possibility exists that prions would pass directly into the outgoing glycerol stream and therefore would not be exposed long enough to the high temperatures in the reactor. The sensitivity of the Two reactor heterogeneous process to water and FFA is far smaller than the homogeneously catalyzed processes, therefore the flexibility in feedstocks is high. A heterogeneous catalyst is used instead of a homogeneous one. This means that the metal ions, which can form soaps, and in a later phase salt waste streams, will not be present. The major improvement however is the 100% certainty in prion removal and destruction. Due to the countercurrent operation, the fat entering the reactor at the top will be present in the reactor long enough to ensure prion removal and destruction (the block scheme is given in Appendix 2.6). Both products leave the system at the bottom of the second reactor, meaning that both products have to pass through the whole process before they leave the system. The stream leaving the top of the first reactor is a vapor. With very efficient demisting equipment fat droplets can be stopped. Any prions that might leave with the vapor are recycled to the process. The new process, the Two reactor heterogeneous process, combines the advantages of the Hydrolysis process with the advantages of the Alkaline-catalyzed process. 2.3 Process Option Chosen We explored the Alkaline-catalyzed, the Hydrolysis process and the Two reactor heterogeneous process further till Basis of Design (BOD) detail because we thought them most promising. The processes use many of the same basic principles, so in exploring one process useful information for the others is obtained. Our preferred process of choice is the Two reactor heterogeneous, which combines the advantages of the Alkaline-catalyzed and Hydrolysis processes. It has a fairly high reaction rate, like the Alkaline process, and does not produce much waste, like the Hydrolysis process. The greatest improvement is the certainty of prion-removal. The block scheme of the Two-reactor process is shown in Appendix 2.6. A washing step is necessary to remove the dirt and metals from the fat and avoid fouling of the catalyst. The fat then enters a pre-esterification reactor (Step 1) at the top, reacting countercurrently with the rising ethanol vapor to avoid excess water pushing the equilibrium the wrong direction, and providing immediate removal of water. The ethanol leaving the reactor enters a distillation and membrane unit to remove the water, and is then recycled to the process. The fat, now without FFA, enters the transesterification reactor (Step 2) at the top, again performing a counter current reaction with ethanol. Glycerol and biodiesel leave the reactor at the bottom and need to be separated and purified. The ethanol, leaving at the top is recycled to the first reactor. At the top of both columns are demisters, to ensure that none of the liquid phase leaves the reactor with the vapor phase. This has a second function, namely the insurance that the liquid stream that possibly contains prions remains in
Biodiesel Production & Prion Destruction Conceptual Process Design
- page 11 -
the process. As mentioned before, all vapor phases are recycled to the process. This means that the one-in-a-trillion prion escaping to this stream would end up in the process after all or will be incinerated in a water stream. The production rate of our plant is high enough to warrant a continuous production. The market forces are not such that batch would be preferable – diesel fuel is used all year round. The feedstock is available all year round. The cold start temperatures stated in the biodiesel fuel norms do vary with the season though, as does the composition of the feedstock. But these problems can be solved within the continuous process, by mixing or small changes in downstream processing. There do not seem to be any operational problems making a batch process necessary either. On the contrary, the countercurrent reaction that would be the best choice for the pre-esterification reactor would be difficult to perform as a batch-process. It is possible to regenerate the catalyst without necessitating a total shutdown of the plant. This can be done by means of a conduit in each tray that can remove the slurry of catalyst and reaction mixture in a controlled manner (lit. P19, p. 16).
Biodiesel Production & Prion Destruction Conceptual Process Design
- page 12 -
3. Basis of Design 3.1 Introduction A design will be made for a pilot plant capable of processing 10.000 tons per year of SRM fat. This design should be capable of handling any combination of animal and vegetable oil as feedstocks. The product is expected to be directly usable in present diesel engines. The specifications for the biodiesel will be the same as the European norms for fossil diesel (EN 590:1999) and FAME (prEN 14214:2002) (see Appendix 1.1) to ensure compatibility with current diesel engines. Glycerol will be produced as a valuable by-product contributing considerably to the economics. The effect of glycerol on the economic margin is given in Paragraph 3.4. The process still retains its positive margin even if the glycerol cannot be sold. Markets that can be considered are manufacturing of explosives, alkyd resins, cellulose films, polyglycerols etc. (lit. B15). Issues, which will have to be overcome, are the removal of prions and ensuring a constant high quality of products. In Appendix 1.2 the relevant European guidelines for the destruction of SRM fat are given. The process of transesterification should qualify as a process that is permissible for the processing of SRM fat. Approval of the Dutch and EU governments will be required before further design of the plant can commence. Very limited data was found on kinetics and thermodynamics. In the latter case the values are estimated using various correlations from literature validated with known values. The kinetics should be further investigated on pilot plant scale. Since attainable conversions are given in literature our design will be based on those values (Chapter 4). 3.2 Process Definition 3.2.1 Process option chosen The process chosen to elaborate is the Two reactor heterogeneous process. The line of reasoning is further explained in Chapter 2. The creative methods used for making the process choice are given in Appendices 2.2 and 2.3. This process uses two countercurrent reactors with heterogeneous catalyst. The first one esterifies the FFA, the second transesterifies the triglycerides (for reactions, see Chapter 4, Figures 4.4.1 and 4.4.2). The catalyst used in the first reactor (R01) is Amberlyst 35 Wet, an acidic ion exchange resin. The catalyst used in the second reactor (R02) is the Engelhard ETS-4 alkaline catalyst. In the first reactor a molar ratio of 3:1 ethanol:FFA is necessary, in the second reactor 6:1 ethanol:triglycerides. As no kinetic data was found on the reactions, an assumption was made that a 28% conversion can be achieved per stage in the column. As acid also catalyses transesterification, it was assumed that 1% of the triglycerides was also converted. In the transesterification column the opposite was assumed (Paragraph 4.4). The plant will be operated in full continuous mode.
Biodiesel Production & Prion Destruction Conceptual Process Design
- page 13 -
The block scheme, flow sheet and stream summary for the process are shown in Appendices 2.6, 5.1 and 5.2. 3.2.2 Thermodynamic & Pure Component Properties A lack of thermodynamic data for the ethyl esters and the triglycerides posed considerable problems during the design. Unknown properties were estimated, and if possible checked against known values. If any values were known for the triglycerides they were taken as values for the whole fat, as the properties should not differ very much. Separation models were also sometimes difficult to find. It is a well-known fact that water and fat separate easily. The Aspen models did not acknowledge this fact, however, so substitute solubility values had to be used. The problems with kinetics were mentioned earlier. All thermodynamic data can be found in Chapter 4. A list of pure component properties can be found in Appendix 4.3 3.3 Basic Assumptions 3.3.1 Plant Capacity & Location The plant is designed to handle 9.776 tons/a SRM fat, producing 10.317 tons/a fatty acid ethyl esters. The economical plant life is taken to be 13 years (see Chapter 4). The flow sheet (Appendix 6) was designed assuming all year continuous operation. The plant may be offline for several weeks per year, due to maintenance and unforeseen problems. For the design however it is assumed that the plant is online 24 hours per day, 7 days a week, 52 weeks per year, making a total of 8760 stream hours/annum. The actual number of online stream hours will be less. The total mass flows of feed, product, by-product and waste are given in Appendix 5.2. The yields are 0.9476 tons fat / ton FAEE and 0.1739 tons ethanol / ton FAEE (for the other yields, see Appendix 5.4). The economical yield is 1.23 € / € if tax reduction is taken into account. The contribution of the biodiesel to the yield is 0.97 € / € and the contribution of the glycerol 0.26 € / €. The yield would be 0.82 € / € if all taxes were taken into consideration. The plant is designed as a stand-alone plant in the Netherlands. 3.3.2 Definition of Feedstocks The main feedstock under investigation is SRM fat, as this is the most difficult stream to handle. The fat is rendered by the destruction company from collected waste of slaughterhouses. The composition varies per season, as the feed of the animals varies, but can generally be taken to contain a mixture of triglycerides and free fatty acids. The generalized composition of the fat (not including impurities) is shown in Table 3.3.1 (lit. C1). The composition given is for both the free fatty acids in the fat and the fatty acids bound in the triglycerides.
Biodiesel Production & Prion Destruction Conceptual Process Design
- page 14 -
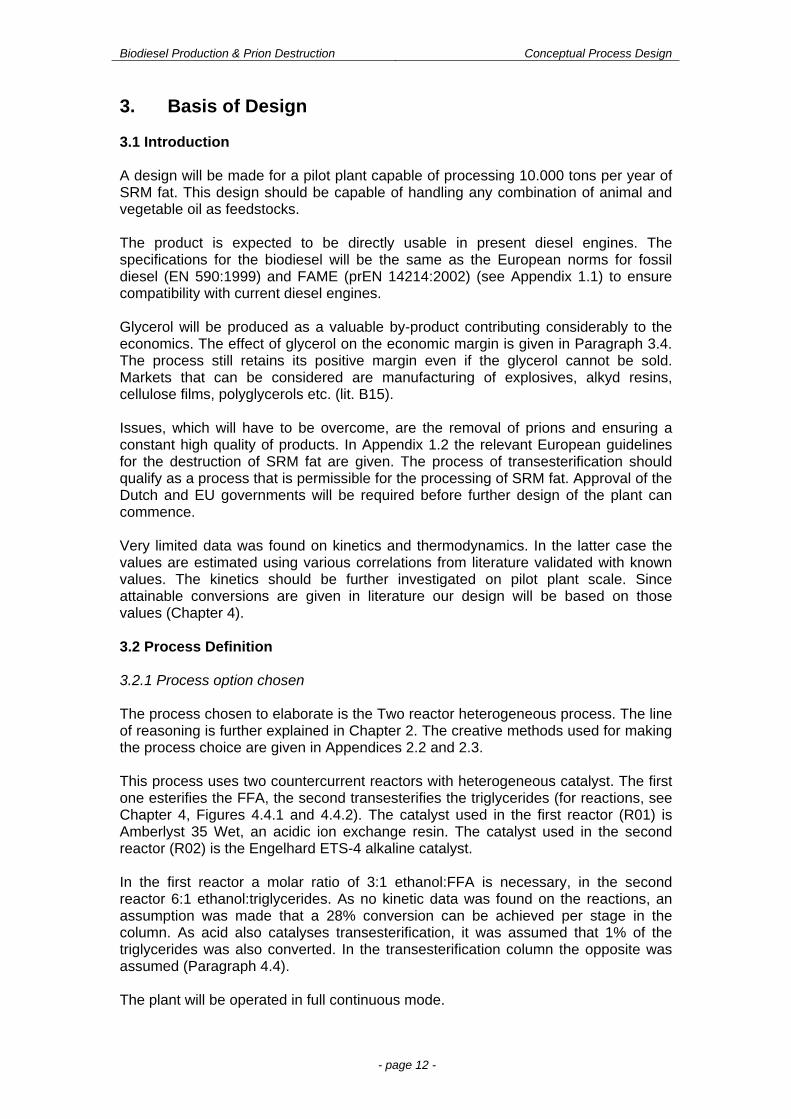
Table 3.3.1: “Fatty acid composition”
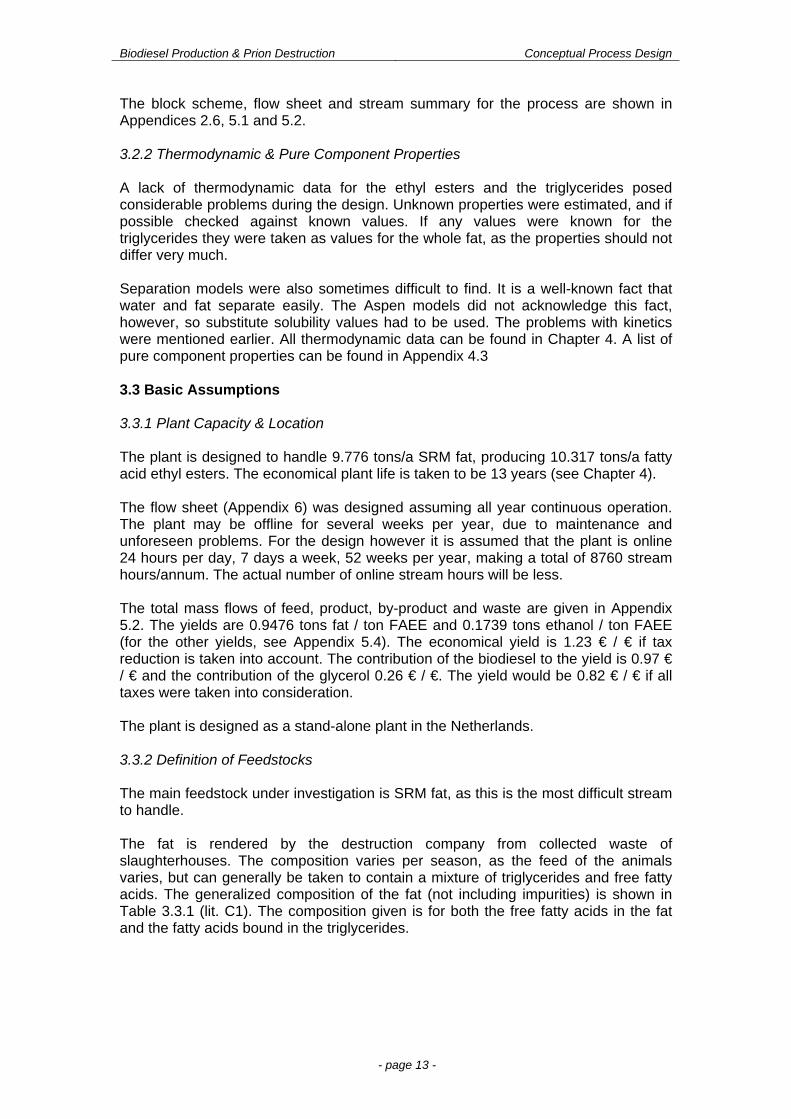
Component Composition1 Concentration2 (%)Palmitic acid C16:0 24.9Palmitoleic acid C16:1 2.4 Stearic acid C18:0 15.3 Oleic acid C18:1 40.2 Linoleic acid C18:2 10.7 Other ~C18 6.5 1Number of carbon atoms : number of double bonds 2Mass percentage of total SRM fat stream Several other components of the main feedstock have to be taken into account in the design as well. As mentioned before, prions could be present, although the quantity is unknown. Furthermore some other proteins and trace metals are present. A last impurity is phospholipids present in the fat. These have the tendency to form micelles that have a negative effect on the process. The phospholipids are removed during the washing step (M01) and (V08). A more detailed table of the composition of the animal fat stream is given in Table 3.3.2. Table 3.3.2: “SRM fat composition”
Stream Name : Animal Fat Comp. Units Specification Additional Information Available Design Notes (also ref. note numbers) Triglycerides %wt 65-90 85.5 (1) (1) For the composition of the chains Free fatty acids %wt 10-30 14.2 (1) of the triglycerides or the free fatty Water %wt 0.23 0.3 acid compositions, the values of Dirt & ash %wt 3.05 0 (2) Table 3.1 are valid Metals trace 0 (2) (2) Dirt & ash and metals are assumed Prions trace (3) to be removed with the wash water.Total 100.0 (3) Though the prions do not have a Process Conditions and Price known concentration, they will Temp. C 15 be taken into account Press. Bara 1 (4) Price obtained from lit. C2 Phase V/L/S S Price €/ton 60 (4) The feedstock reacts with absolute ethanol (100%). To insure that the process yields are high enough, ethanol has to be added in excess. The ethanol used will be bio-ethanol supplied by Royal Nedalco (Bergen op Zoom). This is positive for the overall bio-content of the biodiesel. The specifications of the ethanol entering the process are given in Table 3.3.3. In practice the ethanol will not be 100% but approximately 99.7%.
Biodiesel Production & Prion Destruction Conceptual Process Design
- page 15 -
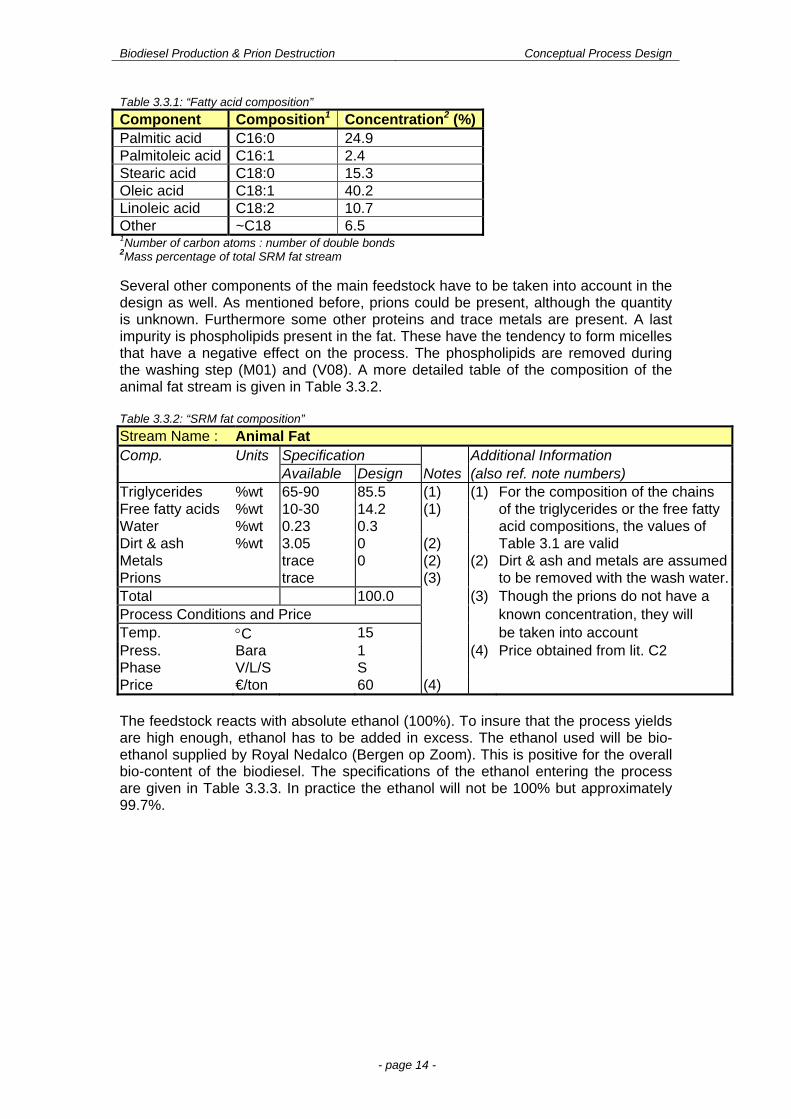
Table 3.3.3: “Ethanol specifications”
Stream Name : Ethanol Comp. Units Specification Additional Information Available Design Notes (also ref. note numbers) Ethanol %wt 100 100 (1) (1) The ethanol is provided by Royal Nedalco Total 100.0 Process Conditions and Price Temp. C 15 Press. Bara 1 Phase V/L/S L Price €/ton 500 (2) (2) Price found in lit. 84 The esterification step (R01) is catalyzed by a solid acid catalyst. It is not known yet how often this catalyst will have to be regenerated. Regeneration can be performed with any strong acid, sulfuric acid is chosen. The solid acid catalyst is described in Table 3.3.4. The solid alkaline catalyst chosen for the transesterification step (R02) is described in Table 3.3.5. Regeneration of this catalyst is possible by calcination. Table 3.3.4: “Solid heterogeneous acid catalyst for esterification in (R01)”
Catalyst Name : Amberlyst (35 Wet) Comp. Units Specification Additional Information Available Design Notes (also ref. note numbers) -SO3H eq/kg1 5.20 5.20 (1) (1) These specifications are obtained Polystyrene from lit. 98. Other resins could be used as well. Process Conditions and Price Temp. C 150 Press. Bara 10 Phase V/L/S S Price €/ton 60,136 (2) (2) Price found in lit. 108 1 the number of moles of H+ per kilogram catalyst Table 3.3.5: “Solid heterogeneous alkaline catalyst specifications for trans-esterification in (R02)”
Catalyst Name : ETS-4 Comp. Units Specification Additional Information Available1 Design Notes (also ref. note numbers) Titanium Zeolite %wt 14.9 14.9 (1) (1) These specifications are obtained Silicaat 85.1 (1) from lit. P17. The owner of this Total 100.0 patent can act as supplier of Process Conditions and Price the catalyst. Temp. C 200 Press. Bara 20 Phase V/L/S S Price €/ton 80,000 (2) (2) Price found in lit. C5 1 the wt% given is for the amount of titanium present in the catalyst There are several different additives possible to achieve the desired specifications (Table 3.3.7 and Appendix 1.1) and to improve the quality of the final biodiesel product. It could be necessary to add ethanol, for instance, to lower the viscosity and improve the cold start properties of the fuel. Another additive that could be needed is an antioxidant to improve the stability of the product. A good candidate for this
Biodiesel Production & Prion Destruction Conceptual Process Design
- page 16 -
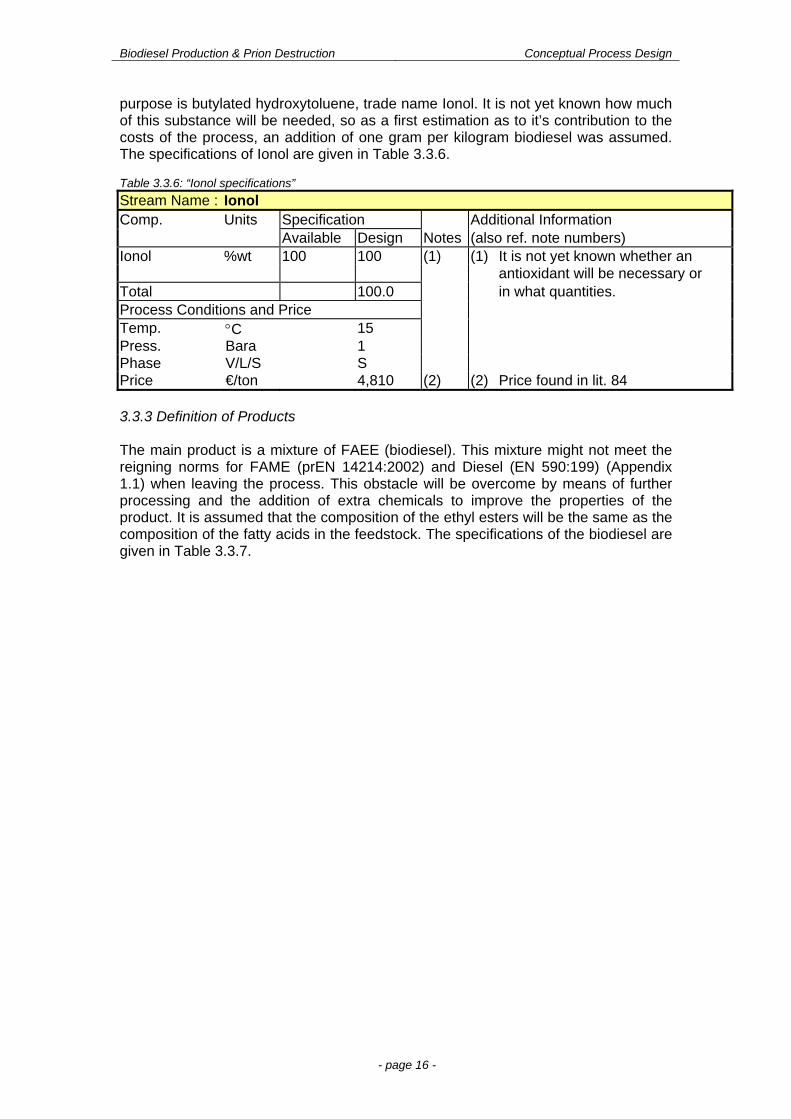
purpose is butylated hydroxytoluene, trade name Ionol. It is not yet known how much of this substance will be needed, so as a first estimation as to it’s contribution to the costs of the process, an addition of one gram per kilogram biodiesel was assumed. The specifications of Ionol are given in Table 3.3.6. Table 3.3.6: “Ionol specifications”
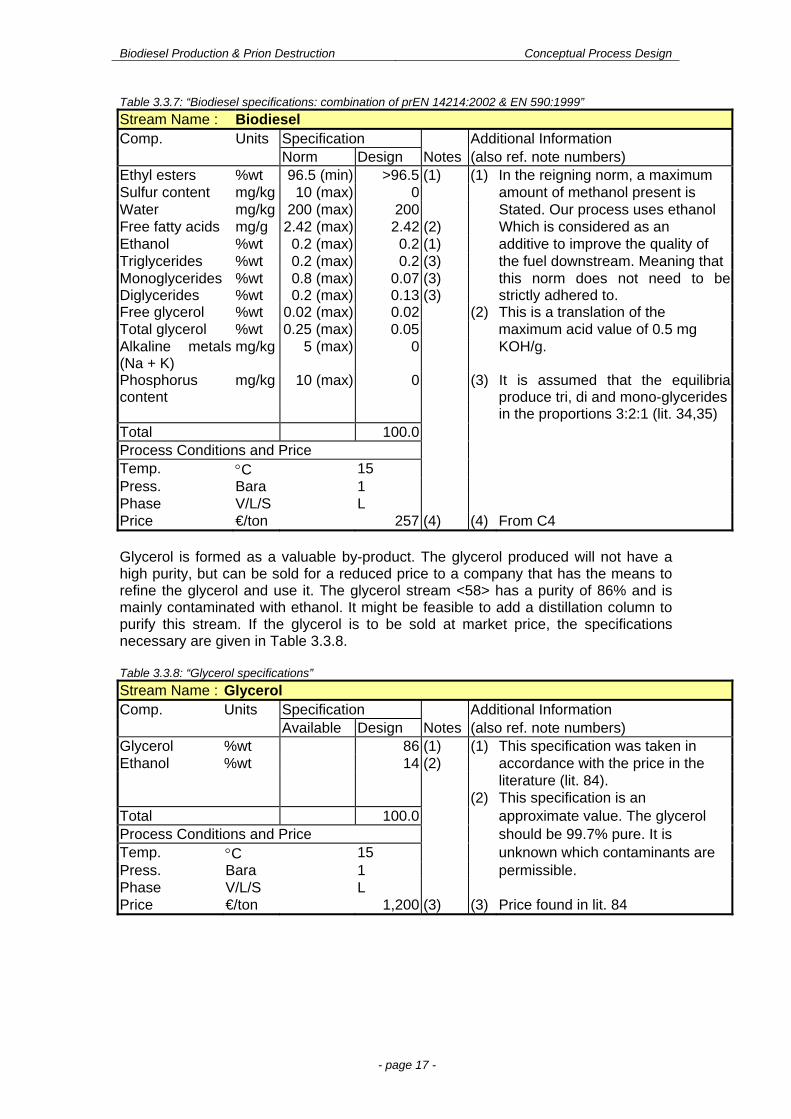
Stream Name : Ionol Comp. Units Specification Additional Information Available Design Notes (also ref. note numbers) Ionol %wt 100 100 (1) (1) It is not yet known whether an antioxidant will be necessary or Total 100.0 in what quantities. Process Conditions and Price Temp. C 15 Press. Bara 1 Phase V/L/S S Price €/ton 4,810 (2) (2) Price found in lit. 84 3.3.3 Definition of Products The main product is a mixture of FAEE (biodiesel). This mixture might not meet the reigning norms for FAME (prEN 14214:2002) and Diesel (EN 590:199) (Appendix 1.1) when leaving the process. This obstacle will be overcome by means of further processing and the addition of extra chemicals to improve the properties of the product. It is assumed that the composition of the ethyl esters will be the same as the composition of the fatty acids in the feedstock. The specifications of the biodiesel are given in Table 3.3.7.
Biodiesel Production & Prion Destruction Conceptual Process Design
- page 17 -
Table 3.3.7: “Biodiesel specifications: combination of prEN 14214:2002 & EN 590:1999”
Stream Name : Biodiesel Comp. Units Specification Additional Information Norm Design Notes (also ref. note numbers) Ethyl esters %wt 96.5 (min) >96.5 (1) (1) In the reigning norm, a maximum Sulfur content mg/kg 10 (max) 0 amount of methanol present is Water mg/kg 200 (max) 200 Stated. Our process uses ethanol Free fatty acids mg/g 2.42 (max) 2.42 (2) Which is considered as an Ethanol %wt 0.2 (max) 0.2 (1) additive to improve the quality of Triglycerides %wt 0.2 (max) 0.2 (3) the fuel downstream. Meaning that Monoglycerides Diglycerides
%wt %wt
0.8 (max)0.2 (max)
0.070.13
(3) (3)
this norm does not need to be strictly adhered to.
Free glycerol %wt 0.02 (max) 0.02 (2) This is a translation of the Total glycerol %wt 0.25 (max) 0.05 maximum acid value of 0.5 mg Alkaline metals (Na + K)
mg/kg 5 (max) 0 KOH/g.
Phosphorus content
mg/kg 10 (max) 0 (3) It is assumed that the equilibria produce tri, di and mono-glycerides
in the proportions 3:2:1 (lit. 34,35) Total 100.0 Process Conditions and Price Temp. C 15 Press. Bara 1 Phase V/L/S L Price €/ton 257 (4) (4) From C4 Glycerol is formed as a valuable by-product. The glycerol produced will not have a high purity, but can be sold for a reduced price to a company that has the means to refine the glycerol and use it. The glycerol stream <58> has a purity of 86% and is mainly contaminated with ethanol. It might be feasible to add a distillation column to purify this stream. If the glycerol is to be sold at market price, the specifications necessary are given in Table 3.3.8. Table 3.3.8: “Glycerol specifications”
Stream Name : Glycerol Comp. Units Specification Additional Information Available Design Notes (also ref. note numbers) Glycerol %wt 86 (1) (1) This specification was taken in Ethanol %wt 14 (2) accordance with the price in the literature (lit. 84). (2) This specification is an Total 100.0 approximate value. The glycerol Process Conditions and Price should be 99.7% pure. It is Temp. C 15 unknown which contaminants are Press. Bara 1 permissible. Phase V/L/S L Price €/ton 1,200 (3) (3) Price found in lit. 84
Biodiesel Production & Prion Destruction Conceptual Process Design
- page 18 -
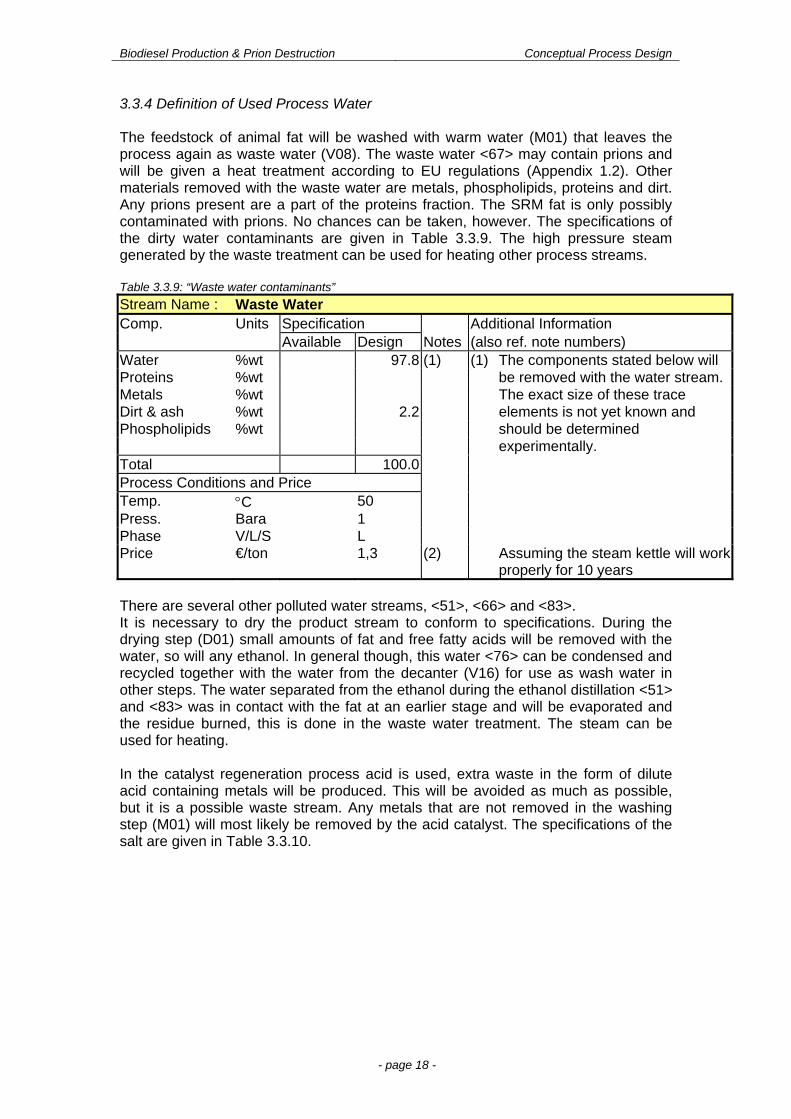
3.3.4 Definition of Used Process Water The feedstock of animal fat will be washed with warm water (M01) that leaves the process again as waste water (V08). The waste water <67> may contain prions and will be given a heat treatment according to EU regulations (Appendix 1.2). Other materials removed with the waste water are metals, phospholipids, proteins and dirt. Any prions present are a part of the proteins fraction. The SRM fat is only possibly contaminated with prions. No chances can be taken, however. The specifications of the dirty water contaminants are given in Table 3.3.9. The high pressure steam generated by the waste treatment can be used for heating other process streams. Table 3.3.9: “Waste water contaminants”
Stream Name : Waste Water Comp. Units Specification Additional Information Available Design Notes (also ref. note numbers) Water %wt 97.8 (1) (1) The components stated below will Proteins %wt be removed with the water stream. Metals %wt The exact size of these trace Dirt & ash %wt 2.2 elements is not yet known and Phospholipids %wt should be determined experimentally. Total 100.0 Process Conditions and Price Temp. C 50 Press. Bara 1 Phase V/L/S L Price €/ton 1,3 (2) Assuming the steam kettle will work
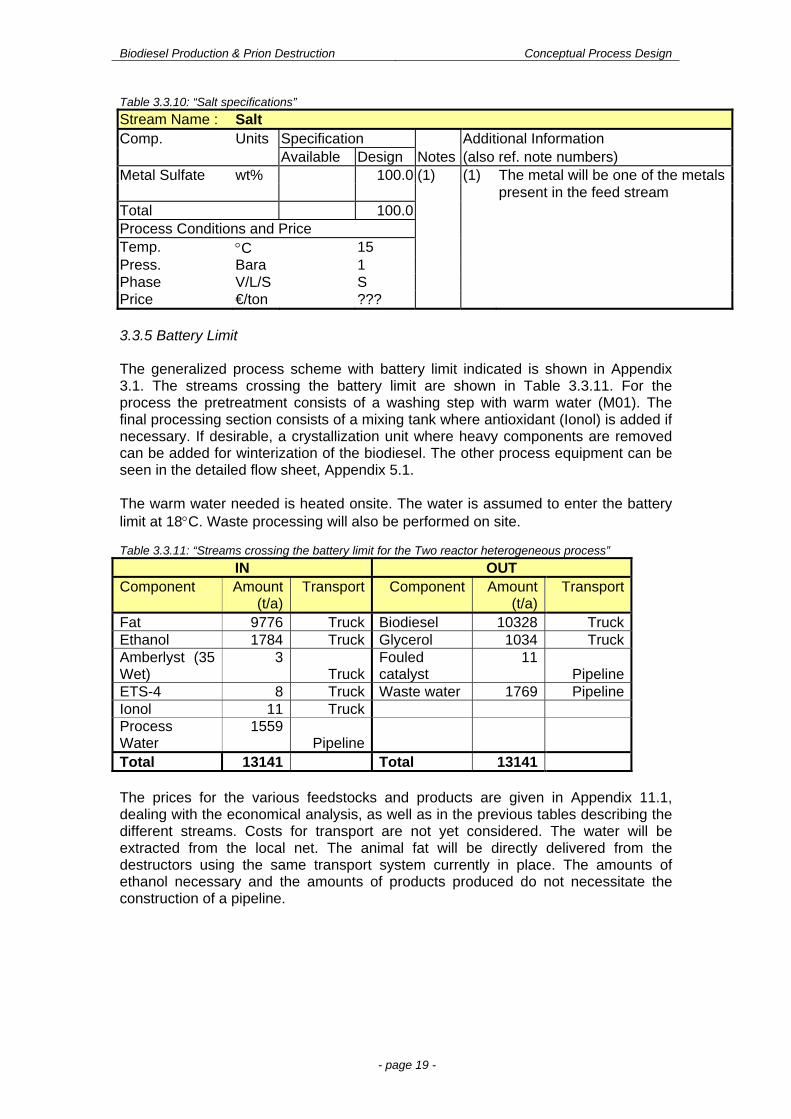
properly for 10 years There are several other polluted water streams, <51>, <66> and <83>. It is necessary to dry the product stream to conform to specifications. During the drying step (D01) small amounts of fat and free fatty acids will be removed with the water, so will any ethanol. In general though, this water <76> can be condensed and recycled together with the water from the decanter (V16) for use as wash water in other steps. The water separated from the ethanol during the ethanol distillation <51> and <83> was in contact with the fat at an earlier stage and will be evaporated and the residue burned, this is done in the waste water treatment. The steam can be used for heating. In the catalyst regeneration process acid is used, extra waste in the form of dilute acid containing metals will be produced. This will be avoided as much as possible, but it is a possible waste stream. Any metals that are not removed in the washing step (M01) will most likely be removed by the acid catalyst. The specifications of the salt are given in Table 3.3.10.
Biodiesel Production & Prion Destruction Conceptual Process Design
- page 19 -
Table 3.3.10: “Salt specifications”
Stream Name : Salt Comp. Units Specification Additional Information Available Design Notes (also ref. note numbers) Metal Sulfate wt% 100.0 (1) (1) The metal will be one of the metals present in the feed stream Total 100.0 Process Conditions and Price Temp. C 15 Press. Bara 1 Phase V/L/S S Price €/ton ???
3.3.5 Battery Limit The generalized process scheme with battery limit indicated is shown in Appendix 3.1. The streams crossing the battery limit are shown in Table 3.3.11. For the process the pretreatment consists of a washing step with warm water (M01). The final processing section consists of a mixing tank where antioxidant (Ionol) is added if necessary. If desirable, a crystallization unit where heavy components are removed can be added for winterization of the biodiesel. The other process equipment can be seen in the detailed flow sheet, Appendix 5.1. The warm water needed is heated onsite. The water is assumed to enter the battery limit at 18C. Waste processing will also be performed on site. Table 3.3.11: “Streams crossing the battery limit for the Two reactor heterogeneous process”
IN OUT Component Amount
(t/a) Transport Component Amount
(t/a)Transport
Fat 9776 Truck Biodiesel 10328 Truck Ethanol 1784 Truck Glycerol 1034 Truck Amberlyst (35 Wet)
3 Truck
Fouled catalyst
11Pipeline
ETS-4 8 Truck Waste water 1769 Pipeline Ionol 11 Truck Process Water
1559 Pipeline
Total 13141 Total 13141 The prices for the various feedstocks and products are given in Appendix 11.1, dealing with the economical analysis, as well as in the previous tables describing the different streams. Costs for transport are not yet considered. The water will be extracted from the local net. The animal fat will be directly delivered from the destructors using the same transport system currently in place. The amounts of ethanol necessary and the amounts of products produced do not necessitate the construction of a pipeline.
Biodiesel Production & Prion Destruction Conceptual Process Design
- page 20 -
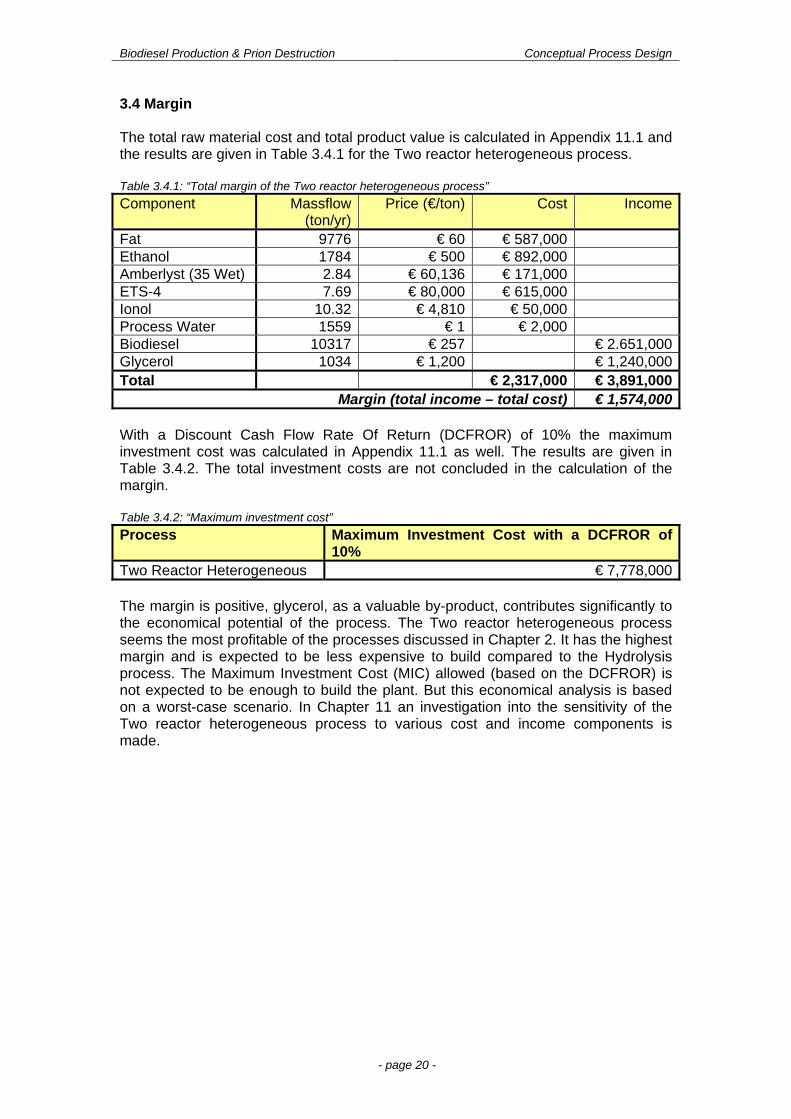
3.4 Margin The total raw material cost and total product value is calculated in Appendix 11.1 and the results are given in Table 3.4.1 for the Two reactor heterogeneous process. Table 3.4.1: “Total margin of the Two reactor heterogeneous process” Component Massflow
(ton/yr)Price (€/ton) Cost Income
Fat 9776 € 60 € 587,000 Ethanol 1784 € 500 € 892,000 Amberlyst (35 Wet) 2.84 € 60,136 € 171,000 ETS-4 7.69 € 80,000 € 615,000 Ionol 10.32 € 4,810 € 50,000 Process Water 1559 € 1 € 2,000 Biodiesel 10317 € 257 € 2.651,000Glycerol 1034 € 1,200 € 1,240,000Total € 2,317,000 € 3,891,000
Margin (total income – total cost) € 1,574,000 With a Discount Cash Flow Rate Of Return (DCFROR) of 10% the maximum investment cost was calculated in Appendix 11.1 as well. The results are given in Table 3.4.2. The total investment costs are not concluded in the calculation of the margin. Table 3.4.2: “Maximum investment cost”
Process Maximum Investment Cost with a DCFROR of 10%
Two Reactor Heterogeneous € 7,778,000 The margin is positive, glycerol, as a valuable by-product, contributes significantly to the economical potential of the process. The Two reactor heterogeneous process seems the most profitable of the processes discussed in Chapter 2. It has the highest margin and is expected to be less expensive to build compared to the Hydrolysis process. The Maximum Investment Cost (MIC) allowed (based on the DCFROR) is not expected to be enough to build the plant. But this economical analysis is based on a worst-case scenario. In Chapter 11 an investigation into the sensitivity of the Two reactor heterogeneous process to various cost and income components is made.
Biodiesel Production & Prion Destruction Conceptual Process Design
- page 21 -
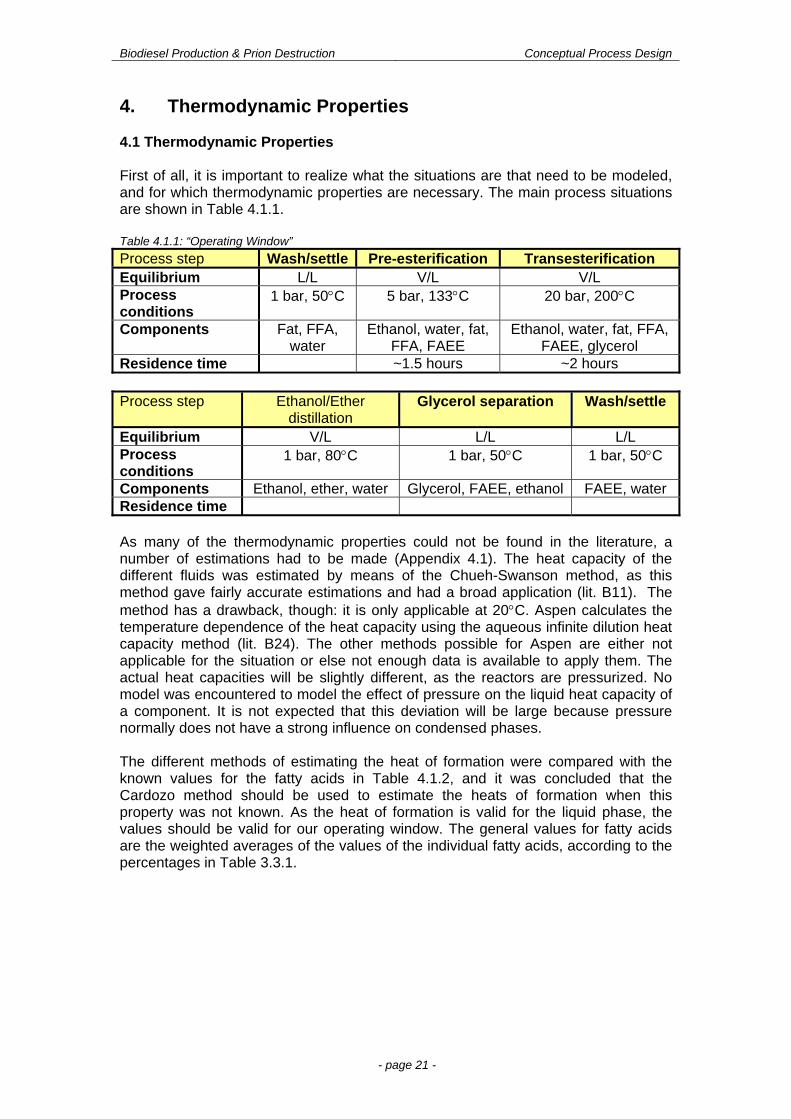
4. Thermodynamic Properties 4.1 Thermodynamic Properties First of all, it is important to realize what the situations are that need to be modeled, and for which thermodynamic properties are necessary. The main process situations are shown in Table 4.1.1. Table 4.1.1: “Operating Window”
Process step Wash/settle Pre-esterification Transesterification Equilibrium L/L V/L V/L Process conditions
1 bar, 50C 5 bar, 133C 20 bar, 200C
Components Fat, FFA, water
Ethanol, water, fat, FFA, FAEE
Ethanol, water, fat, FFA, FAEE, glycerol
Residence time ~1.5 hours ~2 hours
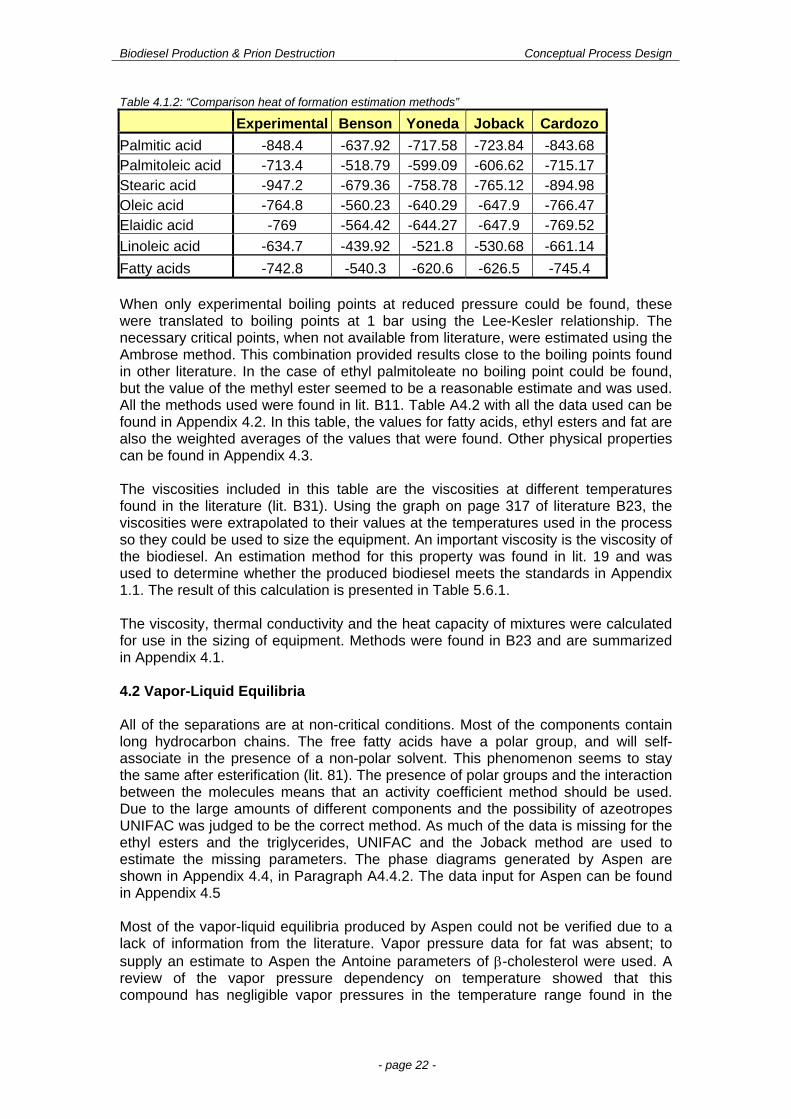
As many of the thermodynamic properties could not be found in the literature, a number of estimations had to be made (Appendix 4.1). The heat capacity of the different fluids was estimated by means of the Chueh-Swanson method, as this method gave fairly accurate estimations and had a broad application (lit. B11). The method has a drawback, though: it is only applicable at 20C. Aspen calculates the temperature dependence of the heat capacity using the aqueous infinite dilution heat capacity method (lit. B24). The other methods possible for Aspen are either not applicable for the situation or else not enough data is available to apply them. The actual heat capacities will be slightly different, as the reactors are pressurized. No model was encountered to model the effect of pressure on the liquid heat capacity of a component. It is not expected that this deviation will be large because pressure normally does not have a strong influence on condensed phases. The different methods of estimating the heat of formation were compared with the known values for the fatty acids in Table 4.1.2, and it was concluded that the Cardozo method should be used to estimate the heats of formation when this property was not known. As the heat of formation is valid for the liquid phase, the values should be valid for our operating window. The general values for fatty acids are the weighted averages of the values of the individual fatty acids, according to the percentages in Table 3.3.1.
Process step Ethanol/Ether distillation
Glycerol separation Wash/settle
Equilibrium V/L L/L L/L Process conditions
1 bar, 80C 1 bar, 50C 1 bar, 50C
Components Ethanol, ether, water Glycerol, FAEE, ethanol FAEE, water Residence time
Biodiesel Production & Prion Destruction Conceptual Process Design
- page 22 -
Table 4.1.2: “Comparison heat of formation estimation methods”
Experimental Benson Yoneda Joback Cardozo
Palmitic acid -848.4 -637.92 -717.58 -723.84 -843.68 Palmitoleic acid -713.4 -518.79 -599.09 -606.62 -715.17 Stearic acid -947.2 -679.36 -758.78 -765.12 -894.98 Oleic acid -764.8 -560.23 -640.29 -647.9 -766.47 Elaidic acid -769 -564.42 -644.27 -647.9 -769.52
Linoleic acid -634.7 -439.92 -521.8 -530.68 -661.14
Fatty acids -742.8 -540.3 -620.6 -626.5 -745.4 When only experimental boiling points at reduced pressure could be found, these were translated to boiling points at 1 bar using the Lee-Kesler relationship. The necessary critical points, when not available from literature, were estimated using the Ambrose method. This combination provided results close to the boiling points found in other literature. In the case of ethyl palmitoleate no boiling point could be found, but the value of the methyl ester seemed to be a reasonable estimate and was used. All the methods used were found in lit. B11. Table A4.2 with all the data used can be found in Appendix 4.2. In this table, the values for fatty acids, ethyl esters and fat are also the weighted averages of the values that were found. Other physical properties can be found in Appendix 4.3. The viscosities included in this table are the viscosities at different temperatures found in the literature (lit. B31). Using the graph on page 317 of literature B23, the viscosities were extrapolated to their values at the temperatures used in the process so they could be used to size the equipment. An important viscosity is the viscosity of the biodiesel. An estimation method for this property was found in lit. 19 and was used to determine whether the produced biodiesel meets the standards in Appendix 1.1. The result of this calculation is presented in Table 5.6.1. The viscosity, thermal conductivity and the heat capacity of mixtures were calculated for use in the sizing of equipment. Methods were found in B23 and are summarized in Appendix 4.1. 4.2 Vapor-Liquid Equilibria All of the separations are at non-critical conditions. Most of the components contain long hydrocarbon chains. The free fatty acids have a polar group, and will self-associate in the presence of a non-polar solvent. This phenomenon seems to stay the same after esterification (lit. 81). The presence of polar groups and the interaction between the molecules means that an activity coefficient method should be used. Due to the large amounts of different components and the possibility of azeotropes UNIFAC was judged to be the correct method. As much of the data is missing for the ethyl esters and the triglycerides, UNIFAC and the Joback method are used to estimate the missing parameters. The phase diagrams generated by Aspen are shown in Appendix 4.4, in Paragraph A4.4.2. The data input for Aspen can be found in Appendix 4.5 Most of the vapor-liquid equilibria produced by Aspen could not be verified due to a lack of information from the literature. Vapor pressure data for fat was absent; to supply an estimate to Aspen the Antoine parameters of -cholesterol were used. A review of the vapor pressure dependency on temperature showed that this compound has negligible vapor pressures in the temperature range found in the
Biodiesel Production & Prion Destruction Conceptual Process Design
- page 23 -
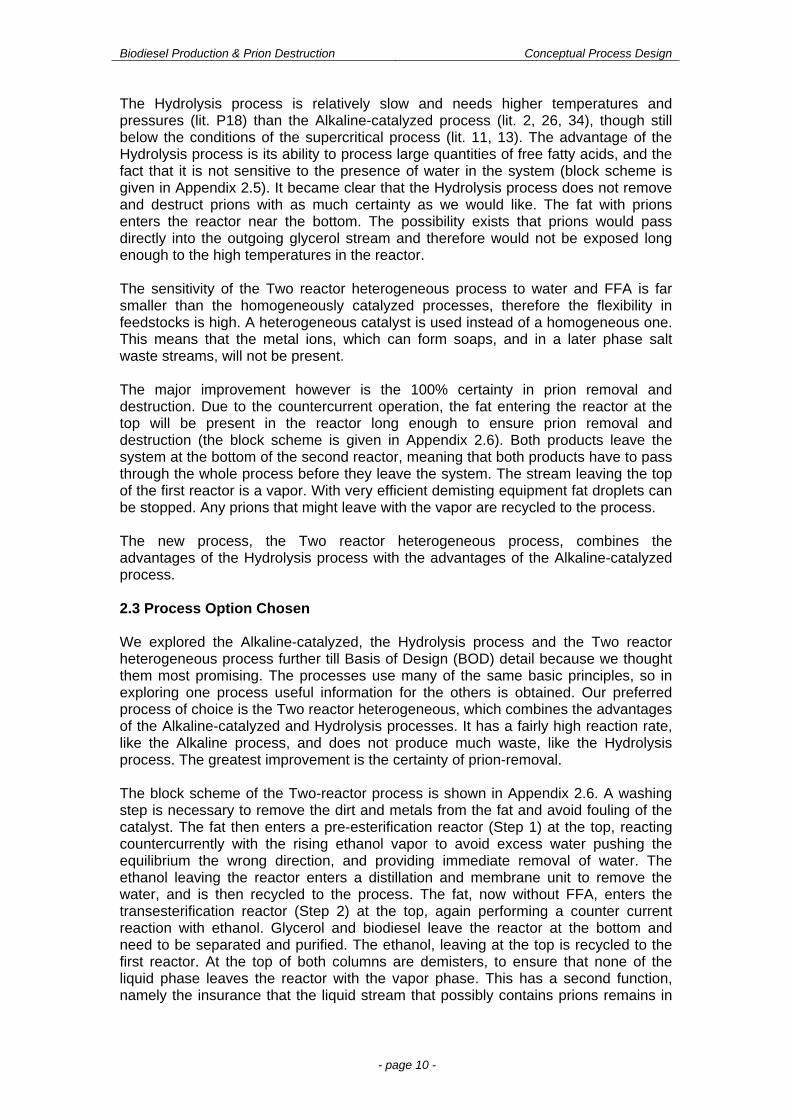
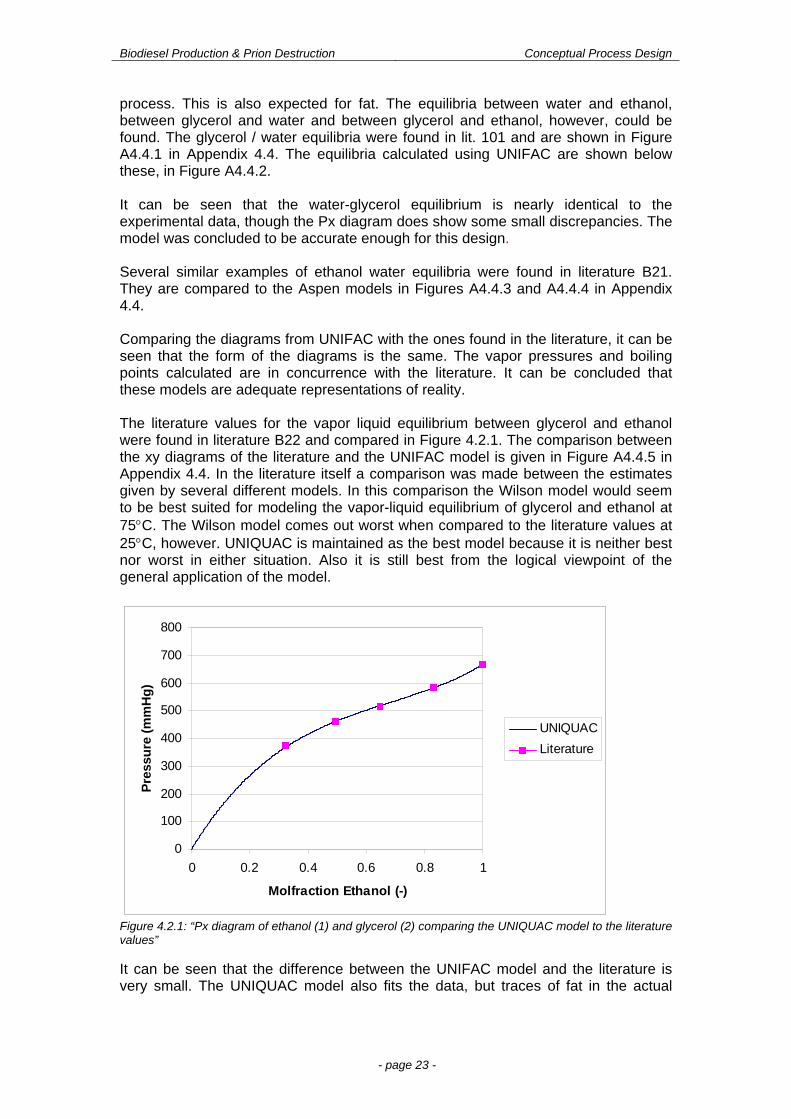
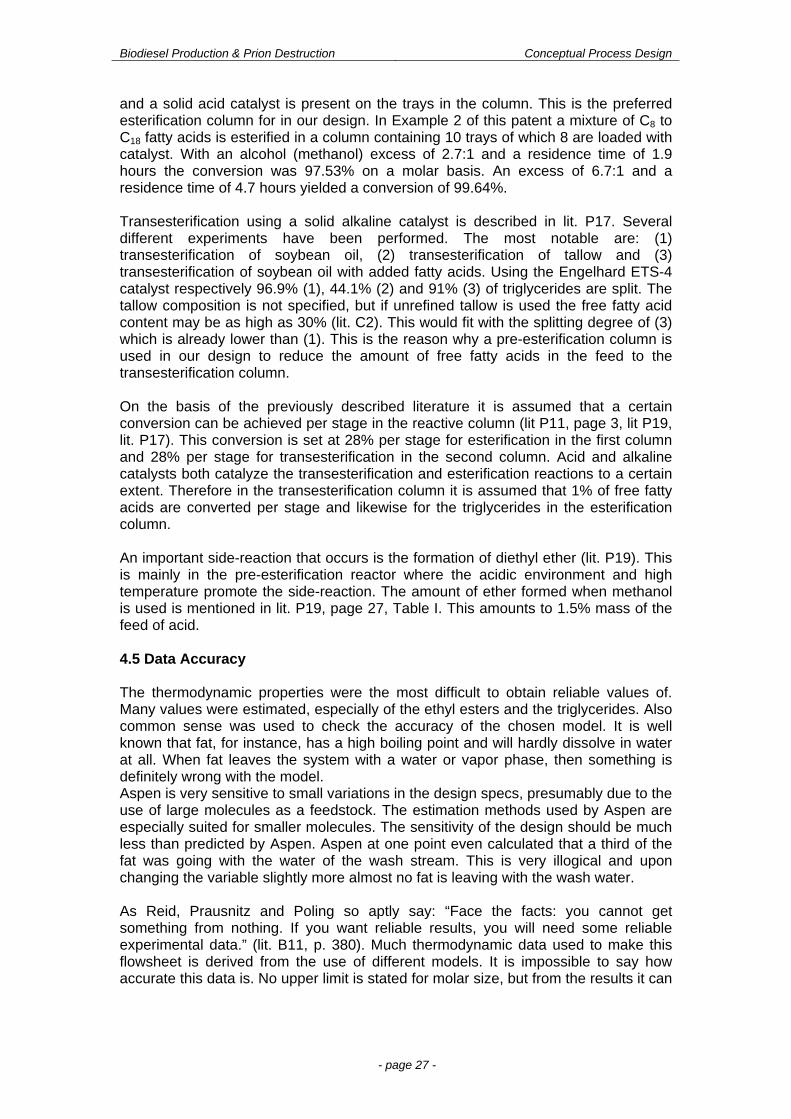
process. This is also expected for fat. The equilibria between water and ethanol, between glycerol and water and between glycerol and ethanol, however, could be found. The glycerol / water equilibria were found in lit. 101 and are shown in Figure A4.4.1 in Appendix 4.4. The equilibria calculated using UNIFAC are shown below these, in Figure A4.4.2. It can be seen that the water-glycerol equilibrium is nearly identical to the experimental data, though the Px diagram does show some small discrepancies. The model was concluded to be accurate enough for this design. Several similar examples of ethanol water equilibria were found in literature B21. They are compared to the Aspen models in Figures A4.4.3 and A4.4.4 in Appendix 4.4. Comparing the diagrams from UNIFAC with the ones found in the literature, it can be seen that the form of the diagrams is the same. The vapor pressures and boiling points calculated are in concurrence with the literature. It can be concluded that these models are adequate representations of reality. The literature values for the vapor liquid equilibrium between glycerol and ethanol were found in literature B22 and compared in Figure 4.2.1. The comparison between the xy diagrams of the literature and the UNIFAC model is given in Figure A4.4.5 in Appendix 4.4. In the literature itself a comparison was made between the estimates given by several different models. In this comparison the Wilson model would seem to be best suited for modeling the vapor-liquid equilibrium of glycerol and ethanol at 75C. The Wilson model comes out worst when compared to the literature values at 25C, however. UNIQUAC is maintained as the best model because it is neither best nor worst in either situation. Also it is still best from the logical viewpoint of the general application of the model.
0
100
200
300
400
500
600
700
800
0 0.2 0.4 0.6 0.8 1
Molfraction Ethanol (-)
Pre
ssu
re (
mm
Hg
)
UNIQUAC
Literature
Figure 4.2.1: “Px diagram of ethanol (1) and glycerol (2) comparing the UNIQUAC model to the literature values” It can be seen that the difference between the UNIFAC model and the literature is very small. The UNIQUAC model also fits the data, but traces of fat in the actual
Biodiesel Production & Prion Destruction Conceptual Process Design
- page 24 -
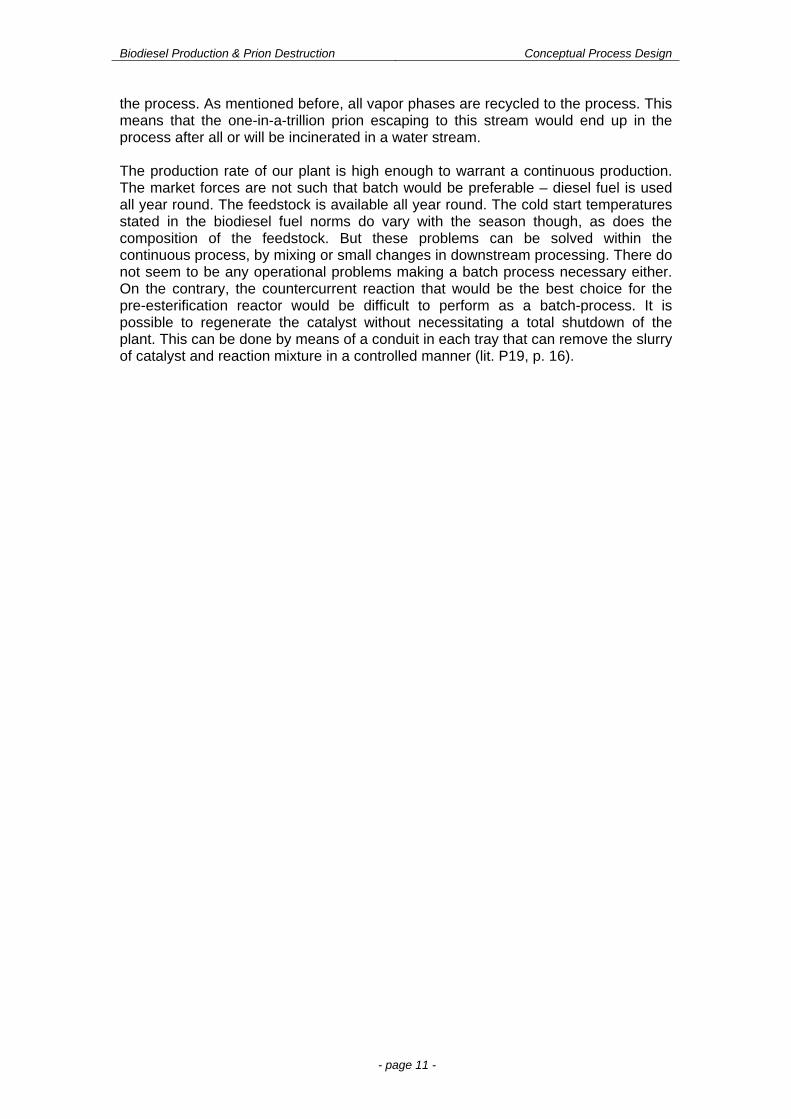
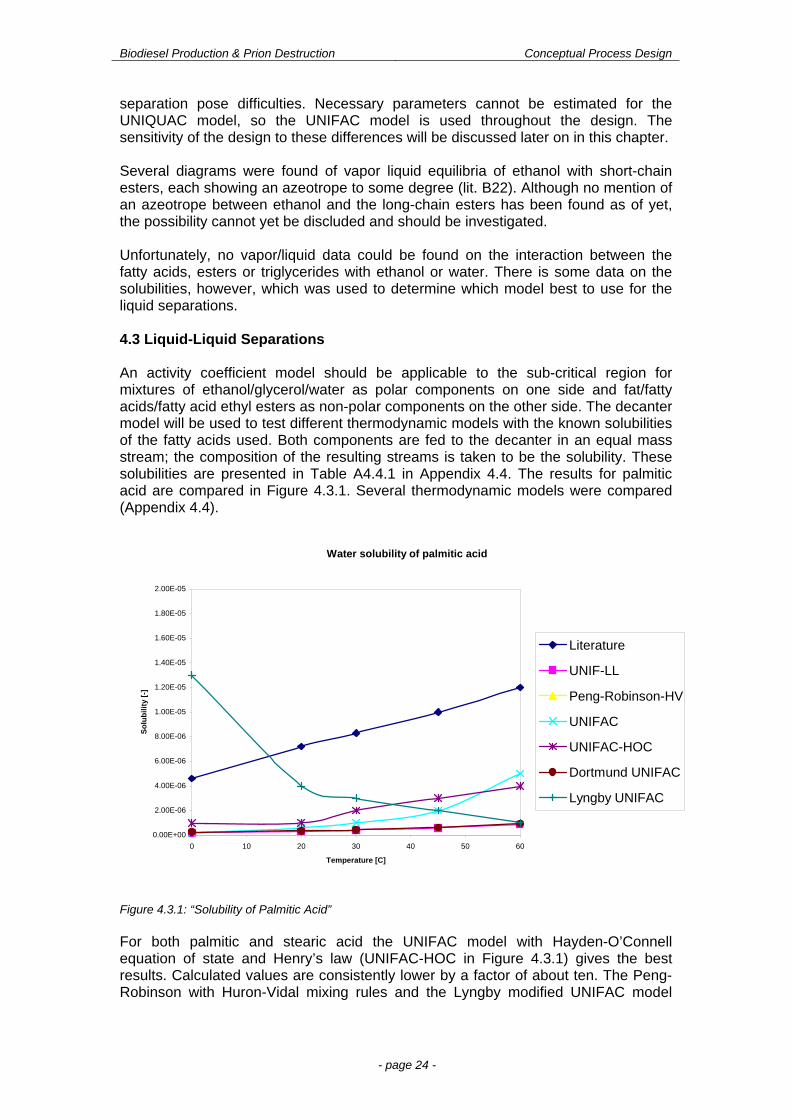
separation pose difficulties. Necessary parameters cannot be estimated for the UNIQUAC model, so the UNIFAC model is used throughout the design. The sensitivity of the design to these differences will be discussed later on in this chapter. Several diagrams were found of vapor liquid equilibria of ethanol with short-chain esters, each showing an azeotrope to some degree (lit. B22). Although no mention of an azeotrope between ethanol and the long-chain esters has been found as of yet, the possibility cannot yet be discluded and should be investigated. Unfortunately, no vapor/liquid data could be found on the interaction between the fatty acids, esters or triglycerides with ethanol or water. There is some data on the solubilities, however, which was used to determine which model best to use for the liquid separations. 4.3 Liquid-Liquid Separations An activity coefficient model should be applicable to the sub-critical region for mixtures of ethanol/glycerol/water as polar components on one side and fat/fatty acids/fatty acid ethyl esters as non-polar components on the other side. The decanter model will be used to test different thermodynamic models with the known solubilities of the fatty acids used. Both components are fed to the decanter in an equal mass stream; the composition of the resulting streams is taken to be the solubility. These solubilities are presented in Table A4.4.1 in Appendix 4.4. The results for palmitic acid are compared in Figure 4.3.1. Several thermodynamic models were compared (Appendix 4.4).
Water solubility of palmitic acid
0.00E+00
2.00E-06
4.00E-06
6.00E-06
8.00E-06
1.00E-05
1.20E-05
1.40E-05
1.60E-05
1.80E-05
2.00E-05
0 10 20 30 40 50 60
Temperature [C]
So
lub
ilit
y [-
]
Literature
UNIF-LL
Peng-Robinson-HV
UNIFAC
UNIFAC-HOC
Dortmund UNIFAC
Lyngby UNIFAC
Figure 4.3.1: “Solubility of Palmitic Acid” For both palmitic and stearic acid the UNIFAC model with Hayden-O’Connell equation of state and Henry’s law (UNIFAC-HOC in Figure 4.3.1) gives the best results. Calculated values are consistently lower by a factor of about ten. The Peng-Robinson with Huron-Vidal mixing rules and the Lyngby modified UNIFAC model
Biodiesel Production & Prion Destruction Conceptual Process Design
- page 25 -
3
3
ester glycerol
eq
triglyceride ethanol
C CK
C C
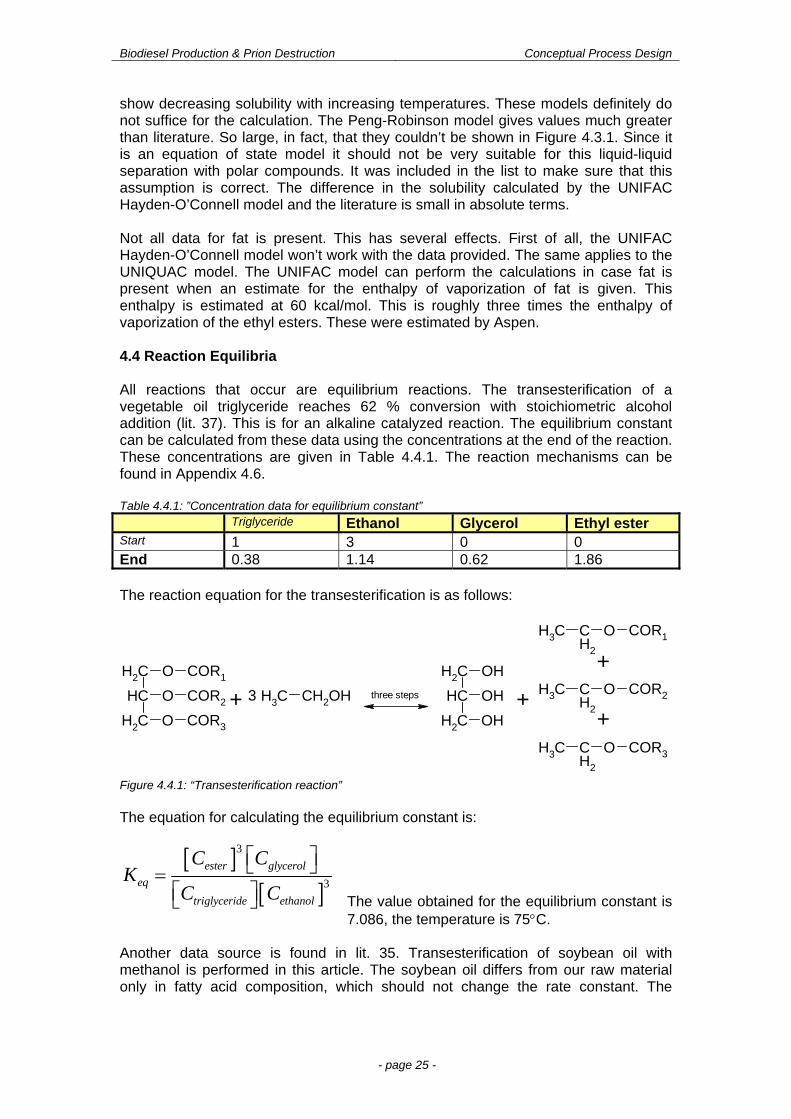
show decreasing solubility with increasing temperatures. These models definitely do not suffice for the calculation. The Peng-Robinson model gives values much greater than literature. So large, in fact, that they couldn’t be shown in Figure 4.3.1. Since it is an equation of state model it should not be very suitable for this liquid-liquid separation with polar compounds. It was included in the list to make sure that this assumption is correct. The difference in the solubility calculated by the UNIFAC Hayden-O’Connell model and the literature is small in absolute terms. Not all data for fat is present. This has several effects. First of all, the UNIFAC Hayden-O’Connell model won’t work with the data provided. The same applies to the UNIQUAC model. The UNIFAC model can perform the calculations in case fat is present when an estimate for the enthalpy of vaporization of fat is given. This enthalpy is estimated at 60 kcal/mol. This is roughly three times the enthalpy of vaporization of the ethyl esters. These were estimated by Aspen. 4.4 Reaction Equilibria All reactions that occur are equilibrium reactions. The transesterification of a vegetable oil triglyceride reaches 62 % conversion with stoichiometric alcohol addition (lit. 37). This is for an alkaline catalyzed reaction. The equilibrium constant can be calculated from these data using the concentrations at the end of the reaction. These concentrations are given in Table 4.4.1. The reaction mechanisms can be found in Appendix 4.6. Table 4.4.1: ”Concentration data for equilibrium constant”
Triglyceride Ethanol Glycerol Ethyl ester Start 1 3 0 0 End 0.38 1.14 0.62 1.86 The reaction equation for the transesterification is as follows:
O COR1CH2
O COR2CH
O COR3CH2
CH2
CH
OH
OH
CH2 OH
CH3 CH2OH three steps
CH3 CH2
O COR1
CH3 CH2
O COR2
CH3 CH2
O COR3
+
+
+ +3
Figure 4.4.1: “Transesterification reaction” The equation for calculating the equilibrium constant is:
The value obtained for the equilibrium constant is 7.086, the temperature is 75C.
Another data source is found in lit. 35. Transesterification of soybean oil with methanol is performed in this article. The soybean oil differs from our raw material only in fatty acid composition, which should not change the rate constant. The
Biodiesel Production & Prion Destruction Conceptual Process Design
- page 26 -
difference in rate constants between methanol and ethanol should also not be large. The ratio of alcohol to triglycerides is 6:1. The temperature is 50C. A kinetic model using a three-step mechanism including monoglycerides and diglycerides is used. Rate constants and activation energies are calculated. The main focus of this study is on the effect of mixing. Experiments are performed in liquid state. From the rate constants of the forward and backward overall reaction an equilibrium constant can be calculated. The data are given in Table 4.4.2. Table 4.4.2: “Kinetic constants for soybean transesterification with methanol”
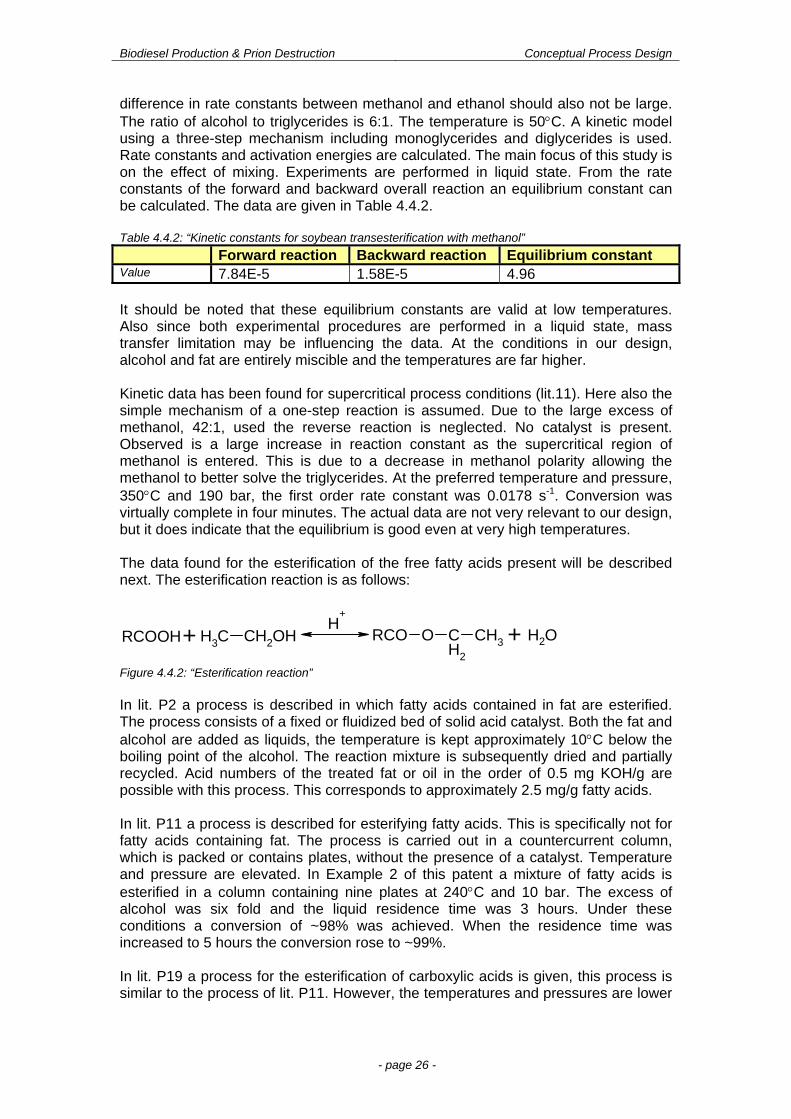
Forward reaction Backward reaction Equilibrium constant Value 7.84E-5 1.58E-5 4.96 It should be noted that these equilibrium constants are valid at low temperatures. Also since both experimental procedures are performed in a liquid state, mass transfer limitation may be influencing the data. At the conditions in our design, alcohol and fat are entirely miscible and the temperatures are far higher. Kinetic data has been found for supercritical process conditions (lit.11). Here also the simple mechanism of a one-step reaction is assumed. Due to the large excess of methanol, 42:1, used the reverse reaction is neglected. No catalyst is present. Observed is a large increase in reaction constant as the supercritical region of methanol is entered. This is due to a decrease in methanol polarity allowing the methanol to better solve the triglycerides. At the preferred temperature and pressure, 350C and 190 bar, the first order rate constant was 0.0178 s-1. Conversion was virtually complete in four minutes. The actual data are not very relevant to our design, but it does indicate that the equilibrium is good even at very high temperatures. The data found for the esterification of the free fatty acids present will be described next. The esterification reaction is as follows:
Figure 4.4.2: “Esterification reaction” In lit. P2 a process is described in which fatty acids contained in fat are esterified. The process consists of a fixed or fluidized bed of solid acid catalyst. Both the fat and alcohol are added as liquids, the temperature is kept approximately 10C below the boiling point of the alcohol. The reaction mixture is subsequently dried and partially recycled. Acid numbers of the treated fat or oil in the order of 0.5 mg KOH/g are possible with this process. This corresponds to approximately 2.5 mg/g fatty acids. In lit. P11 a process is described for esterifying fatty acids. This is specifically not for fatty acids containing fat. The process is carried out in a countercurrent column, which is packed or contains plates, without the presence of a catalyst. Temperature and pressure are elevated. In Example 2 of this patent a mixture of fatty acids is esterified in a column containing nine plates at 240C and 10 bar. The excess of alcohol was six fold and the liquid residence time was 3 hours. Under these conditions a conversion of ~98% was achieved. When the residence time was increased to 5 hours the conversion rose to ~99%. In lit. P19 a process for the esterification of carboxylic acids is given, this process is similar to the process of lit. P11. However, the temperatures and pressures are lower
RCOOH RCO O CH2
CH3CH3 CH2OHH
+
+ + H2O
Biodiesel Production & Prion Destruction Conceptual Process Design
- page 27 -
and a solid acid catalyst is present on the trays in the column. This is the preferred esterification column for in our design. In Example 2 of this patent a mixture of C8 to C18 fatty acids is esterified in a column containing 10 trays of which 8 are loaded with catalyst. With an alcohol (methanol) excess of 2.7:1 and a residence time of 1.9 hours the conversion was 97.53% on a molar basis. An excess of 6.7:1 and a residence time of 4.7 hours yielded a conversion of 99.64%. Transesterification using a solid alkaline catalyst is described in lit. P17. Several different experiments have been performed. The most notable are: (1) transesterification of soybean oil, (2) transesterification of tallow and (3) transesterification of soybean oil with added fatty acids. Using the Engelhard ETS-4 catalyst respectively 96.9% (1), 44.1% (2) and 91% (3) of triglycerides are split. The tallow composition is not specified, but if unrefined tallow is used the free fatty acid content may be as high as 30% (lit. C2). This would fit with the splitting degree of (3) which is already lower than (1). This is the reason why a pre-esterification column is used in our design to reduce the amount of free fatty acids in the feed to the transesterification column. On the basis of the previously described literature it is assumed that a certain conversion can be achieved per stage in the reactive column (lit P11, page 3, lit P19, lit. P17). This conversion is set at 28% per stage for esterification in the first column and 28% per stage for transesterification in the second column. Acid and alkaline catalysts both catalyze the transesterification and esterification reactions to a certain extent. Therefore in the transesterification column it is assumed that 1% of free fatty acids are converted per stage and likewise for the triglycerides in the esterification column. An important side-reaction that occurs is the formation of diethyl ether (lit. P19). This is mainly in the pre-esterification reactor where the acidic environment and high temperature promote the side-reaction. The amount of ether formed when methanol is used is mentioned in lit. P19, page 27, Table I. This amounts to 1.5% mass of the feed of acid. 4.5 Data Accuracy The thermodynamic properties were the most difficult to obtain reliable values of. Many values were estimated, especially of the ethyl esters and the triglycerides. Also common sense was used to check the accuracy of the chosen model. It is well known that fat, for instance, has a high boiling point and will hardly dissolve in water at all. When fat leaves the system with a water or vapor phase, then something is definitely wrong with the model. Aspen is very sensitive to small variations in the design specs, presumably due to the use of large molecules as a feedstock. The estimation methods used by Aspen are especially suited for smaller molecules. The sensitivity of the design should be much less than predicted by Aspen. Aspen at one point even calculated that a third of the fat was going with the water of the wash stream. This is very illogical and upon changing the variable slightly more almost no fat is leaving with the wash water. As Reid, Prausnitz and Poling so aptly say: “Face the facts: you cannot get something from nothing. If you want reliable results, you will need some reliable experimental data.” (lit. B11, p. 380). Much thermodynamic data used to make this flowsheet is derived from the use of different models. It is impossible to say how accurate this data is. No upper limit is stated for molar size, but from the results it can
Biodiesel Production & Prion Destruction Conceptual Process Design
- page 28 -
be seen that the accuracy is sorely wanting for very large molecules. What we can do, however, is determine which properties are most important to know. For the modeling of liquid-liquid separation the Gibbs energy of formation is important. Experimental data on the solubilities of specific components would make that information unnecessary, however. Vapor pressure data for fat is also not available. The logical estimate is that at temperatures of 200C and lower, the vapor pressure of fat is zero. As mentioned before the parameters of -cholesterol have been taken. Vapor pressures of the ethyl esters are more difficult and warrant investigation. Naturally, the kinetics will have to be tested on a smaller scale before it is possible to truly implement them on industrial scale. In the literature little theoretical data could be found. Scientists simply tested the column at different conditions for different times, and determined the conversion. This would seem the most logical method to make a functioning plant with as little effort as possible. Knowledge of the physical properties of the different materials and the more exact kinetics would, however, prevent surprises that might pose a problem at a later time.
Biodiesel Production & Prion Destruction Conceptual Process Design
- page 29 -
5. Process Structure & Description 5.1 Criteria and selections The various criteria for the design have been given in Chapter 2. The main criteria with large consequences for the design will be briefly summarized here.
Removal of prions Achieving product specifications Minimizing reactant use Flexibility for the feedstock
These criteria dictate for a great part the design of the process, the process units and the recycle structure. The first criterion dictates the reactor system and the treatment of the wastewater streams. High temperatures and long residence times have to be provided for every stream, which may possibly be contaminated with the prions. These are assumed to be present in the fat feed stream. The second criterion is very obvious but just as important. Criteria three and four are of a more economic background although the flexibility demand has some implications for reactor sizing. 5.2 Process Flow Scheme The process flow scheme (PFS) is given in Appendix 5.1. The route of the main reactant, SRM fat, through the process will be followed and for every unit the decisions will be elaborated. Then the two recycle systems will be described in detail. For detailed equipment description and sizing reference is made to Chapter 8. Fat Heater (E02, E11) At room temperature the fat is a solid, it has to be melted so it is easier to transport. For further processing it is necessary for the fat to be in liquid from, this already starts at the washing step. Furthermore transport through the plant is easier if in liquid from. In heat exchanger (E11) the incoming fat stream <2> is melted using heat from the product stream <55>. The heat that can be extracted from this stream is enough to heat and melt the fat. The fat is then heated further with waste heat from another product stream <73> in the fat heater (E02). The desired exit temperature of the fat is 75C, at this temperature the viscosity is such that it poses no problems in the decanter (V08). The next step in the process is the washing of fat. Washer (M01) To remove impurities such as animal meal, phospholipids, proteins (including prions), metal salts and the like it is necessary to wash the fat. The proportion of water used is 15 weight percent of the fat stream <3>. This water is recycled from the product-washing step. The main impurities in stream <68> are ethanol and glycerol; these do not pose any problems for the washing step. The mixer (M01) is a stirred tank. Next step in the process is the decanting of fat from the water phase. Water/Fat Decanter (V08) Water has to be removed because most of the pollutants are in the water phase and the equilibrium in the pre-esterification reactor (R01) is negatively influenced by the presence of water. The decanter (V08) is fed from washer (M01) with stream <5>. The temperature is chosen such that the viscosity of the continuous fat phase is low enough to ensure that the size of the decanter (V08) is not excessive. This temperature is around 74C. Next step for the fat is to be pumped up to reactor pressure.
Biodiesel Production & Prion Destruction Conceptual Process Design
- page 30 -
Pump (P07) To get the purified fat stream <8> into the reactor, it needs to be pressurized to the reactor (R01) pressure, which is 5 bar. For this pressure increase a centrifugal pump can be used. The pump needs to process 1.24 m3/h. An efficiency of 35% is assumed. Next the fat enters the reaction section. Pre-esterification reactor (R01) The SRM fat feedstock contains large amounts of FFA. The pre-esterification reactor (R01) is necessary to convert these to the product, FAEE. The reactor is a countercurrent column. The reaction is catalyzed by an acidic ion exchange resin. The required residence time of fat in the reactor is 90 minutes. The conversion is set at 98% overall. The reactor is fed by the pressurized fat stream <9> and a superheated ethanol vapor stream <28>. The fat stream <9> enters the reactor on the top tray. The ethanol vapor stream <28> enters the reactor below the first tray. This mode of countercurrent operation is chosen because of the equilibrium of the reaction and the better heat integration within the reactor. It gives a method of eluding the equilibrium extent, because the partially reacted fatty acids encounter drier ethanol as they are converted further. The water that evolves from the reaction is carried out of the column by the rising ethanol vapor. A guarantee for the residence time is important for the destruction of prions, which still may be present after the washing step. A pressure of 3 bar and a temperature of 133C is the legal requirement. The pressure is set at 5 bar, this is the minimum given in literature P19. The minimum temperature is 138C. A higher pressure is not necessary, it would just add to the investment cost without any benefit, like a smaller reactor. This is because the reactor size is determined by liquid residence time and downcomer backup. A demister is placed in the top stream <29> of the column to prevent droplets, which may contain prions, from leaving with the ethanol stream and escaping destruction in the column. A slight drawback of using an acidic catalyst is that a byproduct is formed. This is diethyl ether, which has a boiling point of 34.5C. Diethyl ether is an extremely volatile substance. Due to a fault in the property estimation Aspen calculated that the ether all dissolved in the fat stream <10>. Therefore it was concluded it would be better not to incorporate the ether in the Aspen model. A separate model was made to simulate the ether/ethanol/water separation that is necessary. More detail can be found in the ethanol recycle part below. Next for the fat is a pump. Pump (P08) To pump the fat stream <11> leaving the pre-esterification reactor (R01) to the trans-esterification reactor (R02), a pump (P08) is installed. The discharge pressure of this pump is 20 bar, the pressure difference is 15 bar. This can be achieved using a multistage centrifugal pump. The capacity of this pump needs to be 1.32 m3/hr. An efficiency of 35% is estimated. The fat then enters the trans-esterification reactor (R02). Trans-esterification reactor (R02) The reactor for the trans-esterification reaction (R02) is the same kind of reactor as the pre-esterification reactor (R01). The conversion in the reactor must be greater than 99%. Countercurrent operation is not so critical here, but some FFA are still present and water is formed. The column is fed by streams <12> and <25>, which are the fat and ethanol stream respectively. Streams leaving the trans-esterification reactor (R02) are the ethanol vapor stream <26> and the ethyl ester stream <13>. In this reactor (R02) the legal requirements for prion destruction are also met with a
Biodiesel Production & Prion Destruction Conceptual Process Design
- page 31 -
large margin. The minimum temperature in the column is 218°C. For the same reason as for (R01) a demister is placed on this column. Biodiesel flash vessel (V12) The raw biodiesel stream <14> from the trans-esterification reactor (R02) contains a large amount of ethanol, ~56 kg/hr that must be removed. The pressure drop in the flash vessel (V12) is 9 bar. A larger pressure drop means a higher recovery of ethanol, but also more glycerol is flashed of. The ethanol recovery is ~30 kg/hr, the temperature is 252C. Heat exchanger (E10) The ester stream <4> from flash vessel (V12) is used next to supply heat for the vaporization of ethanol. The incoming ethanol stream <24> is already at a pressure of 20 bar, the temperature is 79C. The boiling point of pure ethanol at 20 bar is 180C, it needs to be introduced in the trans-esterification reactor (R02) at 200C. The heat exchanger (E10) needs to be designed for fairly high pressures; the exchanging streams have pressures of 20 and 11 bar. The product stream <55> leaving heat exchanger (E10) is still at a high temperature of 174C and a pressure of 11 bar. It will be cooled further before entering the next process step. Heat exchanger (E11) The next major step in the process is the phase separation of glycerol and the ester product. This is performed most efficiently at lower temperatures. Because of this, stream <55> needs to be cooled from 174C to 55C. This is done in the heat exchanger (E11), cooling is done by heating and melting the fat stream <2>. The pressure of 11 bar is reduced to atmospheric pressure using a throttle valve (U03). Glycerol/Ester Decanter (V15) Glycerol needs to be removed from the product for two reasons, it may not be present in the biodiesel and it is a valuable byproduct. Stream <57> is the product stream containing some the glycerol. It is split into the glycerol stream <58> and the biodiesel stream <69>. Biodiesel washer (M02) To wash out the glycerol and ethanol that are still dissolved in the biodiesel stream washing with water is necessary. This washing is performed in the biodiesel washer (M02). The proportion of water that is used <61> is 15 w% of the FAEE stream <59>. In the washer, a stirred tank, streams <61> and <59> are finely dispersed. Biodiesel/Water Decanter (V16) The decanter for the separation of biodiesel and water (V16) is fed from washer (M02) by stream <62>. This stream is split into a water stream <63> with glycerol and part of the ethanol and a biodiesel stream <69>. Simply decanting the biodiesel and water is not enough to achieve the product specification for the water and ethanol content. The biodiesel leaving the decanter <69> has to be dried to conform to the biodiesel norms (Appendix 1.1) Low pressure dryer (D01) To remove the water and ethanol from the product <69> leaving the decanter (V16) a drying step is necessary. This is performed in the low pressure dryer (D01). To avoid exposing the biodiesel to a very high temperature, a low pressure of 0.1 bar is used. The temperature is set at 130C; with this combination of temperature and pressure
Biodiesel Production & Prion Destruction Conceptual Process Design
- page 32 -
almost all water and ethanol is removed. Furthermore the product stream <71> at 130C can be used to heat other streams, <80> and <1> entering the plant. Pump (P1) The pressure of the biodiesel stream <72> leaving the dryer (D01) needs to be raised. This is done by means of a pump (P1). The hot biodiesel stream needs to pass through two heat exchangers so the discharge pressure needs to be slightly higher than atmospheric, for the modeling a discharge pressure of 1 bar has been assumed. Water heater (E13) The hot biodiesel stream originating from the low pressure dryer (D01) contains a considerable amount of heat. This heat can be partially reclaimed by exchanging stream <72> with the stream of fresh wash water <60>. The water stream <60> needs to be warmed to 50C from a temperature of 18C. This causes the hot biodiesel stream <72> to cool down from 130C to 122C. Afterwards the biodiesel stream is cooled further in the smelter of the incoming fat (E02), which is described above. Biodiesel cooler (E03) The biodiesel stream <74> leaving the fat smelter (E02) is still too hot (~80C) to be stored. Cooling is necessary and a safe temperature for storage would be 30C. This temperature can be obtained with cooling water. All process steps for the fat/fatty acids and biodiesel have been treated now. Two recycle systems are present, one for water and one for ethanol. The process units not yet treated in the previous part will now be outlined. First the water recycle will be treated, then the ethanol recycle. Water recycle system Water from two points in the plant is recycled to the start of the process. The first and largest stream comes from the water/biodiesel decanter (V16). This stream contains some glycerol and ethanol. It is mixed with the vapor stream <76> which originates from the low pressure dryer (D01). This vapor stream is pressurized using a compressor (K01). The contents of this stream are mostly ethanol and it would be better to direct this stream to the ethanol purification system. The compressor outlet temperature in stream <77> without intercooling is approximately 300C. The compressor may be an expensive piece of equipment and the savings in ethanol may not be so significant. However, the compressor is needed to keep the dryer at 0.1 bar. Both water streams, <63> and <77>, are mixed together. Next they are split again, because in the washing of fat, less water is needed than in the washing of biodiesel. It is important that a minimal amount of water is used to wash the fat, because this water will become contaminated with prions and will have to undergo an energy intensive treatment. The water purge stream <66> has only been in contact with the biodiesel product which contains no more prions. This may be treated in an ordinary fashion. The ethanol in the water recycle system is partially transferred to the fat phase in the washer (M01) and the water/fat decanter (V08). This ethanol will either participate in the reaction or it will enter the ethanol purification system. Ethanol recycle system The ethanol recycle system is also fed from two points in the process. Ethanol containing some glycerol is flashed off from the biodiesel, <44> in a flash vessel (V12). This stream <15> is cooled to 165C in a cooler (E09) and then flashed from
Biodiesel Production & Prion Destruction Conceptual Process Design
- page 33 -
11 bar to 1 bar to separate the glycerol from the ethanol. Ethanol of a high purity, 99.7%, is obtained from this second flash vessel (V14). The other source of recycled ethanol comes from the trans-esterification reactor (R02). The ethanol vapor <26> leaving the trans-esterification reactor (R02) is throttled back from 20 bar to 5 bar, this is done using a throttle valve (U02). The possibility exists to cool the ethanol vapor stream <27>, for this purpose a cooler (E08) is present. It can be used when the temperature in the pre-esterification reactor (R01) is too high. After the cooler the ethanol is fed to the pre-esterification reactor (R01). The stream leaving the pre-esterification reactor (R01) over the top is throttled to 1 bar using a throttle valve (U01). Then it is cooled to 74C in a condenser (E01). Stream <33> leaves the condenser (E01) and enters the ether distillation column (C01), the ether produced as byproduct in the pre-esterification reactor (R01) leaves over the top and is flared of. The bottom product <41> is fed to the ethanol distillation column where the ethanol is concentrated to 86%. The ethanol stream <52> is then introduced in the membrane unit (S01). Here the ethanol is purified to 99.2%. Then both ethanol recycle streams are mixed with the make-up ethanol stream <22>. If necessary this stream, <23>, can be cooled to its bubble point by means of a condenser (E12). Next it is pressurized to 20 bar before being vaporized in heat exchanger (E10) as described before. Now important process units from both recycle systems will be described in detail. Units mentioned in the previous section will not be repeated here. Ethanol flash vessel (V14) The ethanol/glycerol vapor stream <15> from the biodiesel flash vessel (V12) is first partially condensed by cooling it to 165C in cooler (E09). The pressure is then reduced to 1 bar in the flash vessel (V14). The recoveries of both glycerol and ethanol in this flash vessel exceed 98%. Ethanol vapor compressor (K01) To maintain the reduced pressure in the low pressure dryer (D01) vapor needs to be drawn off. This is done by means of a gas compressor (K01); since a very moderate vacuum is required a reciprocating compressor is the best choice. The work requirement is approximately 1.2 kW. The outlet temperature is 300C, this temperature increase is very large and may necessitate a multistage compressor with interstage cooling. Liquid ethanol pump (P09) A condenser (E12) assures that the feed stream <81> to the liquid ethanol pump (P09) is indeed in a liquid state. The required discharge pressure is 20 bar. This setup is chosen so no gas compressor is needed. The pressurized ethanol is vaporized in the heat exchanger (E10). The pumping of a liquid is always cheaper than compressing a gas. A two stage centrifugal pump is used to overcome the pressure change of 19 bar. Ether distillation column (C01) The ether that is produced in the pre-esterification reactor (R01) needs to be removed from the recycle of ethanol. The low auto ignition temperature, high volatility and health aspects of ether pose unacceptable hazards. A buildup of ether in the plant may have disastrous consequences. To prevent such a buildup 99% of the incoming ether is removed in a distillation column (C01).
Biodiesel Production & Prion Destruction Conceptual Process Design
- page 34 -
Ethanol distillation column (C02) The bottoms <51> from the ether distillation (C01) contain water and ethanol. The ethanol that is needed in the reactors should be free of water. The existence of an azeotrope in the water/ethanol system at 96 weight percent ethanol complicates matters. Waterfree ethanol cannot be obtained by direct distillation. Even distilling to the azeotrope takes a large amount of stages in the distillation column. The azeotrope can be broken in different ways. A third component can be added and a column under a different pressure where the azeotropic composition is different can be used. A third way is the use of a vapor permeation or vapor pervaporation membrane. The last way is chosen, for optimum process economics the ethanol only needs to be distilled to a certain purity in the distillation column. An indication is given in lit.C7, the ethanol is purified in column (C02) to a purity of 86.1%. Membrane pervaporation unit (S01) The membrane unit (S01) is fed by the top stream <52> from the ethanol distillation column (C02). This is a liquid stream because a total condenser is present on top of column (C02). A vacuum of 6.7 mbar will be maintained on the permeate side of the membrane. A gas compressor is needed to maintain the vacuum. This will be a reciprocating compressor. 5.3 Post Processing Some streams leaving the process need some form of further processing. This processing is not designed, but a brief description of it will be given here. FAEE <75> No exact data is available on the stability of the FAEE, and this makes the estimation of the iodide number difficult. A quality control of the produced biodiesel is necessary per batch, and several additives might be necessary, such as an antioxidant to improve the stability, or an additive to improve the cold flow properties and flash point. Ionol should be a suitable antioxidant, and ethanol for the improvement of the cold flow properties. Ether <39> The amount of ether produced is too small for further purification. Purification of this ether will give more pollution and costs a relatively large amount of energy. Onsite storage of sellable quantities of pure ether poses large risks, mainly because of its volatility and fire hazard. For these reasons stream <39> is sent to a flare. Process water <51>, <66>, <67>, <83> The process water leaving with streams <67> and <51> may contain some prions, that have to be destroyed. The water is sent to an incineration unit. The prions in this water will be destroyed and the water evaporated. The steam produced can possibly be used in heat exchangers. Though stream <83> should not be contaminated by prions, as will be explained in Chapter 9, it was in contact with streams containing prions and will be burned as well. Stream <66>, however, only comes into contact with clean biodiesel and can be purified by conventional means. 5.4 Process Stream Summary A complete process stream summary (PSS) is given in Appendix 5.2. This contains all the flows and gives the mass streams per component, total mass stream, temperature, pressure and vapor fraction.
Biodiesel Production & Prion Destruction Conceptual Process Design
- page 35 -
5.5 Utilities Heating and cooling of process fluids can be done by direct heat exchange of these fluids. Not all heating and cooling requirements can be supplied internally. Heating and cooling utilities such as steam and cooling water are necessary. Air could be used for cooling as well but is not implemented in this process. Furthermore to drive pumps and compressors electric power is needed, or for large compressors steam can be used. Different types of steam are available depending on pressure. The higher the pressure the higher the temperature at which condensation takes place. Cooling water can be drawn from surface water or from a water net. The temperature of this water may vary during the seasons. The intake temperature, which is assumed, is 20C, to be allowed to return the hot water to the environment the temperature may not be too high. The allowed return temperature is taken as 30C. Saturated steam at two pressures is used, 1.5 bar steam at 111C and 4 bar steam at 144C. An overview of utility use is given in the utility summary in Appendix 5.3. The amount of steam necessary can be fulfilled using the wastewater stream, which already needs to be heated and evaporated. This depends on the type of equipment used for post-processing, because this water may be contaminated to such an extent that it cannot be used in conventional boilers. As a first estimation a separate steam kettle for steam production is installed. 5.6 Process Yields A convenient way of comparing a process to other similar processes is to provide process yields. These yields give the amount of feedstock or utilities per amount of product. A quick overview of process performance, in terms of process yields, is given in Appendix 5.4. Other processes that have the same purpose are not available. The feedstock, SRM fat, poses such strict requirements on the process that comparison to other biodiesel plants is not realistic. Plants producing biodiesel from vegetable sources or waste grease or oil do not require such high temperatures to destroy prions. Waste water treatment for an SRM fat plant is also much more difficult. Not just the possibility of prion contamination in the feedstock (which is assumed to be present) poses a problem. High contents of free fatty acids necessitate a separate reactor to be converted. These factors contribute to the fact that the SRM process will have higher energy consumption and investment cost. A plus of the process is that it provides a way of turning a hazardous waste into a valuable product. The properties of the product must meet the biodiesel norms. The product as produced should have approximately the properties listed in Table 5.6.1. With the current data and assumptions, all of the specifications are met. Not all the assumptions made will be correct, however, and it would be good to test the product when it is produced as well.
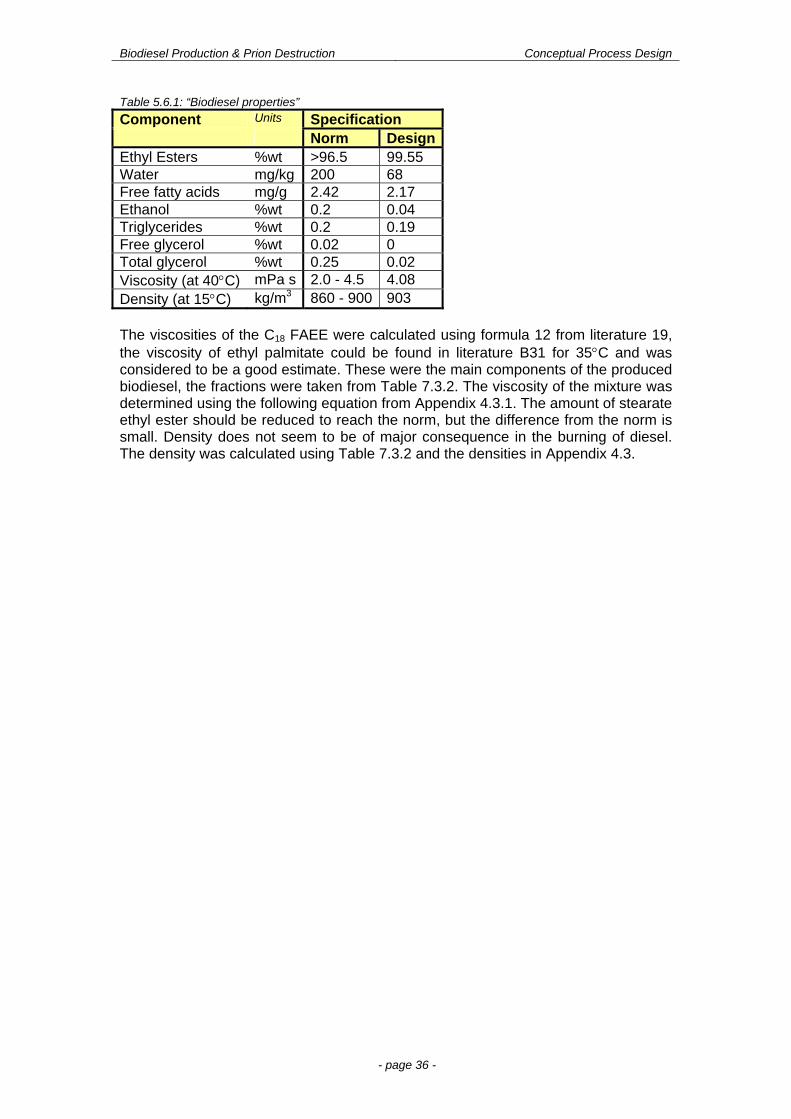
Biodiesel Production & Prion Destruction Conceptual Process Design
- page 36 -
Table 5.6.1: “Biodiesel properties”
Component Units Specification Norm DesignEthyl Esters %wt >96.5 99.55 Water mg/kg 200 68 Free fatty acids mg/g 2.42 2.17 Ethanol %wt 0.2 0.04 Triglycerides %wt 0.2 0.19 Free glycerol %wt 0.02 0 Total glycerol %wt 0.25 0.02 Viscosity (at 40C) mPa s 2.0 - 4.5 4.08 Density (at 15C) kg/m3 860 - 900 903 The viscosities of the C18 FAEE were calculated using formula 12 from literature 19, the viscosity of ethyl palmitate could be found in literature B31 for 35C and was considered to be a good estimate. These were the main components of the produced biodiesel, the fractions were taken from Table 7.3.2. The viscosity of the mixture was determined using the following equation from Appendix 4.3.1. The amount of stearate ethyl ester should be reduced to reach the norm, but the difference from the norm is small. Density does not seem to be of major consequence in the burning of diesel. The density was calculated using Table 7.3.2 and the densities in Appendix 4.3.
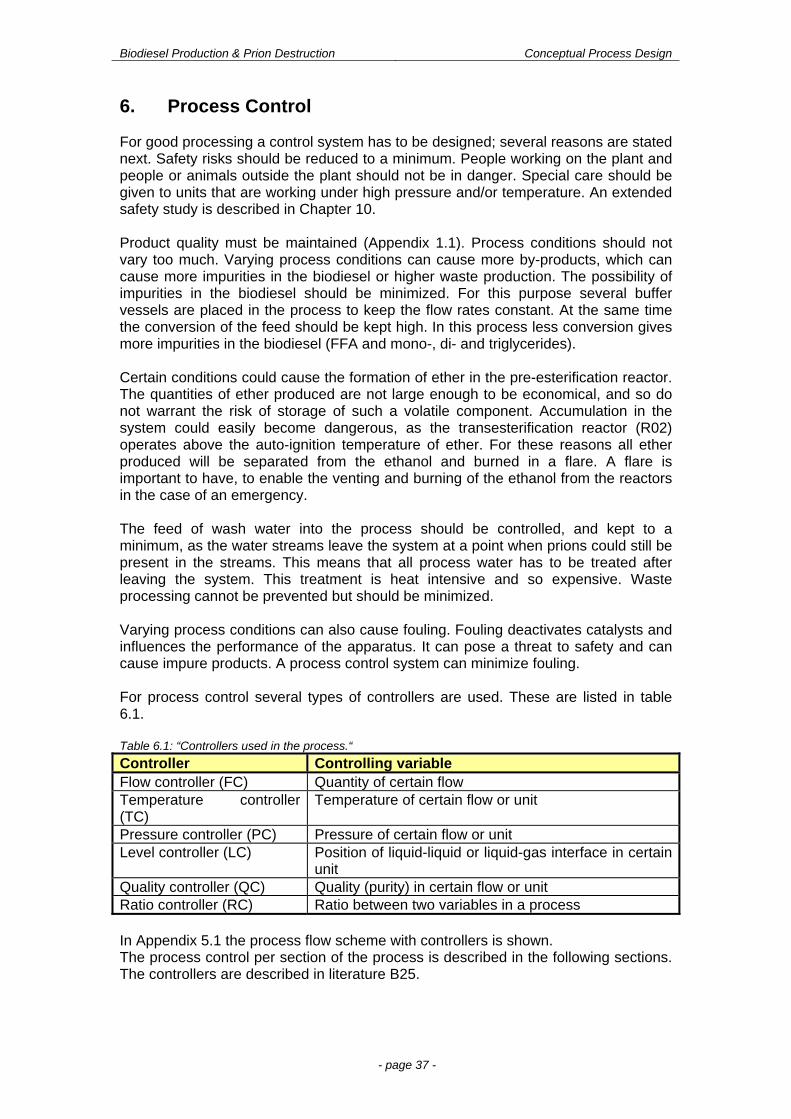
Biodiesel Production & Prion Destruction Conceptual Process Design
- page 37 -
6. Process Control For good processing a control system has to be designed; several reasons are stated next. Safety risks should be reduced to a minimum. People working on the plant and people or animals outside the plant should not be in danger. Special care should be given to units that are working under high pressure and/or temperature. An extended safety study is described in Chapter 10. Product quality must be maintained (Appendix 1.1). Process conditions should not vary too much. Varying process conditions can cause more by-products, which can cause more impurities in the biodiesel or higher waste production. The possibility of impurities in the biodiesel should be minimized. For this purpose several buffer vessels are placed in the process to keep the flow rates constant. At the same time the conversion of the feed should be kept high. In this process less conversion gives more impurities in the biodiesel (FFA and mono-, di- and triglycerides). Certain conditions could cause the formation of ether in the pre-esterification reactor. The quantities of ether produced are not large enough to be economical, and so do not warrant the risk of storage of such a volatile component. Accumulation in the system could easily become dangerous, as the transesterification reactor (R02) operates above the auto-ignition temperature of ether. For these reasons all ether produced will be separated from the ethanol and burned in a flare. A flare is important to have, to enable the venting and burning of the ethanol from the reactors in the case of an emergency. The feed of wash water into the process should be controlled, and kept to a minimum, as the water streams leave the system at a point when prions could still be present in the streams. This means that all process water has to be treated after leaving the system. This treatment is heat intensive and so expensive. Waste processing cannot be prevented but should be minimized. Varying process conditions can also cause fouling. Fouling deactivates catalysts and influences the performance of the apparatus. It can pose a threat to safety and can cause impure products. A process control system can minimize fouling. For process control several types of controllers are used. These are listed in table 6.1. Table 6.1: “Controllers used in the process.“
Controller Controlling variable Flow controller (FC) Quantity of certain flow Temperature controller (TC)
Temperature of certain flow or unit
Pressure controller (PC) Pressure of certain flow or unit Level controller (LC) Position of liquid-liquid or liquid-gas interface in certain
unit Quality controller (QC) Quality (purity) in certain flow or unit Ratio controller (RC) Ratio between two variables in a process In Appendix 5.1 the process flow scheme with controllers is shown. The process control per section of the process is described in the following sections. The controllers are described in literature B25.
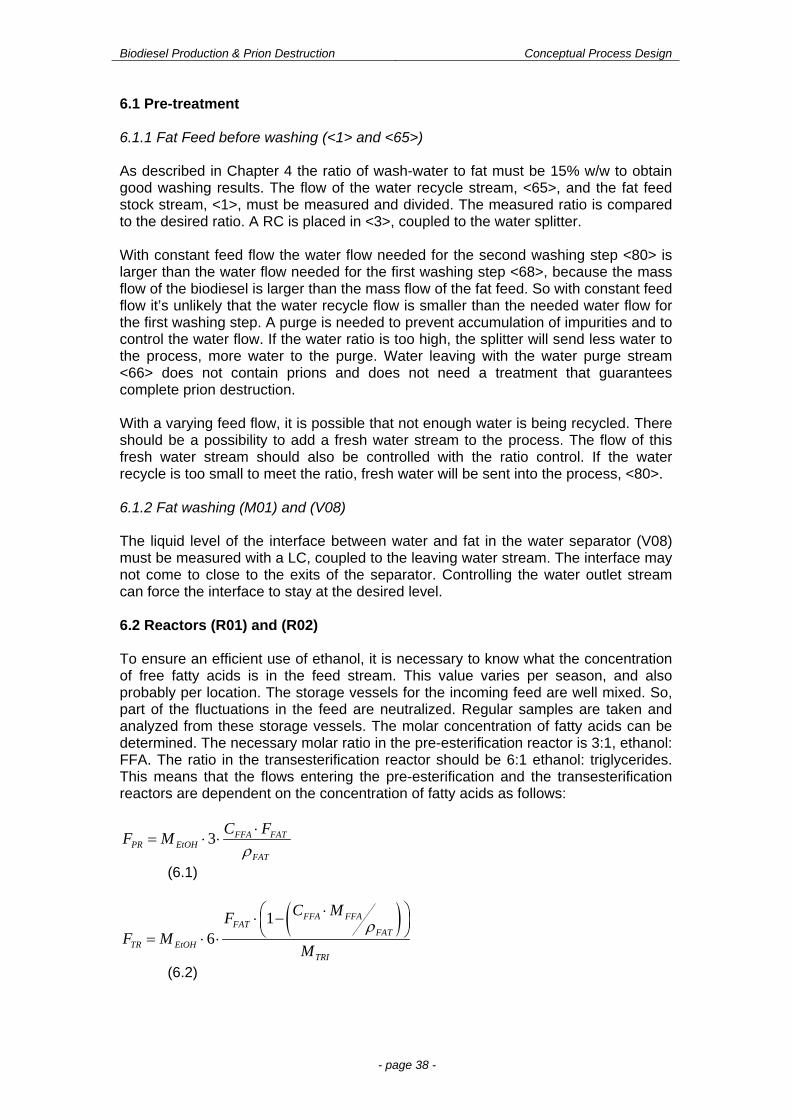
Biodiesel Production & Prion Destruction Conceptual Process Design
- page 38 -
6.1 Pre-treatment 6.1.1 Fat Feed before washing (<1> and <65>) As described in Chapter 4 the ratio of wash-water to fat must be 15% w/w to obtain good washing results. The flow of the water recycle stream, <65>, and the fat feed stock stream, <1>, must be measured and divided. The measured ratio is compared to the desired ratio. A RC is placed in <3>, coupled to the water splitter. With constant feed flow the water flow needed for the second washing step <80> is larger than the water flow needed for the first washing step <68>, because the mass flow of the biodiesel is larger than the mass flow of the fat feed. So with constant feed flow it’s unlikely that the water recycle flow is smaller than the needed water flow for the first washing step. A purge is needed to prevent accumulation of impurities and to control the water flow. If the water ratio is too high, the splitter will send less water to the process, more water to the purge. Water leaving with the water purge stream <66> does not contain prions and does not need a treatment that guarantees complete prion destruction. With a varying feed flow, it is possible that not enough water is being recycled. There should be a possibility to add a fresh water stream to the process. The flow of this fresh water stream should also be controlled with the ratio control. If the water recycle is too small to meet the ratio, fresh water will be sent into the process, <80>. 6.1.2 Fat washing (M01) and (V08) The liquid level of the interface between water and fat in the water separator (V08) must be measured with a LC, coupled to the leaving water stream. The interface may not come to close to the exits of the separator. Controlling the water outlet stream can force the interface to stay at the desired level. 6.2 Reactors (R01) and (R02) To ensure an efficient use of ethanol, it is necessary to know what the concentration of free fatty acids is in the feed stream. This value varies per season, and also probably per location. The storage vessels for the incoming feed are well mixed. So, part of the fluctuations in the feed are neutralized. Regular samples are taken and analyzed from these storage vessels. The molar concentration of fatty acids can be determined. The necessary molar ratio in the pre-esterification reactor is 3:1, ethanol: FFA. The ratio in the transesterification reactor should be 6:1 ethanol: triglycerides. This means that the flows entering the pre-esterification and the transesterification reactors are dependent on the concentration of fatty acids as follows:
3 FFA FATPR EtOH
FAT
C FF M
(6.1)
16
FFA FFAFAT
FATTR EtOH
TRI
C MFF M
M
(6.2)
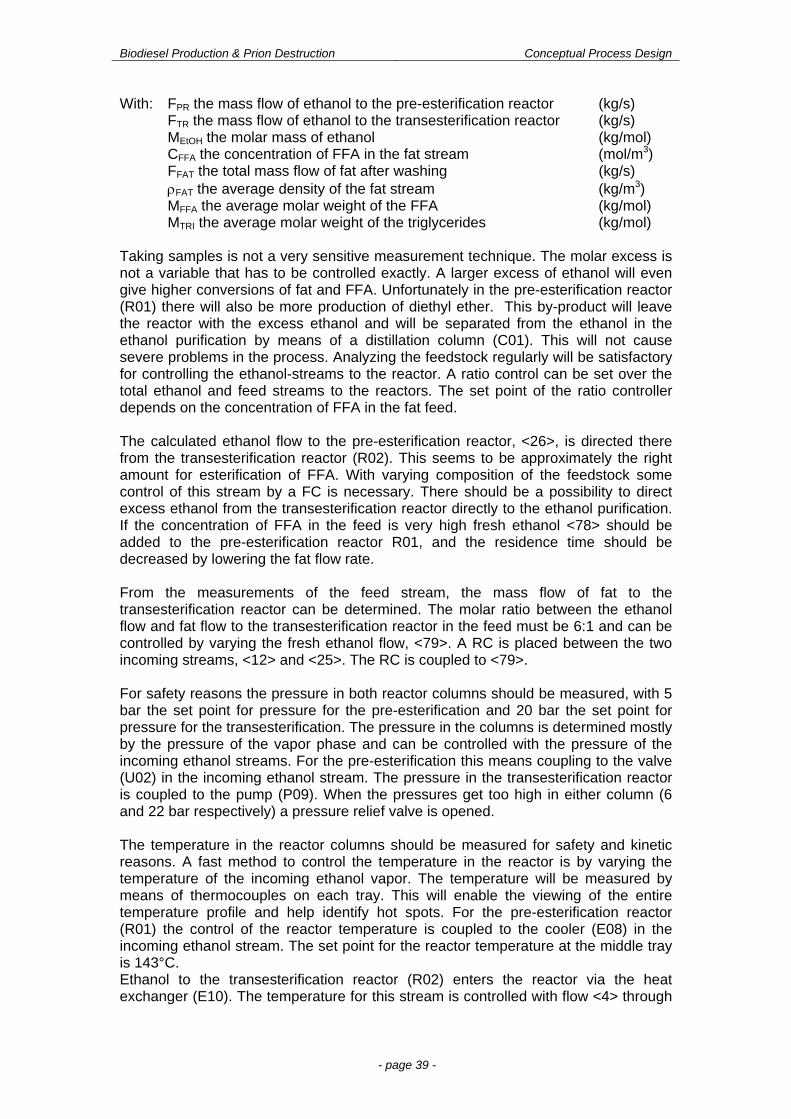
Biodiesel Production & Prion Destruction Conceptual Process Design
- page 39 -
With: FPR the mass flow of ethanol to the pre-esterification reactor (kg/s) FTR the mass flow of ethanol to the transesterification reactor (kg/s) MEtOH the molar mass of ethanol (kg/mol) CFFA the concentration of FFA in the fat stream (mol/m3) FFAT the total mass flow of fat after washing (kg/s) FAT the average density of the fat stream (kg/m3) MFFA the average molar weight of the FFA (kg/mol) MTRI the average molar weight of the triglycerides (kg/mol) Taking samples is not a very sensitive measurement technique. The molar excess is not a variable that has to be controlled exactly. A larger excess of ethanol will even give higher conversions of fat and FFA. Unfortunately in the pre-esterification reactor (R01) there will also be more production of diethyl ether. This by-product will leave the reactor with the excess ethanol and will be separated from the ethanol in the ethanol purification by means of a distillation column (C01). This will not cause severe problems in the process. Analyzing the feedstock regularly will be satisfactory for controlling the ethanol-streams to the reactor. A ratio control can be set over the total ethanol and feed streams to the reactors. The set point of the ratio controller depends on the concentration of FFA in the fat feed. The calculated ethanol flow to the pre-esterification reactor, <26>, is directed there from the transesterification reactor (R02). This seems to be approximately the right amount for esterification of FFA. With varying composition of the feedstock some control of this stream by a FC is necessary. There should be a possibility to direct excess ethanol from the transesterification reactor directly to the ethanol purification. If the concentration of FFA in the feed is very high fresh ethanol <78> should be added to the pre-esterification reactor R01, and the residence time should be decreased by lowering the fat flow rate. From the measurements of the feed stream, the mass flow of fat to the transesterification reactor can be determined. The molar ratio between the ethanol flow and fat flow to the transesterification reactor in the feed must be 6:1 and can be controlled by varying the fresh ethanol flow, <79>. A RC is placed between the two incoming streams, <12> and <25>. The RC is coupled to <79>. For safety reasons the pressure in both reactor columns should be measured, with 5 bar the set point for pressure for the pre-esterification and 20 bar the set point for pressure for the transesterification. The pressure in the columns is determined mostly by the pressure of the vapor phase and can be controlled with the pressure of the incoming ethanol streams. For the pre-esterification this means coupling to the valve (U02) in the incoming ethanol stream. The pressure in the transesterification reactor is coupled to the pump (P09). When the pressures get too high in either column (6 and 22 bar respectively) a pressure relief valve is opened. The temperature in the reactor columns should be measured for safety and kinetic reasons. A fast method to control the temperature in the reactor is by varying the temperature of the incoming ethanol vapor. The temperature will be measured by means of thermocouples on each tray. This will enable the viewing of the entire temperature profile and help identify hot spots. For the pre-esterification reactor (R01) the control of the reactor temperature is coupled to the cooler (E08) in the incoming ethanol stream. The set point for the reactor temperature at the middle tray is 143°C. Ethanol to the transesterification reactor (R02) enters the reactor via the heat exchanger (E10). The temperature for this stream is controlled with flow <4> through
Biodiesel Production & Prion Destruction Conceptual Process Design
- page 40 -
the heat exchanger. There is already another heat exchanger (E11) in <4> that can control the final temperature of this stream. The set point for the middle tray of (R02) is 263°C. In this column there will also be thermocouples on each tray. Despite the TC the temperature may rise in both columns. When the temperature gets too high it may be necessary to shut down the column. For (R01) it is better not to reach the auto-ignition temperature of ether (160°C). As the temperature is measured at each tray, the set point for shutting down this column is 159°C on any one tray. No air is present so the set point can be set somewhat higher; furthermore the concentration of ether in the column is low. Reactor (R02) contains no ether and operates at higher temperatures. The set point for shutting down is set on 275°C to prevent runaways. The reactor is shut down when this temperature is reached at one of the stages. 6.3 Post-treatment 6.3.1 Flashing (V12) and (V14) Ethanol is very flammable (flash point: 12 C), and poses more risks at high temperatures and pressures. Therefore pressure and temperature in the flash vessels should be controlled. A flash vessel operating at stable conditions produces product streams with less variation in composition. Both flash vessels (V12) and (V14) operate at a certain pressure. A PC controls these pressures. The set point is 11 bar for (V12) and 1 bar for (V5). The level of the vapor liquid interface may change. Therefore a LC is placed in the flash vessels. The PC and the LC for each vessel are coupled together and to a valve controlling the flow of the bottom streams leaving the flash vessels. There is also a maximum pressure for the flash vessels for safety reasons. A pressure relief valve is placed on both vessels. The valve in (V12) opens at 13 bar and the valve in (V14) at 3 bar (the vessel will no longer adequately flash at that pressure, but this will not pose any significant problems; any vessel will be able to withstand about 30% overpressure (above design pressure before rupturing). The vapor from the pressure release valves will be flared off. Both flash vessels operate without a heat duty, the evaporation will have a temperature effect though. The size of the incoming stream and the pressure in the flash vessels control their temperature. A TC is placed in both the flash vessels. In stream <16>, entering (V14), a cooler is present. The temperature of <16> can be controlled with this cooler. Stream <14> to (V12) does not go through a heat exchanger. The temperature in (V12) is controlled with the pressure drop. A larger pressure drop means a vapor liquid equilibrium with more vapor. This vapor needs to be evaporated from the liquid and this costs the heat of vaporization. More evaporation means a lower temperature. The effect of less pressure drop available in (V14) can be countered by controlling the duty of the heat exchanger (E09) 6.3.2 Ethanol recycle and purification (C01, C02 and S01) The transesterification reaction is very sensitive to the presence of water. The water concentration in the ethanol flow to the transesterification reactor (R02) has to be
Biodiesel Production & Prion Destruction Conceptual Process Design
- page 41 -
minimized. Ether is formed in (R01). The temperature in (R02) is above the auto-ignition temperature of ether (160°C). The presence of ether should be minimized in (R02). Water and ether must be removed in the ethanol recycle. In the first distillation column (C01) 99 w% of the ether is removed. A TC coupled to the cooling and heating in the condenser and reboiler will ensure the performance of this column. Set points for the temperature are 39°C for the condenser and 79°C for the reboiler. For optimal column conditions the temperature of the incoming stream <33> is also controlled by a TC coupled to the cooler in this stream (E01). The temperature in the column may not become too high. This will influence the separation and increase risks. There is a maximum temperature set at 100°C at which the column will shut down. The main problem is that the column will fall dry at high temperatures. If the top trays fall dry, the condenser duty needs to be increased, and in this way the column receives extra cooling. The pressure in the column is 1 bar. Under normal conditions this pressure will not vary much. There is no PC placed on this column, but there is a pressure relief valve that will open at 3 bar. The contents of the column will then be vented to the flare to avoid safety risks. The second distillation column (C02) will separate the water from the ethanol to a purity of 86 w% ethanol. Stream <42>, entering this column, is not controlled. The temperature of this stream will not vary much, as it leaves (C02) at approximately the boiling point of ethanol. Therefore the temperature of this stream will not be controlled. (C02) will be controlled in the same way as (C01). The set points for the reboiler and condenser are 99° and 78°C respectively. The temperature at which the column will shut down is 120°C. In the membrane (S01) water is removed from the ethanol to a purity of 99.2%. The performance of the membrane is based on the pressure on the permeate side of the membrane. Pressure on the retentate side should not be too high, to prevent rupture of the membrane. A PC coupled to the outgoing stream is placed on both sides of the membrane. To ensure the purity of ethanol entering (R01) a quality control on the ethanol leaving the ethanol recycles is necessary. The QC is placed in stream <19>. The QC is coupled to <84>, which can lead (part of) the ethanol stream back to the purification. By diminishing the recycle stream <20>, the fresh ethanol feed <79> increases, and the water content of the ethanol stream entering the reactor can be maintained at a sufficiently low level. The QC can consist of an IR-spectrometer. 6.3.3 Glycerol separation (V15) The liquid level of the interface between FAEE and glycerol in the glycerol separator (V15) must be measured, coupled to the departing glycerol stream <58>. The interface may not come to close to the exits of the separator. A LC is placed in the decanter. Controlling the glycerol outlet stream <58> can force the interface to stay at the desired set point.
Biodiesel Production & Prion Destruction Conceptual Process Design
- page 42 -
6.3.4 Biodiesel purification (M02, V16 and D01) The second washing step in the process ((M02) and (V16)) is approximately the same as the first ((M01) and (V08)) as described in 6.1.1. Therefore the control over this washing step is the same. A LC in (V16) is coupled to the bottom stream <58>. In the dryer (D01) the last impurities are removed. The dryer is sensitive to variations in the incoming mass stream <70>. A FC is placed on this stream. The concentrations and the quality of the biodiesel leaving the process with <75> should be measured either online or by taking samples, to be sure the biodiesel has the desired purity and quality. The quality of the biodiesel will mainly be measured by taking samples, which will be analysed in a laboratory, because this is necessary for getting certificates for the final product. Samples can be taken from pipes in the process or from biodiesel stored in storage tanks. Different levels (top, middle and bottom) of the storage tanks should be checked, to make sure the quality is homogeneous. If a specification is not fulfilled, a number of actions can be taken. If the concentration of FAEE is too low (<96,5 % m/m), this is mainly due to too high concentrations of other components. The most important contaminants, with their respective maximum concentrations, are: water (200 mg/kg), fat (0,2 % m/m) or FFA (0,2 % m/m). The efficiency of the dryer (D01) will not be controlled online. If the dryer is not working properly this will be detected in the laboratory analysis. If the concentration of water is too high (>200 mg/kg), the dryer should evaporate more water by increasing the temperature, residence time or even by lowering the pressure (this last option is expensive). Any biodiesel containing too much water has to be fed back to the dryer to be dried a second time. It may be necessary to change the settings of the dryer manually to be able to handle the larger stream. As described before, the other separations for purification of biodiesel are controlled (V15), (M02) and (V16). If the biodiesel still contains too many impurities like metals, residues of damaged prions or glycerol the separation was not good enough. The biodiesel has to be fed back to the process. Depending on the impurity to the glycerol separation or water separation. It can be necessary to change the water flow to the washer <80>. It is also possible that there are still too many FFA, mono-, di- or triglycerides. If there is some biodiesel available that is pure enough to mix with the impure biodiesel so that the mixture meets the specifications, this can be done. Otherwise the impure biodiesel can be mixed with the fat feed and fed back to the process. Feeding back biodiesel to the process will influence the capacity of the process. To obtain a certain biodiesel production the apparatus on the plant must be oversized. At the moment little is known about quantities of biodiesel that have to be recycled and to which stream in the plant. So, in this CPD this oversizing is not performed.
Biodiesel Production & Prion Destruction Conceptual Process Design
- page 43 -
6.4 All sections 6.4.1 Heat Exchangers (E02, E10, E11 and E13) The safety and performance of the process is partially dependent on the temperatures of the streams. A TC is placed near all coolers and heaters coupled to the stream of cold water of steam flowing through the other side of the heat exchanger. This method of controlling can also be applied to heat exchangers that exchange heat between two process streams (E02, E10, E11, E13). A disadvantage of this method is that both streams will vary in temperature. However, for three of these exchangers one of the streams leaving these exchangers (<74>, <55> and <73>) flows through another heat exchanger (E03, E11 and E02). These streams can be manipulated to control the temperature of the other streams through the exchangers (<2>, <4> and <60>). The temperature difference in manipulated streams will be controlled in the other heat exchangers. (E11) is not controlled separately. The fat <2> is melted in this stream and heated further on in (E02). (E02) is controlled for a constant temperature and viscosity of the fat. The FAEE stream leaving (E11) flows to two decanters that are not very sensitive to temperature change. It is not necessary to control this stream. 6.4.2 Valves Processes are designed for a certain pressure. Difference in pressures can give unwanted product purities or conversion, but can also pose huge safety risks. The flow of the streams leaving the valves should be controlled with a FC. The mass flow is dependent on the pressure of the stream and should be coupled with the valve settings. If the pressure is too high, the valve should be opened further, to decrease pressure and vice versa. 6.4.3 Pumps As with the valves the pressure of the outgoing flows should be controlled. The pump will work at a certain capacity. The flow leaving the pump can be controlled with a valve. Again this is controlled with a FC on the outgoing flow coupled to the valve. 6.4.4 Buffer vessels (V01-V07, V09-V11 and V14) All buffer vessels in the process are prevented from overflow by a LC coupled to a valve.
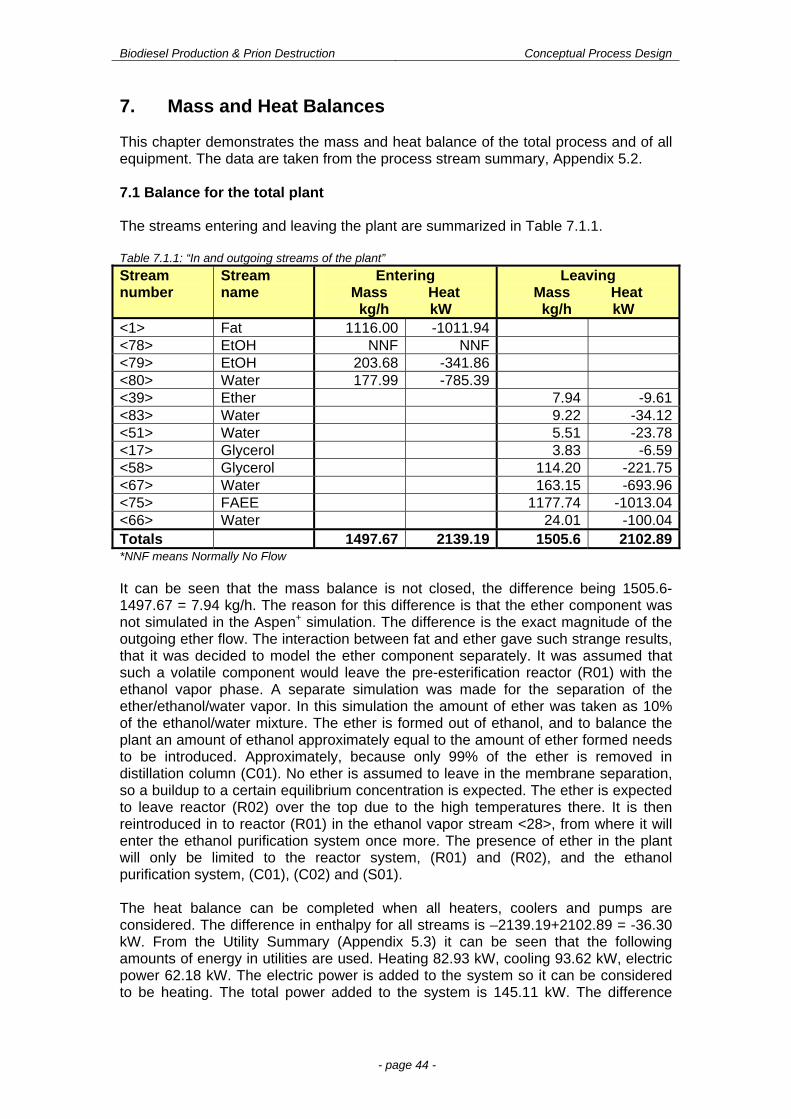
Biodiesel Production & Prion Destruction Conceptual Process Design
- page 44 -
7. Mass and Heat Balances This chapter demonstrates the mass and heat balance of the total process and of all equipment. The data are taken from the process stream summary, Appendix 5.2. 7.1 Balance for the total plant The streams entering and leaving the plant are summarized in Table 7.1.1. Table 7.1.1: “In and outgoing streams of the plant”
Stream number
Stream name
Entering Mass Heat
kg/h kW
Leaving Mass Heat
kg/h kW <1> Fat 1116.00 -1011.94 <78> EtOH NNF NNF <79> EtOH 203.68 -341.86 <80> Water 177.99 -785.39 <39> Ether 7.94 -9.61<83> Water 9.22 -34.12<51> Water 5.51 -23.78<17> Glycerol 3.83 -6.59<58> Glycerol 114.20 -221.75<67> Water 163.15 -693.96<75> FAEE 1177.74 -1013.04<66> Water 24.01 -100.04Totals 1497.67 2139.19 1505.6 2102.89*NNF means Normally No Flow It can be seen that the mass balance is not closed, the difference being 1505.6-1497.67 = 7.94 kg/h. The reason for this difference is that the ether component was not simulated in the Aspen+ simulation. The difference is the exact magnitude of the outgoing ether flow. The interaction between fat and ether gave such strange results, that it was decided to model the ether component separately. It was assumed that such a volatile component would leave the pre-esterification reactor (R01) with the ethanol vapor phase. A separate simulation was made for the separation of the ether/ethanol/water vapor. In this simulation the amount of ether was taken as 10% of the ethanol/water mixture. The ether is formed out of ethanol, and to balance the plant an amount of ethanol approximately equal to the amount of ether formed needs to be introduced. Approximately, because only 99% of the ether is removed in distillation column (C01). No ether is assumed to leave in the membrane separation, so a buildup to a certain equilibrium concentration is expected. The ether is expected to leave reactor (R02) over the top due to the high temperatures there. It is then reintroduced in to reactor (R01) in the ethanol vapor stream <28>, from where it will enter the ethanol purification system once more. The presence of ether in the plant will only be limited to the reactor system, (R01) and (R02), and the ethanol purification system, (C01), (C02) and (S01). The heat balance can be completed when all heaters, coolers and pumps are considered. The difference in enthalpy for all streams is –2139.19+2102.89 = -36.30 kW. From the Utility Summary (Appendix 5.3) it can be seen that the following amounts of energy in utilities are used. Heating 82.93 kW, cooling 93.62 kW, electric power 62.18 kW. The electric power is added to the system so it can be considered to be heating. The total power added to the system is 145.11 kW. The difference
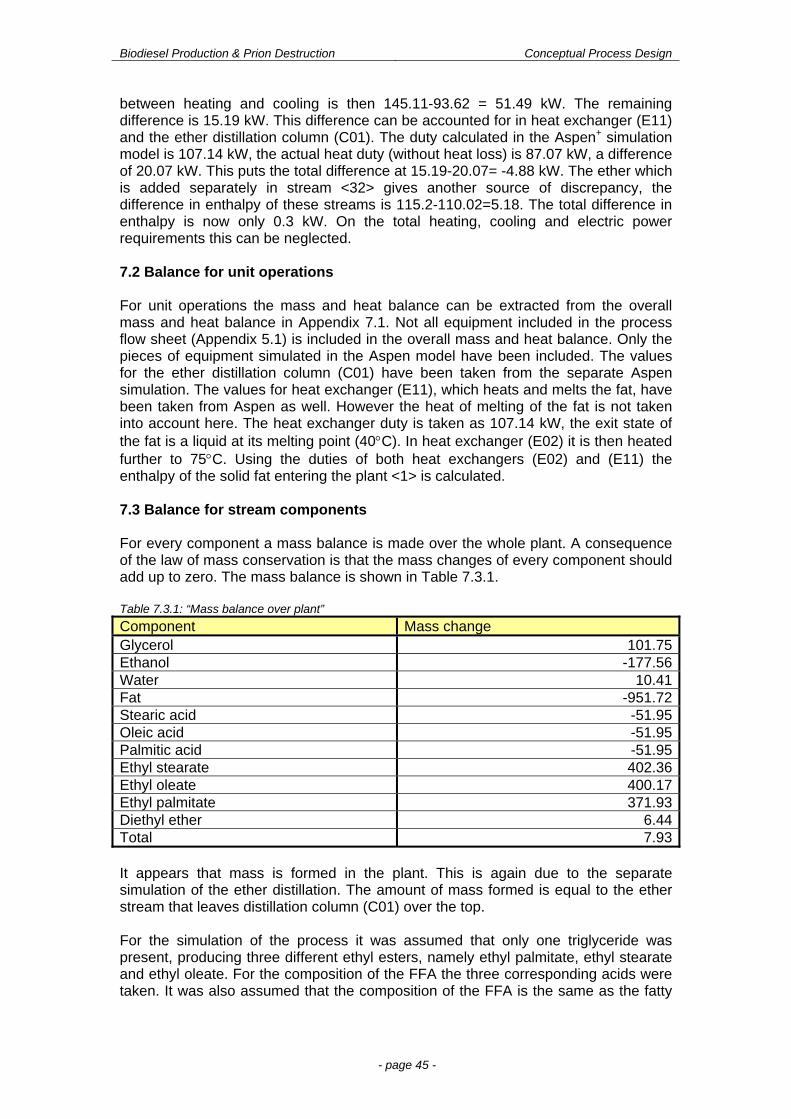
Biodiesel Production & Prion Destruction Conceptual Process Design
- page 45 -
between heating and cooling is then 145.11-93.62 = 51.49 kW. The remaining difference is 15.19 kW. This difference can be accounted for in heat exchanger (E11) and the ether distillation column (C01). The duty calculated in the Aspen+ simulation model is 107.14 kW, the actual heat duty (without heat loss) is 87.07 kW, a difference of 20.07 kW. This puts the total difference at 15.19-20.07= -4.88 kW. The ether which is added separately in stream <32> gives another source of discrepancy, the difference in enthalpy of these streams is 115.2-110.02=5.18. The total difference in enthalpy is now only 0.3 kW. On the total heating, cooling and electric power requirements this can be neglected. 7.2 Balance for unit operations For unit operations the mass and heat balance can be extracted from the overall mass and heat balance in Appendix 7.1. Not all equipment included in the process flow sheet (Appendix 5.1) is included in the overall mass and heat balance. Only the pieces of equipment simulated in the Aspen model have been included. The values for the ether distillation column (C01) have been taken from the separate Aspen simulation. The values for heat exchanger (E11), which heats and melts the fat, have been taken from Aspen as well. However the heat of melting of the fat is not taken into account here. The heat exchanger duty is taken as 107.14 kW, the exit state of the fat is a liquid at its melting point (40C). In heat exchanger (E02) it is then heated further to 75C. Using the duties of both heat exchangers (E02) and (E11) the enthalpy of the solid fat entering the plant <1> is calculated. 7.3 Balance for stream components For every component a mass balance is made over the whole plant. A consequence of the law of mass conservation is that the mass changes of every component should add up to zero. The mass balance is shown in Table 7.3.1. Table 7.3.1: “Mass balance over plant”
Component Mass change Glycerol 101.75Ethanol -177.56Water 10.41Fat -951.72Stearic acid -51.95Oleic acid -51.95Palmitic acid -51.95Ethyl stearate 402.36Ethyl oleate 400.17Ethyl palmitate 371.93Diethyl ether 6.44Total 7.93 It appears that mass is formed in the plant. This is again due to the separate simulation of the ether distillation. The amount of mass formed is equal to the ether stream that leaves distillation column (C01) over the top. For the simulation of the process it was assumed that only one triglyceride was present, producing three different ethyl esters, namely ethyl palmitate, ethyl stearate and ethyl oleate. For the composition of the FFA the three corresponding acids were taken. It was also assumed that the composition of the FFA is the same as the fatty
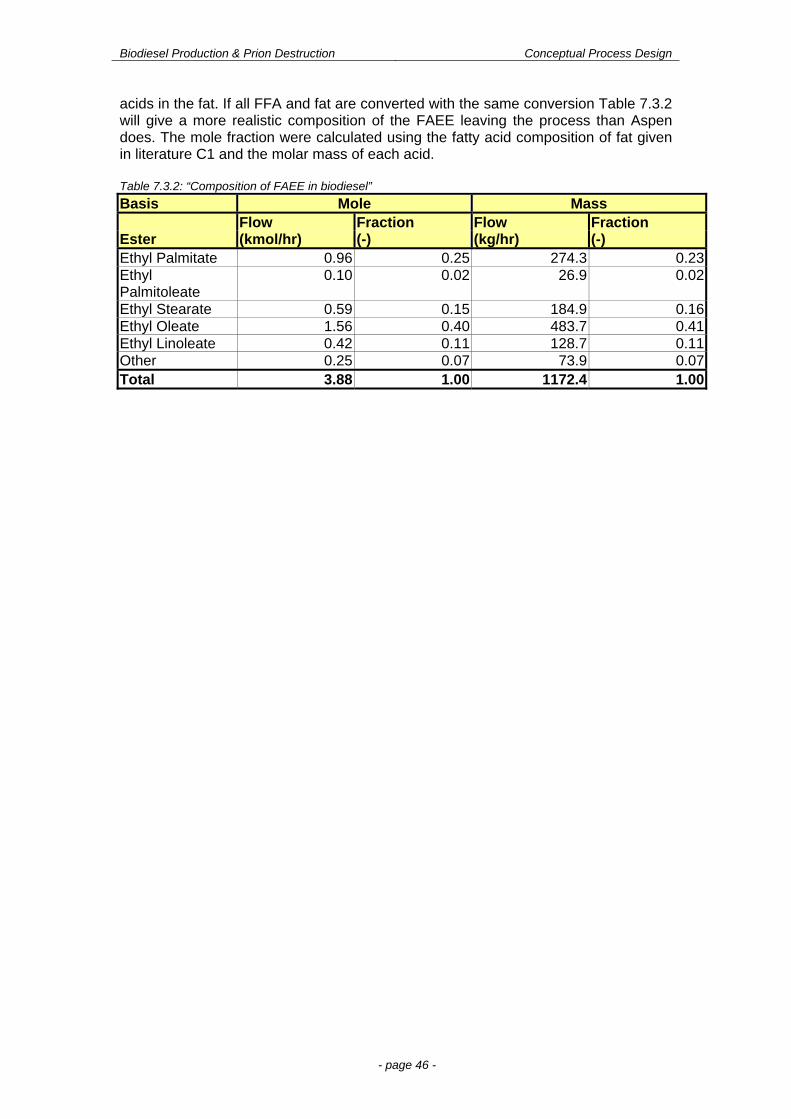
Biodiesel Production & Prion Destruction Conceptual Process Design
- page 46 -
acids in the fat. If all FFA and fat are converted with the same conversion Table 7.3.2 will give a more realistic composition of the FAEE leaving the process than Aspen does. The mole fraction were calculated using the fatty acid composition of fat given in literature C1 and the molar mass of each acid. Table 7.3.2: “Composition of FAEE in biodiesel”
Basis Mole Mass Flow Fraction Flow Fraction
Ester (kmol/hr) (-) (kg/hr) (-) Ethyl Palmitate 0.96 0.25 274.3 0.23Ethyl Palmitoleate
0.10 0.02 26.9 0.02
Ethyl Stearate 0.59 0.15 184.9 0.16Ethyl Oleate 1.56 0.40 483.7 0.41Ethyl Linoleate 0.42 0.11 128.7 0.11Other 0.25 0.07 73.9 0.07Total 3.88 1.00 1172.4 1.00
Biodiesel Production & Prion Destruction Conceptual Process Design
- page 47 -
8. Process and Equipment Design 8.1 General Considerations The flow sheet calculations were performed using Aspen+ 10.2. The final Process Flow Sheet (PFS) is given in Appendix 5.1. For detailed equipment design the spreadsheet programs MathCAD 2001 and MS Excel 2000 were used. The theory for design was predominately gathered from Coulson & Richardson (lit. B23). The models used for all equipment sizing can be found in Appendix 8.1. 8.2 Process simulation 8.2.1 Aspen+ 10.2 For the simulation of the process Aspen+ version 10.2 was used. The fat entering the system consists of a range of triglycerides. For modeling only one fat molecule was assumed to be present, with a stearic-, an oleic-, and a palmitic acid ‘tail’. Only the three corresponding ethyl esters were formed. For the FFA the same assumption was made. Some components present in the process are not available in the Aspen+-database. The fat and the ethyl esters had to be designed as user defined molecules. The UNIFAC and Benson group contribution methods (see lit. B24) were used for this purpose. Additional properties were entered for these components. An overview of this data is given in Appendix 4.5. The estimates by Aspen for the component properties gave good results for the ethyl esters. The estimated properties for fat gave some problems. The estimated Antoine parameters for calculating vapor pressure were not correct and the calculated vapor pressure was too high, so in some places in the process fat was present as vapor. Therefore the parameters of a heavy component from the Aspen database were used, -cholesterol (see Appendix 4.5). The enthalpy of vaporization also needed a specific estimation and was estimated to be approximately three times that of an ethyl ester. The density for the fat was entered as 900 kg/m3, because Aspen did not give a good estimation for this property. In spite of this Aspen still kept using its own estimation of approximately 26 kg/m3. The volume flows from Aspen are not used for sizing calculations when the stream contains significant amounts of fat. The mass streams from Aspen are recalculated to volume flows using the estimate of 900 kg/m3. First the fat was melted in (E02). In Aspen the melting enthalpy was not taken into account. Because of this the calculated value of the heat needed for warming up the fat from 18 °C to 75 °C was much too low. The actual heat duty was calculated in Appendix 8.2. This could not be supplied in exchanger (E02). Heat exchanger (E11) was added to melt the incoming fat. Heat exchanger (E02) was used to heat the fat further till 75 °C. This problem was discovered in the final stage of this CPD project and it was too late to change the complete Aspen simulation. It was decided to make some calculations manually and change some values in the final process stream summary. More information about this problem is given in Chapter 7. The reactors (R01), (R02) used in the process are not standard Aspen reactors. For both reactors the RADFRAC column model, without reboiler and condenser, was chosen. Reactions were added to these columns. Exact kinetic data for these
Biodiesel Production & Prion Destruction Conceptual Process Design
- page 48 -
reactions are not known. Equilibrium reactions for this column did not seem to work. The conversion of oleic acid to its ethyl ester was far too small, probably due to a wrong estimate of the Gibbs energy of formation. It was decided to have 28% conversion of the reactant per stage. In (R01) a total conversion of 98% FFA can be achieved. For this conversion 13 stages are needed. The product specification for biodiesel can be reached with 18 stages in (R02). In the pre-esterification column (R01) also some ether is formed. Ether is a very volatile component, but according to Aspen it will leave the columns with the fat stream, <10>. In reality the ether will evaporate and leave the column with the ethanol stream, <29>. The ether will be separated from water and ethanol in (C01). This column is simulated in a separate Aspen simulation. There are several valves present in the simulation. There will be a heat effect at some of these valves. Aspen does not calculate this heat effect. For liquids this heat effect will be negligible. For gasses there will be a considerable heat effect. In Aspen this is calculated by using a flash vessel model to reduce the pressure with a vapor fraction of one. These flash vessels are of course not sized because they are not really present. 8.2.2 MathCAD 2001 For most design calculations MathCAD was used. The benefit of this program is the direct use of symbols, which makes the calculations more clear and easier to follow. The distillations column (C01), (C02) were sized using Excel. No problems were encountered with these spreadsheet programs. No difficult sets of equations were necessary therefore the convergence to the required solutions was easy. 8.3 Reactor Columns 8.3.1 Column for Pre-esterification (R01) The column for pre-esterification (R01) is in principal a reactive distillation column. Because there is very little known about the kinetics and the precise reaction characteristics it was decided not to design the trays ourselves but to use a tray from literature (lit. P19), which is known to be successful. When more research is done on the kinetics a more suitable tray can be designed. The column is fitted with special trays. The number of trays is 13. The trays are designed according to lit. P19. They are fitted with a downcomer for the fat, which is covered by a mesh filter to prevent carrying over the catalyst to lower trays. A capped ethanol vapor upcomer is present to allow ethanol vapor to agitate the liquid to prevent settling of the catalyst. A circular baffle is present around the upcomer exit to create a flow pattern. The trays are sloped with a slope preferably greater than the angle of repose of the catalyst particles to ensure that any particles that do settle are directed to the upcomer exit where they are agitated again. The angle of repose of the catalyst particles in liquid fat is not known. An estimate of 30 is taken. A pipe with a down turned open end can is fitted below the liquid level to withdraw catalyst slurry from the tray and to introduce fresh catalyst during column operation. The tray spacing is dictated by the backup of liquid in the downcomer. This is equal to the pressure drop over the tray. Per tray the conversion is 28% for the FFA. Literature states that this conversion is possible with the amount of trays and residence time (lit. P19). These values and the streams per tray as given by the ASPEN model determine the size of the reactor. The positive liquid seal offered by the capped
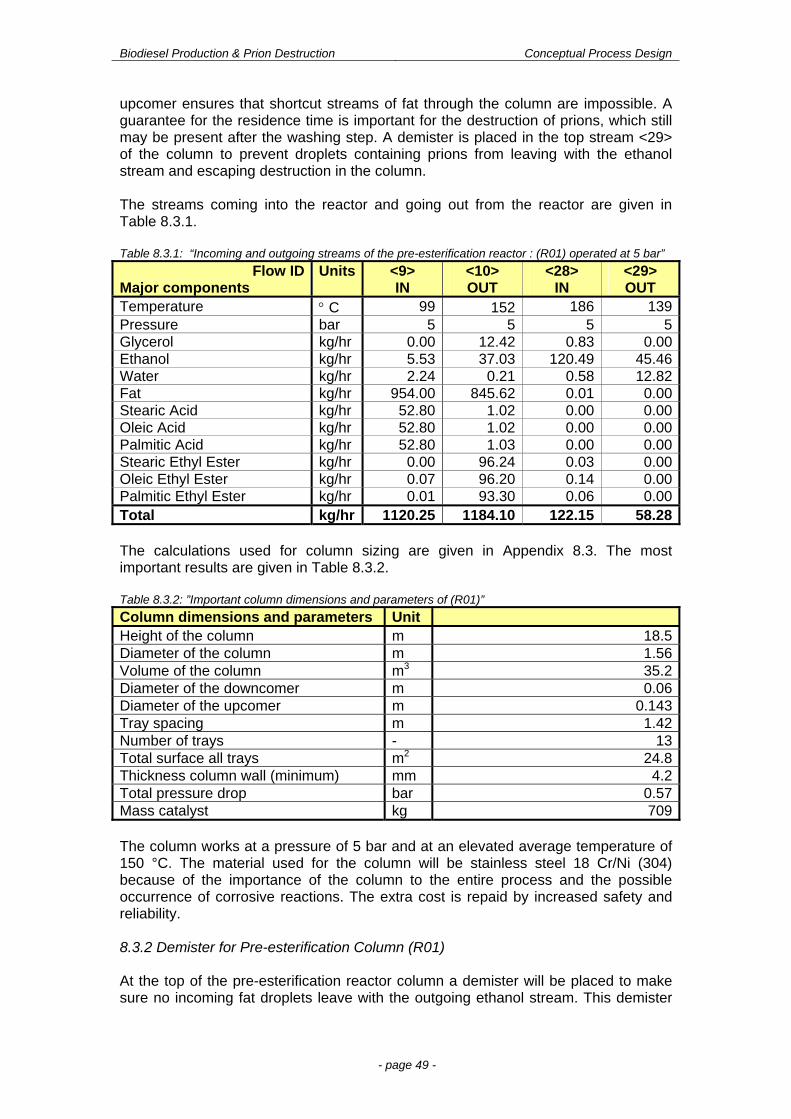
Biodiesel Production & Prion Destruction Conceptual Process Design
- page 49 -
upcomer ensures that shortcut streams of fat through the column are impossible. A guarantee for the residence time is important for the destruction of prions, which still may be present after the washing step. A demister is placed in the top stream <29> of the column to prevent droplets containing prions from leaving with the ethanol stream and escaping destruction in the column. The streams coming into the reactor and going out from the reactor are given in Table 8.3.1. Table 8.3.1: “Incoming and outgoing streams of the pre-esterification reactor : (R01) operated at 5 bar”
Flow ID Major components
Units <9> IN
<10> OUT
<28> IN
<29> OUT
Temperature C 99 152 186 139Pressure bar 5 5 5 5Glycerol kg/hr 0.00 12.42 0.83 0.00Ethanol kg/hr 5.53 37.03 120.49 45.46Water kg/hr 2.24 0.21 0.58 12.82Fat kg/hr 954.00 845.62 0.01 0.00Stearic Acid kg/hr 52.80 1.02 0.00 0.00Oleic Acid kg/hr 52.80 1.02 0.00 0.00Palmitic Acid kg/hr 52.80 1.03 0.00 0.00Stearic Ethyl Ester kg/hr 0.00 96.24 0.03 0.00Oleic Ethyl Ester kg/hr 0.07 96.20 0.14 0.00Palmitic Ethyl Ester kg/hr 0.01 93.30 0.06 0.00Total kg/hr 1120.25 1184.10 122.15 58.28 The calculations used for column sizing are given in Appendix 8.3. The most important results are given in Table 8.3.2. Table 8.3.2: ”Important column dimensions and parameters of (R01)”
Column dimensions and parameters Unit Height of the column m 18.5Diameter of the column m 1.56Volume of the column m3 35.2Diameter of the downcomer m 0.06Diameter of the upcomer m 0.143Tray spacing m 1.42Number of trays - 13Total surface all trays m2 24.8Thickness column wall (minimum) mm 4.2Total pressure drop bar 0.57Mass catalyst kg 709 The column works at a pressure of 5 bar and at an elevated average temperature of 150 °C. The material used for the column will be stainless steel 18 Cr/Ni (304) because of the importance of the column to the entire process and the possible occurrence of corrosive reactions. The extra cost is repaid by increased safety and reliability. 8.3.2 Demister for Pre-esterification Column (R01) At the top of the pre-esterification reactor column a demister will be placed to make sure no incoming fat droplets leave with the outgoing ethanol stream. This demister
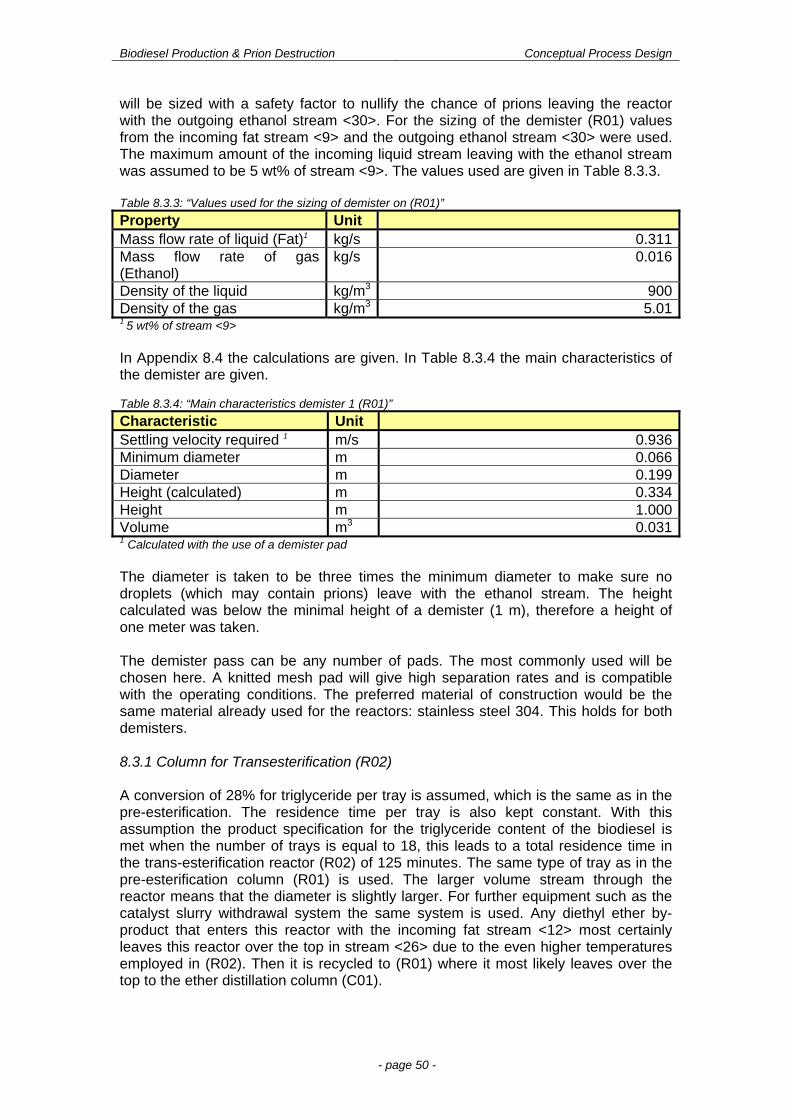
Biodiesel Production & Prion Destruction Conceptual Process Design
- page 50 -
will be sized with a safety factor to nullify the chance of prions leaving the reactor with the outgoing ethanol stream <30>. For the sizing of the demister (R01) values from the incoming fat stream <9> and the outgoing ethanol stream <30> were used. The maximum amount of the incoming liquid stream leaving with the ethanol stream was assumed to be 5 wt% of stream <9>. The values used are given in Table 8.3.3. Table 8.3.3: “Values used for the sizing of demister on (R01)”
Property Unit Mass flow rate of liquid (Fat)1 kg/s 0.311Mass flow rate of gas (Ethanol)
kg/s 0.016
Density of the liquid kg/m3 900Density of the gas kg/m3 5.011 5 wt% of stream <9> In Appendix 8.4 the calculations are given. In Table 8.3.4 the main characteristics of the demister are given. Table 8.3.4: “Main characteristics demister 1 (R01)”
Characteristic Unit Settling velocity required 1 m/s 0.936Minimum diameter m 0.066Diameter m 0.199Height (calculated) m 0.334Height m 1.000Volume m3 0.0311 Calculated with the use of a demister pad The diameter is taken to be three times the minimum diameter to make sure no droplets (which may contain prions) leave with the ethanol stream. The height calculated was below the minimal height of a demister (1 m), therefore a height of one meter was taken. The demister pass can be any number of pads. The most commonly used will be chosen here. A knitted mesh pad will give high separation rates and is compatible with the operating conditions. The preferred material of construction would be the same material already used for the reactors: stainless steel 304. This holds for both demisters. 8.3.1 Column for Transesterification (R02) A conversion of 28% for triglyceride per tray is assumed, which is the same as in the pre-esterification. The residence time per tray is also kept constant. With this assumption the product specification for the triglyceride content of the biodiesel is met when the number of trays is equal to 18, this leads to a total residence time in the trans-esterification reactor (R02) of 125 minutes. The same type of tray as in the pre-esterification column (R01) is used. The larger volume stream through the reactor means that the diameter is slightly larger. For further equipment such as the catalyst slurry withdrawal system the same system is used. Any diethyl ether by-product that enters this reactor with the incoming fat stream <12> most certainly leaves this reactor over the top in stream <26> due to the even higher temperatures employed in (R02). Then it is recycled to (R01) where it most likely leaves over the top to the ether distillation column (C01).
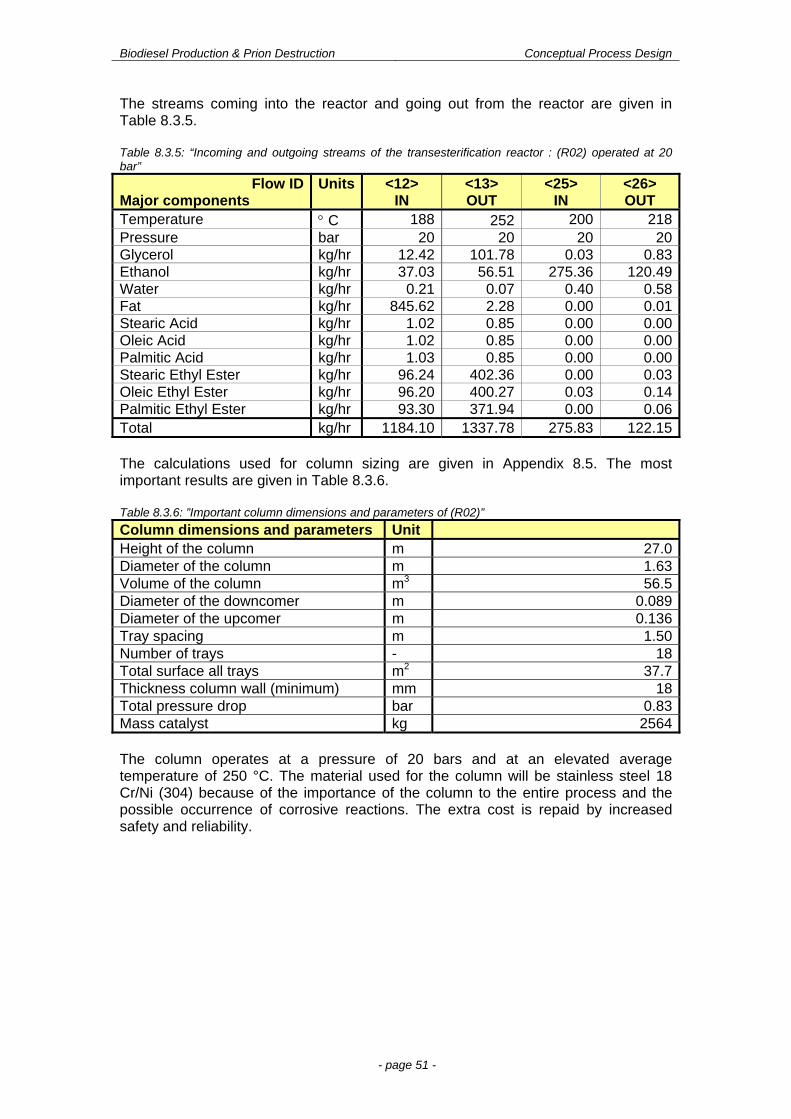
Biodiesel Production & Prion Destruction Conceptual Process Design
- page 51 -
The streams coming into the reactor and going out from the reactor are given in Table 8.3.5. Table 8.3.5: “Incoming and outgoing streams of the transesterification reactor : (R02) operated at 20 bar”
Flow ID Major components
Units <12> IN
<13> OUT
<25> IN
<26> OUT
Temperature C 188 252 200 218Pressure bar 20 20 20 20Glycerol kg/hr 12.42 101.78 0.03 0.83Ethanol kg/hr 37.03 56.51 275.36 120.49Water kg/hr 0.21 0.07 0.40 0.58Fat kg/hr 845.62 2.28 0.00 0.01Stearic Acid kg/hr 1.02 0.85 0.00 0.00Oleic Acid kg/hr 1.02 0.85 0.00 0.00Palmitic Acid kg/hr 1.03 0.85 0.00 0.00Stearic Ethyl Ester kg/hr 96.24 402.36 0.00 0.03Oleic Ethyl Ester kg/hr 96.20 400.27 0.03 0.14Palmitic Ethyl Ester kg/hr 93.30 371.94 0.00 0.06Total kg/hr 1184.10 1337.78 275.83 122.15 The calculations used for column sizing are given in Appendix 8.5. The most important results are given in Table 8.3.6. Table 8.3.6: ”Important column dimensions and parameters of (R02)”
Column dimensions and parameters Unit Height of the column m 27.0Diameter of the column m 1.63Volume of the column m3 56.5Diameter of the downcomer m 0.089Diameter of the upcomer m 0.136Tray spacing m 1.50Number of trays - 18Total surface all trays m2 37.7Thickness column wall (minimum) mm 18Total pressure drop bar 0.83Mass catalyst kg 2564 The column operates at a pressure of 20 bars and at an elevated average temperature of 250 °C. The material used for the column will be stainless steel 18 Cr/Ni (304) because of the importance of the column to the entire process and the possible occurrence of corrosive reactions. The extra cost is repaid by increased safety and reliability.
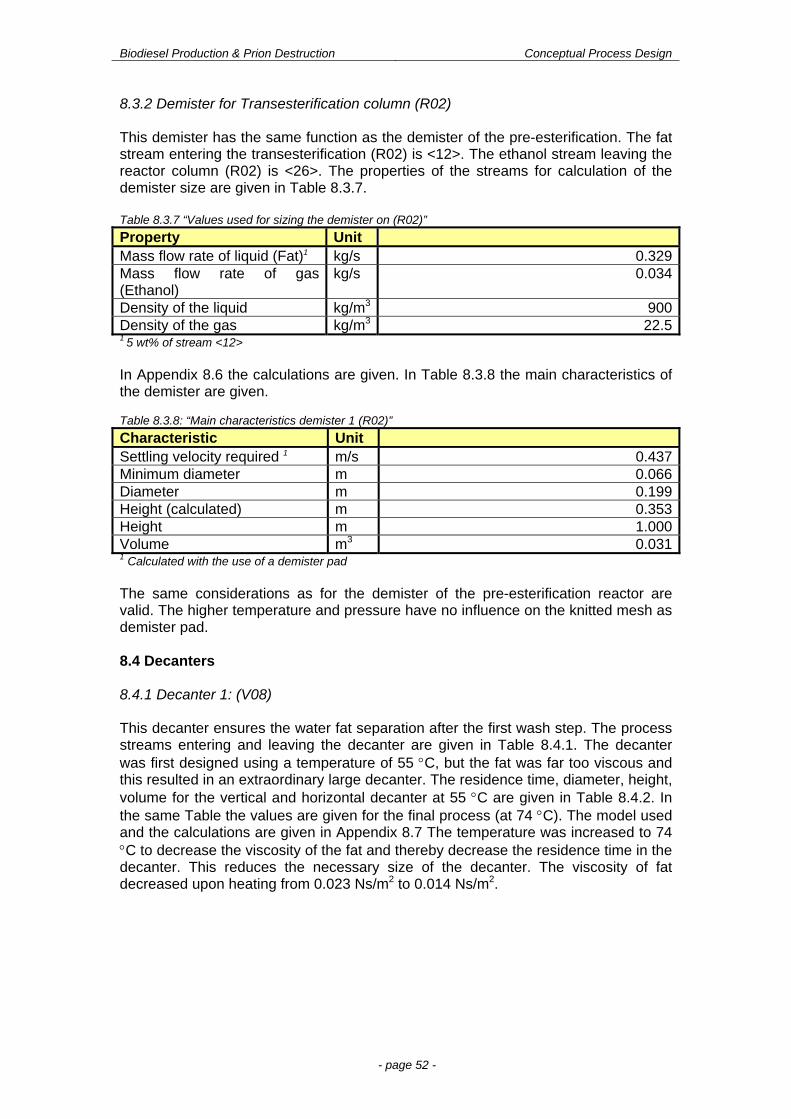
Biodiesel Production & Prion Destruction Conceptual Process Design
- page 52 -
8.3.2 Demister for Transesterification column (R02) This demister has the same function as the demister of the pre-esterification. The fat stream entering the transesterification (R02) is <12>. The ethanol stream leaving the reactor column (R02) is <26>. The properties of the streams for calculation of the demister size are given in Table 8.3.7. Table 8.3.7 “Values used for sizing the demister on (R02)”
Property Unit Mass flow rate of liquid (Fat)1 kg/s 0.329Mass flow rate of gas (Ethanol)
kg/s 0.034
Density of the liquid kg/m3 900Density of the gas kg/m3 22.51 5 wt% of stream <12> In Appendix 8.6 the calculations are given. In Table 8.3.8 the main characteristics of the demister are given. Table 8.3.8: “Main characteristics demister 1 (R02)”
Characteristic Unit Settling velocity required 1 m/s 0.437Minimum diameter m 0.066Diameter m 0.199Height (calculated) m 0.353Height m 1.000Volume m3 0.0311 Calculated with the use of a demister pad The same considerations as for the demister of the pre-esterification reactor are valid. The higher temperature and pressure have no influence on the knitted mesh as demister pad. 8.4 Decanters 8.4.1 Decanter 1: (V08) This decanter ensures the water fat separation after the first wash step. The process streams entering and leaving the decanter are given in Table 8.4.1. The decanter was first designed using a temperature of 55 C, but the fat was far too viscous and this resulted in an extraordinary large decanter. The residence time, diameter, height, volume for the vertical and horizontal decanter at 55 C are given in Table 8.4.2. In the same Table the values are given for the final process (at 74 C). The model used and the calculations are given in Appendix 8.7 The temperature was increased to 74 C to decrease the viscosity of the fat and thereby decrease the residence time in the decanter. This reduces the necessary size of the decanter. The viscosity of fat decreased upon heating from 0.023 Ns/m2 to 0.014 Ns/m2.
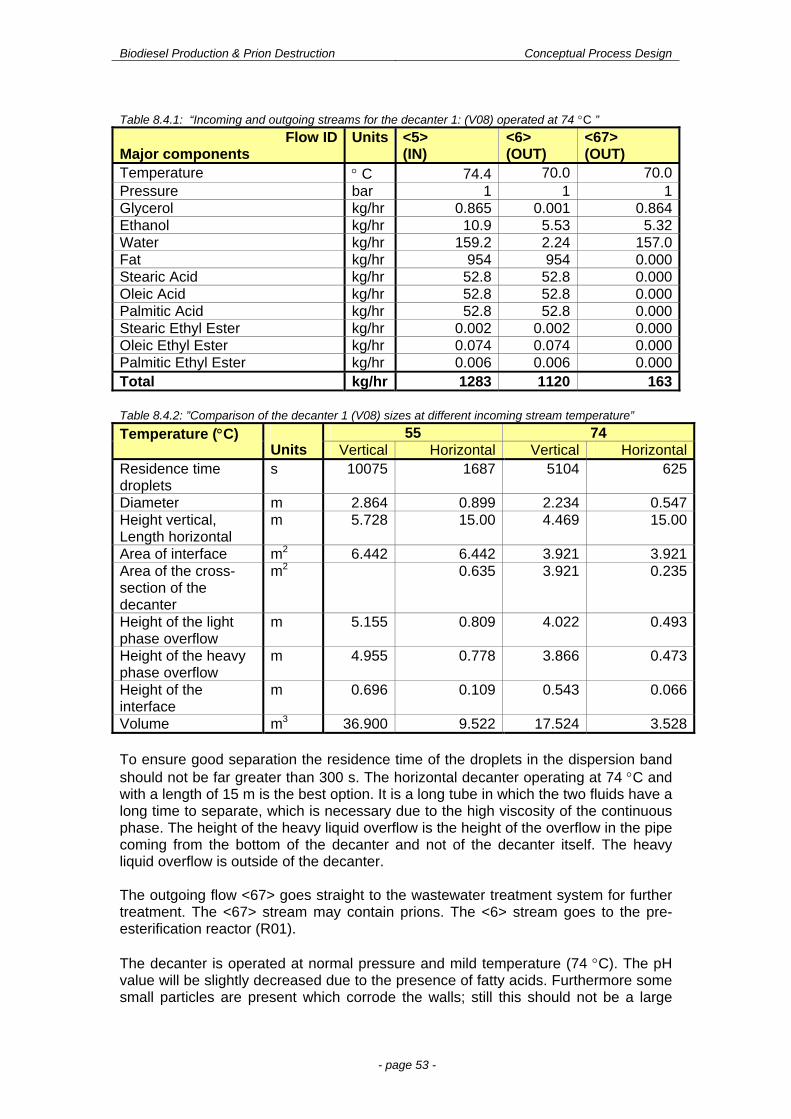
Biodiesel Production & Prion Destruction Conceptual Process Design
- page 53 -
Table 8.4.1: “Incoming and outgoing streams for the decanter 1: (V08) operated at 74 C ”
Flow IDMajor components
Units <5> (IN)
<6> (OUT)
<67> (OUT)
Temperature C 74.4 70.0 70.0Pressure bar 1 1 1Glycerol kg/hr 0.865 0.001 0.864Ethanol kg/hr 10.9 5.53 5.32Water kg/hr 159.2 2.24 157.0Fat kg/hr 954 954 0.000Stearic Acid kg/hr 52.8 52.8 0.000Oleic Acid kg/hr 52.8 52.8 0.000Palmitic Acid kg/hr 52.8 52.8 0.000Stearic Ethyl Ester kg/hr 0.002 0.002 0.000Oleic Ethyl Ester kg/hr 0.074 0.074 0.000Palmitic Ethyl Ester kg/hr 0.006 0.006 0.000Total kg/hr 1283 1120 163 Table 8.4.2: ”Comparison of the decanter 1 (V08) sizes at different incoming stream temperature”
Temperature (C) Units
55 74 Vertical Horizontal Vertical Horizontal
Residence time droplets
s 10075 1687 5104 625
Diameter m 2.864 0.899 2.234 0.547Height vertical, Length horizontal
m 5.728 15.00 4.469 15.00
Area of interface m2 6.442 6.442 3.921 3.921Area of the cross-section of the decanter
m2 0.635 3.921 0.235
Height of the light phase overflow
m 5.155 0.809 4.022 0.493
Height of the heavy phase overflow
m 4.955 0.778 3.866 0.473
Height of the interface
m 0.696 0.109 0.543 0.066
Volume m3 36.900 9.522 17.524 3.528
To ensure good separation the residence time of the droplets in the dispersion band should not be far greater than 300 s. The horizontal decanter operating at 74 C and with a length of 15 m is the best option. It is a long tube in which the two fluids have a long time to separate, which is necessary due to the high viscosity of the continuous phase. The height of the heavy liquid overflow is the height of the overflow in the pipe coming from the bottom of the decanter and not of the decanter itself. The heavy liquid overflow is outside of the decanter. The outgoing flow <67> goes straight to the wastewater treatment system for further treatment. The <67> stream may contain prions. The <6> stream goes to the pre-esterification reactor (R01). The decanter is operated at normal pressure and mild temperature (74 C). The pH value will be slightly decreased due to the presence of fatty acids. Furthermore some small particles are present which corrode the walls; still this should not be a large
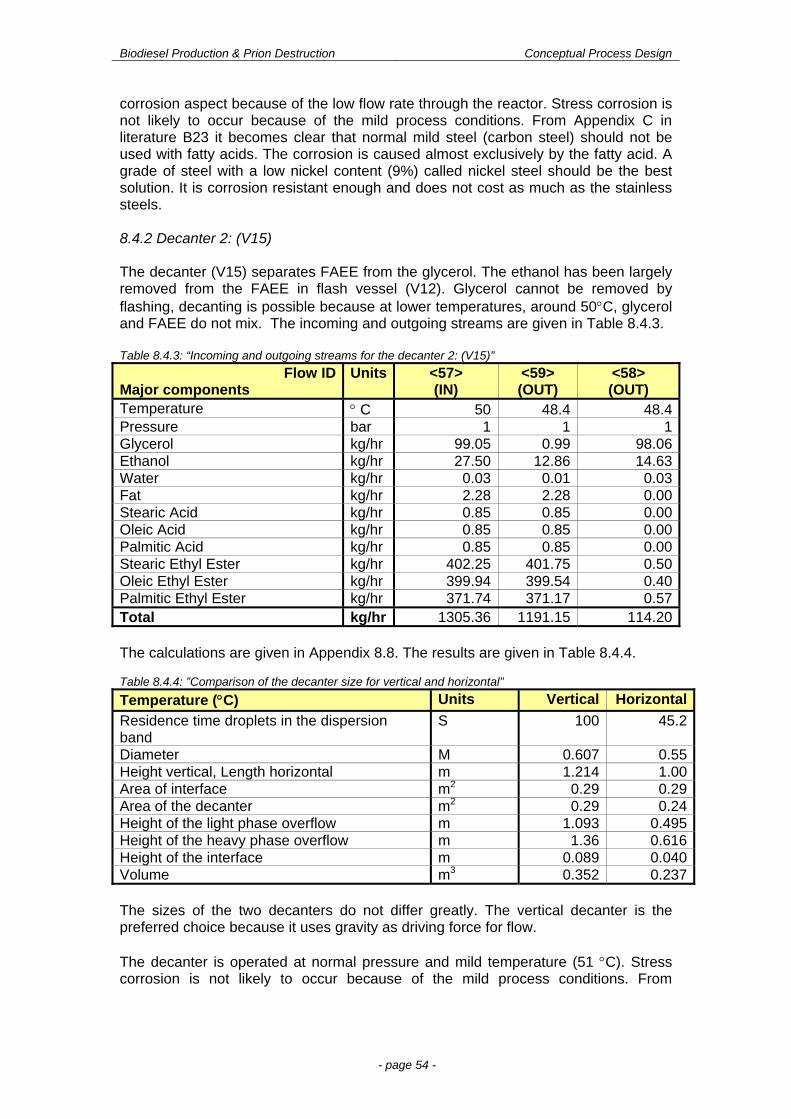
Biodiesel Production & Prion Destruction Conceptual Process Design
- page 54 -
corrosion aspect because of the low flow rate through the reactor. Stress corrosion is not likely to occur because of the mild process conditions. From Appendix C in literature B23 it becomes clear that normal mild steel (carbon steel) should not be used with fatty acids. The corrosion is caused almost exclusively by the fatty acid. A grade of steel with a low nickel content (9%) called nickel steel should be the best solution. It is corrosion resistant enough and does not cost as much as the stainless steels. 8.4.2 Decanter 2: (V15) The decanter (V15) separates FAEE from the glycerol. The ethanol has been largely removed from the FAEE in flash vessel (V12). Glycerol cannot be removed by flashing, decanting is possible because at lower temperatures, around 50C, glycerol and FAEE do not mix. The incoming and outgoing streams are given in Table 8.4.3. Table 8.4.3: “Incoming and outgoing streams for the decanter 2: (V15)”
Flow IDMajor components
Units <57> (IN)
<59> (OUT)
<58> (OUT)
Temperature C 50 48.4 48.4Pressure bar 1 1 1Glycerol kg/hr 99.05 0.99 98.06Ethanol kg/hr 27.50 12.86 14.63Water kg/hr 0.03 0.01 0.03Fat kg/hr 2.28 2.28 0.00Stearic Acid kg/hr 0.85 0.85 0.00Oleic Acid kg/hr 0.85 0.85 0.00Palmitic Acid kg/hr 0.85 0.85 0.00Stearic Ethyl Ester kg/hr 402.25 401.75 0.50Oleic Ethyl Ester kg/hr 399.94 399.54 0.40Palmitic Ethyl Ester kg/hr 371.74 371.17 0.57Total kg/hr 1305.36 1191.15 114.20 The calculations are given in Appendix 8.8. The results are given in Table 8.4.4. Table 8.4.4: ”Comparison of the decanter size for vertical and horizontal”
Temperature (C) Units Vertical Horizontal
Residence time droplets in the dispersion band
S 100 45.2
Diameter M 0.607 0.55Height vertical, Length horizontal m 1.214 1.00Area of interface m2 0.29 0.29Area of the decanter m2 0.29 0.24Height of the light phase overflow m 1.093 0.495Height of the heavy phase overflow m 1.36 0.616Height of the interface m 0.089 0.040Volume m3 0.352 0.237
The sizes of the two decanters do not differ greatly. The vertical decanter is the preferred choice because it uses gravity as driving force for flow. The decanter is operated at normal pressure and mild temperature (51 C). Stress corrosion is not likely to occur because of the mild process conditions. From
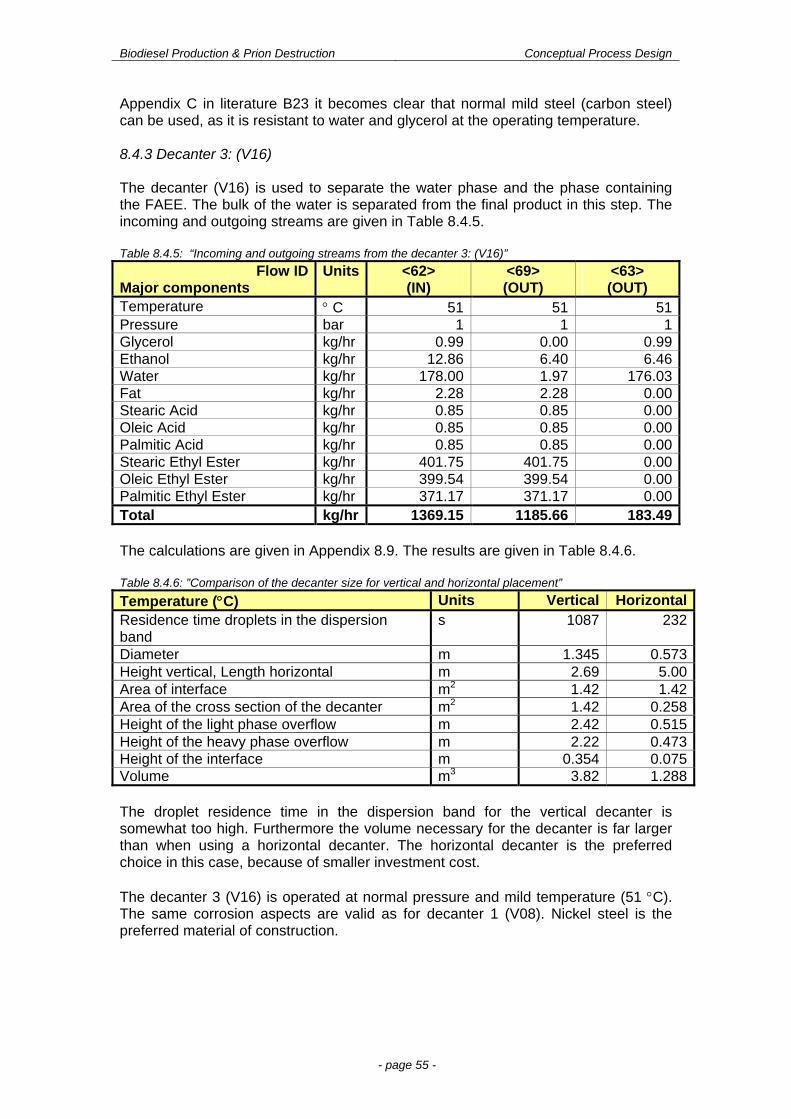
Biodiesel Production & Prion Destruction Conceptual Process Design
- page 55 -
Appendix C in literature B23 it becomes clear that normal mild steel (carbon steel) can be used, as it is resistant to water and glycerol at the operating temperature. 8.4.3 Decanter 3: (V16) The decanter (V16) is used to separate the water phase and the phase containing the FAEE. The bulk of the water is separated from the final product in this step. The incoming and outgoing streams are given in Table 8.4.5. Table 8.4.5: “Incoming and outgoing streams from the decanter 3: (V16)”
Flow ID Major components
Units <62> (IN)
<69> (OUT)
<63> (OUT)
Temperature C 51 51 51Pressure bar 1 1 1Glycerol kg/hr 0.99 0.00 0.99Ethanol kg/hr 12.86 6.40 6.46Water kg/hr 178.00 1.97 176.03Fat kg/hr 2.28 2.28 0.00Stearic Acid kg/hr 0.85 0.85 0.00Oleic Acid kg/hr 0.85 0.85 0.00Palmitic Acid kg/hr 0.85 0.85 0.00Stearic Ethyl Ester kg/hr 401.75 401.75 0.00Oleic Ethyl Ester kg/hr 399.54 399.54 0.00Palmitic Ethyl Ester kg/hr 371.17 371.17 0.00Total kg/hr 1369.15 1185.66 183.49 The calculations are given in Appendix 8.9. The results are given in Table 8.4.6. Table 8.4.6: ”Comparison of the decanter size for vertical and horizontal placement”
Temperature (C) Units Vertical HorizontalResidence time droplets in the dispersion band
s 1087 232
Diameter m 1.345 0.573Height vertical, Length horizontal m 2.69 5.00Area of interface m2 1.42 1.42Area of the cross section of the decanter m2 1.42 0.258Height of the light phase overflow m 2.42 0.515Height of the heavy phase overflow m 2.22 0.473Height of the interface m 0.354 0.075Volume m3 3.82 1.288
The droplet residence time in the dispersion band for the vertical decanter is somewhat too high. Furthermore the volume necessary for the decanter is far larger than when using a horizontal decanter. The horizontal decanter is the preferred choice in this case, because of smaller investment cost. The decanter 3 (V16) is operated at normal pressure and mild temperature (51 C). The same corrosion aspects are valid as for decanter 1 (V08). Nickel steel is the preferred material of construction.
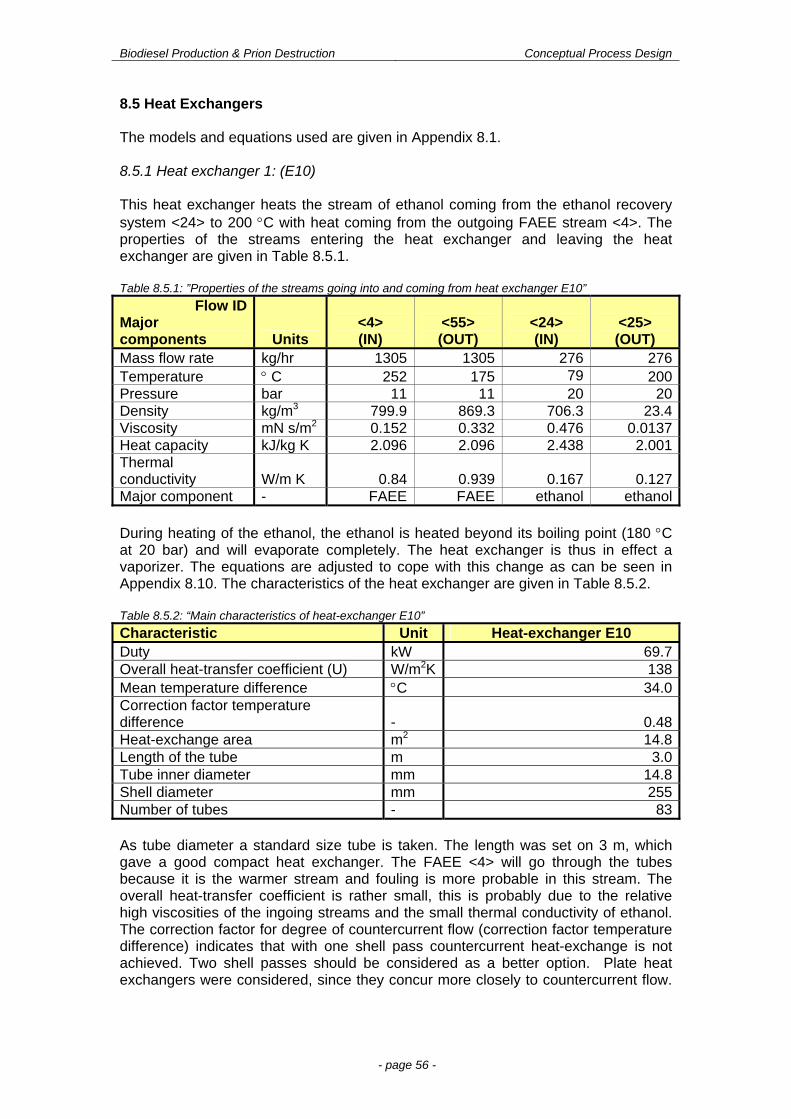
Biodiesel Production & Prion Destruction Conceptual Process Design
- page 56 -
8.5 Heat Exchangers The models and equations used are given in Appendix 8.1. 8.5.1 Heat exchanger 1: (E10) This heat exchanger heats the stream of ethanol coming from the ethanol recovery system <24> to 200 C with heat coming from the outgoing FAEE stream <4>. The properties of the streams entering the heat exchanger and leaving the heat exchanger are given in Table 8.5.1. Table 8.5.1: ”Properties of the streams going into and coming from heat exchanger E10”
Flow ID Major components Units
<4> (IN)
<55> (OUT)
<24> (IN)
<25> (OUT)
Mass flow rate kg/hr 1305 1305 276 276Temperature C 252 175 79 200Pressure bar 11 11 20 20Density kg/m3 799.9 869.3 706.3 23.4Viscosity mN s/m2 0.152 0.332 0.476 0.0137Heat capacity kJ/kg K 2.096 2.096 2.438 2.001Thermal conductivity W/m K 0.84 0.939 0.167 0.127Major component - FAEE FAEE ethanol ethanol During heating of the ethanol, the ethanol is heated beyond its boiling point (180 C at 20 bar) and will evaporate completely. The heat exchanger is thus in effect a vaporizer. The equations are adjusted to cope with this change as can be seen in Appendix 8.10. The characteristics of the heat exchanger are given in Table 8.5.2. Table 8.5.2: “Main characteristics of heat-exchanger E10”
Characteristic Unit Heat-exchanger E10 Duty kW 69.7Overall heat-transfer coefficient (U) W/m2K 138Mean temperature difference C 34.0Correction factor temperature difference - 0.48Heat-exchange area m2 14.8Length of the tube m 3.0Tube inner diameter mm 14.8Shell diameter mm 255Number of tubes - 83 As tube diameter a standard size tube is taken. The length was set on 3 m, which gave a good compact heat exchanger. The FAEE <4> will go through the tubes because it is the warmer stream and fouling is more probable in this stream. The overall heat-transfer coefficient is rather small, this is probably due to the relative high viscosities of the ingoing streams and the small thermal conductivity of ethanol. The correction factor for degree of countercurrent flow (correction factor temperature difference) indicates that with one shell pass countercurrent heat-exchange is not achieved. Two shell passes should be considered as a better option. Plate heat exchangers were considered, since they concur more closely to countercurrent flow.
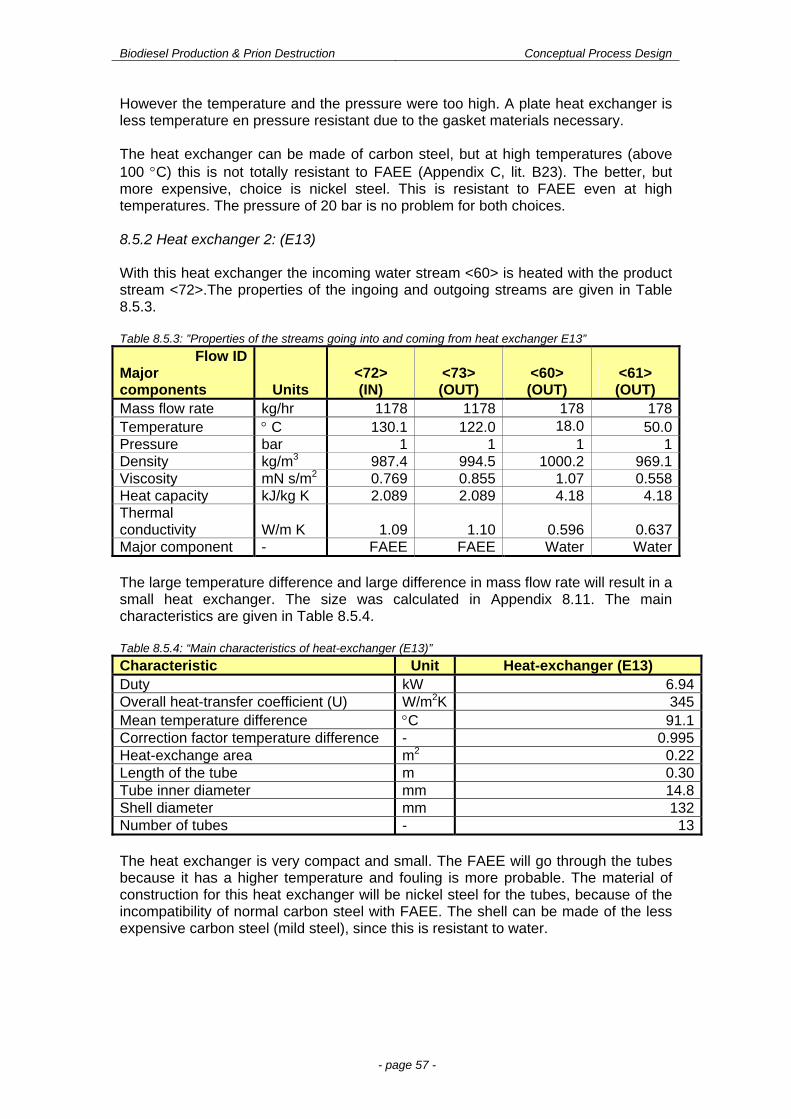
Biodiesel Production & Prion Destruction Conceptual Process Design
- page 57 -
However the temperature and the pressure were too high. A plate heat exchanger is less temperature en pressure resistant due to the gasket materials necessary. The heat exchanger can be made of carbon steel, but at high temperatures (above 100 C) this is not totally resistant to FAEE (Appendix C, lit. B23). The better, but more expensive, choice is nickel steel. This is resistant to FAEE even at high temperatures. The pressure of 20 bar is no problem for both choices. 8.5.2 Heat exchanger 2: (E13) With this heat exchanger the incoming water stream <60> is heated with the product stream <72>.The properties of the ingoing and outgoing streams are given in Table 8.5.3. Table 8.5.3: ”Properties of the streams going into and coming from heat exchanger E13”
Flow ID Major components Units
<72> (IN)
<73> (OUT)
<60> (OUT)
<61> (OUT)
Mass flow rate kg/hr 1178 1178 178 178Temperature C 130.1 122.0 18.0 50.0Pressure bar 1 1 1 1Density kg/m3 987.4 994.5 1000.2 969.1Viscosity mN s/m2 0.769 0.855 1.07 0.558Heat capacity kJ/kg K 2.089 2.089 4.18 4.18Thermal conductivity W/m K 1.09 1.10 0.596 0.637Major component - FAEE FAEE Water Water The large temperature difference and large difference in mass flow rate will result in a small heat exchanger. The size was calculated in Appendix 8.11. The main characteristics are given in Table 8.5.4. Table 8.5.4: “Main characteristics of heat-exchanger (E13)”
Characteristic Unit Heat-exchanger (E13) Duty kW 6.94Overall heat-transfer coefficient (U) W/m2K 345Mean temperature difference C 91.1Correction factor temperature difference - 0.995Heat-exchange area m2 0.22Length of the tube m 0.30Tube inner diameter mm 14.8Shell diameter mm 132Number of tubes - 13 The heat exchanger is very compact and small. The FAEE will go through the tubes because it has a higher temperature and fouling is more probable. The material of construction for this heat exchanger will be nickel steel for the tubes, because of the incompatibility of normal carbon steel with FAEE. The shell can be made of the less expensive carbon steel (mild steel), since this is resistant to water.
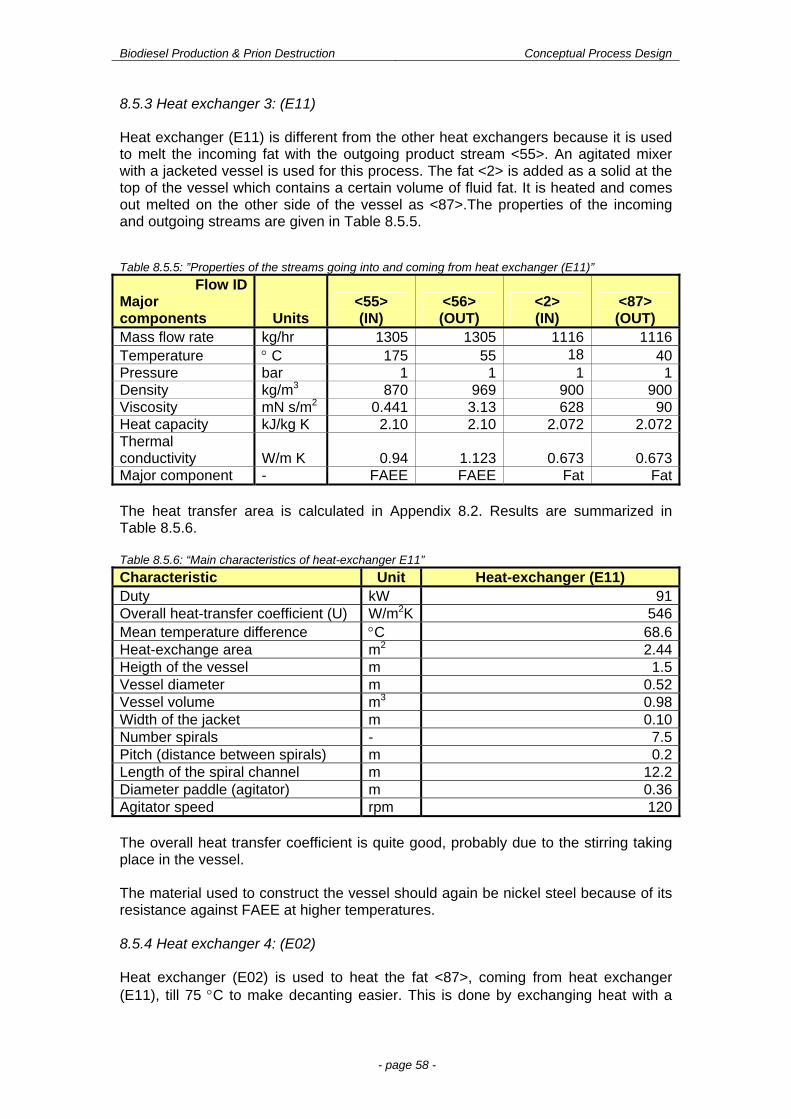
Biodiesel Production & Prion Destruction Conceptual Process Design
- page 58 -
8.5.3 Heat exchanger 3: (E11) Heat exchanger (E11) is different from the other heat exchangers because it is used to melt the incoming fat with the outgoing product stream <55>. An agitated mixer with a jacketed vessel is used for this process. The fat <2> is added as a solid at the top of the vessel which contains a certain volume of fluid fat. It is heated and comes out melted on the other side of the vessel as <87>.The properties of the incoming and outgoing streams are given in Table 8.5.5. Table 8.5.5: ”Properties of the streams going into and coming from heat exchanger (E11)”
Flow ID Major components Units
<55> (IN)
<56> (OUT)
<2> (IN)
<87> (OUT)
Mass flow rate kg/hr 1305 1305 1116 1116Temperature C 175 55 18 40Pressure bar 1 1 1 1Density kg/m3 870 969 900 900Viscosity mN s/m2 0.441 3.13 628 90Heat capacity kJ/kg K 2.10 2.10 2.072 2.072Thermal conductivity W/m K 0.94 1.123 0.673 0.673Major component - FAEE FAEE Fat Fat The heat transfer area is calculated in Appendix 8.2. Results are summarized in Table 8.5.6. Table 8.5.6: “Main characteristics of heat-exchanger E11”
Characteristic Unit Heat-exchanger (E11) Duty kW 91Overall heat-transfer coefficient (U) W/m2K 546Mean temperature difference C 68.6Heat-exchange area m2 2.44Heigth of the vessel m 1.5Vessel diameter m 0.52Vessel volume m3 0.98Width of the jacket m 0.10Number spirals - 7.5Pitch (distance between spirals) m 0.2Length of the spiral channel m 12.2Diameter paddle (agitator) m 0.36Agitator speed rpm 120 The overall heat transfer coefficient is quite good, probably due to the stirring taking place in the vessel. The material used to construct the vessel should again be nickel steel because of its resistance against FAEE at higher temperatures. 8.5.4 Heat exchanger 4: (E02) Heat exchanger (E02) is used to heat the fat <87>, coming from heat exchanger (E11), till 75 C to make decanting easier. This is done by exchanging heat with a
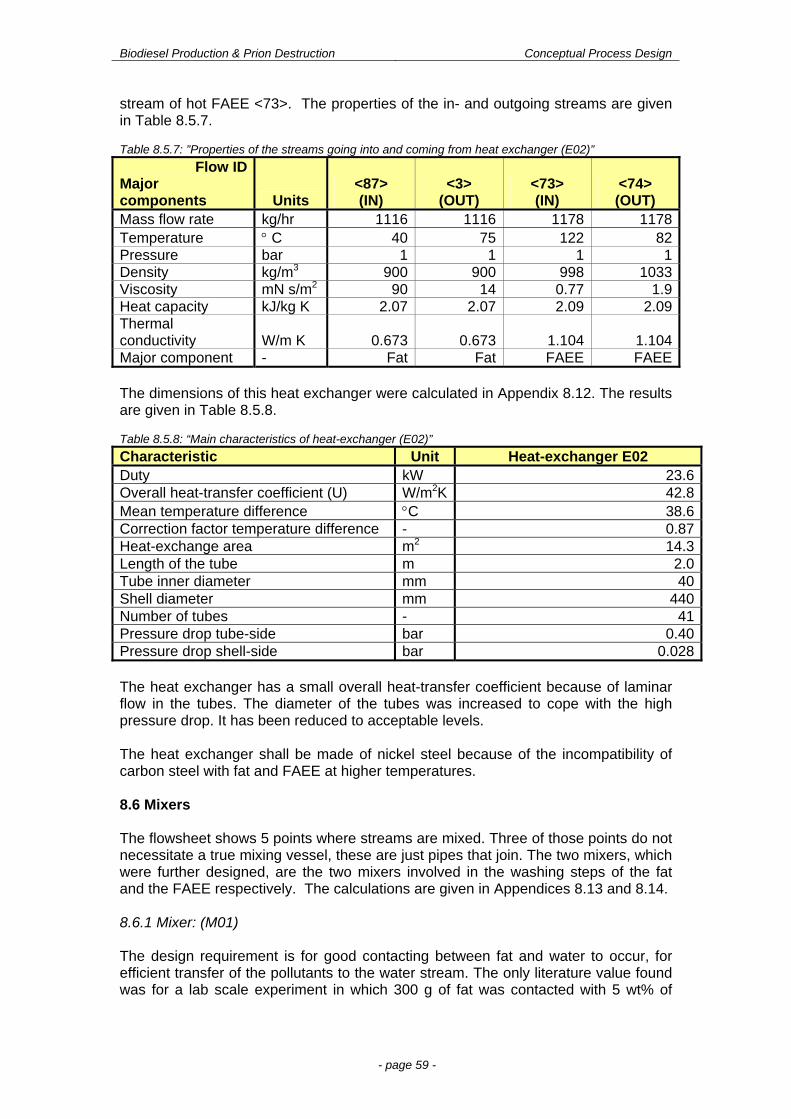
Biodiesel Production & Prion Destruction Conceptual Process Design
- page 59 -
stream of hot FAEE <73>. The properties of the in- and outgoing streams are given in Table 8.5.7. Table 8.5.7: ”Properties of the streams going into and coming from heat exchanger (E02)”
Flow ID Major components Units
<87> (IN)
<3> (OUT)
<73> (IN)
<74> (OUT)
Mass flow rate kg/hr 1116 1116 1178 1178Temperature C 40 75 122 82Pressure bar 1 1 1 1Density kg/m3 900 900 998 1033Viscosity mN s/m2 90 14 0.77 1.9Heat capacity kJ/kg K 2.07 2.07 2.09 2.09Thermal conductivity W/m K 0.673 0.673 1.104 1.104Major component - Fat Fat FAEE FAEE The dimensions of this heat exchanger were calculated in Appendix 8.12. The results are given in Table 8.5.8. Table 8.5.8: “Main characteristics of heat-exchanger (E02)”
Characteristic Unit Heat-exchanger E02 Duty kW 23.6Overall heat-transfer coefficient (U) W/m2K 42.8Mean temperature difference C 38.6Correction factor temperature difference - 0.87Heat-exchange area m2 14.3Length of the tube m 2.0Tube inner diameter mm 40Shell diameter mm 440Number of tubes - 41Pressure drop tube-side bar 0.40Pressure drop shell-side bar 0.028 The heat exchanger has a small overall heat-transfer coefficient because of laminar flow in the tubes. The diameter of the tubes was increased to cope with the high pressure drop. It has been reduced to acceptable levels. The heat exchanger shall be made of nickel steel because of the incompatibility of carbon steel with fat and FAEE at higher temperatures. 8.6 Mixers The flowsheet shows 5 points where streams are mixed. Three of those points do not necessitate a true mixing vessel, these are just pipes that join. The two mixers, which were further designed, are the two mixers involved in the washing steps of the fat and the FAEE respectively. The calculations are given in Appendices 8.13 and 8.14. 8.6.1 Mixer: (M01) The design requirement is for good contacting between fat and water to occur, for efficient transfer of the pollutants to the water stream. The only literature value found was for a lab scale experiment in which 300 g of fat was contacted with 5 wt% of
Biodiesel Production & Prion Destruction Conceptual Process Design
- page 60 -
water (lit. 72) for three minutes. This is not a firm ground from a design point of view. If we take the difference in chemical nature of the two compounds, fat and dissolved impurities, in consideration separation of the impurities by washing them away with water should not pose a problem. But because of the unfamiliarity of the system and the fact that we are dealing with a feedstock containing a great variety of impurities the mixer was heavily oversized. The amount of water was taken threefold (15 wt%) the amount mentioned in literature. Furthermore the contacting time was 15 times higher. This can be easily done because the mixer volume remains relatively small. With this combination of more water and higher residence time the washing should go very effectively. The use of an agitated vessel with an impeller gives an extra means to increase mixing by increasing impeller speed at the cost of extra power consumption. Smaller droplets mean a larger contact area and more efficient washing. The streams going into the mixture are <3> and <68>. The major characteristics of the mixers are given in Table 8.6.1. Table 8.6.1: “Main characteristics of mixer (M01)”
Characteristic Unit Mixer (M01) Duty kW 6.231Heigth of the vessel m 0.913Vessel diameter m 1.218Vessel volume m3 1.064Diameter paddle (agitator) m 0.37Agitator speed rpm 385 The residence time deemed best sets the volume. It can be greatly reduced if more research is done on this system. The impeller used is a standard six-blade impeller. The design can be optimized in conjunction with the manufacturer, since there more detailed knowledge of the agitators is present. 8.6.2 Mixer: (M02) The purpose of this mixer is to wash the outgoing FAEE stream <59> with water <61> to remove the final residues of glycerol. Glycerol dissolves very well in water. Still the agitated vessel is oversized too cope with possible variations because of varying feed stock impurities (mainly variations in FFA content) which could increase the amount of glycerol which still remains. The important characteristics of the mixer are given in Table 8.6.2. Table 8.6.2: “Main characteristics of mixer (M02)”
Characteristic Unit Mixer (M02) Duty kW 3.255Heigth of the vessel m 0.783Vessel diameter m 1.044Vessel volume m3 0.669Diameter paddle (agitator) m 0.313Agitator speed rpm 385 Generally it is the same mixer as (M01) only somewhat smaller in size. The system it handles is largely the same as well. The smaller size is due to the smaller residence time necessary, namely 30 minutes versus 45 minutes for (M01). Again a standard six-blade impeller is used.
Biodiesel Production & Prion Destruction Conceptual Process Design
- page 61 -
8.7 Membrane (S01) In the Aspen model, the membrane (S01) was assumed to be a splitter, with 95% of the water and 5% of the ethanol leaving in the permeate stream. It is important that the concentration of water in the retentate does not rise above 1%, as a large water concentration is detrimental to equilibrium conversion in the transesterification reactor (R02). This leads to streams with compositions and sizes as stated in Table 8.7.1. Table 8.7.1: “Streams to and from the membrane”
Stream <52> <53> <82> Flow rate (kg/h) 52.78 43.56 9.22 Ethanol fraction (-) 0.861 0.992 0.247Water fraction (-) 0.139 0.008 0.753 The temperature of <52>, the stream entering the membrane, is 78C. Cross-linked poly vinyl alcohol (PVA) membranes have a very high hydrophilicity and are often used in the industry for separation of water from ethanol. They are easy to incorporate in modular systems. Though the type of membrane was not specified by the two pervaporation membrane manufacturers that were found (Sulzer Chemtech and Cm-Celfa), it is assumed that this type of membrane will be used. The unit works by contacting the liquid ethanol/water mixture with the membrane and providing a low water concentration on the opposite side of the membrane. This can be done by either blowing through dry air or by providing a vacuum. The use of a vacuum is easier and more controllable; a pressure of 6.7 mbar is used in literature (lit. 75). There are two different gradients in the membrane. The first along the length of the membrane, where the concentration of water in the ethanol decreases from 15% to 1%. The other gradient is over the membrane. The concentration at the side of the permeate is rate-determining. For this reason the pressure has a large influence on the flux and selectivity. The feed composition and temperature also influence the selectivity. Because of the complex behavior of the membrane, design always begins with an experiment. Operating diagrams are used more often than equations for preliminary sizing. (lit. B32, p. 22-67). Operating diagrams were difficult to come by, so experimental data was used from literature 75. The flux and selectivity were found for 80C and a feed composition containing 10 w% water, using a cross-linked PVA membrane and a permeate pressure of 6.7 mbar. These conditions are comparable to the conditions present in the process. Considering figure 22-82 of B32, it would seem that the selectivity at low permeate pressures for 14 w% or 10 w% water content in the feed should not differ significantly. Though not stated in the article, it was assumed that the flux given was the average flux over the membrane. The selectivity was used to check the assumptions made during the calculation of the sizes and compositions of the flows. The formulas used are shown in Appendix 8.15. The results are listed in Table 8.7.2. It can be seen that the maximum deviation is 1.2%. This is considered to be sufficient for a preliminary sizing.
Biodiesel Production & Prion Destruction Conceptual Process Design
- page 62 -
Table 8.7.1: “Comparison assumptions to calculations”
Parameter Calculated Assumed Deviation (%) Selectivity 19.3 (lit. 75) 19 1.6 Flux 0.256 (lit. 75) 0.256 - Size of flow <53> (kg/hr) 43.592 43.556 0.1 Size of flow <82> (kg/hr) 9.184 9.220 0.4 Permeate water fraction (-) 0.756 0.753 0.4 Permeate ethanol fraction (-) 0.244 0.247 1.2 Though the values would seem fairly accurate, experiments will be necessary before a final design of this membrane will be possible. The calculated area is 36 m2. 8.8 Distillation columns The two distillation columns were sized using Excel. The calculation files are given in Appendices 8.16 and 8.17 for ether distillation (C01) and ethanol distillation (C02) respectively. 8.8.1 Ether distillation column: (C01) The ether distillation column is used to remove the diethyl ether from the ethanol stream. This is done to avoid accumulation of diethyl ether in the recycle stream, which could lead to a safety hazard. The incoming stream <33> and the outgoing streams <34>, <41> are given in Table 8.8.1. Table 8.8.1: “Incoming and outgoing streams for the distillation column (C01)”
Flow ID Major components
Units <33> (IN)
<39> (OUT)
<41> (OUT)
Temperature C 74 39 79Pressure bar 1.00 1.00 1.00Glycerol kg/hr 0.00 0.00 0.00Ethanol kg/hr 46.81 1.35 45.46Water kg/hr 12.98 0.16 12.82Fat kg/hr 0.00 0.00 0.00Stearic Acid kg/hr 0.00 0.00 0.00Oleic Acid kg/hr 0.00 0.00 0.00Palmitic Acid kg/hr 0.00 0.00 0.00Stearic Ethyl Ester kg/hr 0.00 0.00 0.00Oleic Ethyl Ester kg/hr 0.00 0.00 0.00Palmitic Ethyl Ester kg/hr 0.00 0.00 0.00Diethyl ether kg/hr 6.50 6.44 0.06Total kg/hr 66.29 7.94 58.35 The calculations are given in Appendix 8.16. The major dimensions are given in Table 8.8.2.
Biodiesel Production & Prion Destruction Conceptual Process Design
- page 63 -
Table 8.8.2: “Main characteristics of distillation column (C01)”
Dimensions and properties Unit Distillation Column (C01) Mass flow vapor (bottom tray) kg/hr 10.5Mass flow liquid (bottom tray) kg/hr 67.2Height of the Column m 3.6Column diameter m 0.11Column tray area m2 0.009Number of trays - 15Pressure drop bar 0.008 The column has a high height to diameter ratio and is overall very small. It’s diameter is not large because of the relatively small throughput. Corrosion should not pose a problem and the pressure and temperature are acceptable, carbon steel can be used as construction material. The trays are normal sieve trays. 8.8.2 Ethanol distillation column: (C02) The ethanol distillation column is used to remove part of the water from the ethanol stream. If the stream is distilled before the pervaporative membrane, the size of the membrane can be greatly reduced. The incoming stream of (C02), <42> is given in Table 8.8.3 as well as the outgoing streams <48>, <51>. Table 8.8.3: “Incoming and outgoing streams for the distillation column (C02)”
Flow ID Major components
Units <42> (IN)
<48> (OUT)
<51> (OUT)
Temperature C 79 78 78Pressure bar 1 1 1Glycerol kg/hr 0.00 0.00 0.00Ethanol kg/hr 45.46 45.46 0.00Water kg/hr 12.82 7.31 5.51Fat kg/hr 0.00 0.00 0.00Stearic Acid kg/hr 0.00 0.00 0.00Oleic Acid kg/hr 0.00 0.00 0.00Palmitic Acid kg/hr 0.00 0.00 0.00Stearic Ethyl Ester kg/hr 0.00 0.00 0.00Oleic Ethyl Ester kg/hr 0.00 0.00 0.00Palmitic Ethyl Ester kg/hr 0.00 0.00 0.00Diethyl ether kg/hr 0.06 0.06 0.00Total kg/hr 58.34 52.83 5.51 The calculations are shown in Appendix 8.17. The important dimensions are given in Table 8.8.4. Table 8.8.4: “Main characteristics of distillation column (C02)”
Dimensions and properties Unit Distillation Column (C02) Mass flow vapor (bottom tray) kg/hr 51.4Mass flow liquid (bottom tray) kg/hr 41.7Heigth of the Column m 13.6Column diameter m 0.13Column tray area m2 0.011Number of trays - 36Pressure drop bara 0.039
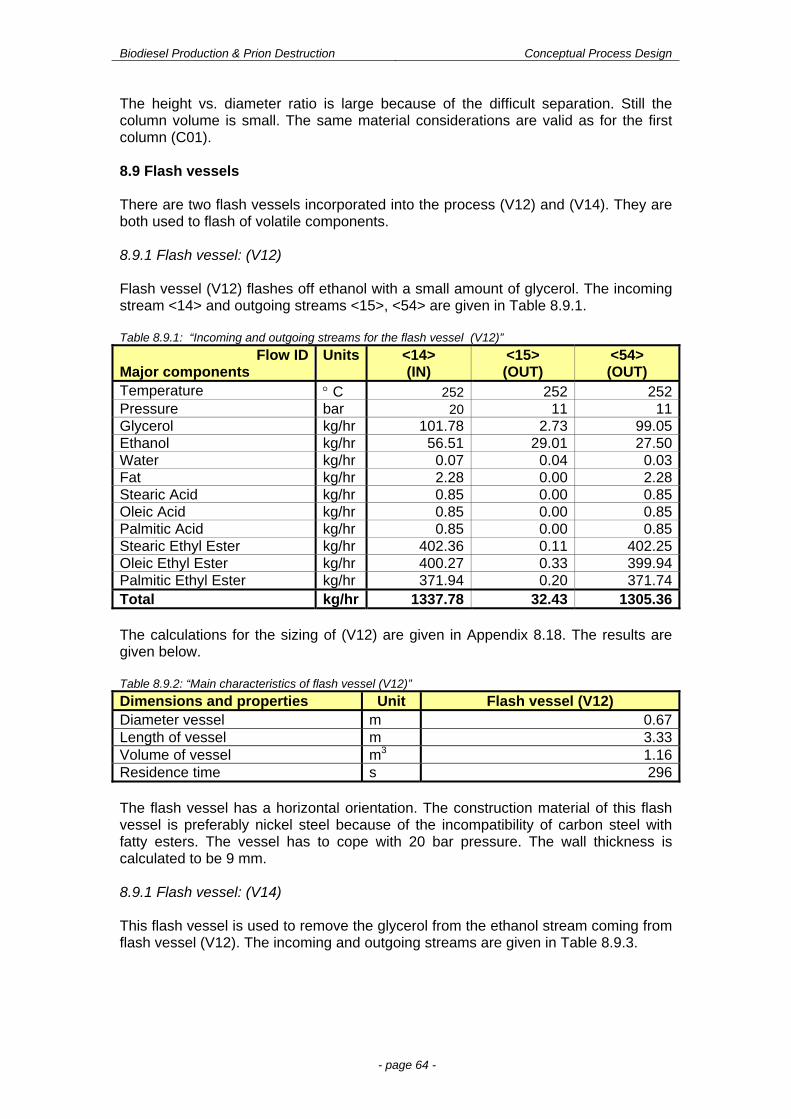
Biodiesel Production & Prion Destruction Conceptual Process Design
- page 64 -
The height vs. diameter ratio is large because of the difficult separation. Still the column volume is small. The same material considerations are valid as for the first column (C01). 8.9 Flash vessels There are two flash vessels incorporated into the process (V12) and (V14). They are both used to flash of volatile components. 8.9.1 Flash vessel: (V12) Flash vessel (V12) flashes off ethanol with a small amount of glycerol. The incoming stream <14> and outgoing streams <15>, <54> are given in Table 8.9.1. Table 8.9.1: “Incoming and outgoing streams for the flash vessel (V12)”
Flow ID Major components
Units <14> (IN)
<15> (OUT)
<54> (OUT)
Temperature C 252 252 252Pressure bar 20 11 11Glycerol kg/hr 101.78 2.73 99.05Ethanol kg/hr 56.51 29.01 27.50Water kg/hr 0.07 0.04 0.03Fat kg/hr 2.28 0.00 2.28Stearic Acid kg/hr 0.85 0.00 0.85Oleic Acid kg/hr 0.85 0.00 0.85Palmitic Acid kg/hr 0.85 0.00 0.85Stearic Ethyl Ester kg/hr 402.36 0.11 402.25Oleic Ethyl Ester kg/hr 400.27 0.33 399.94Palmitic Ethyl Ester kg/hr 371.94 0.20 371.74Total kg/hr 1337.78 32.43 1305.36 The calculations for the sizing of (V12) are given in Appendix 8.18. The results are given below. Table 8.9.2: “Main characteristics of flash vessel (V12)”
Dimensions and properties Unit Flash vessel (V12) Diameter vessel m 0.67Length of vessel m 3.33Volume of vessel m3 1.16Residence time s 296 The flash vessel has a horizontal orientation. The construction material of this flash vessel is preferably nickel steel because of the incompatibility of carbon steel with fatty esters. The vessel has to cope with 20 bar pressure. The wall thickness is calculated to be 9 mm. 8.9.1 Flash vessel: (V14) This flash vessel is used to remove the glycerol from the ethanol stream coming from flash vessel (V12). The incoming and outgoing streams are given in Table 8.9.3.
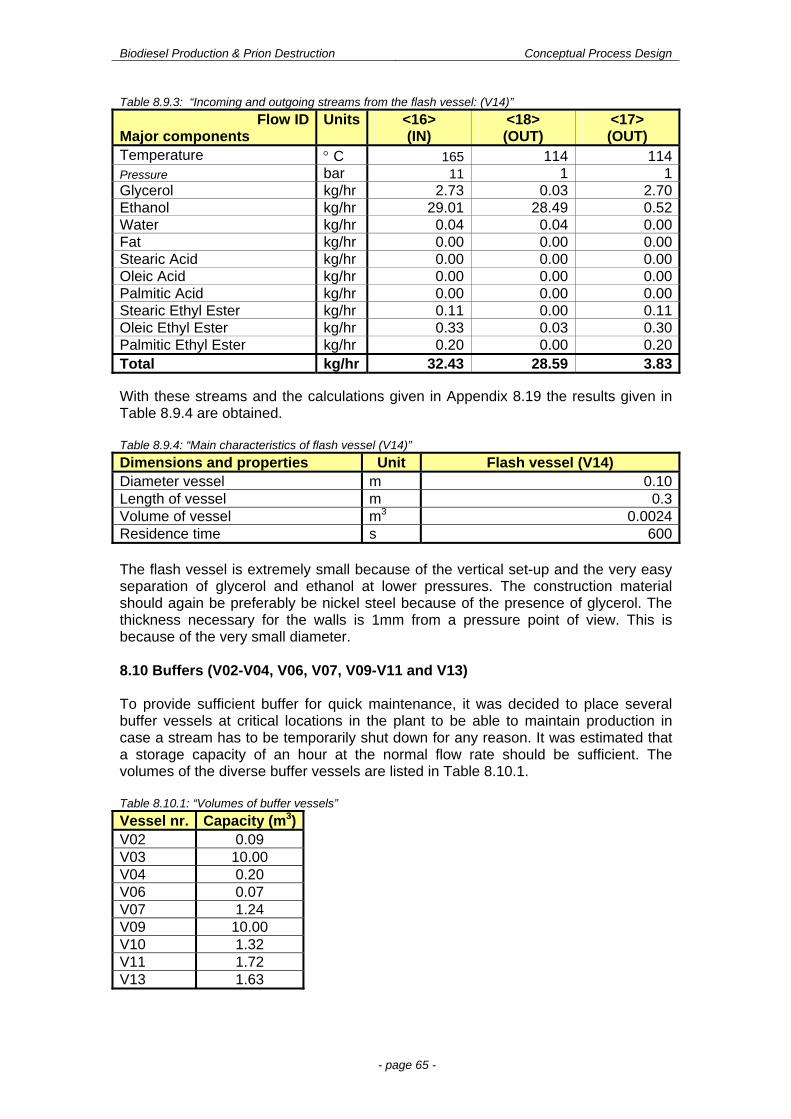
Biodiesel Production & Prion Destruction Conceptual Process Design
- page 65 -
Table 8.9.3: “Incoming and outgoing streams from the flash vessel: (V14)”
Flow ID Major components
Units <16> (IN)
<18> (OUT)
<17> (OUT)
Temperature C 165 114 114Pressure bar 11 1 1Glycerol kg/hr 2.73 0.03 2.70Ethanol kg/hr 29.01 28.49 0.52Water kg/hr 0.04 0.04 0.00Fat kg/hr 0.00 0.00 0.00Stearic Acid kg/hr 0.00 0.00 0.00Oleic Acid kg/hr 0.00 0.00 0.00Palmitic Acid kg/hr 0.00 0.00 0.00Stearic Ethyl Ester kg/hr 0.11 0.00 0.11Oleic Ethyl Ester kg/hr 0.33 0.03 0.30Palmitic Ethyl Ester kg/hr 0.20 0.00 0.20Total kg/hr 32.43 28.59 3.83 With these streams and the calculations given in Appendix 8.19 the results given in Table 8.9.4 are obtained. Table 8.9.4: “Main characteristics of flash vessel (V14)”
Dimensions and properties Unit Flash vessel (V14) Diameter vessel m 0.10Length of vessel m 0.3Volume of vessel m3 0.0024Residence time s 600 The flash vessel is extremely small because of the vertical set-up and the very easy separation of glycerol and ethanol at lower pressures. The construction material should again be preferably be nickel steel because of the presence of glycerol. The thickness necessary for the walls is 1mm from a pressure point of view. This is because of the very small diameter. 8.10 Buffers (V02-V04, V06, V07, V09-V11 and V13) To provide sufficient buffer for quick maintenance, it was decided to place several buffer vessels at critical locations in the plant to be able to maintain production in case a stream has to be temporarily shut down for any reason. It was estimated that a storage capacity of an hour at the normal flow rate should be sufficient. The volumes of the diverse buffer vessels are listed in Table 8.10.1. Table 8.10.1: “Volumes of buffer vessels”
Vessel nr. Capacity (m3) V02 0.09 V03 10.00 V04 0.20 V06 0.07 V07 1.24 V09 10.00 V10 1.32 V11 1.72 V13 1.63
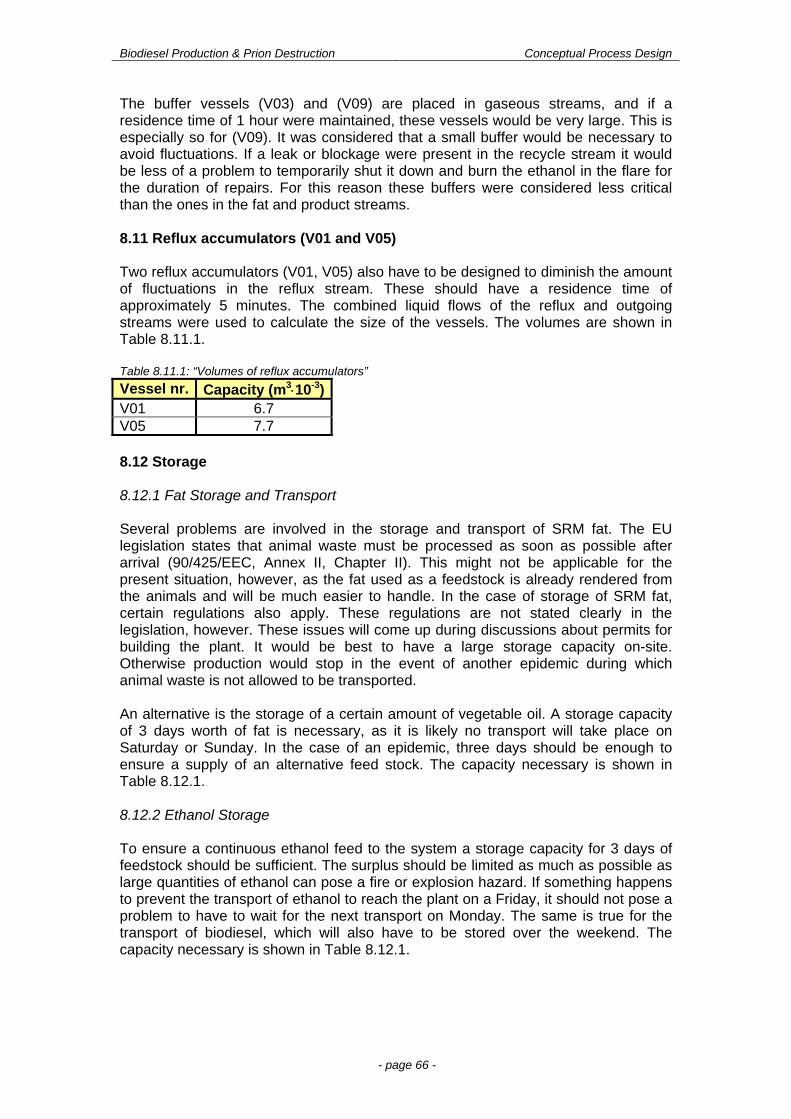
Biodiesel Production & Prion Destruction Conceptual Process Design
- page 66 -
The buffer vessels (V03) and (V09) are placed in gaseous streams, and if a residence time of 1 hour were maintained, these vessels would be very large. This is especially so for (V09). It was considered that a small buffer would be necessary to avoid fluctuations. If a leak or blockage were present in the recycle stream it would be less of a problem to temporarily shut it down and burn the ethanol in the flare for the duration of repairs. For this reason these buffers were considered less critical than the ones in the fat and product streams. 8.11 Reflux accumulators (V01 and V05) Two reflux accumulators (V01, V05) also have to be designed to diminish the amount of fluctuations in the reflux stream. These should have a residence time of approximately 5 minutes. The combined liquid flows of the reflux and outgoing streams were used to calculate the size of the vessels. The volumes are shown in Table 8.11.1. Table 8.11.1: “Volumes of reflux accumulators”
Vessel nr. Capacity (m310-3) V01 6.7 V05 7.7 8.12 Storage 8.12.1 Fat Storage and Transport Several problems are involved in the storage and transport of SRM fat. The EU legislation states that animal waste must be processed as soon as possible after arrival (90/425/EEC, Annex II, Chapter II). This might not be applicable for the present situation, however, as the fat used as a feedstock is already rendered from the animals and will be much easier to handle. In the case of storage of SRM fat, certain regulations also apply. These regulations are not stated clearly in the legislation, however. These issues will come up during discussions about permits for building the plant. It would be best to have a large storage capacity on-site. Otherwise production would stop in the event of another epidemic during which animal waste is not allowed to be transported. An alternative is the storage of a certain amount of vegetable oil. A storage capacity of 3 days worth of fat is necessary, as it is likely no transport will take place on Saturday or Sunday. In the case of an epidemic, three days should be enough to ensure a supply of an alternative feed stock. The capacity necessary is shown in Table 8.12.1. 8.12.2 Ethanol Storage To ensure a continuous ethanol feed to the system a storage capacity for 3 days of feedstock should be sufficient. The surplus should be limited as much as possible as large quantities of ethanol can pose a fire or explosion hazard. If something happens to prevent the transport of ethanol to reach the plant on a Friday, it should not pose a problem to have to wait for the next transport on Monday. The same is true for the transport of biodiesel, which will also have to be stored over the weekend. The capacity necessary is shown in Table 8.12.1.

Biodiesel Production & Prion Destruction Conceptual Process Design
- page 67 -
Table 8.12.1: “Storage capacity” Capacity (m3) Ethanol 15.5 SRM fat 89.3 FAEE 79.2
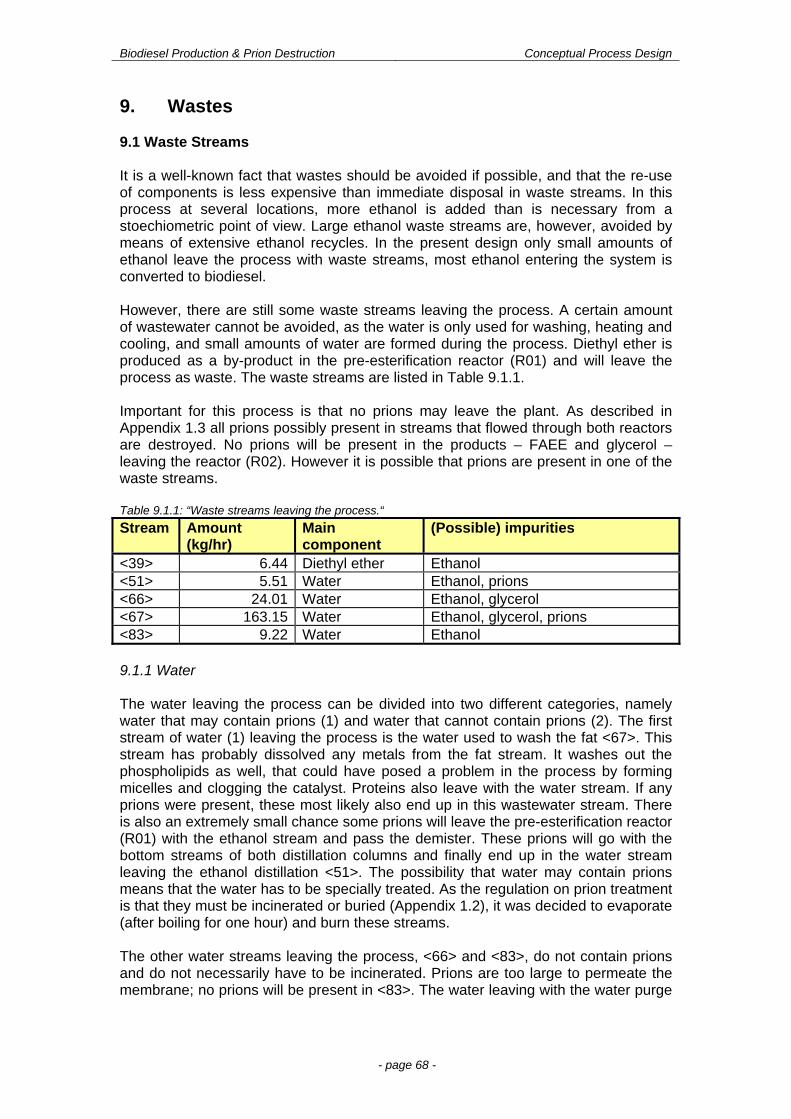
Biodiesel Production & Prion Destruction Conceptual Process Design
- page 68 -
9. Wastes 9.1 Waste Streams It is a well-known fact that wastes should be avoided if possible, and that the re-use of components is less expensive than immediate disposal in waste streams. In this process at several locations, more ethanol is added than is necessary from a stoechiometric point of view. Large ethanol waste streams are, however, avoided by means of extensive ethanol recycles. In the present design only small amounts of ethanol leave the process with waste streams, most ethanol entering the system is converted to biodiesel. However, there are still some waste streams leaving the process. A certain amount of wastewater cannot be avoided, as the water is only used for washing, heating and cooling, and small amounts of water are formed during the process. Diethyl ether is produced as a by-product in the pre-esterification reactor (R01) and will leave the process as waste. The waste streams are listed in Table 9.1.1. Important for this process is that no prions may leave the plant. As described in Appendix 1.3 all prions possibly present in streams that flowed through both reactors are destroyed. No prions will be present in the products – FAEE and glycerol – leaving the reactor (R02). However it is possible that prions are present in one of the waste streams. Table 9.1.1: “Waste streams leaving the process.“
Stream Amount (kg/hr)
Main component
(Possible) impurities
<39> 6.44 Diethyl ether Ethanol <51> 5.51 Water Ethanol, prions <66> 24.01 Water Ethanol, glycerol <67> 163.15 Water Ethanol, glycerol, prions <83> 9.22 Water Ethanol 9.1.1 Water The water leaving the process can be divided into two different categories, namely water that may contain prions (1) and water that cannot contain prions (2). The first stream of water (1) leaving the process is the water used to wash the fat <67>. This stream has probably dissolved any metals from the fat stream. It washes out the phospholipids as well, that could have posed a problem in the process by forming micelles and clogging the catalyst. Proteins also leave with the water stream. If any prions were present, these most likely also end up in this wastewater stream. There is also an extremely small chance some prions will leave the pre-esterification reactor (R01) with the ethanol stream and pass the demister. These prions will go with the bottom streams of both distillation columns and finally end up in the water stream leaving the ethanol distillation <51>. The possibility that water may contain prions means that the water has to be specially treated. As the regulation on prion treatment is that they must be incinerated or buried (Appendix 1.2), it was decided to evaporate (after boiling for one hour) and burn these streams. The other water streams leaving the process, <66> and <83>, do not contain prions and do not necessarily have to be incinerated. Prions are too large to permeate the membrane; no prions will be present in <83>. The water leaving with the water purge
Biodiesel Production & Prion Destruction Conceptual Process Design
- page 69 -
<66> only came in contact with FAEE that flowed through both reactors that does not contain prions. This means that it is impossible that this outgoing water stream contains prions. However, these two streams are very small and purification will be expensive. Therefore it is decided to send these streams to the incineration as well. All impurities present in the four wastewater streams will be incinerated and the water evaporated. This will create medium-pressure steam, which can be used for the heating of some other process stream. Because all prions will be destroyed in the heat treatment, the steam generated may be used for heating or for the second wash step. Recycle of process water is not taken into account during the design of the process, but is something to look into before building the plant. The incineration process will produce some ash that has to be dumped. The incineration unit will be operated as batch to make sure all prions will have a residence time in this unit of 1 hour. A buffer vessel is needed for storage of the process water. Nearly 202 kg/hr of process water must be processed. The temperature of the total water stream will be approximately 70°C. With a density of approximately 970 kg/m3 this gives a volume stream of 0.21 m3/hr. The units will not be designed precisely. For economic calculations it is assumed that a steam kettle can be used. It can be said that this kettle must have a minimum volume of 0.21 m3. The minimum buffer vessel is set on three times the volume of the kettle and will be at least 0.63 m3. 9.1.2 Diethyl ether The ether leaving the first distillation column (C01) is quite dangerous due to its low flash and auto-ignition points. The amount of ether produced is also too small to design a purification system for this component. It was deemed too costly to purify this stream to a purity suitable for sale. Furthermore it is not desirable to store ether onsite. It was decided to send this stream <39> to a flare. 9.2 Catalyst The process currently chosen was partly chosen to avoid the large amounts of waste that a homogeneous catalyst would produce. The catalysts in both reactors will need to be regenerated and replaced several times a year. In literature P17 it is stated that the ETS-4 catalyst can stay online for at least 500 stream hours without regeneration. Our first estimates were that both catalysts would have to be regenerated 9 times a year (970 online stream hours). The Amberlyst (35 Wet) will be replaced 4 times a year and the ETS-4 catalyst 3 times a year. Regeneration and replacement might be necessary at more frequent intervals, but the impurities in the feed should be small, as a washing step takes place before the feed enters either reactor. The ETS-4 catalyst should have a longer lifetime than the Amberlyst (35 Wet) catalyst, as the pre-esterification reactor (R01) should remove any trace impurities that are present. The Amberlyst (35 Wet) catalyst should be regenerated using a strong acid. The streams leaving the regeneration may contain some (heavy) metals and heavy components formed in the reactor. Again these streams are very small and can be dumped or used to produce steam in the incineration process. It is difficult to estimate with the current information how much waste will be produced. The ETS-4 catalyst is regenerated through calcination (lit. C8), which is heating to high temperatures in an oven. Of course every time the catalyst is replaced the old catalyst becomes waste. With the current assumptions of catalyst replacement rates, the stream sizes will be 2.84 and 7.69 tons per year for the Amberlyst (35 Wet) and ETS-4 catalysts respectively. These catalysts were chosen as first options to

Biodiesel Production & Prion Destruction Conceptual Process Design
- page 70 -
determine the feasibility of the process. It is quite possible that better catalysts exist, and this should definitely be investigated.
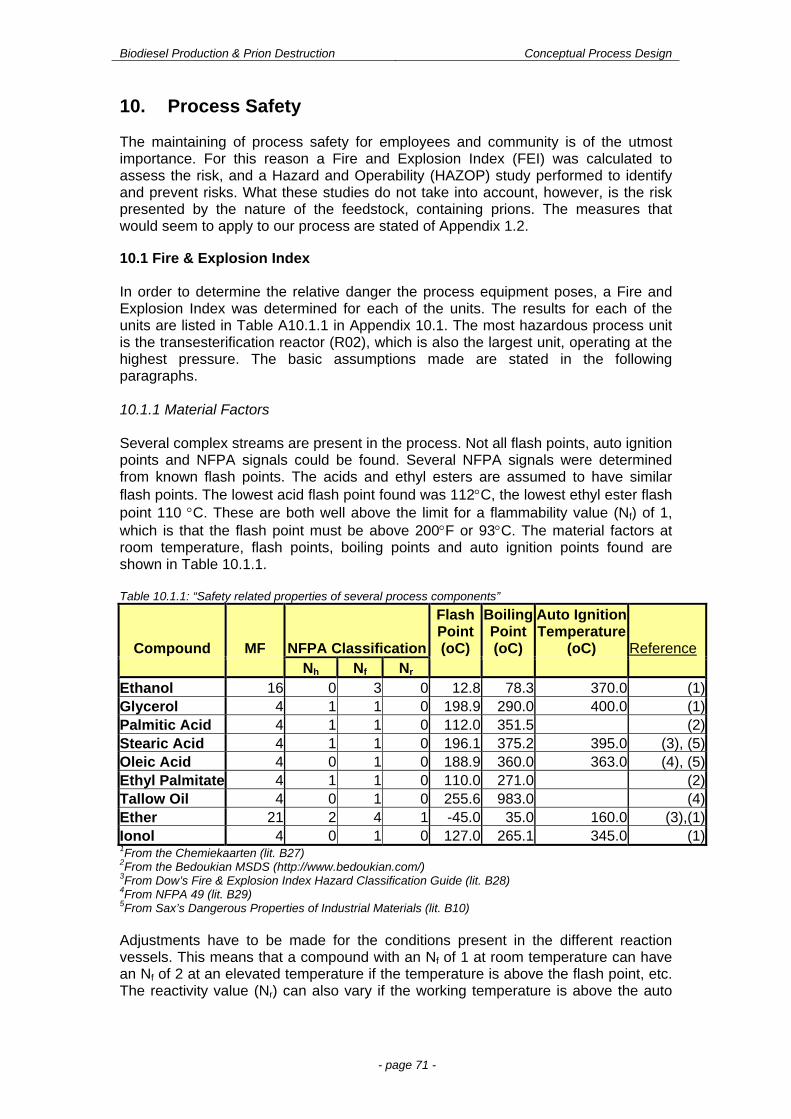
Biodiesel Production & Prion Destruction Conceptual Process Design
- page 71 -
10. Process Safety The maintaining of process safety for employees and community is of the utmost importance. For this reason a Fire and Explosion Index (FEI) was calculated to assess the risk, and a Hazard and Operability (HAZOP) study performed to identify and prevent risks. What these studies do not take into account, however, is the risk presented by the nature of the feedstock, containing prions. The measures that would seem to apply to our process are stated of Appendix 1.2. 10.1 Fire & Explosion Index In order to determine the relative danger the process equipment poses, a Fire and Explosion Index was determined for each of the units. The results for each of the units are listed in Table A10.1.1 in Appendix 10.1. The most hazardous process unit is the transesterification reactor (R02), which is also the largest unit, operating at the highest pressure. The basic assumptions made are stated in the following paragraphs. 10.1.1 Material Factors Several complex streams are present in the process. Not all flash points, auto ignition points and NFPA signals could be found. Several NFPA signals were determined from known flash points. The acids and ethyl esters are assumed to have similar flash points. The lowest acid flash point found was 112C, the lowest ethyl ester flash point 110 C. These are both well above the limit for a flammability value (Nf) of 1, which is that the flash point must be above 200F or 93C. The material factors at room temperature, flash points, boiling points and auto ignition points found are shown in Table 10.1.1. Table 10.1.1: “Safety related properties of several process components”
Compound MF NFPA Classification
Flash Point (oC)
Boiling Point (oC)
Auto Ignition Temperature
(oC) Reference Nh Nf Nr Ethanol 16 0 3 0 12.8 78.3 370.0 (1)Glycerol 4 1 1 0 198.9 290.0 400.0 (1)Palmitic Acid 4 1 1 0 112.0 351.5 (2)Stearic Acid 4 1 1 0 196.1 375.2 395.0 (3), (5)Oleic Acid 4 0 1 0 188.9 360.0 363.0 (4), (5)Ethyl Palmitate 4 1 1 0 110.0 271.0 (2)Tallow Oil 4 0 1 0 255.6 983.0 (4)Ether 21 2 4 1 -45.0 35.0 160.0 (3),(1) Ionol 4 0 1 0 127.0 265.1 345.0 (1)1From the Chemiekaarten (lit. B27) 2From the Bedoukian MSDS (http://www.bedoukian.com/) 3From Dow’s Fire & Explosion Index Hazard Classification Guide (lit. B28) 4From NFPA 49 (lit. B29) 5From Sax’s Dangerous Properties of Industrial Materials (lit. B10) Adjustments have to be made for the conditions present in the different reaction vessels. This means that a compound with an Nf of 1 at room temperature can have an Nf of 2 at an elevated temperature if the temperature is above the flash point, etc. The reactivity value (Nr) can also vary if the working temperature is above the auto
Biodiesel Production & Prion Destruction Conceptual Process Design
- page 72 -
ignition point. This should not occur in this process unless something happens to disrupt the system. The material factors taken for each of the process steps are shown in Table A10.1.1 of Appendix 10.1. The material factors for the different materials were adapted to the situations in the reactors. The most hazardous normal operation state has to be taken into account for all the process units. This means that it is best to take the material factor for the most volatile component. For instance in both of the reactors ethanol is present as a relatively separate vapor stream. Should anything go wrong in the reactor, the ethanol phase will most likely determine the extent of the damage. In the case of the feed stream of fat, all the components have a material factor of 4 at all the operating temperatures except the reactors, and in the reactors the ethanol stream is taken as reference. Ether is produced as a hazardous by-product in the pre-esterification reactor. It is assumed that the ether is only present in the ethanol vapor stream and will be separated by means of distillation (C01) from the stream before it enters the ethanol distillation column (C02). It is not present in large enough quantities to have much influence in the reactor. The operating temperature is close to the auto ignition temperature of ether, however, adding an extra danger to the reactor (R01). In the distillation column (C01) where the ether is removed from the system, as much as ten percent of the flow could be made up of ether in the gas phase. The ether in the system should not pose a problem even above its auto ignition temperature though, as no oxygen should be present in the system for it to react with and the concentration is low. 10.1.2 General Process Hazards Because the plant layout has not yet been determined, several of the penalties could not be estimated. However, it is assumed that there is enough access to each of the units for fire-fighting equipment. It is also assumed that the drainage is satisfactory. For these points no penalties were awarded. It is also assumed that no leakage takes place, as the plant will be new, and should be made of materials designed to withstand the stress of the process. According to Dow (lit. B28), esterification is a moderate exothermic reaction. It is safe to assume that transesterification is also a moderate exotherm. For this reason, both reactions will require a penalty of 0.50. Ethanol is a class I flammable and is a potential hazard. It may be delivered by means of a pipeline or a truck, depending on the final location of the plant. At the moment transport by truck is assumed. Transport by pipeline would be safer. Enough ethanol is stored to be able to run the plant for three days. With a Nf of 3, this means a penalty of 0.85. For the storage of ethanol, an inerted, closed vapor recovery system should be used, with assured air-tightness. This avoids risks that might occur if air got into the system. The fat was considered to be a flammable solid; a storage capacity of three days was also taken into account for this storage. The biodiesel storage was not considered, but should be equivalent to the fat storage, as the heat of combustion per kilo is roughly equivalent, as is the material factor.
Biodiesel Production & Prion Destruction Conceptual Process Design
- page 73 -
10.1.3 Special Process Hazards All materials present have health factors (Nh) of either 0 or 1. This means that in the worst case, only minor residual injury is likely due to the toxicity. In the membrane separation section the pressure is 10 mbar, which means there should be a penalty applied for sub-atmospheric pressure of 0.50. The pressure penalties applicable are a penalty of 0.52 for the 20 bar transesterification section, and a penalty of 0.29 for the 5 bar sections. As ethanol would count as a compressed gas, the penalties both need to be multiplied by 1.2, giving penalties of respectively 0.62 and 0.35. No low temperatures are employed in the process. No corrosion is expected to take place. No fired heaters were needed, as all process temperatures could be reached using pressurized steam. In the situation that all steam has to be produced on site, a heated kettle will be needed. The ether and occasional ethanol flare can be used to complement the natural gas for heating of this steam. Water is not combustible or flammable, and should not pose a safety hazard. It is important, however, that any unit that could release material above its flash point or boiling point is placed far away from the fired heater. 10.1.4 Improvement Options & Conclusions The results for each of the units are listed in Table A10.1.1 in Appendix 10.1. As was expected, the two reactors are the most dangerous units in the system. The transesterification reactor (R02) in particular. If this reactor explodes it will have a radius of approximately 21 meters, with 66% damage done to the surrounding equipment. However, the F&EI showed that all units with a considerable ethanol flow pose a certain danger. High pressure and vacuum also increase risks. Due to the small scale of the plant, none of the units pose more than a moderate hazard (lit. B23, p. 369). For the two reactors (R01 and R02) and several pumps (P07, P08 and P09) an estimate was made for the credit factors that would be applicable. Credit factors of 0.64 and 0.60 were calculated for the pre-esterification and the transesterification reactors respectively. This shows that with proper control and safety measures risks can be reduced considerably. It is important that there is sufficient drainage in place, especially around the reactors. A diking design should be made that surrounds three sides of the area and directs spills to an impounding basin or non-exposing drainage trench. The slope has to be more than 1% for hard surface, the distance more than eight meters. The basin has to be able to hold at least 75% of the contents of the reactor and 30 minutes of fire fighting water. As most of the fluids in system are either fat or biodiesel, and have a high combustion energy, it is even more important to have a good fire-fighting and explosion suppression system in place for any ethanol or ether leaks. A fire started by an ethanol leak must not reach any process unit where large amounts of biodiesel are stored. Alarms should be in place that detects unusual concentrations of these components before they reach their explosive limits.
Biodiesel Production & Prion Destruction Conceptual Process Design
- page 74 -
10.2 HAZOP 10.2.1 HAZOP Analysis The Hazard and Operability study was performed on several of the process units with the highest Fire and Explosion Index. The study was carried out in accordance to the guidelines from literature B23. The results are shown in Appendix 10.2. The major conclusions from this study are explained in the following section. 10.2.2 Conclusions & Recommendations It can be seen from the HAZOP performed on the reactors and other equipment with high F&EI that most problems, when they occur, would mean either a temporary shutdown of the plant or a shutdown of the ethanol recycle. The first situation especially should be avoided at all costs, and so several improvements were suggested which can make sure that the chance of these events occurring is as small as possible. And, that if such an event should occur, it will be noticed immediately and action can be taken. Of course the first method for reducing risks is good maintenance. This should decrease the chance of plugging in pipes or in the reactor. Regular regeneration of the catalyst will also help in avoiding risks. Proper control is, naturally, also important in avoiding situations that could create dangers. A number of extra control loops were added according to the results of the HAZOP. These controllers were described in chapter 6. Not all controllers suggested in the HAZOP are added to process. Some controllers did not seem really necessary or there were already controllers that had approximately the same function. The controllers are still mentioned in the HAZOP analysis as good suggestions for control possibilities when there are some problems operating a unit in the process. Some of the most dangerous accidents have occurred because flows started flowing in the wrong direction. As the plant design includes several pressure increases, non-return valves should be fitted to ensure that the flow does not reverse in the case of the malfunctioning of one of the pumps. All critical pumps in the process have backups that can be switched to when the main pumps malfunction. The malfunctioning pump will also be cut off from the rest of the process by valves that direct the flow to the backup pump. Furthermore several flows in which major temperature variations can have severe consequences are fitted with a backup heater or cooler. If any of the control systems fails, this backup system can also be used. An emergency generator is important to have in the case of electricity failure, as this could also cause accidents to happen through the sudden failure of pumps. Another danger is pressure increase. To avoid dangerous buildup of material and pressure, relief valves were decided on for flash vessels, distillation columns and reactors. The vapor released by these valves will be fed to a flare. To avoid shutdown when something goes wrong in the system, buffer vessels are added to dampen flow fluctuations. In the case of an emergency, it should be possible to vent the vapor in the reactors to a flare system. The fluid could also be removed from the trays by means of the catalyst regeneration pipes. This should not be necessary in most situations, however. The fluid should provide cooling for the reactor that would not occur otherwise and usually it is wiser to leave the fluid in the reactor.

Biodiesel Production & Prion Destruction Conceptual Process Design
- page 75 -
For the worst-case scenario, any major piece of equipment needs to be equipped with valves on the inlet and outlet streams so that it can be cut off from the rest of the plant if necessary.
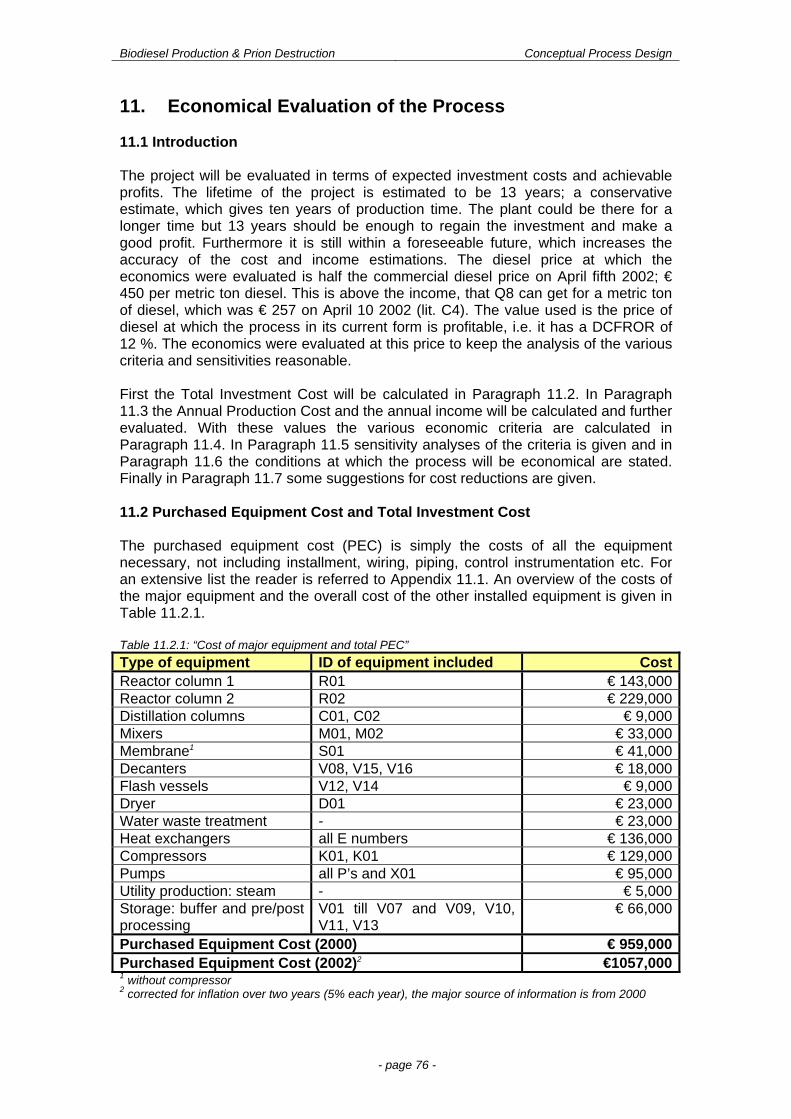
Biodiesel Production & Prion Destruction Conceptual Process Design
- page 76 -
11. Economical Evaluation of the Process 11.1 Introduction The project will be evaluated in terms of expected investment costs and achievable profits. The lifetime of the project is estimated to be 13 years; a conservative estimate, which gives ten years of production time. The plant could be there for a longer time but 13 years should be enough to regain the investment and make a good profit. Furthermore it is still within a foreseeable future, which increases the accuracy of the cost and income estimations. The diesel price at which the economics were evaluated is half the commercial diesel price on April fifth 2002; € 450 per metric ton diesel. This is above the income, that Q8 can get for a metric ton of diesel, which was € 257 on April 10 2002 (lit. C4). The value used is the price of diesel at which the process in its current form is profitable, i.e. it has a DCFROR of 12 %. The economics were evaluated at this price to keep the analysis of the various criteria and sensitivities reasonable. First the Total Investment Cost will be calculated in Paragraph 11.2. In Paragraph 11.3 the Annual Production Cost and the annual income will be calculated and further evaluated. With these values the various economic criteria are calculated in Paragraph 11.4. In Paragraph 11.5 sensitivity analyses of the criteria is given and in Paragraph 11.6 the conditions at which the process will be economical are stated. Finally in Paragraph 11.7 some suggestions for cost reductions are given. 11.2 Purchased Equipment Cost and Total Investment Cost The purchased equipment cost (PEC) is simply the costs of all the equipment necessary, not including installment, wiring, piping, control instrumentation etc. For an extensive list the reader is referred to Appendix 11.1. An overview of the costs of the major equipment and the overall cost of the other installed equipment is given in Table 11.2.1. Table 11.2.1: “Cost of major equipment and total PEC”
Type of equipment ID of equipment included Cost Reactor column 1 R01 € 143,000Reactor column 2 R02 € 229,000Distillation columns C01, C02 € 9,000Mixers M01, M02 € 33,000Membrane1 S01 € 41,000Decanters V08, V15, V16 € 18,000Flash vessels V12, V14 € 9,000Dryer D01 € 23,000Water waste treatment - € 23,000Heat exchangers all E numbers € 136,000Compressors K01, K01 € 129,000Pumps all P’s and X01 € 95,000Utility production: steam - € 5,000Storage: buffer and pre/post processing
V01 till V07 and V09, V10, V11, V13
€ 66,000
Purchased Equipment Cost (2000) € 959,000Purchased Equipment Cost (2002)2 €1057,0001 without compressor 2 corrected for inflation over two years (5% each year), the major source of information is from 2000
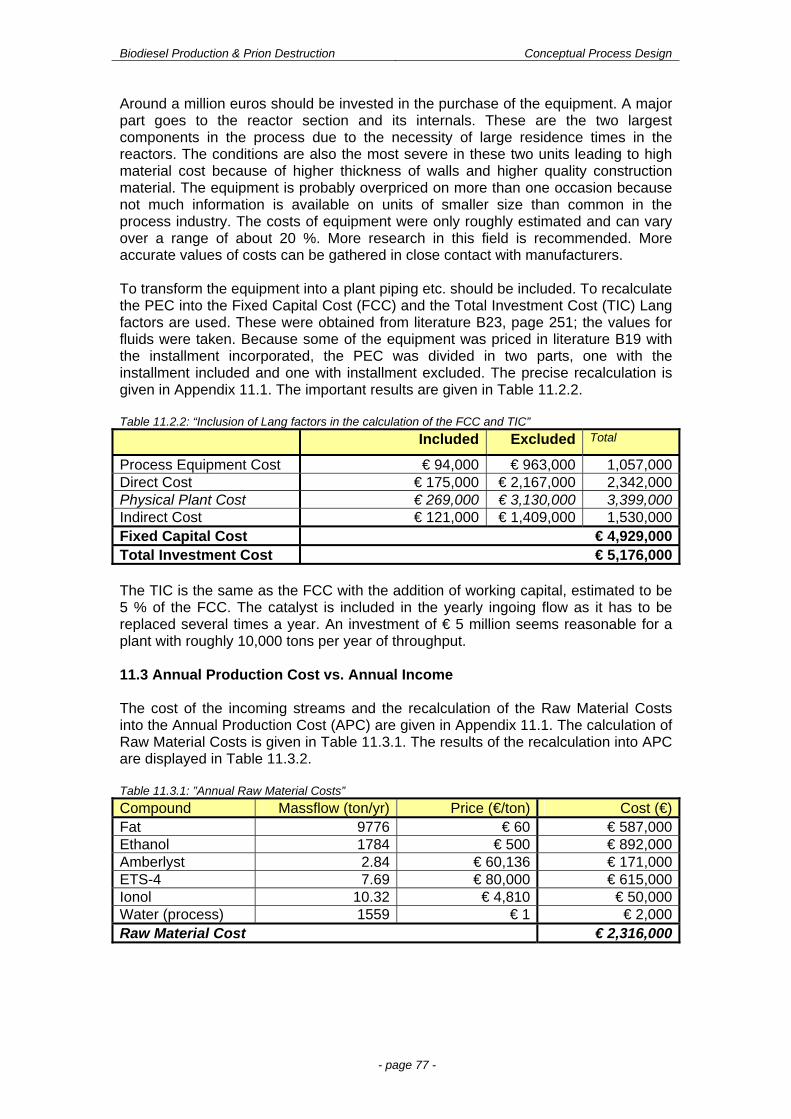
Biodiesel Production & Prion Destruction Conceptual Process Design
- page 77 -
Around a million euros should be invested in the purchase of the equipment. A major part goes to the reactor section and its internals. These are the two largest components in the process due to the necessity of large residence times in the reactors. The conditions are also the most severe in these two units leading to high material cost because of higher thickness of walls and higher quality construction material. The equipment is probably overpriced on more than one occasion because not much information is available on units of smaller size than common in the process industry. The costs of equipment were only roughly estimated and can vary over a range of about 20 %. More research in this field is recommended. More accurate values of costs can be gathered in close contact with manufacturers. To transform the equipment into a plant piping etc. should be included. To recalculate the PEC into the Fixed Capital Cost (FCC) and the Total Investment Cost (TIC) Lang factors are used. These were obtained from literature B23, page 251; the values for fluids were taken. Because some of the equipment was priced in literature B19 with the installment incorporated, the PEC was divided in two parts, one with the installment included and one with installment excluded. The precise recalculation is given in Appendix 11.1. The important results are given in Table 11.2.2. Table 11.2.2: “Inclusion of Lang factors in the calculation of the FCC and TIC”
Included Excluded Total
Process Equipment Cost € 94,000 € 963,000 1,057,000Direct Cost € 175,000 € 2,167,000 2,342,000Physical Plant Cost € 269,000 € 3,130,000 3,399,000Indirect Cost € 121,000 € 1,409,000 1,530,000Fixed Capital Cost € 4,929,000Total Investment Cost € 5,176,000 The TIC is the same as the FCC with the addition of working capital, estimated to be 5 % of the FCC. The catalyst is included in the yearly ingoing flow as it has to be replaced several times a year. An investment of € 5 million seems reasonable for a plant with roughly 10,000 tons per year of throughput. 11.3 Annual Production Cost vs. Annual Income The cost of the incoming streams and the recalculation of the Raw Material Costs into the Annual Production Cost (APC) are given in Appendix 11.1. The calculation of Raw Material Costs is given in Table 11.3.1. The results of the recalculation into APC are displayed in Table 11.3.2. Table 11.3.1: ”Annual Raw Material Costs”
Compound Massflow (ton/yr) Price (€/ton) Cost (€)Fat 9776 € 60 € 587,000Ethanol 1784 € 500 € 892,000Amberlyst 2.84 € 60,136 € 171,000ETS-4 7.69 € 80,000 € 615,000Ionol 10.32 € 4,810 € 50,000Water (process) 1559 € 1 € 2,000Raw Material Cost € 2,316,000
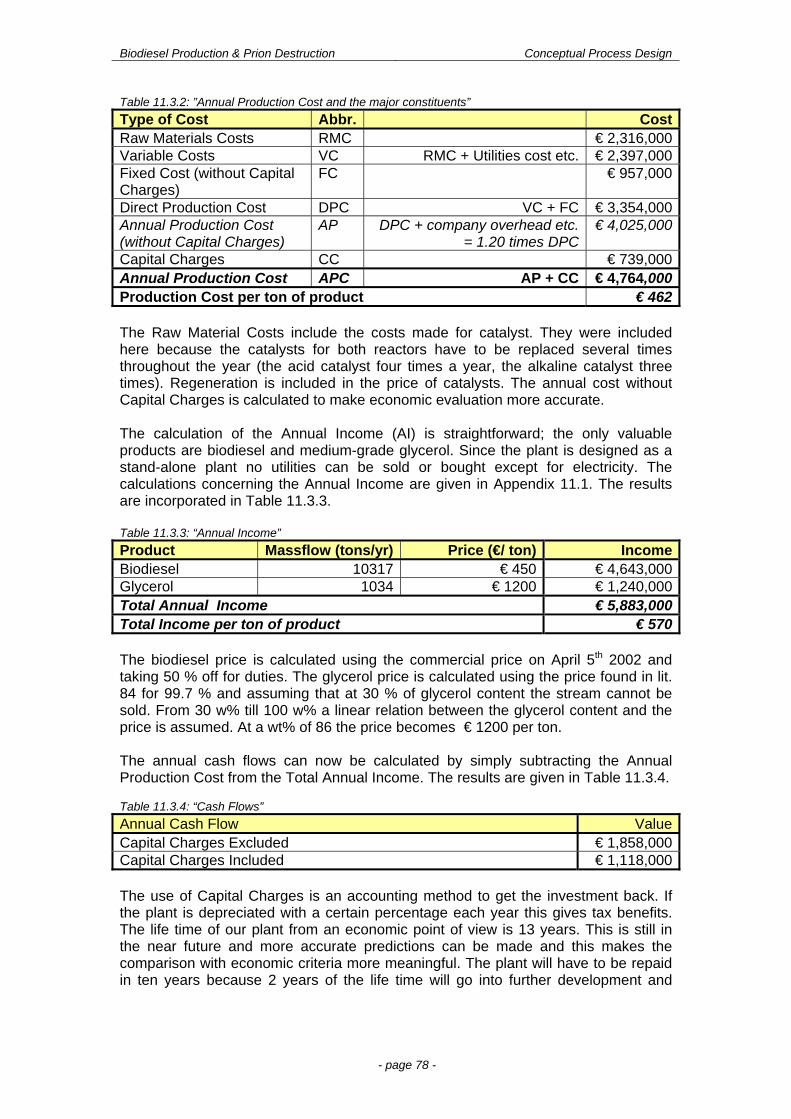
Biodiesel Production & Prion Destruction Conceptual Process Design
- page 78 -
Table 11.3.2: ”Annual Production Cost and the major constituents”
Type of Cost Abbr. CostRaw Materials Costs RMC € 2,316,000Variable Costs VC RMC + Utilities cost etc. € 2,397,000Fixed Cost (without Capital Charges)
FC € 957,000
Direct Production Cost DPC VC + FC € 3,354,000Annual Production Cost (without Capital Charges)
AP DPC + company overhead etc. = 1.20 times DPC
€ 4,025,000
Capital Charges CC € 739,000Annual Production Cost APC AP + CC € 4,764,000Production Cost per ton of product € 462 The Raw Material Costs include the costs made for catalyst. They were included here because the catalysts for both reactors have to be replaced several times throughout the year (the acid catalyst four times a year, the alkaline catalyst three times). Regeneration is included in the price of catalysts. The annual cost without Capital Charges is calculated to make economic evaluation more accurate. The calculation of the Annual Income (AI) is straightforward; the only valuable products are biodiesel and medium-grade glycerol. Since the plant is designed as a stand-alone plant no utilities can be sold or bought except for electricity. The calculations concerning the Annual Income are given in Appendix 11.1. The results are incorporated in Table 11.3.3. Table 11.3.3: “Annual Income”
Product Massflow (tons/yr) Price (€/ ton) IncomeBiodiesel 10317 € 450 € 4,643,000Glycerol 1034 € 1200 € 1,240,000Total Annual Income € 5,883,000Total Income per ton of product € 570 The biodiesel price is calculated using the commercial price on April 5th 2002 and taking 50 % off for duties. The glycerol price is calculated using the price found in lit. 84 for 99.7 % and assuming that at 30 % of glycerol content the stream cannot be sold. From 30 w% till 100 w% a linear relation between the glycerol content and the price is assumed. At a wt% of 86 the price becomes € 1200 per ton. The annual cash flows can now be calculated by simply subtracting the Annual Production Cost from the Total Annual Income. The results are given in Table 11.3.4. Table 11.3.4: “Cash Flows”
Annual Cash Flow ValueCapital Charges Excluded € 1,858,000Capital Charges Included € 1,118,000 The use of Capital Charges is an accounting method to get the investment back. If the plant is depreciated with a certain percentage each year this gives tax benefits. The life time of our plant from an economic point of view is 13 years. This is still in the near future and more accurate predictions can be made and this makes the comparison with economic criteria more meaningful. The plant will have to be repaid in ten years because 2 years of the life time will go into further development and
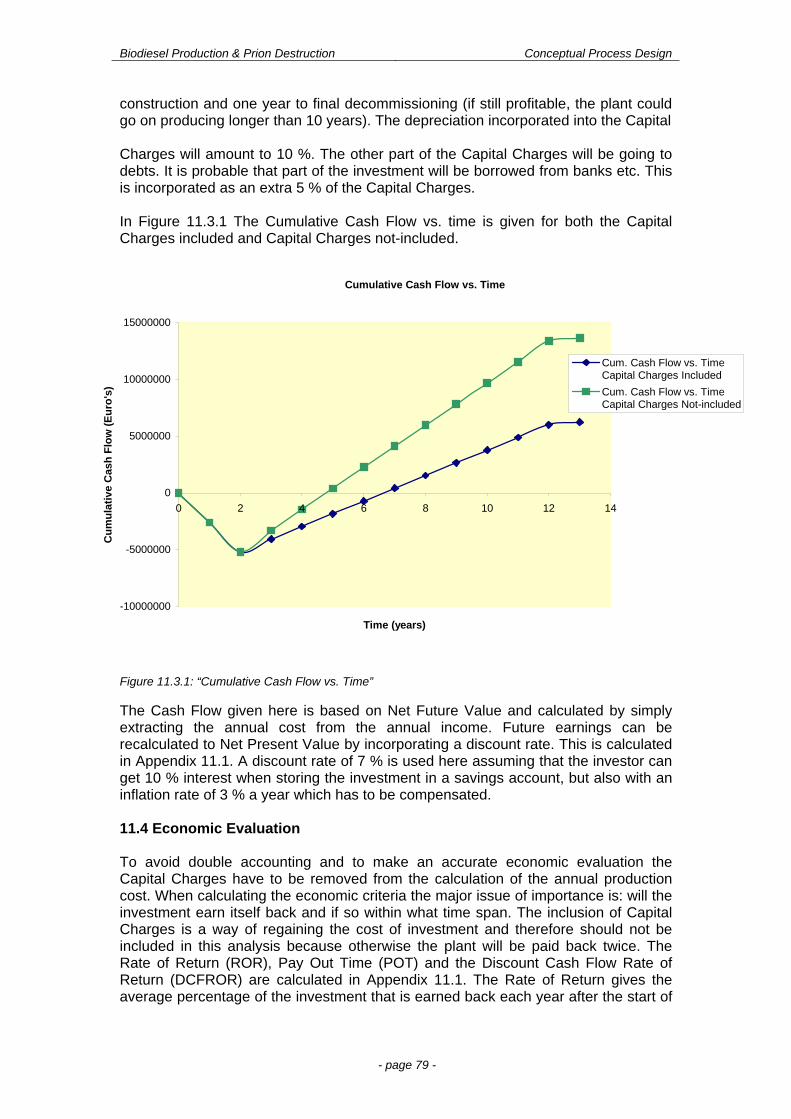
Biodiesel Production & Prion Destruction Conceptual Process Design
- page 79 -
construction and one year to final decommissioning (if still profitable, the plant could go on producing longer than 10 years). The depreciation incorporated into the Capital Charges will amount to 10 %. The other part of the Capital Charges will be going to debts. It is probable that part of the investment will be borrowed from banks etc. This is incorporated as an extra 5 % of the Capital Charges. In Figure 11.3.1 The Cumulative Cash Flow vs. time is given for both the Capital Charges included and Capital Charges not-included.
Figure 11.3.1: “Cumulative Cash Flow vs. Time” The Cash Flow given here is based on Net Future Value and calculated by simply extracting the annual cost from the annual income. Future earnings can be recalculated to Net Present Value by incorporating a discount rate. This is calculated in Appendix 11.1. A discount rate of 7 % is used here assuming that the investor can get 10 % interest when storing the investment in a savings account, but also with an inflation rate of 3 % a year which has to be compensated. 11.4 Economic Evaluation To avoid double accounting and to make an accurate economic evaluation the Capital Charges have to be removed from the calculation of the annual production cost. When calculating the economic criteria the major issue of importance is: will the investment earn itself back and if so within what time span. The inclusion of Capital Charges is a way of regaining the cost of investment and therefore should not be included in this analysis because otherwise the plant will be paid back twice. The Rate of Return (ROR), Pay Out Time (POT) and the Discount Cash Flow Rate of Return (DCFROR) are calculated in Appendix 11.1. The Rate of Return gives the average percentage of the investment that is earned back each year after the start of
Cumulative Cash Flow vs. Time
-10000000
-5000000
0
5000000
10000000
15000000
0 2 4 6 8 10 12 14
Time (years)
Cu
mu
lati
ve C
ash
Flo
w (
Eu
ro's
)
Cum. Cash Flow vs. TimeCapital Charges Included
Cum. Cash Flow vs. TimeCapital Charges Not-included
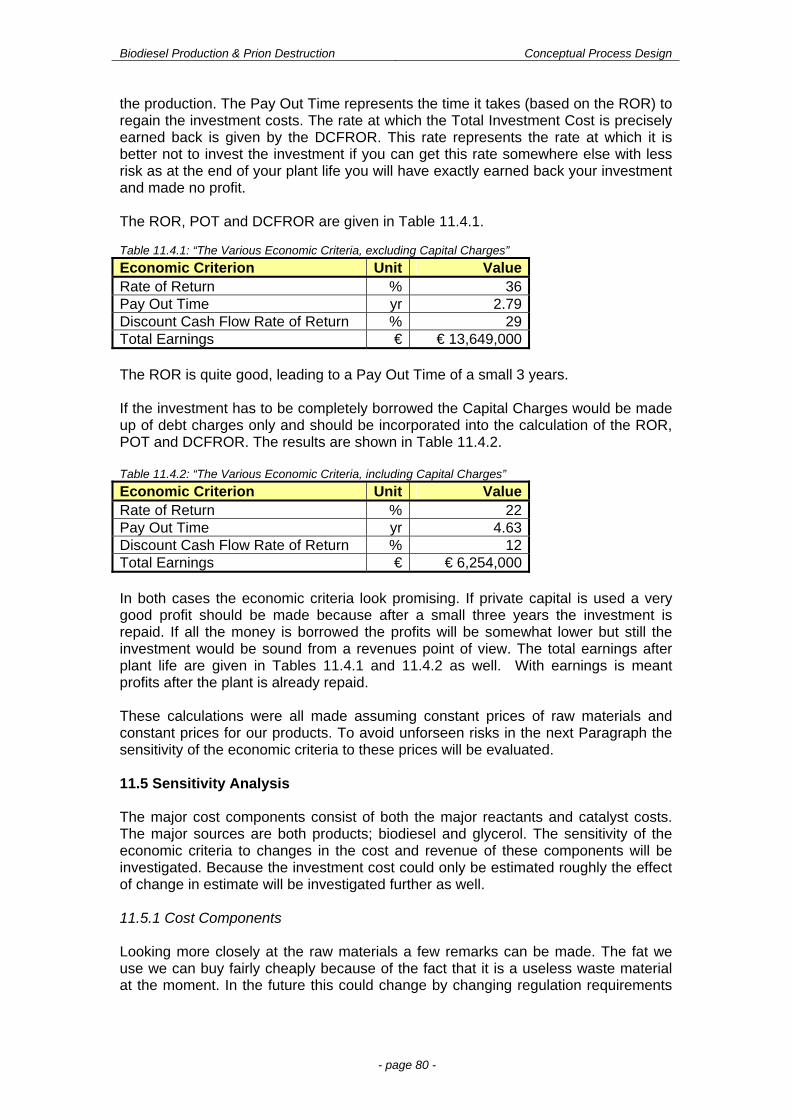
Biodiesel Production & Prion Destruction Conceptual Process Design
- page 80 -
the production. The Pay Out Time represents the time it takes (based on the ROR) to regain the investment costs. The rate at which the Total Investment Cost is precisely earned back is given by the DCFROR. This rate represents the rate at which it is better not to invest the investment if you can get this rate somewhere else with less risk as at the end of your plant life you will have exactly earned back your investment and made no profit. The ROR, POT and DCFROR are given in Table 11.4.1. Table 11.4.1: “The Various Economic Criteria, excluding Capital Charges”
Economic Criterion Unit ValueRate of Return % 36Pay Out Time yr 2.79Discount Cash Flow Rate of Return % 29Total Earnings € € 13,649,000 The ROR is quite good, leading to a Pay Out Time of a small 3 years. If the investment has to be completely borrowed the Capital Charges would be made up of debt charges only and should be incorporated into the calculation of the ROR, POT and DCFROR. The results are shown in Table 11.4.2. Table 11.4.2: “The Various Economic Criteria, including Capital Charges”
Economic Criterion Unit ValueRate of Return % 22Pay Out Time yr 4.63Discount Cash Flow Rate of Return % 12Total Earnings € € 6,254,000 In both cases the economic criteria look promising. If private capital is used a very good profit should be made because after a small three years the investment is repaid. If all the money is borrowed the profits will be somewhat lower but still the investment would be sound from a revenues point of view. The total earnings after plant life are given in Tables 11.4.1 and 11.4.2 as well. With earnings is meant profits after the plant is already repaid. These calculations were all made assuming constant prices of raw materials and constant prices for our products. To avoid unforseen risks in the next Paragraph the sensitivity of the economic criteria to these prices will be evaluated. 11.5 Sensitivity Analysis The major cost components consist of both the major reactants and catalyst costs. The major sources are both products; biodiesel and glycerol. The sensitivity of the economic criteria to changes in the cost and revenue of these components will be investigated. Because the investment cost could only be estimated roughly the effect of change in estimate will be investigated further as well. 11.5.1 Cost Components Looking more closely at the raw materials a few remarks can be made. The fat we use we can buy fairly cheaply because of the fact that it is a useless waste material at the moment. In the future this could change by changing regulation requirements
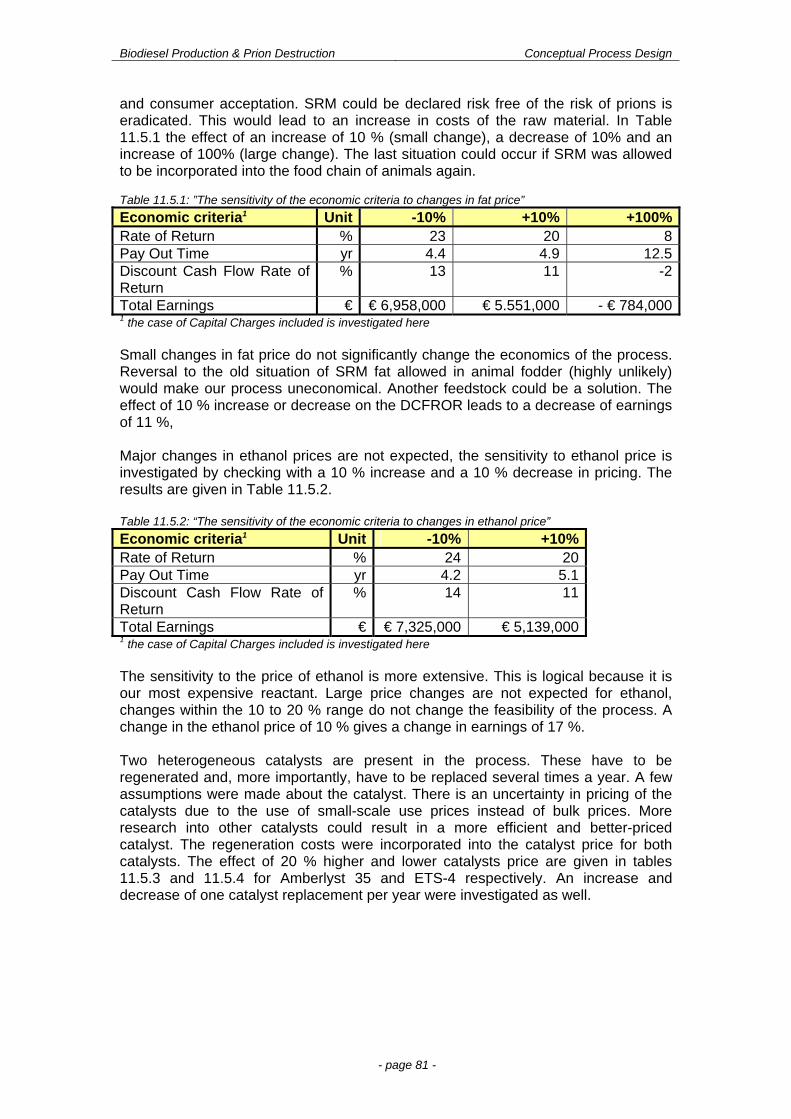
Biodiesel Production & Prion Destruction Conceptual Process Design
- page 81 -
and consumer acceptation. SRM could be declared risk free of the risk of prions is eradicated. This would lead to an increase in costs of the raw material. In Table 11.5.1 the effect of an increase of 10 % (small change), a decrease of 10% and an increase of 100% (large change). The last situation could occur if SRM was allowed to be incorporated into the food chain of animals again. Table 11.5.1: ”The sensitivity of the economic criteria to changes in fat price”
Economic criteria1 Unit -10% +10% +100%Rate of Return % 23 20 8Pay Out Time yr 4.4 4.9 12.5Discount Cash Flow Rate of Return
% 13 11 -2
Total Earnings € € 6,958,000 € 5.551,000 - € 784,0001 the case of Capital Charges included is investigated here Small changes in fat price do not significantly change the economics of the process. Reversal to the old situation of SRM fat allowed in animal fodder (highly unlikely) would make our process uneconomical. Another feedstock could be a solution. The effect of 10 % increase or decrease on the DCFROR leads to a decrease of earnings of 11 %, Major changes in ethanol prices are not expected, the sensitivity to ethanol price is investigated by checking with a 10 % increase and a 10 % decrease in pricing. The results are given in Table 11.5.2. Table 11.5.2: “The sensitivity of the economic criteria to changes in ethanol price”
Economic criteria1 Unit -10% +10% Rate of Return % 24 20 Pay Out Time yr 4.2 5.1 Discount Cash Flow Rate of Return
% 14 11
Total Earnings € € 7,325,000 € 5,139,000 1 the case of Capital Charges included is investigated here The sensitivity to the price of ethanol is more extensive. This is logical because it is our most expensive reactant. Large price changes are not expected for ethanol, changes within the 10 to 20 % range do not change the feasibility of the process. A change in the ethanol price of 10 % gives a change in earnings of 17 %. Two heterogeneous catalysts are present in the process. These have to be regenerated and, more importantly, have to be replaced several times a year. A few assumptions were made about the catalyst. There is an uncertainty in pricing of the catalysts due to the use of small-scale use prices instead of bulk prices. More research into other catalysts could result in a more efficient and better-priced catalyst. The regeneration costs were incorporated into the catalyst price for both catalysts. The effect of 20 % higher and lower catalysts price are given in tables 11.5.3 and 11.5.4 for Amberlyst 35 and ETS-4 respectively. An increase and decrease of one catalyst replacement per year were investigated as well.
Biodiesel Production & Prion Destruction Conceptual Process Design
- page 82 -
Table 11.5.3: “The sensitivity of the economic criteria to changes in Amberlyst 35 WET price and replacement rate ”
Economic criteria1 Unit -20% +20% -1 Repl. +1 Repl. Rate of Return % 22 21 23 21Pay Out Time yr 4.5 4.8 4.4 4.9Discount Cash Flow Rate of Return
% 13 12 13 12
Total Earnings € € 6,664,000 € 5,845,000 € 6,769,000 € 5,746,0001 the case of Capital Charges included is investigated here The influence of the price of Amberlyst on the economics of the process is not extensive. Even at an increase of 20 % in catalyst price the economics are hardly affected. The same goes for an extra replacement of catalyst necessary per year. More research into this catalyst should still be done but is not critical. A change in Amberlyst price of 20 % leads to a change in earnings of only 7 %. Table 11.5.4: “The sensitivity of the economic criteria to changes in ETS-4 price and replacement rate ”
Economic criteria1 Unit -20% +20% -1 Repl. +1 Repl. Rate of Return % 24 19 26 17Pay Out Time yr 4.1 5.3 3.79 5.9Discount Cash Flow Rate of Return
% 15 10 16 8
Total Earnings € € 7,731,000 € 4,778,000 € 8,716,000 € 3,793,0001 the case of Capital Charges included is investigated here The influence of the price of this catalyst is larger than for Amberlyst as more of this catalyst is used. The effect of an extra catalyst replacement per year is even larger. More research into this catalyst and others like it is highly recommended. The change of 20 % in catalyst price leads to a change in earnings of about 24 %. 11.5.2 Sensitivity of the Economics to Biodiesel Price The price at which the economics was calculated were half the price of commercial diesel on April 5th 2002, which gives € 450 per ton of diesel. The minimum diesel price for our process to be worth investing in is shown in Figure 11.5.1. The actual income for an oil company on diesel on April 10 2002 was € 257 per metric ton of diesel (lit. C04). This means that at the current diesel prices the process is not profitable. The conditions under which the process will become profitable are given in Paragraph 11.6.
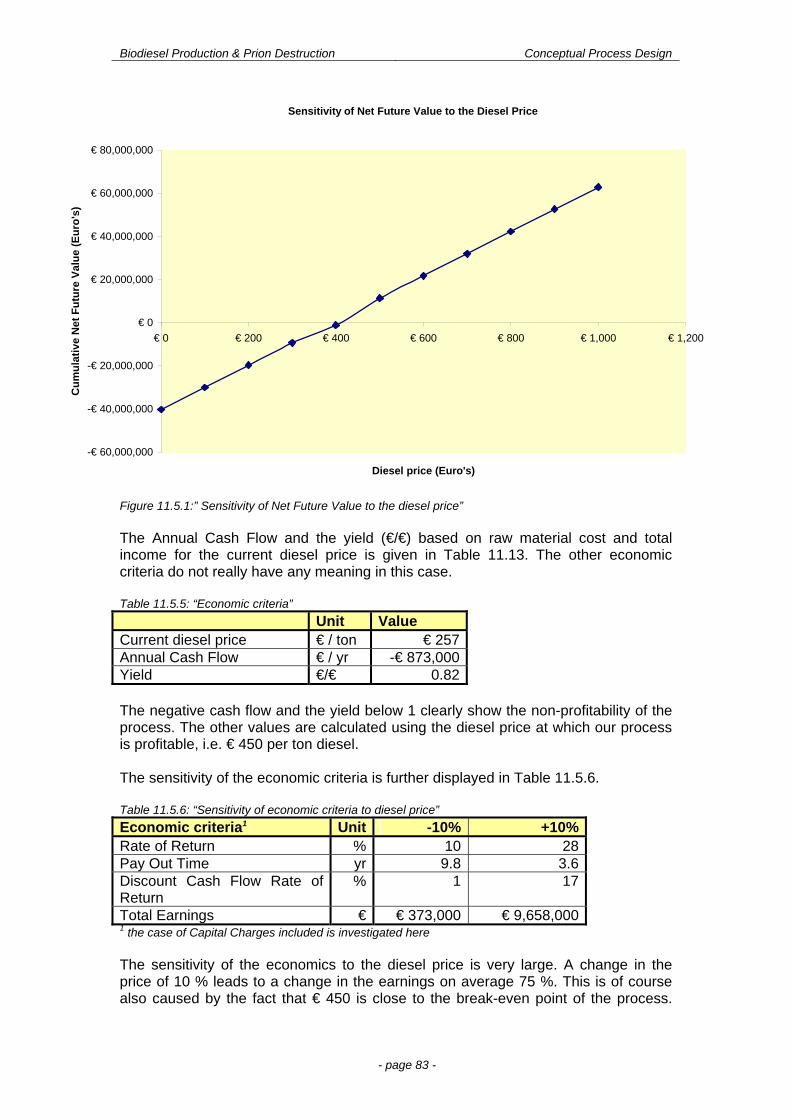
Biodiesel Production & Prion Destruction Conceptual Process Design
- page 83 -
Figure 11.5.1:” Sensitivity of Net Future Value to the diesel price” The Annual Cash Flow and the yield (€/€) based on raw material cost and total income for the current diesel price is given in Table 11.13. The other economic criteria do not really have any meaning in this case. Table 11.5.5: “Economic criteria”
Unit Value Current diesel price € / ton € 257Annual Cash Flow € / yr -€ 873,000Yield €/€ 0.82 The negative cash flow and the yield below 1 clearly show the non-profitability of the process. The other values are calculated using the diesel price at which our process is profitable, i.e. € 450 per ton diesel. The sensitivity of the economic criteria is further displayed in Table 11.5.6. Table 11.5.6: “Sensitivity of economic criteria to diesel price”
Economic criteria1 Unit -10% +10% Rate of Return % 10 28 Pay Out Time yr 9.8 3.6 Discount Cash Flow Rate of Return
% 1 17
Total Earnings € € 373,000 € 9,658,000 1 the case of Capital Charges included is investigated here The sensitivity of the economics to the diesel price is very large. A change in the price of 10 % leads to a change in the earnings on average 75 %. This is of course also caused by the fact that € 450 is close to the break-even point of the process.
Sensitivity of Net Future Value to the Diesel Price
-€ 60,000,000
-€ 40,000,000
-€ 20,000,000
€ 0
€ 20,000,000
€ 40,000,000
€ 60,000,000
€ 80,000,000
€ 0 € 200 € 400 € 600 € 800 € 1,000 € 1,200
Diesel price (Euro's)
Cu
mu
lati
ve N
et F
utu
re V
alu
e (E
uro
's)
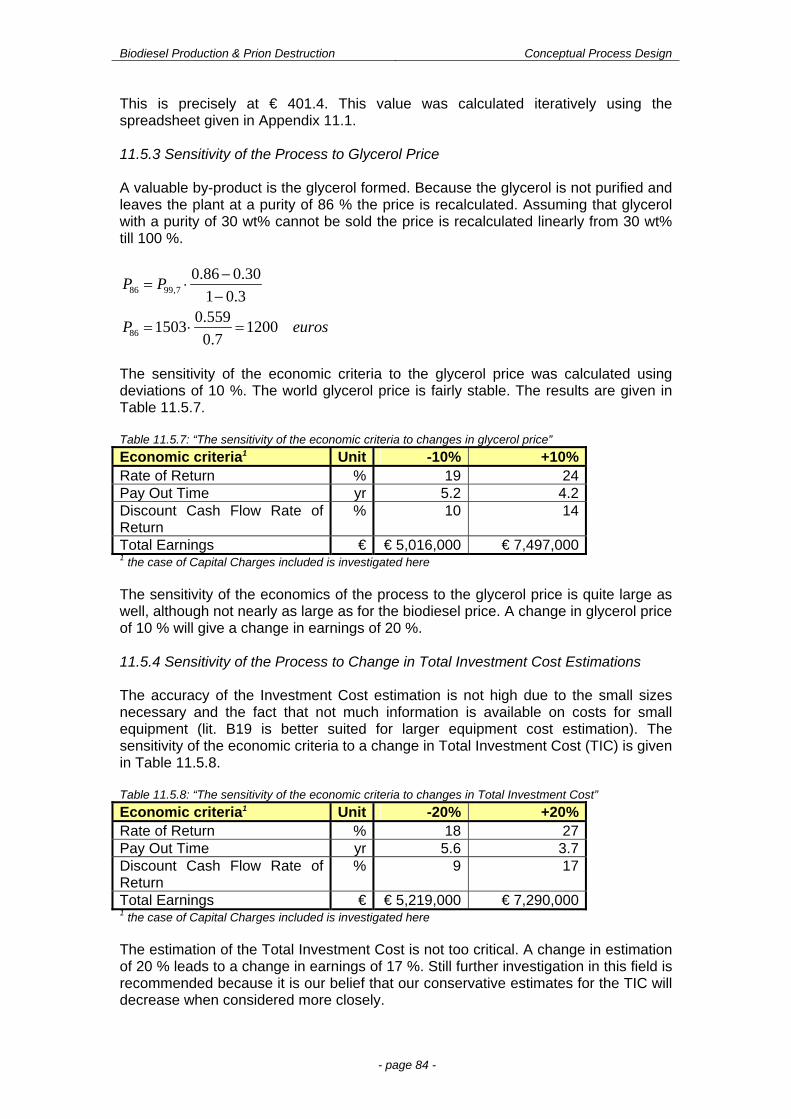
Biodiesel Production & Prion Destruction Conceptual Process Design
- page 84 -
This is precisely at € 401.4. This value was calculated iteratively using the spreadsheet given in Appendix 11.1. 11.5.3 Sensitivity of the Process to Glycerol Price A valuable by-product is the glycerol formed. Because the glycerol is not purified and leaves the plant at a purity of 86 % the price is recalculated. Assuming that glycerol with a purity of 30 wt% cannot be sold the price is recalculated linearly from 30 wt% till 100 %.
86 99,7
86
0.86 0.30
1 0.30.559
1503 12000.7
P P
P euros
The sensitivity of the economic criteria to the glycerol price was calculated using deviations of 10 %. The world glycerol price is fairly stable. The results are given in Table 11.5.7. Table 11.5.7: “The sensitivity of the economic criteria to changes in glycerol price”
Economic criteria1 Unit -10% +10% Rate of Return % 19 24 Pay Out Time yr 5.2 4.2 Discount Cash Flow Rate of Return
% 10 14
Total Earnings € € 5,016,000 € 7,497,000 1 the case of Capital Charges included is investigated here The sensitivity of the economics of the process to the glycerol price is quite large as well, although not nearly as large as for the biodiesel price. A change in glycerol price of 10 % will give a change in earnings of 20 %. 11.5.4 Sensitivity of the Process to Change in Total Investment Cost Estimations The accuracy of the Investment Cost estimation is not high due to the small sizes necessary and the fact that not much information is available on costs for small equipment (lit. B19 is better suited for larger equipment cost estimation). The sensitivity of the economic criteria to a change in Total Investment Cost (TIC) is given in Table 11.5.8. Table 11.5.8: “The sensitivity of the economic criteria to changes in Total Investment Cost”
Economic criteria1 Unit -20% +20% Rate of Return % 18 27 Pay Out Time yr 5.6 3.7 Discount Cash Flow Rate of Return
% 9 17
Total Earnings € € 5,219,000 € 7,290,000 1 the case of Capital Charges included is investigated here The estimation of the Total Investment Cost is not too critical. A change in estimation of 20 % leads to a change in earnings of 17 %. Still further investigation in this field is recommended because it is our belief that our conservative estimates for the TIC will decrease when considered more closely.
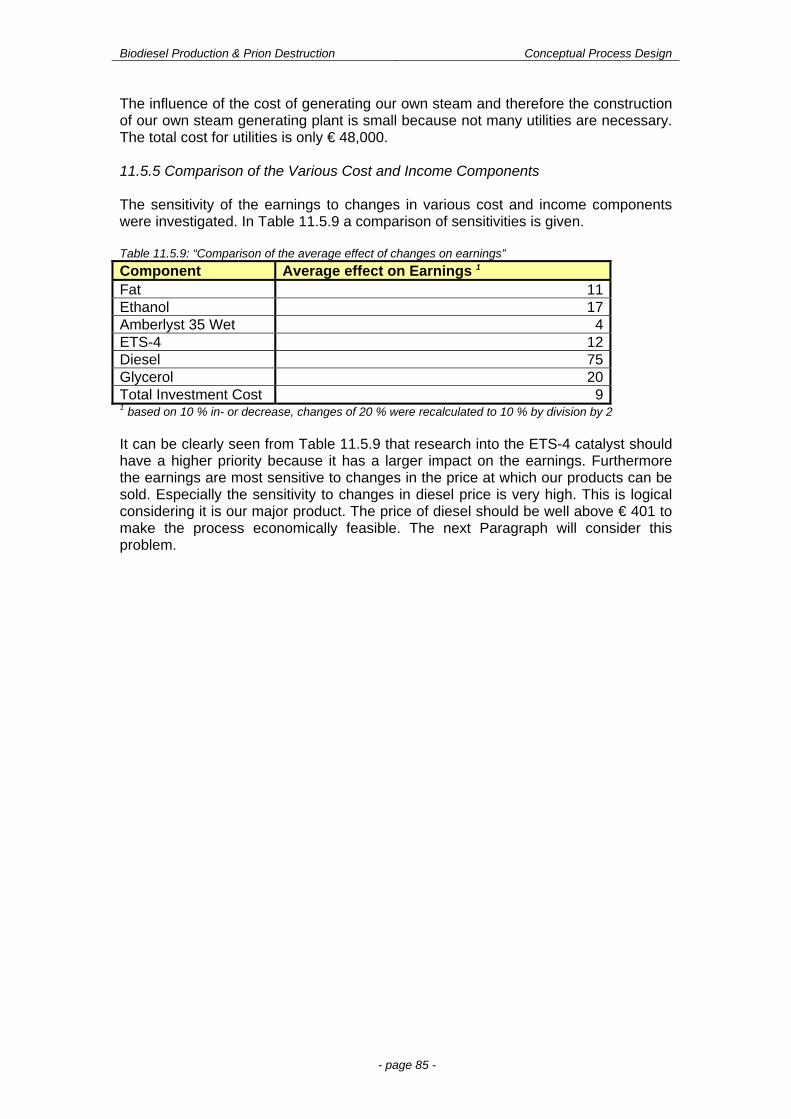
Biodiesel Production & Prion Destruction Conceptual Process Design
- page 85 -
The influence of the cost of generating our own steam and therefore the construction of our own steam generating plant is small because not many utilities are necessary. The total cost for utilities is only € 48,000. 11.5.5 Comparison of the Various Cost and Income Components The sensitivity of the earnings to changes in various cost and income components were investigated. In Table 11.5.9 a comparison of sensitivities is given. Table 11.5.9: “Comparison of the average effect of changes on earnings”
Component Average effect on Earnings 1
Fat 11 Ethanol 17 Amberlyst 35 Wet 4 ETS-4 12 Diesel 75 Glycerol 20 Total Investment Cost 9 1 based on 10 % in- or decrease, changes of 20 % were recalculated to 10 % by division by 2 It can be clearly seen from Table 11.5.9 that research into the ETS-4 catalyst should have a higher priority because it has a larger impact on the earnings. Furthermore the earnings are most sensitive to changes in the price at which our products can be sold. Especially the sensitivity to changes in diesel price is very high. This is logical considering it is our major product. The price of diesel should be well above € 401 to make the process economically feasible. The next Paragraph will consider this problem.
Biodiesel Production & Prion Destruction Conceptual Process Design
- page 86 -
11.6 Conditions at which the process will be economically feasible The current diesel price does not warrant the investment necessary for this project. This situation can be changed in three ways based on diesel price only:
1) The diesel price could increase due to forces on the market. This will be the case if the shortages in fossil fuel become more critical. This could take some time. ECN (“Netherlands Energy Research Foundation”) predicts in a report from 1996 (lit. B36) that the current fossil fuel reserves should sustain projected worldwide demand for at least 25 years; still more oil reserves are discovered today. The price of diesel fuel will only gradually increase in the following ten years unless crises like the oil crises in the mid and late seventies occur.
2) Because of the 100% certain prion destruction our process is a good solution to the current disposal problem of SRM fat. Furthermore the member states of the EU have to incorporate 2 % of biodiesel fuel in the diesel consumption by the year 2005 (lit. C3). These are good incentives to grant a subsidy to the production of biodiesel in the Netherlands.
3) The third way is by an (partial) exemption from duties on the biodiesel. If we can receive an approximately 33 % cut in duties on our biodiesel the economics calculated above are valid for our process.
It is imperative that prion destruction is certain to get a subsidy or duty cut or even a permit for the plant. The possibility of higher quality glycerol coming from the plant is not a good option for increasing profitability because the maximum price we can get for glycerol is € 1503. This will still give a negative Annual Cash Flow (based on Net Future Earnings) of € 559,000. It could be a component in further optimization. Another possibility is to look at the effect of economy of scale. Fuel production is performed in large-scale refineries. Looking at our process an economy of scale is to be expected. If the feed rate is increased by 2 for example the second reactor has to have twice the volume it now has (56,5 m3 to 113 m3), the price of the column will only increase from € 215,000 to € 303,000 (B19, average between 2 and 2.5 m diameter at 18 mm thickness and 30 m length). This will probably hold for the total process although the effects will be less drastic. More research in this field is recommended. In the future the public incentive to use fuels from a sustainable source is likely to grow. The incentive for using biodiesel will grow as well. In view of this further research in the production of biodiesel from animal fat and vegetable oil should be recommended even if it is at the time not economical.
Biodiesel Production & Prion Destruction Conceptual Process Design
- page 87 -
11.7 Options for Cost Reduction The reactor configuration now chosen is two large columns with the pre-esterification in one (R01) and the transesterification in the other (R02). These columns became quite large because of flooding considerations. An option could be to use a series of smaller columns instead. This would increase the number of vessels but reduce the overall volume necessary. This could increase or decrease the Total Investment Cost. If steam from the wastewater plant is used instead of an extra steam kettle the cost can be further reduced. Steam from the waste water facility is perfectly safe and should be enough for the steam requirements of our process. To avoid giving even the appearance of a possibility of prions going with the steam back into the process an extra steamkettle was included. The Investment Cost will be reduced by € 4,500 if this steam kettle is removed, the effect on the economics will be negligible. The excess of steam generated in our process could be used to generate electricity. Assuming all electricity needs can be generated by the excess steam (a reasonable assumption) and estimating the cost of the generator on the cost of a counter pressure turbo generator (lit. B19, page 117) at € 51,000 there is no cost reduction.
Biodiesel Production & Prion Destruction Conceptual Process Design
- page 88 -
12. Conclusions The Two-reactor heterogeneous process was chosen. This process combines the milder conditions of the alkaline process with the ease of waste removal of the hydrolysis process. But above all, this process is the most certain for the destruction of prions. This process uses two counter-current reactors with heterogeneous catalysts. The first reactor (R01) esterifies any free fatty acids present in the feed with ethanol at a temperature of 150C and a pressure of 5 bar, with a residence time of 90 minutes. The free fatty acids will no longer pose a problem in the second reactor (R02) where the triglycerides are transesterified with ethanol at 250C and 20 bar, with a residence time of 125 minutes. The conversion reached was set to be 98 % in (R01), a value obtained from literature P19. The conversion in the second reactor (R02) is almost total. The concentration of FAEE in the product stream after washing and glycerol separation is 99.5%. A working and partially optimized process structure was produced. The process flow sheet can be seen in Appendix 5.1. The equipment works well within the assumptions made. The equipment consists of several large units and many small units. This is because of the relatively small mass flow-rates through the system, although continuous processing is still warranted. Nearly all the major equipment is sized. As the assumptions made were conservative, probably most equipment is oversized. Process control is complete on a unit-level. On a plant-wide level it needs to be further implemented and optimized. The yields are 0.9476 tons fat / ton FAEE and 0.1739 tons ethanol / ton FAEE (for the other yields, see Appendix 5.4). The heat and mass balances are correct. Deviations can be explained by the separate modeling of the ether separation, and the melting enthalpy of the fat, which was not taken into account in the flowsheeting program. The biodiesel produced meets specifications on all points, if the assumptions made are correct. The economical yield is 0.82 € / € for biodiesel and glycerol combined if the current biodiesel price is taken. The contribution of the biodiesel to the yield is 0.56 € / € and the contribution of the glycerol 0.26 € / €. This process is not economically feasible. The feasibility increases drastically with subsidizing of the biodiesel, however. The break-even price, i.e. the price at which the process will become profitable, was calculated to be € 401. The price at which a DCFROR of 12 % is achieved is € 450. With this value the economics were calculated. A diesel price of € 450, which is still half of the consumer price gives a Rate of Return of 22%, which makes the Pay Out Time 4.6 years. The DCFROR is 12%, and the total earnings would be € 6,254,000. These values are valid when all capital for investments is borrowed. The economical performance of the process is very sensitive to the price of the products, especially the diesel price. With a duty reduction of ~33 % or subsidies the process becomes economical. The amount of waste produced is not large. The prion-contaminated water must undergo a heat treatment. A certified laboratory must check the final product for the presence of prions before it can be sold on the market (Appendix 1.2). The ether produced will be burned in a flare. The process is relatively safe. The most dangerous process unit is the transesterification reactor (R02), with a Fire and Explosion Index of 82.31. All units

Biodiesel Production & Prion Destruction Conceptual Process Design
- page 89 -
are in the mild to moderate hazard range (lit. B23). Several improvements were suggested during a HAZOP study, and largely implemented in process control.
Biodiesel Production & Prion Destruction Conceptual Process Design
- page 90 -
13. Recommendations The following recommendations are made, mostly on areas, which require more research: The supercritical process is a very promising new process for biodiesel production, and warrants further exploration. It does not guarantee prion destruction however and so was not used for this process. Though this design is considered to be a feasible option, a certain amount of research is necessary before it can be truly implemented. During the design a deplorable lack of thermodynamic data was encountered. A number of assumptions were made, especially in this category, that need to be checked. The properties of the fat and fatty acid ethyl esters in particular were largely uninvestigated in the literature. Solubilities are needed to determine the efficiency of the washing steps. The kinetics are unknown for our conditions, research should be done on the speed of the different steps. The catalyst needs to be optimized as well. Tests should be done with various catalysts, temperature dependence and mass transfer resistance needs to be determined, and the conversion possible with each different catalyst. The frequency of regeneration and cost per kilo of catalyst will also have to be considered when choosing the best catalyst. And the final product should be investigated to determine whether additives are necessary to improve the properties and make it useable as diesel fuel. Not enough time was available to fully optimize all flow parameters. The glycerol stream leaving the decanter is fairly pure and only contaminated with ethanol, which should not be difficult to remove using a simple distillation column. Also more water recovery is possible than was shown in this design, such as the reuse of the water from the heat-treatment section. In the design of the sections of the plant surrounding the reactors, reasonably standard equipment and methods were used. Other equipment could be considered. Desiccants could be used for drying, for instance, instead of a dryer with low pressure and high temperature. There are a number of different methods to clean the fat that might be interesting as well. For the economical evaluation the DACE price book (lit. B19) was used. This book only has the prices for large units, however. The actual prices of our equipment should be lower, as our equipment in general was far smaller than the units listed. More accurate sizing will also reduce costs. The economics of the process are sensitive to variations in the prices of the different feedstocks and products. The sensitivity to the pricing of the products is especially large. It would be good to investigate the possibility of running the same process at more moderate conditions, in the case that the prion-contaminated feedstock is no longer available or at a much higher price, and switching to a different feedstock becomes attractive. The possibility of obtaining duty cuts and subsidies from the Dutch government should be explored since the process does transform a useless and dangerous waste material (SRM fat) into a useful product (biodiesel).
Biodiesel Production & Prion Destruction Conceptual Process Design
- page 94 -
List of abbreviations AI Annual Income AP Annual Production cost (without capital charges) APC Annual Production Cost BOD Basis Of Design BP Boiling point BSE Bovine Spongiform Encephalopathy CC Capital Charges CPD Conceptual Process Design DCFROR Discount Cash Flow Rate Of Return DPC Direct Production Cost ECN Energieonderzoek Centrum Nederland (Energy Research
Foundation ) EN European Norm ETS-4 Type of zeolite catalyst from the Engelhard Company containing
titanium EU European Union FAEE Fatty Acid Ethyl Esters FAME Fatty Acid Methyl Esters FC Fixed Costs FC Flow Controller FCC Fixed Capital Cost FEI Fire and Explosion Index FFA Free Fatty Acids HAZOP Hazard and Operability ISO International Organization for Standardization LC Level Controller LD50 Lethal Dose 50 % LRM Low Risk Material MAC Maximum Acceptable Concentration MIC Maximum Investment Cost MP Melting Point MW Molecular Weight NFPA National Fire Protection Aggency OBL Ontwikkeling van Bio-ethanol uit Landbouwgrondstoffen
(Development of Bio Ethanol from Agricultural Resources) PC Pressure Controller PEC Purchased Equipment Cost PFS Process Flow Scheme POT Pay Out Time prEN Preliminary European Norm PSS Process Stream Summary PVA Poly Vinyl Alcohol QC Quality Controller RC Ratio Controller RMC Raw Material Cost ROR Rate Of Return SRM Specified Risk Material TC Temperature Controller

Biodiesel Production & Prion Destruction Conceptual Process Design
- page 95 -
TIC Total Investment Cost TSE Transmissible Spongiform Encephalopathies UNIFAC-HOC UNIFAC Hayden O’ Connell model VC Variable Costs
Biodiesel Production & Prion Destruction Conceptual Process Design
- page 96 -
List of symbols : Selectivity (-) : Angle of repose of catalyst particles (°) : Association factor for solvent (-)
: Mass flow (kg/hr)
m : Mass flow (kg/hr)
V : Volume fraction (-)
V : Volume flow (kg/hr)
i : Viscosity of component i (mNs/m2)
m : Viscosity of mixture (mNs/m2)
iv : Special diffusion volume coefficients (-)
i : Density of component i (kg/m3)
b : Density at boiling point (kg/m3)
l : Density of the liquid (kg/m3)
v : Density of the vapor (kg/m3)
: Average density of a mixture (kg/m3) : Surface tension (mJ/m2) : Residence time (s) A : Area (m2) B : Antoine coefficient (kJ/kmol) C : Antoine coefficient (K)
iC : Concentration (mol/l)
pC : Specific heat capacity (kJ/kg°C)
pC : Specific heat capacity for ideal gas (kJ/kg°C)
d: Diameter (m) D: Diameter (m)
vD : Vapor diffusivity (m2/s)
LD : Liquid diffusivity (m2/s) e: Column thickness (m) ehead: Thickness of head (m) f: Fouling factor (m2K/W) f: Design stress (N/mm2) F : Correction factor for heat exchangers (-) Fr: Fraction (-)
prF : Mass flow of ethanol to pre-esterification reactor (kg/s)
trF : Mass flow of ethanol to transesterification reactor (kg/s)
FATF : Total mass flow of fat after washing (kg/s) g: Gravitational constant (=9.807 m/s2) h : Heat transfer coefficient (Wm2/K) h , H: Height (m)
Biodiesel Production & Prion Destruction Conceptual Process Design
- page 97 -
j: Heat transfer factor (-) J: Flux (m2/s) k : Thermal conductivity (W/m°C) l,L: Length (m)
vL : Enthalpy of vaporization (kJ/kmol)
,v bL : Enthalpy of vaporization at normal boiling point (kJ/kmol)
iM : (Average) molecular mass of component i (g/mol)
Nu: Nusselt number Nf : Flammability value (-) Nh: Health value (-) Nr : Reactivity value (-) P : Pressure (bar, Pa)
iP : Design stress (Pa)
P: Power (W)
chP : Sugden’s parachor
Pr: Prandtl number (-)
rP : Reduced pressure (bar)
Q : Heat flow (W)
mQ : Mass flow rate (kg/s)
vQ : Volume flow rate (m3/s)
p : Pitch (m) r: Radius (m) Re: Reynolds number (-)
pS : Tray spacing (m)
residencet : Residence time (s)
T : Temperature (°C, K)
bT : Normal boiling point (K)
cT : Critical Temperature (K)
iT : Residence time (min)
rT : Reduced temperature (K) u,U: Velocity (m/s) U : Overall transfer heat coefficient (Wm2/K) X : Lockhart-Martinelli two-phase flow parameter V: Volume (m3)
mV : Molar volume (m3/kmol)
, , ,i i i iw x y z : Mass fraction of component i (-)
z : Compressibility constant (-) z : Height (m)