Embed Size (px)
Citation preview
CPAC Webinar Feb. 2009Process Spectroscopy and
Optical SensingBrian Marquardt Ph.D.Director – Applied Optical Sensing LabApplied Physics LabUniversity of WashingtonSeattle, Washington 98105
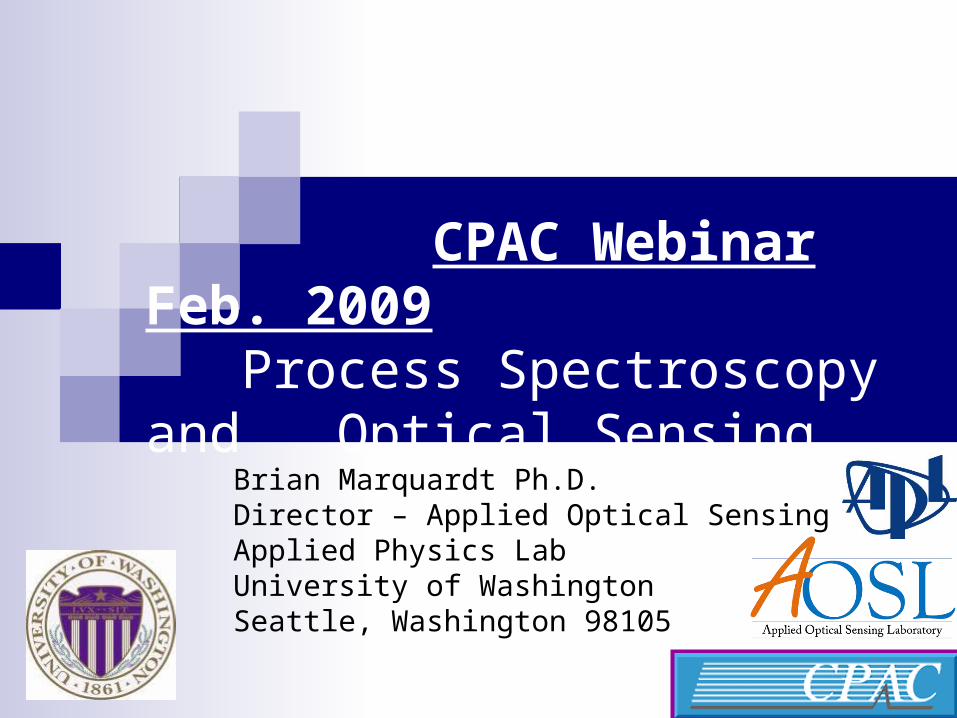
Process Raman Applications Pharmaceuticals Food quality and safety Polymers/coatings Fermentation/biotech Cellular/tissue Oil/fuels/petrochemicals Oceanography/environment Challenges
Reproducible sampling Fluorescence
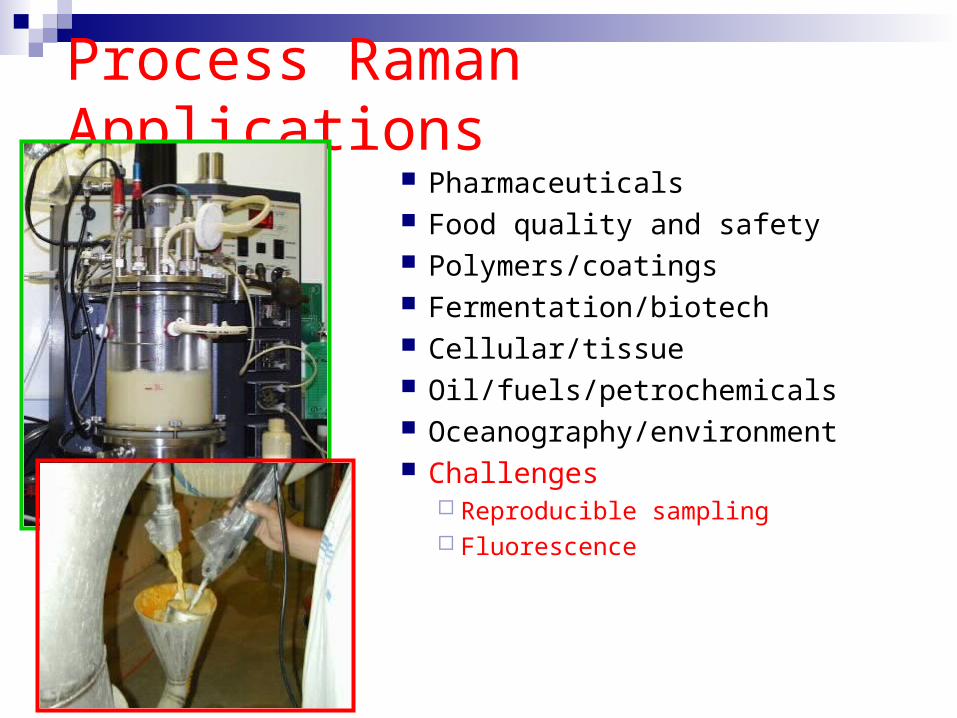
Quantitative Raman = Effective Sampling
• no moving parts• sapphire spherical lens• constant focal length and sample volume• probe is ALWAYS aligned when in contact with sample• effective sampling of liquids, slurries, powders, pastes and solids• high sampling precision allows it to be used effectively to monitor dynamic mixing systems (powder/slurry/particle)•improved measurement precision leads to robust multivariate calibration of process Raman data
CPAC developed, patented and licensed Raman ballprobe
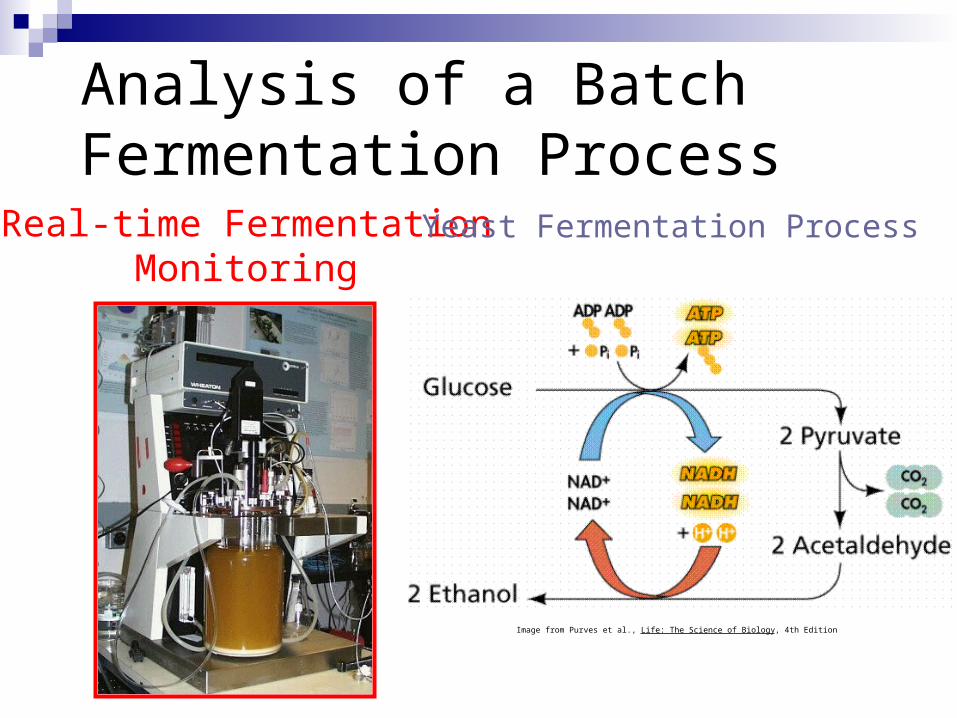
Real-time FermentationMonitoring
Image from Purves et al., Life: The Science of Biology, 4th Edition
Yeast Fermentation Process
Analysis of a Batch Fermentation Process
0 200 400 600 800 1000 1200 1400 1600 18000
500
1000
1500
2000
2500
3000
3500
Raman Shift (cm-1)
Inte
nsity
Fermentation Raw Raman Spectra
0 200 400 600 800 1000 1200 1400 1600 18000
500
1000
1500
2000
2500
3000
3500
Raman Shift (cm-1)
Inte
nsity
Fermentation Raw Raman Spectra
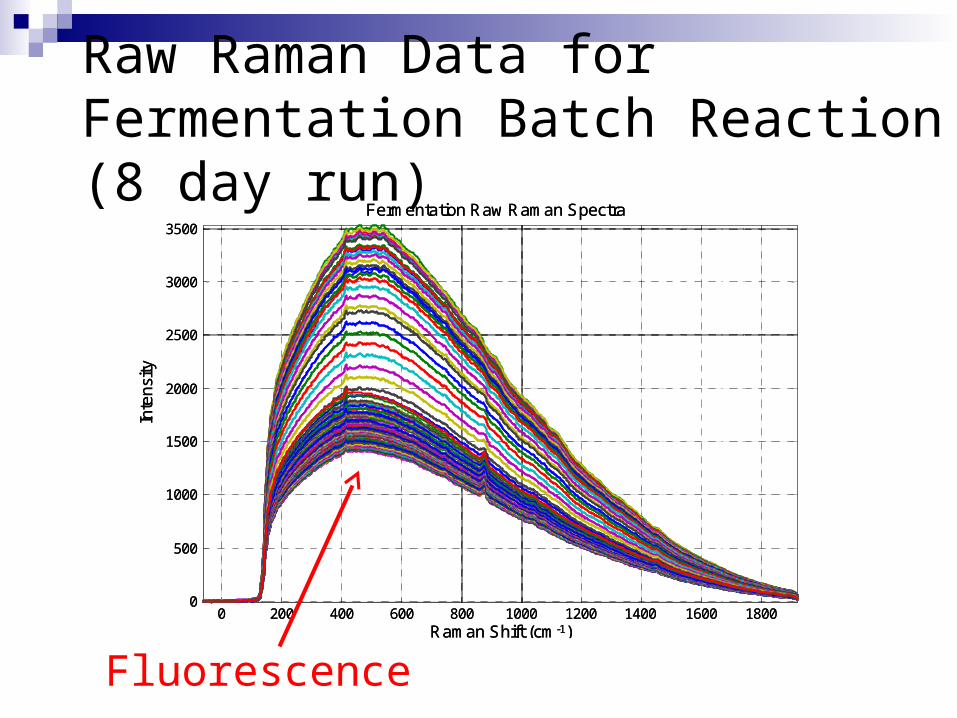
• 10 second acquisition, 20 accumulations, sample every 10 minutes • Analysis was run continuously for 8 days
Raw Raman Data for Fermentation Batch Reaction (8 day run)
Fluorescence
400 600 800 1000 1200 1400 1600 1800
-500
0
500
1000
1500
2000
2500
3000
3500
4000
4500
Raman Shift (cm-1)
Flu
ore
sc
en
ce
Co
rre
cte
d I
nte
ns
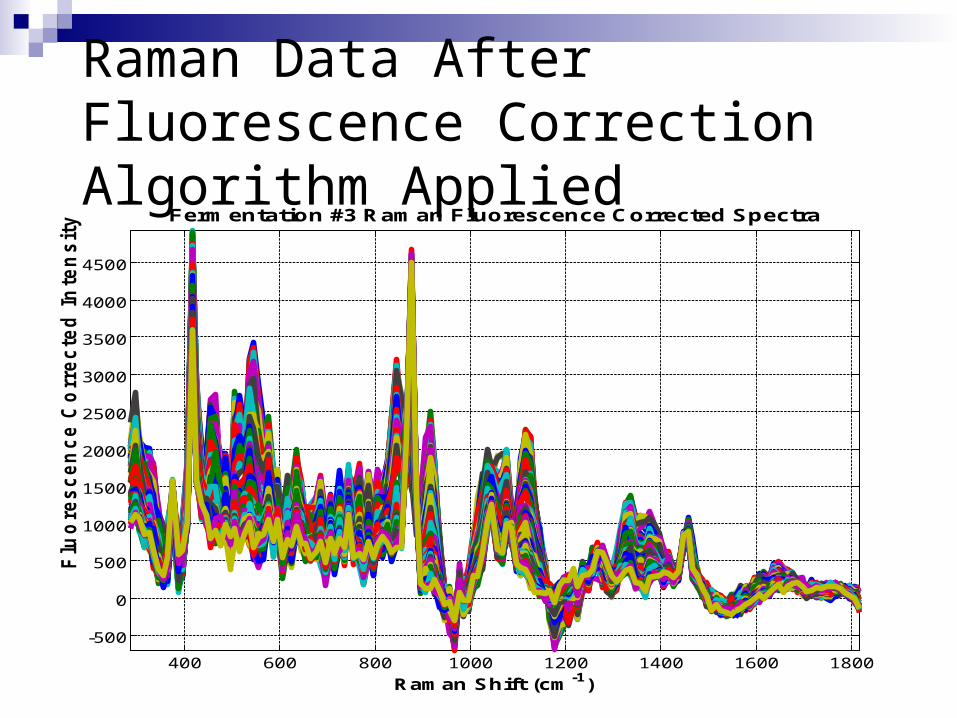
ity Fermentation #3 Raman Fluorescence Corrected Spectra
Raman Data After Fluorescence Correction Algorithm Applied
Brian Marquardt - confidential
Raman Shift (cm-1)
Inte
nsi
ty
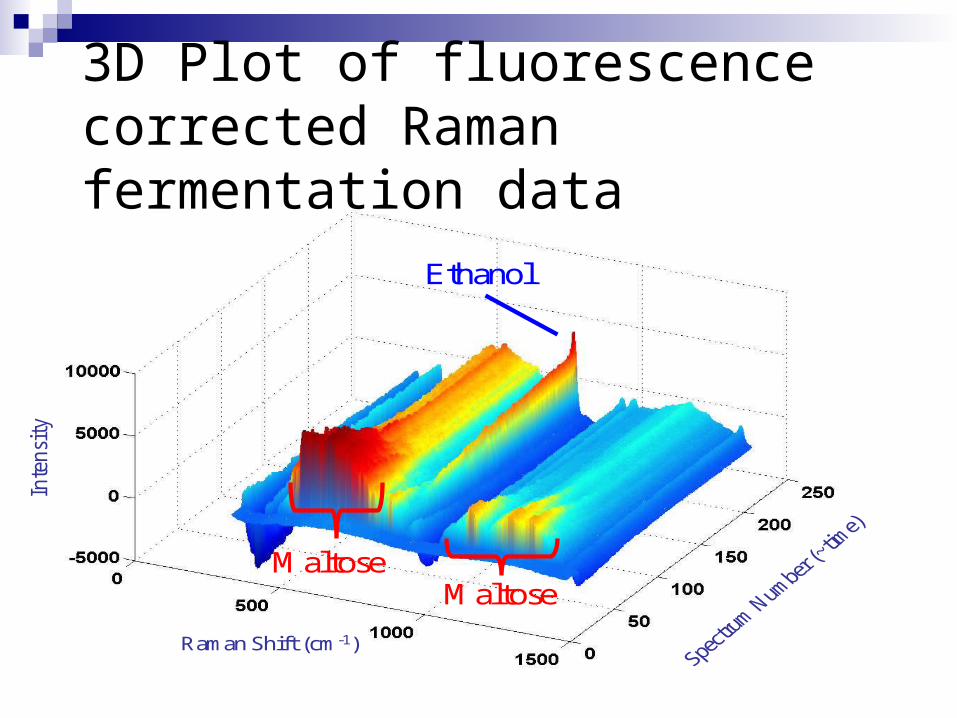
Maltose
Ethanol
Maltose
3D Plot of fluorescence corrected Raman fermentation data
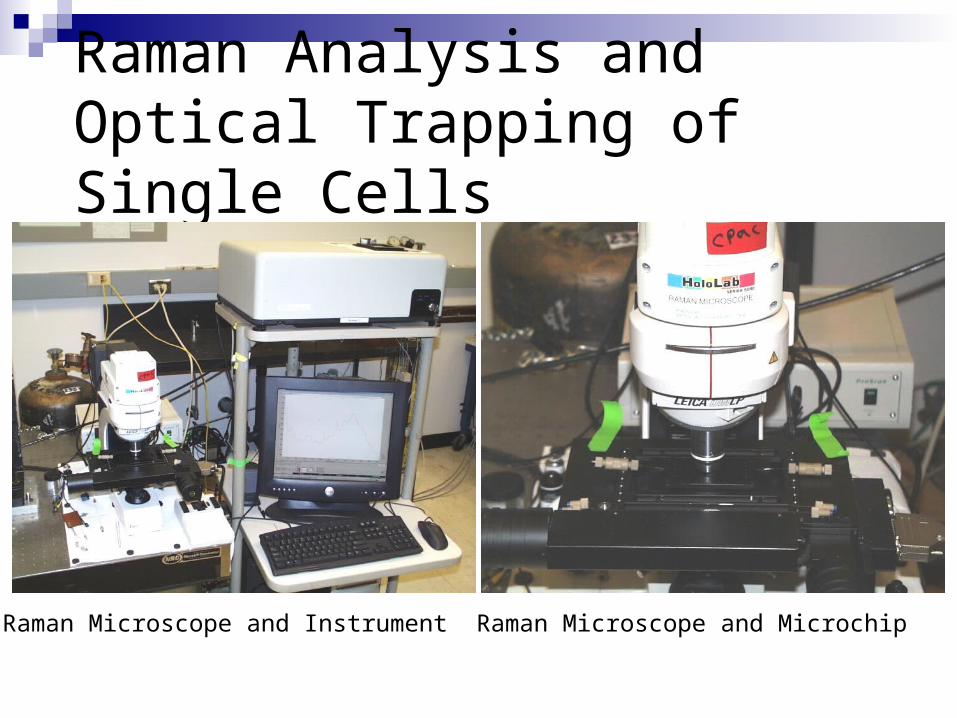
Raman Analysis and Optical Trapping of Single Cells
Raman Microscope and Instrument Raman Microscope and Microchip
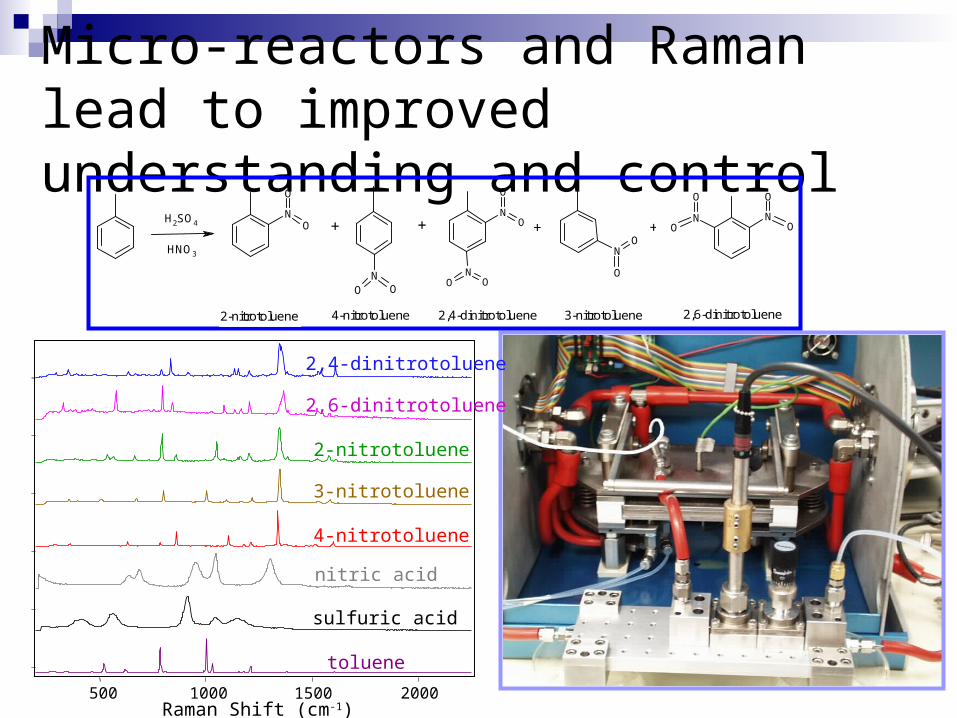
Micro-reactors and Raman lead to improved understanding and control
O
NO
NOO
ON
O
O
NO
N
O
O
O
NO
NOO
+ ++ +H2SO4
HNO3
2-nitrotoluene 4-nitrotoluene 2,4-dinitrotoluene 2,6-dinitrotoluene3-nitrotoluene
Raman Shift (cm-1) 500 1000 1500 2000
2,4-dinitrotoluene
2,6-dinitrotoluene
2-nitrotoluene
3-nitrotoluene
4-nitrotoluene
nitric acid
sulfuric acid
toluene
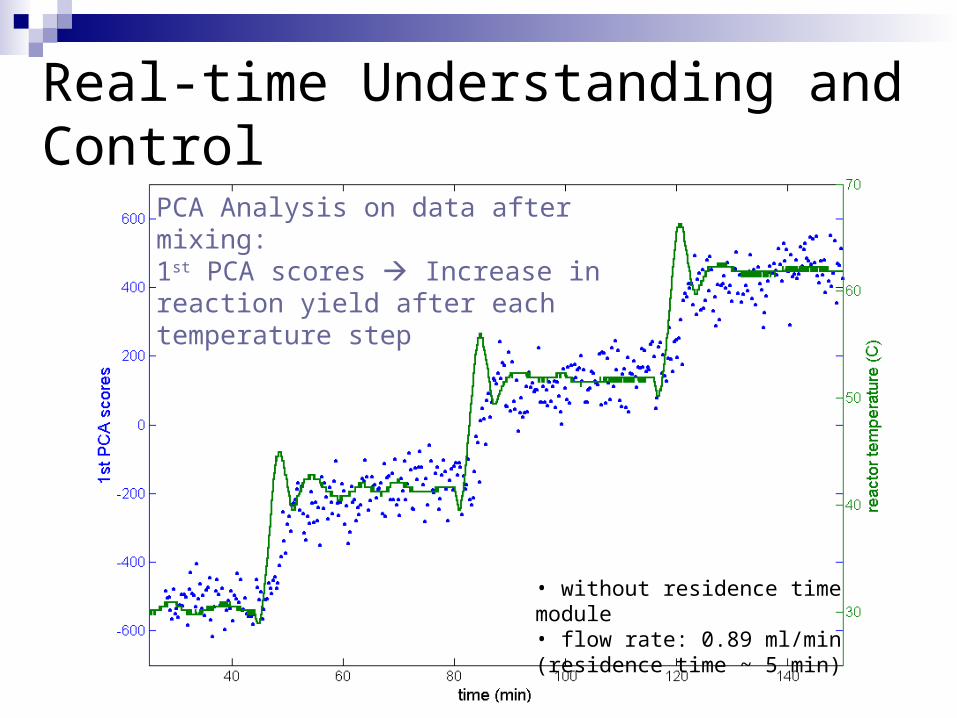
• without residence time module• flow rate: 0.89 ml/min (residence time ~ 5 min)
PCA Analysis on data after mixing:1st PCA scores Increase in reaction yield after each temperature step
Real-time Understanding and Control
CPAC/FDA/Corning MicroReactor
Goal: to improve reaction development and optimization through the use of continuous glass microreactors, NeSSI and analytics
Funded by the FDA to demonstrate the benefits of improved reactor design, effective sampling and online analytics to increase process understanding (QbD)
QbD Project began November 2008
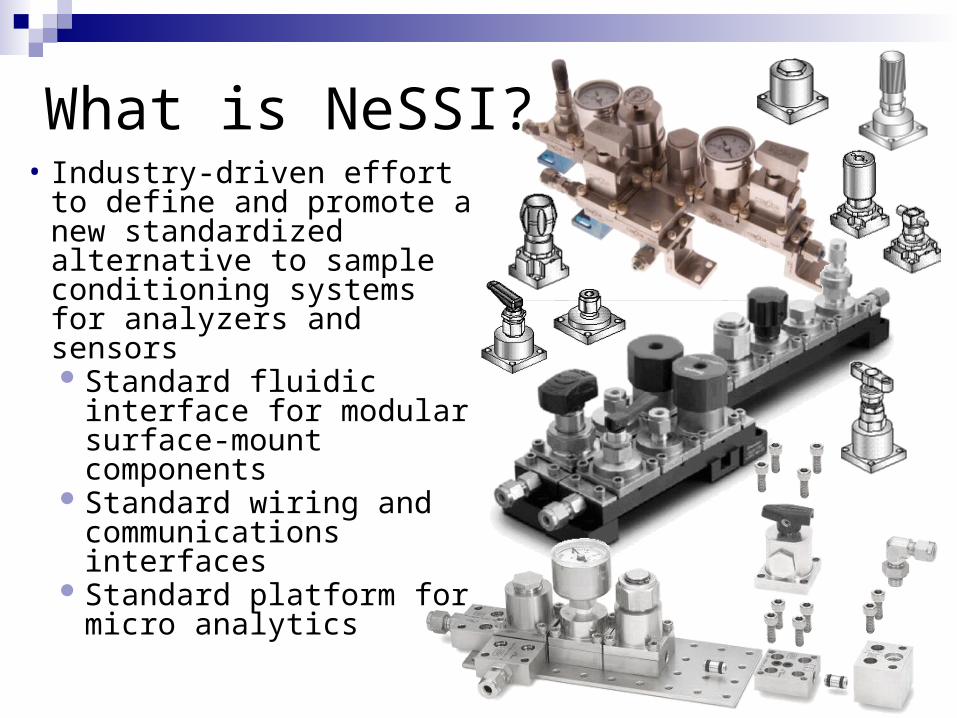
What is NeSSI?• Industry-driven effort to
define and promote a new standardized alternative to sample conditioning systems for analyzers and sensorsStandard fluidic interface
for modular surface-mount components
Standard wiring and communications interfaces
Standard platform formicro analytics
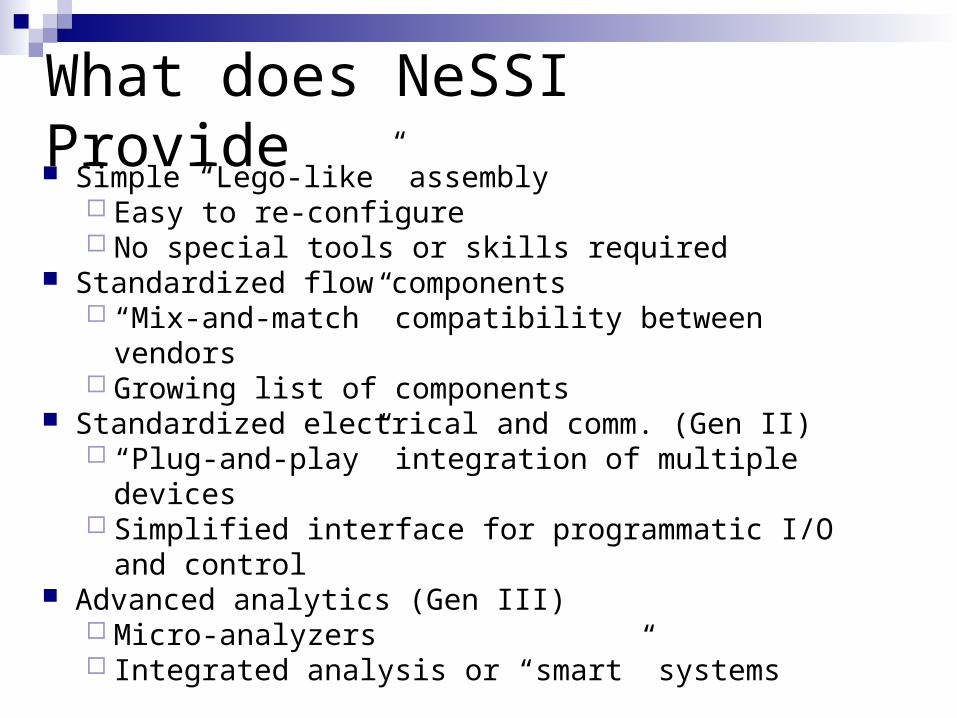
What does NeSSI Provide Simple “Lego-like” assembly
Easy to re-configure No special tools or skills required
Standardized flow components “Mix-and-match” compatibility between vendors Growing list of components
Standardized electrical and comm. (Gen II) “Plug-and-play” integration of multiple devices Simplified interface for programmatic I/O and control
Advanced analytics (Gen III) Micro-analyzers Integrated analysis or “smart” systems
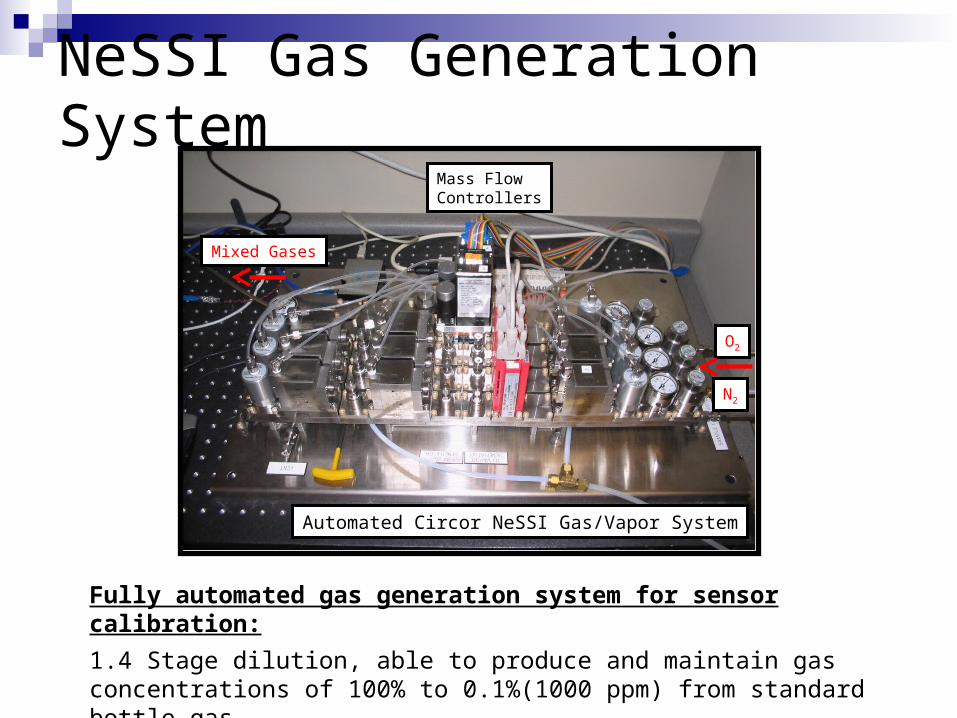
NeSSI Gas Generation System
Fully automated gas generation system for sensor calibration:
1.4 Stage dilution, able to produce and maintain gas concentrations of 100% to 0.1%(1000 ppm) from standard bottle gas2.Fully calibrated, automated system with set and forget capability
Automated Circor NeSSI Gas/Vapor System
N2
O2
Mixed Gases
Mass FlowControllers
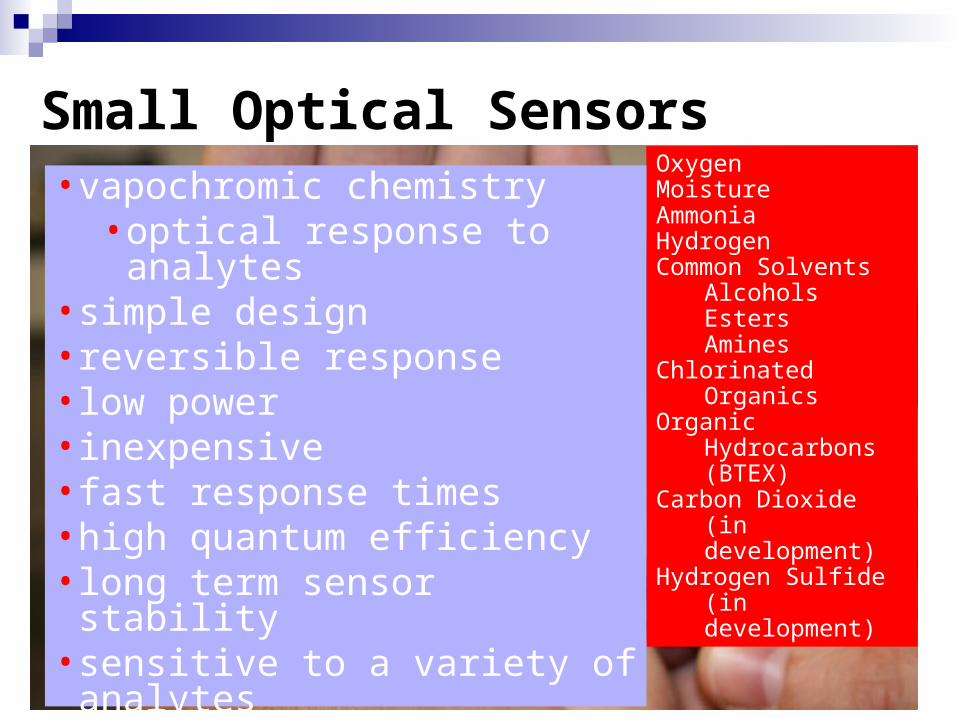
Small Optical SensorsOxygenMoistureAmmoniaHydrogenCommon Solvents
AlcoholsEstersAmines
Chlorinated OrganicsOrganic Hydrocarbons
(BTEX)Carbon Dioxide
(in development)Hydrogen Sulfide
(in development)
• vapochromic chemistry• optical response to analytes
• simple design• reversible response• low power• inexpensive• fast response times• high quantum efficiency• long term sensor stability• sensitive to a variety of analytes• wireless communication• battery powered
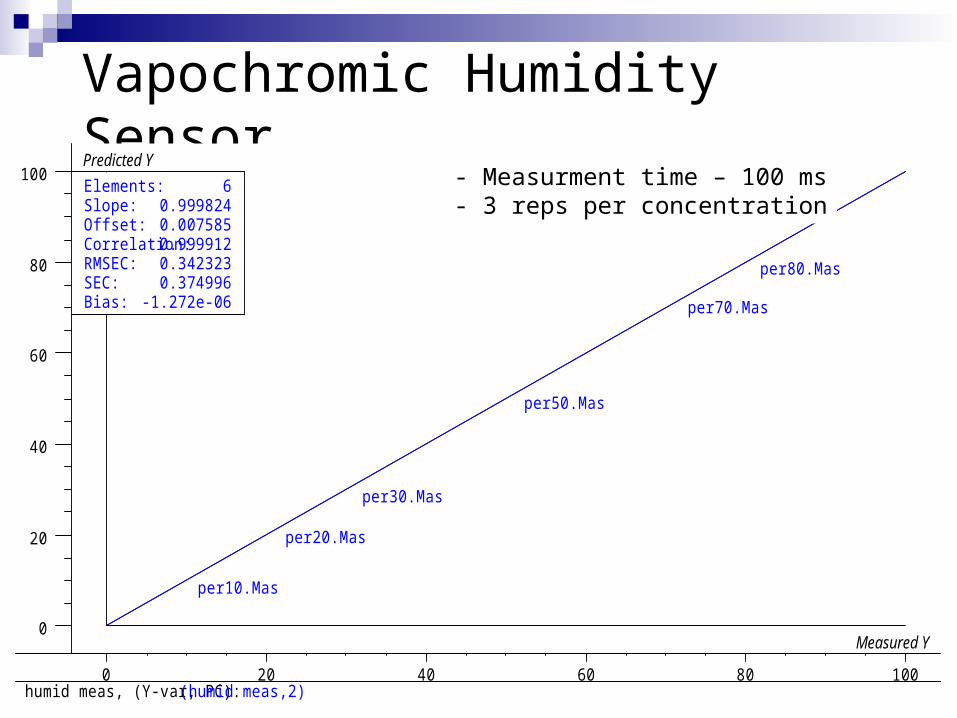
Vapochromic Humidity Sensor
0
20
40
60
80
100
0 20 40 60 80 100 humid meas, (Y-var, PC): (humid meas,2)
per10.Mas
per20.Mas
per30.Mas
per50.Mas
per70.Mas
per80.Mas
Elements:Slope:Offset:Correlation:RMSEC:SEC:Bias:
60.9998240.0075850.9999120.3423230.374996
-1.272e-06
Measured Y
Predicted Y- Measurment time – 100 ms- 3 reps per concentration
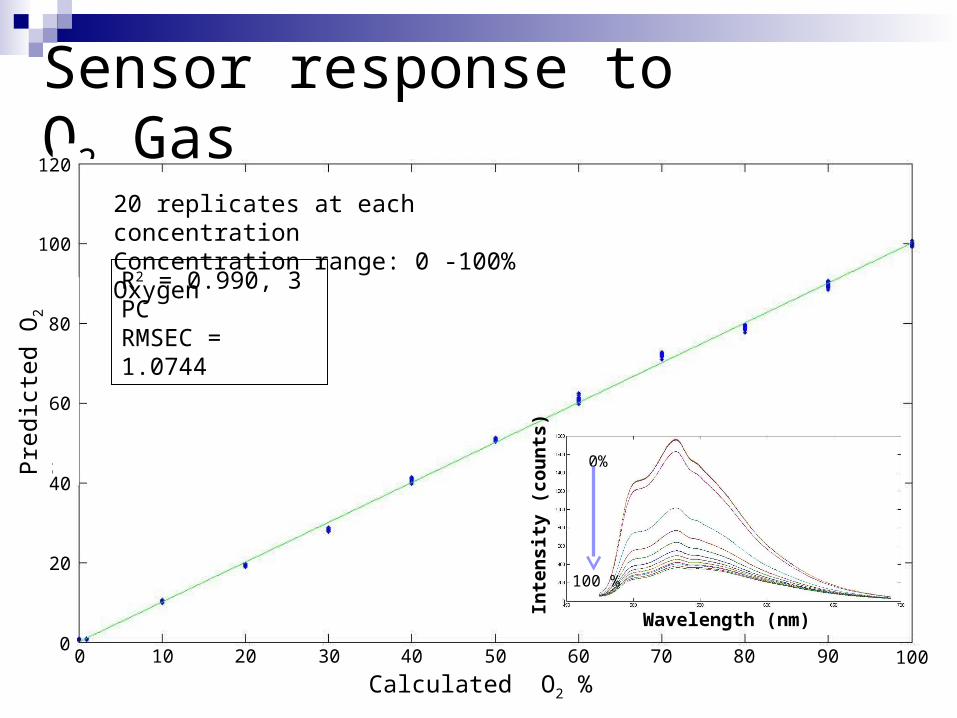
Sensor response to O2 Gas
Pre
dict
ed O
2 %
Calculated O2 %
R2 = 0.990, 3 PCRMSEC = 1.0744
20 replicates at each concentrationConcentration range: 0 -100% Oxygen
Inte
nsi
ty (
cou
nts
)
Wavelength (nm)
100 %
0%
120
100
80
60
40
20
01009080706050403020100
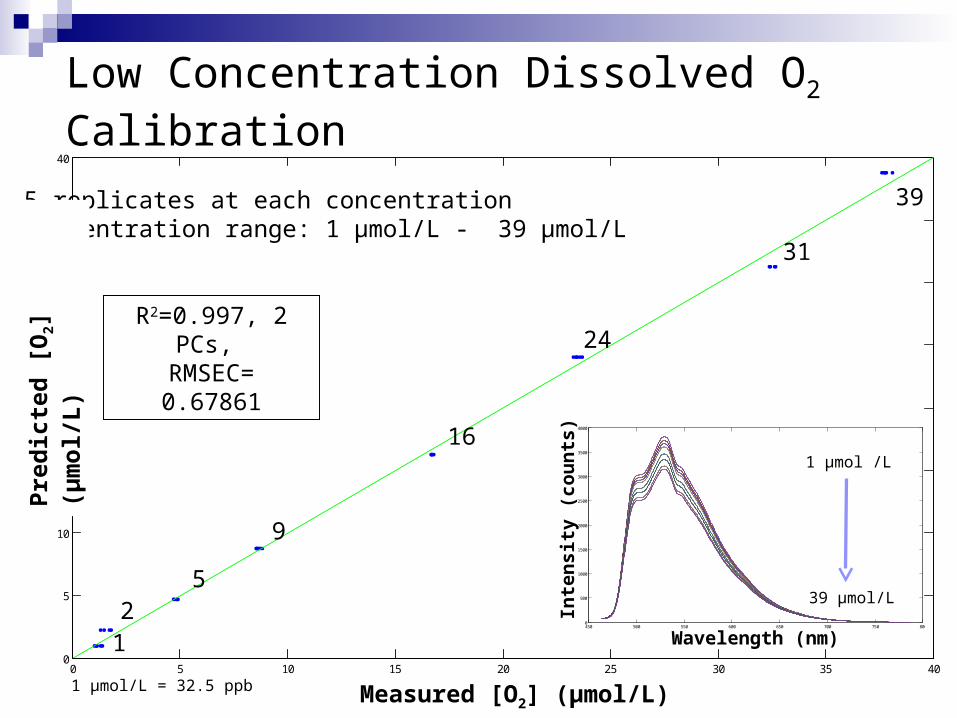
Low Concentration Dissolved O2 Calibration
0 5 10 15 20 25 30 35 400
5
10
15
20
25
30
35
40
Y Predicted 1
Y M
easu
red
1
Samples/Scores Plot of CTFOS5320to1300
R2 = 0.9972 Latent VariablesRMSEC = 0.67861
1
9
16
24
31
R2=0.997, 2 PCs, RMSEC= 0.67861
5 replicates at each concentrationConcentration range: 1 μmol/L - 39 μmol/L
Pre
dic
ted
[O
2] (
μm
ol/
L)
Measured [O2] (μmol/L)1 μmol/L = 32.5 ppb
39
450 500 550 600 650 700 750 8000
500
1000
1500
2000
2500
3000
3500
4000
39 μmol/L
1 μmol /L
Inte
nsi
ty (
cou
nts
)
Wavelength (nm)2
5
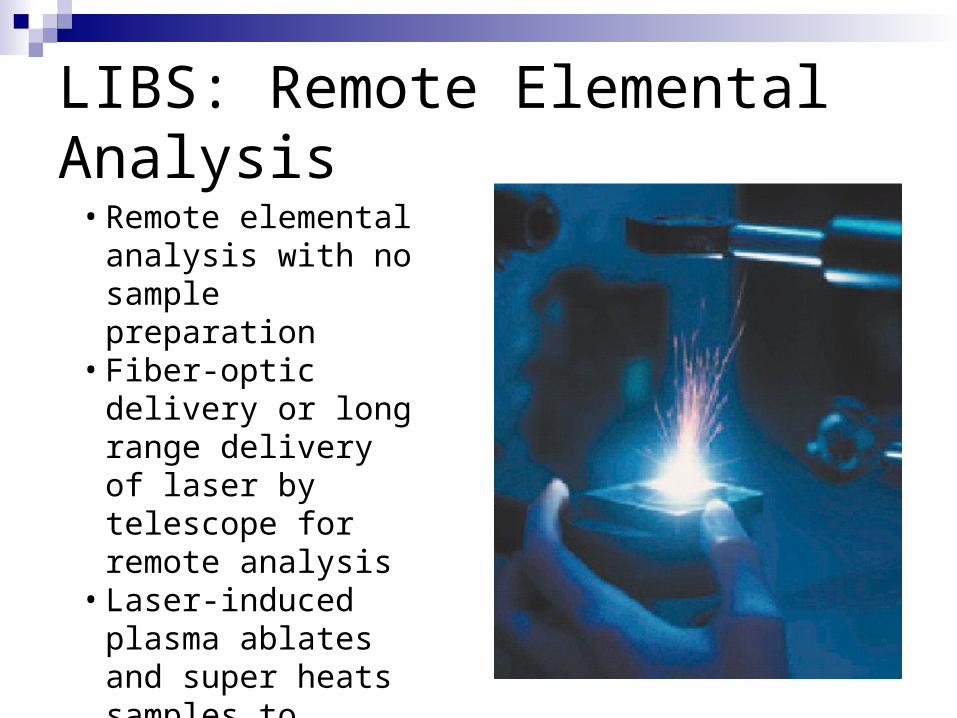
LIBS: Remote Elemental Analysis
• Remote elemental analysis with no sample preparation
• Fiber-optic delivery or long range delivery of laser by telescope for remote analysis
• Laser-induced plasma ablates and super heats samples to provide elemental spectral data
Potential Applications Analysis of metal complexes in food, cellulosic biomass,
pharmaceuticals and fermentation apps. Determination of ionic and inorganic species in a variety of
chemical/production processes Glasses, ceramics, zeolites, alloys, corrosion analysis
Quantitative analysis of catalyst composition for screening and development
Couple with vibrational techniques to develop a hyphenated technique (Raman/LIBS) to define both organic and inorganic analytes in a process system

Acknowledgements
CPAC Washington Tech. Center National Science Foundation National Institute of Health, Charlie Branham and Wes Thompson Many current and past CPAC sponsors