Embed Size (px)
Citation preview
CPA: A web-based platform for Consensus Pathway Analysisand interactive visualization
Supplementary Material
Hung Nguyen 1, Duc Tran 1, Jonathan M. Galazka 2, Sylvain V. Costes 2, AfshinBeheshti 3, Juli Petereit 4, Sorin Draghici 5, Tin Nguyen 1∗
1University of Nevada Reno, Department of Computer Science and Engineering, Reno,NV 89557, USA,
2NASA Ames Research Center, Space Biosciences Division, Moffett Field, CA 94035,USA,
3KBR, NASA Ames Research Center, Space Biosciences Division, Moffett Field, CA94035, USA,
4University of Nevada Reno, Nevada Bioinformatics Center, Reno, NV 89557, USA and5Wayne State University, Department of Computer Science, Detroit, MI 48202, USA
2
Contents
1 Pathway Analysis Methods 31.1 Over-representation analysis (ORA) . . . . . . . . . . . . . . . . . . . . . . . . . . . . . . 31.2 Gene set enrichment analysis (GSEA) . . . . . . . . . . . . . . . . . . . . . . . . . . . . . 31.3 Gene set analysis (GSA) . . . . . . . . . . . . . . . . . . . . . . . . . . . . . . . . . . . . . 31.4 Fast Gene Set Enrichment Analysis (FGSEA) . . . . . . . . . . . . . . . . . . . . . . . . . 41.5 Pathway analysis with down-weighting overlapping genes (PADOG) . . . . . . . . . . . . 41.6 Kolmogorov-Smirnov (KS) test . . . . . . . . . . . . . . . . . . . . . . . . . . . . . . . . . 41.7 Wilcoxon test . . . . . . . . . . . . . . . . . . . . . . . . . . . . . . . . . . . . . . . . . . . 41.8 Impact analysis . . . . . . . . . . . . . . . . . . . . . . . . . . . . . . . . . . . . . . . . . . 5
2 CPA Interface 5
3
1 Pathway Analysis Methods
Pathway analysis methods can be categorized into three classes. The earliest approaches use Over-Representation Analysis (ORA) [1–6] that identify the pathways in which the DE genes are over- orunder-represented. Functional Class Scoring (FCS) approaches [7–11] have been developed to addresssome of the issues raised by ORA approaches. The main improvement of FCS is based on the observationthat small but coordinated changes in expression of functionally related genes can have significant impacton pathways. However, both ORA and FCS still ignore the direction and type of the signals betweengenes, the positions and roles of the genes on each pathway, as well as all the other information capturedby the topology of the pathway. Topology-based (TB) approaches [12–19] which fully exploit all theknowledge about how gene interact as described by pathways, have been developed more recently.
Our website implements eight pathway analysis methods. They can be categorized into the above threecategories: i) Over-representation analysis; ii) Functional Class Scoring: Gene set enrichment analysis(GSEA), Gene set analysis (GSA), Fast Gene Set Enrichment Analysis (FGSEA), Pathway analysis withdown-weighting overlapping genes (PADOG), Kolmogorov-Smirnov (KS) test, and Wilcoxon (Wilcox)test; and iii) Topology-based: Impact Analysis. The detail about these methods are described in thefollowing subsections.
1.1 Over-representation analysis (ORA)
Over-representation analysis (ORA) [20] is a method that tests whether the number of differentiallyexpressed genes are over-represented in a gene set. The null hypothesis is that genes in the uploadedlist of differentially expressed (DE) genes are sampled from the same general population as genes fromthe reference set, i.e. the probability of observing a DE gene from a particular gene set GS is thesame as observing at other genes in the reference list. The alternative hypothesis is that the differentiallyexpressed genes are over- or under-represented in the gene set. ORA uses hypergeometric test to calculatethe p-value that represents how likely one can observes that many DE gene in the gene set just by chance.
1.2 Gene set enrichment analysis (GSEA)
The null hypothesis of GSEA [7, 21] is that “the rank ordering of genes in a given comparison is randomwith regard to the diagnostic categorization of the samples”. The alternative hypothesis is that “the rankordering of the pathway members is associated with the specific diagnostic criteria used to categorize thegroups of affected individuals” [21].
Denote N as the total number of genes, GSi as the ith gene set, ni as the number of genes in theithgeneset, (z1, z2, . . . , zni
) as the t-statistic of genes in the ith gene set. For gene set GSi, GSEA computesa score S(GSi) which essentially equals to a signed version of the Kolmogorov-Smirnov statistic betweenthe values zj (j ∈ GSi) and their complement. The samples then are permuted many times to build theempirical null distribution of the score for each gene set. The significance of the ith gene set is determinedby the fraction of the distribution that is more extreme than the observed S(GSi).
1.3 Gene set analysis (GSA)
GSA [8] differs from GSEA mainly in two ways: the summary statistic and the re-standardization of geneset scores based on row randomization. First, the score of the gene set is the maxmean statistic:
Smax(GSi) = max(
∑z
(+)j
ni,
∑z
(−)j
ni) (1)
where the (+) and (-) signs identify the positive and negative t-scores, respectively, and ni is the number ofgenes in the gene set. Second, GSA re-standardizes the gene set scores by taking into account scores fromsets formed by random selection of genes. GSA then permutes the samples to compute the significanceof the standardized gene set scores.
4
1.4 Fast Gene Set Enrichment Analysis (FGSEA)
Fast Gene Set Enrichment Analysis (FGSEA) [22, 23] has the same null and alternative hypotheses asGSEA. FGSEA differs from GSEA in the idea of reusing sampling for different query gene-sets. Insteadof generating n independent random gene sets for each of M input pathways (total of n ∗M), FGSEAwill generate only n random gene sets of size K. K is equal to the size of the biggest pathway. Let gibe an ith random gene set of size K. From that gene set we can generate gene sets for all the querypathways Pj by using its prefix: gi,j = gi[1..Kj ], where Kj is the size of pathway Pj . The next step is tocalculate the enrichment scores for all gene sets gi,j . Instead of calculating Enrichment Scores separatelyfor each gene set, FGSEA will calculate simultaneously scores for all gi,j for a fixed i.
Another improvement of FGSEA is that given a gene set sample gi of the size K, the Enrichment Scorevalues for all the prefixes gi,1..j can be calculated in an efficient manner using a square root heuristic.Briefly, a variant of an enrichment curve is considered: the genes are enumerated starting from the mostup-regulated to the most down-regulated, with the curve going to the right if the gene is not present inthe pathway, and the curve goes upward if the gene is present in the pathway.
With these two improvements, the time complexity of the calculating P-values for the set of Mpathways is O(n(K
√K+M)), which gives around O(
√K log(K)) speed up compared to a naive approach.
This allows FGSEA to perform analysis with much higher number of permutation, which leads to theability to estimate lower value of p.
1.5 Pathway analysis with down-weighting overlapping genes (PADOG)
The null hypothesis of Pathway analysis with down-weighting overlapping genes (PADOG) [10, 24] is thatthe mean of the (weighted) absolute differences between the phenotypes for the genes on a given pathwayis zero. The alternative hypothesis is that this mean is different from zero. An alternative formulationis that the null hypothesis states that no gene on the pathway is a DEG, with the alternative statingthat there is at least a gene that is a differentially expressed gene (DEG) on the given pathway. Thisformulation of the null hypothesis belongs to the self-contained category of null hypotheses accordingto [25] and in the second type of null hypotheses according to [26]. The statistic for the gene set GSi isas follows:
S(GSi) =1
ni
ni∑j=1
|T (gj)| · w(gj) (2)
where ni is the number of genes in the gene set, gj (j ∈ [1..ni]) are the genes in the gene sets, T (gj) isthe moderate t-score of the gene gj , w(gj) is the weight for gene gj . A gene is weighted less if it appearsin more gene sets. The score is then standardized based on row randomization. PADOG then permutesthe samples to compute the significance of the standardized gene set scores.
1.6 Kolmogorov-Smirnov (KS) test
Kolmogorov-Smirnov (KS) [27] test compares two empirical distributions to determine whether they differsignificantly. It is a non-parametric test that does not make any assumptions about the distributions ofthe given data sets. In the context of pathway analysis, the two empirical distributions are the scoresof the DE genes inside (denoted as DE-hit) and outside (denoted as DE-miss) a pathway. The nullhypothesis here is that there is no association between DE genes and the given pathway, and therefore,there is no significant difference between the two empirical distributions of DE-hit and DE-miss. Thealternative hypothesis is that there is a difference between the two empirical distribution of DE-hit andDE-miss.
1.7 Wilcoxon test
Wilcoxon (Wilcox) test [28] is a non-parametric statistical test generally used to determine whether ornot there is a significant difference in the medians of two given populations. In the context of pathway
5
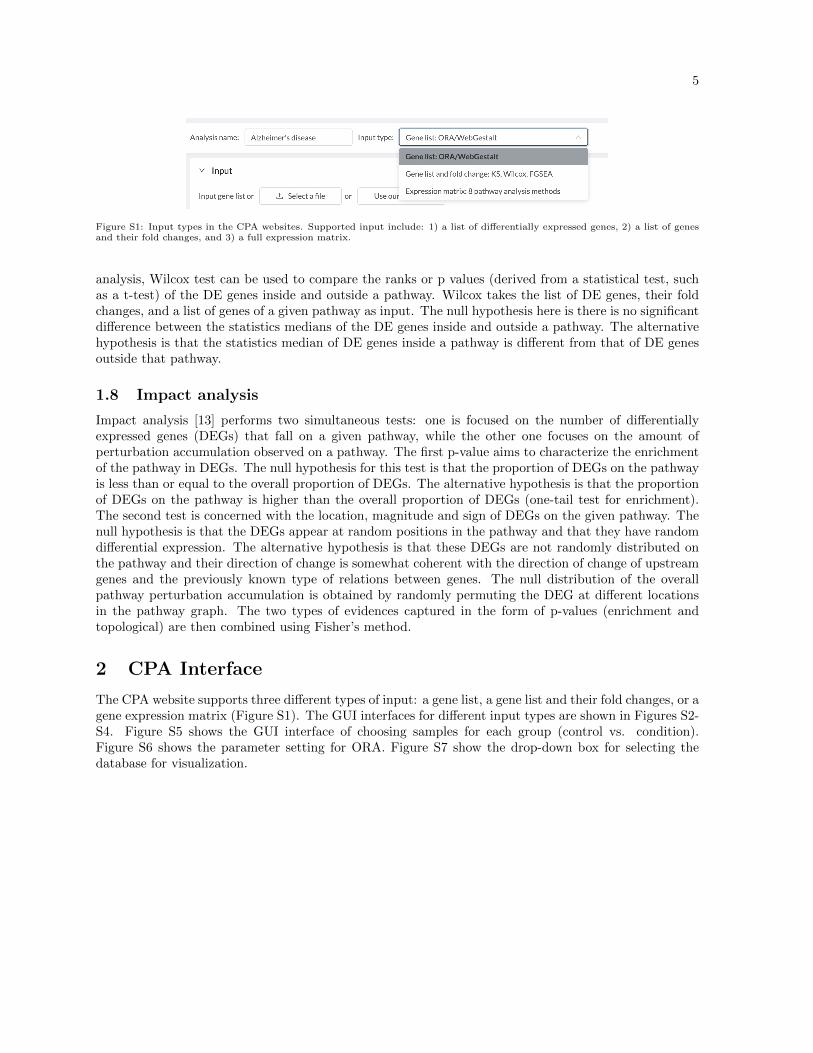
Figure S1: Input types in the CPA websites. Supported input include: 1) a list of differentially expressed genes, 2) a list of genesand their fold changes, and 3) a full expression matrix.
analysis, Wilcox test can be used to compare the ranks or p values (derived from a statistical test, suchas a t-test) of the DE genes inside and outside a pathway. Wilcox takes the list of DE genes, their foldchanges, and a list of genes of a given pathway as input. The null hypothesis here is there is no significantdifference between the statistics medians of the DE genes inside and outside a pathway. The alternativehypothesis is that the statistics median of DE genes inside a pathway is different from that of DE genesoutside that pathway.
1.8 Impact analysis
Impact analysis [13] performs two simultaneous tests: one is focused on the number of differentiallyexpressed genes (DEGs) that fall on a given pathway, while the other one focuses on the amount ofperturbation accumulation observed on a pathway. The first p-value aims to characterize the enrichmentof the pathway in DEGs. The null hypothesis for this test is that the proportion of DEGs on the pathwayis less than or equal to the overall proportion of DEGs. The alternative hypothesis is that the proportionof DEGs on the pathway is higher than the overall proportion of DEGs (one-tail test for enrichment).The second test is concerned with the location, magnitude and sign of DEGs on the given pathway. Thenull hypothesis is that the DEGs appear at random positions in the pathway and that they have randomdifferential expression. The alternative hypothesis is that these DEGs are not randomly distributed onthe pathway and their direction of change is somewhat coherent with the direction of change of upstreamgenes and the previously known type of relations between genes. The null distribution of the overallpathway perturbation accumulation is obtained by randomly permuting the DEG at different locationsin the pathway graph. The two types of evidences captured in the form of p-values (enrichment andtopological) are then combined using Fisher’s method.
2 CPA Interface
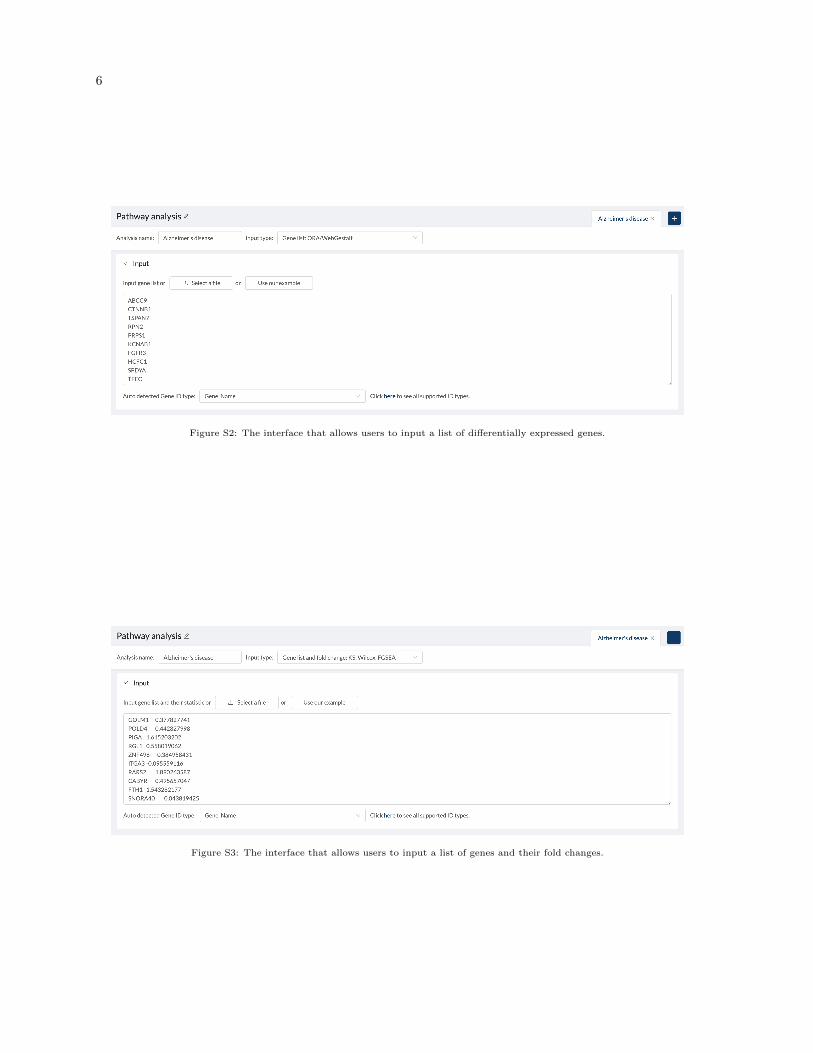
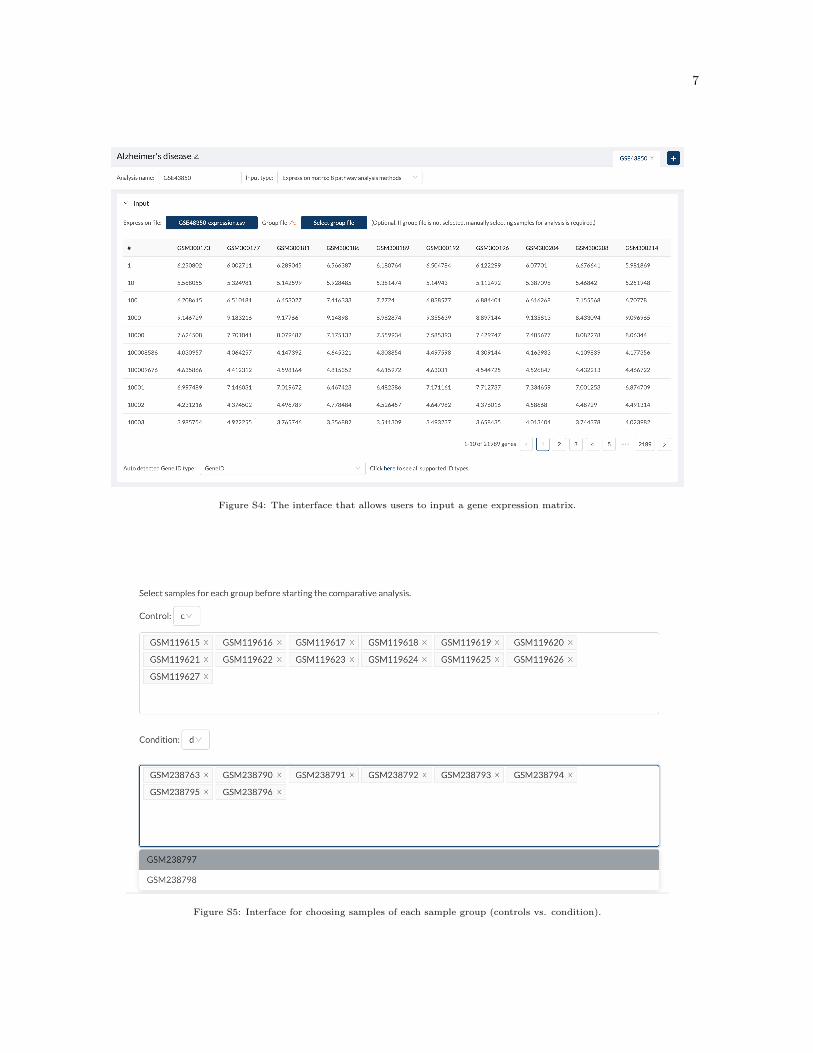
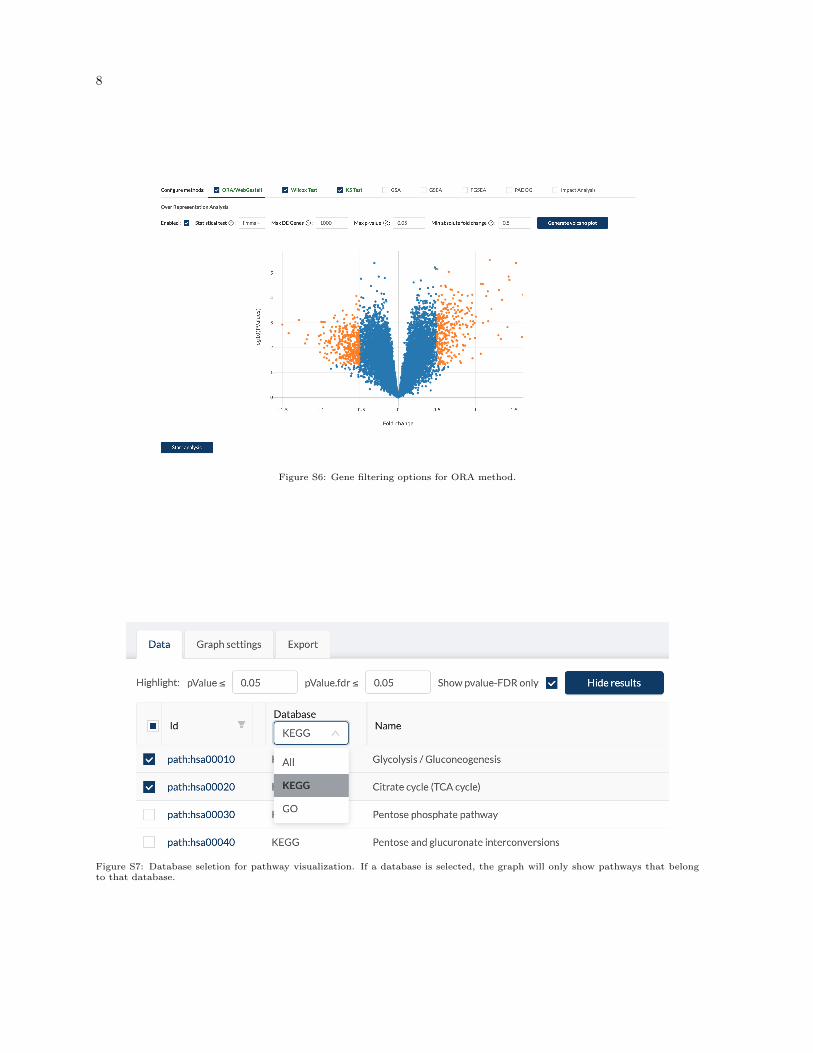
The CPA website supports three different types of input: a gene list, a gene list and their fold changes, or agene expression matrix (Figure S1). The GUI interfaces for different input types are shown in Figures S2-S4. Figure S5 shows the GUI interface of choosing samples for each group (control vs. condition).Figure S6 shows the parameter setting for ORA. Figure S7 show the drop-down box for selecting thedatabase for visualization.
6
Figure S2: The interface that allows users to input a list of differentially expressed genes.
Figure S3: The interface that allows users to input a list of genes and their fold changes.
7
Figure S4: The interface that allows users to input a gene expression matrix.
Figure S5: Interface for choosing samples of each sample group (controls vs. condition).
8
Figure S6: Gene filtering options for ORA method.
Figure S7: Database seletion for pathway visualization. If a database is selected, the graph will only show pathways that belongto that database.
9
References
[1] Khatri, P., Draghici, S., Ostermeier, G. C., and Krawetz, S. A. (2002) Profiling gene expression usingOnto-Express. Genomics, 79(2), 266–270.
[2] Hosack, D. A., Dennis Jr., G., Sherman, B. T., Lane, H. C., and Lempicki., R. A. (2003) IdentifyingBiological Themes within Lists of Genes with EASE.. Genome Biology, 4(6), P4.
[3] Al-Shahrour, F., Diaz-Uriarte, R., and Dopazo, J. (2004) FatiGO: a web tool for finding significantassociations of Gene Ontology terms with groups of genes. Bioinformatics, 20(4), 578–580.
[4] Beißbarth, T. and Speed, T. P. (June, 2004) GOstat: find statistically overrepresented Gene On-tologies within a group of genes.. Bioinformatics, 20, 1464–1465.
[5] Huang, D. W., Sherman, B. T., and Lempicki, R. A. (2009) Systematic and integrative analysis oflarge gene lists using DAVID bioinformatics resources. Nature Protocols, 4(1), 44.
[6] Wang, J., Duncan, D., Shi, Z., and Zhang, B. (2013) WEB-based GEne SeT AnaLysis Toolkit(WebGestalt): update 2013. Nucleic Acids Research, 41(W1), W77–W83.
[7] Subramanian, A., Tamayo, P., Mootha, V. K., Mukherjee, S., Ebert, B. L., Gillette, M. A., Paulovich,A., Pomeroy, S. L., Golub, T. R., Lander, E. S., and Mesirov, J. P. (2005) Gene set enrichmentanalysis: a knowledge-based approach for interpreting genome-wide expression profiles. Proceedingof The National Academy of Sciences, 102(43), 15545–15550.
[8] Efron, B. and Tibshirani, R. (2007) On testing the significance of sets of genes. The Annals of AppliedStatistics, 1(1), 107–129.
[9] Jiang, Z. and Gentleman, R. (2007) Extensions to gene set enrichment. Bioinformatics, 23(3), 306–313.
[10] Tarca, A. L., Draghici, S., Bhatti, G., and Romero, R. (2012) Down-weighting overlapping genesimproves gene set analysis. BMC Bioinformatics, 13(1), 136.
[11] Kong, S. W., Pu, W. T., and Park, P. J. (2006) A multivariate approach for integrating genome-wideexpression data and biological knowledge. Bioinformatics, 22(19), 2373–2380.
[12] Rahnenfuhrer, J., Domingues, F. S., Maydt, J., and Lengauer, T. (2004) Calculating the StatisticalSignificance of Changes in Pathway Activity From Gene Expression Data. Statistical Applications inGenetics and Molecular Biology, 3(1).
[13] Draghici, S., Khatri, P., Tarca, A. L., Amin, K., Done, A., Voichita, C., Georgescu, C., and Romero,R. (2007) A systems biology approach for pathway level analysis. Genome Research, 17(10), 1537–1545.
[14] Tarca, A. L., Draghici, S., Khatri, P., Hassan, S. S., Mittal, P., Kim, J.-s., Kim, C. J., Kusanovic,J. P., and Romero, R. (2009) A novel signaling pathway impact analysis. Bioinformatics, 25(1),75–82.
[15] Shojaie, A. and Michailidis, G. (2009) Analysis of Gene Sets Based on the Underlying RegulatoryNetwork. Journal of Computational Biology, 16(3), 407–426.
[16] Glaab, E., Baudot, A., Krasnogor, N., and Valencia, A. (2010) TopoGSA: network topological geneset analysis. Bioinformatics, 26(9), 1271–1272.
[17] Greenblum, S., Efroni, S., Schaefer, C., and Buetow, K. (2011) The PathOlogist: an automated toolfor pathway-centric analysis. BMC Bioinformatics, 12(1), 133.
10
[18] Gu, Z., Liu, J., Cao, K., Zhang, J., and Wang, J. (2012) Centrality-based pathway enrichment: asystematic approach for finding significant pathways dominated by key genes. BMC Systems Biology,6(1), 56.
[19] Gu, Z. and Wang, J. (2013) CePa: an R package for finding significant pathways weighted by multiplenetwork centralities. Bioinformatics, 29(5), 658–660.
[20] Draghici, S., Khatri, P., Martins, R. P., Ostermeier, G. C., and Krawetz, S. A. (2003) Globalfunctional profiling of gene expression. Genomics, 81(2), 98–104.
[21] Mootha, V. K., Lindgren, C. M., Eriksson, K.-F., Subramanian, A., Sihag, S., Lehar, J., Puigserver,P., Carlsson, E., Ridderstrale, M., Laurila, E., Houstis, N., Daly, M. J., Patterson, N., Mesirov,J. P., Golub, T. R., Tamayo, P., Spiegelman, B., Lander, E. S., Hirschhorn, J. N., Altshuler, D.,and Groop, L. C. (2003) PGC-11α-responsive genes involved in oxidative phosphorylation are coor-dinately downregulated in human diabetes. Nature Genetics, 34(3), 267–273.
[22] Korotkevich, G., Sukhov, V., Budin, N., Shpak, B., Artyomov, M. N., and Sergushichev, A. (2021)Fast gene set enrichment analysis. BioRxiv, p. 060012.
[23] Sergushichev, A. A. (2016) An algorithm for fast preranked gene set enrichment analysis usingcumulative statistic calculation. BioRxiv, p. 060012.
[24] Tarca, A. L., Bhatti, G., and Romero, R. (2013) A comparison of gene set analysis methods in termsof sensitivity, prioritization and specificity. PloS One, 8(11), e79217.
[25] Emmert-Streib, F. and V. Glazko, G. (2011) Pathway Analysis of Expression Data: DecipheringFunctional Building Blocks of Complex Diseases. PLoS Computational Biology, 7(5), e1002053.
[26] Tian, L., Greenberg, S. A., Kong, S. W., Altschuler, J., Kohane, I. S., and Park, P. J. (2005) Dis-covering statistically significant pathways in expression profiling studies. Proceeding of The NationalAcademy of Sciences, 102(38), 13544–13549.
[27] Stuart, A., Arnold, S., Ord, J. K., O’Hagan, A., and Forster, J. (1994) Kendall’s advanced theoryof statistics, Vol. 1, Wiley, London 6th edition.
[28] Wilcoxon, F. (1945) Individual comparisons by ranking methods. Biometrics, 1(6), 80–83.