Embed Size (px)
Citation preview
1
Cox & Kings Ltd.
Investor Presentation
February 2011
360° Travel. 100% Focus.

2
Disclaimer
This presentation has been prepared by Cox & Kings Limited (the “Company”) solely for your information and for your use
and may not be taken away, reproduced, redistributed or passed on, directly or indirectly, to any other person (whether
within or outside your organization or firm) or published in whole or in part, for any purpose. By attending this presentation,
you are agreeing to be bound by the foregoing restrictions and to maintain absolute confidentiality regarding the
information disclosed in these materials.
The information contained in this presentation does not constitute or form any part of any offer, invitation or
recommendation to purchase or subscribe for any securities in any jurisdiction, and neither the issue of the information nor
anything contained herein shall form the basis of, or be relied upon in connection with, any contract or commitment on the
part of any person to proceed with any transaction. The information contained in these materials has not been
independently verified. No representation or warranty, express or implied, is made and no reliance should be placed on the
accuracy, fairness or completeness of the information presented or contained in these materials. Any forward-looking
statements in this presentation are subject to risks and uncertainties that could cause actual results to differ materially
from those that may be inferred to being expressed in, or implied by, such statements. Such forward-looking statements
are not indicative or guarantees of future performance. Any forward-looking statements, projections and industry data
made by third parties included in this presentation are not adopted by the Company and the Company is not responsible
for such third party statements and projections. This presentation may not be all inclusive and may not contain all of the
information that you may consider material. The information presented or contained in these materials is subject to change
without notice and its accuracy is not guaranteed. Neither the Company nor any of its affiliates, advisers or representatives
accepts liability whatsoever for any loss howsoever arising from any information presented or contained in these materials.
THIS PRESENTATION IS NOT AN OFFER OF SECURITIES FOR SALE IN THE UNITED STATES OR ELSEWHERE.

3
Cox & Kings: Overview
• Company Overview
• One of India’s Largest Travel and Tour Companies
• Global Tours & Travel Operators: Geographical Diversification
• Focus on Leisure with Diverse Product Offerings

4
Company Overview
4
Cox & Kings Ltd., C&K or Cox & Kings, is one of the oldest and well recognized travel and tour operators in the world
In December 2009, C&K successfully listed on the stock exchange in India
C&K has subsidiaries in UK, Australia, New Zealand, Japan, US, UAE, Germany, Hong Kong, Greece and Singapore
C&K’s business can be categorized into 4 service offerings, namely, leisure travel, corporate travel, visa processing and foreign
exchange
Business Description
CMP on 31st December 2010
BSE : INR 523.8 NSE : INR 521.8
3- Month High /Low
(Nov 2010 – Jan 2011)
High INR 589.0
Low INR 425.7
Market Cap. on 31st Dec. 2010
INR 3,575.32 cr
Equity Capital as on 31st December 2010
6,82,63,945
1758 201019th Cent.18th Cent. 19701923
Business was sold to
Lloyd’s Bank; The Shipping
agency became a separate
company running tours
around the world
Cox & Kings agency was
bought by Grindlays Bank in
a deal with the Indian Govt.
to promote tourism in the
country
Cox & Kings is a global
tour and travel company.
The Company is a ‘one stop
shop’ for travel solutions
Richard Cox served
as a regimental
agent to a unit of the
Majesty’s Armed
Forces
Company established
by Richard Cox grew to
provide services to
majority of the British
regiments
Merged with Henry S. King &
Co, a bank and shipping
agency to form Cox’s &
King’s; Henry S. King & Co
had strong links with India
1970-99
Largely operated as a
ticketing agent; non
leisure business
accounted for over 50% of
the revenues in 1999
1999-2006
Expanded product
portfolio to become a
full service Indian
tour operator
2006-09
Acquires and consolidates
businesses across the world
with a focus on leisure travel;
90% of revenue is from leisure
segment in FY 07-09

5
Shareholding Details
5
Shareholding Pattern
Source: BSE
Promoter58.7%
Banks, Mutual Funds & FI
6.1%
FII,NRIs and Foreign
Corporate Bodies27.1%
GDR3.5%
Other Corporate
Bodies and Public4.8%
Promoter58.7%
Banks, Mutual Funds & FI
6.6%
FII,NRIs and Foreign
Corporate Bodies22.2%
GDR7.3%
Other Corporate
Bodies and Public5.3%
Quarter ended 31st December 2010 Quarter ended 30st September 2010
Shareholders No. of shares
% of
Holding
Promoters 40,040,880 58.7
Smal l Cap World Fund, Inc 3,995,500 5.9
Citibank N.A. New York, Nyadr Department 2,355,534 3.5
Carlson Fund - As ian Smal l Cap 1,700,000 2.5
Emerging Markets Growth Fund, Inc. 1,624,647 2.4
Goldman Sachs Investments (Mauritius)I Ltd 1,428,000 2.1
Rel iance Capita l Trustee Co. Ltd A/c Rel ianceequit1,302,700 1.2
Stichting Pens ioenfonds ABP -GDR 1,232,530 1.8
Deutsche Securi ties Mauritius Limited 811,974 1.2
Capita l International Emerging Markets Fund 772,764 1.1
Lehman Brothers Opportunity Limited 760,648 1.1
TOTAL 56,025,177 82.1
Top Shareholders as on 31st December 2010
6
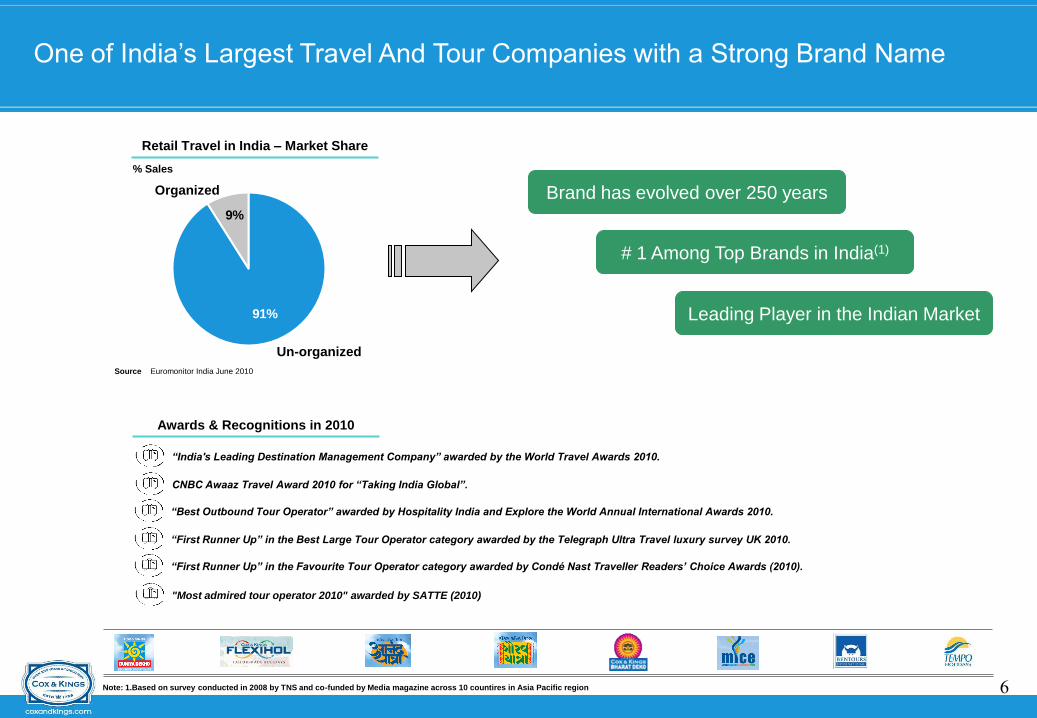
One of India’s Largest Travel And Tour Companies with a Strong Brand Name
9%
91%
% Sales
Retail Travel in India – Market Share
Un-organized
Organized Brand has evolved over 250 years
# 1 Among Top Brands in India(1)
Source Euromonitor India June 2010
Leading Player in the Indian Market
Note: 1.Based on survey conducted in 2008 by TNS and co-funded by Media magazine across 10 countires in Asia Pacific region
Awards & Recognitions in 2010
“India's Leading Destination Management Company” awarded by the World Travel Awards 2010.
CNBC Awaaz Travel Award 2010 for “Taking India Global”.
“Best Outbound Tour Operator” awarded by Hospitality India and Explore the World Annual International Awards 2010.
“First Runner Up” in the Best Large Tour Operator category awarded by the Telegraph Ultra Travel luxury survey UK 2010.
“First Runner Up” in the Favourite Tour Operator category awarded by Condé Nast Traveller Readers‟ Choice Awards (2010).
"Most admired tour operator 2010" awarded by SATTE (2010)

7
Global Tours & Travel Operator: Geographical Diversification
• Cox & Kings Japan Ltd.
–Outbound travel
Japan
• Tempo Holidays Pty Ltd; MyPlanet
Australia Pty Ltd, Bentours
International Australia Pty. Ltd
–Outbound travel
Australia and New Zealand
• Cox & Kings Tours LLC
–Outbound and Inbound travel
UAE
• Cox & Kings Ltd, Quoprro Global
Services Pvt. Ltd.
–Outbound, Inbound, Domestic,
Corporate travel
–Special offerings such as Maharajas’
Express, Kumbh Mela etc.
India
• Cox & Kings (UK) Ltd. – Outbound Travel
• Clearmine Ltd. (ETN Services Ltd) –
Inbound Travel (Destination management
services)
United Kingdom
• Cox & Kings Singapore Pte Ltd.,
Quoprro Global Services Pte Ltd.,
Quoprro Global Services Pvt Ltd.
–Visa processing
South-East Asia
Note: 1. Cox & Kings Ltd. has a 100% commercial interest in all its subsidiaries
• East India Travel Company Inc
–Up-market outbound tour and
travel packages
United States of America
Europe
• Cox and Kings Gmbh, Quoprro
Global Hellas
–Visa processing
8
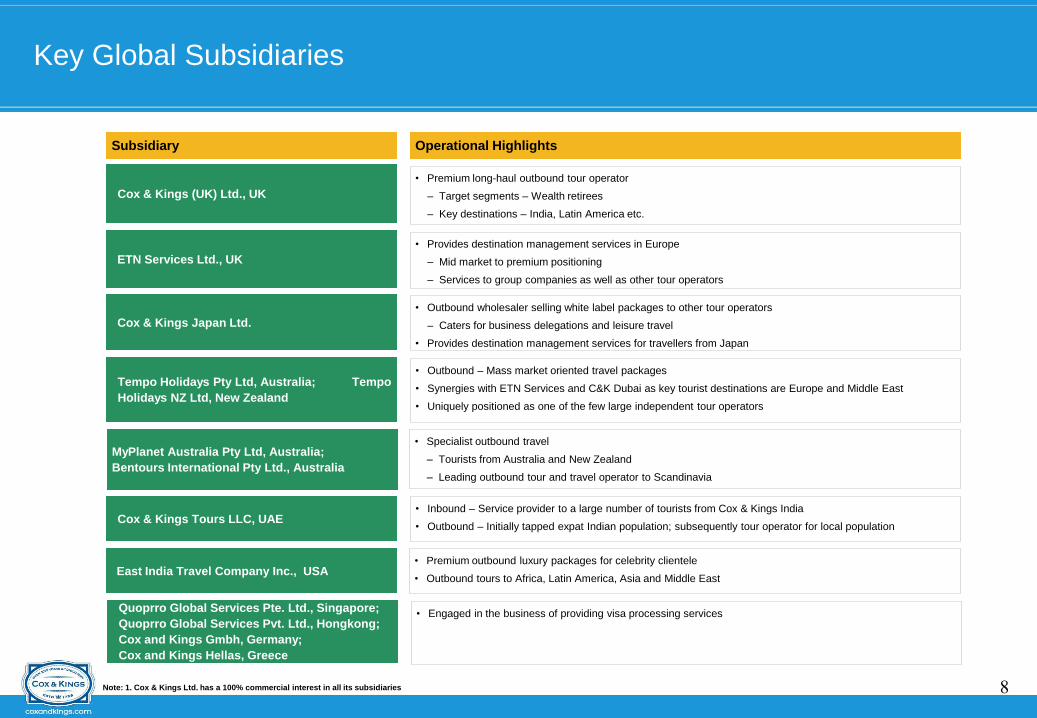
Key Global Subsidiaries
Note: 1. Cox & Kings Ltd. has a 100% commercial interest in all its subsidiaries
• Premium long-haul outbound tour operator
– Target segments – Wealth retirees
– Key destinations – India, Latin America etc.
Cox & Kings (UK) Ltd., UK
Operational HighlightsSubsidiary
• Provides destination management services in Europe
– Mid market to premium positioning
– Services to group companies as well as other tour operators
ETN Services Ltd., UK
• Outbound wholesaler selling white label packages to other tour operators
– Caters for business delegations and leisure travel
• Provides destination management services for travellers from Japan
Cox & Kings Japan Ltd.
• Outbound – Mass market oriented travel packages
• Synergies with ETN Services and C&K Dubai as key tourist destinations are Europe and Middle East
• Uniquely positioned as one of the few large independent tour operators
Tempo Holidays Pty Ltd, Australia; Tempo
Holidays NZ Ltd, New Zealand
• Inbound – Service provider to a large number of tourists from Cox & Kings India
• Outbound – Initially tapped expat Indian population; subsequently tour operator for local populationCox & Kings Tours LLC, UAE
MyPlanet Australia Pty Ltd, Australia;
Bentours International Pty Ltd., Australia
• Specialist outbound travel
– Tourists from Australia and New Zealand
– Leading outbound tour and travel operator to Scandinavia
• Engaged in the business of providing visa processing servicesQuoprro Global Services Pte. Ltd., Singapore;
Quoprro Global Services Pvt. Ltd., Hongkong;
Cox and Kings Gmbh, Germany;
Cox and Kings Hellas, Greece
• Premium outbound luxury packages for celebrity clientele
• Outbound tours to Africa, Latin America, Asia and Middle EastEast India Travel Company Inc., USA

9
Focus on Leisure with Diverse Product Offerings
Offerings
Markets
Portfolio
Sample
Corporate TravelLeisure Travel Innovative Products
• Outbound Travel
• Inbound Travel (Destination
management)
• Domestic Travel
• Meeting, Incentives, Conferences
and Exhibitions (MICE)
• Trade Fairs
• Outsourced business
solution provider to
diplomatic missions
• Licensed retail foreign
exchange dealer in India
• Customized business
travel solutions
• Retail clients in India, UK,
Australia, New Zealand, Japan,
USA and UAE
• Visa for India from
Germany, UAE, Hong
kong, Greece and
Singapore
• Visa’s for Malaysia and
Singapore from India
and French Visa from
UK
• Fx operations in India
• 200+ companies located
in India
• Offerings that
differentiate Cox and
Kings from competitors
• Create brand value for
the company
• Strategic partnership
• In all operational
markets
Visa Processing &
Foreign Exchange
Kumbh Mela, India

10
Value Drivers
• Selective Acquisitions Globally
• Consolidated Sourcing Operations
• Strong National & International Distribution
• Technological Prowess
• Experienced Board of Directors & Human Resources

11
Selective Acquisitions Globally – Aligned to Core Business Strategy
FY2008 FY2009 FY2010FY2006
• Outbound travel operator catering to
the up-market leisure travel business
Cox & Kings (UK) Ltd.
• Destination management services
Clearmine Ltd.
-ETN Services Ltd.
• Travel wholesaler
• Revenues principally from package
consultancy and services for major
wholesalers and societies
Cox & Kings Japan Ltd.
• Specialised outbound tours
Tempo Holidays PTY, Australia;
Tempo Holidays NZ Ltd., New Zealand
• Up-market outbound tour and travel
packages
East India Travel Company Inc
• Specialized outbound tours
My Planet Australia, BenTours
International Pty Ltd.
• Visa processing services
Quoprro Global Services Pvt Ltd.
Rationale for Acquisitions:
Increase in scale of business through exponential growth in number of customers, markets and products
Synergies with existing operations with a scope for creating value for the combined entity
Risk mitigation through diversification of revenue streams; counters cyclical nature of industry
Strong management and prior success with integrating acquired businesses

12
Improving Efficiency Through Consolidated Sourcing Operations
Significant increase in business and business volumes
in recent years through acquisitions as well as
organically
— Operating Income increased by 48 % (FY08-10)
— Acquired 7 businesses in last 4 years
Since 2008, products sourced through global
consolidated efforts
— Growing size of operations provided buying
power with suppliers
— Increased ability to offer competitive packages to
customers leading to higher revenue and better
margins
(%)
40%42%
47%
25%
22%
34%
0%
10%
20%
30%
40%
50%
2008 2009 2010
Consolidated Buying Group Improving Margins
EBITDA Margin(1) PAT Margin
Expansion in Business Volumes
Inorganic GrowthOrganic Growth
Bargaining Power
Competitive Advantage
+
Note: EBITDA margin calculated after excluding other income

13
Strong National & International Distribution Network
India Distribution Network
RADIUS: Consortium of leading travel
agents present across approximately 80
countries
Tempo Holidays Cox & Kings India Portal
Online package design and selection
Cox & Kings UK Portal
Online booking
Global Distribution Network
Online Distribution Network
14 Sales Offices
115 Franchise Sales Shops
143 PAs
Source As of 31st December 2010 Subsidiaries Branch Office Representative Office
Russia
Australia
New Zealand
SingaporeSouth America
South Africa
US
UAE
UK
Japan
Hong Kong
Maldives
Tahiti
Spain
Italy
Germany
India

14
• Web enabled reservation engine
• Centralized dynamic packaging
system
• Covers all travel related services
such as reservations, insurance, visa
and package tours
Technological Prowess
Technology Platforms
• B2B as well as a B2C solution,
providing a backbone to the Global
Distribution Systems (GDS)
• Online payment gateways integrated to
existing technology platform
• Fully integrated computer reservation
systems (CRS) with our mid and back
office operations
Services
• Latest data-management software,
including ERP
• Proprietary software for our Visa
Processing business with technical
support from a leading technology
company globally
Top End Software
• Servers are secured with firewalls
• Robust security systems including
biometrics identifiers, fingerprints and
photographs for visa application
• Strong disaster management,
including recovery solutions and
scheduled backups
Security
Improve efficiencies and reduce TATs: Dynamic designing of packages; increasing business handled per employee
Seamless integration of operations of acquired entities
Ability to introduce white label/ co-branded offerings for clients such as MSN and Jet Escapes
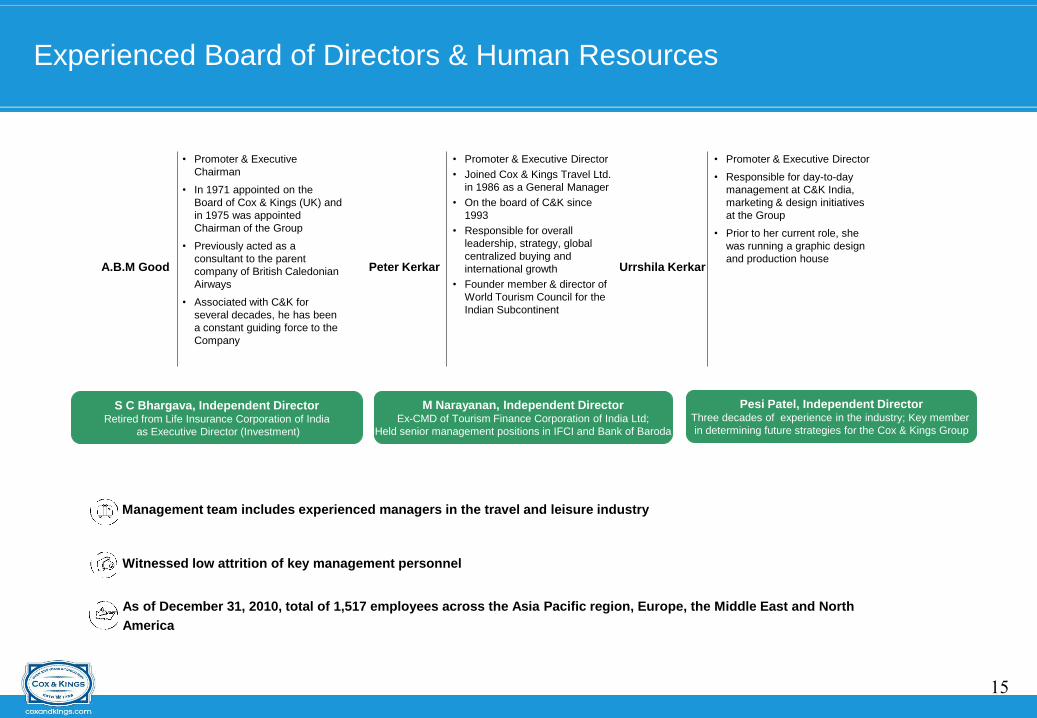
15
• Promoter & Executive Director
• Responsible for day-to-day
management at C&K India,
marketing & design initiatives
at the Group
• Prior to her current role, she
was running a graphic design
and production house
• Promoter & Executive
Chairman
• In 1971 appointed on the
Board of Cox & Kings (UK) and
in 1975 was appointed
Chairman of the Group
• Previously acted as a
consultant to the parent
company of British Caledonian
Airways
• Associated with C&K for
several decades, he has been
a constant guiding force to the
Company
• Promoter & Executive Director
• Joined Cox & Kings Travel Ltd.
in 1986 as a General Manager
• On the board of C&K since
1993
• Responsible for overall
leadership, strategy, global
centralized buying and
international growth
• Founder member & director of
World Tourism Council for the
Indian Subcontinent
Experienced Board of Directors & Human Resources
A.B.M Good Peter Kerkar Urrshila Kerkar
• Management team includes experienced managers in the travel and leisure industry
• Witnessed low attrition of key management personnel
• As of December 31, 2010, total of 1,517 employees across the Asia Pacific region, Europe, the Middle East and North
America
S C Bhargava, Independent DirectorRetired from Life Insurance Corporation of India
as Executive Director (Investment)
M Narayanan, Independent DirectorEx-CMD of Tourism Finance Corporation of India Ltd;
Held senior management positions in IFCI and Bank of Baroda
Pesi Patel, Independent DirectorThree decades of experience in the industry; Key member
in determining future strategies for the Cox & Kings Group

16
Business Strategy

17
Business Strategy
Grow the
outbound leisure
services sub-
segment in India
Expand
distribution
network globally
Leverage existing
global platform to
enhance product
and service
offerings
Inorganic growth
by selectively
acquiring
businesses
Strategic
initiatives for our
product and
service offerings

18
Financials

19
Consolidated Audited Financials
Note: 1. EBITDA & PAT margin calculated after excluding other income
2. INR/ USD exchange rate of INR 45.14/ USD as on 31 March 2010
EBITDA & PAT Margin(1)
(%)
40% 42%
47%
25%22%
34%
0%
10%
20%
30%
40%
50%
FY08 FY09 FY10
EBITDA Margin PAT Margin
Operating Income PAT
(INR MM)
1,821
2,869
3,992
0
1,000
2,000
3,000
4,000
5,000
FY08 FY09 FY10
(INR MM)
446634
1,348
0
300
600
900
1,200
1,500
FY08 FY09 FY10
US$ MM(2)40.3 63.6 88.4 9.9 14.0 29.9
Key Components of Operating Expenditure
as a Percentage of Operating Income
(%)28% 28%
25%
12% 12%
9%
0%
5%
10%
15%
20%
25%
30%
FY08 FY09 FY10
Personnel Expenditure Advertising

20
Consolidated Financials Q3FY11
• Q3FY11 Operating Income for the Group stood at INR 1,083.1 Mn i.e. an increase of 37% over the same period last year
Cox & Kings Ltd. Consolidated Q3 2011 & Q3 YTD FY 2011 Results (INR Mn)
• EBITDA increased to INR 385.6 Mn i.e. an increase of 27% over EBITDA for Q3 FY10
Particulars Q3 FY 11 Q3 FY 10Q-o-Q
Change
Q3 YTD FY
11
Q3 YTD FY
10 % Change
Year Ended
FY 2010
Income from Operations 1,083.1 788.9 37% 3,386.9 2,622.4 29% 3,991.5
Employee Cost 353.2 248.7 962.3 705.6 994.1
Advertisement Cost 103.4 58.8 325.4 275.6 357.0
Depreciation 48.0 35.7 133.9 100.4 150.7
Other Expenditure 240.9 178.5 612.6 496.6 776.1
Total Expenditure 745.5 521.7 43% 2,034.2 1,578.1 29% 2,277.9
Profit from operations before Other Income, Interest &
Exceptional Items 337.6 267.2 26% 1,352.6 1,044.2 30% 1,713.6
Other Income 81.6 22.7 172.7 70.2 137.3
Profit before Interest & Exceptional Items 419.2 289.8 45% 1,525.3 1,114.4 37% 1,851.0
Interest & Finance Charges (Net) 166.6 47.4 422.6 182.3 269.7
Profit before Exceptional Items 252.6 242.5 4% 1,102.7 932.1 18% 1,581.2
Exceptional Items Gain / (Loss) 86.9 33.6 102.1 257.6 283.8
Profit from Ordinary Activities before tax 339.5 276.1 23% 1,204.9 1,189.7 1% 1,865.1
Tax Expense 106.1 80.8 362.2 293.8 516.9
Net Profit from Ordinary Activities after tax 233.4 195.3 842.7 895.9 1,348.1
Share in the Profit/(Loss) of Assoicates (3.1) (2.5) (8.8) (7.3) (9.6)
Extra-ordinary items
Net profit for the period 230.2 192.8 19% 834.0 888.6 -6% 1,338.5
Note: There is a foreign exchange gain of Rs. 25.76 crores on account of foreign currency loan revaluation Q3 YTD - FY 2010 as
against Rs. 10.22 crores in Q3 YTD – FY 2011. Hence, the PAT is marginally lower for the 9 months ended 2011 as compared to
corresponding period in the previous year.

Revenue Contribution
21
India50.5%
UK Travel16.6%
ETN7.2%
CNK Japan7.6%
East India4.1%
Dubai5.0%
Australia8.0% Others
1.0%
YTD 2011
India44.8%
UK Travel21.2%
ETN5.3%
CNK Japan9.3%
East India5.9%
Dubai4.7%
Australia7.0%
Others1.8%
Q3 2011
C & K India „s Net Sales for YTD 2011 increased by 31 % over
the same period last year
YTD 2011 Net Sales from Dubai subsidiary and C & K Travel
(UK) increased by 98 % and 20 % respectively over the same
period last year.
Q3 2011 Net Sales from C & K India increased by 38 %
over Q3 2010
Q3 2011 Net Sales from Dubai Subsidiary increased by
39 % and that of C & K Travel (UK) increased by 33 %
over corresponding quarter last year.
The growth of net sales for UK is lower by 10% on
account of foreign exchange conversion from GBP to
INR

Net Debt & Cost
2222
Rs. 862 croresDebt
FY 11 – Q3Particluars
Rs. 1052 croresCash & Cash Equivalents
(Rs. 190 crores)Net Debts
7.7%Average Finance Cost
4.7%Average Finance Cost (Net of
Return of Liquid Investments)

Acquistions
23
The Company is already engaged in discussion with identified acquisition targets.
Liquidity available to the company will be majorly used for these identified
acquisitions.
There are certain jurisdictions where a serious discussion with the acquisition
target cannot be made unless the company has available funds. In such a
scenario, the interest carry therefore becomes a necessary element of the
acquisition. The company has continued with its cautionary approach of
judiciously working on the acquisition.
The company is in a position to act in a very short time and conclude the
acquisition the moment the opportunity is appropriate. We expect to conclude on
the transaction within the quarter ending June 2011.

24
Strong Industry Fundamentals

25
T & T Industry
Source WTTC’s The Economic Impact of Travel & Tourism
Country rankings for Travel and Tourism Direct Industry GDP in 2020
Rank Country ($ in billions)
1 United States 916.5
2 China 500.7
3 Japan 215.8
4 United Kingdom 148.2
5 France 143
6 Spain 123.7
7 Italy 121.8
8 India 110.6
9 Germany 103.7
10 Australia 79.7
Forecast – 10 Year Trend
Contribution of Travel & Tourism Industry 2010 2020
Economy GDP (USD in bn) 118 330
Economy GDP (INR in bn) 5,533 18,544
Growth rate 8.6% 9.0%
Real GDP growth rate 6.7% 8.5%
Employment (no. of jobs) 49,086,000 58,141,000
Growth rate 10.0% 10.4%
Source: WTTC’s The Economic Impact of Travel & Tourism
The Indian T & T industry expected to grow at an annual rate of
7.8% over the next 10 years
India has been ranked 8th with 110.6 billion $ Direct Industry GDP
in 2020.
India will rank 3rd in terms of annual growth in Travel & Tourism
Demand between 2010 and 2019, averaging 8.2% per annum
Travel & Tourism Demand (2009-2019)
10- Year real growth (Annualized %)
6.9%
7.0%
7.1%
7.1%
7.1%
7.2%
8.2%
8.2%
9.2%
20.1%
0% 5% 10% 15% 20% 25%
Zimbabwe
Montenegro
Namibia
Cape Verde
Libya
Vietnam
Malawi
India
China
Sao Tome and Principe
China & India are amongst the Top 10 countries for T & T

26
Indian T & T industry – Domestic
Source Ministry of Tourism,
18% growth in the number of trips in 2010 from 550 mns Indians to 650 mns.
65% relates to leisure travel
25% growth in Domestic Air Travel

27
Indian T & T industry – Inbound
Source Ministry of Tourism
Arrivals in India grew by 9.3% from 5.11 mns in 2009 to 5.58 mns in 2010
Visa on Arrival Scheme in India extended to 10 countries in 2010 from 5
countries in 2009 namely :
Mayanmar & Indonesia
Japan
Singapore
Finland
Luxembourg
New Zealand
Cambodia
Loas
Vietnam
Philippines

28
Indian T & T industry – Outbound
Source Euromonitor India June 2010,
Indians travelling abroad increased to 12.61 mns from 11.56 mns in 2009
Indians travelling to Hong Kong increased by 47% in 2010
Indians travelling to Switzerland increased by 25% in 2010
Indians travelling to South Korea increased by 25% in 2010
Indians travelling to Malysia increased by 25% in 2010
Indians travelling to Finland increased by 17% in 2010
29
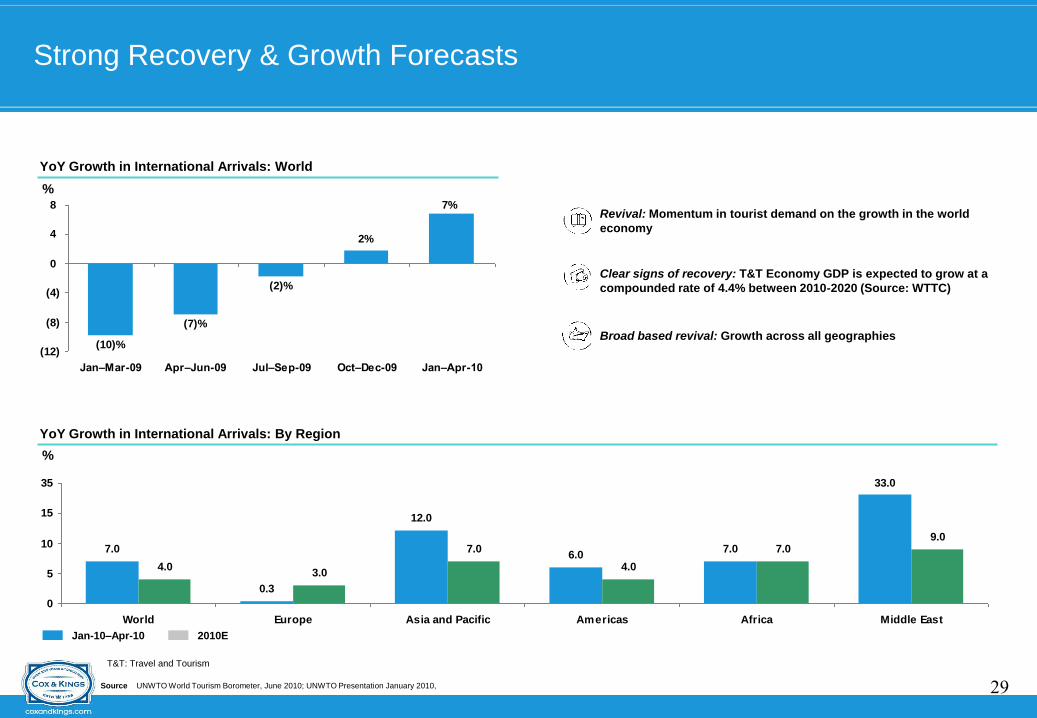
Strong Recovery & Growth Forecasts
Source UNWTO World Tourism Borometer, June 2010; UNWTO Presentation January 2010,
%7%
2%
(2)%
(7)%
(10)%(12)
(8)
(4)
0
4
8
Jan–Mar-09 Apr–Jun-09 Jul–Sep-09 Oct–Dec-09 Jan–Apr-10
YoY Growth in International Arrivals: World
%
Jan-10–Apr-10 2010E
7.0
0.3
12.0
6.07.0
4.03.0
7.0
4.0
7.09.0
33.0
0
5
10
15
35
World Europe Asia and Pacific Americas Africa Middle East
YoY Growth in International Arrivals: By Region
Clear signs of recovery: T&T Economy GDP is expected to grow at a
compounded rate of 4.4% between 2010-2020 (Source: WTTC)
Revival: Momentum in tourist demand on the growth in the world
economy
Broad based revival: Growth across all geographies
T&T: Travel and Tourism

30
For further details, please contact:
Cox & Kings Ltd, Turner Morrison Building, 16 Bank Street, Fort, Mumbai - 400 001
Website: www.coxandkings.com
Email: [email protected]
Thank You