Embed Size (px)
Citation preview
Source: Wastewater- Based Epidemiology: Global Collaborative to Maximize Contributions in the Fight Against COVID- 19Environmental Science & Technology
COVID-19 Wastewater-Based Epidemiology
--- CONFIDENTIAL BUSINESS INFORMATION ---
July 21, 2020Anna Mehrotra, PhD, PEGreta Zornes, PhD

Overview
▪ Safety moment
▪ Introduction to wastewater-based epidemiology
▪ Research approach and findings
▪ Discussion
--- CONFIDENTIAL BUSINESS INFORMATION ---
https://www.ft.com/

Persistence of infectious SARS-CoV-2 unknown▪ Stool
▪ 3 days for seeded SARS-CoV (Wang et al. 2005)
▪ Live virus isolated from 0% (Wölfel et al. 2020) to 2.4% (Wang et al. 2020)
▪ Raw wastewater▪ “Not significant” (Rimoldi et al. 2020)
CDC recommends “standard practices” for wastewater workers
3
Rimoldi et al. 2020. Preprint.Wang, X.W. et al. 2005. J. Virological Methods.
Wang, W. et al. 2020. JAMAWölfel, R.et al. 2020. Nature.
Wu et al. 2020. Lancet Gastroenterol Hepatol.
Throat swab SARS-CoV-2 Fecal sample SARS-CoV-2
Infected patients shed SARS-CoV-2: patient stool samples remained positive for 27.9 days vs. 16.7 days for throat swabs (Wu et al.)
COVID-19 & wastewater: safety moment

4
Am
phe
tam
ines
Co
cain
e
Met
hylp
enid
ate
Her
oin
Est
ima
ted
co
nsu
mp
tio
n(m
g/d
ay/
1,0
00
pe
rso
ns)
WBE is the analysis of substances in raw wastewater to obtain information on community health – this is not a new science, but an area of rapid growth.
Gushgari et al. 2018. J. Haz Mat.Es
tim
ated
num
ber i
nfec
ted
wit
h no
rovi
rus
GG
II
Act
ual n
umbe
r di
agno
sed
wit
h no
rovi
rus
GG
II
Hellmér et al. 2014. Appl. Environ.Microbiol.
Estimated
Actual
Illicit drugs • Toxics exposure • Nutritional status • Stress levels • Viral diseases
Wastewater-based epidemiology

▪ SARS-CoV-2 can be measured in wastewater using qPCR lab method
▪ Wastewater correlates with and even precedes clinical disease incidence
➔ Wastewater could potentially help fill the clinical testing gap
5
Peccia et al. 2020. Preprint
N1 target
0
50
100
150
200
250
300
0.E+00
1.E+05
2.E+05
3.E+05
4.E+05
5.E+05
6.E+05
7.E+05
It is possible to detect COVID-19 at least 7 days faster as compared to testing individuals.
Δ = 7 to 16 days
Miyani et al. 2020. Under peer review at J Env Eng.Peccia et al. 2020. Preprint from MedRxiv.
Randazzo et al. 2020. Water Research.
New reported COVID-19 cases
WastewaterSARS-CoV-2 signal
WBE & COVID-19

▪ Coordinated efforts▪ National: Australia, Canada,
Finland, Germany, Netherlands, Pakistan and now US!
▪ State-level: CO, NY, OH
▪ Research▪ Methods
▪ Trends across time and space
▪ Fate and transport in environment
6
Area of active focus
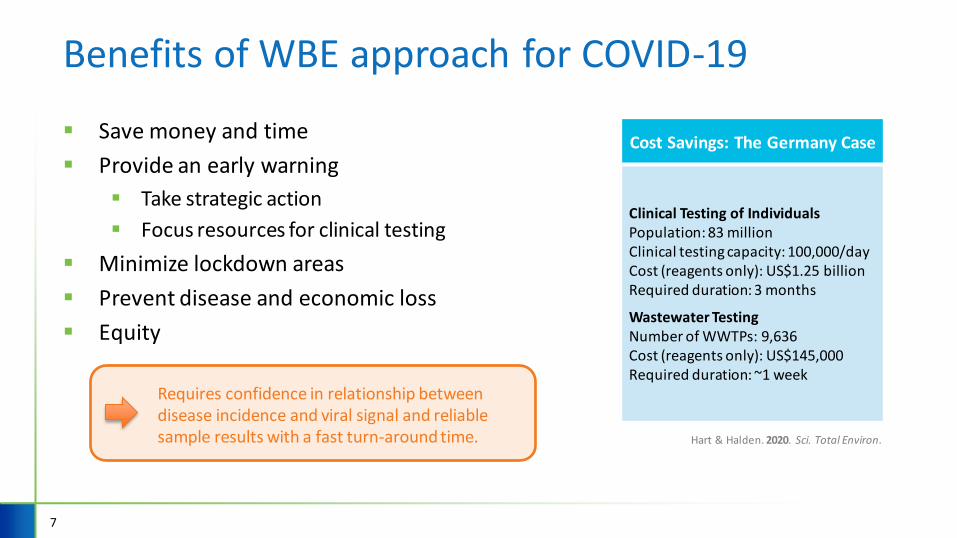
▪ Save money and time
▪ Provide an early warning
▪ Take strategic action
▪ Focus resources for clinical testing
▪ Minimize lockdown areas
▪ Prevent disease and economic loss
▪ Equity
7
Cost Savings: The Germany Case
Clinical Testing of IndividualsPopulation: 83 millionClinical testing capacity: 100,000/dayCost (reagents only): US$1.25 billionRequired duration: 3 months
Wastewater TestingNumber of WWTPs: 9,636Cost (reagents only): US$145,000Required duration: ~1 week
Hart & Halden. 2020. Sci. Total Environ.
Requires confidence in relationship between disease incidence and viral signal and reliable sample results with a fast turn-around time.
Benefits of WBE approach for COVID-19

1. City-wide approach ▪ Collaborating with GLWA & Xagoraraki
lab at MSU
▪ Complex, many variables
▪ Goal is high confidence in relationship between disease incidence and viral signal
8
*O’Brien et al. 2017. Water Research
Progress to date
‐ On week 16 of sampling; 1x-3x per week
‐ GLWA providing in-kind sampling labor
‐ All 3 interceptors at GLWA WRRF influent
‐ Field filtration using VIRADEL method
‐ Further sample preparation based on method optimized in Xagoraraki lab*
‐ qPCR optimized for N1 target so far
‐ Strong SARS-CoV-2 signal in all samples: 104 to 105 copies per L
‐ Revised manuscript submitted to J. Env Eng.
CDM Smith’s parallel research initiatives

2. Facility or site-specific approach▪ Pilot for Brown University
▪ Simple, fewer unknowns
▪ Goal is validation of a reliable method with fast turn-around
9
https://biomeme.com/ https://www.wbur.org/hereandnow/2018/03/28/opioids-
test-wastewater
Potential Facilities• Military vessels and/or bases • University dorms and/or campuses • Large industrial facilities • Residential healthcare facilities • Prisons
CDM Smith’s parallel research initiatives

10
Study LocationPopulation Served
Sampling Locations
Sample Number
Sampling Dates
% PositiveSARS-CoV-2 Genome Copies per L (log10)
Ahmed et al. Brisbane, Australia
736,000 9 9 3/20-4/1 22% 1.3; 2.1
Haramoto et al.
Yamanashi, Japan 820,000 5 5 3/17-5/7 0% --
Medema et al. The Netherlands 2,800,000 8 28 2/5-3/25 62% (N1) 0.41 to 2.9
Miyani et al. Detroit, USA 3,200,000 3 76 4/8-5/28 100% 4.5 to 5.6
Peccia et al. New Haven, USA 200,000 1 Not reported 3/19-5/1 100% 3.2 to 5.7
Randazzo et al. Murcia, Spain 750,000 6 42 3/12-4/14 83% (raw) 5.4 ± 0.21
Wu et al. Boston, USA 2,300,000 2 10 3/20-3/25 100% 4.3 to 5.4
Wurtzer et al. Paris, France 2,100,000 3 23 3/5-4/7 100% > 3
*Not intended to be a comprehensive list.
SARS-CoV-2 wastewater surveillance studies*
11
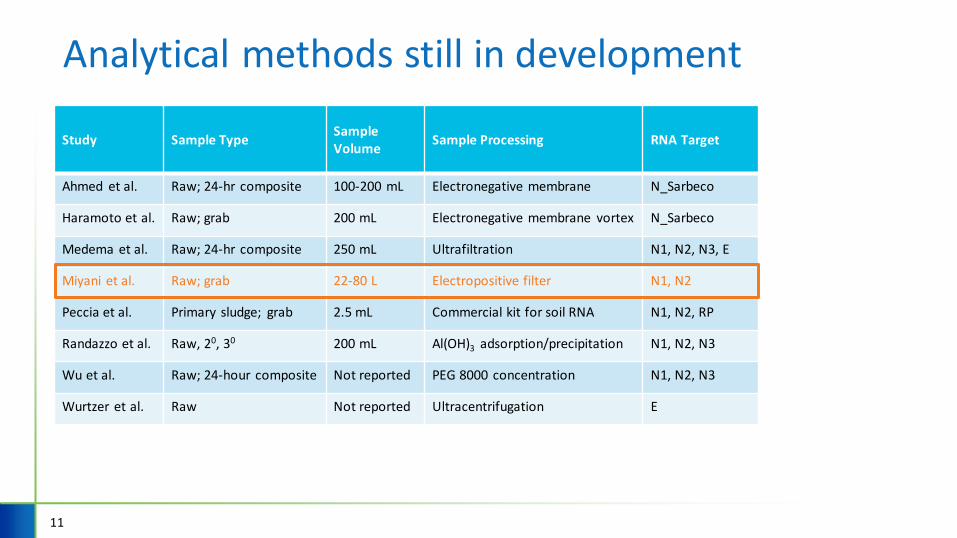
Study Sample TypeSample Volume
Sample Processing RNA Target
Ahmed et al. Raw; 24-hr composite 100-200 mL Electronegative membrane N_Sarbeco
Haramoto et al. Raw; grab 200 mL Electronegative membrane vortex N_Sarbeco
Medema et al. Raw; 24-hr composite 250 mL Ultrafiltration N1, N2, N3, E
Miyani et al. Raw; grab 22-80 L Electropositive filter N1, N2
Peccia et al. Primary sludge; grab 2.5 mL Commercial kit for soil RNA N1, N2, RP
Randazzo et al. Raw, 20, 30 200 mL Al(OH)3 adsorption/precipitation N1, N2, N3
Wu et al. Raw; 24-hour composite Not reported PEG 8000 concentration N1, N2, N3
Wurtzer et al. Raw Not reported Ultracentrifugation E
Analytical methods still in development

▪ Cumulative or new cases?
▪ Discrepancy between reported health data and estimates based on wastewater signal
▪ 0.026% reported vs. 0.1%-5% estimated for Boston (Wu et al. 2020)
▪ Health data scale (ZIP Code, county, city) vs. sewershed scale
12
GLWA Service Area
Correlation with COVID-19 prevalence/incidence

▪ City-scale▪ Facility specific▪ Beyond COVID-19
13
https://the-scientist.com
WBE is here to stay
▪ COVID-19 WBE Collaborative: https://www.covid19wbec.org/
▪ CDC/EPA National Wastewater Surveillance
How to stay up-to-date
Take-away themes

Questions