Embed Size (px)
Citation preview
COVID-19 Student Survey: Online Learning
Experiences and Challenges Experienced Related to the COVID-19 Pandemic
Spring 2020
Research by: Vera Froman Daniel Berumen Jaime Rodriguez Cathy Stute
August 2020

Mt. SAC COVID-19 Student Survey Page1
Table of Contents .................................................................................................................................................. 1
Executive Summary ................................................................................................................... 4
Introduction ................................................................................................................................ 6
Methodology .............................................................................................................................. 6
Analysis ..................................................................................................................................... 7
Limitations .................................................................................................................................. 7
Respondent Characteristics: Survey Representativeness .......................................................... 7
Table 1. Ethnicity of all credit enrollments compared to survey respondents ....................... 7
Table 2. Age of all credit enrollments compared to survey respondents .............................. 8
Table 3. Gender of all credit enrollments compared to survey respondents ........................ 8
Technology and Accessibility ..................................................................................................... 8
Table 4. How students are accessing online course content ............................................... 8
Table 5. How students are accessing online course content by ethnicity ............................ 9
Technological Issues .............................................................................................................. 9
Table 6. Technological issues experienced by students .....................................................10
Table 7. Themes regarding technological issues experienced by students ........................11
Accessibility Issues................................................................................................................11
Table 8. Accessibility issues experienced by students .......................................................12
Table 9. Themes regarding accessibility issues experienced by students ..........................13
Learning Experience and Social Interaction ..............................................................................13
Table 10. Concerns with transition to remote learning ........................................................13
Table 11. Themes regarding concerns with transition to remote learning ...........................14
Learning Issues .....................................................................................................................15
Table 12. Learning issues experienced since the transition to remote learning ..................15
Table 13. Learning issues experienced since the transition to remote learning by ethnicity16
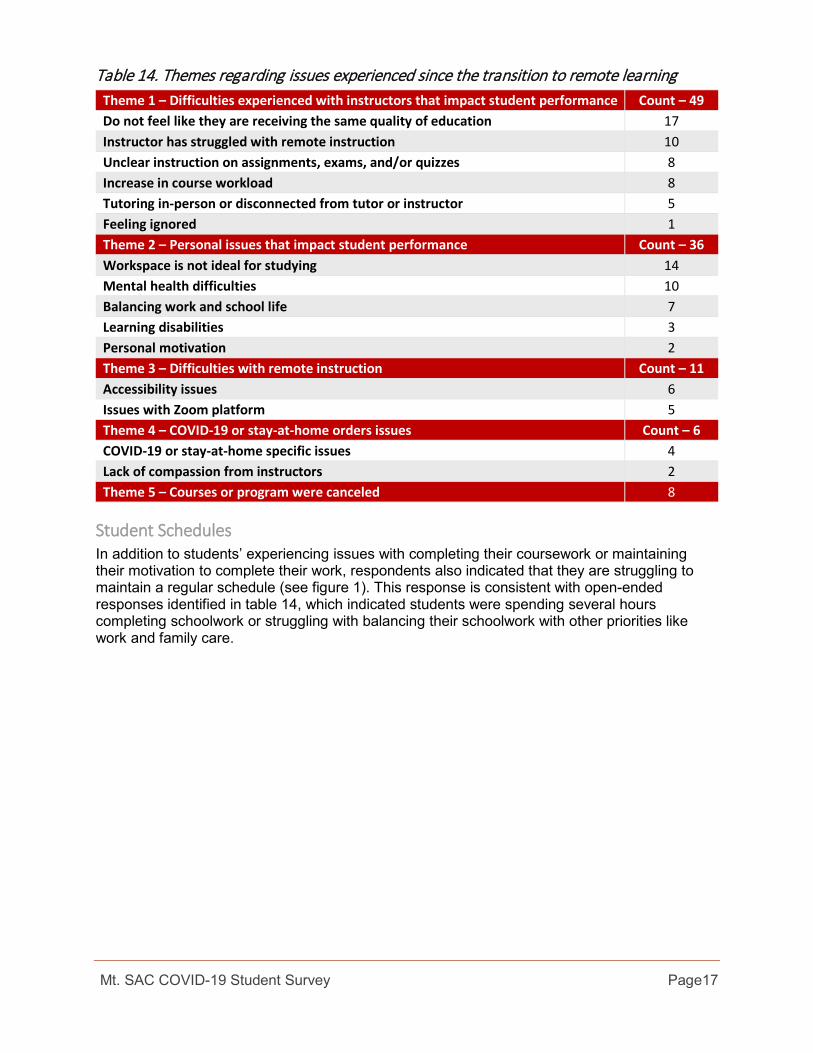
Table 14. Themes regarding issues experienced since the transition to remote learning ...17
Student Schedules ................................................................................................................17
Figure 1. Respondents ability to maintain a regular schedule at home to complete homework and assignments in a timely manner .................................................................18
Perceptions of Faculty ...........................................................................................................18
Figure 2. Respondents perception of faculty as considerate or inconsiderate of the students' circumstances .....................................................................................................18
Table 15. Themes regarding instructors being somewhat or very inconsiderate to students circumstances ....................................................................................................................19
Life, Health, and Basic Needs Issues ........................................................................................20
Table 16. Life and health issues .........................................................................................20

Mt. SAC COVID-19 Student Survey Page2
Table 17. Life and Health Issues by Ethnicity (Highly or Moderately Concerned Only) .......21
Working status of students ....................................................................................................21
Table 18. Working Status Prior to COVID-19 .....................................................................21
Figure 3. Working students’ status .....................................................................................22
Figure 4. Working students’ status by ethnicity* .................................................................22
Food and housing insecurity ..................................................................................................22
Table 19. Food and housing insecurity ...............................................................................23
Table 20. Food and housing insecurity by ethnicity (Often/sometimes only) .......................23
Table 21. Review of participants current living situation .....................................................24
Figure 5. Unsafe at home ...................................................................................................24
Mental State ..........................................................................................................................24
Table 22. Mental state of respondents over the last week ..................................................25
Awareness of Mt. SAC COVID-19 services and resources .......................................................25
Table 23. Mt. SAC resource awareness and use ...............................................................25
Counseling program participation ..............................................................................................25
Students biggest challenges and most positive experiences since classes transitioned to remote instruction .................................................................................................................................26
Table 24. Themes regarding student’s biggest challenge since classes transitioned to remote instruction ..............................................................................................................26
Positive Experiences .............................................................................................................28
Table 25. Themes regarding student’s positive experiences since classes transitioned to remote instruction ..............................................................................................................29
Recommendations and Opportunities for Improvement .............................................................30
Appendix A: Technology Issues, Open-Ended Responses not focused on Technology ............32
Table A1. Themes provided in the technological issues question that did not focus on technology .............................................................................................................................32
Appendix B: Accessibility Issues, Open-Ended Responses not focused on Accessibility ..........33
Table B1. Themes provided in the accessibility issues question that did not focus on accessibility ...........................................................................................................................33
Appendix C: Respondents that Reported Feeling Physically and/or Emotionally Unsafe in their Home ........................................................................................................................................34
Table C1. Experiences that have made respondents feel unsafe in their home .....................34
Appendix D: Mt. SAC Resources Evaluation .............................................................................35
Laptop lending program .........................................................................................................35
Table D1. Satisfaction with the laptop lending program ......................................................35
Mountie fresh food pantry ......................................................................................................35
Table D2. Satisfaction with the Mountie fresh food pantry ..................................................35
Online counseling ..................................................................................................................36
Table D3. Satisfaction with online counseling ....................................................................36

Mt. SAC COVID-19 Student Survey Page3
Table D4. Themes regarding respondents who were unsatisfied with online counseling ....37
COVID-19 excused withdrawal and/or pass/no pass status for course grades ......................37
Table D5. Satisfaction with the COVID-19 excused withdrawal and pass/no pass grading option .................................................................................................................................37
Table D6. Themes regarding respondents who were unsatisfied with the COVID-19 excused withdrawal and pass/no pass grading option ........................................................38
Mountie fresh basic needs resources ....................................................................................39
Table D7. Satisfaction with the Mountie fresh basic needs option ......................................39
Mt. SAC’s mental health services ..........................................................................................39
Table D8. Satisfaction with Mt. SAC’s mental health services ............................................39
Online tutoring services .........................................................................................................40
Table D9. Satisfaction with the online tutoring services ......................................................40
Table D10. Themes regarding respondents who were unsatisfied with the online tutoring services .............................................................................................................................40
Appendix E: Students involved in counseling or special programs ............................................42
Table E1. Special programs that respondents currently participate in ................................42
Table E2. Communication methods that have allowed continued participation in special programs............................................................................................................................43
Table E3. Preference for future communication with counseling, advising, tutoring, updates, or helpful information .........................................................................................................43

Mt. SAC COVID-19 Student Survey Page4
Executive Summary In response to the ongoing COVID-19 crisis and Mt. San Antonio College’s (Mt. SAC) move to a remote learning experience, the Office of Research and Institutional Effectiveness (RIE) and the Office of Instruction began planning a series of surveys to gather relevant feedback from the campus community including students, faculty, and staff. The first phase of this research was the creation and distribution of the COVID-19 Student Survey. The survey was influenced by a series of discussions throughout April 2020 that included input from Academic Senate and Student Services leadership. The student survey consisted of 42 total items, including multiple-choice and open-ended questions. The survey was sent to all spring 2020 credit students’ Mt. SAC email accounts on April 23, 2020, and was closed on May 18, 2020. A total of 27,763 students received an invitation to complete the survey and 2,828 responses were collected for a response rate of 10.2%. A review of the results provides the following highlights: Technology: A large majority of respondents indicated that a computer, laptop, or tablet was available to them to access their online content (94.0%). Most students indicated that they did not struggle with the use of technology for their courses. That said, the two most common technical issues students encountered were their instructors’ (38.7%) and their own (29.1%) discomfort or lack of familiarity with the required technologies or applications. In open-ended comments, students mentioned consistent connectivity issues with Zoom and Canvas and described how they were unable to access supporting hardware, such as printers and scanners, and software, such as Microsoft Word and Excel. Learning Experience and Social Interactions: In a series of questions related to their learning experience, students indicated that they were having trouble maintaining sufficient levels of time and effort to complete their schoolwork. Only 17.0% of students indicated that they were able to keep a regular schedule and 42.9% had issues finding time to participate in their classes. A slight majority of students expressed difficulties with online learning; for example, 53.7% had trouble focusing or paying attention to remote instruction or activities, and another 53.5% indicated that they had a personal preference for face-to-face learning. In total, 56.8% of respondents indicated they had issues completing their course assignments in a timely matter. Financial, housing, and mental health issues: Responses in this section indicated that students were encountering significant financial, housing, and health barriers to learning. Of the students who had a job before the COVID-19 crisis, 39.0% lost that job, and another, 36.3% had their hours and/or pay reduced. 35.0% of students indicated that in the last 30 days, the food they bought did not last and reported that they did not have the money to get more. In reference to student health: 79.2% of students indicated they were moderately or highly concerned with their mental and physical health, 75.1% were concerned with the effects of having a lower income, and 74.0% were concerned with issues related to social isolation. Awareness of Mt. SAC Covid-19 resources: To assess the effectiveness of the colleges messaging, students were asked to identify their awareness of various services and resources the college has made available to students. A large majority of students indicated an awareness of the excused withdrawal and Pass/No Pass options related to COVD-19 (86.8%), online counseling (77.3%), online tutoring (75.8%), and the Mountie Fresh Food Pantry (73.8%). Only 58.7% of students were aware, however, of Mt. SAC’s mental health services and only 52.9%
Mt. SAC COVID-19 Student Survey Page5
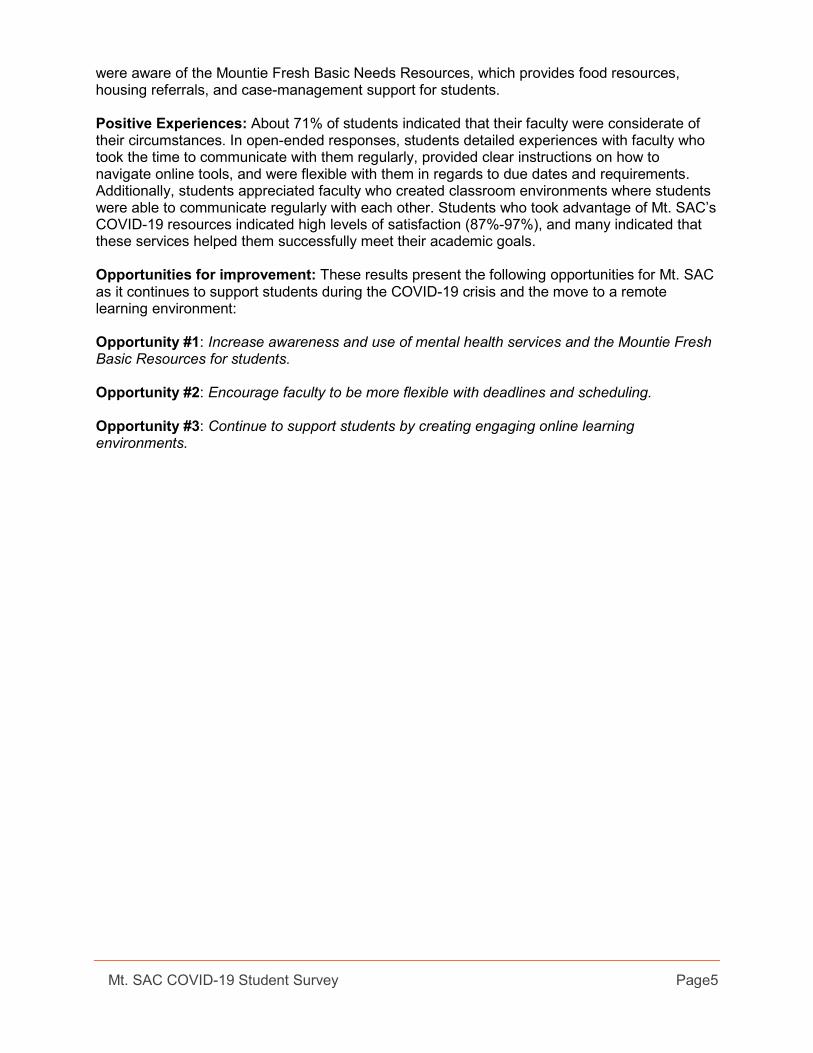
were aware of the Mountie Fresh Basic Needs Resources, which provides food resources, housing referrals, and case-management support for students. Positive Experiences: About 71% of students indicated that their faculty were considerate of their circumstances. In open-ended responses, students detailed experiences with faculty who took the time to communicate with them regularly, provided clear instructions on how to navigate online tools, and were flexible with them in regards to due dates and requirements. Additionally, students appreciated faculty who created classroom environments where students were able to communicate regularly with each other. Students who took advantage of Mt. SAC’s COVID-19 resources indicated high levels of satisfaction (87%-97%), and many indicated that these services helped them successfully meet their academic goals. Opportunities for improvement: These results present the following opportunities for Mt. SAC as it continues to support students during the COVID-19 crisis and the move to a remote learning environment: Opportunity #1: Increase awareness and use of mental health services and the Mountie Fresh Basic Resources for students. Opportunity #2: Encourage faculty to be more flexible with deadlines and scheduling. Opportunity #3: Continue to support students by creating engaging online learning environments.

Mt. SAC COVID-19 Student Survey Page6
Introduction In response to the ongoing COVID-19 crisis and Mt. San Antonio College’s (Mt. SAC) move to a remote learning experience, the Office of Research and Institutional Effectiveness (RIE) and the Office of Instruction began planning a series of surveys to gather relevant feedback from the campus community. The surveys intended to provide a space for community feedback about the college’s response to the crisis and identify additional resources or policies that would need to be implemented. The first phase of this research was the creation and distribution of the COVID-19 Student Survey. Discussions throughout April 2020, which included input from Academic Senate, Instruction, and Student Services leadership, influenced questions and areas of focus for the student survey. Additionally, as other researchers across the country were working to address the same issue, the Mt. SAC student survey drew from several other entities to identify additional valuable questions. These entities included the Hope Center, the Research and Planning (RP) Group, the Higher Education Data Sharing Consortium (HED), EDUCAUSE, and the Community College Equity Assessment Lab (CCEAL), among others. The final version of the student survey focused on five general areas of concern. The survey began by addressing issues related to technology, including access to hardware, software, and reliable internet access. The second section focused on issues related to the online learning experience, including questions related to challenges in course delivery, assignment completion, and social interactions. This was followed by a section heavily influenced by the Hope Center COVID-19 survey, which included questions about mental and emotional health, issues related to financial hardships, and food insecurity. The fourth section focused on services that Mt. SAC created or boosted in response to the situation. The final section prompted students to indicate any special programs they were involved in and their current participation status.
Methodology The student survey consisted of 42 total items, including multiple-choice and open-ended questions. The survey, built in the Qualtrics environment, included a functionality that allowed the researchers to display certain questions based on participant responses to previous questions. Additionally, students were not required to answer any question. Therefore, not all students completed the 42 items. The survey was delivered to all Spring 2020 credit students’ Mt. SAC email accounts on April 23, 2020, and was closed on May 18, 2020. Throughout the data collection period, two email reminders were sent to students who had not completed the survey. A total of 27,763 students received an invitation to complete the survey, and a total of 2,828 responses were collected for a response rate of 10.2%. Given a population size of 27,763 students registered during spring 2020 and a sample of 2,828, the current survey has a margin of error of plus or minus 2%. This error rate is used to generalize to the total population with a 95% confidence interval. For example, if one response option was endorsed by 60% of the sample, this margin of error suggests that the population endorsement would be between 58% and 62%.
Mt. SAC COVID-19 Student Survey Page7
Analysis Analysis of the survey included both quantitative analysis of valid responses and qualitative analysis of all open-ended questions. For the quantitative questions, all missing responses were removed and only valid responses were included in the final “N” or sample for that question; because of this, the “N” for each question may vary. For all open-ended questions or response options, the content of each response was reviewed, summarized, and organized by common over-arching themes. This analysis can often result in one open-ended response containing multiple themes.
Limitations The most relevant limitation with online surveys is respondents’ access to technology to complete the survey. Students, who were unable to access reliable internet and/or their Mt. SAC email accounts, would have been less likely to respond to the survey. Therefore, results may be over-reporting access to online learning. Additionally, the survey was only administered to students enrolled in credit courses. As such, the results do not include the perspective of Mt. SAC’s large noncredit population. These students were invited to participate in a separate survey administered by noncredit staff.
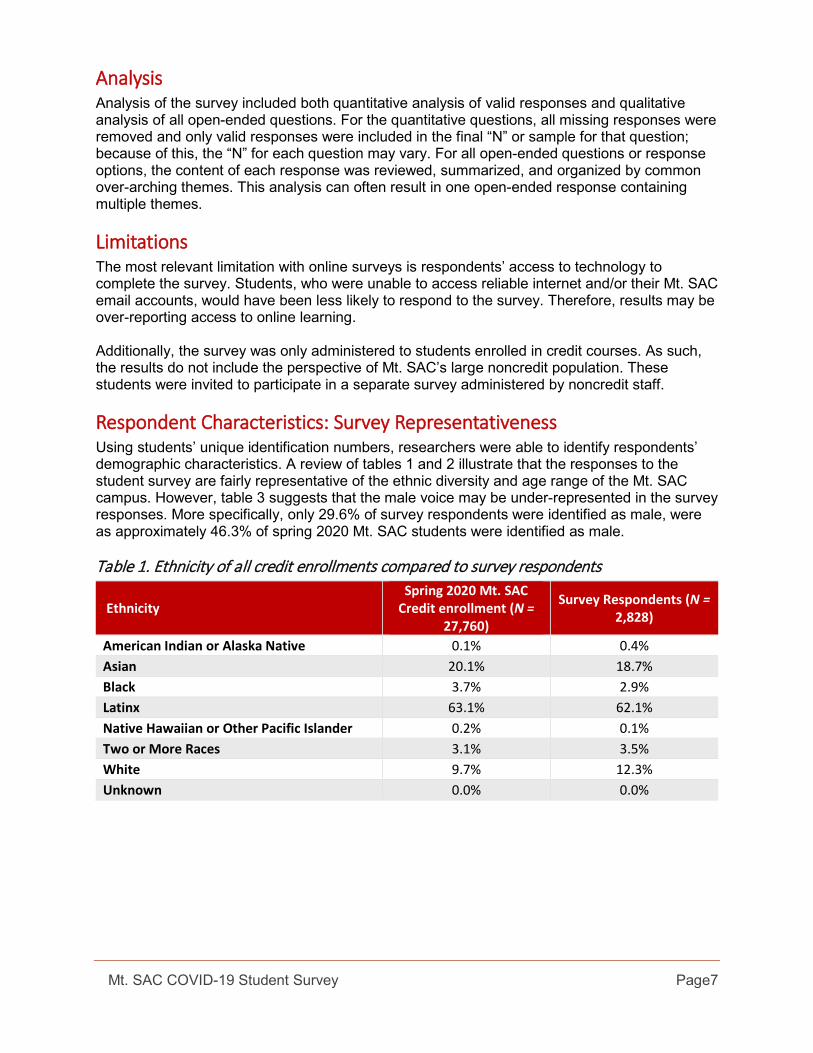
Respondent Characteristics: Survey Representativeness Using students’ unique identification numbers, researchers were able to identify respondents’ demographic characteristics. A review of tables 1 and 2 illustrate that the responses to the student survey are fairly representative of the ethnic diversity and age range of the Mt. SAC campus. However, table 3 suggests that the male voice may be under-represented in the survey responses. More specifically, only 29.6% of survey respondents were identified as male, were as approximately 46.3% of spring 2020 Mt. SAC students were identified as male.
Table 1. Ethnicity of all credit enrollments compared to survey respondents
Ethnicity Spring 2020 Mt. SAC
Credit enrollment (N = 27,760)
Survey Respondents (N = 2,828)
American Indian or Alaska Native 0.1% 0.4% Asian 20.1% 18.7% Black 3.7% 2.9% Latinx 63.1% 62.1% Native Hawaiian or Other Pacific Islander 0.2% 0.1% Two or More Races 3.1% 3.5% White 9.7% 12.3% Unknown 0.0% 0.0%

Mt. SAC COVID-19 Student Survey Page8
Table 2. Age of all credit enrollments compared to survey respondents
Age Spring 2020 Mt. SAC Credit Enrollment (N = 27,760) Survey Respondents (N = 2,828)
19 or less 22.0% 23.7% 20-24 43.2% 38.0% 25-29 17.4% 16.4% 30-34 7.5% 8.4% 35-39 3.6% 4.2% 40-54 5.1% 7.2% 55 and older 1.2% 2.0%
Table 3. Gender of all credit enrollments compared to survey respondents
Gender Spring 2020 Mt. SAC Credit Enrollment (N = 27,760) Survey Respondents (N = 2,828)
Female 52.2% 68.7% Male 46.3% 29.6% Unknown 1.5% 1.7%
Technology and Accessibility The first section of the survey focused on technological questions related to the switch to online learning. This topic included questions related to technology used to connect to online software, technology used to complete assignments, and any accessibility issues that students encountered. It should be noted, however, that while the focus of these questions was on technology use and access, in available open-ended options, students commented on aspects that were outside of this focus. The first question in this section prompted students to identify how they were able to access their online course content. Results indicated that approximately 94% of respondents had access to a personal computer, laptop, or tablet (refer to table 4). This number includes the 5.1% of respondents who were able to borrow a laptop directly from Mt. SAC.
Table 4. How students are accessing online course content Accessing Course Content Count Percent I have my own personal computer, laptop or tablet 2,061 73.4% I share a home computer, laptop or tablet 354 12.6% I borrowed a computer, laptop or tablet from someone outside of my home 77 2.7% I borrowed a laptop or tablet from Mt. SAC 147 5.2% I am only able to use my cellphone to access content 144 5.1% I have not been able to access Mt. SAC online course content 26 0.9% Total 2,809 100%
While a large majority of students reported having a device that allowed them to access their online course content, disaggregation of the data suggests that racial and ethnic disparities are evident in reference to accessing online course content. More specifically, table 5 indicates that students who self-identified as Latinx (82.8%), Black or African American (76.5%), and
Mt. SAC COVID-19 Student Survey Page9
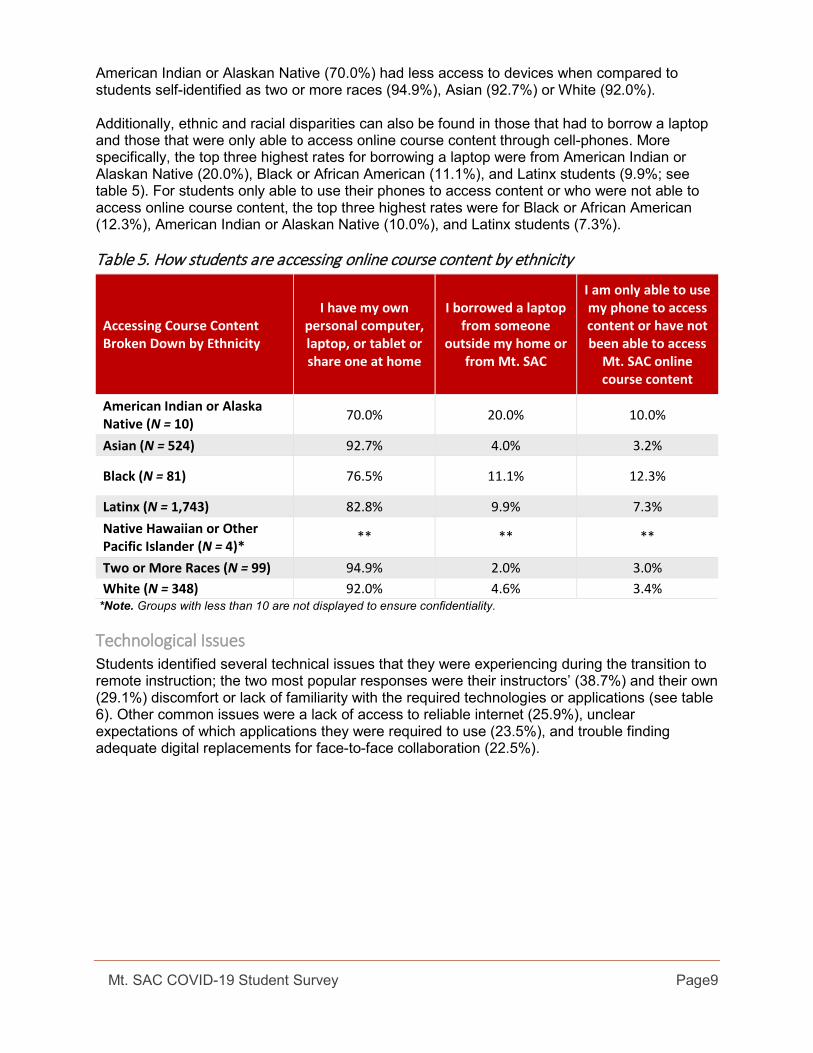
American Indian or Alaskan Native (70.0%) had less access to devices when compared to students self-identified as two or more races (94.9%), Asian (92.7%) or White (92.0%). Additionally, ethnic and racial disparities can also be found in those that had to borrow a laptop and those that were only able to access online course content through cell-phones. More specifically, the top three highest rates for borrowing a laptop were from American Indian or Alaskan Native (20.0%), Black or African American (11.1%), and Latinx students (9.9%; see table 5). For students only able to use their phones to access content or who were not able to access online course content, the top three highest rates were for Black or African American (12.3%), American Indian or Alaskan Native (10.0%), and Latinx students (7.3%).
Table 5. How students are accessing online course content by ethnicity
Accessing Course Content Broken Down by Ethnicity
I have my own personal computer, laptop, or tablet or share one at home
I borrowed a laptop from someone
outside my home or from Mt. SAC
I am only able to use my phone to access content or have not been able to access
Mt. SAC online course content
American Indian or Alaska Native (N = 10) 70.0% 20.0% 10.0%
Asian (N = 524) 92.7% 4.0% 3.2%
Black (N = 81) 76.5% 11.1% 12.3%
Latinx (N = 1,743) 82.8% 9.9% 7.3% Native Hawaiian or Other Pacific Islander (N = 4)*
** ** **
Two or More Races (N = 99) 94.9% 2.0% 3.0% White (N = 348) 92.0% 4.6% 3.4%
*Note. Groups with less than 10 are not displayed to ensure confidentiality.
Technological Issues Students identified several technical issues that they were experiencing during the transition to remote instruction; the two most popular responses were their instructors’ (38.7%) and their own (29.1%) discomfort or lack of familiarity with the required technologies or applications (see table 6). Other common issues were a lack of access to reliable internet (25.9%), unclear expectations of which applications they were required to use (23.5%), and trouble finding adequate digital replacements for face-to-face collaboration (22.5%).

Mt. SAC COVID-19 Student Survey Page10
Table 6. Technological issues experienced by students
Technological Issues Count Percent (N = 2,435)
Instructor discomfort or lack of familiarity with required technologies or applications 942 38.7%
My own discomfort or lack of familiarity with required technologies or applications 708 29.1%
My access to reliable internet/service 631 25.9% Unclear expectations around which technologies and applications I am required to use 573 23.5%
Adequate digital replacements for face-to-face collaboration tools (e.g., whiteboards) 549 22.5%
My access to other computer hardware (e.g., printer, scanner) 520 21.4% Other (please specify) 405 16.6% My access to library resources 341 14.0% My access to reliable communication software/tools (e.g., Zoom, Skype, Google) 329 13.5%
My access to specialized software (e.g., Adobe products) 329 13.5% My access to a reliable digital device (e.g., laptop, mobile device) 228 9.4% Adequate knowledge to effectively navigate canvas 220 9.0%
Of the 16.6% (N = 405) of respondents that marked “other (please specify),” approximately 378 wrote in an explanation of the additional technical issues they were experiencing. Of these responses, 76 wrote in none or some form that expressed that they were not experiencing any technological issues. Of the remaining responses, 98 times the response focused on a technological issue and 259 times it focused on other, non-technological issues. For additional information on the responses that did not include technology issues, please refer to Appendix A. The majority of respondents expressed difficulty with using platforms like Canvas, Zoom, Slack, the instructor’s website, or the textbook’s website. Two students stated:
“Canvas is unable to access fully on a laptop, so I have to use my cell phone to double-check assignments.”
“Also teacher using other sites besides canvas to have homework. They are adding multiple sites which makes it difficult for us to keep up with it.”
Additionally, students indicated that they lacked access to devices or other equipment for their course(s) or were experiencing connectivity issues. Some students indicated that they were expected to have a printer or they had to invest in a new laptop to participate in their course; furthermore, with classes online, having internet service that cuts out or not having internet, can make it very difficult to fulfill your class requirements or even participate. Additional quotes can be found below:
“I’m taking ENGR 24 (AutoCAD for engineers). Transitioning from using the lab computers in class to my laptop/tablet has affected my ability to efficiently complete the assignments. Simply put my personal laptop is not as good as the computers we had in class.”

Mt. SAC COVID-19 Student Survey Page11
“My professor was not helpful at all when I didn’t have Wi-Fi and could not send in an assignment. I asked to turn it in the minute I was connected to Wi-Fi and she would not take it. This was a math class. I struggle in math as it is.”
Refer to table 7 for the complete list of themes regarding technological issues experienced by respondents.
Table 7. Themes regarding technological issues experienced by students Themes – Technological Issues Count - 98 Difficulties using platforms (Canvas, Zoom, Slack, instructor website, text website) 22 Lack of access to devices or other equipment for course 18 Connectivity (internet, Wi-Fi), access, or functionality 12 Faculty technology issues 8 Lack of access to necessary applications 7 Personal device difficulties 7 Inconsistent placement of course content in Canvas 5 Lack of knowledge or training on using technology 5 Difficulty with proctoring application during test 5 Mt. SAC portal issues 3 Privacy concerns with technology 2 ADA content issues 2 Added expense to buy technology 2
Accessibility Issues Finally, with most classes transitioned to a remote environment, we asked students to identify what kind, if any, accessibility issues they may be experiencing. Of those that responded to the survey, 50.1% reported that they do not require any accessibility accommodations now that their classes are online; however, 30.6% indicated that they did need extra time for exams and quizzes and 15.8% needed access to an accessible tutor (see table 8).

Mt. SAC COVID-19 Student Survey Page12
Table 8. Accessibility issues experienced by students
Accessibility Issues Count Percent (N = 2,320)
I do not require accessibility accommodations. 1,162 50.1% Extra time on tests/quizzes 710 30.6% Accessible tutoring 367 15.8% Digital material in alternate formats, such as text enlargements, screen reader 188 8.1%
Test proctoring 176 7.6% Availability of live captioning on video conferencing 151 6.5% Access to a note taker 146 6.3% Access to assistive technology hardware or software 145 6.3% Integrating captioning into Zoom 135 5.8% Other (please specify) 122 5.3% Availability of closed captioning 91 3.9% Accessibility of canvas 81 3.5% Access to ASL interpreters 17 0.7%
Of the 107 respondents who provided a write-in response after marking “other (please specify),” 31 indicated that they were not experiencing any accessibility issues. Of the remaining responses, there were 38 references to accessibility issues and 57 references to other issues not relevant to accessibility. Most indicated that they needed additional time for classwork and exams or had no access to class notes or lecture recordings. See below for examples regarding these themes:
“Professor not accommodating my Access request for extra time.”
“Professors need to be more understanding and give more time on exams and certain assignments. For example, I have a lab and we have to do our labs online and there’s no help just do the lab by watching videos like the class is hard itself and they expect us to learn off a 3-minute video to complete 12 pages.”
“Recording lectures, personally I have home distractions, it would be nice to be able to access lectures at other times.”
Although, students remarked about accessibility concerns, a review of the responses suggest that participants misunderstood the intent of the question. Specifically, this question was focused on understanding if students needed accommodations because of visual impairment, disability, cognitive difficulties or other similar impairments that may interfere with their ability to interact with the material. Responses to this question, suggest that it may have been interpreted to mean access to things that would make the class easier in general. Please refer to table 9 below for additional accessibility themes that emerged in the open-ended response option. For information on themes that did not relate to accessibility, but were provided under this question, please refer to Appendix B.

Mt. SAC COVID-19 Student Survey Page13
Table 9. Themes regarding accessibility issues experienced by students Themes – Accessibility Issues Count 38 Need additional time for classwork and exams 10 No access to class notes or lecture recordings 8 Challenges with application software used 6 Need live question and answer with professors 4 Accommodations request ignored by professor 4 No access to or compatibility with accessibility tools 3 Limited access to tutoring 3
Learning Experience and Social Interaction The second section of the survey focused on issues related to learning in an online environment. This included their concerns with the transition, issues they had while they were learning online, and their ability to maintain regular schedules during the COVID-19 crisis. When asked about concerns that students are facing since classes transitioned to remote instruction, 69% of respondents indicated that they were worried about keeping up with their coursework, and 64.2% were worried about their performance in the course. Relatedly, 63.3% of respondents were concerned with balancing school with other priorities. Refer to table 10 for further details on other relevant concerns including communication with instructors and classmates, and experiencing delays in their educational progress.
Table 10. Concerns with transition to remote learning Concerns With Transition To Remote Learning Count Percent (N = 2,582) Keeping up with coursework 1,783 69.1% Grades/performing well in class 1,658 64.2% Balancing school with other priorities 1,635 63.3% Communication with instructors 1,187 46.0% Communication with classmates 936 36.3% Possible delays in graduating/completing my program 936 36.3% Missing out on extracurricular/on-campus activities 713 27.6% Changes to grading structure (e.g., pass/fail, credit/no-credit) 498 19.3% Online privacy, protection of personal data 463 17.9% Security/privacy in taking online exams 301 11.7% Accessibility accommodations 246 9.5% Other (please specify) 221 8.6% Completing my internship or practicum requirements 208 8.1%
Of the 8.6% (N = 221) of respondents that marked “other (please specify),” 216 provided a written response. Of these written responses, 23 instances reflected a “none” or “not applicable” type response. The remaining responses provided five over-arching themes reflecting respondent concerns regarding the transition to remote instruction (see table 11).

Mt. SAC COVID-19 Student Survey Page14
Table 11. Themes regarding concerns with transition to remote learning Theme 1 – Quality of Learning Concerns Count - 88 Quality of online setting 31 Having to teach myself or learning remotely is difficult 25 Prefer hands-on learning or access to lab, course tools 24 Lack of access to student support services 8 Theme 2 – Personal Concerns Count – 81 Mental health, stress, isolation 23 Competing priorities due to pandemic, work, family, and school 21 Inadequate studying environment or distractions at home 20 Job security or financial concerns or housing concerns 9 Miss interaction with classmates 8 Theme 3 – Faculty Concerns Count – 67 Faculty demands or heavy coursework 33 Lack of faculty support 16 Prefer face-to-face communication with faculty 14 Faculty training needed 4 Theme 4 – Academic Impact Concerns Count – 49 Delays due to canceled classes, retakes, transfer concerns 41 Grade concerns, unclear grading, grades dropping after the move to remote learning 8 Theme 5 – Technology Concerns Count – 16 Connectivity issues 6 Safety or invasion of privacy at home 5 Difficulty with technology for coursework 5
The most frequently cited concerns in participant responses included concerns about how the quality of their education may be impacted and personal concerns like their mental health and balancing their school, work, and family priorities. Below are several example quotes regarding these concerns:
“Not actually learning anything since it is hard to retain information when the lectures are not face-to-face. Instead of learning, I am simply just finishing assignments before their due dates. This concerns me, as I am going to need this information in future classes.” “Life is busier. Trying [to] balance care for [my] child and [my] mental stability with school and work [is] becoming increasingly difficult. Finding it harder and harder to focus [on] school work.” “I am a caregiver for an elder parent who requires much of my time to manage their healthcare. Because of COVID-19, my duties have increased exponentially and it is a hardship to balance life care with school work.”

Mt. SAC COVID-19 Student Survey Page15
Learning Issues After expressing their concerns with the move to remote instruction, respondents identified the learning issues they have experienced once classes were fully online. In this environment, issues with coursework were again a major topic for respondents. About 57% of respondents indicated they had trouble completing course assignments on time and that they had issues with their motivation and/or desire to complete their coursework (see table 12). Following issues with coursework, respondents selected issues related to learning in an online environment: 53.7% of students had difficulty focusing or paying attention to remote instruction or activities and for 53.5% of respondents their preference for face-to-face learning became an issue. Participation in class was also an issue for students, with 42.9% experiencing problems with finding time to participate in class and 28.1% having issues completing class meetings and schedules.
Table 12. Learning issues experienced since the transition to remote learning
Learning Issues Since Transition Count Percent (N = 2,449)
Completing course assignments in a timely manner 1,390 56.8% Personal motivation/desire to complete coursework 1,387 56.6% Difficulty focusing or paying attention to remote instruction or activities 1,315 53.7%
Personal preference for face-to-face learning 1,310 53.5% Unclear expectations around course/assignment requirements 1,067 43.6% Finding time to participate in classes (e.g., live-streaming lectures or video conferencing at a set time) 1,050 42.9%
Course lessons or activities that haven't translated well to a remote environment 880 35.9%
Completing class meetings and schedules 688 28.1% Instructor availability/responsiveness 478 19.5% Other (please specify) 151 6.2%
Further analysis of learning issues experienced by ethnicity found some notable differences among different groups of students. For instance, 64.8% of Black or African American and 59.2% of Latinx students indicated that completing course assignments on time was a learning issue they were experiencing (table 13, below). These rates are 14.0% and 8.4% higher than Asian students, respectively. Similarly, while 22.6% of White students had trouble completing class meetings and schedules, 38.0% of Black or African American and 30.2% Latinx students indicated this was a learning issue. These were differences of 15.4% and 7.6%, respectively.

Mt. SAC COVID-19 Student Survey Page16
Table 13. Learning issues experienced since the transition to remote learning by ethnicity
Learning Issues Since Transition Broken Down by Ethnicity
Completing course assignments in a timely manner
Completing class meetings and schedules
American Indian or Alaska Native (N = 9)* ** **
Asian (N = 439) 50.8% 23.2%
Black (N = 71) 64.8% 38.0%
Latinx (N = 1,535) 59.2% 30.2%
Native Hawaiian or Other Pacific Islander (N = 4)* ** **
Two or More Races (N = 86) 53.5% 27.9%
White (N = 305) 52.5% 22.6% *Note. Groups with less than 10 are not displayed to ensure confidentiality. Furthermore, respondents used the “other (please specify)” option for this question to reflect concerns that were similar to the concerns remarked in the previous question. The major themes that emerge from the 142 responses provided were: difficulties with instructors, personal issues that have impacted their performance, difficulties with remote instruction, COVID-19 or the stay-at-home orders that have impacted them, and the fact that their courses or programs were unable to transition to remote instruction (see Table 14). There were 25 responses which indicated that they were not experiencing any issues and 14 responses that were not relevant to the question. Example responses from participants include:
“Understand that for me to complete my course work in a timely manner, means I have to spend 9+ hours a day, 6 days a week, working on my classes. Because most don't provide any face-to-face lectures…I have to literally sit and write all of my reading material down, as I read it just so I CAN’T EXPLETIVE RETAIN THE INFORMATION.”
“Finding time and [a] place without being interrupted by kids and family.”
“I have a difficult time focusing. I had two family members pass away during the course of this time. I am struggling to try to balance my time. I am, officially, getting depressed because I am forced to mourn inside, at home where everyone else is sad. It has just been an emotional rollercoaster all around.”
“Canvas desktop version has been giving me difficulty when submitting assignments and looking up assignments.”
Mt. SAC COVID-19 Student Survey Page17
Table 14. Themes regarding issues experienced since the transition to remote learning Theme 1 – Difficulties experienced with instructors that impact student performance Count – 49 Do not feel like they are receiving the same quality of education 17 Instructor has struggled with remote instruction 10 Unclear instruction on assignments, exams, and/or quizzes 8 Increase in course workload 8 Tutoring in-person or disconnected from tutor or instructor 5 Feeling ignored 1 Theme 2 – Personal issues that impact student performance Count – 36 Workspace is not ideal for studying 14 Mental health difficulties 10 Balancing work and school life 7 Learning disabilities 3 Personal motivation 2 Theme 3 – Difficulties with remote instruction Count – 11 Accessibility issues 6 Issues with Zoom platform 5 Theme 4 – COVID-19 or stay-at-home orders issues Count – 6 COVID-19 or stay-at-home specific issues 4 Lack of compassion from instructors 2 Theme 5 – Courses or program were canceled 8
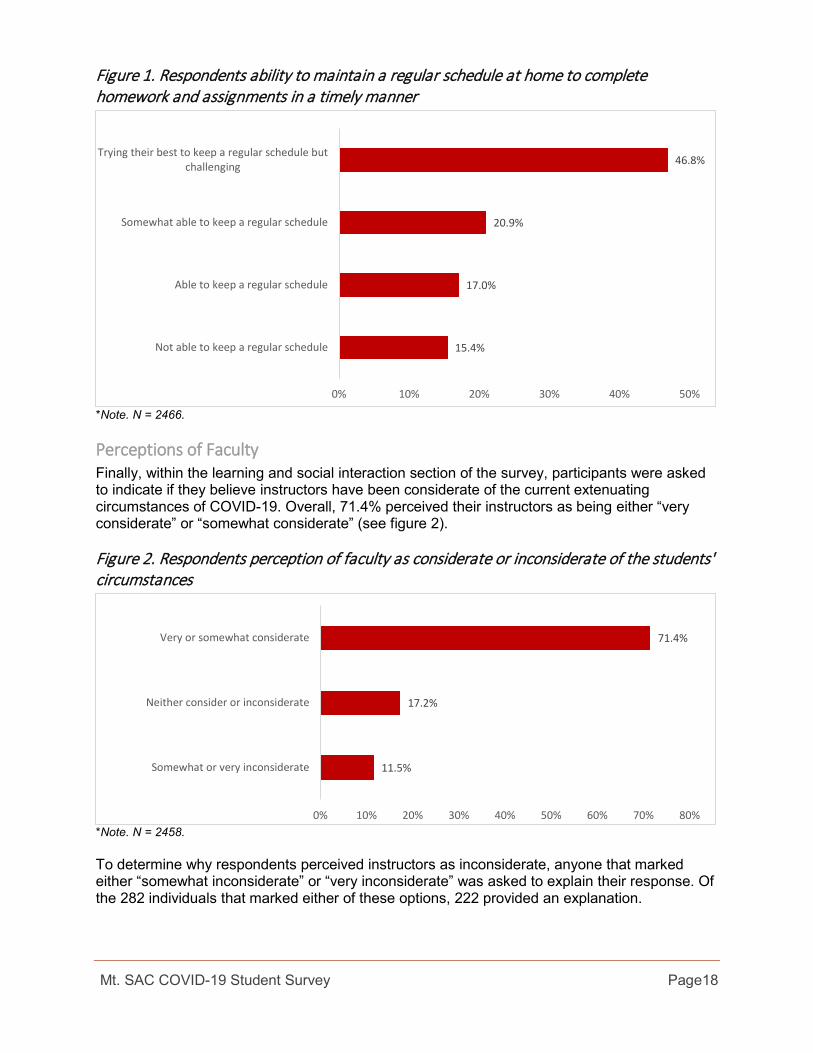
Student Schedules In addition to students’ experiencing issues with completing their coursework or maintaining their motivation to complete their work, respondents also indicated that they are struggling to maintain a regular schedule (see figure 1). This response is consistent with open-ended responses identified in table 14, which indicated students were spending several hours completing schoolwork or struggling with balancing their schoolwork with other priorities like work and family care.
Mt. SAC COVID-19 Student Survey Page18
Figure 1. Respondents ability to maintain a regular schedule at home to complete homework and assignments in a timely manner
*Note. N = 2466.
Perceptions of Faculty Finally, within the learning and social interaction section of the survey, participants were asked to indicate if they believe instructors have been considerate of the current extenuating circumstances of COVID-19. Overall, 71.4% perceived their instructors as being either “very considerate” or “somewhat considerate” (see figure 2).
Figure 2. Respondents perception of faculty as considerate or inconsiderate of the students' circumstances
*Note. N = 2458. To determine why respondents perceived instructors as inconsiderate, anyone that marked either “somewhat inconsiderate” or “very inconsiderate” was asked to explain their response. Of the 282 individuals that marked either of these options, 222 provided an explanation.
15.4%
17.0%
20.9%
46.8%
0% 10% 20% 30% 40% 50%
Not able to keep a regular schedule
Able to keep a regular schedule
Somewhat able to keep a regular schedule
Trying their best to keep a regular schedule butchallenging
11.5%
17.2%
71.4%
0% 10% 20% 30% 40% 50% 60% 70% 80%
Somewhat or very inconsiderate
Neither consider or inconsiderate
Very or somewhat considerate
Mt. SAC COVID-19 Student Survey Page19
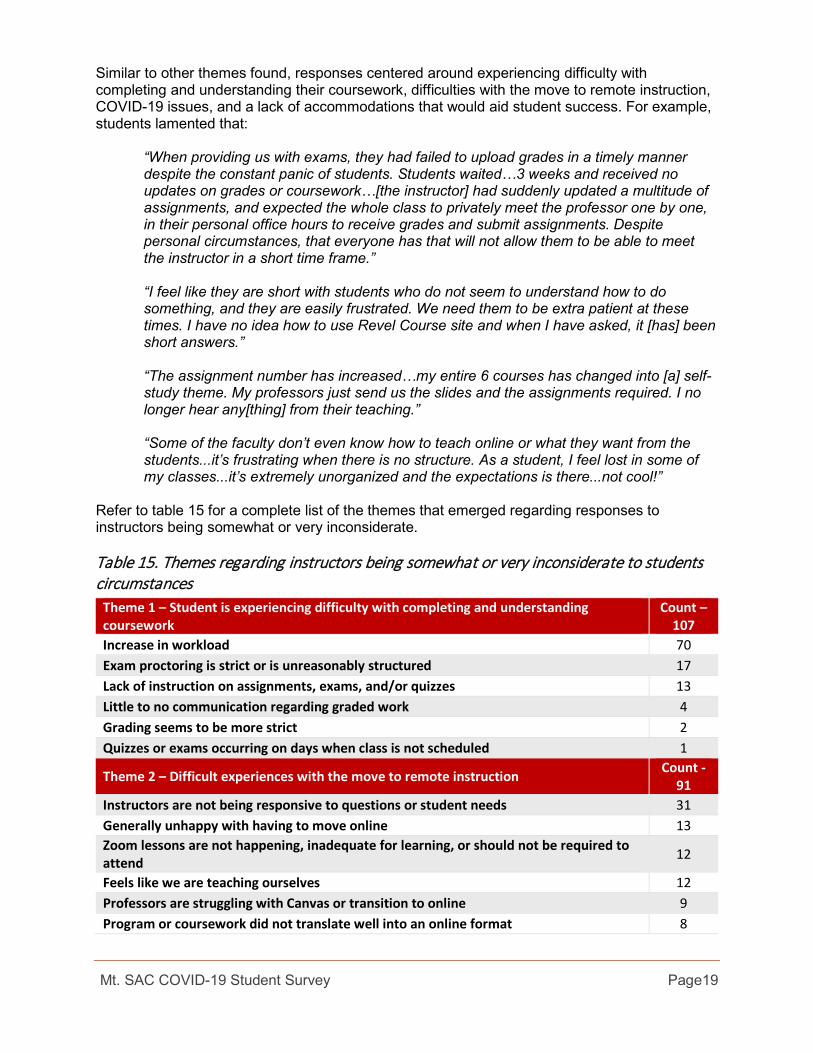
Similar to other themes found, responses centered around experiencing difficulty with completing and understanding their coursework, difficulties with the move to remote instruction, COVID-19 issues, and a lack of accommodations that would aid student success. For example, students lamented that:
“When providing us with exams, they had failed to upload grades in a timely manner despite the constant panic of students. Students waited…3 weeks and received no updates on grades or coursework…[the instructor] had suddenly updated a multitude of assignments, and expected the whole class to privately meet the professor one by one, in their personal office hours to receive grades and submit assignments. Despite personal circumstances, that everyone has that will not allow them to be able to meet the instructor in a short time frame.” “I feel like they are short with students who do not seem to understand how to do something, and they are easily frustrated. We need them to be extra patient at these times. I have no idea how to use Revel Course site and when I have asked, it [has] been short answers.” “The assignment number has increased…my entire 6 courses has changed into [a] self-study theme. My professors just send us the slides and the assignments required. I no longer hear any[thing] from their teaching.”
“Some of the faculty don’t even know how to teach online or what they want from the students...it’s frustrating when there is no structure. As a student, I feel lost in some of my classes...it’s extremely unorganized and the expectations is there...not cool!”
Refer to table 15 for a complete list of the themes that emerged regarding responses to instructors being somewhat or very inconsiderate.
Table 15. Themes regarding instructors being somewhat or very inconsiderate to students circumstances
Theme 1 – Student is experiencing difficulty with completing and understanding coursework
Count – 107
Increase in workload 70 Exam proctoring is strict or is unreasonably structured 17 Lack of instruction on assignments, exams, and/or quizzes 13 Little to no communication regarding graded work 4 Grading seems to be more strict 2 Quizzes or exams occurring on days when class is not scheduled 1
Theme 2 – Difficult experiences with the move to remote instruction Count - 91
Instructors are not being responsive to questions or student needs 31 Generally unhappy with having to move online 13 Zoom lessons are not happening, inadequate for learning, or should not be required to attend 12
Feels like we are teaching ourselves 12 Professors are struggling with Canvas or transition to online 9 Program or coursework did not translate well into an online format 8

Mt. SAC COVID-19 Student Survey Page20
The instructor is not involved in teaching 4 Teacher dropped student from class without letting them know 1 Computer was hacked 1 Theme 3 – COVID-19 issues that students are experiencing in reference to their performance
Count – 74
Lack of understanding of how COVID-19 and stay-at-home orders have impacted students 32
Lack of compassion in general 30 Instructors do not seem to understand that students time is now monopolized by carrying for others 12
Theme 4 – Little to no accommodations are made to aid students within the course or with completion of coursework
Count – 53
No leniency in general for late work 25 Limited or no access to needed resources 12 Essential worker and schedule has increased, instructor is unwilling to accommodate 12 Access concerns – not receiving proper accommodations 2 Would prefer greater access to assignments 1 Briefly experienced homelessness which impeded completion of coursework 1
*Note. 5 responses indicated that they were not experiencing issues with mental health and 3 provided a response that was not relevant to the question.
Life, Health, and Basic Needs Issues As previously mentioned, the following section derived several questions from the Hope Center’s COVID-19 survey. These questions focused on understanding the student experience outside of the classroom. The survey asked participants about their food and housing security, job and income security, and asked about their mental and emotional state. Table 16 indicates that of the students who participated in the survey, 79.2% are highly or moderately concerned with their current mental and physical health; this was closely followed by having a lower income (75.1%), social isolation (74.0%), and reduced working hours (67.7%). Additionally, slightly less than half of the respondents were concerned about housing instability (45.0%) or lack of food in their household (43.6%).
Table 16. Life and health issues
Life/Health Issues Highly/Moderately Concerned Not Concerned
Mental/Physical health (N = 2,443) 79.2% 20.8% Lower income (2,434) 75.1% 24.9% Social isolation (N = 2,444) 74.0% 26.0% Reduced working hours (N = 2,424) 67.7% 32.3% Inability to pay my bills (N = 2,441) 67.4% 32.6% Job loss (N = 2,438) 66.7% 33.3% Personal Safety (N = 2,429) 60.7% 39.3% Lack of food in my household (N = 2,440) 45.0% 55.0% Housing instability (N = 2,436) 43.6% 56.4%

Mt. SAC COVID-19 Student Survey Page21
An examination of this data by ethnicity indicated disparities between different groups. American Indian or Alaskan Native and Black or African American students had higher rates of concerns compared to White and Asian students (see table 17). While the count is only 10 for American Indian or Alaska Native students, they demonstrated the highest rate for lack of food (80.0%), housing insecurity (90.0%), and an inability to pay bills (90.0%). Similarly, 58.3% of Black or African American students were concerned with a lack of food in their household and 76.4% were concerned with paying their bills compared to only 32.5% and 58.6% of White students, respectively.
Table 17. Life and Health Issues by Ethnicity (Highly or Moderately Concerned Only)
Ethnicity Lack of food in my household
Housing instability
Inability to pay my bills
Personal safety
American Indian or Alaska Native (N = 10) 80.0% 90.0% 90.0% 60.0%
Asian (N = 443) 42.4% 43.8% 65.2% 65.9%
Black (N = 72) 58.3% 45.8% 76.4% 56.9%
Latinx (N = 1,514) 47.7% 45.9% 69.4% 62.3%
Native Hawaiian or Other Pacific Islander (N = 4) ** ** ** **
Two or More Races (N = 87) 36.8% 33.3% 63.2% 49.4%
White (N = 314) 32.5% 32.2% 58.6% 46.8%
Working status of students To gain additional insight into how the COVID-19 crisis has impacted students beyond the classroom, participants were asked about their employment status before the pandemic. Of the students who responded, 69.3% indicated that they were employed prior to the crisis (see table 18).
Table 18. Working Status Prior to COVID-19 Employed Prior to COVID-19 Count Percent Yes 1,668 69.3% No 740 30.7% Total 2,408 100%
Those who were employed before COVID-19 were then prompted to indicate the current status of their employment. Of those that participated in the survey and were working prior to COVID-19, 39.0% indicated that they have lost their job and 36.3% reported that their hours or pay have been reduced (see Figure 3).

Mt. SAC COVID-19 Student Survey Page22
Figure 3. Working students’ status
*Note. N = 1,660. When the data is disaggregated by ethnicity, as in figure 4 below, some differences were found between ethnic groups. For example, 33.5% of White students indicated that they lost their job; however, 45.6% of students who were identified as two or more races, and 42.3% of Black students also indicated that they lost their job.
Figure 4. Working students’ status by ethnicity*
*Note. Groups with less than 10 were excluded to ensure confidentiality.
Food and housing insecurity In reference to food and housing security, we asked students to think about what they have experienced in the last 30 days. Exactly 65.0% reported never experiencing food not lasting, or not having money to get food during this period. Furthermore, 97.3% reported never having to sleep in an outdoor location (see table 19). Although the majority of participants were not experiencing any food or housing insecurities, approximately 35.0% - 36.5% of students reported some type of food insecurity and 2.7% - 9.6% reported some type of housing insecurity. This suggests that there is still a group of students who are in need of Mt. SAC resources to address these issues.
24.8%
36.3%
39.0%
0% 5% 10% 15% 20% 25% 30% 35% 40% 45%
Nothing has changed
My hours/pay were reduced
Lost job
41.4% 42.3% 39.0%45.6%
33.5%
36.5% 28.8% 36.5%30.9%
38.0%
0.0%
10.0%
20.0%
30.0%
40.0%
50.0%
60.0%
70.0%
80.0%
Asian (N=249) Black or AfricanAmerican (N=52)
Latinx (N=1,062) Two or More Races(N=68)
White (N=221)
Lost job My hours/pay were reduced

Mt. SAC COVID-19 Student Survey Page23
Table 19. Food and housing insecurity
Last 30 Days: Often/Sometimes Never
The food that I bought didn’t last and I didn’t have money to get more. (N = 2,412) 35.0% 65.0%
Cut the size of your meals/skip meals because there wasn't enough money for food. (N = 2,414) 36.5% 63.5%
Only had a place to stay temporarily. (N = 2,411) 9.6% 90.4%
I had to sleep in an outdoor location (N = 2,415) 2.7% 97.3%
Disaggregating the data in table 19 by ethnicity indicates some differences among groups. Higher rates of American Indian or Alaskan Native (70%), Black (47.9%), and Latinx students (38.0%) indicated that the food they bought did not last (see table 20). These same groups were more likely to cut the size of their meals compared to Asian and White students. For students who indicated they had to sleep in an outdoor location in the last 30 days, students with the highest rates included American Indian or Alaskan Native (10.0%) and Black or African American students (7.0%).
Table 20. Food and housing insecurity by ethnicity (Often/sometimes only)
Last 30 Days (Often/Sometimes Responses Only)
The food that I bought didn’t
last and I didn’t have money to
get more
Cut the size of your meals/skip meals because there wasn't
enough money for food
Only had a place to stay
temporarily
I had to sleep in an outdoor
location
American Indian or Alaska Native (N = 10) 70.0% 80.0% 40.0% 10.0%
Asian (N = 436) 31.0% 33.7% 11.7% 2.3%
Black (N = 71) 47.9% 54.9% 15.5% 7.0%
Latinx (N = 1,498) 38.0% 38.1% 8.9% 2.6% Native Hawaiian or Other Pacific Islander (N = 4)
** ** ** **
Two or More Races (N = 84) 32.1% 39.3% 10.7% 3.6%
White (N = 312) 21.8% 25.6% 7.1% 1.9% *Note. Groups with less than 10 were excluded to ensure confidentiality. When participants were asked specifics about their current living situation, 81.6% either “strongly agreed” or “somewhat agreed” that their living situation is stable and consistent. Furthermore, 71.6% said that they can study and engage in their courses from their current

Mt. SAC COVID-19 Student Survey Page24
living situation. Reflectively, however, 12.4% either “strongly agreed” or “somewhat agreed” with the statement that their current living situation is temporary (see table 21).
Table 21. Review of participants current living situation
Living situation Strongly/
Somewhat agree
Neither agree nor disagree
Somewhat/ Strongly Disagree
My living situation is stable and consistent. (N = 2,385) 81.6% 9.1% 3.3%
I can study and engage in classes where I am living. (N = 2,386) 71.6% 11.0% 6.7%
My living situation is temporary, even if I wanted to stay. (N = 2,362) 12.4% 11.0% 68.4%
In addition to their living situation, students were prompted to indicate if in the last 30 days they felt physically or emotionally unsafe in their home. Of those that responded to this question, 88.6% indicated that they did not feel unsafe in their home (see figure 5). For more information on the 11.4% that reported feeling unsafe, please see Appendix C.
Figure 5. Unsafe at home
*Note. N = 2389.
Mental State Finally, respondents were asked about their mental state over the last week. Of those that responded to this question, 28.1% reported becoming easily annoyed or irritable nearly every day and approximately, 25% reported being so restless, that it is hard to sit still, and of worrying too much about different things (see table 22). While several reported these experiences occurring every day, the majority of respondents (between 57.0% and 47.3%) reported only experiencing these feelings on a few days or over half the days in the last week.
11.4%
88.6%
0% 10% 20% 30% 40% 50% 60% 70% 80% 90% 100%
Yes
No

Mt. SAC COVID-19 Student Survey Page25
Table 22. Mental state of respondents over the last week
In last week: Nearly Every Day
Over half/few days
Not at all
Becoming easily annoyed or irritable (N = 2,365) 28.1% 57.0% 14.9% Being so restless that it's hard to sit still (N = 2,366) 25.8% 55.8% 18.4% Worrying too much about different things (N = 2,365) 25.4% 59.5% 15.1%
Feeling nervous, anxious, or on edge (N = 2,362) 21.8% 52.7% 25.5% Not being able to stop or control worrying (N = 2,369) 20.4% 47.5% 32.0%
Feeling afraid as if something awful might happen (N = 2,364) 19.3% 47.3% 33.4%
Awareness of Mt. SAC COVID-19 services and resources Due to the urgency, that classes had to be moved to an online format and the impact that COVID-19 was expected to have on students, Mt. SAC made efforts to provide students with resources that they may need to continue their schooling or to supplement or support basic needs. When asked if respondents were aware of these services and if they had used them, 22.8% of respondents indicated that they had used the COVID-19 excused withdrawal and pass/no pass status for course grades and 19.3% said they had utilized the online counseling service(see table 23). While respondents in previous questions indicated issues with food, housing and mental health, only 52.9% of respondents were aware of the Mountie Fresh Basic Needs resource, and 58.7% were aware of mental health services available.
Table 23. Mt. SAC resource awareness and use
Resource Awareness Yes, and
have used it
Yes, but I have not used it
No
Laptop lending (N = 2,339) 7.4% 61.5% 31.1% Mountie Fresh Food Pantry (N = 2,336) 10.7% 63.2% 26.2% Online Counseling (N = 2,335) 19.3% 58.0% 22.7% COVID Excused Withdrawal and Pass/No Pass statuses for course grades (N = 2,334) 22.8% 64.0% 13.2%
Mountie Fresh Basic Needs Resources (food resources, housing referrals, case management support) (N = 2,331)
2.6% 50.3% 47.1%
Mental Health Services (N = 2,337) 3.4% 55.3% 41.3% Online Tutoring (N = 2,338) 9.5% 66.3% 24.2%
For more information on how respondents that used these services, evaluated them, please see Appendix D.
Counseling program participation With the Mt. SAC campus closing, participants were asked about their participation in counseling and special programs like the Minority Male Initiative, REACH, Veterans services,

Mt. SAC COVID-19 Student Survey Page26
and other similar programs. The focus of these questions was to provide insight into how students are still interacting with these programs. While informative, this data is less focused on COVID-19 experiences or learning experience given remote instruction; due to this, the results focused on students in counseling or special programs can be found in Appendix E.
Students biggest challenges and most positive experiences since classes transitioned to remote instruction The final questions of the survey focused on the best and worst experiences that students have gone through since classes transitioned to an online environment. Approximately, 64.3% (N = 1,820) of the respondents provided a response on their biggest challenge(s) and 57.1% (N = 1,615) told us about their most positive experiences since the transition to remote instruction. Of those that responded to the biggest challenge experienced question, 39 individuals provided an invalid response that was not relevant to the question and 57 indicated that they were not experiencing any challenges. A review of the remaining responses highlighted the 6 most challenging areas. These areas include adjusting to the online environment, personal issues or concerns, adjusting to a new study environment, issues with instructors, interaction with others, and issues or concerns related to technology resources (see table 24).
Table 24. Themes regarding student’s biggest challenge since classes transitioned to remote instruction
Theme 1 – Online adjustment Count – 1138
Having a hard time doing their education online (do not feel like they are learning, finishing exams/homework on time, keeping track of work, the structure of exams, teaching themselves)
399
Having a hard time organizing their schedule or their time 184 Face-to-face preference 165 Class has increased in difficulty (increased workload, more difficult exams and assignments) 140
Adjusting to new class structure (finding new ways to engage with the material, doing labs online, online structure in general) 127
Having a hard time understanding the material 57 Believes that the class did not translate well into in an online environment 41 Unable to get help with work 20 Lack of lab 5
Theme 2 – Personal issues or concerns Count – 783
Lack of motivation in general or to work 201 Balance life and school (childcare, family responsibilities, helping children with schoolwork, self-care) 156
Mental health concern (anxiety, depression, stress/worry) 79 Balance work and school (increased work hours, work schedule changes, essential worker) 79
Concern about future (employment, graduating, passing, progress in school delayed, transferring) 78

Mt. SAC COVID-19 Student Survey Page27
Work, school, life balance 48 Personal issues (poor sleep, illness, harm to eyesight) 31 Financial worries 29 Finding motivation or staying motivation 27 Feeling overwhelmed 19 Nervous about pandemic 12 Housing concerns 10 Family issues (taking care of relatives, family or close other death) 8 Job loss 6
Theme 3 – Adjusting to new study environment Count – 361
Experiencing difficulty with trying to focus or concentrate 190 Studying at home is not ideal 94 Finding a place to work 49 Prefer to be on campus to study 15 Getting use to studying at home 7 Generally adjusting to changing study environment 6
Theme 4 – Issues with instructor Count – 279
Unclear instruction 83 Instructor has been struggling with the transition 68 Instructor not doing video/Zoom lessons 36 Accommodations are not occurring (Access students, leniency on assignments or exams, Zoom instruction happening while students are at work) 31
Instructor not being responsive to students 29 Instructor not being understanding of the current situation 27 No consensus on how applications are used across instructors 5
Theme 5 – Interaction Count – 213
Unable to interact with instructors 104 Social isolation or feeling less connected to others 51 Unable to interact with classmates or peers 47 Unable to communicate with counselors, TA’s, or tutors 11
Theme 6 – Issues or concerns related to technology or resources Count – 184
Experiencing difficulty with technology or applications (Canvas, applications not working, internet issues) 76
Lack of resources (books, art supplies/equipment for class, applications/compatibility, internet/Wi-Fi, laptop, printer, software/communication software, uses phone) 73
Issues or uncomfortable with technology 24 Shares devices (laptop, internet) 11
Theme 7 – Other Count – 180
Experienced no challenges or difficulty 57

Mt. SAC COVID-19 Student Survey Page28
Dropped a class or classes 48 Invalid 39 Classes did not transition to online or were canceled 36
Based on the themes that emerged from the responses provide, students have struggled with several aspects of remote instruction. Responses often contained several themes, with individuals trying to balance childcare and their schoolwork, while also struggling with not being able to keep track of their course work. Others remarked that they understood that the transition was necessary, but they prefer face-to-face instruction and no longer feel like they are learning anything and are just trying to get their work handed in on time. Example quotes that represent these themes can be found below:
“That I cannot learn online. I was doing great in my classes. I had great grades and then this all happen and I was not able to retain information like I normally would.” “There is less help around. Like the sessions for class seem clear, but since all the exams and quizzes are at home, my professors make them ten times harder, so I’m not as prepared as I thought I was and don’t end up learning at all.” “My elementary school-aged child has also transitioned to online learning. It has been difficult for me to participate in my own zoom video class meetings due to my daughter having her video class meetings that overlap in time with mine.” “I became the only person in my household with steady income so I had to pick up a second job to support my family and was forced to forget about school.” “The biggest challenge has been managing my personal life with the constantly altering schedule of the RN program. This past month and a half has been very difficult due to my grandparents' passing, my mother's depression, reduction of work hours, and my father's new diagnosis of Kidney cancer. Having to experience this along with the unstable school schedule is extremely stressful.” “Being subject to family's behavior: rudeness, verbal abuse, drama even while attending class or taking an exam. My family thinks my attending school is a joke. (Most barely graduated from high school). Also, most ignore distancing and the house sometimes is like a rough party. I'm scared because I have asthma and kidney problems.” “Not having a connection with anybody.”
Positive Experiences The final question of the survey was intended to collect positive experiences; what has gone well during the time period. Of those who responded, 63 provided unrelated comments, and 164 indicated that nothing had gone well. The rest of the responses were categorized into 6 general themes (table 25). The positives students were able to identify were related to their schedules, experiences with their faculty, factors that helped them succeed, the online learning experience, support from Mt. SAC, and that many were able to meet their educational goals.

Mt. SAC COVID-19 Student Survey Page29
Table 25. Themes regarding student’s positive experiences since classes transitioned to remote instruction
Theme 1 - Schedule Count - 653 Time with family/loved ones 248 Time for other activities 122 Time for schoolwork/homework/exams 96 No commute / No parking issues 86 Home – being, staying, time at 68 Rest 33 Theme 2 - Faculty Count - 290 Supportive 143 Flexible 81 Communication 34 Effort 32 Theme 3 - Success factors Count - 269 Students' motivation and determination to succeed 175 Support from family/friends/others 58 Time management 36 Theme 4 - Online Experience Count - 198 Enjoy remote learning 53 Recorded Lectures 34 Access to tech and internet service 26 Classmates 26 Synchronous Learning (Including Zoom) 29 Self-paced 14 Learning new technology 9 Canvas 6 Textbooks 1 Theme 5 - Mt. SAC support Count - 124 EW/drop/refund/P/NP 33 Communication 31 Mt. SAC response (general) 18 Counselors/Program Support 16 Mt. SAC services/resources 14 Loaner technology 10 Cancelled classes 2 Theme 6 - Meeting educational goals Count - 95
As the rest of the survey highlighted, many students struggled during this period to balance different priorities. It is notable that the second most common theme in this section was related to the ways in which supportive, flexible and communicative faculty were valuable to students. In general, the comments contained significant examples of students managing to persist through various obstacles. Example quotes that represent these themes can be found below:
Mt. SAC COVID-19 Student Survey Page30
“A couple of my professors have been very understanding, they make themselves available for one-on-one or smaller group sessions, they answer emails as fast as they can, and their deadlines have been flexible, as well as, not requiring that we attend all zoom meetings as our home life sometimes doesn’t permit it.”
“Academically, my professors expressing their compassion and understanding has gone the best during this difficult time. It’s nice to know that they are trying as hard as possible to stay connected and make class as interesting as possible on Zoom. Also, their ability to be more lenient during this time is super helpful because of the stress and anxiety that I have been feeling lately.” “Hearing from my professors in emails, canvas messages, and watching videos they post has been nice. It is sad to not be able to see them or my peers in person, as I was really enjoying the start of the semester.” “Having the use of a loaner laptop through the generous support of Mt. Sac is only the tip of the iceberg of the total learning pyramid. Without this essential technology, it would have been difficult if not impossible to stay connected even if it is through the internet. Thank you so much for the use of a loaner laptop!” “I have seen how the college has been reaching out to its students by providing them food and help in other aspects and I’m truly grateful for that.” “I appreciate being able to do my coursework on my own time. Stressful family events have happened to affect my ability to attend on a timely schedule, but I know that I can turn in my work whenever I am available.”
Recommendations and Opportunities for Improvement A review of the data collected from the Covid-19 Student Survey indicated that many students are struggling with their course workload and learning in an online environment. These issues are compounded by stressors brought on by financial hardships and the worries about their mental and physical health. These results present the following opportunities for Mt. SAC as it continues to support students during the COVID-19 crisis and the move to a remote learning environment: Opportunity #1: Increase awareness and use of mental health services and the Mountie Fresh Basic Resources for students.
- In both multiple-choice responses and open-ended comments, large numbers of respondents indicated they were dealing with issues related to their mental health brought on by the crisis. Yet only 58.7% of students were aware of mental health services at Mt. SAC, and of those, only 3.4% had used these services. Similarly, with a significant number of respondents indicating housing and food insecurity, additional communications about the Mountie Fresh Basic Resources may prove helpful.
Opportunity #2: Encourage faculty to be more flexible with deadlines and scheduling.
- Students indicated that they were having trouble maintaining consistent schedules. In comments, students explained that they were forced to address health-related issues in
Mt. SAC COVID-19 Student Survey Page31
their family, childcare, along with other household duties. In addition, many were acting as teachers for their school-aged children. Several indicated that these responsibilities have made it difficult for them to work online or on their device, attend class sessions, and required them to work late into the night to get schoolwork done. Instructors may see more participation and success by familiarizing themselves with their students’ other priorities and/or being more understanding about course requirements. This could include allowing students greater access to assignments or exams, allowing late work, or expanded office hours. Faculty who can find ways to do this while maintaining course rigor will help encourage student success.
Opportunity #3: Continue to support students by creating engaging online learning environments.
- A majority of respondents preferred face-to-face learning and indicated that they felt disconnected or isolated in the current environment. As such, students will require additional support to navigate the online environment. This could be as simple as including a description in the syllabus – allowing students to refer back to it if needed – it could also mean instructors including hyperlinks to Canvas Student Guides in their assignments, modules, announcements, or wherever they are asking students to submit work. These hyperlinks would include instructions on how students should interact with Canvas (e.g., how to submit an assignment in Canvas). Additionally, providing faculty with the proper tools and training to provide an engaging online environment that includes significant student-to-student interaction is key. Students indicated that they appreciated faculty who were responsive to their questions, concerns, and requests for additional support.

Appendix A: Technology Issues, Open-Ended Responses not focused on Technology When asked about technology issues that students are experiencing, several individuals provided a response that focused on general issues that they were experiencing since moving to remote instruction rather than technology-specific issues. Refer to table A1 for the common themes that these responses conveyed.
Table A1. Themes provided in the technological issues question that did not focus on technology
Themes – Other Issues Count - 259 Inadequate instruction through a digital platform, ineffective for learning 73 Unsure of expectations/assignments/lack of communication from instructor 32 Schedule/availability conflicts due to caregiving/work/other classes 19 Lack of access to professors for questions, office hours 17 Inadequate studying environment or distractions at home 14 Lack of access to tutors or tutoring labs 14 Feeling overwhelmed, stressed, unmotivated 13 Class, internship canceled 13 A shortened term without omitting content or heavy workload 12 Prefer face-to-face interaction 11 Faculty inflexibility or lack of understanding 9 Work or income concerns 8 Cannot keep up with schoolwork 7 Issues with lab classes 6 Would like Zoom lectures and discussion 5 In-class participation through Zoom is inadequate 3 Other non-technical reasons 3

Appendix B: Accessibility Issues, Open-Ended Responses not focused on Accessibility When asked about accessibility issues that students were experiencing, several individuals provided a response that more focused on general issues they were experiencing since moving to remote instruction rather than accessibility specific issues. Refer to table B1 for the common themes that these responses conveyed.
Table B1. Themes provided in the accessibility issues question that did not focus on accessibility
Themes – Other Issues Count – 57 The online platform creates added challenges 11 Lack of access to devices (computer, printer, video-cam, microphone) 9 Classes canceled 9 Connectivity (internet, Wi-Fi) access or functionality 6 Inadequate instruction or difficulty learning course content 6 Prefer face-to-face 4 Schedule or availability conflicts due to caregiving, work, or other classes 3 Inadequate study environment or distracting house 3 Lack of faculty understanding 3 Mental health concerns or lack of motivation 2 Time management 1

Appendix C: Respondents that Reported Feeling Physically and/or Emotionally Unsafe in their Home Approximately 11.4% (N = 272) of respondents indicated that in the last 30 days, at the time of the survey, they felt either physically or emotionally unsafe in their home. As these individuals, indicated feeling unsafe, they were asked to provide additional information as to what they were experiencing. Table C1 indicated that the most common experience was emotional abuse like humiliation, belittling, threats, outbursts, and indifference (63.7%); closely followed by verbal abuse (61.3%) which included yelling, screaming, insults, and harsh criticism.
Table C1. Experiences that have made respondents feel unsafe in their home In the last 30 days, have you experienced: Yes No
Emotional abuse (humiliation, belittling, threats, outbursts, indifference) (N = 270) 63.7% 36.3%
Verbal abuse (yelling, screaming, insults, harsh criticism) (N = 266) 61.3% 38.7% Physical intimidation (invading personal space, preventing you from leaving the area) (N = 268) 35.1% 64.9%
Physical assault (aggression causing any physical pain, even minor pain) (N = 267) 8.6% 91.4%
Sexual harassment (unwanted comments regarding sexuality or gender identity) (N = 269) 5.9% 94.1%
Sexual assault (unwanted touching) (N = 269) 4.5% 95.5%

Appendix D: Mt. SAC Resources Evaluation When asked about the various resources that Mt. SAC made available to its students in response to COVID-19, individuals that indicated that they were aware of the service and used it were asked how satisfied they were with that service. Additionally, individuals that marked either “somewhat unsatisfied” or “not satisfied,” were asked to explain why they were unsatisfied with the service in question. See tables D1 – D10 for these evaluations.
Laptop lending program Approximately 9.8% (N = 173) of participants indicated that they have used the laptop lending program. Of these respondents, 166 provided an evaluation of this program. Refer to table D1 for this evaluation.
Table D1. Satisfaction with the laptop lending program Satisfaction Count Percent Satisfied 124 74.7% Somewhat satisfied 30 18.1% Somewhat unsatisfied 7 4.2% Not satisfied 5 3.0% Total 166 100.0%
Of those “somewhat unsatisfied” or “not satisfied” with the laptop lending program, 9 individuals provided an explanation. The majority of these responses, 7, indicated that the equipment was not working properly. The remaining responses indicated that they had not received the equipment yet or that they were dealing with a personal issue. The personal issue response was considered invalid, as the content did not pertain to the laptop lending program. Please see below for example quotes:
“Only on Monday, Apr 20th, I was provided with supposedly working equipment and [a] mobile hot spot phone. Have not yet been able to set up and work from my single room in the Safe House.”
“Hot spot gets too hot, not sure what’s wrong with. But I am very thankful for the help.”
“Not able to download applications necessary.”
Mountie fresh food pantry Approximately 14.1% (N = 249) of participants indicated that they have used the Mountie fresh food pantry. Of these respondents, 246 provided an evaluation of this program. Refer to table D2 for this evaluation.
Table D2. Satisfaction with the Mountie fresh food pantry Satisfaction Count Percent Satisfied 190 77.2% Somewhat satisfied 49 19.9% Somewhat unsatisfied 4 1.6%

Satisfaction Count Percent Not satisfied 3 1.2% Total 246 100.0%
Of those “somewhat unsatisfied” or “not satisfied” with the Mountie fresh food pantry program, 6 individuals provided an explanation. Of these responses, in which more than one theme was generated per response, 4 times a response indicated that the Mountie fresh food pantry was inconvenient and 3 times the response indicated that the program is limited in their food options. See below for example quotes pertaining to these themes:
“Because I'm a single parent and it’s during school time - I can't go.... My kid’s school gets out at 2 [pm].”
“While I appreciate all the effort Mt. SAC does in providing a "food bank," there is not much that they offer that I can use. But don't stop. It is a good program for those that need it more than I do. I have health issues and there are a lot of foods that I don't like. Keep the pantry going for those that need it”
“The lines are always too long and they do not offer many vegan options.”
Online counseling Approximately 25.5% (N = 451) of participants indicated that they have used the online counseling option. Of these respondents, 450 provided an evaluation of this program. Refer to table D3 for this evaluation.
Table D3. Satisfaction with online counseling Satisfaction Count Percent Satisfied 262 58.2% Somewhat satisfied 153 34.0% Somewhat unsatisfied 23 5.1% Not satisfied 12 2.7% Total 450 100.0%
Of those “somewhat unsatisfied” or “not satisfied” with online counseling, 28 individuals provided an explanation. There were 3 themes that emerged from the responses provided. Additionally, based on some of the responses provided, it is evident that the stated question regarding online counseling needed clarification. Specifically, some individuals answered the question in terms of mental health counseling; however, the focus of the question was on academic counseling. Due to this misunderstanding, comments focusing on mental health counseling, tutoring, or in-class experiences or learning remotely, were considered invalid responses. Additionally, other responses that were considered invalid included those that wrote: “N/A” or statements like “fools” (see table D4).

Table D4. Themes regarding respondents who were unsatisfied with online counseling Theme 1 – Do not feel like they received adequate help or support Count - 5 Theme 2 – Prefer person-to-person assistances Count - 5 Theme 3 – Did not hear back regarding a request for services Count - 4 Theme 4 – Other Count - 3 Having to call in for assistance is difficult Unfamiliar with how to go about getting counseling online Not enough available counselors Invalid responses 11 Responses are focused on in-class learning Previous negative experience with mental health counseling General invalid The response is focused on the need for tutoring
See below for example quotes pertaining to these themes:
“I think the school counselor cannot help me, and often asks me to find another department. Dealing with one thing is too difficult!!!” “Since the beginning of the semester, I've spoken to counselors online 3 times and tried to complete my educational plan. However, as of today, based on various reasons, it is still not complete. Due to this fact, I will not be able to obtain financial aid, and I am unable to continue my education in the Fall.” “Comfort level is definitely different. Online counseling is not as personal as face-to-face. I find myself reluctant to participate...” “Had scheduled an appointment but never heard back.”
COVID-19 excused withdrawal and/or pass/no pass status for course grades Approximately 30.1% (N = 532) of participants indicated that they have used this adjusted grading option. Of these respondents, 529 provided an evaluation of this option. Refer to table D5 for this evaluation.
Table D5. Satisfaction with the COVID-19 excused withdrawal and pass/no pass grading option
Satisfaction Count Percent Satisfied 315 59.5% Somewhat satisfied 174 32.9% Somewhat unsatisfied 21 4.0% Not satisfied 19 3.6% Total 529 100.0%
Of those “somewhat unsatisfied” or “not satisfied” with online counseling, 32 individuals provided an explanation. Refer to table D6 for the 4 main themes that emerged during analysis.

Table D6. Themes regarding respondents who were unsatisfied with the COVID-19 excused withdrawal and pass/no pass grading option
Theme 1 – Felt like they had no other option to take Count – 11
Unsatisfied with having to withdrawal because the class was not able to transition to remote instruction 8
Felt they were forced into taking the withdrawal 3
Theme 2 – Concerned with how this grading option will appear on their transcript Count – 11
Would have preferred to drop the course with nothing appearing on their transcript 4 Concerned about how this grade will impact their ability to transfer or continue with higher education 3
Concerned with how this grade will impact their GPA 2 EW grade has yet to appear on transcript but thinks it should appear as a “C” instead 2
Theme 3 – Worried that their academic progress is now delayed Count – 4
Thought they would have struggled in an online format and now are worried about being delayed 3
Concerned about being set back Theme 4 – Financial concern regarding the use of this grading option Count - 4 Theme 5 – Other Count - 4 Grading option did not apply to all courses 2 More assistance should be provided for students to succeed Window to request EW was too short
See below for example quotes pertaining to these themes:
“It is hard to get into classes for the RVT program. Although I understand why classes were canceled, I am still frustrated that they didn’t offer a way to extend the class so that I don’t have to try to get into the class again.” “We were not given any other option. I would have preferred to complete our course in an online format since we were in week 4 of a 6-week course and now have to repeat it. Probably 60 hours of my time spent for nothing...” “We should have been allowed to withdraw from classes completely without a "W" given the special circumstances. I feel the only reason the school did not allow this, was to meet attendance requirements, and because of their greed. It is unbelievably frustrating to stay in a class because you do not want a “W” on your record, even it is an “excused W.” This was completely mishandled!” “Although it is great, I will not be able to utilize it because I need letter grades to apply to graduate school. I think this only applies to students who are trying to get their undergraduate but not for someone who is applying for graduate programs.” “Other nursing schools were allowed to continue during this time. We are now not on track to finish the program as scheduled. We will be at least a semester behind if not

more. Financially not sure if I will be able to continue into 2021. Do not feel that it is fair to students when instructors and school staff continue to be paid and we cannot continue the program even online!”
Mountie fresh basic needs resources Approximately 3.4% (N = 60) of participants indicated that they have used the Mountie fresh basic needs option. Of these respondents, 59 provided an evaluation of this option. Refer to table D7 for this evaluation.
Table D7. Satisfaction with the Mountie fresh basic needs option Satisfaction Count Percent Satisfied 44 74.6% Somewhat satisfied 13 22.0% Somewhat unsatisfied 1 1.7% Not satisfied 1 1.7% Total 59 100.0%
Of those, “somewhat unsatisfied” or “not satisfied” with the Mountie fresh basic needs option, only 2 individuals provided an explanation. Due to the low number of responses, quotes, and theme generation cannot be provided. Overall, these individuals stated that they wanted access to housing referrals and access to hygiene necessities.
Mt. SAC’s mental health services Approximately 4.5% (N = 79) of participants indicated that they have used Mt. SAC’s mental health services. Of these respondents, 76 provided an evaluation of this option. Refer to table D8 for this evaluation.
Table D8. Satisfaction with Mt. SAC’s mental health services Satisfaction Count Percent Satisfied 41 53.9% Somewhat satisfied 25 32.9% Somewhat unsatisfied 3 3.9% Not satisfied 7 9.2% Total 76 100.0%
Of those, “somewhat unsatisfied” or “not satisfied” with Mt. SAC’s mental health services, 7 individuals provided an explanation. From the responses provided, 3 times did the response indicate that they felt that these services were unable to help them, that these services are not accommodating to a person’s needs (frequency = 2), and that they are not easily accessible (frequency = 1). For examples of these themes, please refer to the quotes below:
“Not satisfied with the mental health services of the health building when I went while having an emotional breakdown. I was told sheriffs would be called if I was suicidal! Great way to deter students from HELP! But REDACTED the case manager in the access offices I believe? She is great.”

“It does not meet my personal needs/lack of special accommodations for students with social anxiety.”
Online tutoring services Approximately 12.6% (N = 222) of participants indicated that they have used the online tutoring services. Of these respondents, 218 provided an evaluation of this option. Refer to table D9 for this evaluation.
Table D9. Satisfaction with the online tutoring services Satisfaction Count Percent Satisfied 116 53.2% Somewhat satisfied 83 38.1% Somewhat unsatisfied 14 6.4% Not satisfied 5 2.3% Total 218 100.0%
Of those, “somewhat unsatisfied” or “not satisfied” with the online tutoring services, 16 individuals provided an explanation. Refer to table D10 for the main themes that emerged during analysis.
Table D10. Themes regarding respondents who were unsatisfied with the online tutoring services
Theme 1 – Receiving help takes a long time Count - 5 Theme 2 - Tutoring online is difficult Count – 3 Tutoring needs additional technological tools Communication of problem is difficult Theme 3 - Third-party tutoring was difficult to navigate and unhelpful Count - 2 Theme 4 - Prefers face-to-face Count - 2 Theme 5 - Other Count – 2 No tutors available for my course Tutors are impatient
For examples of these themes, please refer to the quotes below:
“The response time for STEM subjects is significantly longer than History or English, for example.” “In my experience, tutors are not proficient in Zoom annotation features. They also need a digital pen and tablet that allows them to write and display their illustrations quicker so that we can move through the material more efficiently, especially for Physics and other math-based courses.” “It’s hard communicating my problems with them and understanding what steps they are telling me to do.”
“I wish the online tutoring services with Mt. SAC tutors were available sooner. The 3rd party tutoring service…offered to students took an eternity to get through to a tutor when it only said there is a 5 min wait time for the next tutor and not all of them were helpful.”

Appendix E: Students involved in counseling or special programs Of those that completed the survey, only 14.3% (N = 330) indicated that they participated in some type of counseling or special program on campus. Refer to table E1 for the full list of special programs that respondents are members of.
Table E1. Special programs that respondents currently participate in Special Program Count Percent ACES 28 8.5% ACCESS/DSPS 142 43.0% ARISE 19 5.8% Aspire 6 1.8% Bridge 26 7.9% CARE 22 6.7% Career and Transfer Center 18 5.5% CalWorks 29 8.8% DREAM 5 1.5% EOPS 80 24.2% Honors 15 4.5% International Students 4 1.2% Minority Male Initiative 2 0.6% Pride Center 23 7.0% REACH 5 1.5% STEP 7 2.1% Veteran Services 44 13.3% Honors Program 28 8.5% Tech Ed Resource Center (TERC) 8 2.4% Teacher Prep Institute (TPI) 4 1.2% WIN (Athletics) 8 2.4% Writing Center 21 6.4% Other 13 3.9% Total 330 100.0%
Additionally, it was found that 27.2% of these participants indicated that they have been in contact with their program leaders. Furthermore, 24.8% said they had been in contact with some of their program leaders, but not all and 48.0% had not been in contact with their program leaders. The most common way of communication that allowed members to remain active in the program was through emails with program leaders, counselors, staff, and other students (63.0%; see table E2).

Table E2. Communication methods that have allowed continued participation in special programs
Communication method Percent (N =312)
Email communication with program leaders, counselors, staff, or students 63.0% Video chats (e.g., Zoom, Skype, Google) with program leaders, counselors, staff or students 34.1%
Utilizing canvas to communication with program leaders, counselors, staff or students 29.6% Follow social media posts from program leaders, counselors, staff or students 21.9% Texting with program leaders, counselors, staff or students 15.9% Other 14.4%
Similar to the responses on how students have been able to still participate in these special programs, preferred methods of future communication included email correspondence (62.8%); other preferred methods of future communication included video chats (41.0%) and counseling sessions carried out over Zoom, Skype or Google (41.7%; see table E3).
Table E3. Preference for future communication with counseling, advising, tutoring, updates, or helpful information
Communication method Percent (N =312)
Email correspondence 62.8% Counseling sessions (via Zoom, Skype, Google) with program leaders, counselors, staff 41.7% Video chats (e.g., Zoom, Skype, Google) with program leaders, counselors, staff 41.0% Phone call with program leaders, counselors, staff 40.7% Canvas 38.8% Texting 36.9% Program social media 11.2% Other 2.6%