Embed Size (px)
Citation preview
Munich Personal RePEc Archive
COVID-19 related uncertainty, investor
sentiment and stock returns in India
R, Sreelakshmi and Sinha, Apra and Mandal, Sabuj Kumar
Indian Institute of Technology, Madras, ARSD College, University of
Delhi, Indian Institute of Technology, Madras
9 August 2021
Online at https://mpra.ub.uni-muenchen.de/109549/
MPRA Paper No. 109549, posted 04 Sep 2021 15:05 UTC
1
COVID-19 related uncertainty, investor sentiment and stock returns in India
Abstract : Akin to the global markets, the Indian stock market also nosedived in response to
the COVID-19 pandemic. However, this drastic fall was not persistent; rather a sharp
recovery was witnessed as a result of sweeping investor enthusiasm and wide-ranging
speculation. In this paper, we explore the relationship between investor sentiment, stock
returns and important macro variables during the COVID-19 period spanning from January,
2020 to May, 2021. We have also conducted event analysis to see the significance of major
events during the period. While the Great Lockdown and first fiscal package impacted the
stock returns significantly, the first case reported, second fiscal package, vaccination drive
and the second wave failed to create a commendable impact. The event analysis also suggests
that the Indian stock market responds negatively to an increase in interest rate uncertainty.
Our empirical analysis shows evidence of significant effect of investor sentiment on stock
returns during all periods, except the period of extreme volatility. Moreover, the stock return
is positively related to oil price and negatively related to the exchange rate. We also find
mixed evidence of COVID-19 related information on stock market.
Keywords: COVID-19 pandemic, uncertainty, investor sentiment, stock returns, event
analysis, India
1 Overview
The COVID-19 period stands out for an extremely high frequency of large daily stock
market movements, making the financial market highly volatile and unpredictable. Albulescu
(2021) and Zhang et. al (2020) contend that varying perceptions of the investors regarding the
information available at one point of time and the resultant mixed reaction have escalated the
global financial risk drastically since the onset of the pandemic. Eichenbaum et. al. (2020),
Elgin et. al. (2020) finds that stringent public health measures adopted by the emerging
countries which brought the economic activities to a standstill by restricting mobility, supply
chains and commercial activities paved the way for the freefall of the markets. Stock markets
across the globe rose like a proverbial phoenix soon after the freefall owing to the “whatever
it takes” attitude of the major governments in cushioning the economy by way of unleashing
monetary and fiscal packages of enormous magnitude.
2
India responded to the COVID-19 pandemic with a strict nationwide lockdown. The
lockdown was devastating and GDP growth for the first quarter of 2021-22 was -23.9%
(YoY)1. But, Ali et. al. (2020) finds the evidence of a positive average returns during the
lockdown period and confirms that the lockdown had a positive impact on the Indian stock
market performance. Healthcare, Technology and Cement were the top-performers
throughout; while tourism, entertainment and hospitality stocks fell by 40%. A V-shaped
recovery was largely anticipated as financial authorities boosted the investor sentiment by
administering reduced taxes, providing production-linked incentives, supporting MSMEs and
upholding labor and farm-sector reforms. Easy money propelled by high liquidity and low
interest rates shot up the risk appetite thereby inducing the investors to invest in the stock
market. The Indian companies also responded swiftly by cutting down costs thereby
protecting profits, and strategically used the buoyancy in the market to raise capital for future
growth. The stock market acted as a link between the current state and the future expectations
of a strong economy in the post-crisis phase. And as soon as the second wave of COVID-19
took its shape around mid-March-2021, the market topped out and corrected itself around
8%-9%. Thereafter, the market continued the rally led by the positive investor sentiment
based on a brighter long-term recovery boosted by the prospects of mass vaccination drive.
In the Indian context, studies on investor sentiment and stock returns are limited and
inconclusive. In this paper, we employ event analysis to study the impact of major events on
the stock returns. The event analysis helps us understand the speed with which Indian stock
market reacts to the new set of information in a very short period of time. The paper also
examines the relation between investor sentiment and stock returns during the COVID-19
phase. We capture investor sentiment via implied volatility. We also control for COVID
related information such as growth in confirmed cases, recovery rate and death rate along
with other important macro variables. We find evidence of significant effect of investor
sentiment on stock returns during all the sub-periods except the first wave phase. However,
investor sentiment had a negligible impact on the stock returns during the entire phase owing
to a large influx of irrational traders during this phase. The stock return is positively related to
oil prices, suggesting that higher oil prices capture the effect of strong global demand. Also,
the negative relationship between exchange rate and stock return is confirmed, which is
driven by strong dependence of Indian stock market on FIIs. While the stock market is
always forward-looking, in the short-term it was largely driven by the daily news on COVID-
1 https://www.indiatoday.in/diu/story/india-first-quarter-gdp-data-worst-1717384-2020-09-01
3
19 statistics. Given the prospects of a robust economy with 7-8% GDP growth rate in the next
3-4 years, one can only guess the levels at which the Sensex would trade in coming years.
2 Uncertainty, Investor Sentiment and the Indian Stock Market
Apart from the alarming number of confirmed COVID cases, factors like exchange
rate volatility, oil price shocks, net FIIs and uncertainty influenced the investor sentiment and
thereby stock returns. Since the lockdown, the stock market returns were highly volatile as
the quantum of speculation was extremely large. After the announcement of the stimulus
package on May 12th, the index dipped a bit owing to the meagre fiscal stimulus. In the
beginning of June-2020, the stock market showed a considerable dip immediately after the
Moody’s downgrade. Consumer confidence remained very low in November 2020 when
compared to the same a year ago, as reflected in the Current Situation Index (CSI); though it
shows a marginal improvement over the all-time low recorded in the previous round. But the
households remained optimistic about the one year ahead situation, with the future
expectations index (FEI) remaining in growth terrain at 115.9 (RBI CCS, NOV 2020).
Economic policies create uncertainties and result in irrational judgment of investors,
and have unpredictable effects on market stability (Chung et. al.,2013). According to
Donadelli et al. (2017), the spread of infectious diseases creates a fear in the market which
induces the investors to make cautious investments to deal with uncertainties. Risky times are
also associated with increase in precautionary savings that decreases consumption and output
(Bansal and Yaron, 2004). But the COVID-19 uncertainty had bolstered the output and
innovation in the health and pharma sectors as not tapping the opportunity will be a costly
decision. Uncertainty is also associated with increase in risk premiums, leading to higher
borrowing cost for firms which further depresses investment and growth (Arellano et. al.,
2010). COVID-19 induced uncertainty has led to an increase in lending rates over the risk-
free rate thereby dampening the business investments. Bekaert et. al., (2013) suggest that
uncertainty in the market can be captured by fluctuations in the VIX.
The Volatility Index (VIX) measures the expected future volatility of the underlying
benchmark index in the next 30 days. Investors take into account the trajectory of this fear
index before venturing into investments as the blacked-out volatility from option prices
(VIX) should be informative about the uncertainty in the market. The investor sentiment is
derived from the personal beliefs of investors regarding the discounted risk of their
investments, which may not be justified by the existing facts (Baker and Wurgler, 2007). It
4
represents the total outlook that the rational, emotional and noise traders have regarding the
future of the market. As the decision and action of the noise traders are highly unpredictable,
a huge influx of them in the market can create chaos and unexpected turns unless the market
is mature enough to absorb the shocks.
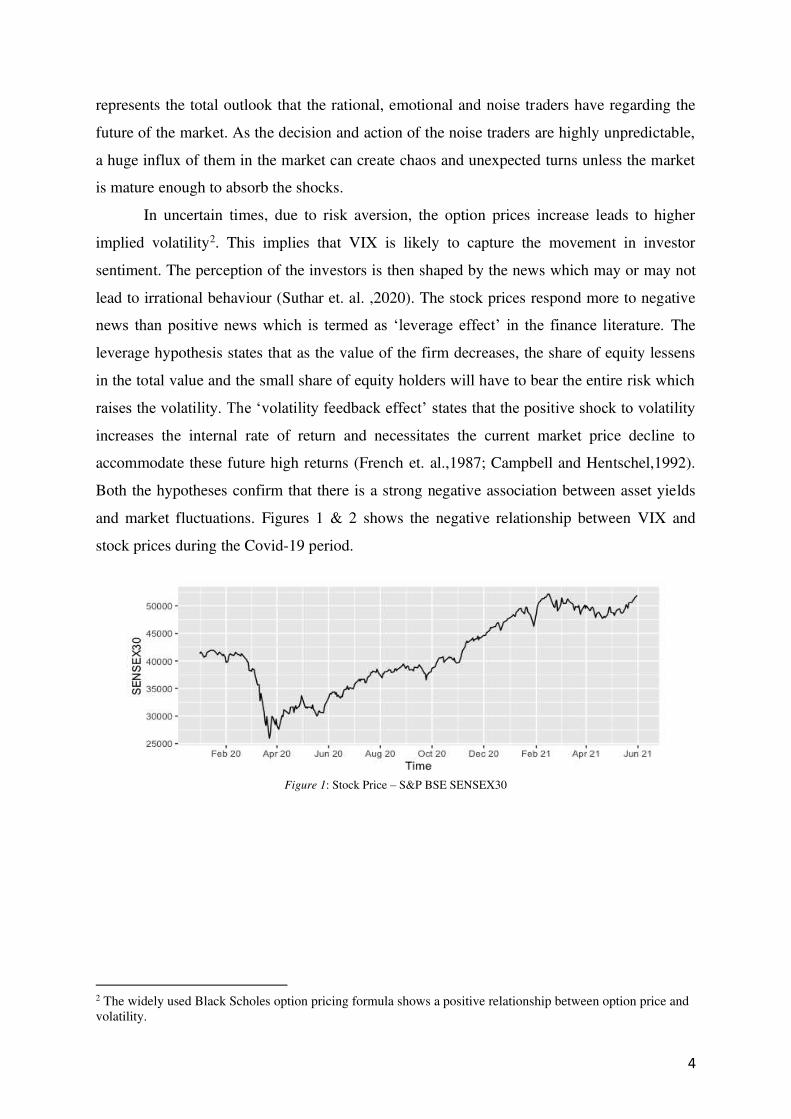
In uncertain times, due to risk aversion, the option prices increase leads to higher
implied volatility2. This implies that VIX is likely to capture the movement in investor
sentiment. The perception of the investors is then shaped by the news which may or may not
lead to irrational behaviour (Suthar et. al. ,2020). The stock prices respond more to negative
news than positive news which is termed as ‘leverage effect’ in the finance literature. The
leverage hypothesis states that as the value of the firm decreases, the share of equity lessens
in the total value and the small share of equity holders will have to bear the entire risk which
raises the volatility. The ‘volatility feedback effect’ states that the positive shock to volatility
increases the internal rate of return and necessitates the current market price decline to
accommodate these future high returns (French et. al.,1987; Campbell and Hentschel,1992).
Both the hypotheses confirm that there is a strong negative association between asset yields
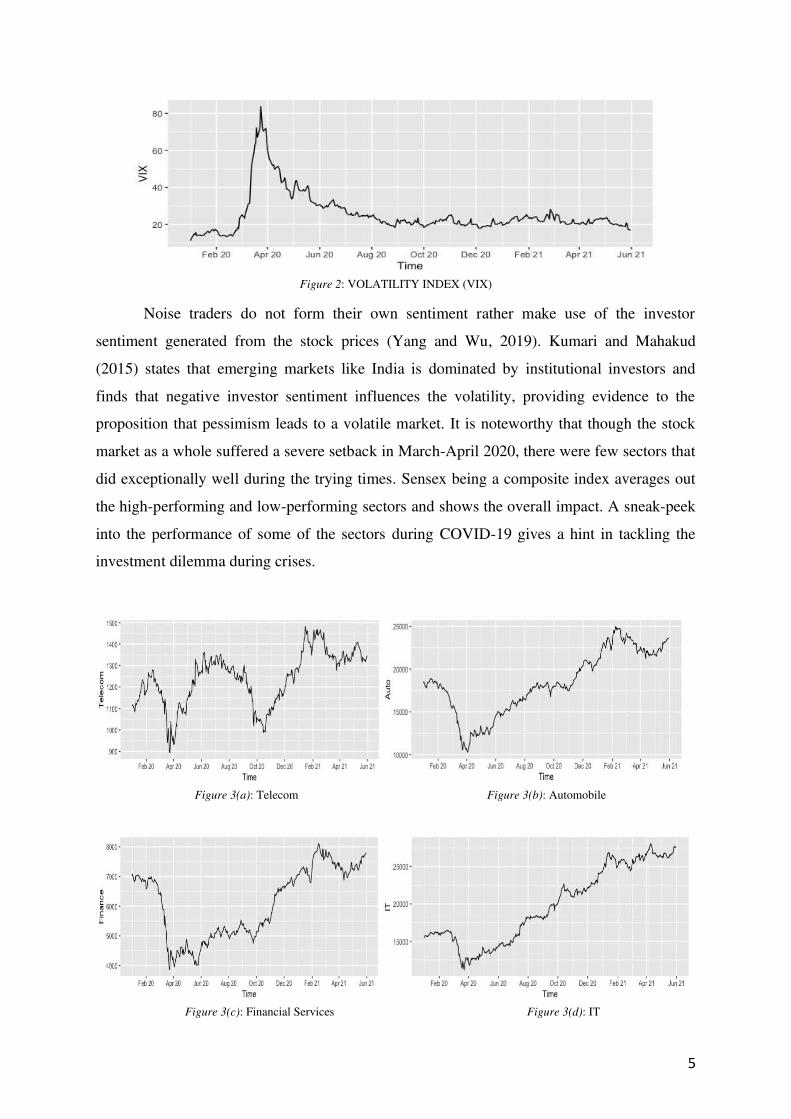
and market fluctuations. Figures 1 & 2 shows the negative relationship between VIX and
stock prices during the Covid-19 period.
Figure 1: Stock Price – S&P BSE SENSEX30
2 The widely used Black Scholes option pricing formula shows a positive relationship between option price and volatility.
5
Figure 2: VOLATILITY INDEX (VIX)
Noise traders do not form their own sentiment rather make use of the investor
sentiment generated from the stock prices (Yang and Wu, 2019). Kumari and Mahakud
(2015) states that emerging markets like India is dominated by institutional investors and
finds that negative investor sentiment influences the volatility, providing evidence to the
proposition that pessimism leads to a volatile market. It is noteworthy that though the stock
market as a whole suffered a severe setback in March-April 2020, there were few sectors that
did exceptionally well during the trying times. Sensex being a composite index averages out
the high-performing and low-performing sectors and shows the overall impact. A sneak-peek
into the performance of some of the sectors during COVID-19 gives a hint in tackling the
investment dilemma during crises.
Figure 3(a): Telecom Figure 3(b): Automobile
Figure 3(c): Financial Services Figure 3(d): IT
6
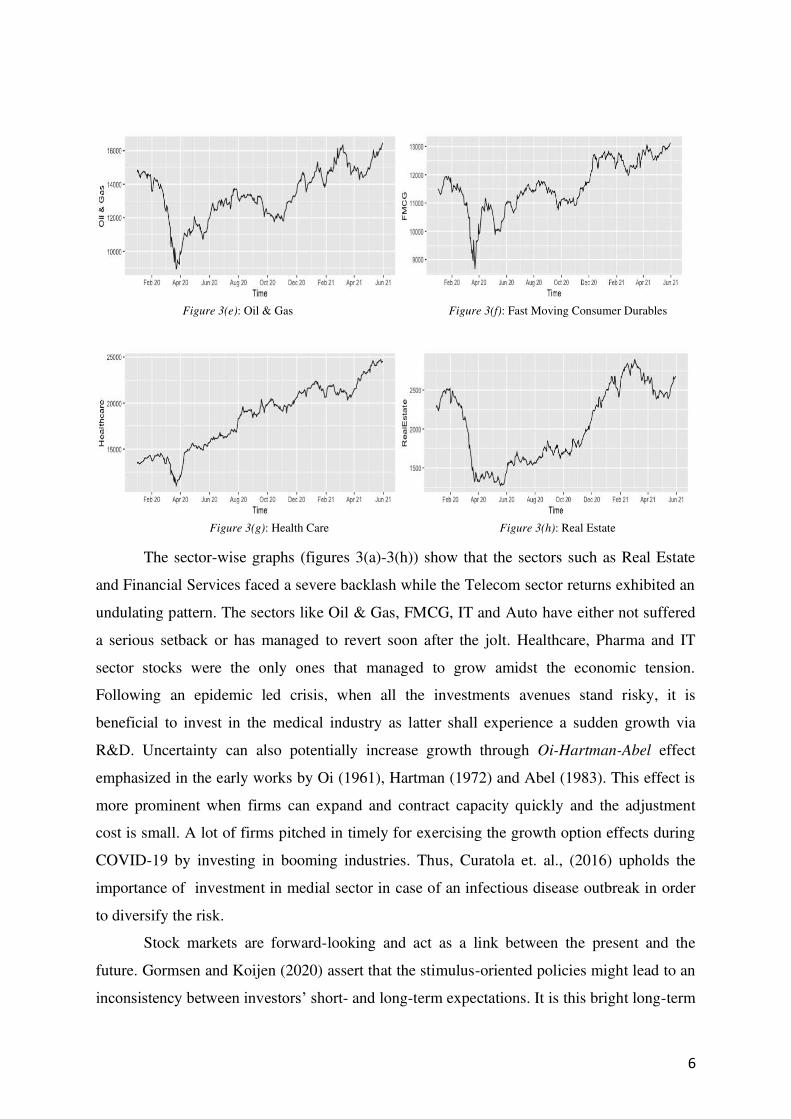
Figure 3(e): Oil & Gas Figure 3(f): Fast Moving Consumer Durables
Figure 3(g): Health Care Figure 3(h): Real Estate
The sector-wise graphs (figures 3(a)-3(h)) show that the sectors such as Real Estate
and Financial Services faced a severe backlash while the Telecom sector returns exhibited an
undulating pattern. The sectors like Oil & Gas, FMCG, IT and Auto have either not suffered
a serious setback or has managed to revert soon after the jolt. Healthcare, Pharma and IT
sector stocks were the only ones that managed to grow amidst the economic tension.
Following an epidemic led crisis, when all the investments avenues stand risky, it is
beneficial to invest in the medical industry as latter shall experience a sudden growth via
R&D. Uncertainty can also potentially increase growth through Oi-Hartman-Abel effect
emphasized in the early works by Oi (1961), Hartman (1972) and Abel (1983). This effect is
more prominent when firms can expand and contract capacity quickly and the adjustment
cost is small. A lot of firms pitched in timely for exercising the growth option effects during
COVID-19 by investing in booming industries. Thus, Curatola et. al., (2016) upholds the
importance of investment in medial sector in case of an infectious disease outbreak in order
to diversify the risk.
Stock markets are forward-looking and act as a link between the present and the
future. Gormsen and Koijen (2020) assert that the stimulus-oriented policies might lead to an
inconsistency between investors’ short- and long-term expectations. It is this bright long-term
7
expectations regarding the future economy that sustained the positive vibe in the Indian stock
market in the post-COVID phase. The Efficient Market Hypothesis rarely holds in the real
world and flawed information flow or information asymmetry distorts the logic of the stock
market reactions. In this regard we proceed to analyse the interesting dynamics between the
investor sentiment and stock movements during the COVID-19 phase in India.
3 Event Study Analysis
An event study measures the valuation effects of a set of firms by examining their
stock return movements in response to an unexpected event. The underlying assumption is
that information regarding the event is priced into the market in an unbiased manner. Pioneer
works in this arena include Fama et. al. (1969). Other prominent works include Brown and
Warner (1985), Barber and Lyon (1997), Mitchell and Stafford (2000) and Kothari and
Warner (2006). Since the very first case of COVID-19 was reported in India on 30th January
2020, investors were sceptical about the pulse of the stock market. By the time the cases sky-
rocketed, forcing the government to impose a complete lockdown on 24th March, 2020 the
speculation in the Indian stock market was raging high. The investors being clueless about
the direction and magnitude of the stock movements, began indulging in heavy transactions
in the market. This sudden surge in the trading volume in the stock market resulted in a spike
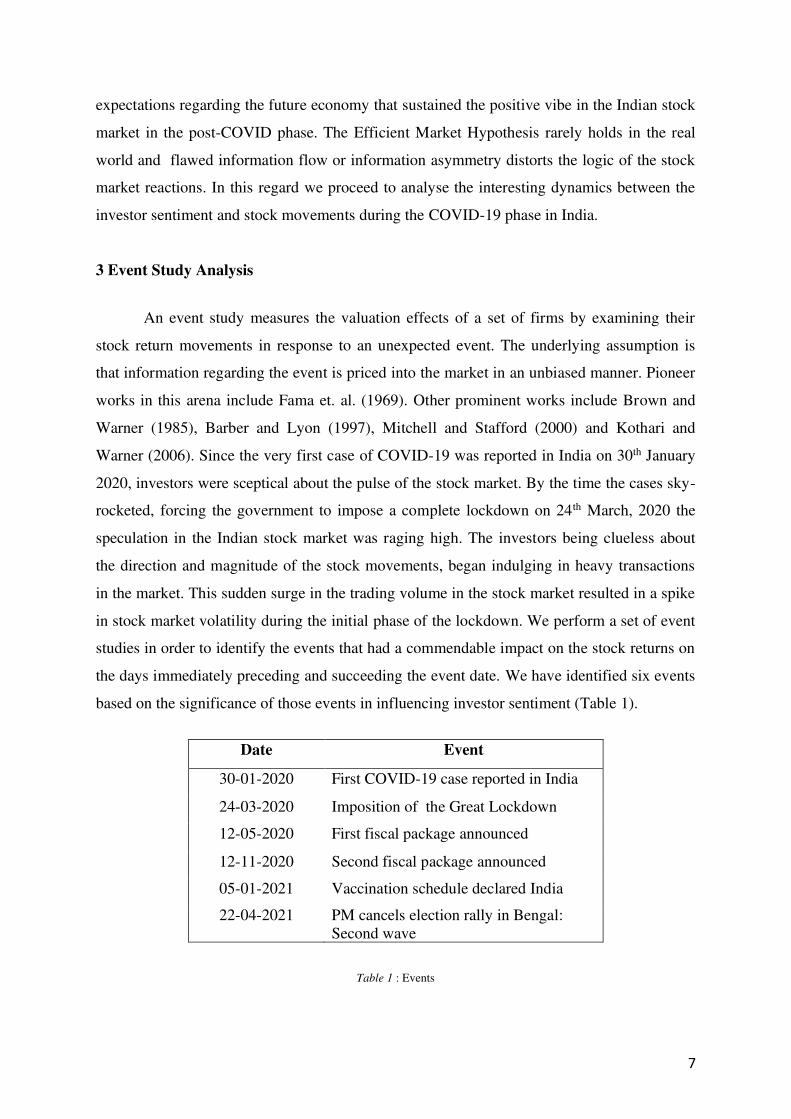
in stock market volatility during the initial phase of the lockdown. We perform a set of event
studies in order to identify the events that had a commendable impact on the stock returns on
the days immediately preceding and succeeding the event date. We have identified six events
based on the significance of those events in influencing investor sentiment (Table 1).
Date Event
30-01-2020 First COVID-19 case reported in India
24-03-2020 Imposition of the Great Lockdown
12-05-2020 First fiscal package announced
12-11-2020 Second fiscal package announced
05-01-2021 Vaccination schedule declared India
22-04-2021 PM cancels election rally in Bengal: Second wave
Table 1 : Events
8
Our analysis makes an attempt to examine if cross-sectional returns on and after the
event day is abnormal or not in order to see how the information is incorporated into the
prices. In the first stage, we create an event window of 11 days; which includes five days
prior to the event, the event day and five days after the event. For the purpose of the study,
we take all the 30 companies which constitute the BSE SENSEX index and calculate their
daily stock returns from closing stock prices. BSE500 index is taken as the benchmark
market index to which the individual company stock returns are compared to. The return on
the stocks is calculated as given by equation (1).
𝑟𝑖𝑡 = ln(𝑝𝑖𝑡) − ln(𝑝𝑖𝑡−1) (1) Where 𝑟𝑖𝑡 is the return of the company 𝑖 at time 𝑡, 𝑝𝑖𝑡 and 𝑝𝑖𝑡−1 is the price of the stock on
the current day (𝑡) and the previous trading day( 𝑡 − 1). Following Sefcik and Thompson
(1986) that studies the effects of cross-sectionally correlated abnormal returns, we examine
the statistical properties via cross-sectional regressions. We control for company fixed effects
by taking the firm level heterogeneity into account and estimates each of the six events
considered in this paper. The model specification is given by equation (2).
𝑟𝑖𝑡 = 𝛽0 + ∑ 𝛽𝑘𝑡+𝑘𝑡−𝑘 + ∑ 𝜃𝑗𝑗=30𝑗=2 + 𝜖𝑖𝑡 𝑘 = 1,2,3,4,53 (2)
Where 𝑡 = 0 is the event date and 𝜃𝑗 controls for firm-level fixed effects. We estimate the
above model and obtain the coefficients 𝛽−5 𝑡𝑜 𝛽5. In the AR plots, x-axis represents the
event window that ranges from -5 to 5 and the y-axis shows the Average Return (AR). We
also estimate 29 company dummies, and one base company dummy included in the intercept
term. A narrow window is chosen to identify the precise causal factors as larger event
windows bring confounding factors and increases the omitted variable bias problem3. The
graphs (figures 4-9) show the coefficients and their standard error. Ideally, if a statistic is
significantly different from 0 at the 0.05 level, then the 95% confidence interval will not
contain 0, as all the values that fall within the confidence interval are the plausible values that
3 Event study windows are usually short on the basis of the Efficient Market Hypothesis and
due to cost of expanding them. According to Efficient Market hypothesis, the stock market
reacts almost immediately to any new information available. Expanding event window leads
to reduced power of analysis (Brown and Warner, 1985). Longer event windows are more
likely to be affected by other confounding events.
9
the variable may take. Thus, to say that an event is significant, all values in the confidence
interval should be on the same side of zero (either all positive or all negative) and not include
zero.
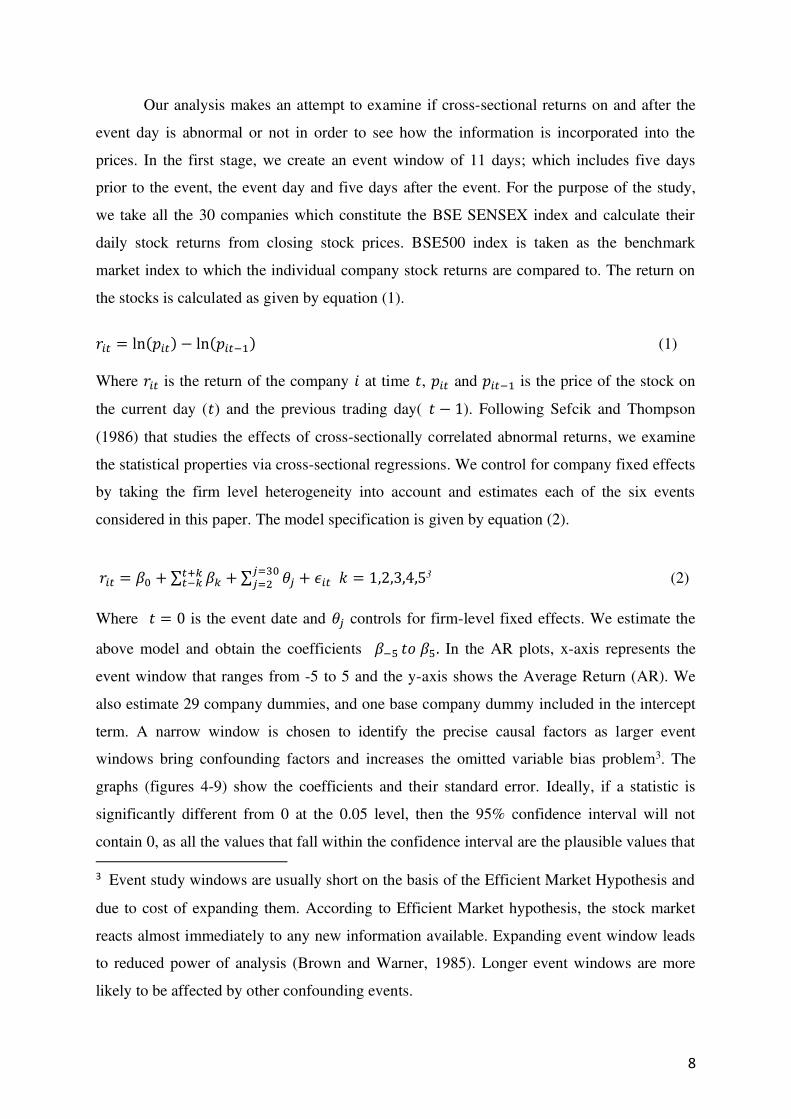
Figure 4: First COVID-19 case reported in India
Figure 4 presents the average returns pertaining to the first covid case in India. The
return was in the positive range before the event, but became significantly negative on the
second day after the detection of first covid case on 30th Jan 2020. But soon after the second
day (𝑘 = 2), the returns moved to the positive range indicating that the first covid case did
not lead to a persistent decline in stock returns. This could be due to the falling oil prices
which boosted the market value of the listed companies that rely heavily on crude oil for
production and transportation processes. The Union Budget announced on Feb 1st,2020 also
contributed to the positive effect by advocating bold steps.
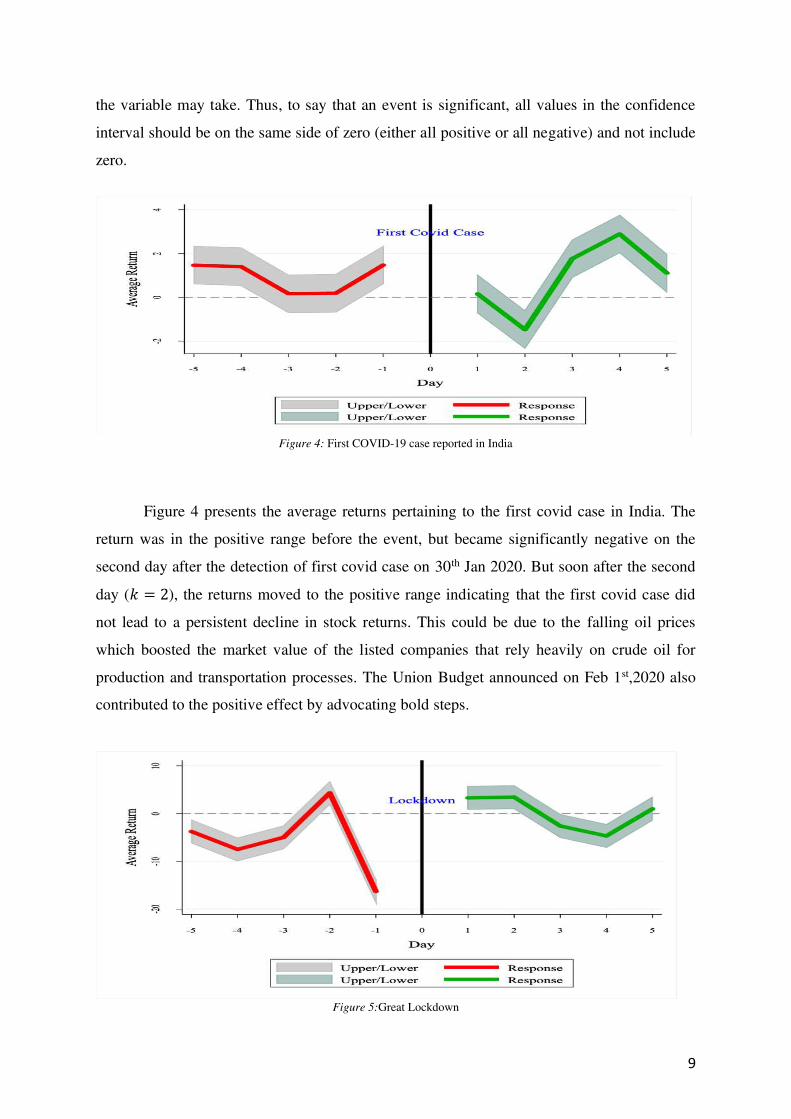
Figure 5:Great Lockdown
10
Figure 5 presents the results from the Great Lockdown. We could see a significant fall
in average return of almost all companies just before the day of announcement of the
lockdown, due to the extreme uncertainty that prevailed. Raging panic that resulted in FII
outflows and heavy withdrawals from the stock market led to negative returns. After the
announcement of the lockdown, the return was positive and significant but with higher
dispersion. On the third and the fourth trading day, the average return reverted to being
negative and significant. The positive and significant return after the announcement of
lockdown could be due to the following reasons:
Firstly, it was anticipated that the lockdown shall contain the spread of the virus in the
country, supporting the country’s stock market in long run. Secondly, RBI reduced the
interest rate by 75 basis points which brought the repo rate down to 4.4 percent from 5.15
percent. The reverse repo rate was also cut by 90 basis points to 4 percent. Thirdly, despite
infusing volatility in the Indian stock market, the lockdown has not been able to detract
investors. After the lockdown announcement, many millennials ventured in to the stock
market due to a ripple effect of lockdown which has caused unemployment, pay cuts and
work from home culture. Fourthly, progressive regulation made the stock market access
easier. SEBI has been working actively towards regulations to ease market participation
which acted as a catalyst for millennials to invest in the market.
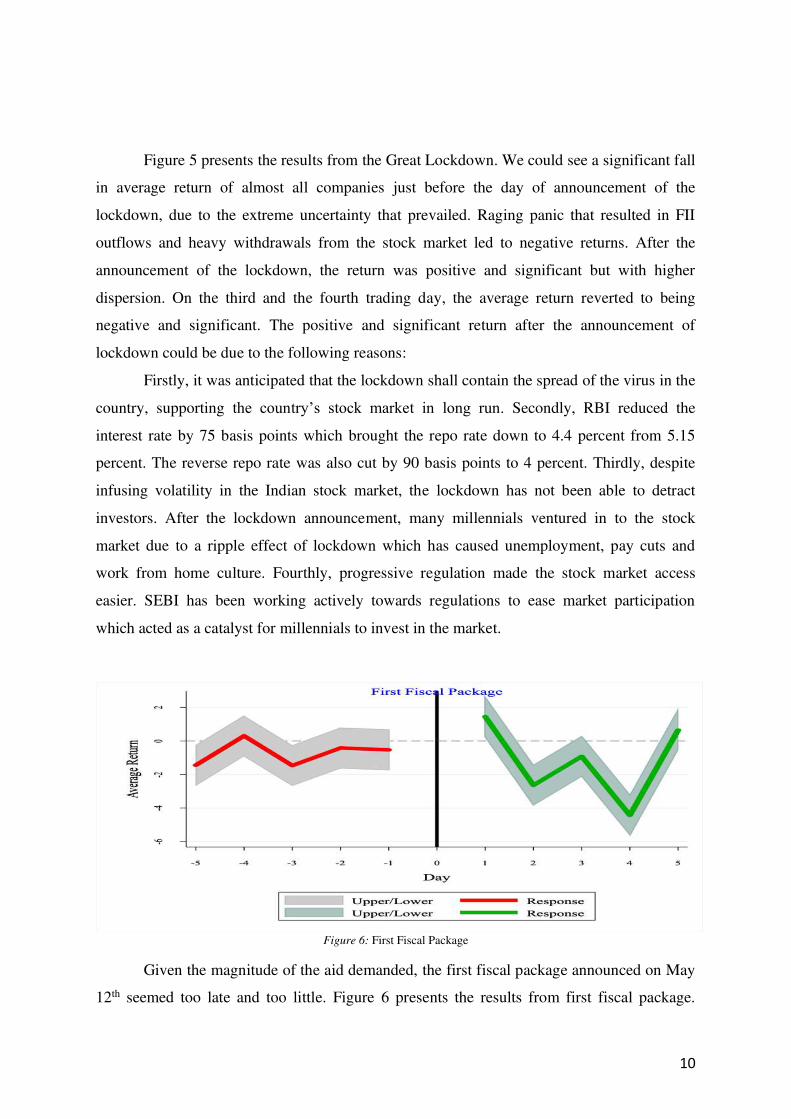
Figure 6: First Fiscal Package
Given the magnitude of the aid demanded, the first fiscal package announced on May
12th seemed too late and too little. Figure 6 presents the results from first fiscal package.
11
Market was in the negative return range before the announcement of the fiscal package, but
the negative return became more pronounced after the announcement of the fiscal package.
The reasons for the negative returns could be:
Firstly, the increase in government borrowings to fund the increased public
expenditure might lead to an increase in interest rate. The stock prices are discounted present
value of cash flow given by 𝑝𝑖𝑡 = ∑ 𝑐𝑓𝑖𝑡+𝑠𝑠=∞𝑠=0(1+𝑟)𝑠 ,where 𝑐𝑓𝑖𝑡+𝑠 is the cashflow for the company
and 𝑟 is the risk-free rate. An increase in interest rate will thus lead to a fall in stock prices.
Secondly, if government consumes more, the increase in interest rate will reduce private
investment leading to the Crowding Out effect. Following the change in investment schedule
by these companies, market might revise all the future cashflows in downward direction
which shall put further pressure on prices. Third, the retail investors who borrow and invest
in the stock market shall reduce their investment, as borrowings become costlier. Figure 6
clearly shows that before the announcement of the fiscal package, the market was in negative
zone but after the announcement of the first fiscal package the effect is more pronounced.
Also, the fiscal package could have led to positive effect on prices had it stimulated a spike
in the cash flow of these firms to counter the negative effect of increase in expected interest
rate; which did not happen as shown in figure 6.
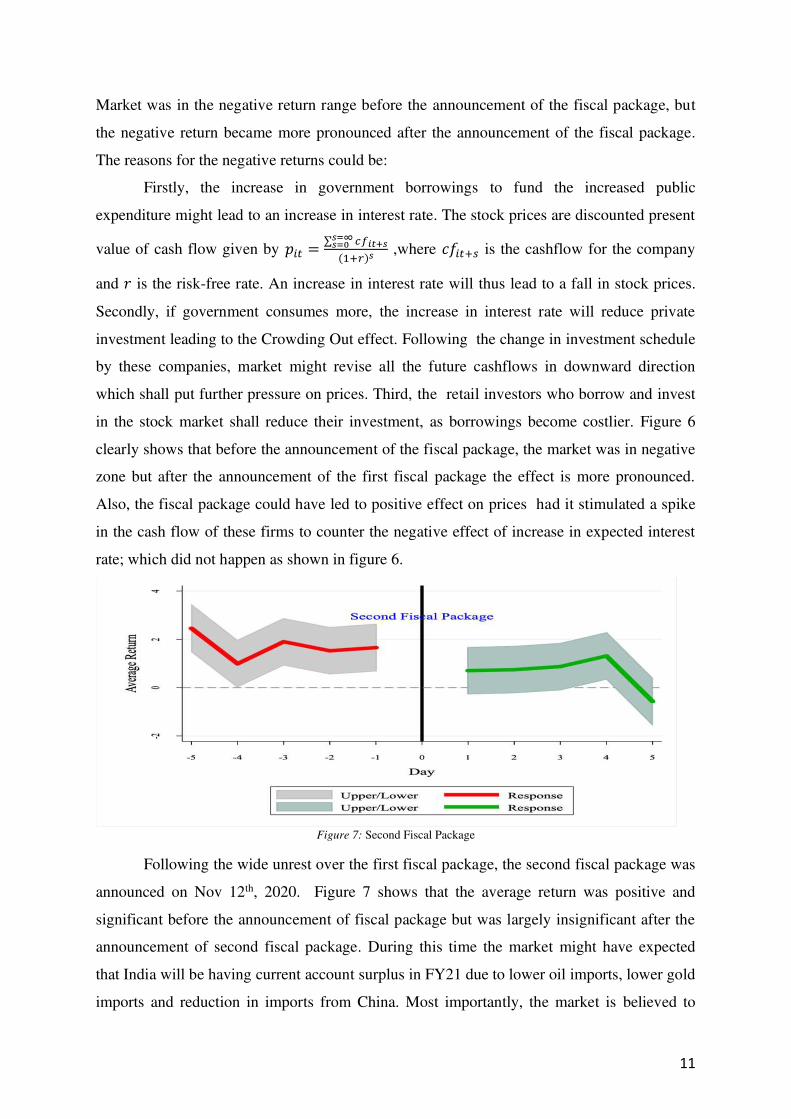
Figure 7: Second Fiscal Package
Following the wide unrest over the first fiscal package, the second fiscal package was
announced on Nov 12th, 2020. Figure 7 shows that the average return was positive and
significant before the announcement of fiscal package but was largely insignificant after the
announcement of second fiscal package. During this time the market might have expected
that India will be having current account surplus in FY21 due to lower oil imports, lower gold
imports and reduction in imports from China. Most importantly, the market is believed to
12
have priced the resumption of normal economic activities, with vaccination against COVID-
19 around the corner. The positive news swayed the investors towards the equity markets and
this resulted in positive returns. A fall in the active COVID-19 cases also resulted in the
investors investing heavily in the equity markets which in turn ramped up the market. Thus
we can say that second fiscal package affected the returns negatively, but not to the extent
that of first fiscal package.
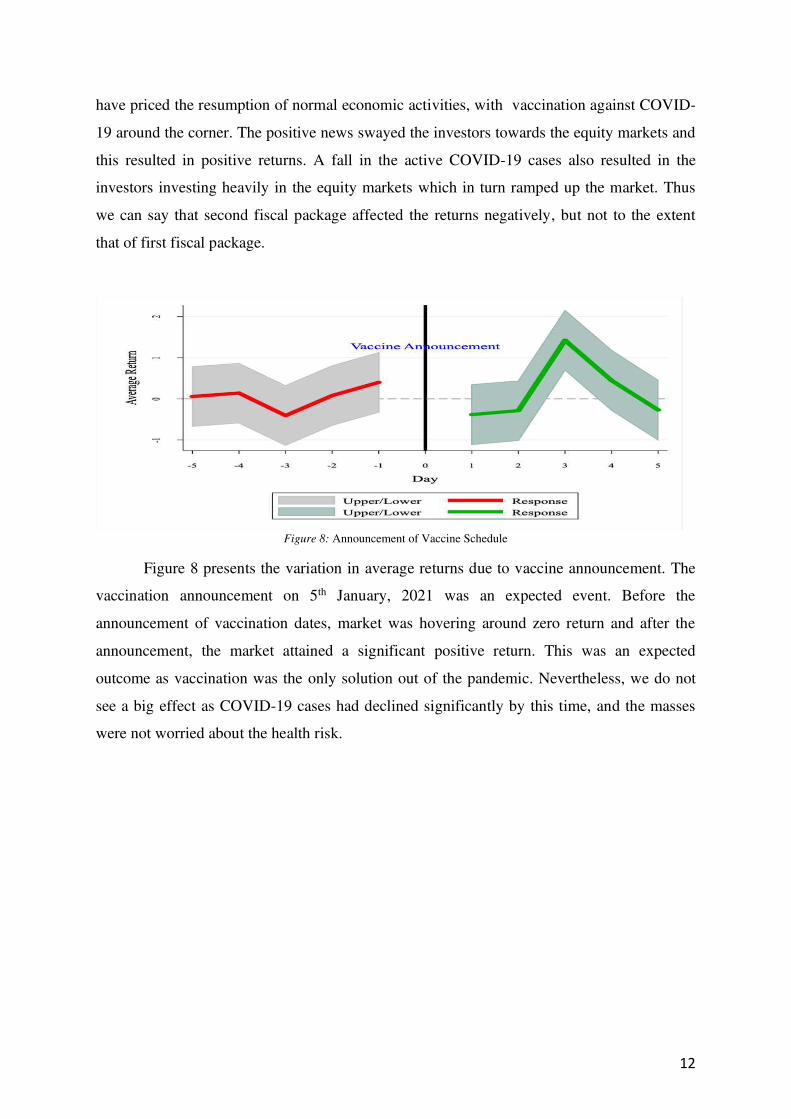
Figure 8: Announcement of Vaccine Schedule
Figure 8 presents the variation in average returns due to vaccine announcement. The
vaccination announcement on 5th January, 2021 was an expected event. Before the
announcement of vaccination dates, market was hovering around zero return and after the
announcement, the market attained a significant positive return. This was an expected
outcome as vaccination was the only solution out of the pandemic. Nevertheless, we do not
see a big effect as COVID-19 cases had declined significantly by this time, and the masses
were not worried about the health risk.
13
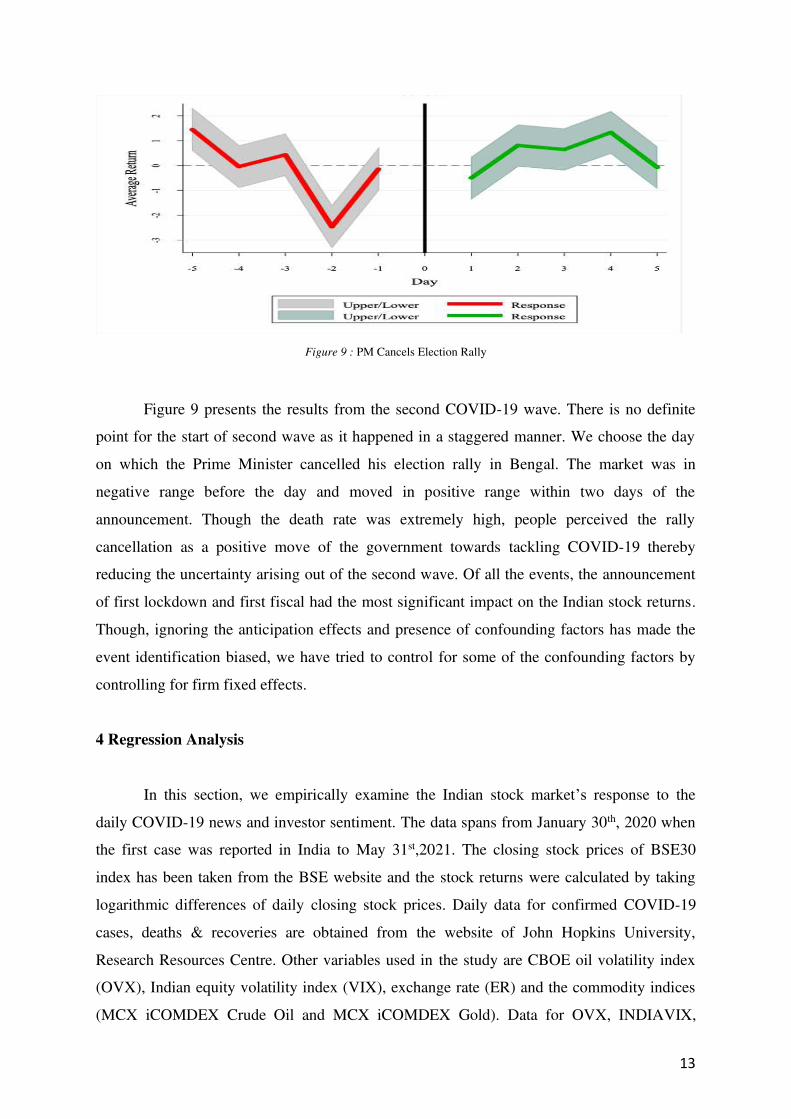
Figure 9 : PM Cancels Election Rally
Figure 9 presents the results from the second COVID-19 wave. There is no definite
point for the start of second wave as it happened in a staggered manner. We choose the day
on which the Prime Minister cancelled his election rally in Bengal. The market was in
negative range before the day and moved in positive range within two days of the
announcement. Though the death rate was extremely high, people perceived the rally
cancellation as a positive move of the government towards tackling COVID-19 thereby
reducing the uncertainty arising out of the second wave. Of all the events, the announcement
of first lockdown and first fiscal had the most significant impact on the Indian stock returns.
Though, ignoring the anticipation effects and presence of confounding factors has made the
event identification biased, we have tried to control for some of the confounding factors by
controlling for firm fixed effects.
4 Regression Analysis
In this section, we empirically examine the Indian stock market’s response to the
daily COVID-19 news and investor sentiment. The data spans from January 30th, 2020 when
the first case was reported in India to May 31st,2021. The closing stock prices of BSE30
index has been taken from the BSE website and the stock returns were calculated by taking
logarithmic differences of daily closing stock prices. Daily data for confirmed COVID-19
cases, deaths & recoveries are obtained from the website of John Hopkins University,
Research Resources Centre. Other variables used in the study are CBOE oil volatility index
(OVX), Indian equity volatility index (VIX), exchange rate (ER) and the commodity indices
(MCX iCOMDEX Crude Oil and MCX iCOMDEX Gold). Data for OVX, INDIAVIX,
14
exchange rate and the commodity indices is obtained from investing.com. The growth rate of
confirmed cases is used along with the death rate and recovery rate. Death rate and recovery
rate is formulated by calculating the respective shares of deaths and recoveries in the total
number of confirmed cases; expressed as a percentage. The death rate and recovery rate, in a
way proxy for the bad news and good news respectively.
𝐷𝑒𝑎𝑡ℎ 𝑅𝑎𝑡𝑒 (𝐷𝑅𝐴𝑇𝐸) = 𝑁𝑜: 𝑜𝑓 𝐷𝑒𝑎𝑡ℎ𝑠𝑁𝑜: 𝑜𝑓 𝐶𝑜𝑛𝑓𝑖𝑟𝑚𝑒𝑑 𝐶𝑎𝑠𝑒𝑠 ∗ 100
𝑅𝑒𝑐𝑜𝑣𝑒𝑟𝑦 𝑅𝑎𝑡𝑒 (𝑅𝐸𝐶𝑅𝐴𝑇𝐸) = 𝑁𝑜: 𝑜𝑓 𝑅𝑒𝑐𝑜𝑣𝑒𝑟𝑖𝑒𝑠𝑁𝑜: 𝑜𝑓 𝐶𝑜𝑛𝑓𝑖𝑟𝑚𝑒𝑑 𝐶𝑎𝑠𝑒𝑠 ∗ 100
The logarithmic transformation of the stock market index (BSE Sensex) and exchange
rate (ER) is taken as follows: 𝐿𝑁𝐵𝑆𝐸 = ln ( 𝐵𝑆𝐸𝑡𝐵𝑆𝐸𝑡−1) ∗ 100
𝐿𝑁𝐸𝑅 = ln ( 𝐸𝑅𝑡𝐸𝑅𝑡−1) ∗ 100
The stock returns (LNBSE) is then regressed on other variables like growth in cases
(GCASES), death rate (DRATE), recovery rate (RECRATE), oil volatility index (OVX),
equity market volatility index (VIX) and exchange rate returns (LNER) as depicted by
equation (3).
𝐿𝑁𝐵𝑆𝐸𝑡 = 𝛽0 + 𝛽1 𝐺𝐶𝐴𝑆𝐸𝑆𝑡 + 𝛽2𝐷𝑅𝐴𝑇𝐸𝑡 + 𝛽3𝑅𝐸𝐶𝑅𝐴𝑇𝐸𝑡 + 𝛽4𝑉𝐼𝑋𝑡 + 𝛽5𝑂𝑉𝑋𝑡 +𝛽6𝐿𝑁𝐸𝑅𝑡 (3)
For the purpose of examining the change in interrelation between the variables, the
whole span of January 30th, 2020 – May 31st, 2021 is bifurcated to four distinct phases. The
first phase runs from January 30th to March 24th which is the incubation period when the
pandemic was in its primary stage. The second phase runs from the day when the lockdown
was announced, March 24th till the announcement of the announcement of the Unlock 1.0,
June 1st, 2020. This period shows the highest volatility in the stock markets owing to the
burgeoning crisis. The third phase is basically the immediate post-crisis phase that runs from
June 1st, 2020 to March 10th, when the flattened graph started picking up marking the
beginning of the deadly second wave in India as per the JHU CSSE COVID-19 database.
Even amidst the uncertainty related pertaining to a severe secondary wave, stock markets
kept on moving in a bullish mode in this intermediate phase. This period also saw extremely
15
positive realms led by the hopes of a mass vaccination drive. Also, on February 16th, 2021 the
stock markets witnessed its all-time high since the March of 2020, after which it started
retreating. In the second wave phase which ran from March 10th,2021 to May 31st,2021, the
market corrected itself up to almost 8%-9%. In this section, we analyze the interrelation
between the variables throughout the study period; in particular the investor sentiment – stock
return nexus. Firstly, ADF and PP tests were carried out to check the stationarity of the
variables.
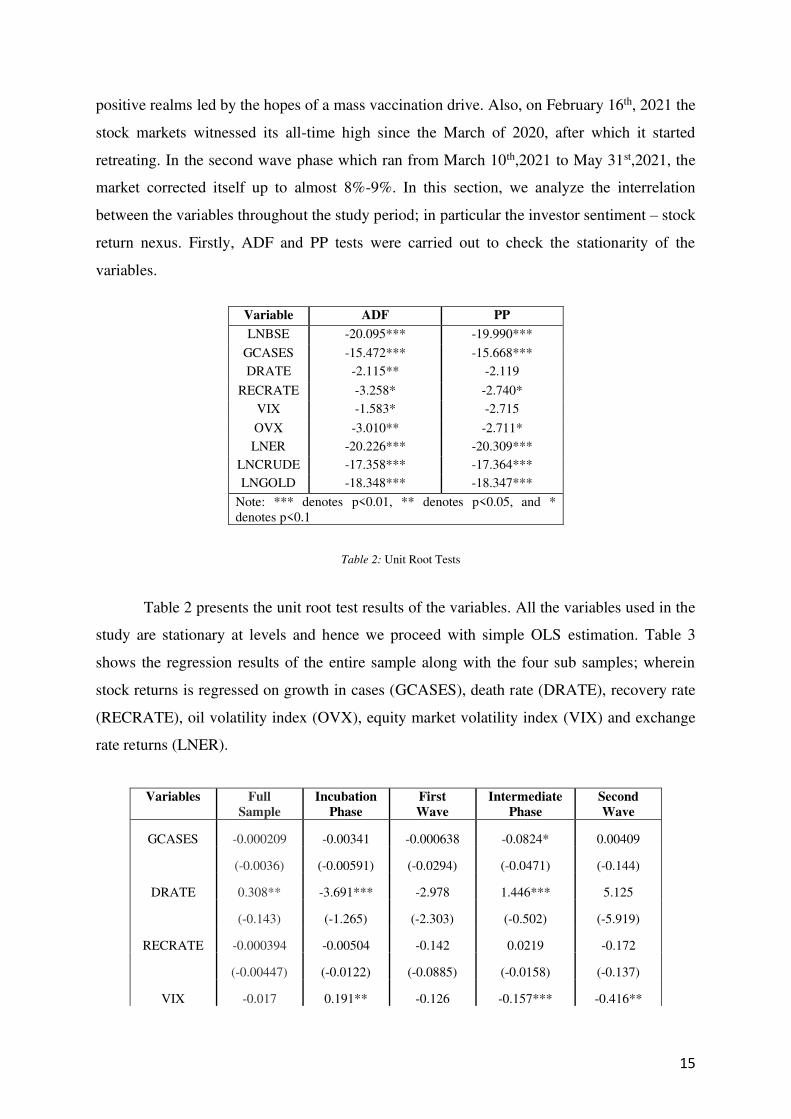
Variable ADF PP
LNBSE -20.095*** -19.990***
GCASES -15.472*** -15.668***
DRATE -2.115** -2.119
RECRATE -3.258* -2.740*
VIX -1.583* -2.715
OVX -3.010** -2.711*
LNER -20.226*** -20.309***
LNCRUDE -17.358*** -17.364***
LNGOLD -18.348*** -18.347***
Note: *** denotes p<0.01, ** denotes p<0.05, and * denotes p<0.1
Table 2: Unit Root Tests
Table 2 presents the unit root test results of the variables. All the variables used in the
study are stationary at levels and hence we proceed with simple OLS estimation. Table 3
shows the regression results of the entire sample along with the four sub samples; wherein
stock returns is regressed on growth in cases (GCASES), death rate (DRATE), recovery rate
(RECRATE), oil volatility index (OVX), equity market volatility index (VIX) and exchange
rate returns (LNER).
Variables
Full
Sample
Incubation
Phase
First
Wave
Intermediate
Phase
Second
Wave
GCASES -0.000209 -0.00341 -0.000638 -0.0824* 0.00409
(-0.0036) (-0.00591) (-0.0294) (-0.0471) (-0.144)
DRATE 0.308** -3.691*** -2.978 1.446*** 5.125
(-0.143) (-1.265) (-2.303) (-0.502) (-5.919)
RECRATE -0.000394 -0.00504 -0.142 0.0219 -0.172
(-0.00447) (-0.0122) (-0.0885) (-0.0158) (-0.137)
VIX -0.017 0.191** -0.126 -0.157*** -0.416**
16
(-0.0162) (-0.0918) (-0.0951) (-0.042) (-0.182)
OVX -0.00276 -0.0327 -0.0125 0.0161 -0.00555
(-0.00451) (-0.0373) (-0.00966) (-0.0107) (-0.0373)
LNER -1.751*** -4.927*** -1.951** -1.052*** -0.0084
(-0.25) (-1.238) (-0.747) (-0.225) (-0.453)
CONSTANT 0.173 -1.406 20.51 -1.172 17.94**
(-0.555) (-1.231) (-12.96) (-1.876) (-8.533)
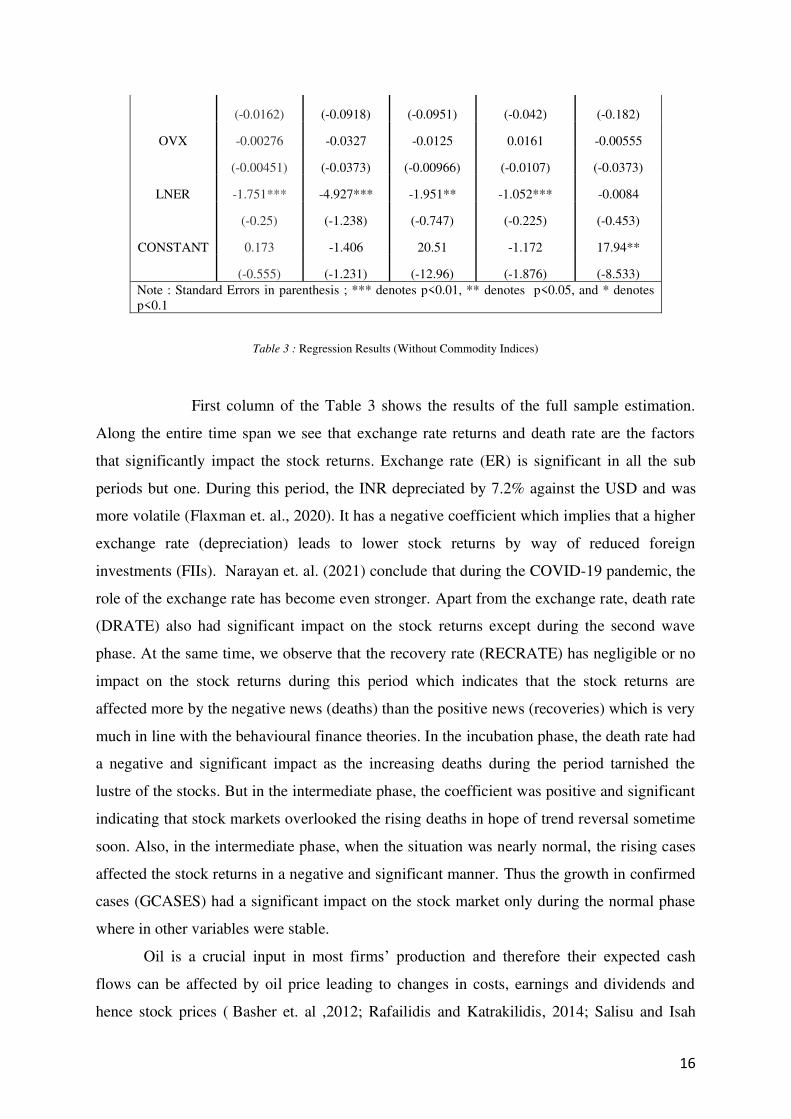
Note : Standard Errors in parenthesis ; *** denotes p<0.01, ** denotes p<0.05, and * denotes p<0.1
Table 3 : Regression Results (Without Commodity Indices)
First column of the Table 3 shows the results of the full sample estimation.
Along the entire time span we see that exchange rate returns and death rate are the factors
that significantly impact the stock returns. Exchange rate (ER) is significant in all the sub
periods but one. During this period, the INR depreciated by 7.2% against the USD and was
more volatile (Flaxman et. al., 2020). It has a negative coefficient which implies that a higher
exchange rate (depreciation) leads to lower stock returns by way of reduced foreign
investments (FIIs). Narayan et. al. (2021) conclude that during the COVID-19 pandemic, the
role of the exchange rate has become even stronger. Apart from the exchange rate, death rate
(DRATE) also had significant impact on the stock returns except during the second wave
phase. At the same time, we observe that the recovery rate (RECRATE) has negligible or no
impact on the stock returns during this period which indicates that the stock returns are
affected more by the negative news (deaths) than the positive news (recoveries) which is very
much in line with the behavioural finance theories. In the incubation phase, the death rate had
a negative and significant impact as the increasing deaths during the period tarnished the
lustre of the stocks. But in the intermediate phase, the coefficient was positive and significant
indicating that stock markets overlooked the rising deaths in hope of trend reversal sometime
soon. Also, in the intermediate phase, when the situation was nearly normal, the rising cases
affected the stock returns in a negative and significant manner. Thus the growth in confirmed
cases (GCASES) had a significant impact on the stock market only during the normal phase
where in other variables were stable.
Oil is a crucial input in most firms’ production and therefore their expected cash
flows can be affected by oil price leading to changes in costs, earnings and dividends and
hence stock prices ( Basher et. al ,2012; Rafailidis and Katrakilidis, 2014; Salisu and Isah
17
,2017; Narayan and Smyth, 2018). The COVID-19 crisis period witnessed drastic changes in
global oil prices; wherein the price of brent oil dropped from $68.90/barrel in the very
beginning of 2020 to $26.60 in May, 2020. The oil price volatility was also high during this
period, but since the prices were extremely low, it provided a support for the plunging the
stock market. Nevertheless, the oil volatility index (OVX) is also not a significant influence
on the stock returns during this period.
Many studies confirm the inverse relation between investor sentiment and stock
returns. In the Indian context, Shaikh and Padhi (2015) confirms the negative association
between VIX and stock returns. This relationship is established in the literature mainly via
two channels of operation. Firstly, when the investor sentiment is high, it pushes down the
value of the stocks due to the abnormal trading volume in the market. Secondly, when the
sentiment is bearish, lot of investor attention goes in there, which reduces the level of
uncertainty and hence the risk involved. This in turn reduces the premium reward for risk
taken thereby pulling down the stock returns. The stock market consists of all sorts of
investors; strategic, naive and opinionated whose behaviour is difficult to predict with
certainty especially during periods of extreme uncertainty. The impact of VIX on the stock
returns is insignificant during the whole COVID-19 phase and especially during the first
wave phase when the pandemic intensified. Chandra and Thenmozhi (2015) support the fact
that stock prices move independently with respect to the sentiment (VIX) during periods of
sharp downturns. And hence the investor sentiment turns out to be insignificant during the
first wave. In other phases, the VIX is negative and significant and the impact is more
prominent during the second phase, where we find that the stock markets were buttressed by
the strong positive sentiment alone. We see the same results for the second wave phase even
after the inclusion of the commodity indices of gold and crude oil. Equation (4) shows the
modified equation after the inclusion of the commodity indices; MCX iCOMDEX Crude Oil
(LNCRUDE) and MCX iCOMDEX Gold (LNGOLD).Both the commodity returns are
calculated for the purpose of the analysis.
𝐿𝑁𝐵𝑆𝐸𝑡 = 𝛽0 + 𝛽1 𝐺𝐶𝐴𝑆𝐸𝑆𝑡 + 𝛽2𝐷𝑅𝐴𝑇𝐸𝑡 + 𝛽3𝑅𝐸𝐶𝑅𝐴𝑇𝐸𝑡 + 𝛽4𝑉𝐼𝑋𝑡 + 𝛽5𝑂𝑉𝑋𝑡 +𝛽6𝐿𝑁𝐸𝑅𝑡 + 𝛽7𝐿𝑁𝐶𝑅𝑈𝐷𝐸𝑡 + 𝛽8𝐿𝑁𝐺𝑂𝐿𝐷𝑡 (4)
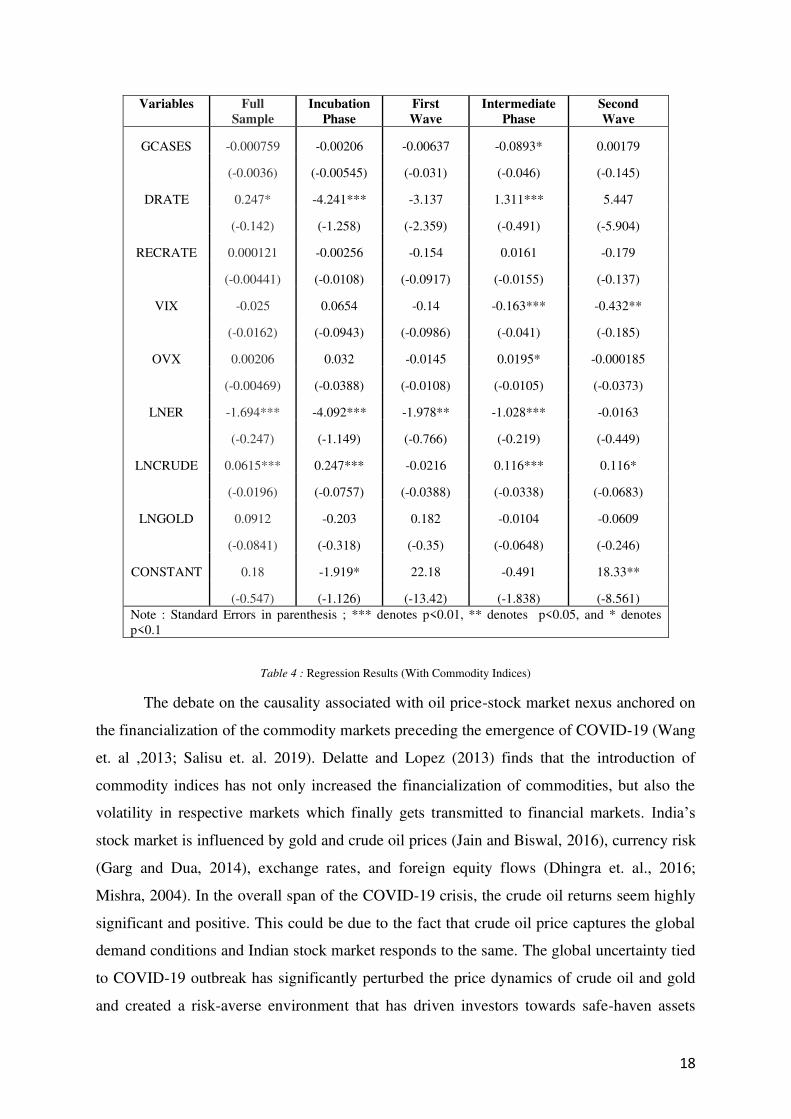
Table 4 shows that, along with the investor sentiment, the commodity index for crude
oil (CRUDE) returns also impact stock returns in a positive manner.
18
Variables
Full
Sample
Incubation
Phase
First
Wave
Intermediate
Phase
Second
Wave
GCASES -0.000759 -0.00206 -0.00637 -0.0893* 0.00179
(-0.0036) (-0.00545) (-0.031) (-0.046) (-0.145)
DRATE 0.247* -4.241*** -3.137 1.311*** 5.447
(-0.142) (-1.258) (-2.359) (-0.491) (-5.904)
RECRATE 0.000121 -0.00256 -0.154 0.0161 -0.179
(-0.00441) (-0.0108) (-0.0917) (-0.0155) (-0.137)
VIX -0.025 0.0654 -0.14 -0.163*** -0.432**
(-0.0162) (-0.0943) (-0.0986) (-0.041) (-0.185)
OVX 0.00206 0.032 -0.0145 0.0195* -0.000185
(-0.00469) (-0.0388) (-0.0108) (-0.0105) (-0.0373)
LNER -1.694*** -4.092*** -1.978** -1.028*** -0.0163
(-0.247) (-1.149) (-0.766) (-0.219) (-0.449)
LNCRUDE 0.0615*** 0.247*** -0.0216 0.116*** 0.116*
(-0.0196) (-0.0757) (-0.0388) (-0.0338) (-0.0683)
LNGOLD 0.0912 -0.203 0.182 -0.0104 -0.0609
(-0.0841) (-0.318) (-0.35) (-0.0648) (-0.246)
CONSTANT 0.18 -1.919* 22.18 -0.491 18.33**
(-0.547) (-1.126) (-13.42) (-1.838) (-8.561)
Note : Standard Errors in parenthesis ; *** denotes p<0.01, ** denotes p<0.05, and * denotes p<0.1
Table 4 : Regression Results (With Commodity Indices)
The debate on the causality associated with oil price-stock market nexus anchored on
the financialization of the commodity markets preceding the emergence of COVID-19 (Wang
et. al ,2013; Salisu et. al. 2019). Delatte and Lopez (2013) finds that the introduction of
commodity indices has not only increased the financialization of commodities, but also the
volatility in respective markets which finally gets transmitted to financial markets. India’s
stock market is influenced by gold and crude oil prices (Jain and Biswal, 2016), currency risk
(Garg and Dua, 2014), exchange rates, and foreign equity flows (Dhingra et. al., 2016;
Mishra, 2004). In the overall span of the COVID-19 crisis, the crude oil returns seem highly
significant and positive. This could be due to the fact that crude oil price captures the global
demand conditions and Indian stock market responds to the same. The global uncertainty tied
to COVID-19 outbreak has significantly perturbed the price dynamics of crude oil and gold
and created a risk-averse environment that has driven investors towards safe-haven assets
19
such as gold (Mensi et. al. 2020; Gharib et al, 2021). But in the Indian context, we see
negligible impact of gold returns on the stock returns. There exists a strong negative
association between stock market and exchange as the Indian stock market is highly
dependent on FIIs. In the incubation phase, VIX becomes insignificant as the crude oil
returns is added, indicating the preference for safe assets in times of a crisis.
5 Conclusion
The bullish market that emerged in the latter half of 2020 can be attributed to sheer
pessimism that existed in the months of March-April (2020), when the investors decided to
take advantage of the opportunity of the extremely undervalued stocks. Large influx of retail
traders into the stock market was guided by falling real return on deposit; both demand and
term; and improved digitization coupled with progressive regulations by SEBI to ease market
participation.
The event analysis shows that only the first lockdown and the first fiscal package
could garner an immediate significant impact on the stock returns. The analysis also suggests
that the market has been most averse to interest rate uncertainty in comparison to other types
of COVID-19 induced uncertainty. The empirical estimation provides interesting results as
we see that during periods of extreme volatility, the investor sentiment becomes insignificant
while it’s a pivotal influence during the normal time periods. But the stock return is
positively related to oil prices, suggesting that higher oil prices capture the effect of strong
global demand. Also, the negative relationship between exchange rate and stock return is
confirmed which is driven by strong dependence of Indian stock market on FIIs. The results
are of importance to both investors and policy makers as it exposes the complicated
sentiment-stock returns dynamics especially during times of crisis. It is not only the investor
sentiment, but the detailed analysis of the market fundamentals and portfolio diversification,
that constitutes a healthy investment plan during a crisis.
Indian stock market has outperformed its world counterparts even amidst grappling
economic pressures. A thriving stock market led by strong positive investor sentiment has
drawn in retail investors coveting exorbitant profits. But, with the economy’s vitals in danger,
sustaining the current performance is difficult as corporates cannot surpass the threats of an
imminent demand crunch. Lack of sufficient demand may run down the corporate profits and
erode the market value endangering the prevailing market stability. The current stock market
20
bubble guided by irrational exuberance may soon give way to an acute market crash unless
the economy is injected with adequate growth activators.
References
Abel, A.B.(1983): “Optimal investment under uncertainty,” The American Economic
Review, 73(1), pp.228-233. Albulescu, C. T. (2021):”COVID-19 and the United States financial markets’ volatility,” Finance Research Letters, 38, 101699. Ali, M., Alam, N., & Rizvi, S. A. R. (2020): “Coronavirus (COVID-19)—An epidemic or pandemic for financial markets,” Journal of Behavioural and Experimental Finance, 27, 100341. Arellano, C., Bai, Y. and Kehoe, P. (2010): “Financial markets and fluctuations in uncertainty,” Federal Reserve Bank of Minneapolis Working Paper. Baker, M., & Wurgler, J. (2007): “Investor sentiment in the stock market,” Journal of
economic perspectives, 21(2), 129-152. Bansal, R. and Yaron, A. (2004): “Risks for the long run: A potential resolution of asset pricing puzzles,” The journal of Finance, 59(4), pp.1481-1509. Barber, B., and J. Lyon (1997): “Detecting long-run abnormal stock returns: The empirical power and specification of test statistics,” Journal of Financial Economics, 43: 341-372. Basher, S. A., Haug, A. A., & Sadorsky, P. (2012): “Oil prices, exchange rates and emerging stock markets,” Energy Economics, 34(1), 227-240. Bekaert, G., Hoerova, M. and Duca, M.L.(2013): “Risk, uncertainty and monetary policy,” Journal of Monetary Economics, 60(7), pp.771-788. Brown, S.J. and Warner, J.B. (1985): “Using Daily Stock Returns: The Case of Event Studies,” Journal of Financial Economics, 14, 3-31. Campbell, J. Y., & Hentschel, L. (1992): “No news is good news: An asymmetric model of changing volatility in stock returns,” Journal of financial Economics, 31(3), 281-318. Chandra, A., & Thenmozhi, M. (2015): “On asymmetric relationship of India volatility index (India VIX) with stock market return and risk management,” Decision, 42(1), 33-55. Chung, T. K., Hui, C. H., & Li, K. F. (2013): “Explaining share price disparity with parameter uncertainty: Evidence from Chinese A-and H-shares,” Journal of Banking &
Finance, 37(3),1073-1083. Curatola, G., Donadelli, M., Kizys, R., & Riedel, M. (2016): “Investor sentiment and sectoral stock returns: Evidence from World Cup games,” Finance Research Letters, 17, 267-274.
21
Delatte, A. L., & Lopez, C. (2013): “Commodity and equity markets: Some stylized facts from a copula approach,” Journal of Banking & Finance, 37(12), 5346-5356. Dhingra, V. S., Gandhi, S., & Bulsara, H. P. (2016): “Foreign institutional investments in India: An empirical analysis of dynamic interactions with stock market return and volatility,” IIMB Management Review, 28(4), 212-224. Donadelli, M., Kizys, R., & Riedel, M. (2017): “Dangerous infectious diseases: Bad news for Main Street, good news for Wall Street?,” Journal of Financial Markets, 35, 84-103. Eichenbaum, M. S., Rebelo, S., & Trabandt, M. (2020): The macroeconomics of
epidemics (No. w26882), National Bureau of Economic Research. Elgin, C., Basbug, G., & Yalaman, A. (2020): “Economic policy responses to a pandemic: Developing the COVID-19 economic stimulus index,” COVID Economics, 1(3), 40-53. Fama, E., Fisher, L., Jensen, M. and Roll,R. (1969): “The adjustment of stock prices to new information,” International Economic Review, 10: 1-21. Flaxman, S., Mishra, S., Gandy, A., Unwin, H. J. T., Coupland, H., Mellan, T. A., ... & Bhatt, S. (2020): Estimating the number of infections and the impact of non-pharmaceutical interventions on COVID-19 in European countries: technical description update. arXiv
preprint arXiv:2004.11342. French, K. R., Schwert, G. W., & Stambaugh, R. F. (1987): “Expected stock returns and volatility,” Journal of financial Economics, 19(1), 3-29. Garg, R., & Dua, P. (2014), “Foreign portfolio investment flows to India: determinants and analysis,” World development, 59, 16-28. Gharib, C., Mefteh-Wali, S., & Jabeur, S. B. (2021): “The bubble contagion effect of COVID-19 outbreak: Evidence from crude oil and gold markets,” Finance research
letters, 38, 101703. Gormsen, N. J., & Koijen, R. S. (2020): “Coronavirus: Impact on stock prices and growth expectations,” The Review of Asset Pricing Studies, 10(4), 574-597. Hartman, R. (1972): “The effects of price and cost uncertainty on investment,” Journal of
economic theory, 5(2), pp.258-266. Jain, A., & Biswal, P. C. (2016): “Dynamic linkages among oil price, gold price, exchange rate, and stock market in India,” Resources Policy, 49, 179-185. Kumari, J., & Mahakud, J. (2015): “Does investor sentiment predict the asset volatility? Evidence from emerging stock market India,” Journal of Behavioral and Experimental
Finance, 8, 25-39. Kothari, S. P., & Warner, J. B. (2007): “Econometrics of event studies,” In Handbook of empirical corporate finance (pp. 3-36), Elsevier.
22
Mensi, W., Sensoy, A., Vo, X. V., & Kang, S. H. (2020): “Impact of COVID-19 outbreak on asymmetric multifractality of gold and oil prices,” Resources Policy, 69, 101829. Mishra, A. K. (2004): “Stock market and foreign exchange market in India: are they related?,” South Asia Economic Journal, 5(2), 209-232. Mitchell, M., and Stafford,E. (2000): “Managerial decisions and long-term stock price performance,” Journal of Business, 73: 287-329. Narayan, P. K., Phan, D. H. B., & Liu, G. (2021): “COVID-19 lockdowns, stimulus packages, travel bans, and stock returns,” Finance research letters, 38, 101732. Narayan, P. K., & Smyth, R. (2008): “Energy consumption and real GDP in G7 countries: new evidence from panel cointegration with structural breaks,” Energy
Economics, 30(5), 2331-2341. Oi, W.Y.(1961): “The desirability of price instability under perfect competition,” Econometrica: journal of the Econometric Society, pp.58-64. Rafailidis, P., & Katrakilidis, C. (2014): “The relationship between oil prices and stock prices: a nonlinear asymmetric cointegration approach,” Applied Financial
Economics, 24(12), 793-800. Salisu, A. A., & Isah, K. O. (2017): “Revisiting the oil price and stock market nexus: A nonlinear Panel ARDL approach,” Economic Modelling, 66, 258-271. Salisu, A. A., Swaray, R., & Oloko, T. F. (2019): “Improving the predictability of the oil–US stock nexus: The role of macroeconomic variables,” Economic Modelling, 76, 153-171. Shaikh, I., & Padhi, P. (2015): “The behavior of option’s implied volatility index: a case of India VIX,” Business: Theory and Practice, 16(2), 149-158. Suthar, M. S., Zimmerman, M. G., Kauffman, R. C., Mantus, G., Linderman, S. L., Hudson, W. H., ... & Wrammert, J. (2020), “Rapid generation of neutralizing antibody responses in COVID-19 patients,” Cell Reports Medicine, 1(3), 100040. Wang, Y., Wu, C., & Yang, L. (2013): “Oil price shocks and stock market activities: Evidence from oil-importing and oil-exporting countries,” Journal of Comparative
Economics, 41(4), 1220-1239. Yang, C., & Wu, H. (2019): “Chasing investor sentiment in stock market,” The North
American Journal of Economics and Finance, 50, 100975. Zhang, D., Hu, M. & Ji, Q. (2020): “Financial markets under the global pandemic of COVID-19,” Finance Research Letters, 36, 101528.

23