Embed Size (px)
Citation preview
COVID-19 in Ontario: January 15, 2020 to September 9, 2021 1
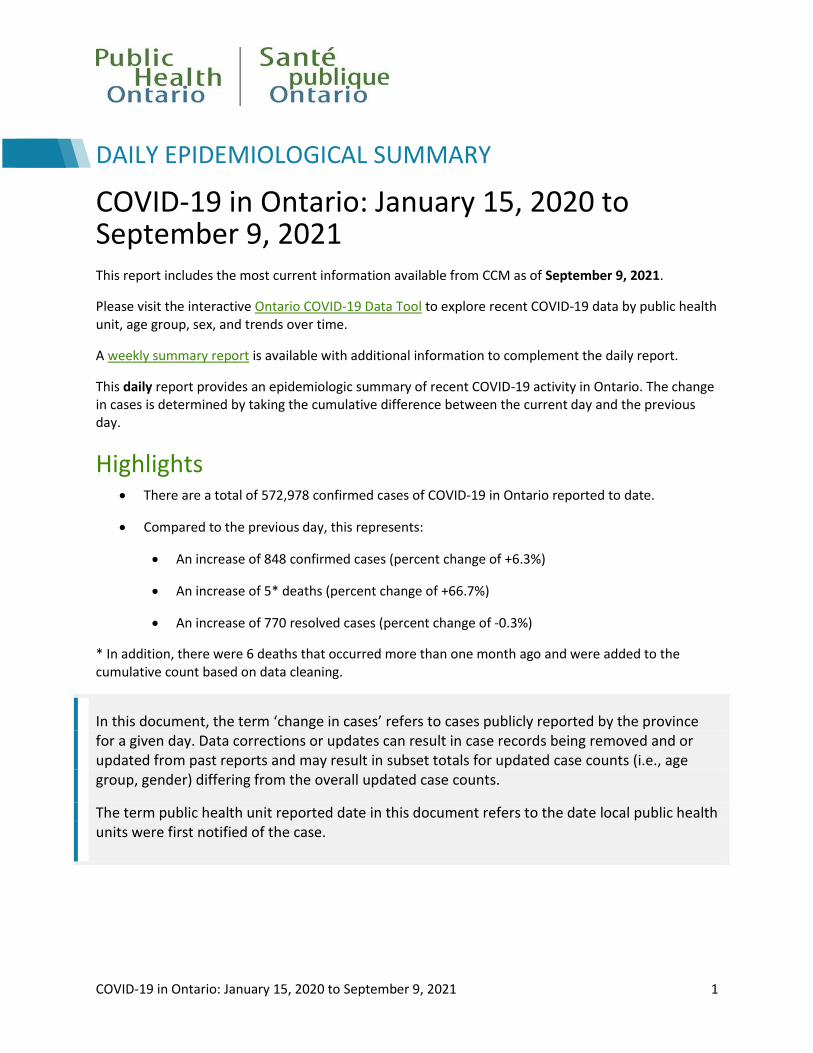
DAILY EPIDEMIOLOGICAL SUMMARY
COVID-19 in Ontario: January 15, 2020 to September 9, 2021 This report includes the most current information available from CCM as of September 9, 2021.
Please visit the interactive Ontario COVID-19 Data Tool to explore recent COVID-19 data by public health unit, age group, sex, and trends over time.
A weekly summary report is available with additional information to complement the daily report.
This daily report provides an epidemiologic summary of recent COVID-19 activity in Ontario. The change in cases is determined by taking the cumulative difference between the current day and the previous day.
Highlights There are a total of 572,978 confirmed cases of COVID-19 in Ontario reported to date.
Compared to the previous day, this represents:
An increase of 848 confirmed cases (percent change of +6.3%)
An increase of 5* deaths (percent change of +66.7%)
An increase of 770 resolved cases (percent change of -0.3%)
* In addition, there were 6 deaths that occurred more than one month ago and were added to the cumulative count based on data cleaning.
In this document, the term ‘change in cases’ refers to cases publicly reported by the province for a given day. Data corrections or updates can result in case records being removed and or updated from past reports and may result in subset totals for updated case counts (i.e., age group, gender) differing from the overall updated case counts.
The term public health unit reported date in this document refers to the date local public health units were first notified of the case.
COVID-19 in Ontario: January 15, 2020 to September 9, 2021 2
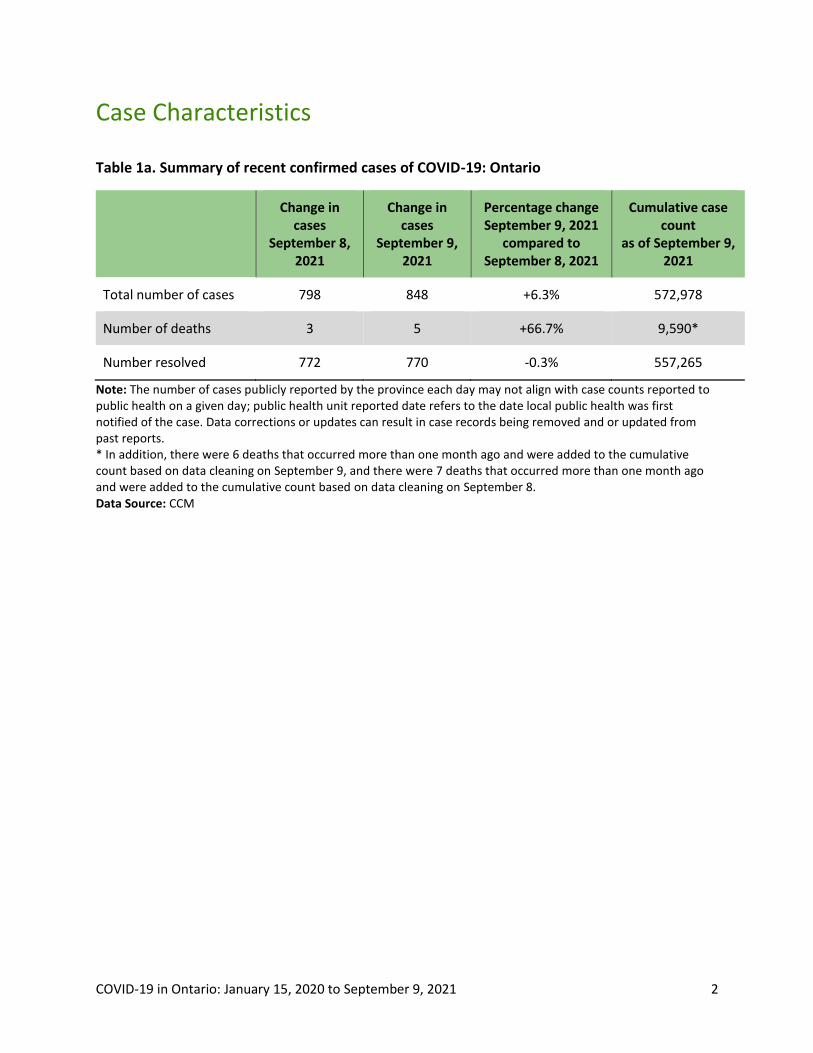
Case Characteristics
Table 1a. Summary of recent confirmed cases of COVID-19: Ontario
Change in cases
September 8, 2021
Change in cases
September 9, 2021
Percentage change September 9, 2021
compared to September 8, 2021
Cumulative case count
as of September 9, 2021
Total number of cases 798 848 +6.3% 572,978
Number of deaths 3 5 +66.7% 9,590*
Number resolved 772 770 -0.3% 557,265
Note: The number of cases publicly reported by the province each day may not align with case counts reported to public health on a given day; public health unit reported date refers to the date local public health was first notified of the case. Data corrections or updates can result in case records being removed and or updated from past reports. * In addition, there were 6 deaths that occurred more than one month ago and were added to the cumulative count based on data cleaning on September 9, and there were 7 deaths that occurred more than one month ago and were added to the cumulative count based on data cleaning on September 8. Data Source: CCM

COVID-19 in Ontario: January 15, 2020 to September 9, 2021 3
Table 1b. Summary of recent confirmed cases of COVID-19 by age group and gender: Ontario
Change in cases
September 8, 2021 Change in cases
September 9, 2021
Cumulative case count as of September 9,
2021
Gender: Male 396 437 285,550
Gender: Female 375 420 283,487
Ages: 0-4 35 45 15,691
Ages: 5-11 101 82 27,909
Ages: 12-19 85 90 51,078
Ages: 20-39 295 353 216,174
Ages: 40-59 190 178 161,706
Ages: 60-79 73 83 74,743
Ages: 80 and over 19 17 25,570
Note: Not all cases have a reported age or gender reported. Data corrections or updates can result in case records being removed and or updated from past reports and may result in subset totals (i.e., age group, gender) differing from past publicly reported case counts. Data Source: CCM

COVID-19 in Ontario: January 15, 2020 to September 9, 2021 4
Table 2. Summary of recent confirmed cases of COVID-19 in long-term care homes: Ontario
Long-term care home cases Change in cases
September 8, 2021 Change in cases
September 9, 2021
Cumulative case count as of September 9,
2021
Residents 9 2 15,521
Health care workers 3 1 7,305
Deaths among residents 2 1 3,996
Deaths among health care workers
0 0 10
Note: Information on how long-term care home residents and health care workers are identified is available in the technical notes. Also, the change in cases in these categories may represent existing case records that have been updated. Data Source: CCM
COVID-19 in Ontario: January 15, 2020 to September 9, 2021 5
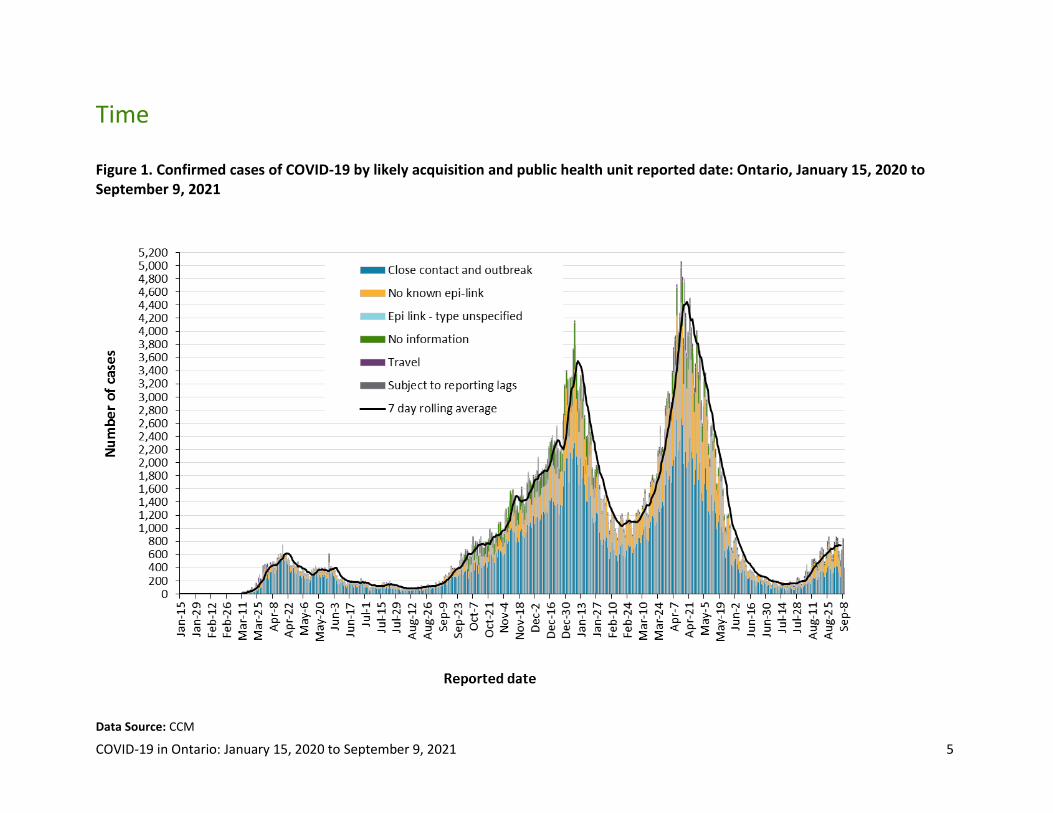
Time
Figure 1. Confirmed cases of COVID-19 by likely acquisition and public health unit reported date: Ontario, January 15, 2020 to September 9, 2021
Data Source: CCM
COVID-19 in Ontario: January 15, 2020 to September 9, 2021 6
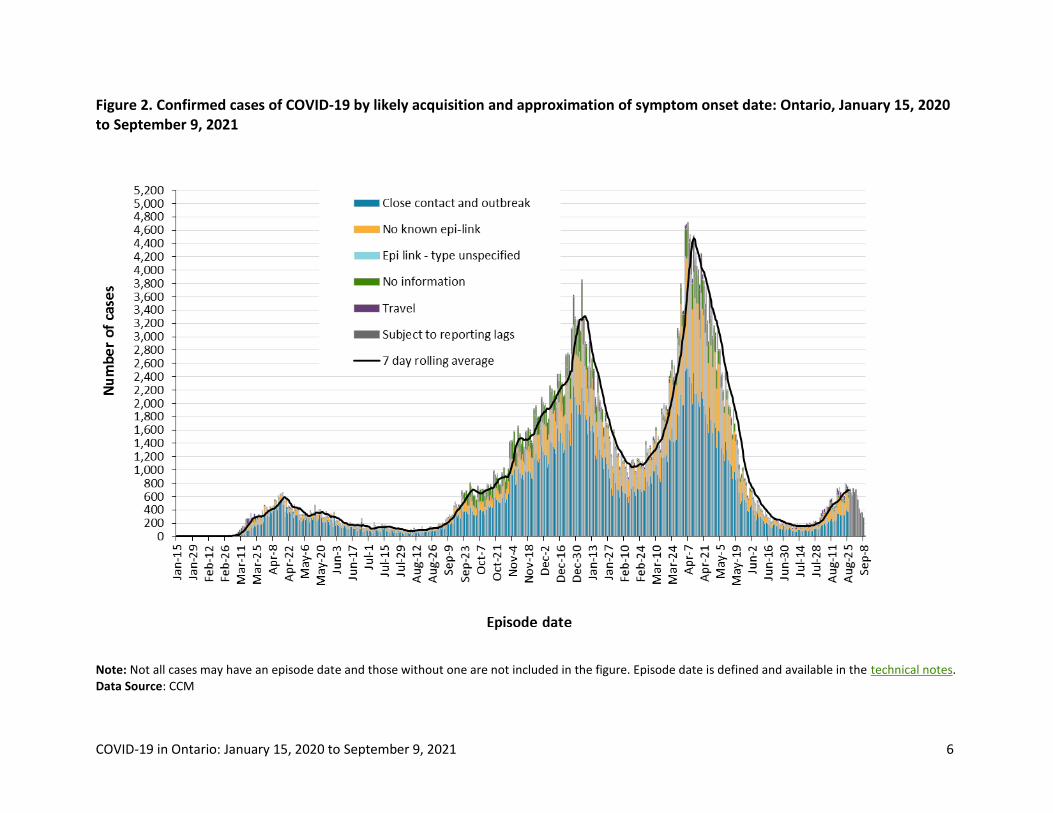
Figure 2. Confirmed cases of COVID-19 by likely acquisition and approximation of symptom onset date: Ontario, January 15, 2020 to September 9, 2021
Note: Not all cases may have an episode date and those without one are not included in the figure. Episode date is defined and available in the technical notes. Data Source: CCM
COVID-19 in Ontario: January 15, 2020 to September 9, 2021 7
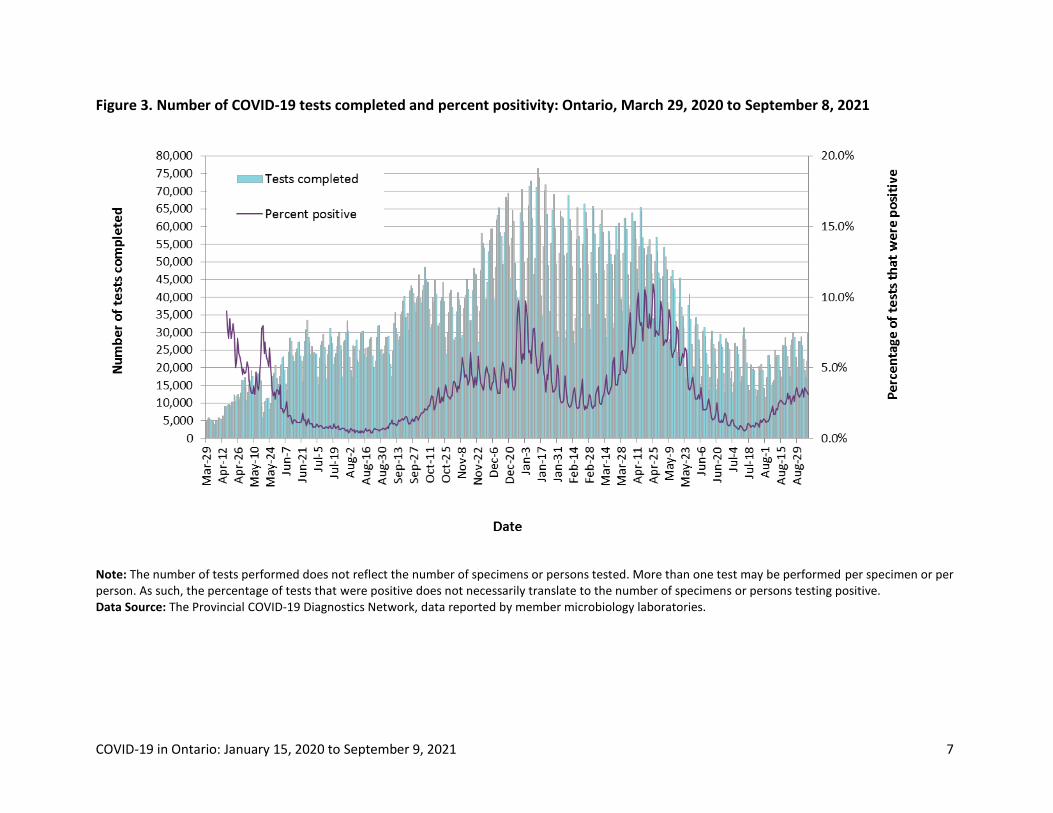
Figure 3. Number of COVID-19 tests completed and percent positivity: Ontario, March 29, 2020 to September 8, 2021
Note: The number of tests performed does not reflect the number of specimens or persons tested. More than one test may be performed per specimen or per person. As such, the percentage of tests that were positive does not necessarily translate to the number of specimens or persons testing positive. Data Source: The Provincial COVID-19 Diagnostics Network, data reported by member microbiology laboratories.
COVID-19 in Ontario: January 15, 2020 to September 9, 2021 8
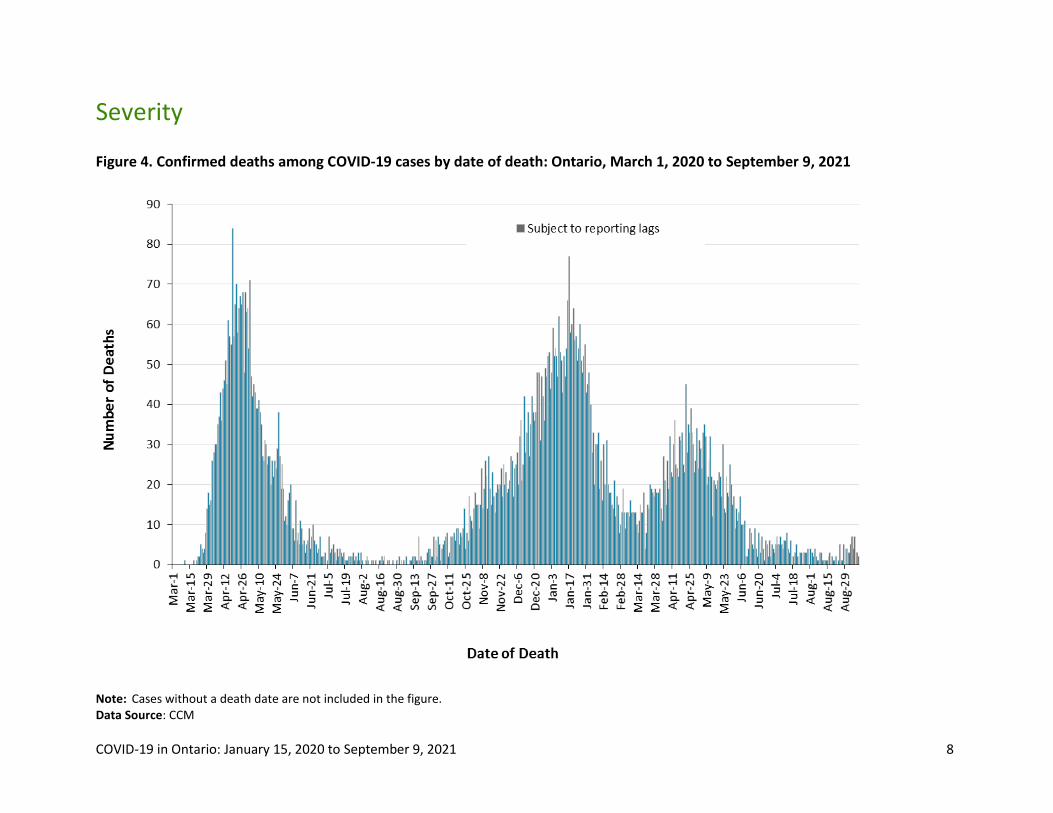
Severity
Figure 4. Confirmed deaths among COVID-19 cases by date of death: Ontario, March 1, 2020 to September 9, 2021
Note: Cases without a death date are not included in the figure. Data Source: CCM

COVID-19 in Ontario: January 15, 2020 to September 9, 2021 9
Table 3. Confirmed cases of COVID-19 by severity: Ontario
Blank cell Cumulative case count
as of September 9, 2021
Percentage of all cases
Cumulative deaths reported (please note there may be a reporting delay for deaths)
9,590 1.7%
Deaths reported in ages: 19 and under 5 < 0.1%
Deaths reported in ages: 20-39 92 < 0.1%
Deaths reported in ages: 40-59 638 0.4%
Deaths reported in ages: 60-79 3,109 4.2%
Deaths reported in ages: 80 and over 5,745 22.5%
Ever in ICU 5,707 1.0%
Ever hospitalized 29,330 5.1%
Note: Not all cases have an age reported. Data corrections or updates can result in case records being removed and/or updated and may result in totals differing from past publicly reported case counts. Percentage of deaths reported for each age group is calculated using all cases in the age group as the denominator. Data Source: CCM

COVID-19 in Ontario: January 15, 2020 to September 9, 2021 10
Geography
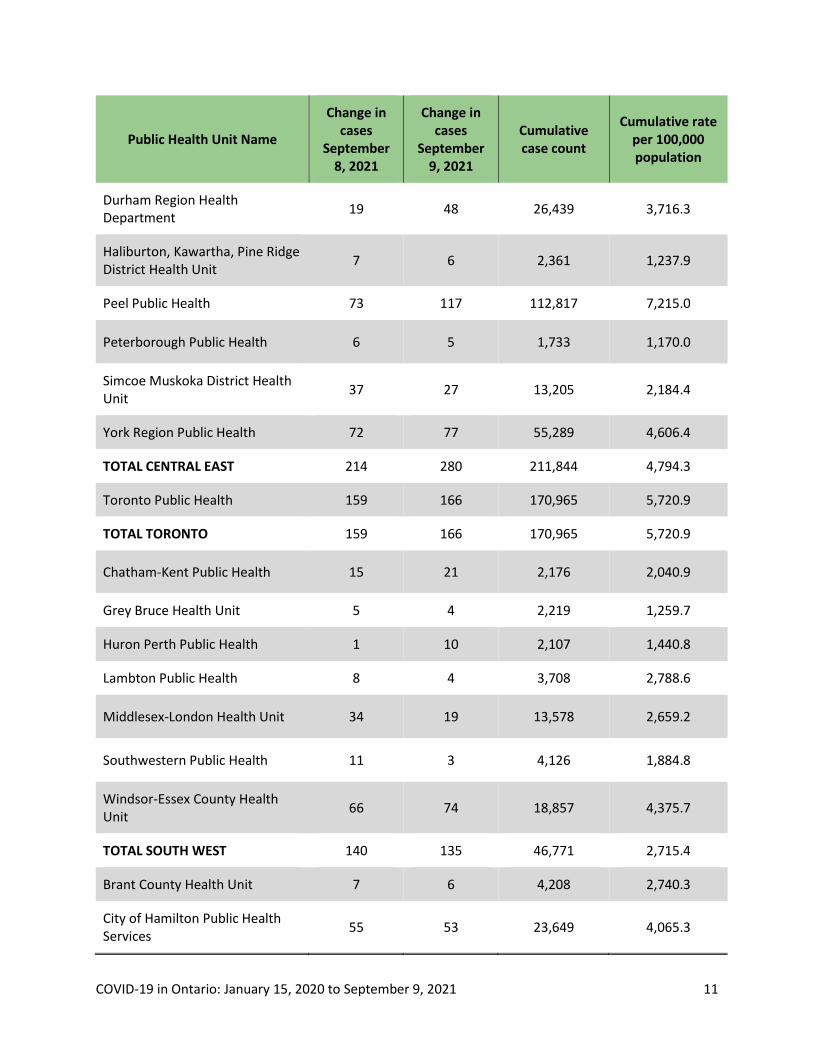
Table 4. Summary of recent confirmed cases of COVID-19 by public health unit and region: Ontario
Public Health Unit Name
Change in cases
September 8, 2021
Change in cases
September 9, 2021
Cumulative case count
Cumulative rate per 100,000 population
Northwestern Health Unit 0 1 1,130 1,391.9
Thunder Bay District Health Unit 4 0 3,381 2,143.9
TOTAL NORTH WEST 4 1 4,511 1,888.3
Algoma Public Health 1 8 444 376.8
North Bay Parry Sound District Health Unit
2 3 709 548.3
Porcupine Health Unit 1 0 2,184 2,569.4
Public Health Sudbury & Districts 8 7 2,301 1,121.0
Timiskaming Health Unit 0 0 209 616.8
TOTAL NORTH EAST 12 18 5,847 1,023.5
Ottawa Public Health 72 52 28,738 2,755.0
Eastern Ontario Health Unit 5 21 4,848 2,245.9
Hastings Prince Edward Public Health
6 4 1,310 758.0
Kingston, Frontenac and Lennox & Addington Public Health
6 7 1,643 785.3
Leeds, Grenville & Lanark District Health Unit
3 2 1,813 1,007.5
Renfrew County and District Health Unit
1 3 774 713.5
TOTAL EASTERN 93 89 39,126 2,027.8
COVID-19 in Ontario: January 15, 2020 to September 9, 2021 11
Public Health Unit Name
Change in cases
September 8, 2021
Change in cases
September 9, 2021
Cumulative case count
Cumulative rate per 100,000 population
Durham Region Health Department
19 48 26,439 3,716.3
Haliburton, Kawartha, Pine Ridge District Health Unit
7 6 2,361 1,237.9
Peel Public Health 73 117 112,817 7,215.0
Peterborough Public Health 6 5 1,733 1,170.0
Simcoe Muskoka District Health Unit
37 27 13,205 2,184.4
York Region Public Health 72 77 55,289 4,606.4
TOTAL CENTRAL EAST 214 280 211,844 4,794.3
Toronto Public Health 159 166 170,965 5,720.9
TOTAL TORONTO 159 166 170,965 5,720.9
Chatham-Kent Public Health 15 21 2,176 2,040.9
Grey Bruce Health Unit 5 4 2,219 1,259.7
Huron Perth Public Health 1 10 2,107 1,440.8
Lambton Public Health 8 4 3,708 2,788.6
Middlesex-London Health Unit 34 19 13,578 2,659.2
Southwestern Public Health 11 3 4,126 1,884.8
Windsor-Essex County Health Unit
66 74 18,857 4,375.7
TOTAL SOUTH WEST 140 135 46,771 2,715.4
Brant County Health Unit 7 6 4,208 2,740.3
City of Hamilton Public Health Services
55 53 23,649 4,065.3

COVID-19 in Ontario: January 15, 2020 to September 9, 2021 12
Public Health Unit Name
Change in cases
September 8, 2021
Change in cases
September 9, 2021
Cumulative case count
Cumulative rate per 100,000 population
Haldimand-Norfolk Health Unit 6 5 2,818 2,348.2
Halton Region Public Health 25 35 18,346 3,004.7
Niagara Region Public Health 38 24 17,007 3,530.4
Region of Waterloo Public Health and Emergency Services
31 26 19,166 3,166.7
Wellington-Dufferin-Guelph Public Health
14 10 8,720 2,794.9
TOTAL CENTRAL WEST 176 159 93,914 3,278.2
TOTAL ONTARIO 798 848 572,978 3,888.8
Notes: Health units with data corrections or updates could result in records being removed from totals, leading to negative or zero counts. Data Source: CCM
COVID-19 in Ontario: January 15, 2020 to September 9, 2021 13
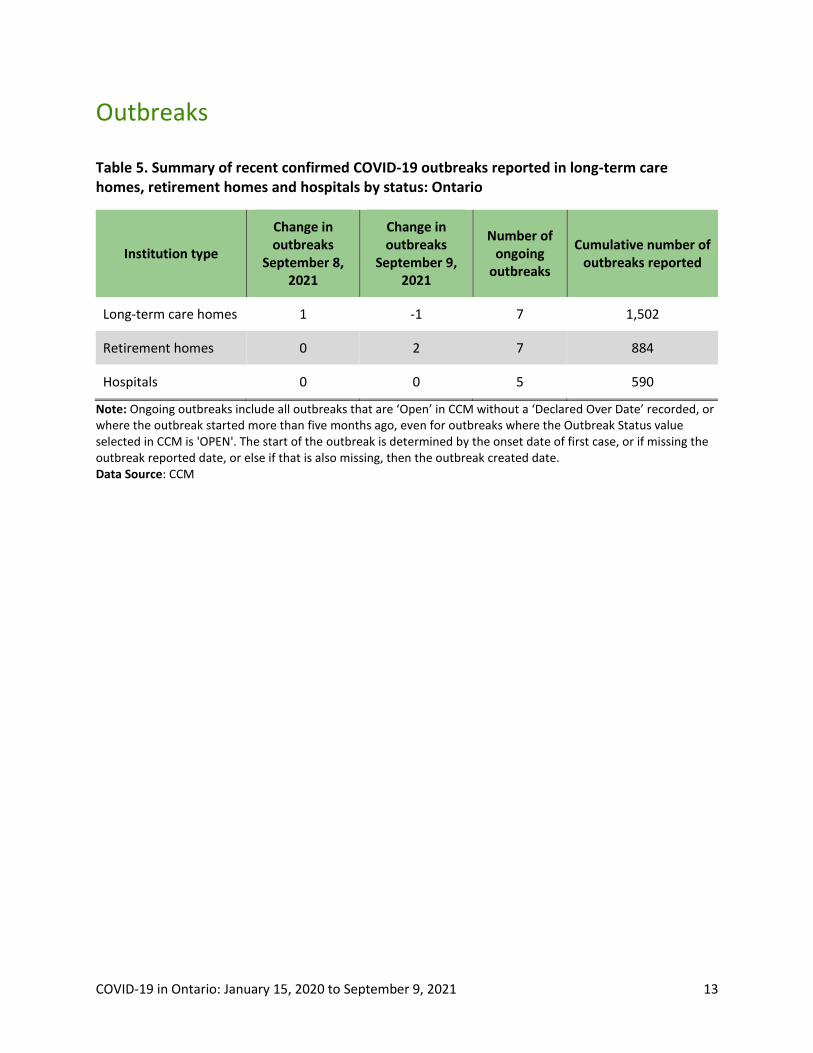
Outbreaks
Table 5. Summary of recent confirmed COVID-19 outbreaks reported in long-term care homes, retirement homes and hospitals by status: Ontario
Institution type
Change in outbreaks
September 8, 2021
Change in outbreaks
September 9, 2021
Number of ongoing
outbreaks
Cumulative number of outbreaks reported
Long-term care homes 1 -1 7 1,502
Retirement homes 0 2 7 884
Hospitals 0 0 5 590
Note: Ongoing outbreaks include all outbreaks that are ‘Open’ in CCM without a ‘Declared Over Date’ recorded, or where the outbreak started more than five months ago, even for outbreaks where the Outbreak Status value selected in CCM is 'OPEN'. The start of the outbreak is determined by the onset date of first case, or if missing the outbreak reported date, or else if that is also missing, then the outbreak created date. Data Source: CCM
COVID-19 in Ontario: January 15, 2020 to September 9, 2021 14
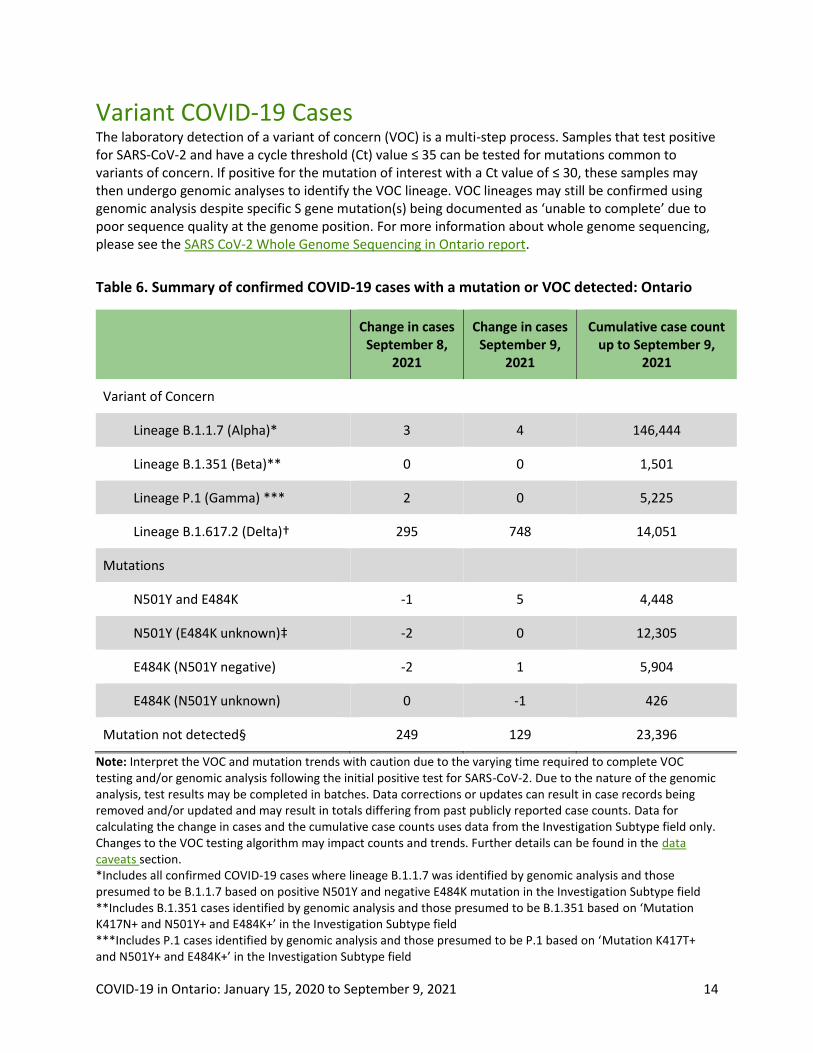
Variant COVID-19 Cases The laboratory detection of a variant of concern (VOC) is a multi-step process. Samples that test positive for SARS-CoV-2 and have a cycle threshold (Ct) value ≤ 35 can be tested for mutations common to variants of concern. If positive for the mutation of interest with a Ct value of ≤ 30, these samples may then undergo genomic analyses to identify the VOC lineage. VOC lineages may still be confirmed using genomic analysis despite specific S gene mutation(s) being documented as ‘unable to complete’ due to poor sequence quality at the genome position. For more information about whole genome sequencing, please see the SARS CoV-2 Whole Genome Sequencing in Ontario report.
Table 6. Summary of confirmed COVID-19 cases with a mutation or VOC detected: Ontario
Change in cases
September 8, 2021
Change in cases September 9,
2021
Cumulative case count up to September 9,
2021
Variant of Concern
Lineage B.1.1.7 (Alpha)* 3 4 146,444
Lineage B.1.351 (Beta)** 0 0 1,501
Lineage P.1 (Gamma) *** 2 0 5,225
Lineage B.1.617.2 (Delta)† 295 748 14,051
Mutations
N501Y and E484K -1 5 4,448
N501Y (E484K unknown)‡ -2 0 12,305
E484K (N501Y negative) -2 1 5,904
E484K (N501Y unknown) 0 -1 426
Mutation not detected§ 249 129 23,396
Note: Interpret the VOC and mutation trends with caution due to the varying time required to complete VOC testing and/or genomic analysis following the initial positive test for SARS-CoV-2. Due to the nature of the genomic analysis, test results may be completed in batches. Data corrections or updates can result in case records being removed and/or updated and may result in totals differing from past publicly reported case counts. Data for calculating the change in cases and the cumulative case counts uses data from the Investigation Subtype field only. Changes to the VOC testing algorithm may impact counts and trends. Further details can be found in the data caveats section. *Includes all confirmed COVID-19 cases where lineage B.1.1.7 was identified by genomic analysis and those presumed to be B.1.1.7 based on positive N501Y and negative E484K mutation in the Investigation Subtype field **Includes B.1.351 cases identified by genomic analysis and those presumed to be B.1.351 based on ‘Mutation K417N+ and N501Y+ and E484K+’ in the Investigation Subtype field ***Includes P.1 cases identified by genomic analysis and those presumed to be P.1 based on ‘Mutation K417T+ and N501Y+ and E484K+’ in the Investigation Subtype field

COVID-19 in Ontario: January 15, 2020 to September 9, 2021 15
†Includes B.1.617.2 and AY.3 cases identified by genomic analysis. Mutations common to B.1.617.2 are not included in the current VOC mutation test. ‡The category ‘N501Y (E484K unknown)’ mainly consists of results from before the introduction of the E484K test. Counts will shift from this category into a VOC lineage category as E484K tests or genomic analysis are completed. §Includes cases identified as ‘Mutation not detected’ or ‘Mutation N501Y- and E484K-‘ in the Investigation Subtype field only. Data Source: CCM
COVID-19 in Ontario: January 15, 2020 to September 9, 2021 16
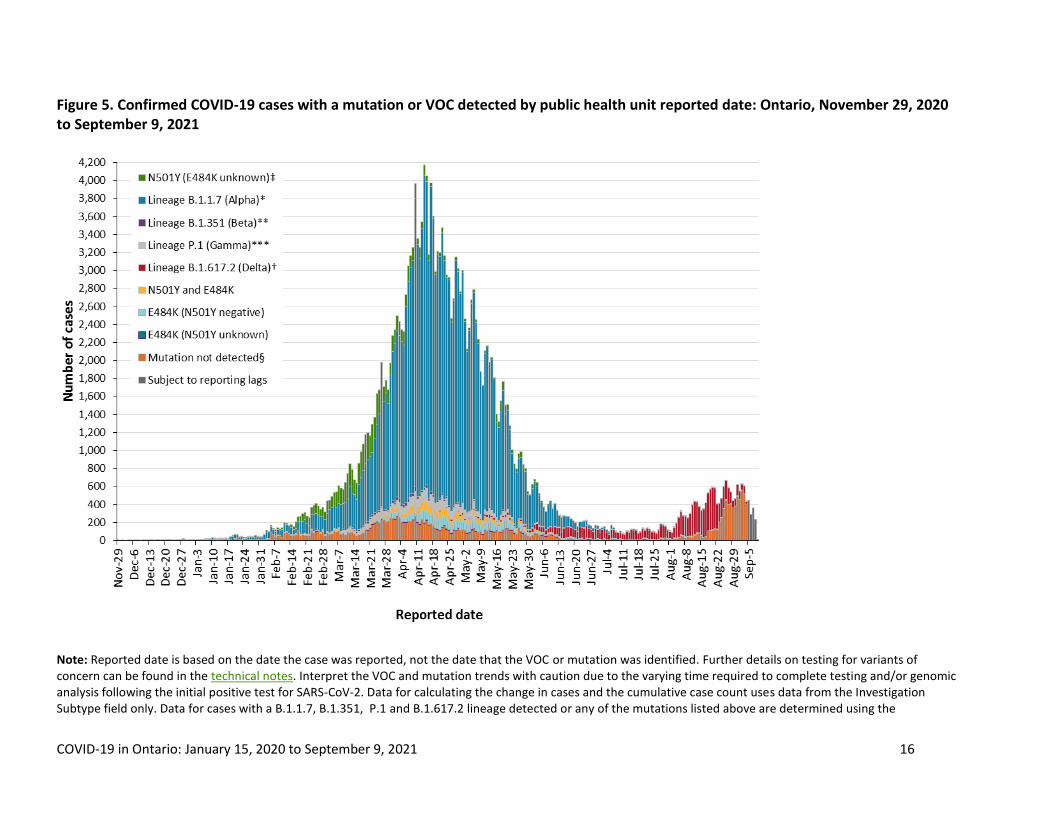
Figure 5. Confirmed COVID-19 cases with a mutation or VOC detected by public health unit reported date: Ontario, November 29, 2020 to September 9, 2021
Note: Reported date is based on the date the case was reported, not the date that the VOC or mutation was identified. Further details on testing for variants of concern can be found in the technical notes. Interpret the VOC and mutation trends with caution due to the varying time required to complete testing and/or genomic analysis following the initial positive test for SARS-CoV-2. Data for calculating the change in cases and the cumulative case count uses data from the Investigation Subtype field only. Data for cases with a B.1.1.7, B.1.351, P.1 and B.1.617.2 lineage detected or any of the mutations listed above are determined using the
COVID-19 in Ontario: January 15, 2020 to September 9, 2021 17
Investigation Subtype field only. Changes to the VOC testing algorithm may impact counts and trends. Further details can be found in the data caveats section. As of March 22, 2021, positive specimens with a Ct ≤ 35 are tested for both the N501Y and E484K mutation, with all E484K positive specimens with a Ct ≤ 30 forwarded for further genomic analysis. If found to be positive for the N501Y mutation only, no further genomic analysis are performed as these are presumed to be B.1.1.7. As of May 26, 2021, cases where an E484K mutation is detected will no longer be reflexed for sequencing as VOC testing labs switched to a representative sampling method where only a proportion of all positives with a Ct ≤ 30 are forwarded for further genomic analysis. *Includes all confirmed COVID-19 cases where lineage B.1.1.7 was identified by genomic analysis and those presumed to be B.1.1.7 based on positive N501Y and negative E484K mutation in the Investigation Subtype field **Includes B.1.351 cases identified by genomic analysis and those presumed to be B.1.351 based on ‘Mutation K417N+ and N501Y+ and E484K+’ in the Investigation Subtype field ***Includes P.1 cases identified by genomic analysis and those presumed to be P.1 based on ‘Mutation K417T+ and N501Y+ and E484K+’ in the Investigation Subtype field †Includes B.1.617.2 and AY.3 cases identified by genomic analysis. Mutations common to B.1.617.2 are not included in the current VOC mutation test. ‡The category ‘N501Y (E484K unknown)’ mainly consists of results from before the introduction of the E484K test. Counts will shift from this category into a VOC lineage category as E484K tests or genomic analysis are completed. §Includes cases identified as ‘Mutation not detected’ or ‘Mutation N501Y- and E484K-‘ in the Investigation Subtype field only. Data Source: CCM

COVID-19 in Ontario: January 15, 2020 to September 9, 2021 18
Technical Notes
Data Sources The data for this report were based on information successfully extracted from the Public Health
Case and Contact Management Solution (CCM) for all PHUs by PHO as of September 9, 2021 at 1 p.m. for cases reported from February 1, 2021 onwards and as of September 9, 2021 at 9 a.m. for cases reported up to January 31, 2021.
VOC data for this report were based on information successfully extracted from CCM for all PHUs by PHO as of September 9, 2021 at 1 p.m. for cases reported from April 1, 2021 onwards and as of September 9, 2021 at 9 a.m. for cases reported up to March 31, 2021.
CCM is a dynamic disease reporting system, which allows ongoing updates to data previously entered. As a result, data extracted from CCM represent a snapshot at the time of extraction and may differ from previous or subsequent reports.
Ontario population estimate data were sourced from Statistics Canada. Population estimates 2001-2020: Table 1 annual population estimates by age and sex for July 1, 2001 to 2020, health regions, Ontario [unpublished data table]. Ottawa, ON: Government of Canada; 2021 [received April 22, 2021].
COVID-19 test data were based on information from The Provincial COVID-19 Diagnostics Network, reported by member microbiology laboratories.
Data Caveats The data only represent cases reported to public health units and recorded in CCM. As a result,
all counts will be subject to varying degrees of underreporting due to a variety of factors, such as disease awareness and medical care seeking behaviours, which may depend on severity of illness, clinical practice, changes in laboratory testing, and reporting behaviours.
Data cleaning for older cases is incorporated on Mondays and may impact the case count published on Tuesdays
Lags in CCM data entry due to weekend staffing may result in lower case counts than would otherwise be recorded.
Only cases meeting the confirmed case classification as listed in the MOH Case Definition – Coronavirus Disease (COVID-19) document are included in the report counts from CCM
Cases of confirmed reinfection, as defined in the provincial case definitions, are counted as unique investigations.
Case classification information may be updated for individuals with a positive result issued from a point-of-care assays.
The number of tests performed does not reflect the number of specimens or persons tested. More than one test may be performed per specimen or per person. As such, the percentage of tests that were positive does not necessarily translate to the number of specimens or persons testing positive.

COVID-19 in Ontario: January 15, 2020 to September 9, 2021 19
Reported date is the date the case was reported to the public health unit.
Case episode date represents an estimate of disease onset. This date is calculated based on the earliest date of symptom onset, specimen collection/test date, or the date reported to the public health unit.
Resolved cases are determined only for COVID-19 cases that have not died. Cases that have died are considered fatal and not resolved. The following cases are classified as resolved:
Cases that are reported as ‘recovered’ in CCM
Cases that are not hospitalized and are 14 days past their episode date
Cases that are currently hospitalized (no hospital end date entered) and have a status of ‘closed’ in CCM (indicating public health unit follow-up is complete) and are 14 days past their symptom onset date or specimen collection date
Hospitalization includes all cases for which a hospital admission date was reported or hospitalization/ICU was reported as ‘Yes’ at the time of data extraction. It includes cases that have been discharged from hospital as well as cases that are currently hospitalized. Emergency room visits are not included in the number of reported hospitalizations.
ICU admission includes all cases for which an ICU admission date was reported at the time of data extraction. It is a subset of the count of hospitalized cases. It includes cases that have been treated or that are currently being treated in an ICU.
Orientation of case counts by geography is based on the permanent health unit. This is equivalent to the diagnosing health unit (DHU) in iPHIS. DHU refers to the case's public health unit of residence at the time of illness onset and not necessarily the location of exposure. Cases for which the DHU was reported as MOH-PHO (to signify a case that is not a resident of Ontario) have been excluded from the analyses.
Likely source of acquisition is determined by examining the epidemiologic link and epidemiologic link status fields in CCM. If no epidemiologic link is identified in those fields the risk factor fields are examined to determine whether a case travelled, was associated with a confirmed outbreak, was a contact of a case, had no known epidemiological link (sporadic community transmission) or was reported to have an unknown source/no information was reported. Some cases may have no information reported if the case is untraceable, was lost to follow-up or referred to FNIHB. Cases with multiple risk factors were assigned to a single likely acquisition source group which was determined hierarchically in the following order:
For cases with an episode date on or after April 1, 2020: Outbreak-associated > close contact of a confirmed case > travel > no known epidemiological link > information missing or unknown
For cases with an episode date before April 1, 2020: Travel > outbreak-associated > close contact of a confirmed case > no known epidemiological link > information missing or unknown
Deaths are determined by using the outcome field in CCM. Any case marked ‘Fatal’ is included in the deaths data. The CCM field Type of Death is not used to further categorize the data.

COVID-19 in Ontario: January 15, 2020 to September 9, 2021 20
The date of death is determined using the outcome date field for cases marked as ‘Fatal’ in the outcome field.
COVID-19 cases from CCM for which the Classification and/or Disposition was reported as ENTERED IN ERROR, DOES NOT MEET DEFINITION, IGNORE, DUPLICATE or any variation on these values have been excluded. The provincial case count for COVID-19 may include some duplicate records, if these records were not identified and resolved.
Ongoing outbreaks include all outbreaks that are ‘Open’ in CCM without a ‘Declared Over Date’ recorded, or where the outbreak started more than five months ago, even for outbreaks where the Outbreak Status value selected in CCM is 'OPEN'. The start of the outbreak is determined by the onset date of first case, or if missing the outbreak reported date, or else if that is also missing, then the outbreak created date.
‘Long-term care home residents’ includes cases that reported ‘Yes’ to the risk factor ‘Resident of a long-term care home’; or ‘Yes’ to the risk factor ‘Resident of nursing home or other chronic care facility’ and reported to be part of an outbreak assigned as a long-term care home (via the Outbreak number or case comments field); or were reported to be part of an outbreak assigned as a long-term care home (via the outbreak number or case comments field) with an age over 70 years and did not report ‘No’ to the risk factors ‘Resident of long-term care home’ or ‘Resident of nursing home or other chronic care facility’. ‘Long-term care home residents’ excludes cases that reported ‘Yes’ to any of the health care worker occupational risk factors.
The ‘health care workers’ variable includes cases that reported ‘Yes’ to any of the occupation of health care worker, doctor, nurse, dentist, dental hygienist, midwife, other medical technicians, personal support worker, respiratory therapist, first responder.
‘Health care workers associated with long-term care outbreaks’ includes ‘health care workers’ reported to be part of an outbreak assigned as a long-term care home (via the outbreak number or case comments field). Excludes cases that reported ‘Yes’ to risk factors ‘Resident of long-term care home’ or ‘Resident of nursing home or other chronic care facility’ and ‘Yes’ to the calculated ‘health care workers’ variable.
Percent change is calculated by taking the difference between the current period (i.e., daily count or sum of the daily count over a 7-day period) and previous period (i.e., daily count or sum of the daily count over a 7-day period), divided by the previous period.
Public Health Ontario conducts testing and genomic analyses for SARS-CoV-2 positive specimens using the criteria outlined here: https://www.publichealthontario.ca/en/laboratory-services/test-information-index/covid-19-voc
Lineage nomenclature is dynamic. PANGO lineage naming and assignment may change as more samples are sequenced and analyzed.
Variant status may be updated based on scientific evidence. Variants designated as a VOC in Canada is available on the Public Health Agency of Canada’s SARS-CoV-2 Variants webpage.
Changes to the VOC testing algorithm may occur over time and trends should be interpreted with caution. Since February 3, 2021 all PCR positive SARS-Co-V-2 specimens with Ct values ≤ 35 are tested for a N501Y mutation. As of March 22, 2021, positive specimens with a Ct ≤ 35 are tested for both the N501Y and E484K mutation, with all E484K positive specimens with a Ct ≤ 30 forwarded for further genomic analysis. If found to be positive for the N501Y mutation only, no

COVID-19 in Ontario: January 15, 2020 to September 9, 2021 21
further genomic analysis are performed as these are presumed to be B.1.1.7. As of May 26, 2021, cases where a E484K mutation is detected will no longer be reflexed for sequencing as VOC testing labs switched to a representative sampling method where only a proportion of all positives with a Ct ≤ 30 are forwarded for further genomic analysis.
The laboratory detection of a variant of concern is a multi-step process. Samples that test positive for SARS-CoV-2 and have a cycle threshold (Ct) value ≤ 35 can be tested for mutations common to variants of concern. If positive for the mutation of interest with a Ct value of ≤30, these samples may then undergo genomic analyses to identify the VOC lineage. VOC lineages may still be confirmed using genomic analysis despite specific S gene mutation(s) being documented as ‘unable to complete’ due to poor sequence quality at the genome position.
VOC testing data are analyzed for cases with a reported date on or after February 07, 2021. VOC testing data are based on CCM information reported within the laboratory object for select Logical Observation Identifiers Names and Codes (LOINC) and supplemented with information from the Investigation Subtype field. A confirmed Case Investigation is assigned a VOC test value (e.g., VOC test detected, VOC test not detected) based on the following hierarchy:
If multiple laboratory results are identified, a VOC test value is assigned based on the following hierarchy: Detected > Not Detected > Unable to complete
If a laboratory result is ‘Not Detected’ or ‘Unable to complete’, but data on the Investigation Subtype field is listed as a lineage or mutation common to a VOC, then the VOC test value is set to ‘Detected’
If a VOC is identified through genomic analysis cases initially classified as a mutation may be updated and moved to the appropriate lineage (B.1.1.7, B.1.351, P.1 and B.1.617.2)
LOINCs are a set of internationally used result description codes. In the absence of a standard LOINC, Ontario Health can create local result codes, which are identified with an ‘XON’ prefix. LOINCs incorporate details of the result value (e.g. test method, target detected - such as IgG, DNA, isolate etc.) and are unique to each result.
VOC testing data in this report are assigned on a per case basis. Multiple laboratory results may be associated to a single case investigation, but for analysis purposes are only counted once.
The percent of cases that test VOC positive is calculated by taking the number of VOC test positive, divided by the total number of confirmed COVID-19 cases for a given reported date.
The VOC percent positive may be higher than described in this report. As testing algorithms change, the VOC percent positivity may not be reflective of the exact number of COVID-19 cases due to VOCs
Only CCM case investigations with a CONFIRMED classification have their laboratory records with VOC testing information included in the percent positivity calculations

COVID-19 in Ontario: January 15, 2020 to September 9, 2021 22
Appendix A
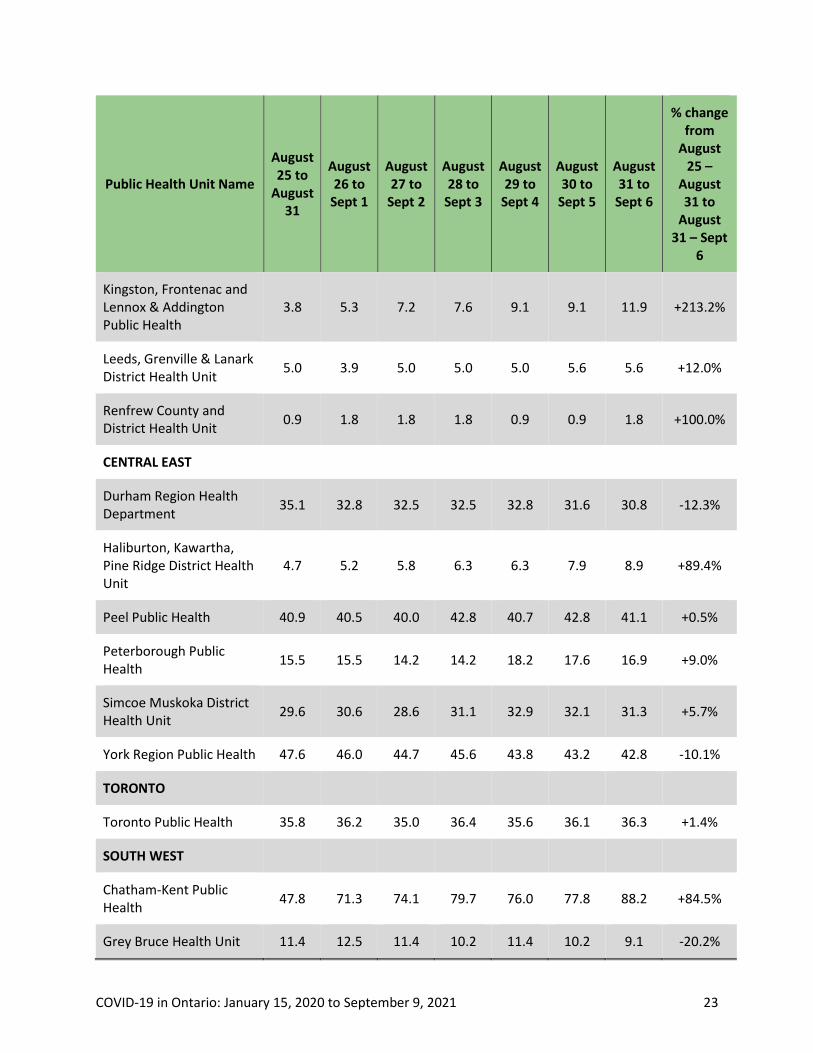
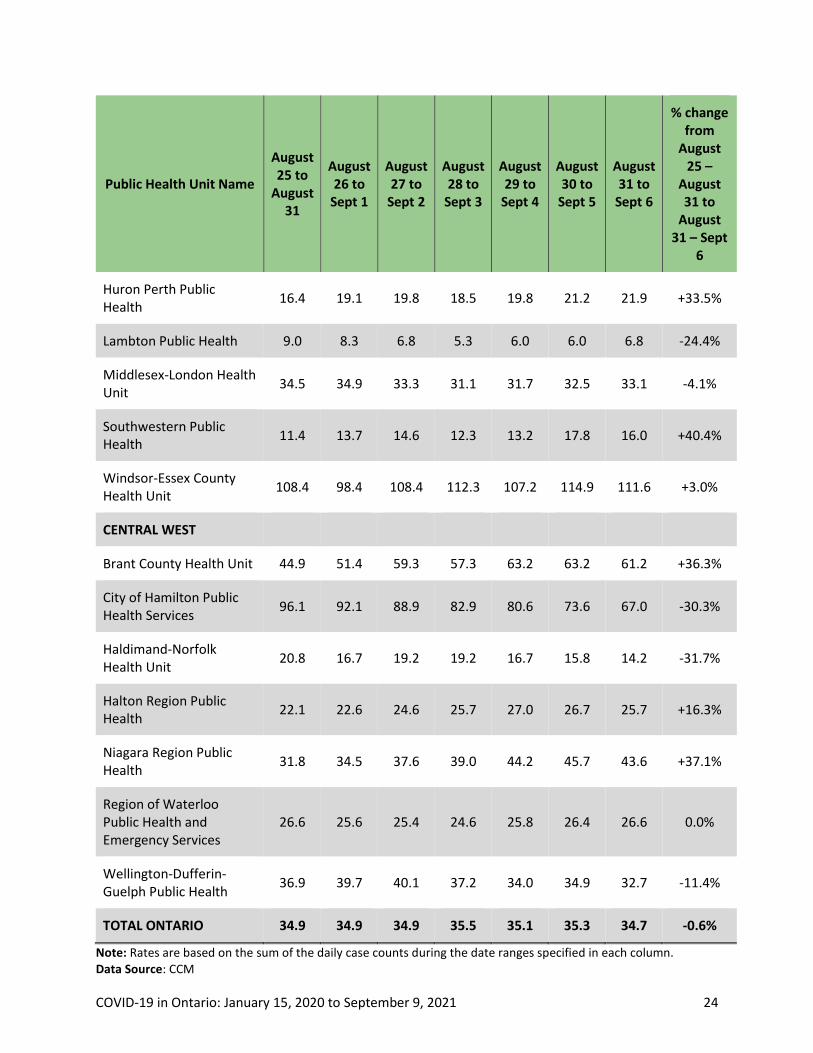
Table A1. Weekly rates of confirmed COVID-19 cases per 100,000 population over recent rolling 7-day periods, by reported date and public health unit: Ontario, August 25 to September 6, 2021
Public Health Unit Name
August 25 to
August 31
August 26 to
Sept 1
August 27 to
Sept 2
August 28 to
Sept 3
August 29 to
Sept 4
August 30 to
Sept 5
August 31 to
Sept 6
% change from
August 25 –
August 31 to
August 31 – Sept
6
NORTH WEST
Northwestern Health Unit
3.7 4.9 6.2 11.1 12.3 12.3 12.3 +232.4%
Thunder Bay District Health Unit
7.6 7.0 5.7 4.4 5.7 4.4 6.3 -17.1%
NORTH EAST
Algoma Public Health 7.6 6.8 6.8 5.1 2.5 2.5 0.0 -100.0%
North Bay Parry Sound District Health Unit
11.6 13.1 19.3 21.7 22.4 26.3 22.4 +93.1%
Porcupine Health Unit 15.3 14.1 20.0 21.2 18.8 17.6 17.6 +15.0%
Public Health Sudbury & Districts
11.2 11.2 11.7 10.2 10.2 7.3 9.3 -17.0%
Timiskaming Health Unit 3.0 3.0 3.0 3.0 3.0 3.0 0.0 -100.0%
EASTERN
Ottawa Public Health 19.5 22.1 21.3 23.7 23.6 23.1 24.0 +23.1%
Eastern Ontario Health Unit
35.2 34.7 32.0 32.9 30.6 28.7 30.1 -14.5%
Hastings Prince Edward Public Health
20.8 19.7 23.1 19.1 18.5 16.2 12.7 -38.9%
COVID-19 in Ontario: January 15, 2020 to September 9, 2021 23
Public Health Unit Name
August 25 to
August 31
August 26 to
Sept 1
August 27 to
Sept 2
August 28 to
Sept 3
August 29 to
Sept 4
August 30 to
Sept 5
August 31 to
Sept 6
% change from
August 25 –
August 31 to
August 31 – Sept
6
Kingston, Frontenac and Lennox & Addington Public Health
3.8 5.3 7.2 7.6 9.1 9.1 11.9 +213.2%
Leeds, Grenville & Lanark District Health Unit
5.0 3.9 5.0 5.0 5.0 5.6 5.6 +12.0%
Renfrew County and District Health Unit
0.9 1.8 1.8 1.8 0.9 0.9 1.8 +100.0%
CENTRAL EAST
Durham Region Health Department
35.1 32.8 32.5 32.5 32.8 31.6 30.8 -12.3%
Haliburton, Kawartha, Pine Ridge District Health Unit
4.7 5.2 5.8 6.3 6.3 7.9 8.9 +89.4%
Peel Public Health 40.9 40.5 40.0 42.8 40.7 42.8 41.1 +0.5%
Peterborough Public Health
15.5 15.5 14.2 14.2 18.2 17.6 16.9 +9.0%
Simcoe Muskoka District Health Unit
29.6 30.6 28.6 31.1 32.9 32.1 31.3 +5.7%
York Region Public Health 47.6 46.0 44.7 45.6 43.8 43.2 42.8 -10.1%
TORONTO
Toronto Public Health 35.8 36.2 35.0 36.4 35.6 36.1 36.3 +1.4%
SOUTH WEST
Chatham-Kent Public Health
47.8 71.3 74.1 79.7 76.0 77.8 88.2 +84.5%
Grey Bruce Health Unit 11.4 12.5 11.4 10.2 11.4 10.2 9.1 -20.2%
COVID-19 in Ontario: January 15, 2020 to September 9, 2021 24
Public Health Unit Name
August 25 to
August 31
August 26 to
Sept 1
August 27 to
Sept 2
August 28 to
Sept 3
August 29 to
Sept 4
August 30 to
Sept 5
August 31 to
Sept 6
% change from
August 25 –
August 31 to
August 31 – Sept
6
Huron Perth Public Health
16.4 19.1 19.8 18.5 19.8 21.2 21.9 +33.5%
Lambton Public Health 9.0 8.3 6.8 5.3 6.0 6.0 6.8 -24.4%
Middlesex-London Health Unit
34.5 34.9 33.3 31.1 31.7 32.5 33.1 -4.1%
Southwestern Public Health
11.4 13.7 14.6 12.3 13.2 17.8 16.0 +40.4%
Windsor-Essex County Health Unit
108.4 98.4 108.4 112.3 107.2 114.9 111.6 +3.0%
CENTRAL WEST
Brant County Health Unit 44.9 51.4 59.3 57.3 63.2 63.2 61.2 +36.3%
City of Hamilton Public Health Services
96.1 92.1 88.9 82.9 80.6 73.6 67.0 -30.3%
Haldimand-Norfolk Health Unit
20.8 16.7 19.2 19.2 16.7 15.8 14.2 -31.7%
Halton Region Public Health
22.1 22.6 24.6 25.7 27.0 26.7 25.7 +16.3%
Niagara Region Public Health
31.8 34.5 37.6 39.0 44.2 45.7 43.6 +37.1%
Region of Waterloo Public Health and Emergency Services
26.6 25.6 25.4 24.6 25.8 26.4 26.6 0.0%
Wellington-Dufferin-Guelph Public Health
36.9 39.7 40.1 37.2 34.0 34.9 32.7 -11.4%
TOTAL ONTARIO 34.9 34.9 34.9 35.5 35.1 35.3 34.7 -0.6%
Note: Rates are based on the sum of the daily case counts during the date ranges specified in each column. Data Source: CCM
COVID-19 in Ontario: January 15, 2020 to September 9, 2021 25
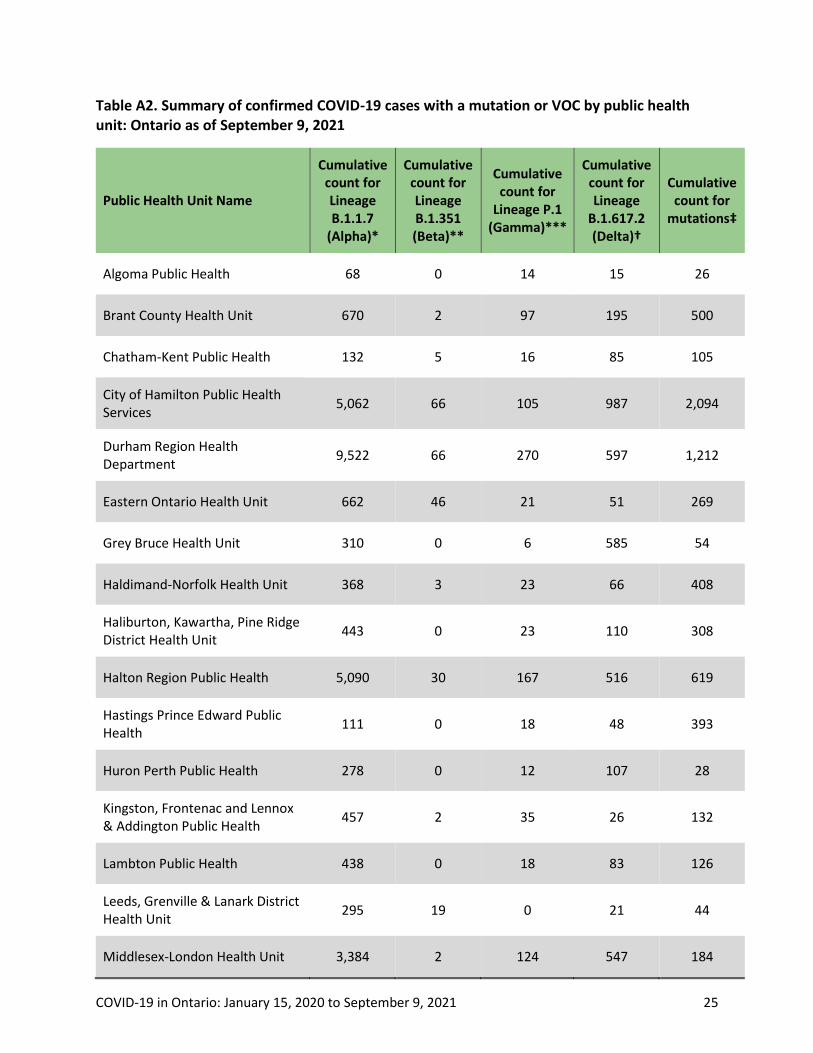
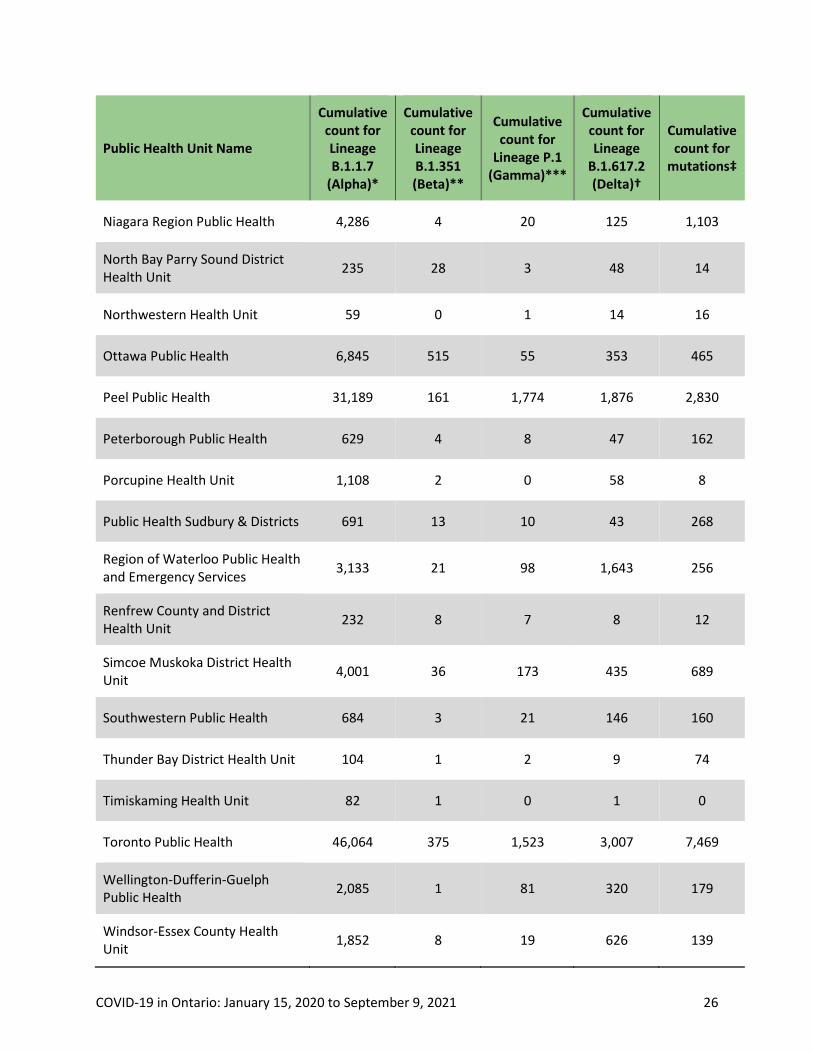
Table A2. Summary of confirmed COVID-19 cases with a mutation or VOC by public health unit: Ontario as of September 9, 2021
Public Health Unit Name
Cumulative count for Lineage B.1.1.7
(Alpha)*
Cumulative count for Lineage B.1.351 (Beta)**
Cumulative count for
Lineage P.1 (Gamma)***
Cumulative count for Lineage
B.1.617.2 (Delta)†
Cumulative count for
mutations‡
Algoma Public Health 68 0 14 15 26
Brant County Health Unit 670 2 97 195 500
Chatham-Kent Public Health 132 5 16 85 105
City of Hamilton Public Health Services
5,062 66 105 987 2,094
Durham Region Health Department
9,522 66 270 597 1,212
Eastern Ontario Health Unit 662 46 21 51 269
Grey Bruce Health Unit 310 0 6 585 54
Haldimand-Norfolk Health Unit 368 3 23 66 408
Haliburton, Kawartha, Pine Ridge District Health Unit
443 0 23 110 308
Halton Region Public Health 5,090 30 167 516 619
Hastings Prince Edward Public Health
111 0 18 48 393
Huron Perth Public Health 278 0 12 107 28
Kingston, Frontenac and Lennox & Addington Public Health
457 2 35 26 132
Lambton Public Health 438 0 18 83 126
Leeds, Grenville & Lanark District Health Unit
295 19 0 21 44
Middlesex-London Health Unit 3,384 2 124 547 184
COVID-19 in Ontario: January 15, 2020 to September 9, 2021 26
Public Health Unit Name
Cumulative count for Lineage B.1.1.7
(Alpha)*
Cumulative count for Lineage B.1.351 (Beta)**
Cumulative count for
Lineage P.1 (Gamma)***
Cumulative count for Lineage
B.1.617.2 (Delta)†
Cumulative count for
mutations‡
Niagara Region Public Health 4,286 4 20 125 1,103
North Bay Parry Sound District Health Unit
235 28 3 48 14
Northwestern Health Unit 59 0 1 14 16
Ottawa Public Health 6,845 515 55 353 465
Peel Public Health 31,189 161 1,774 1,876 2,830
Peterborough Public Health 629 4 8 47 162
Porcupine Health Unit 1,108 2 0 58 8
Public Health Sudbury & Districts 691 13 10 43 268
Region of Waterloo Public Health and Emergency Services
3,133 21 98 1,643 256
Renfrew County and District Health Unit
232 8 7 8 12
Simcoe Muskoka District Health Unit
4,001 36 173 435 689
Southwestern Public Health 684 3 21 146 160
Thunder Bay District Health Unit 104 1 2 9 74
Timiskaming Health Unit 82 1 0 1 0
Toronto Public Health 46,064 375 1,523 3,007 7,469
Wellington-Dufferin-Guelph Public Health
2,085 1 81 320 179
Windsor-Essex County Health Unit
1,852 8 19 626 139
COVID-19 in Ontario: January 15, 2020 to September 9, 2021 27
Public Health Unit Name
Cumulative count for Lineage B.1.1.7
(Alpha)*
Cumulative count for Lineage B.1.351 (Beta)**
Cumulative count for
Lineage P.1 (Gamma)***
Cumulative count for Lineage
B.1.617.2 (Delta)†
Cumulative count for
mutations‡
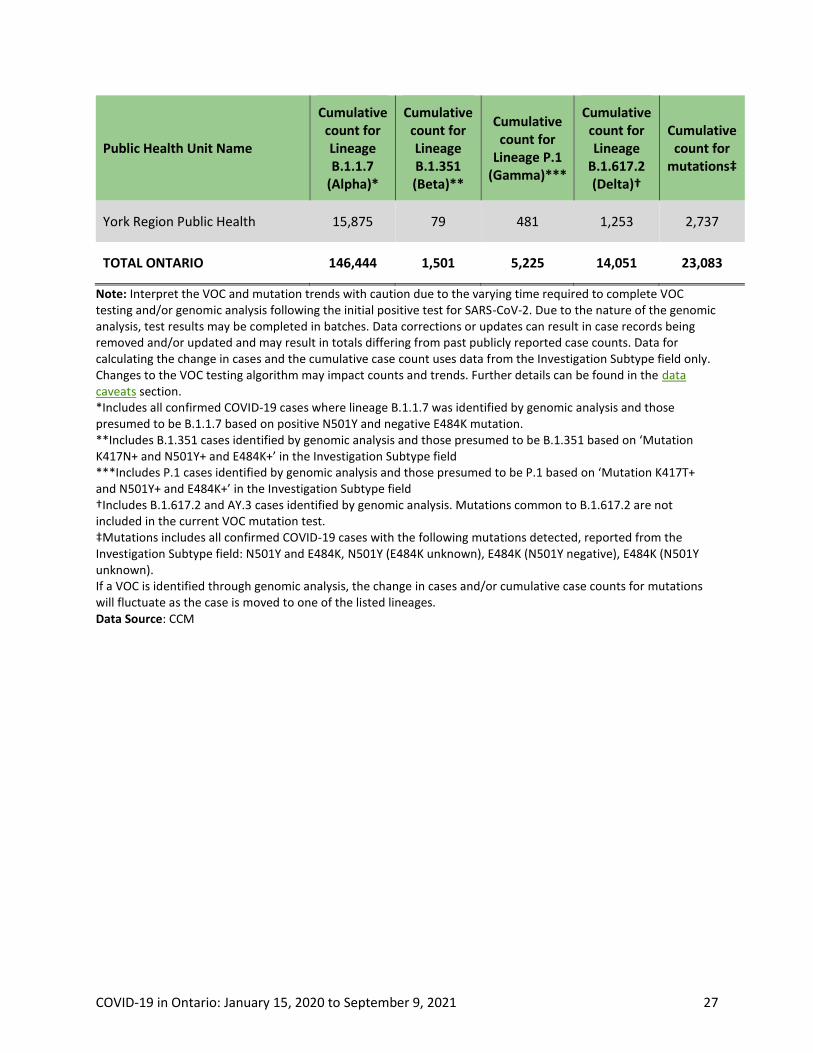
York Region Public Health 15,875 79 481 1,253 2,737
TOTAL ONTARIO 146,444 1,501 5,225 14,051 23,083
Note: Interpret the VOC and mutation trends with caution due to the varying time required to complete VOC testing and/or genomic analysis following the initial positive test for SARS-CoV-2. Due to the nature of the genomic analysis, test results may be completed in batches. Data corrections or updates can result in case records being removed and/or updated and may result in totals differing from past publicly reported case counts. Data for calculating the change in cases and the cumulative case count uses data from the Investigation Subtype field only. Changes to the VOC testing algorithm may impact counts and trends. Further details can be found in the data caveats section. *Includes all confirmed COVID-19 cases where lineage B.1.1.7 was identified by genomic analysis and those presumed to be B.1.1.7 based on positive N501Y and negative E484K mutation. **Includes B.1.351 cases identified by genomic analysis and those presumed to be B.1.351 based on ‘Mutation K417N+ and N501Y+ and E484K+’ in the Investigation Subtype field ***Includes P.1 cases identified by genomic analysis and those presumed to be P.1 based on ‘Mutation K417T+ and N501Y+ and E484K+’ in the Investigation Subtype field †Includes B.1.617.2 and AY.3 cases identified by genomic analysis. Mutations common to B.1.617.2 are not included in the current VOC mutation test. ‡Mutations includes all confirmed COVID-19 cases with the following mutations detected, reported from the Investigation Subtype field: N501Y and E484K, N501Y (E484K unknown), E484K (N501Y negative), E484K (N501Y unknown). If a VOC is identified through genomic analysis, the change in cases and/or cumulative case counts for mutations will fluctuate as the case is moved to one of the listed lineages. Data Source: CCM
COVID-19 in Ontario: January 15, 2020 to September 9, 2021 28
Citation Ontario Agency for Health Protection and Promotion (Public Health Ontario). Epidemiologic summary: COVID-19 in Ontario – January 15, 2020 to September 9, 2021. Toronto, ON: Queen’s Printer for Ontario; 2021.
Disclaimer This document was developed by Public Health Ontario (PHO). PHO provides scientific and technical advice to Ontario’s government, public health organizations and health care providers. PHO’s work is guided by the current best available evidence at the time of publication. The application and use of this document is the responsibility of the user. PHO assumes no liability resulting from any such application or use. This document may be reproduced without permission for non-commercial purposes only and provided that appropriate credit is given to PHO. No changes and/or modifications may be made to this document without express written permission from PHO.
For Further Information For more information, [email protected].
Public Health Ontario Public Health Ontario is an agency of the Government of Ontario dedicated to protecting and promoting the health of all Ontarians and reducing inequities in health. Public Health Ontario links public health practitioners, front-line health workers and researchers to the best scientific intelligence and knowledge from around the world.
For more information about PHO, visit publichealthontario.ca.
©Queen’s Printer for Ontario, 2021