Embed Size (px)
Citation preview

COVID-19 in Ontario: January 15, 2020 to June 18, 2020 1
Daily Epidemiologic Summary
COVID-19 in Ontario: January 15, 2020 to June 18, 2020
This report includes the most current information available from iPHIS and other local case management systems (iPHIS plus) as of June 18, 2020.
Please visit the interactive Ontario COVID-19 Data Tool to explore recent COVID-19 data by public health unit, age group, sex, and trends over time.
A weekly summary report is available with additional information to complement the daily report.
This daily report provides an epidemiologic summary of recent COVID-19 activity in Ontario. The change in cases is determined by taking the cumulative difference between the current day and the previous day.
Highlights There are a total of 33,095 confirmed cases of COVID-19 in Ontario reported to date.
Compared to the previous day, this represents:
An increase of 178 confirmed cases (percent change of 2.9%)
An increase of 11 deaths (percent change of 266.7%)
An increase of 246 resolved cases (percent change of 11.8%)
In this document, the term ‘change in cases’ refers to cases publicly reported by the province for a given day. Data corrections or updates can result in case records being removed and or updated from past reports and may result in subset totals for updated case counts (i.e., age group, gender) differing from the overall updated case counts.
The term public health unit reported date in this document refers to the date local public health units were first notified of the case.

COVID-19 in Ontario: January 15, 2020 to June 18, 2020 2
Case Characteristics
Table 1a. Summary of recent cases of COVID-19: Ontario
Change in cases
June 17
Change in cases
June 18
Percentage change
June 18 compared to June 17
Cumulative case count
as of June 18
Number of cases 173 178 2.9% 33,095
Number of deaths 3 11 266.7% 2,564
Number resolved 220 246 11.8% 28,250
Note: The number of cases publicly reported by the province each day may not align with case counts reported to public health on a given day; public health unit reported date refers to the date local public health was first notified of the case.
Data Source: iPHIS plus
Table 1b. Summary of recent cases of COVID-19 by age group and gender: Ontario
Change in cases
June 17
Change in cases
June 18
Cumulative case count
as of June 18
Gender: Male 79 109 14,984
Gender: Female 93 68 17,838
Ages: 19 and under 18 16 1,475
Ages: 20-39 81 58 9,335
Ages: 40-59 44 51 10,126
Ages: 60-79 31 35 6,400
Ages: 80 and over 0 18 5,747
Note: Not all cases have a reported age or gender reported. Data corrections or updates can result in case records being removed and or updated from past reports and may result in subset totals (i.e., age group, gender) differing from past publicly reported case counts.
Data Source: iPHIS plus

COVID-19 in Ontario: January 15, 2020 to June 18, 2020 3
Table 2. Summary of recent cases of COVID-19 in long-term care homes: Ontario
Long-term care home cases Change in cases
June 17
Change in cases
June 18
Cumulative case count as of June 18
Residents 1 24 5,384
Health care workers 18 27 2,142
Deaths among residents 0 9 1,645
Deaths among health care workers
0 0 6
Note: Information for how long-term care home residents and health care workers are identified is available in the technical notes. The change in cases in these categories may represent existing case records that have been updated.
Data Source: iPHIS plus

COVID-19 in Ontario: January 15, 2020 to June 18, 2020 4
Time
Figure 1. Confirmed cases of COVID-19 by likely acquisition and public health unit reported date: Ontario, January 15, 2020 to June 18, 2020
Data Source: iPHIS plus

COVID-19 in Ontario: January 15, 2020 to June 18, 2020 5
Figure 2. Confirmed cases of COVID-19 by likely acquisition and approximation of symptom onset date: Ontario, January 15, 2020 to June 18, 2020
Note: Not all cases may have an episode date and are not included in the figure. Episode date is defined and available in the technical notes.
Data Source: iPHIS plus

COVID-19 in Ontario: January 15, 2020 to June 18, 2020 6
Figure 3. Number of COVID-19 tests completed and percent positivity: Ontario, March 29, 2020 to June 17, 2020
Note: The number of tests performed does not reflect the number of specimens or persons tested. More than one test may be performed per specimen or per person. As such, the percentage of tests that were positive does not necessarily translate to the number of specimens or persons testing positive.
Data Source: The Provincial COVID-19 Diagnostics Network, data reported by member microbiology laboratories.

COVID-19 in Ontario: January 15, 2020 to June 18, 2020 7
Severity Figure 4. Confirmed deaths among COVID-19 cases by date of death: Ontario, March 1, 2020 to June 18, 2020
Note: Cases without a death date are not included in the figure.
Data Source: iPHIS plus
COVID-19 in Ontario: January 15, 2020 to June 18, 2020 8
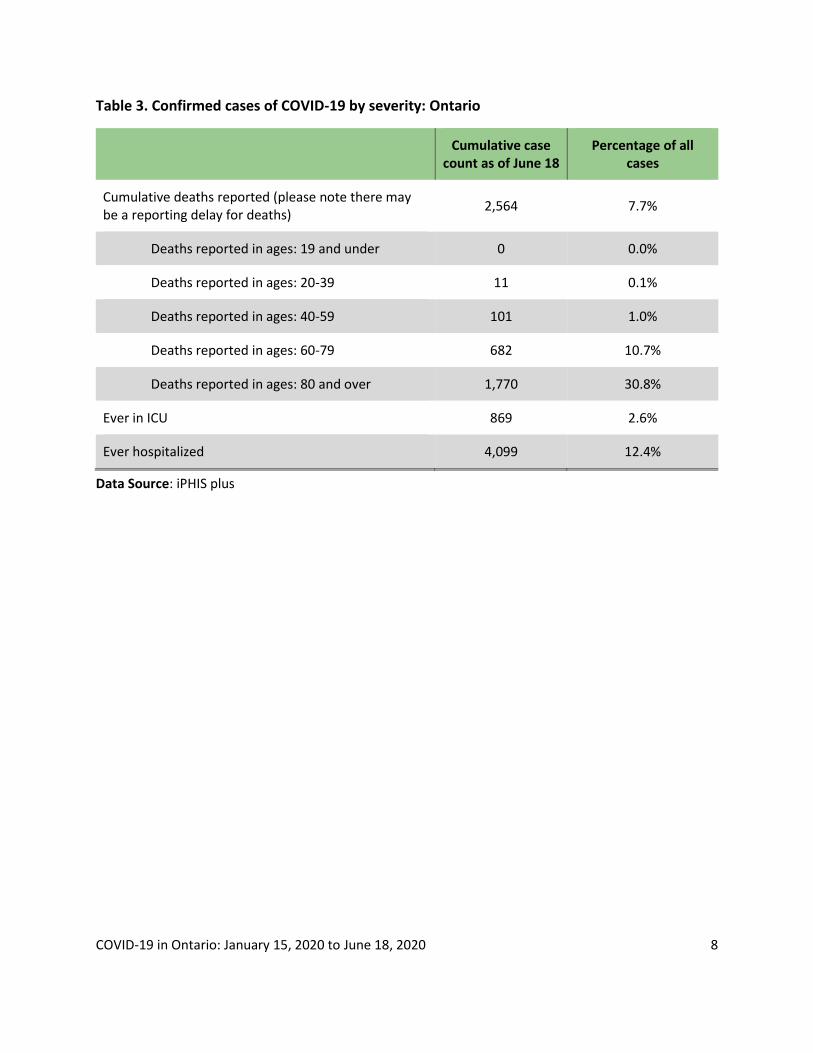
Table 3. Confirmed cases of COVID-19 by severity: Ontario
Blank cell Cumulative case
count as of June 18 Percentage of all
cases
Cumulative deaths reported (please note there may be a reporting delay for deaths)
2,564 7.7%
Deaths reported in ages: 19 and under 0 0.0%
Deaths reported in ages: 20-39 11 0.1%
Deaths reported in ages: 40-59 101 1.0%
Deaths reported in ages: 60-79 682 10.7%
Deaths reported in ages: 80 and over 1,770 30.8%
Ever in ICU 869 2.6%
Ever hospitalized 4,099 12.4%
Data Source: iPHIS plus
COVID-19 in Ontario: January 15, 2020 to June 18, 2020 9
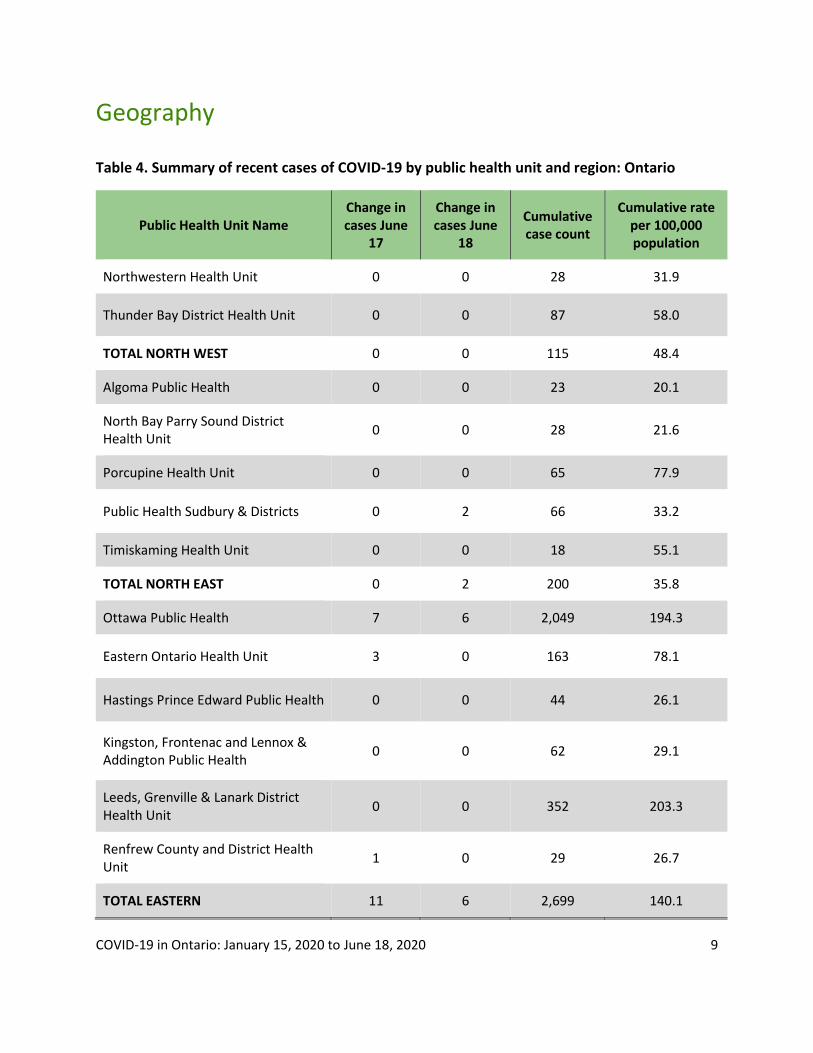
Geography
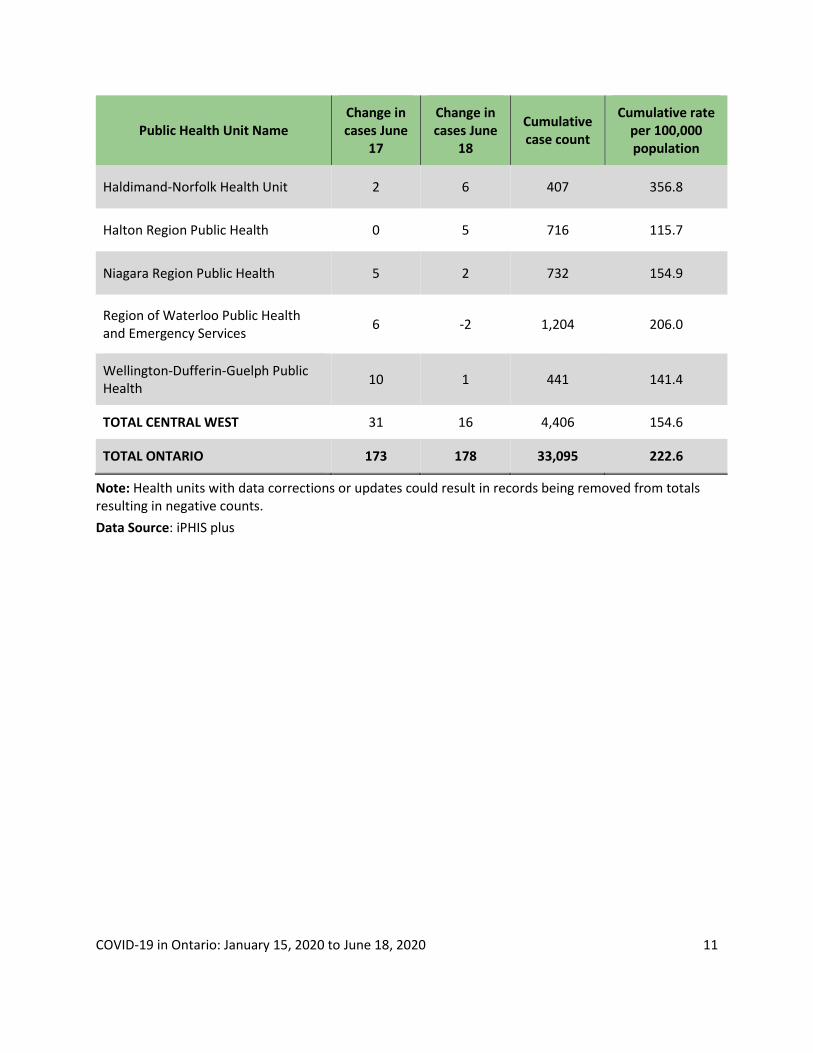
Table 4. Summary of recent cases of COVID-19 by public health unit and region: Ontario
Public Health Unit Name Change in cases June
17
Change in cases June
18
Cumulative case count
Cumulative rate per 100,000 population
Northwestern Health Unit 0 0 28 31.9
Thunder Bay District Health Unit 0 0 87 58.0
TOTAL NORTH WEST 0 0 115 48.4
Algoma Public Health 0 0 23 20.1
North Bay Parry Sound District Health Unit
0 0 28 21.6
Porcupine Health Unit 0 0 65 77.9
Public Health Sudbury & Districts 0 2 66 33.2
Timiskaming Health Unit 0 0 18 55.1
TOTAL NORTH EAST 0 2 200 35.8
Ottawa Public Health 7 6 2,049 194.3
Eastern Ontario Health Unit 3 0 163 78.1
Hastings Prince Edward Public Health 0 0 44 26.1
Kingston, Frontenac and Lennox & Addington Public Health
0 0 62 29.1
Leeds, Grenville & Lanark District Health Unit
0 0 352 203.3
Renfrew County and District Health Unit
1 0 29 26.7
TOTAL EASTERN 11 6 2,699 140.1

COVID-19 in Ontario: January 15, 2020 to June 18, 2020 10
Public Health Unit Name Change in cases June
17
Change in cases June
18
Cumulative case count
Cumulative rate per 100,000 population
Durham Region Health Department 3 7 1,654 232.2
Haliburton, Kawartha, Pine Ridge District Health Unit
1 0 186 98.4
Peel Public Health 27 33 5,372 334.5
Peterborough Public Health 0 0 93 62.8
Simcoe Muskoka District Health Unit 3 15 542 90.4
York Region Public Health 14 13 2,796 228.1
TOTAL CENTRAL EAST 48 68 10,643 237.5
Toronto Public Health 70 56 12,505 400.8
TOTAL TORONTO 70 56 12,505 400.8
Chatham-Kent Public Health 1 3 156 146.7
Grey Bruce Health Unit 0 3 99 58.3
Huron Perth Public Health 0 0 58 41.5
Lambton Public Health 1 1 280 213.8
Middlesex-London Health Unit 3 6 601 118.4
Southwestern Public Health 0 0 81 38.3
Windsor-Essex County Health Unit 8 17 1,252 294.7
TOTAL SOUTH WEST 13 30 2,527 149.5
Brant County Health Unit 0 0 129 83.1
City of Hamilton Public Health Services
8 4 777 131.2
COVID-19 in Ontario: January 15, 2020 to June 18, 2020 11
Public Health Unit Name Change in cases June
17
Change in cases June
18
Cumulative case count
Cumulative rate per 100,000 population
Haldimand-Norfolk Health Unit 2 6 407 356.8
Halton Region Public Health 0 5 716 115.7
Niagara Region Public Health 5 2 732 154.9
Region of Waterloo Public Health and Emergency Services
6 -2 1,204 206.0
Wellington-Dufferin-Guelph Public Health
10 1 441 141.4
TOTAL CENTRAL WEST 31 16 4,406 154.6
TOTAL ONTARIO 173 178 33,095 222.6
Note: Health units with data corrections or updates could result in records being removed from totals resulting in negative counts.
Data Source: iPHIS plus

COVID-19 in Ontario: January 15, 2020 to June 18, 2020 12
Outbreaks
Table 5. Summary of recent confirmed COVID-19 outbreaks reported in long-term care homes, retirement homes and hospitals by status: Ontario
Institution type Change in
outbreaks June 17 Change in
outbreaks June 18
Number of ongoing
outbreaks
Cumulative number of outbreaks
reported
Long-term care homes
5 6 79 346
Retirement homes 1 0 21 152
Hospitals 1 1 4 89
Note: Ongoing outbreaks includes all outbreaks that are ‘Open’ in iPHIS without a ‘Declared Over Date’ recorded.
Data Source: iPHIS

COVID-19 in Ontario: January 15, 2020 to June 18, 2020 13
Technical Notes
Data Sources The data for this report were based on:
Information extracted from the Ontario Ministry of Health (Ministry) integrated Public Health Information System (iPHIS) database, as of June 18, 2020 at 4 p.m.
Information successfully uploaded to the Ministry from Local Systems: Toronto Public Health (Coronavirus Rapid Entry System) CORES, The Ottawa Public Health COVID-19 Ottawa Database (The COD) and Middlesex-London COVID-19 Case and Contact Management Tool (CCMtool) as of June 18, 2020 at 2 p.m.
iPHIS and iPHIS plus (which includes iPHIS, CORES, The COD and COVID-19 CCMtool) are dynamic disease reporting systems, which allow ongoing updates to data previously entered. As a result, data extracted from iPHIS and the Local Systems represent a snapshot at the time of extraction and may differ from previous or subsequent reports.
Ontario population projection data for 2020 were sourced from Ministry, IntelliHEALTH Ontario. Data were extracted on November 26, 2019.
COVID-19 test data were based on information from The Provincial COVID-19 Diagnostics Network, reported by member microbiology laboratories.
Data Caveats: The data only represent cases reported to public health units and recorded in iPHIS plus. As a
result, all counts will be subject to varying degrees of underreporting due to a variety of factors, such as disease awareness and medical care seeking behaviours, which may depend on severity of illness, clinical practice, changes in laboratory testing, and reporting behaviours.
Lags in iPHIS plus data entry due to weekend staffing may result in lower case counts than would otherwise be recorded.
Only cases meeting the confirmed case classification as listed in the MOH COVID-19 case definition are included in the report counts from iPHIS plus.
The number of tests performed does not reflect the number of specimens or persons tested. More than one test may be performed per specimen or per person. As such, the percentage of tests that were positive does not necessarily translate to the number of specimens or persons testing positive.
Reported date is the date the case was reported to the public health unit.
Case episode date is based on an estimate of the best date of disease onset. This date is calculated based on either the date of symptom onset, specimen collection/test date, or the date reported to the public health unit.
COVID-19 in Ontario: January 15, 2020 to June 18, 2020 14
Resolved cases are determined only for COVID-19 cases that have not died. Cases that have died are considered fatal and not resolved. The following cases are classified as resolved:
Cases that are reported as ‘recovered’ in iPHIS
Cases that are not hospitalized and are 14 days past their episode date
Cases that are currently hospitalized (no hospital end date entered) and have a status of ‘closed’ in iPHIS (indicating public health unit follow-up is complete) and are 14 days past their symptom onset date or specimen collection date
Hospitalization includes all cases for which a hospital admission date was reported at the time of data extraction. It includes cases that have been discharged from hospital as well as cases that are currently hospitalized. Emergency room visits are not included in the number of reported hospitalizations.
ICU admission includes all cases for which an ICU admission date was reported at the time of data extraction. It is a subset of the count of hospitalized cases. It includes cases that have been treated or that are currently being treated in an ICU.
Orientation of case counts by geography is based on the diagnosing health unit (DHU). DHU refers to the case's public health unit of residence at the time of illness onset and not necessarily the location of exposure. Cases for which the DHU was reported as MOH (to signify a case that is not a resident of Ontario) have been excluded from the analyses.
Likely source of acquisition is determined by examining the exposure and risk factor fields from iPHIS and local systems to determine whether a case travelled, was associated with an outbreak, was a contact of a case, had no known epidemiological link (sporadic community transmission) or was reported to have an unknown source/no information was reported. Cases with multiple exposures or risk factors were assigned to a single likely acquisition source group which was determined hierarchically in the following order:
For cases with an episode date on or after April 1, 2020: Outbreak-associated > close contact of a confirmed case > travel > no known epidemiological link > information missing or unknown
For cases with an episode date before April 1, 2020: Travel > outbreak-associated > close contact of a confirmed case > no known epidemiological link > information missing or unknown
Deaths are determined by using the outcome field in iPHIS plus. Any case marked ‘Fatal’ is included in the deaths data. Deaths are included whether or not COVID-19 was determined to be a contributing or underlying cause of death as indicated in the iPHIS field Type of Death.
The date of death is determined using the outcome date field for cases marked as ‘Fatal’ in the outcome field.
COVID-19 in Ontario: January 15, 2020 to June 18, 2020 15
iPHIS cases for which the Disposition Status was reported as ENTERED IN ERROR, DOES NOT MEET DEFINITION, DUPLICATE-DO NOT USE, or any variation on these values have been excluded.
Ongoing outbreaks are those that are reported in iPHIS as ‘Open’ without a ‘Declared Over Date’ recorded.
‘Long-term care home residents’ includes cases that reported ‘Yes’ to the risk factor ‘Resident of nursing home or other chronic care facility’ and reported to be part of an outbreak assigned as a long-term care home (via the Outbreak number or case comments field); or were reported to be part of an outbreak assigned as a long-term care home (via the outbreak number or case comments field) with an age over 70 years and did not report ‘No’ to the risk factor ‘Resident of nursing home or other chronic care facility’. Excludes cases that reported ‘Yes’ to both risk factors: ‘Resident of nursing home or other chronic care facility’ and ‘health care worker’.
The ‘health care workers’ variable includes cases that reported ‘Yes’ to any of the occupation of health care worker, doctor, nurse, dentist, dental hygienist, midwife, other medical technicians, personal support worker, respiratory therapist, first responder.
‘Health care workers associated with long-term care outbreaks’ includes ‘health care workers’ reported to be part of an outbreak assigned as a long-term care home (via the outbreak number or case comments field). Excludes cases that reported ‘Yes’ to risk factors ‘Resident of nursing home or other chronic care facility’ and ‘Yes’ to the calculated ‘health care workers’ variable.
Percent change is calculated by taking the difference between the current day and previous day, divided by the previous day count.

COVID-19 in Ontario: January 15, 2020 to June 18, 2020 16
Disclaimer This document was developed by Public Health Ontario (PHO). PHO provides scientific and technical advice to Ontario’s government, public health organizations and health care providers. PHO’s work is guided by the current best available evidence at the time of publication.
The application and use of this document is the responsibility of the user. PHO assumes no liability resulting from any such application or use.
This document may be reproduced without permission for non-commercial purposes only and provided that appropriate credit is given to PHO. No changes and/or modifications may be made to this document without express written permission from PHO.
Citation Ontario Agency for Health Protection and Promotion (Public Health Ontario). Epidemiologic summary: COVID-19 in Ontario – January 15, 2020 to June 18, 2020. Toronto, ON: Queen’s Printer for Ontario; 2020.
For Further Information For more information, email [email protected].
Public Health Ontario Public Health Ontario is an agency of the Government of Ontario dedicated to protecting and promoting the health of all Ontarians and reducing inequities in health. Public Health Ontario links public health practitioners, front-line health workers and researchers to the best scientific intelligence and knowledge from around the world.
For more information about PHO, visit publichealthontario.ca.