Embed Size (px)
Citation preview
COVID-19: Channels of transmission to food and agriculture

COVID-19: Channels of transmission to food and agriculture
Josef Schmidhuber, Jonathan Pound and Bing Qiao Trade and Market Division Economic and Social Development Department
Food and Agriculture Organization of the United Nations
Rome, 2020
Required citation:J. Schmidhuber, J. Pound, B. Qiao. 2020. COVID-19: Channels of transmission to food and agriculture. Rome, FAO.https://doi.org/10.4060/ca8430en
The designations employed and the presentation of material in this information product do not imply the expression of any opinion whatsoever on the part of the Food and Agriculture Organization of the United Nations (FAO) concerning the legal or development status of any country, territory, city or area or of its authorities, or concerning the delimitation of its frontiers or boundaries. The mention of specific companies or products of manufacturers, whether or not these have been patented, does not imply that these have been endorsed or recommended by FAO in preference to others of a similar nature that are not mentioned.
The views expressed in this information product are those of the author(s) and do not necessarily reflect the views or policies of FAO.
ISBN 978-92-5-132354-0© FAO, 2020
Some rights reserved. This work is made available under the Creative Commons Attribution-NonCommercial-ShareAlike 3.0 IGO licence (CC BY-NC-SA 3.0 IGO; https://creativecommons.org/licenses/by-nc-sa/3.0/igo/legalcode).
Under the terms of this licence, this work may be copied, redistributed and adapted for non-commercial purposes, provided that the work is appropriately cited. In any use of this work, there should be no suggestion that FAO endorses any specific organization, products or services. The use of the FAO logo is not permitted. If the work is adapted, then it must be licensed under the same or equivalent Creative Commons licence. If a translation of this work is created, it must include the following disclaimer along with the required citation: “This translation was not created by the Food and Agri-culture Organization of the United Nations (FAO). FAO is not responsible for the content or accuracy of this translation. The original [Language] edition shall be the authoritative edition.”
Disputes arising under the licence that cannot be settled amicably will be resolved by mediation and arbitration as de-scribed in Article 8 of the licence except as otherwise provided herein. The applicable mediation rules will be the media-tion rules of the World Intellectual Property Organization http://www.wipo.int/amc/en/mediation/rules and any arbitration will be conducted in accordance with the Arbitration Rules of the United Nations Commission on International Trade Law (UNCITRAL).
Third-party materials. Users wishing to reuse material from this work that is attributed to a third party, such as tables, figures or images, are responsible for determining whether permission is needed for that reuse and for obtaining permis-sion from the copyright holder. The risk of claims resulting from infringement of any third-party-owned component in the work rests solely with the user.
Sales, rights and licensing. FAO information products are available on the FAO website (www.fao.org/publications) and can be purchased through [email protected]. Requests for commercial use should be submitted via: www.fao.org/contact-us/licence-request. Queries regarding rights and licensing should be submitted to: [email protected].
Page 5 of 44
COVID-19: Channels of transmission to food and agriculture
ABOUT THIS PAPER FAO is analysing and providing updates on the emerging COVID-19 pandemic’s effects on agricultural markets—effects that are still largely unknown. Most current assessments generally foresee a contraction in both supply of and demand for agricultural products, and point to possible disruptions in trade and logistics.
On the supply side, widely different views remain on the duration of the shocks, the price dynamics, differential impacts between domestic and international markets, differences across countries and commodities, the likely paths of recovery, and the policy actions to remedy the various shock waves.
On the demand side, there is near ubiquitous agreement that agricultural demand and trade would slow-down, with contractions stemming from a deceleration in overall economic activity (GDP growth) and rising rates of unemployment. While food and agricultural systems are exposed to both demand and supply side shocks (symmetric), these shocks are not expected to take place in parallel (asynchronous) since, inter alia, consumers can draw on savings, food stocks and safety nets.
This paper makes no attempt to produce an impact assessment of the COVID-19-induced outbreak. Instead, it aims to identify the channels of transmissions into the food and agriculture sectors and, based on this, to delineate the degrees of exposure to the COVID-19-induced shock by geographic region. The initial aim was to examine all elements of the food system. However, data availability limited the empirical analysis largely to primary production, trade and final consumption. These elements are analyzed in detail and, where possible, quantified. Based on results of the analysis, a country taxonomy of the exposure is developed and presented.
The identification of the primary channels of transmission and a classification of countries based on exposure to the effects of the COVID-19-induced pandemic could help assist countries and international organizations in formulating remedial interventions.
Page 6 of 44
COVID-19: Channels of transmission to food and agriculture
EXECUTIVE SUMMARY The COVID-19-induced pandemic affects the entire food system. It exerts a symmetric, but asynchronous shock on global and national food systems. Its impacts will affect both supply and demand channels, but they will be felt at different points in time. They will affect all elements of the food system, from primary supply, to processing, to trade as well as national and international logistics systems, to intermediate and final demand. It also affects factor markets, namely labour and capital, and intermediate inputs of production. The channels of transmission into food and agricultural demand include numerous macroeconomic factors, notably swings in exchange rates, in energy and credit markets, and, most importantly, the expected surge in unemployment and the contractions in overall economic activity.
We have assessed the exposure of countries to a selected number of these channels of transmission. We quantify the impacts of agricultural factor markets, trade and final demand. We present more qualitatively the effects of credit markets, energy markets or possible disruptions in the supply chains and the various choke points therein.
The composition of the factors of production for primary agriculture differs along the stages of development and of course the type of output. In general, agriculture in high-income countries is a capital-intensive industry, exposed to possible disruptions of supplies of intermediate inputs in the short term and fixed capital items in the longer term. The same holds for some agricultural systems in low-income countries, but their exposure to a pandemic shock can differ markedly. For instance, production of row crops is capital-intensive and labour-saving in both North and South America. Both systems are, however, exposed to different debt/equity shares and differential impacts from credit markets. Current evidence suggests that capital-intensive row crop producers in North America are likely to benefit from lower interest rates, while their counterparts in South America could suffer from higher interest rates and clogged credit markets. At the same time, North American producers have seen a noticeable appreciation of their currency, which may offset the gains in credit markets, potentially even overcompensating them.
Lack of inputs affects a growing number of farmers around the world. Low supplies of pesticides for instance is already affecting crop protection efforts in countries affected at an early stage and will likely reduce yields later in the year. A lack of pesticides is also hampering efforts to contain pest outbreaks, including the current locust outbreak in East Africa.
With 80 percent of countries, accounting for 92 percent of global GDP2, under social distancing provisions, labour availability for agricultural supply chains has become a near ubiquitous problem. In general, low-income countries employ higher shares of labour for primary production, which makes them more exposed to direct disruptions in labour supply, including the farmer’s own labour force. The same holds for labour-intensive production more generally. Various examples illustrate that fruit and vegetable as well as meat or dairy production have already been adversely affected by COVID-induced labour shortages3. Such deficits can be caused by domestic labour supply disruptions, as well as by shortages of seasonal and migrant workers.
In addition, also macroeconomic channels of transmission affect agricultural supply, trade and final demand. The precipitous fall in oil and metal prices, for instance, exerted downward pressure on the exchange rates of many commodity exporting countries (“commodity currencies”). While the downward pressure on exchange rates, triggered by price declines in non-food commodities, affects all tradeable commodities, including food. It makes food supplies
2 As at end March 2020, see e.g. https://www.cnbc.com/2020/03/30/coronavirus-goldman-says-pandemic-will-permanently-alter-oil-markets.html 3 The same holds for global fisheries. The sector is not analyzed in detail in this paper, largely reflecting a lack of the necessary data.
Page 7 of 44
COVID-19: Channels of transmission to food and agriculture
internationally more competitive, at least in the short term, and supports exports of food. In response to these changes, some commodity exporters have started to impose export restrictions on food and agricultural products to avoid compromising domestic supplies.
Sporadic export restrictions notwithstanding, the current supply-demand situation is markedly different from the situation at the start of the last global food crisis in 2007–08. Overall, carry-over stocks are high, the prospects for the next crop are good and, instead of an expansion of demand through a burgeoning biofuels sector, demand is likely to contract; food demand is likely to stagnate or even decline given the expected contraction in global GDP, while demand in the non-food sector is likely to be capped in view of the sharply lower prices for fossil energy. Possible logistical bottlenecks notwithstanding, these factors would not support an outlook of a looming global food security crisis arising from supply shortages. The extent of a possible demand contraction is still unclear. In the case of a substantial global GDP contraction, the data presented in this document suggest that low-income countries may find themselves not in a price-induced food security crisis, but an income-induced one.
Finally, and arguably most importantly, COVID-19 will exert a shock on final food demand by lowering overall purchasing power, especially for an increasing number of unemployed people. The extent of the impacts on food demand will depend on numerous factors, including the depth and length of the macroeconomic shock, the availability of savings and access to credit and safety-net mechanisms. These factors determine the responsiveness of demand, which is used to gauge the differences in reactions across countries and food commodity groups. While neither the final income nor the final price impacts are clear at this early stage, the availability of food staples and the greater exposure of labour intensive foods such as vegetables and dairy products to adverse effects emanating from this pandemic, suggests a deterioration in the quality of the diet rather than increases in calorie deficits.
Page 8 of 44
COVID-19: Channels of transmission to food and agriculture
TABLE OF CONTENTS About this paper ............................................................................................................................... 5
Executive summary ........................................................................................................................... 6
Channels of transmission ............................................................................................................... 10
Overview ................................................................................................................................. 10
Agricultural supply .......................................................................................................................... 10
Factor intensity of production as channel of transmission ................................................... 11
Capital intensity of agricultural production ........................................................................... 11
Labour intensity of agricultural production ........................................................................... 13
Exchange rates as a channel of transmission ............................................................................ 15
Energy markets as a channel of transmission ............................................................................ 17
High concentration in global fertilizer trade .......................................................................... 18
Credit markets as a channel of transmission ............................................................................. 19
Trade as a channel of transmission ................................................................................................ 21
Agricultural exports .................................................................................................................... 21
Agricultural imports .................................................................................................................... 22
Agricultural demand and macroeconomic channels of transmission ........................................... 24
Impact on food consumption ..................................................................................................... 26
Differential impacts across countries and commodities ....................................................... 26
Possible time lags in the demand shock ................................................................................ 27
Exposure to COVID-19 – a taxonomy of countries ........................................................................ 28
A regional overview of supply side exposures ........................................................................... 28
A regional overview of demand side exposures ........................................................................ 29
Annex .............................................................................................................................................. 32
Exposure to supply and demand shocks: A country taxonomy ................................................. 32
Page 9 of 44
COVID-19: Channels of transmission to food and agriculture
List of figures
Figure 1: The basic channels of transmission ................................................................................ 10 Figure 2: Intermediate inputs across countries ............................................................................. 12 Figure 3: Fixed costs of production across countries .................................................................... 13 Figure 4: Labour intensity across countries ................................................................................... 14 Figure 5: Net trade in agriculture and energy, data based on UN Comtrade ............................... 17 Figure 6: Fertiliser and natural gas prices, ..................................................................................... 18 Figure 7: Dependency on agricultural exports ............................................................................... 21 Figure 8 Dependency on agricultural exports, top 30 exporters .................................................. 22 Figure 9: Dependency on agricultural imports .............................................................................. 23 Figure 10: Dependency on agricultural imports, top 30 importers .............................................. 24 Figure 11: Income elasticities by product group and income level .............................................. 26 Figure 12: Food expenditure shares by income level .................................................................... 27 Figure 13: Overall supply exposure ................................................................................................ 28 Figure 14: Overall demand exposure ............................................................................................. 29 Figure 15: Share of intermediate inputs in gross output .............................................................. 38 Figure 16: Consumption of fixed capital per agricultural employee ............................................. 39 Figure 17: Gross Output per agricultural employee ...................................................................... 40 Figure 18: Kazakhstan’s exports of merchandise trade, HS2 ........................................................ 41 Figure 19: Changes in exchange rates against the US Dollar, January 2020 – mid March 2020. . 42
List of tables
Table 1: Energy and metal prices since January 2020 ................................................................... 15 Table 2: Concentration ratios of fertilizer exports ......................................................................... 19
Page 10 of 44
COVID-19: Channels of transmission to food and agriculture
CHANNELS OF TRANSMISSION
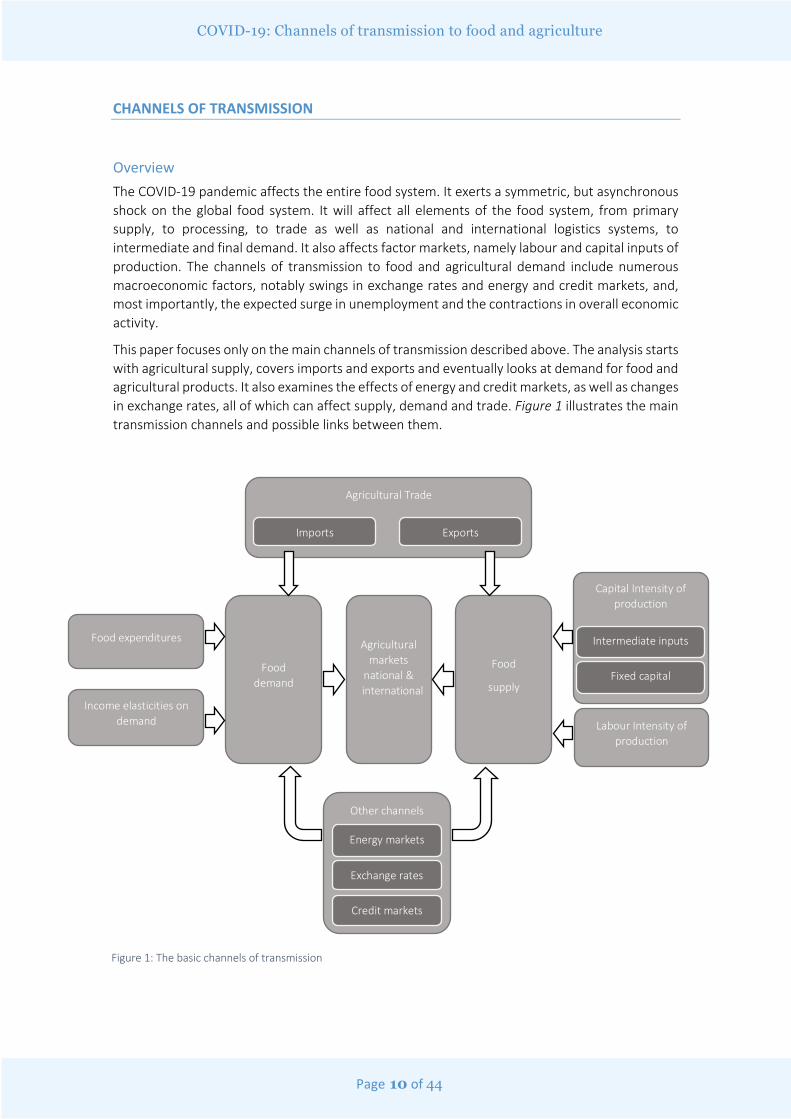
Overview The COVID-19 pandemic affects the entire food system. It exerts a symmetric, but asynchronous shock on the global food system. It will affect all elements of the food system, from primary supply, to processing, to trade as well as national and international logistics systems, to intermediate and final demand. It also affects factor markets, namely labour and capital inputs of production. The channels of transmission to food and agricultural demand include numerous macroeconomic factors, notably swings in exchange rates and energy and credit markets, and, most importantly, the expected surge in unemployment and the contractions in overall economic activity.
This paper focuses only on the main channels of transmission described above. The analysis starts with agricultural supply, covers imports and exports and eventually looks at demand for food and agricultural products. It also examines the effects of energy and credit markets, as well as changes in exchange rates, all of which can affect supply, demand and trade. Figure 1 illustrates the main transmission channels and possible links between them.
Agricultural markets
national & international
Food
supply
Food demand
Capital Intensity of production
Intermediate inputs
Fixed capital
Labour Intensity of production
Agricultural Trade
Imports Exports
Other channels
Energy markets
Exchange rates
Credit markets
Food expenditures
Income elasticities on demand
Figure 1: The basic channels of transmission
Page 11 of 44
COVID-19: Channels of transmission to food and agriculture
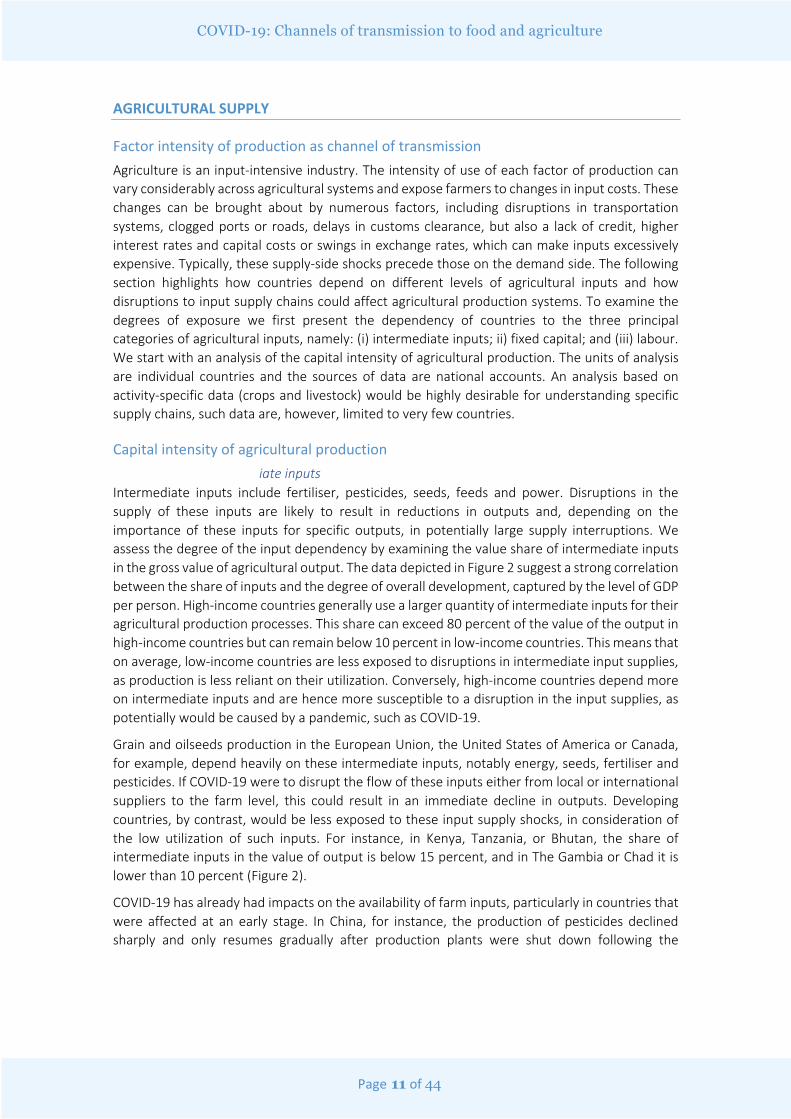
AGRICULTURAL SUPPLY
Factor intensity of production as channel of transmissionAgriculture is an input-intensive industry. The intensity of use of each factor of production can vary considerably across agricultural systems and expose farmers to changes in input costs. These changes can be brought about by numerous factors, including disruptions in transportation systems, clogged ports or roads, delays in customs clearance, but also a lack of credit, higher interest rates and capital costs or swings in exchange rates, which can make inputs excessively expensive. Typically, these supply-side shocks precede those on the demand side. The following section highlights how countries depend on different levels of agricultural inputs and how disruptions to input supply chains could affect agricultural production systems. To examine the degrees of exposure we first present the dependency of countries to the three principal categories of agricultural inputs, namely: (i) intermediate inputs; ii) fixed capital; and (iii) labour. We start with an analysis of the capital intensity of agricultural production. The units of analysis are individual countries and the sources of data are national accounts. An analysis based on activity-specific data (crops and livestock) would be highly desirable for understanding specific supply chains, such data are, however, limited to very few countries.
Capital intensity of agricultural production iate inputs
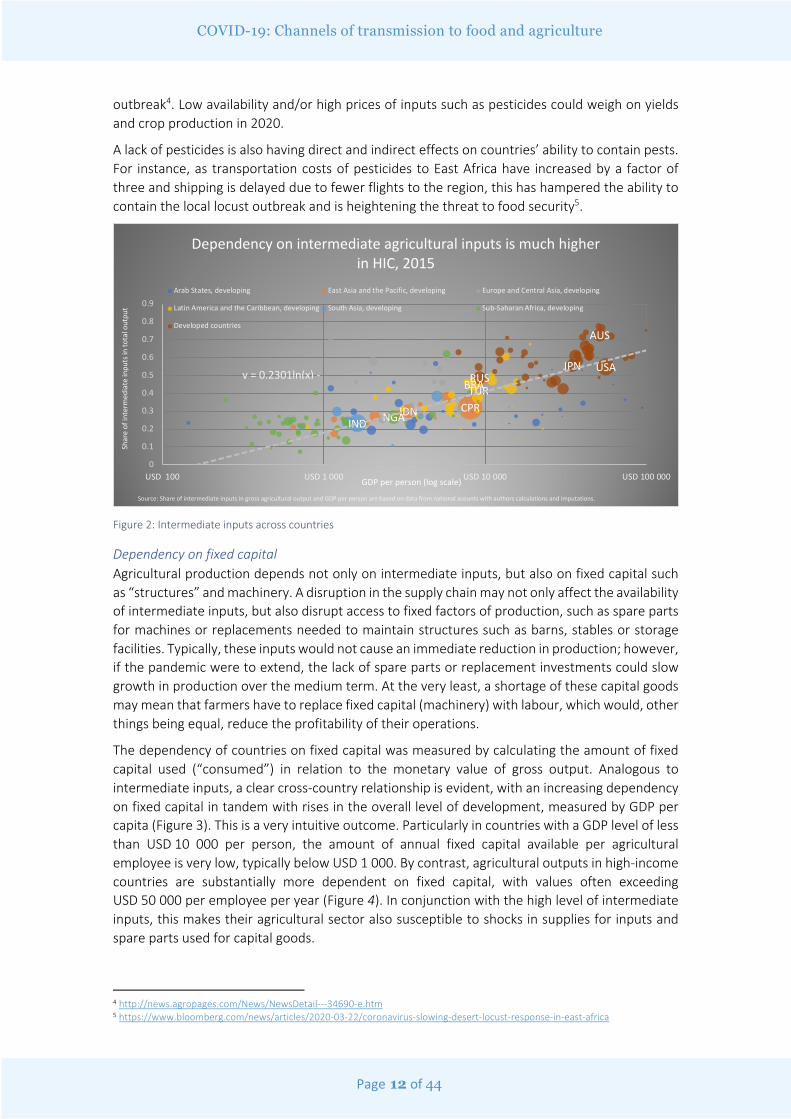
Intermediate inputs include fertiliser, pesticides, seeds, feeds and power. Disruptions in the supply of these inputs are likely to result in reductions in outputs and, depending on the importance of these inputs for specific outputs, in potentially large supply interruptions. We assess the degree of the input dependency by examining the value share of intermediate inputs in the gross value of agricultural output. The data depicted in Figure 2 suggest a strong correlation between the share of inputs and the degree of overall development, captured by the level of GDP per person. High-income countries generally use a larger quantity of intermediate inputs for their agricultural production processes. This share can exceed 80 percent of the value of the output in high-income countries but can remain below 10 percent in low-income countries. This means that on average, low-income countries are less exposed to disruptions in intermediate input supplies, as production is less reliant on their utilization. Conversely, high-income countries depend more on intermediate inputs and are hence more susceptible to a disruption in the input supplies, as potentially would be caused by a pandemic, such as COVID-19.
Grain and oilseeds production in the European Union, the United States of America or Canada, for example, depend heavily on these intermediate inputs, notably energy, seeds, fertiliser and pesticides. If COVID-19 were to disrupt the flow of these inputs either from local or international suppliers to the farm level, this could result in an immediate decline in outputs. Developing countries, by contrast, would be less exposed to these input supply shocks, in consideration of the low utilization of such inputs. For instance, in Kenya, Tanzania, or Bhutan, the share of intermediate inputs in the value of output is below 15 percent, and in The Gambia or Chad it is lower than 10 percent (Figure 2).
COVID-19 has already had impacts on the availability of farm inputs, particularly in countries that were affected at an early stage. In China, for instance, the production of pesticides declined sharply and only resumes gradually after production plants were shut down following the
Page 12 of 44
COVID-19: Channels of transmission to food and agriculture
outbreak4. Low availability and/or high prices of inputs such as pesticides could weigh on yields and crop production in 2020.
A lack of pesticides is also having direct and indirect effects on countries’ ability to contain pests. For instance, as transportation costs of pesticides to East Africa have increased by a factor of three and shipping is delayed due to fewer flights to the region, this has hampered the ability to contain the local locust outbreak and is heightening the threat to food security5.
Figure 2: Intermediate inputs across countries
Dependency on fixed capital Agricultural production depends not only on intermediate inputs, but also on fixed capital such as “structures” and machinery. A disruption in the supply chain may not only affect the availability of intermediate inputs, but also disrupt access to fixed factors of production, such as spare parts for machines or replacements needed to maintain structures such as barns, stables or storage facilities. Typically, these inputs would not cause an immediate reduction in production; however, if the pandemic were to extend, the lack of spare parts or replacement investments could slow growth in production over the medium term. At the very least, a shortage of these capital goods may mean that farmers have to replace fixed capital (machinery) with labour, which would, other things being equal, reduce the profitability of their operations.
The dependency of countries on fixed capital was measured by calculating the amount of fixed capital used (“consumed”) in relation to the monetary value of gross output. Analogous to intermediate inputs, a clear cross-country relationship is evident, with an increasing dependency on fixed capital in tandem with rises in the overall level of development, measured by GDP per capita (Figure 3). This is a very intuitive outcome. Particularly in countries with a GDP level of less than USD 10 000 per person, the amount of annual fixed capital available per agricultural employee is very low, typically below USD 1 000. By contrast, agricultural outputs in high-income countries are substantially more dependent on fixed capital, with values often exceeding USD 50 000 per employee per year (Figure 4). In conjunction with the high level of intermediate inputs, this makes their agricultural sector also susceptible to shocks in supplies for inputs and spare parts used for capital goods.
4 http://news.agropages.com/News/NewsDetail---34690-e.htm 5 https://www.bloomberg.com/news/articles/2020-03-22/coronavirus-slowing-desert-locust-response-in-east-africa
CPRIDN
TURBRA
IND NGA
AUS
JPNRUS
USA
0
0.1
0.2
0.3
0.4
0.5
0.6
0.7
0.8
0.9
USD 100 USD 1 000 USD 10 000 USD 100 000
Shar
e of
inte
rmed
iate
inpu
ts in
tota
l out
put
GDP per person (log scale)
Dependency on intermediate agricultural inputs is much higher in HIC, 2015
Arab States, developing East Asia and the Pacific, developing Europe and Central Asia, developing
Latin America and the Caribbean, developing South Asia, developing Sub-Saharan Africa, developing
Developed countries
y = 0.2301ln(x) -
Source: Share of intermediate inputs in gross agricultural output and GDP per person are based on data from national acounts with authors calculations and imputations.
Page 13 of 44
COVID-19: Channels of transmission to food and agriculture
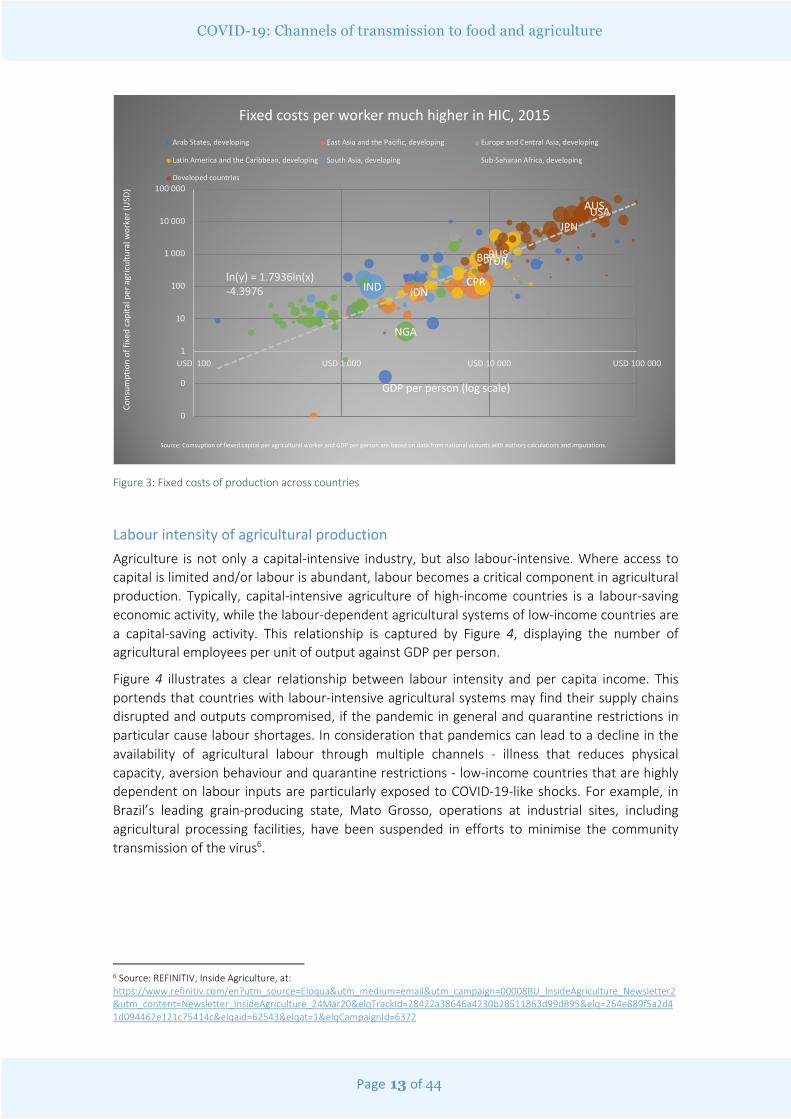
Figure 3: Fixed costs of production across countries
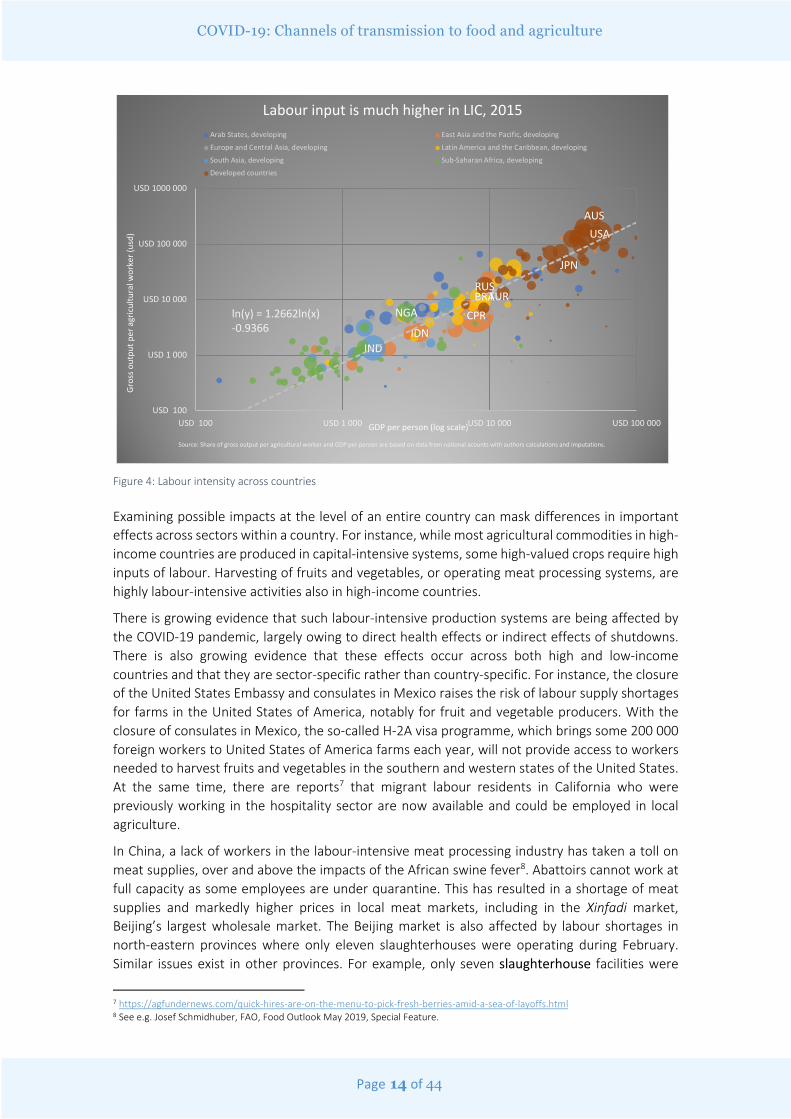
Labour intensity of agricultural production Agriculture is not only a capital-intensive industry, but also labour-intensive. Where access to capital is limited and/or labour is abundant, labour becomes a critical component in agricultural production. Typically, capital-intensive agriculture of high-income countries is a labour-saving economic activity, while the labour-dependent agricultural systems of low-income countries are a capital-saving activity. This relationship is captured by Figure 4, displaying the number of agricultural employees per unit of output against GDP per person.
Figure 4 illustrates a clear relationship between labour intensity and per capita income. This portends that countries with labour-intensive agricultural systems may find their supply chains disrupted and outputs compromised, if the pandemic in general and quarantine restrictions in particular cause labour shortages. In consideration that pandemics can lead to a decline in the availability of agricultural labour through multiple channels - illness that reduces physical capacity, aversion behaviour and quarantine restrictions - low-income countries that are highly dependent on labour inputs are particularly exposed to COVID-19-like shocks. For example, in Brazil’s leading grain-producing state, Mato Grosso, operations at industrial sites, including agricultural processing facilities, have been suspended in efforts to minimise the community transmission of the virus6.
6 Source: REFINITIV, Inside Agriculture, at: https://www.refinitiv.com/en?utm_source=Eloqua&utm_medium=email&utm_campaign=00008BU_InsideAgriculture_Newsletter2&utm_content=Newsletter_InsideAgriculture_24Mar20&elqTrackId=28422a38646a4230b28511863d99d895&elq=264e889f5a2d41d094462e121c75414c&elqaid=62543&elqat=1&elqCampaignId=6372
CPRIDN
TURBRA
IND
NGA
AUS
JPN
RUS
USA
0
0
1
10
100
1 000
10 000
100 000
USD 100 USD 1 000 USD 10 000 USD 100 000
Cons
umpt
ion
of fi
xed
capi
tal p
er a
gric
ultu
ral w
orke
r (U
SD)
GDP per person (log scale)
Fixed costs per worker much higher in HIC, 2015Arab States, developing East Asia and the Pacific, developing Europe and Central Asia, developing
Latin America and the Caribbean, developing South Asia, developing Sub-Saharan Africa, developing
Developed countries
ln(y) = 1.7936ln(x) -4.3976
Source: Comsuption of fiexed capital per agricultural worker and GDP per person are based on data from national acounts with authors calculations and imputations.
Page 14 of 44
COVID-19: Channels of transmission to food and agriculture
Figure 4: Labour intensity across countries
Examining possible impacts at the level of an entire country can mask differences in important effects across sectors within a country. For instance, while most agricultural commodities in high-income countries are produced in capital-intensive systems, some high-valued crops require high inputs of labour. Harvesting of fruits and vegetables, or operating meat processing systems, are highly labour-intensive activities also in high-income countries.
There is growing evidence that such labour-intensive production systems are being affected by the COVID-19 pandemic, largely owing to direct health effects or indirect effects of shutdowns. There is also growing evidence that these effects occur across both high and low-income countries and that they are sector-specific rather than country-specific. For instance, the closure of the United States Embassy and consulates in Mexico raises the risk of labour supply shortages for farms in the United States of America, notably for fruit and vegetable producers. With the closure of consulates in Mexico, the so-called H-2A visa programme, which brings some 200 000 foreign workers to United States of America farms each year, will not provide access to workers needed to harvest fruits and vegetables in the southern and western states of the United States. At the same time, there are reports7 that migrant labour residents in California who were previously working in the hospitality sector are now available and could be employed in local agriculture.
In China, a lack of workers in the labour-intensive meat processing industry has taken a toll on meat supplies, over and above the impacts of the African swine fever8. Abattoirs cannot work at full capacity as some employees are under quarantine. This has resulted in a shortage of meat supplies and markedly higher prices in local meat markets, including in the Xinfadi market, Beijing’s largest wholesale market. The Beijing market is also affected by labour shortages in north-eastern provinces where only eleven slaughterhouses were operating during February. Similar issues exist in other provinces. For example, only seven slaughterhouse facilities were
7 https://agfundernews.com/quick-hires-are-on-the-menu-to-pick-fresh-berries-amid-a-sea-of-layoffs.html 8 See e.g. Josef Schmidhuber, FAO, Food Outlook May 2019, Special Feature.
CPRIDN
TURBRA
IND
NGA
AUS
JPN
RUS
USA
USD 100
USD 1 000
USD 10 000
USD 100 000
USD 1000 000
USD 100 USD 1 000 USD 10 000 USD 100 000
Gro
ss o
utpu
t per
agr
icul
tura
l wor
ker (
usd)
GDP per person (log scale)
Labour input is much higher in LIC, 2015Arab States, developing East Asia and the Pacific, developing
Europe and Central Asia, developing Latin America and the Caribbean, developing
South Asia, developing Sub-Saharan Africa, developing
Developed countries
ln(y) = 1.2662ln(x) -0.9366
Source: Share of gross output per agricultural worker and GDP per person are based on data from national acounts with authors calculations and imputations.
Page 15 of 44
COVID-19: Channels of transmission to food and agriculture
operating in Liaoning, and just two each in Heilongjiang and Inner Mongolia. In addition to shortages in labour supplies for abattoirs, there is growing evidence that transportation bottlenecks are affecting the local meat supply chain. Up until early March 2020, only large-scale farms were able to deliver finished hogs. Family farms cannot market hogs as trucks cannot enter villages, many of which are still under lockdown to prevent the spread of COVID-19.
Exchange rates as a channel of transmission
One of the immediate reactions to the COVID-19 pandemic was a change in exchange rates. Figure 19 (Annex) of this document presents the shifts in exchange rates since January 2020 for all major currencies. While the exact reasons for the rapid movements in exchange rates are still to be determined, a common feature was a significant appreciation of the United States dollar against almost all other currencies. The same holds, albeit to a lesser extent, for the Euro.
Another common feature was a particularly noticeable depreciation of the so-called commodity currencies, i.e. the currencies of commodity exporters, such as the Argentinian Peso and the Brazilian real, but also the Canadian and the Australian dollar. The devaluation and/or depreciation of these currencies reflected, at least to a certain degree, the sharp decline in commodity prices, notably those of petroleum, metals and energy and to a lesser extent those of agricultural products.
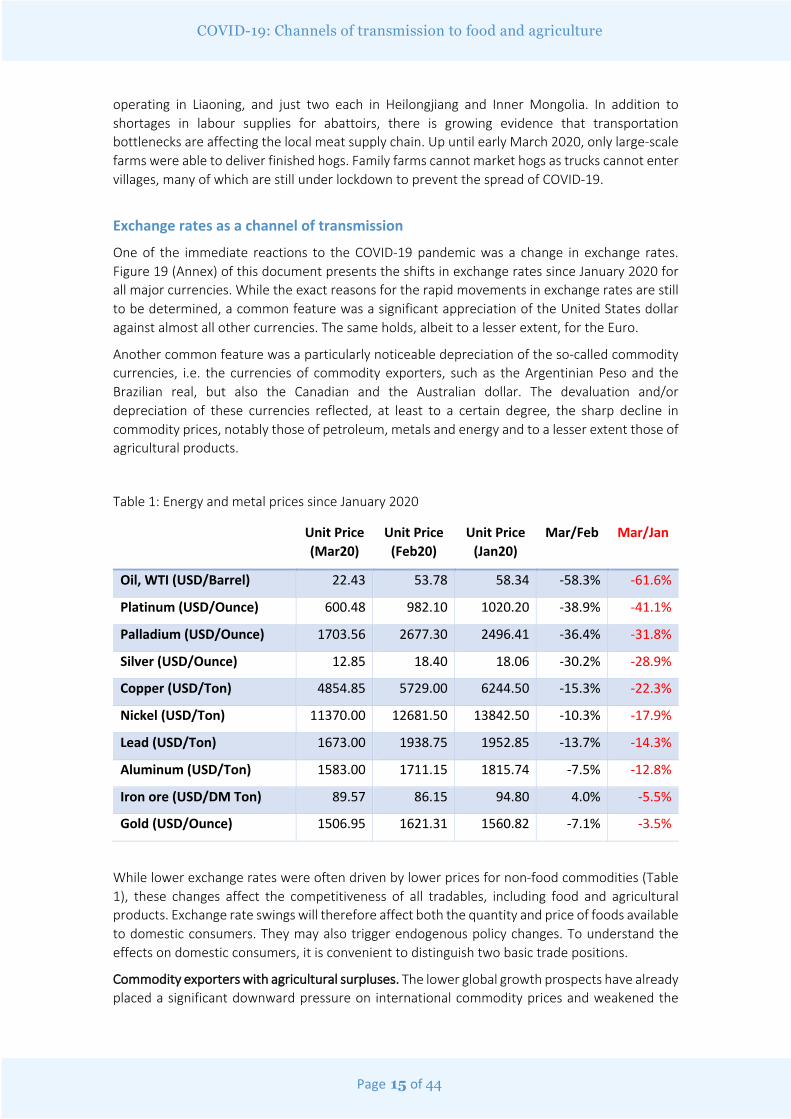
Table 1: Energy and metal prices since January 2020
Unit Price (Mar20)
Unit Price (Feb20)
Unit Price (Jan20)
Mar/Feb Mar/Jan
Oil, WTI (USD/Barrel) 22.43 53.78 58.34 -58.3% -61.6%
Platinum (USD/Ounce) 600.48 982.10 1020.20 -38.9% -41.1%
Palladium (USD/Ounce) 1703.56 2677.30 2496.41 -36.4% -31.8%
Silver (USD/Ounce) 12.85 18.40 18.06 -30.2% -28.9%
Copper (USD/Ton) 4854.85 5729.00 6244.50 -15.3% -22.3%
Nickel (USD/Ton) 11370.00 12681.50 13842.50 -10.3% -17.9%
Lead (USD/Ton) 1673.00 1938.75 1952.85 -13.7% -14.3%
Aluminum (USD/Ton) 1583.00 1711.15 1815.74 -7.5% -12.8%
Iron ore (USD/DM Ton) 89.57 86.15 94.80 4.0% -5.5%
Gold (USD/Ounce) 1506.95 1621.31 1560.82 -7.1% -3.5%
While lower exchange rates were often driven by lower prices for non-food commodities (Table 1), these changes affect the competitiveness of all tradables, including food and agricultural products. Exchange rate swings will therefore affect both the quantity and price of foods available to domestic consumers. They may also trigger endogenous policy changes. To understand the effects on domestic consumers, it is convenient to distinguish two basic trade positions.
Commodity exporters with agricultural surpluses. The lower global growth prospects have already placed a significant downward pressure on international commodity prices and weakened the
Page 16 of 44
COVID-19: Channels of transmission to food and agriculture
exchange rates of commodity exporters (“commodity currencies”) against the main benchmark currencies, notably the United States Dollar and the Euro. These devaluations/depreciations affect the competitiveness of all commodities, food and non-food alike. While a higher competitiveness for non-food exports is often welcome, an outflow of food could undermine domestic food supplies and eventually entice policy makers to export restrictions to ensure domestic food security. A proliferation of export restrictions could, as in previous food crises, result in global supply shortages and eventually food higher international prices.
High stocks and good crop prospects suggest that such fears are currently unwarranted. A few exceptions exist, however, including the recent export restrictions imposed by Kazakhstan. Kazakhstan’s economy is heavily dependent on exports of minerals and metals, which account for more than 85 percent of total merchandise exports (Figure 17, Annex). Sharply lower prices of these non-agricultural products exerted downward pressure on the country’s currency, the tenge, which lost nearly 10 percent of its value against the United States dollar since the start of the pandemic (Figure 18). This also triggered fears of an outflow of basic foods. On 24 March, the Ministry of Agriculture of Kazakhstan imposed a ban on the exports of food products, including wheat flour, sunflower seed and sunflower oil. The list of banned products also included buckwheat, sugar, potatoes and certain types of vegetables.
Similarly, on March 25, it was reported that Argentine soybean and maize farmers are holding back their crops from the market, even after the Government moved to resolve coronavirus-related problems that have slowed delivery to the country's export hubs. This was attributed to the uncertainty over the fast-spreading COVID-19 pandemic, with expectations of higher commodities prices ahead9.
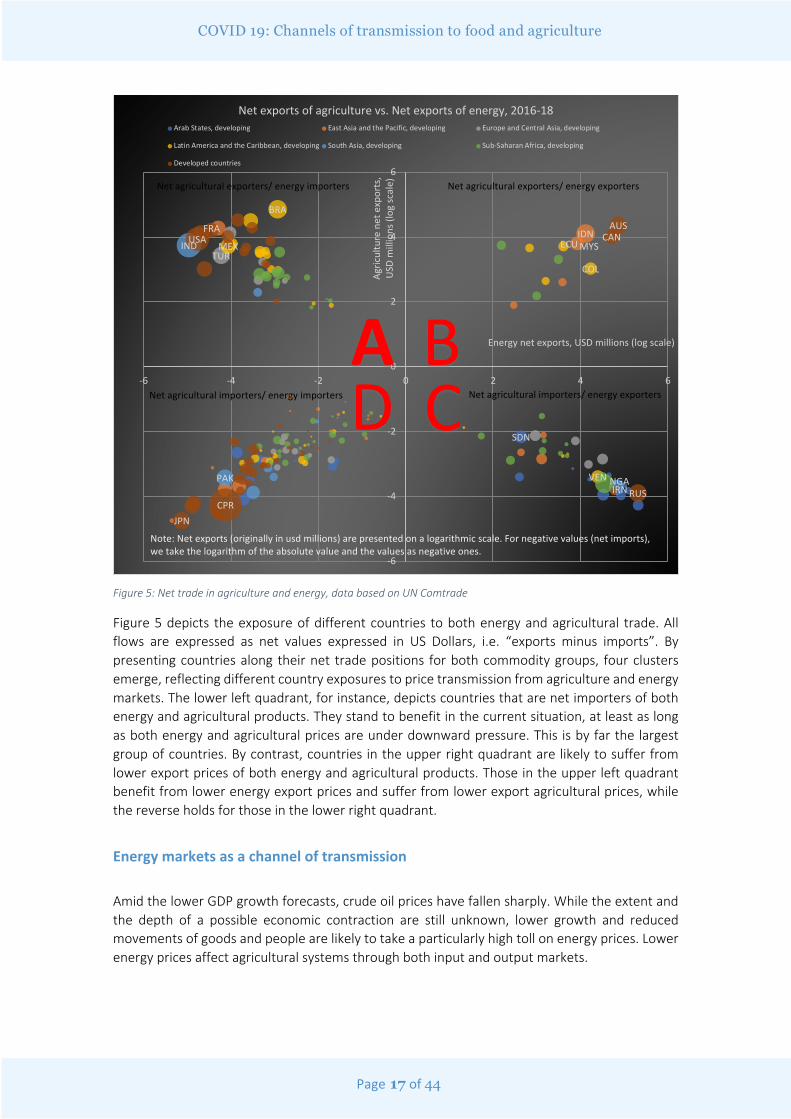
Commodity exporters with agricultural deficits. These countries could be confronted with a situation where the dwindling revenues from exports of non-agricultural products could undermine their ability to purchase enough food on the international markets. This would particularly be the case, if the prices of agricultural products rise on international markets. Many countries in the MENA region fall in this rubric, many of which are exporters of “hydrocarbons and importers of carbohydrates” (Figure 5). Particularly poorer countries of the region could find themselves in a situation where the benefits from lower international food prices are outweighed by lower revenues from exports of hydrocarbons, metals and minerals.
9 Inside Agriculture: http://share.thomsonreuters.com/assets/newsletters/Inside_Agriculture/IA_STORIES_03262020.pdf?utm_source=Eloqua&utm_medium=email&utm_campaign=00008BU_InsideAgriculture_Newsletter2&utm_content=Newsletter_InsideAgriculture_26Mar20
Page 17 of 44
COVID 19: Channels of transmission to food and agriculture
Figure 5: Net trade in agriculture and energy, data based on UN Comtrade
Figure 5 depicts the exposure of different countries to both energy and agricultural trade. All flows are expressed as net values expressed in US Dollars, i.e. “exports minus imports”. By presenting countries along their net trade positions for both commodity groups, four clusters emerge, reflecting different country exposures to price transmission from agriculture and energy markets. The lower left quadrant, for instance, depicts countries that are net importers of both energy and agricultural products. They stand to benefit in the current situation, at least as long as both energy and agricultural prices are under downward pressure. This is by far the largest group of countries. By contrast, countries in the upper right quadrant are likely to suffer from lower export prices of both energy and agricultural products. Those in the upper left quadrant benefit from lower energy export prices and suffer from lower export agricultural prices, while the reverse holds for those in the lower right quadrant.
Energy markets as a channel of transmission
Amid the lower GDP growth forecasts, crude oil prices have fallen sharply. While the extent and the depth of a possible economic contraction are still unknown, lower growth and reduced movements of goods and people are likely to take a particularly high toll on energy prices. Lower energy prices affect agricultural systems through both input and output markets.
SDN
IDNMYS
TUR
BRA
COL
ECUMEX
VEN
IND
IRNPAK NGA
AUSCAN
CPR
FRA
JPN
RUS
USA
-6
-4
-2
0
2
4
6
-6 -4 -2 0 2 4 6Ag
ricul
ture
net
exp
orts
, U
SD m
illio
ns (l
og sc
ale)
Energy net exports, USD millions (log scale)
Net exports of agriculture vs. Net exports of energy, 2016-18Arab States, developing East Asia and the Pacific, developing Europe and Central Asia, developing
Latin America and the Caribbean, developing South Asia, developing Sub-Saharan Africa, developing
Developed countries
Note: Net exports (originally in usd millions) are presented on a logarithmic scale. For negative values (net imports), we take the logarithm of the absolute value and the values as negative ones.
Net agricultural exporters/ energy importers Net agricultural exporters/ energy exporters
Net agricultural importers/ energy importers Net agricultural importers/ energy exporters
A BCD
Page 18 of 44
COVID-19: Channels of transmission to food and agriculture
On the agricultural output side, lower energy prices will reduce the amounts of agricultural feedstocks used for the production of biofuels, probably limiting biofuel use to the amounts mandated by policies. The typical feedstocks, such as sugar cane and maize, are likely to see the most pronounced contractions in demand and the most significant downward pressure on prices.
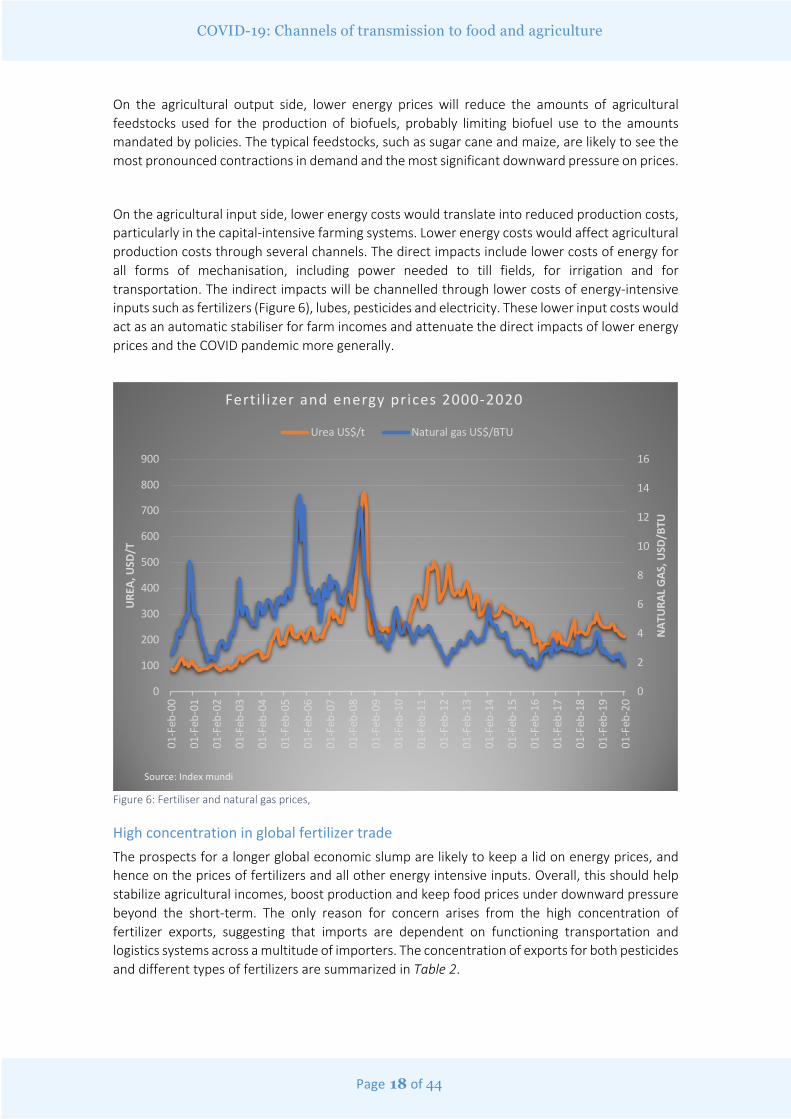
On the agricultural input side, lower energy costs would translate into reduced production costs, particularly in the capital-intensive farming systems. Lower energy costs would affect agricultural production costs through several channels. The direct impacts include lower costs of energy for all forms of mechanisation, including power needed to till fields, for irrigation and for transportation. The indirect impacts will be channelled through lower costs of energy-intensive inputs such as fertilizers (Figure 6), lubes, pesticides and electricity. These lower input costs would act as an automatic stabiliser for farm incomes and attenuate the direct impacts of lower energy prices and the COVID pandemic more generally.
Figure 6: Fertiliser and natural gas prices,
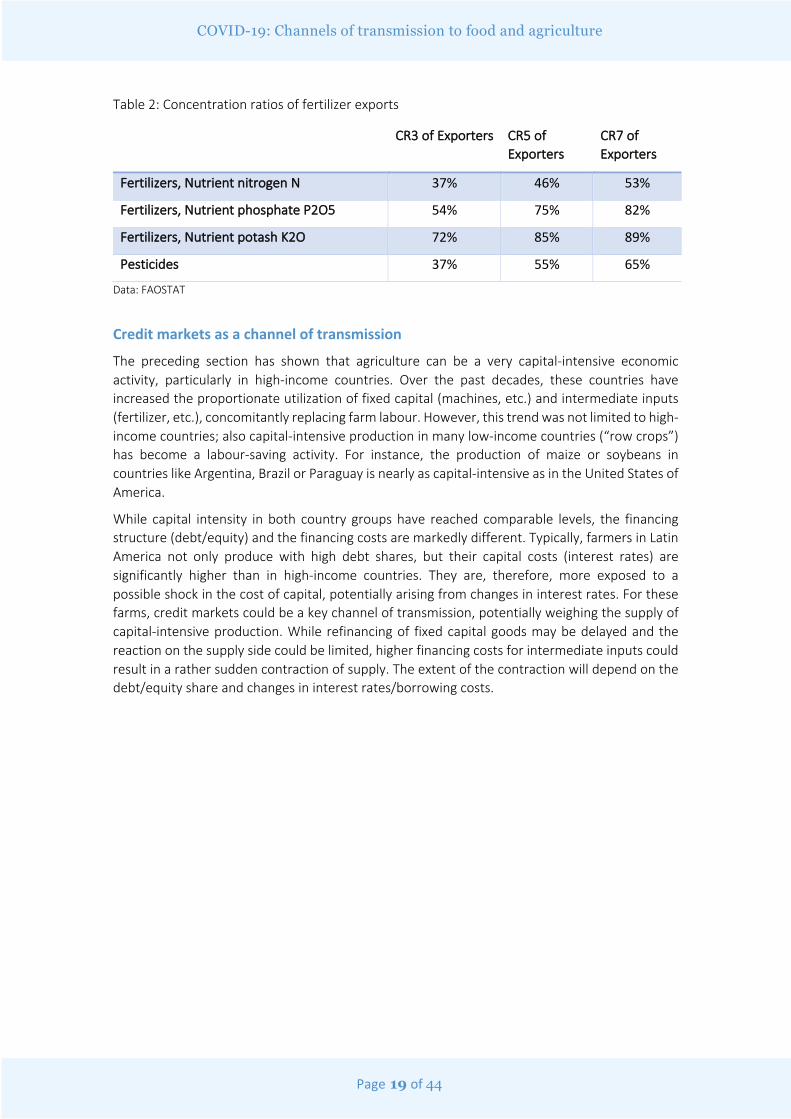
High concentration in global fertilizer trade The prospects for a longer global economic slump are likely to keep a lid on energy prices, and hence on the prices of fertilizers and all other energy intensive inputs. Overall, this should help stabilize agricultural incomes, boost production and keep food prices under downward pressure beyond the short-term. The only reason for concern arises from the high concentration of fertilizer exports, suggesting that imports are dependent on functioning transportation and logistics systems across a multitude of importers. The concentration of exports for both pesticides and different types of fertilizers are summarized in Table 2.
0
2
4
6
8
10
12
14
16
0
100
200
300
400
500
600
700
800
900
01-F
eb-0
0
01-F
eb-0
1
01-F
eb-0
2
01-F
eb-0
3
01-F
eb-0
4
01-F
eb-0
5
01-F
eb-0
6
01-F
eb-0
7
01-F
eb-0
8
01-F
eb-0
9
01-F
eb-1
0
01-F
eb-1
1
01-F
eb-1
2
01-F
eb-1
3
01-F
eb-1
4
01-F
eb-1
5
01-F
eb-1
6
01-F
eb-1
7
01-F
eb-1
8
01-F
eb-1
9
01-F
eb-2
0
NAT
URA
L GA
S, U
SD/B
TU
URE
A, U
SD/T
Ferti l izer and energy prices 2000-2020
Urea US$/t Natural gas US$/BTU
Source: Index mundi
Page 19 of 44
COVID-19: Channels of transmission to food and agriculture
Table 2: Concentration ratios of fertilizer exports
CR3 of Exporters CR5 of Exporters
CR7 of Exporters
Fertilizers, Nutrient nitrogen N 37% 46% 53%
Fertilizers, Nutrient phosphate P2O5 54% 75% 82%
Fertilizers, Nutrient potash K2O 72% 85% 89%
Pesticides 37% 55% 65%
Data: FAOSTAT
Credit markets as a channel of transmission
The preceding section has shown that agriculture can be a very capital-intensive economic activity, particularly in high-income countries. Over the past decades, these countries have increased the proportionate utilization of fixed capital (machines, etc.) and intermediate inputs (fertilizer, etc.), concomitantly replacing farm labour. However, this trend was not limited to high-income countries; also capital-intensive production in many low-income countries (“row crops”) has become a labour-saving activity. For instance, the production of maize or soybeans in countries like Argentina, Brazil or Paraguay is nearly as capital-intensive as in the United States of America.
While capital intensity in both country groups have reached comparable levels, the financing structure (debt/equity) and the financing costs are markedly different. Typically, farmers in Latin America not only produce with high debt shares, but their capital costs (interest rates) are significantly higher than in high-income countries. They are, therefore, more exposed to a possible shock in the cost of capital, potentially arising from changes in interest rates. For these farms, credit markets could be a key channel of transmission, potentially weighing the supply of capital-intensive production. While refinancing of fixed capital goods may be delayed and the reaction on the supply side could be limited, higher financing costs for intermediate inputs could result in a rather sudden contraction of supply. The extent of the contraction will depend on the debt/equity share and changes in interest rates/borrowing costs.
Page 20 of 44
COVID-19: Channels of transmission to food and agriculture
Differential impacts due to differential changes in interest rates
Since the outbreak of COVID-19, interest rates have changed around the world. In general, rates have fallen in high-income countries, following the interventions of central banks, which are lowering refinancing rates for commercial banks and reducing market rates through open market interventions. By 23 March 2020, 39 central banks10 had lowered interest rates or increased liquidity. Despite these interventions, market rates for borrowing fresh capital have often risen11, particularly in low-income countries. A Jubilee Debt Campaign12 report states that interest rates have on average risen by 3.5 percentage points for low- and middle-income countries since mid-February, and that costs for new borrowing stood at 10 percent. At the same time, prices of products coming from capital-intensive systems, such as maize or soybeans, have fallen, further squeezing profit margins for these products, particularly in low-income countries.
The different exposures to borrowing costs by high and low-income countries could have differential effects on the supply of these capital-intensive products. In general, it would enhance competitiveness of supplies from high-income countries (United States of America, European Union) and weigh on competitiveness of producers in low-income countries (Latin American producers). How long these effects will last is difficult to predict and, indeed, not the objective of this analysis. There are, however, first signs of a possible global credit crisis, which could be large in magnitude and long in duration. To stave off the potential impact on farmers, the United States of America’s Farm Credit Administration, the regulatory body overseeing the credit system, is encouraging financial institutions to implement relief mechanisms, such as extending the terms of loan repayments.13
A recent report by the United Nations Conference on Trade and Development (UNCTAD)14 shows how sustained debts could pose a larger problem for the global economy and financial system. According to UNCTAD, in 2018, total debt (private, public, domestic and external) across developing countries was equal to almost twice their combined GDP—the highest ever. The build-up of private debt by non-financial corporations, which now amounts to nearly three-quarters of total debt in developing countries (a much higher ratio than in advanced economies), is seen as particularly concerning. According to UNCTAD, inherently volatile “foreign shadow financial institutions” have played a major role in fuelling this accumulation, such that around one-third of private non-financial corporate debt is located in low-income countries. Similarly, a report by the International Monetary Fund15 (IMF) shows that rising debt levels have led to increased debt vulnerabilities in many low-income developing countries (LIDCs). While debt vulnerabilities remain contained in the majority of LIDCs, some 40 percent of LIDCs now face significant debt-related challenges, up from 21 percent in 2013. Nine of twelve countries that moved from “low/moderate risk” to “high risk/in debt distress” are in sub-Saharan Africa.
With rising costs for capital, the impacts would also be felt in agriculture, notably capital-intensive forms of production. Credit markets could become an important channel of transmission, adversely affecting capital-intensive agriculture. Capital intensive production in low-income countries (e.g. row crops in Latin America) could be particularly hard hit. This would further
10 Inter alia, the Central Banks of the US (Fed), Euro Area (ECB), UK (BoE), Brazil, Chile, Hongkong, Indonesia, South Korea, Mexico, New Zealand, Norway, Peru, The Philippines, Poland, Romania, South Africa, Thailand, and Turkey. 11 There are several factors that led to higher interest rates. Importantly, the rapid price declines in other asset classes, notably equities, forced many investors to sell bonds (including T-bill and German Bunds). This in turn led to downward pressure on bond prices and increases in the underlying yields (interest rates). 12 https://jubileedebt.org.uk/ 13 FCA encourages Farm Credit System institutions to work with borrowers affected by COVID-19. Farm Credit Association, 17 March 2020. https://www.fca.gov/newsroom/news 14 https://unctad.org/en/PublicationsLibrary/gds_tdr2019_update_coronavirus.pdf?user=1653 15 https://www.imf.org/en/Publications/Policy-Papers/Issues/2018/03/22/pp021518macroeconomic-developments-and-prospects-in-lidcs
Page 21 of 44
COVID-19: Channels of transmission to food and agriculture
deteriorate the commodity terms of trade for many commodity dependent LIDCs that has been underway since the last price hike in 2012.
TRADE AS A CHANNEL OF TRANSMISSION The preceding section examined the dependency of different farming systems on the various factors of production. But farming is not only exposed to disruptions in domestic factor markets, it is also subject to possible disruptions in trade and international supply chains. The quantitative analysis will be limited to disruptions in agricultural outputs. Exposure through imports and exports will be presented separately.
Agricultural exports
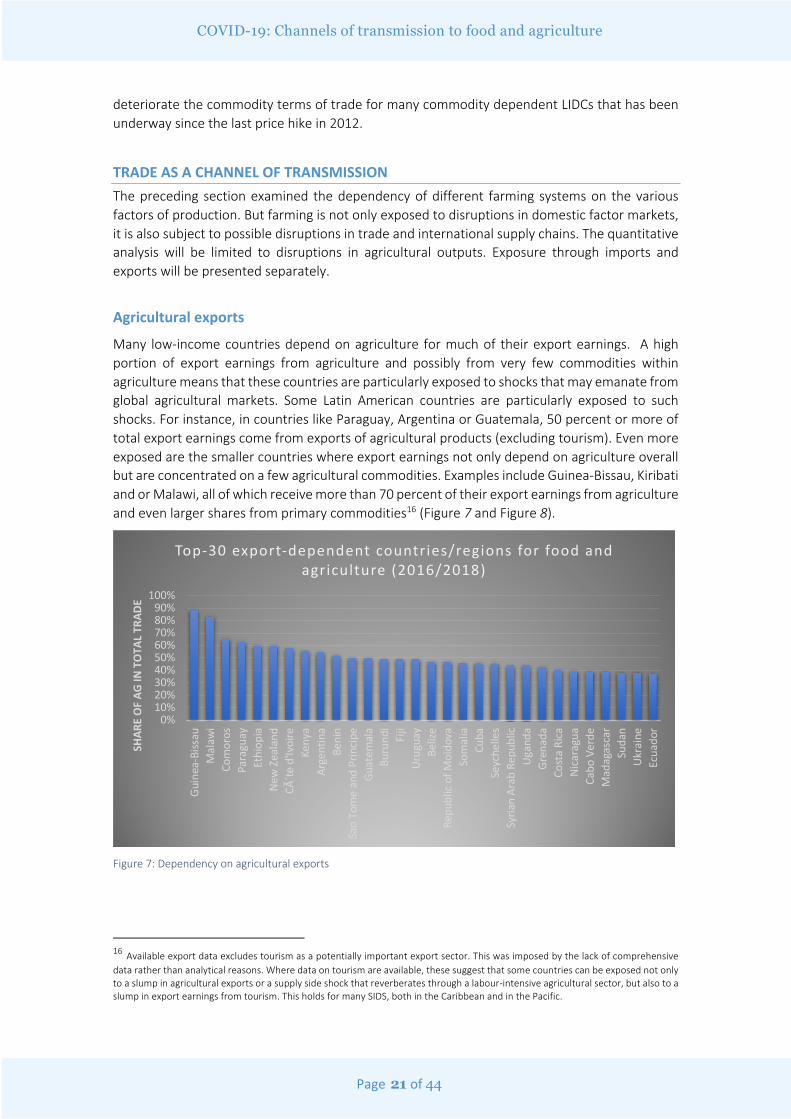
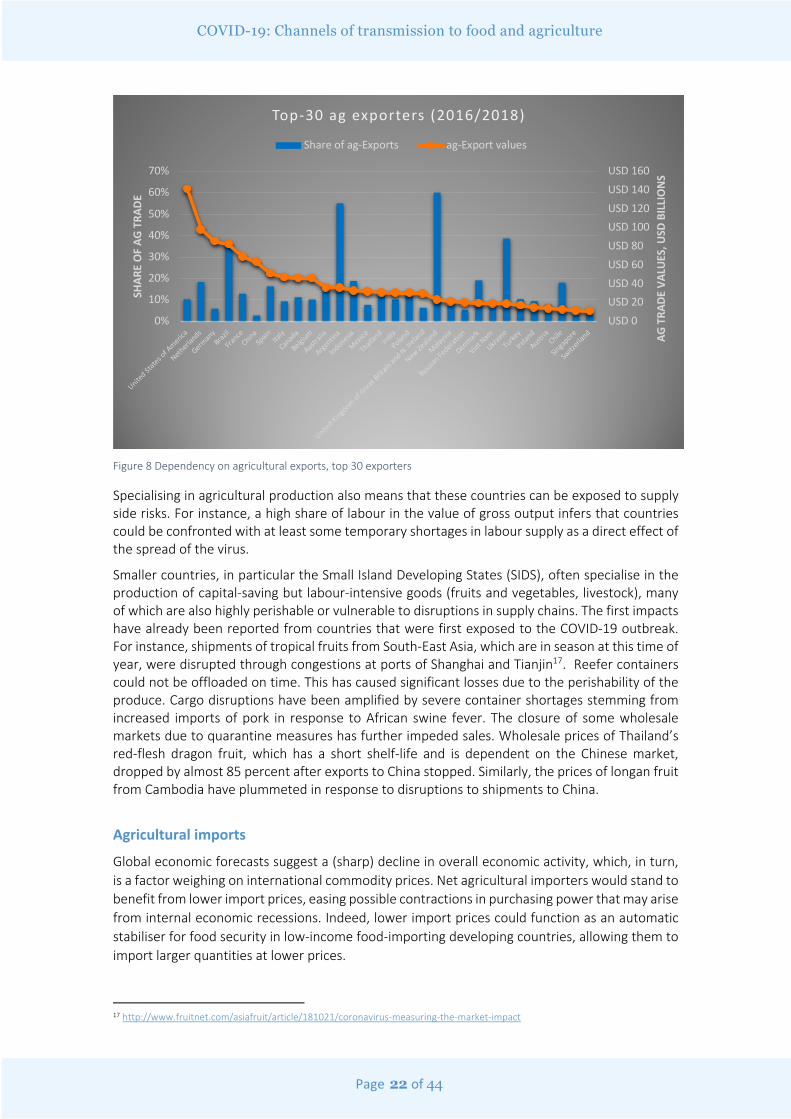
Many low-income countries depend on agriculture for much of their export earnings. A high portion of export earnings from agriculture and possibly from very few commodities within agriculture means that these countries are particularly exposed to shocks that may emanate from global agricultural markets. Some Latin American countries are particularly exposed to such shocks. For instance, in countries like Paraguay, Argentina or Guatemala, 50 percent or more of total export earnings come from exports of agricultural products (excluding tourism). Even more exposed are the smaller countries where export earnings not only depend on agriculture overall but are concentrated on a few agricultural commodities. Examples include Guinea-Bissau, Kiribati and or Malawi, all of which receive more than 70 percent of their export earnings from agriculture and even larger shares from primary commodities16 (Figure 7 and Figure 8).
Figure 7: Dependency on agricultural exports
16 Available export data excludes tourism as a potentially important export sector. This was imposed by the lack of comprehensivedata rather than analytical reasons. Where data on tourism are available, these suggest that some countries can be exposed not only to a slump in agricultural exports or a supply side shock that reverberates through a labour-intensive agricultural sector, but also to a slump in export earnings from tourism. This holds for many SIDS, both in the Caribbean and in the Pacific.
0%10%20%30%40%50%60%70%80%90%
100%
Guin
ea-B
issau
Mal
awi
Com
oros
Para
guay
Ethi
opia
New
Zea
land
Côte
d'Iv
oire
Keny
aAr
gent
ina
Beni
nSa
o To
me
and
Prin
cipe
Guat
emal
aBu
rund
iFi
jiUr
ugua
yBe
lize
Repu
blic
of M
oldo
vaSo
mal
iaCu
baSe
yche
lles
Syria
n Ar
ab R
epub
licUg
anda
Gren
ada
Cost
a Ri
caNi
cara
gua
Cabo
Ver
deM
adag
asca
rSu
dan
Ukra
ine
Ecua
dor
SHAR
E O
F AG
IN T
OTA
L TR
ADE
Top-30 export-dependent countries/regions for food and agriculture (2016/2018)
Page 22 of 44
COVID-19: Channels of transmission to food and agriculture
Figure 8 Dependency on agricultural exports, top 30 exporters
Specialising in agricultural production also means that these countries can be exposed to supply side risks. For instance, a high share of labour in the value of gross output infers that countries could be confronted with at least some temporary shortages in labour supply as a direct effect of the spread of the virus.
Smaller countries, in particular the Small Island Developing States (SIDS), often specialise in the production of capital-saving but labour-intensive goods (fruits and vegetables, livestock), many of which are also highly perishable or vulnerable to disruptions in supply chains. The first impacts have already been reported from countries that were first exposed to the COVID-19 outbreak. For instance, shipments of tropical fruits from South-East Asia, which are in season at this time of year, were disrupted through congestions at ports of Shanghai and Tianjin17. Reefer containers could not be offloaded on time. This has caused significant losses due to the perishability of the produce. Cargo disruptions have been amplified by severe container shortages stemming from increased imports of pork in response to African swine fever. The closure of some wholesale markets due to quarantine measures has further impeded sales. Wholesale prices of Thailand’s red-flesh dragon fruit, which has a short shelf-life and is dependent on the Chinese market, dropped by almost 85 percent after exports to China stopped. Similarly, the prices of longan fruit from Cambodia have plummeted in response to disruptions to shipments to China.
Agricultural imports
Global economic forecasts suggest a (sharp) decline in overall economic activity, which, in turn, is a factor weighing on international commodity prices. Net agricultural importers would stand to benefit from lower import prices, easing possible contractions in purchasing power that may arise from internal economic recessions. Indeed, lower import prices could function as an automatic stabiliser for food security in low-income food-importing developing countries, allowing them to import larger quantities at lower prices.
17 http://www.fruitnet.com/asiafruit/article/181021/coronavirus-measuring-the-market-impact
USD 0USD 20USD 40USD 60USD 80USD 100USD 120USD 140USD 160
0%
10%
20%
30%
40%
50%
60%
70%
United States o
f Americ
a
Netherlands
Germany
Brazil
France
China Sp
ain Ita
ly
Canada
Belgium
Australia
Argentina
Indonesia
Mexic
o
Thailand
India
Poland
United Kingdom of G
reat Brit
ain and N. Ireland
New Zealand
Malaysi
a
Russian Federatio
n
Denmark
Viet Nam
Ukraine
Turkey
Ireland
Austria
Chile
Singapore
Switz
erland AG
TRA
DE V
ALU
ES, U
SD B
ILLI
ON
S
SHAR
E O
F AG
TRA
DE
Top-30 ag exporters (2016/2018)
Share of ag-Exports ag-Export values
Page 23 of 44
COVID-19: Channels of transmission to food and agriculture
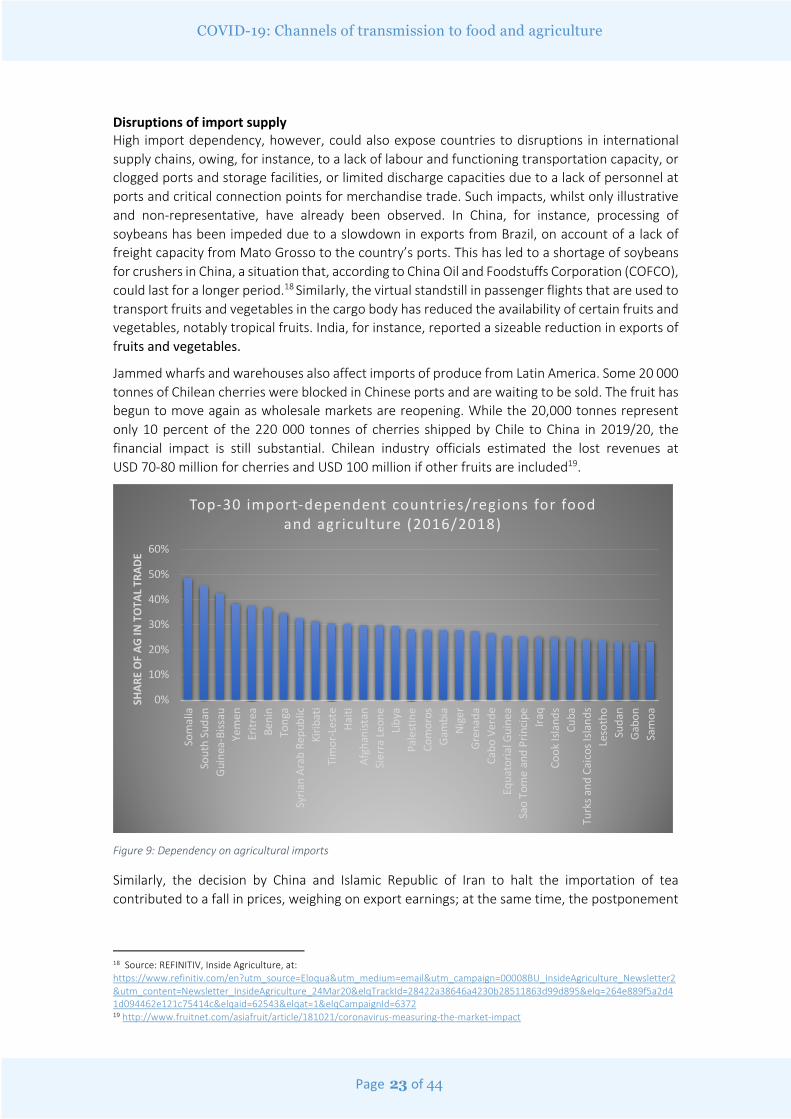
Disruptions of import supply High import dependency, however, could also expose countries to disruptions in international supply chains, owing, for instance, to a lack of labour and functioning transportation capacity, or clogged ports and storage facilities, or limited discharge capacities due to a lack of personnel at ports and critical connection points for merchandise trade. Such impacts, whilst only illustrative and non-representative, have already been observed. In China, for instance, processing of soybeans has been impeded due to a slowdown in exports from Brazil, on account of a lack of freight capacity from Mato Grosso to the country’s ports. This has led to a shortage of soybeans for crushers in China, a situation that, according to China Oil and Foodstuffs Corporation (COFCO), could last for a longer period.18 Similarly, the virtual standstill in passenger flights that are used to transport fruits and vegetables in the cargo body has reduced the availability of certain fruits and vegetables, notably tropical fruits. India, for instance, reported a sizeable reduction in exports of fruits and vegetables.
Jammed wharfs and warehouses also affect imports of produce from Latin America. Some 20 000 tonnes of Chilean cherries were blocked in Chinese ports and are waiting to be sold. The fruit has begun to move again as wholesale markets are reopening. While the 20,000 tonnes represent only 10 percent of the 220 000 tonnes of cherries shipped by Chile to China in 2019/20, the financial impact is still substantial. Chilean industry officials estimated the lost revenues at USD 70-80 million for cherries and USD 100 million if other fruits are included19.
Figure 9: Dependency on agricultural imports
Similarly, the decision by China and Islamic Republic of Iran to halt the importation of tea contributed to a fall in prices, weighing on export earnings; at the same time, the postponement
18 Source: REFINITIV, Inside Agriculture, at: https://www.refinitiv.com/en?utm_source=Eloqua&utm_medium=email&utm_campaign=00008BU_InsideAgriculture_Newsletter2&utm_content=Newsletter_InsideAgriculture_24Mar20&elqTrackId=28422a38646a4230b28511863d99d895&elq=264e889f5a2d41d094462e121c75414c&elqaid=62543&elqat=1&elqCampaignId=6372 19 http://www.fruitnet.com/asiafruit/article/181021/coronavirus-measuring-the-market-impact
0%
10%
20%
30%
40%
50%
60%
Som
alia
Sout
h Su
dan
Guin
ea-B
issau
Yem
enEr
itrea
Beni
nTo
nga
Syria
n Ar
ab R
epub
licKi
ribat
iTi
mor
-Les
teHa
itiAf
ghan
istan
Sier
ra Le
one
Libya
Pale
stin
eCo
mor
osGa
mbi
aNi
ger
Gren
ada
Cabo
Ver
deEq
uato
rial G
uine
aSa
o To
me
and
Prin
cipe Ira
qCo
ok Is
land
sCu
baTu
rks a
nd C
aico
s Isla
nds
Leso
tho
Suda
nGa
bon
Sam
oa
SHAR
E O
F AG
IN T
OTA
L TR
ADE
Top-30 import-dependent countries/regions for food and agriculture (2016/2018)
Page 24 of 44
COVID-19: Channels of transmission to food and agriculture
of tea auctions by the East Africa Tea Trade Association triggered a decline in regional tea prices and limited access to export markets.20
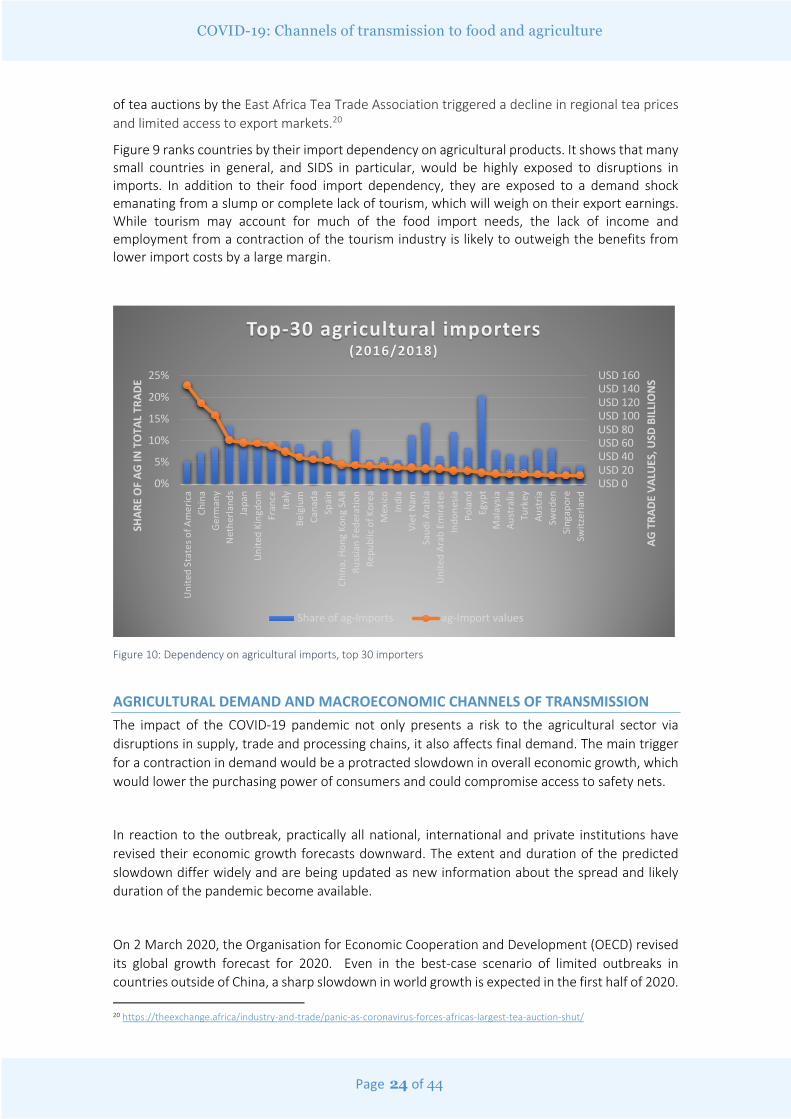
Figure 9 ranks countries by their import dependency on agricultural products. It shows that many small countries in general, and SIDS in particular, would be highly exposed to disruptions in imports. In addition to their food import dependency, they are exposed to a demand shock emanating from a slump or complete lack of tourism, which will weigh on their export earnings. While tourism may account for much of the food import needs, the lack of income and employment from a contraction of the tourism industry is likely to outweigh the benefits from lower import costs by a large margin.
Figure 10: Dependency on agricultural imports, top 30 importers
AGRICULTURAL DEMAND AND MACROECONOMIC CHANNELS OF TRANSMISSION The impact of the COVID-19 pandemic not only presents a risk to the agricultural sector via disruptions in supply, trade and processing chains, it also affects final demand. The main trigger for a contraction in demand would be a protracted slowdown in overall economic growth, which would lower the purchasing power of consumers and could compromise access to safety nets.
In reaction to the outbreak, practically all national, international and private institutions have revised their economic growth forecasts downward. The extent and duration of the predicted slowdown differ widely and are being updated as new information about the spread and likely duration of the pandemic become available.
On 2 March 2020, the Organisation for Economic Cooperation and Development (OECD) revised its global growth forecast for 2020. Even in the best-case scenario of limited outbreaks in countries outside of China, a sharp slowdown in world growth is expected in the first half of 2020.
20 https://theexchange.africa/industry-and-trade/panic-as-coronavirus-forces-africas-largest-tea-auction-shut/
USD 0USD 20USD 40USD 60USD 80USD 100USD 120USD 140USD 160
0%
5%
10%
15%
20%
25%
Uni
ted
Stat
es o
f Am
eric
aCh
ina
Ger
man
yN
ethe
rland
sJa
pan
Uni
ted
King
dom
Fran
ceIta
lyBe
lgiu
mCa
nada
Spai
nCh
ina,
Hon
g Ko
ng S
ARRu
ssia
n Fe
dera
tion
Repu
blic
of K
orea
Mex
ico
Indi
aVi
et N
amSa
udi A
rabi
aU
nite
d Ar
ab E
mira
tes
Indo
nesi
aPo
land
Egyp
tM
alay
sia
Aust
ralia
Turk
eyAu
stria
Swed
enSi
ngap
ore
Switz
erla
nd
AG T
RADE
VAL
UES
, USD
BIL
LIO
NS
SHAR
E O
F AG
IN T
OTA
L TR
ADE
Top-30 agricultural importers (2016/2018)
Share of ag-Imports ag-Import values
Page 25 of 44
COVID-19: Channels of transmission to food and agriculture
It is argued that supply chains would be significantly disrupted, commodity markets would be hit hard, tourism could precipitously drop and overall economic confidence falter. Global economic growth is projected to fall to 2.4 percent for 2020 as a whole, compared with an already weak growth of 2.9 percent in 2019. Growth is expected to rise again to a modest 3.3 percent in 2021. Growth prospects for China have been revised down more sharply, from 6.1 percent in 2019 to below 5 percent in 2020.
In addition, the OECD offered a much more significant growth reduction scenario. A broader contagion across the wider Asia-Pacific region and advanced economies – as has happened in China - could cut global growth to as low as 1.5 percent in 2020, halving the OECD’s previous 2020 projection released in November 2019. Containment measures and loss of confidence would hit production and spending, and drive some countries into recession, including Japan and the Euro area.
On 4 March, the International Monetary Fund (IMF) also warned that global growth this year would fall below last year’s levels due to the novel coronavirus crisis. This warning followed a downward revision in the World Economic Outlook (WEO) of January 2020, when the IMF reduced growth estimates for 2019 and 2020 by 0.1 percentage points and those for 2021 by 0.2 percentage points. Without presenting exact new estimates, the IMF now predicts that global growth in 2020 would dip below last year’s levels. On the same day, the European Union said that both Italy and France are at risk of slipping into recession. On 10 March, LC Macro Advisors, a private company headed by the former Chief Economist of Italy’s Treasury Department, estimated that daily GDP was running 10 to 15 percent below normal levels. On a quarterly basis, LC Macro Advisors see a GDP contraction of 1.2 percent in the first quarter, followed by a drop of 3 percent in the second quarter.
The latest economic outlook21 of the Federal Reserve Bank of St. Louis (United States of America) even predicts that the United States unemployment rate could reach 30 percent in the second quarter of 2020, reflecting shutdowns to combat the spread of COVID-19. The same outlook expects an unprecedented 50 percent drop in GDP. Such massive contractions in economic activity would compromise the ability of households to access sufficient and nutritious food in otherwise wealthy economies.
In tandem with the expected economic slowdown or outright contraction, jobs will be lost, and unemployment is expected to rise. Estimates from the International Labour Organization (ILO) indicate that the current slowdown in economic activity could, in the worst-case scenario, result in an increase in unemployment of 24.7 million people globally. Particularly informal and casually employed workers in low-wage segments are exposed to the pandemic, given the limited safety net mechanisms available to them. Longer lasting quarantine restrictions would particularly affect self-employed workers of the transportation and hospitality sector, including many jobs created in the gig economy.
21 https://www.bloomberg.com/news/articles/2020-03-22/fed-s-bullard-says-u-s-jobless-rate-may-soar-to-30-in-2q
Page 26 of 44
COVID-19: Channels of transmission to food and agriculture
Impact on food consumption
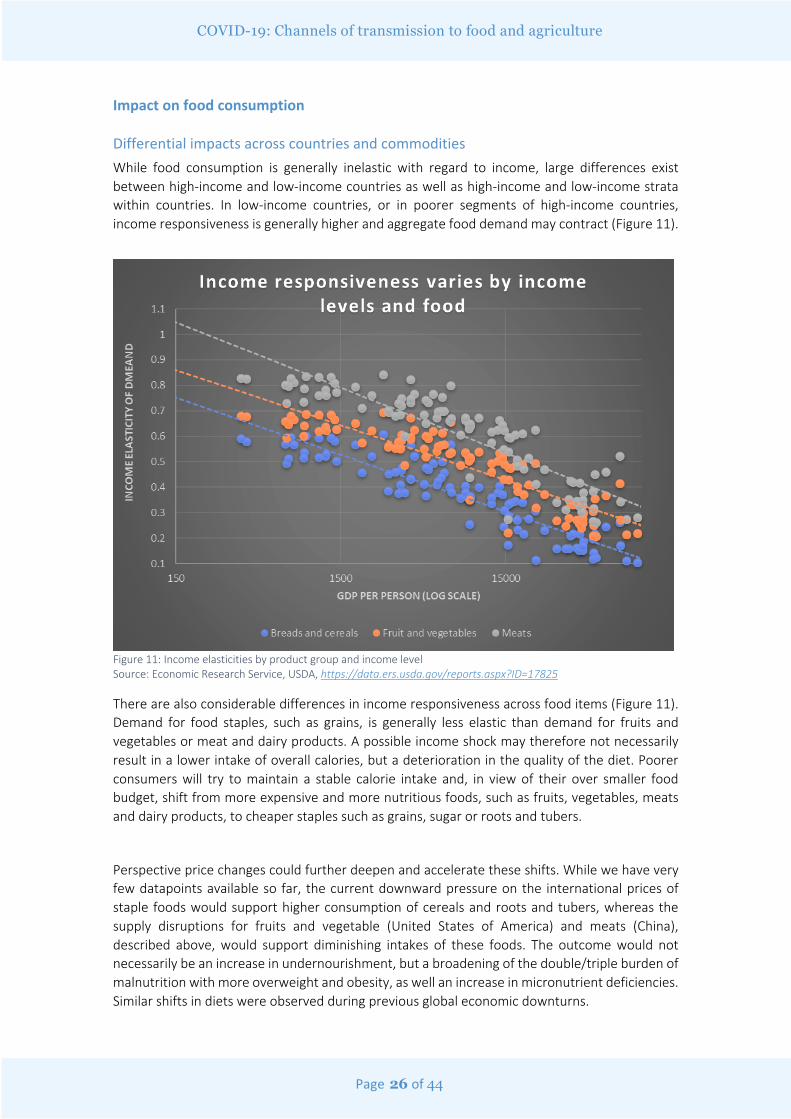
Differential impacts across countries and commodities While food consumption is generally inelastic with regard to income, large differences exist between high-income and low-income countries as well as high-income and low-income strata within countries. In low-income countries, or in poorer segments of high-income countries, income responsiveness is generally higher and aggregate food demand may contract (Figure 11).
Figure 11: Income elasticities by product group and income level Source: Economic Research Service, USDA, https://data.ers.usda.gov/reports.aspx?ID=17825
There are also considerable differences in income responsiveness across food items (Figure 11). Demand for food staples, such as grains, is generally less elastic than demand for fruits and vegetables or meat and dairy products. A possible income shock may therefore not necessarily result in a lower intake of overall calories, but a deterioration in the quality of the diet. Poorer consumers will try to maintain a stable calorie intake and, in view of their over smaller food budget, shift from more expensive and more nutritious foods, such as fruits, vegetables, meats and dairy products, to cheaper staples such as grains, sugar or roots and tubers.
Perspective price changes could further deepen and accelerate these shifts. While we have very few datapoints available so far, the current downward pressure on the international prices of staple foods would support higher consumption of cereals and roots and tubers, whereas the supply disruptions for fruits and vegetable (United States of America) and meats (China), described above, would support diminishing intakes of these foods. The outcome would not necessarily be an increase in undernourishment, but a broadening of the double/triple burden of malnutrition with more overweight and obesity, as well an increase in micronutrient deficiencies. Similar shifts in diets were observed during previous global economic downturns.
Page 27 of 44
COVID-19: Channels of transmission to food and agriculture
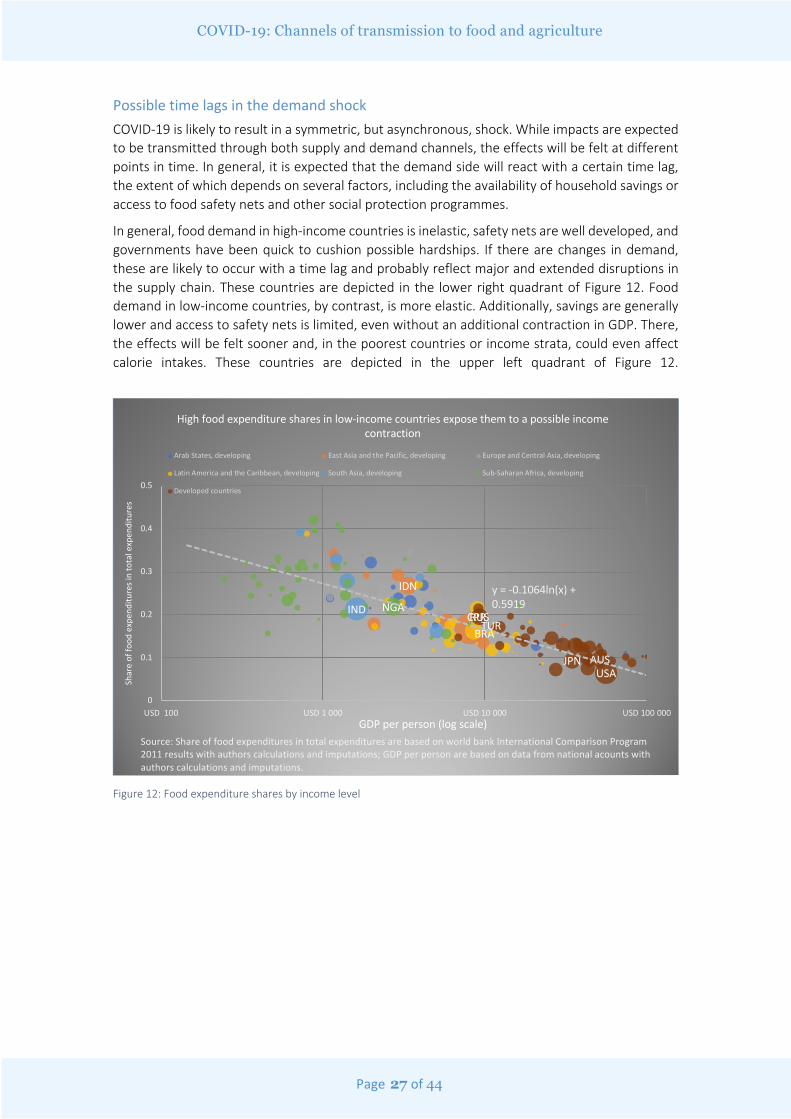
Possible time lags in the demand shock COVID-19 is likely to result in a symmetric, but asynchronous, shock. While impacts are expected to be transmitted through both supply and demand channels, the effects will be felt at different points in time. In general, it is expected that the demand side will react with a certain time lag, the extent of which depends on several factors, including the availability of household savings or access to food safety nets and other social protection programmes.
In general, food demand in high-income countries is inelastic, safety nets are well developed, and governments have been quick to cushion possible hardships. If there are changes in demand, these are likely to occur with a time lag and probably reflect major and extended disruptions in the supply chain. These countries are depicted in the lower right quadrant of Figure 12. Food demand in low-income countries, by contrast, is more elastic. Additionally, savings are generally lower and access to safety nets is limited, even without an additional contraction in GDP. There, the effects will be felt sooner and, in the poorest countries or income strata, could even affect calorie intakes. These countries are depicted in the upper left quadrant of Figure 12.
Figure 12: Food expenditure shares by income level
CPR
IDN
TURBRA
IND NGA
AUSJPN
RUS
USA
0
0.1
0.2
0.3
0.4
0.5
USD 100 USD 1 000 USD 10 000 USD 100 000
Shar
e of
food
exp
endi
ture
s in
tota
l exp
endi
ture
s
GDP per person (log scale)
High food expenditure shares in low-income countries expose them to a possible income contraction
Arab States, developing East Asia and the Pacific, developing Europe and Central Asia, developing
Latin America and the Caribbean, developing South Asia, developing Sub-Saharan Africa, developing
Developed countries
y = -0.1064ln(x) + 0.5919
Source: Share of food expenditures in total expenditures are based on world bank International Comparison Program 2011 results with authors calculations and imputations; GDP per person are based on data from national acounts with authors calculations and imputations.
Page 28 of 44
COVID-19: Channels of transmission to food and agriculture
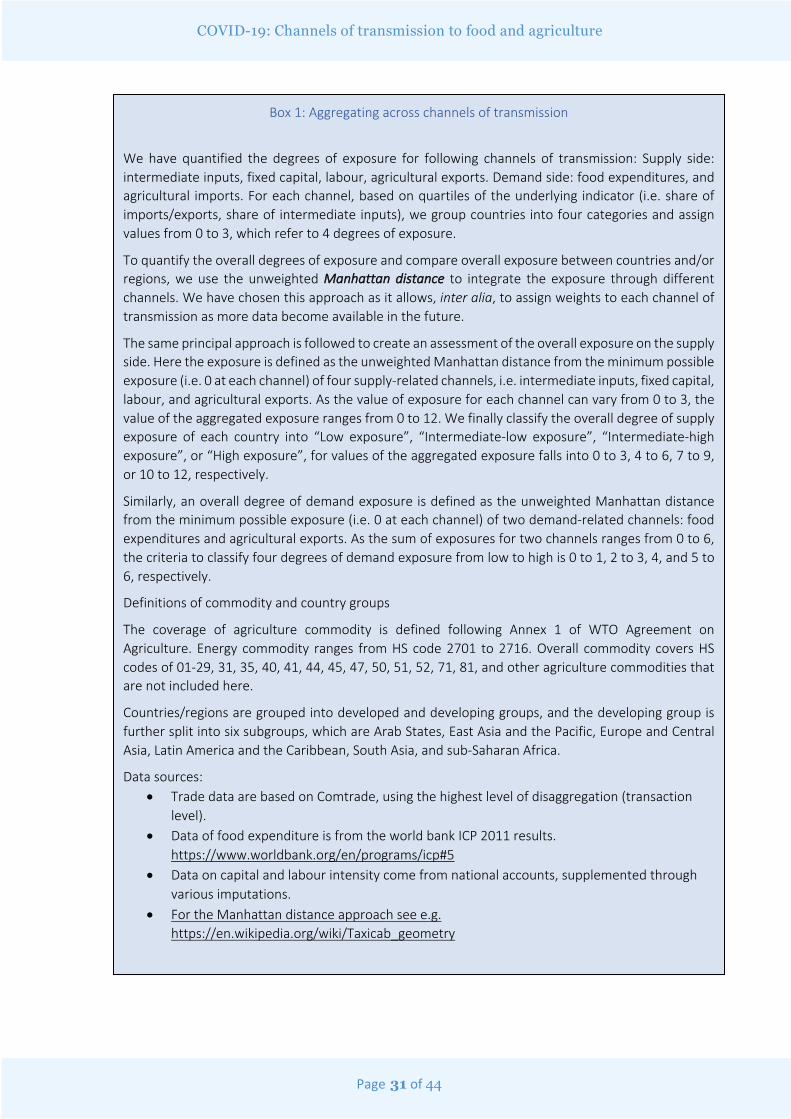
EXPOSURE TO COVID-19 – A TAXONOMY OF COUNTRIES The preceding analysis showed that countries can be affected to different extents and through various channels of transmission. This section presents an approach to combine the supply and demand-sided risks at the level of an individual region or country and establish a taxonomy of countries based on their exposure to pandemic-induced shocks. These results are intended to provide a better understanding of individual channels of transmissions and eventually assess the overall exposure of countries to COVID-19 related supply and demand shocks. The section will first describe the methodology of combining channels and classifying degrees of exposure. The methodological aspects are summarized in Box 1.
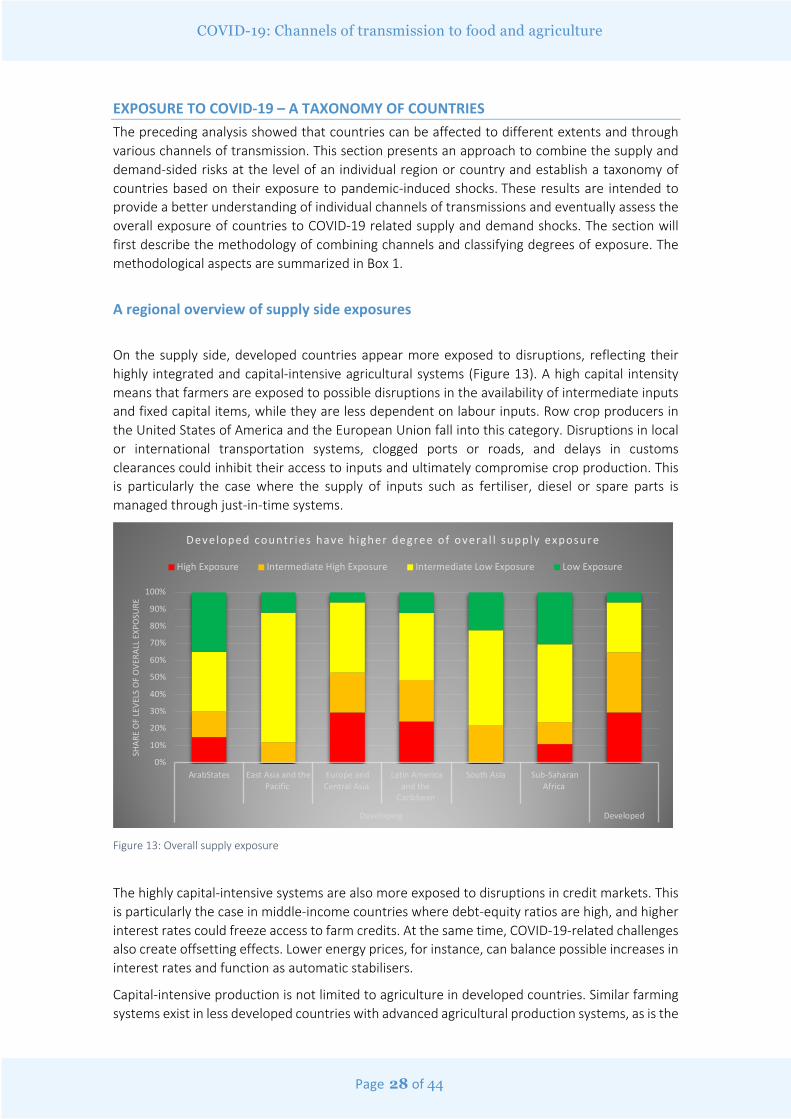
A regional overview of supply side exposures
On the supply side, developed countries appear more exposed to disruptions, reflecting their highly integrated and capital-intensive agricultural systems (Figure 13). A high capital intensity means that farmers are exposed to possible disruptions in the availability of intermediate inputs and fixed capital items, while they are less dependent on labour inputs. Row crop producers in the United States of America and the European Union fall into this category. Disruptions in local or international transportation systems, clogged ports or roads, and delays in customs clearances could inhibit their access to inputs and ultimately compromise crop production. This is particularly the case where the supply of inputs such as fertiliser, diesel or spare parts is managed through just-in-time systems.
Figure 13: Overall supply exposure
The highly capital-intensive systems are also more exposed to disruptions in credit markets. This is particularly the case in middle-income countries where debt-equity ratios are high, and higher interest rates could freeze access to farm credits. At the same time, COVID-19-related challenges also create offsetting effects. Lower energy prices, for instance, can balance possible increases in interest rates and function as automatic stabilisers.
Capital-intensive production is not limited to agriculture in developed countries. Similar farming systems exist in less developed countries with advanced agricultural production systems, as is the
0%
10%
20%
30%
40%
50%
60%
70%
80%
90%
100%
ArabStates East Asia and thePacific
Europe andCentral Asia
Latin Americaand the
Caribbean
South Asia Sub-SaharanAfrica
Developing Developed
SHAR
E O
F LE
VELS
OF
OVE
RALL
EXP
OSU
RE
Developed countr ies have h igher degree of overa l l supply exposure
High Exposure Intermediate High Exposure Intermediate Low Exposure Low Exposure
Page 29 of 44
COVID-19: Channels of transmission to food and agriculture
case in Brazil, Argentina, Kazakhstan and Ukraine. They have similar exposures to possible disruptions in credit markets. Unsurprisingly, these factors percolate through to the regional level, signifying that regions like Latin America or Eastern Europe are classified as regions comparatively highly exposed to supply shocks (Figure 13).
By contrast, most developing regions appear less susceptible to supply shocks, reflecting their limited reliance on intermediate inputs and fixed capital. However, most farming systems in these regions are highly labour-intensive, and a widespread outbreak of COVID-19 would expose their agricultural production to possible labour shortages. This could not only compromise every step in the production process, but, given their high degree of subsistence farming, also jeopardise their food security.
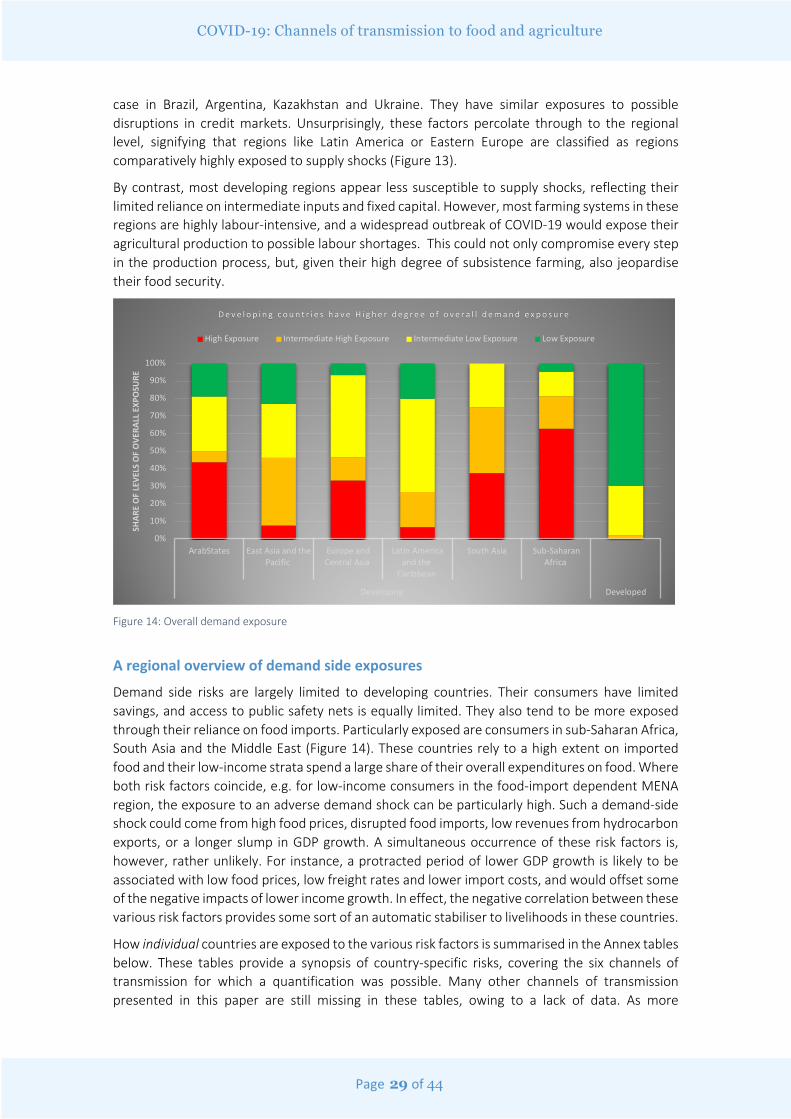
Figure 14: Overall demand exposure
A regional overview of demand side exposures
Demand side risks are largely limited to developing countries. Their consumers have limited savings, and access to public safety nets is equally limited. They also tend to be more exposed through their reliance on food imports. Particularly exposed are consumers in sub-Saharan Africa, South Asia and the Middle East (Figure 14). These countries rely to a high extent on imported food and their low-income strata spend a large share of their overall expenditures on food. Where both risk factors coincide, e.g. for low-income consumers in the food-import dependent MENA region, the exposure to an adverse demand shock can be particularly high. Such a demand-side shock could come from high food prices, disrupted food imports, low revenues from hydrocarbon exports, or a longer slump in GDP growth. A simultaneous occurrence of these risk factors is, however, rather unlikely. For instance, a protracted period of lower GDP growth is likely to be associated with low food prices, low freight rates and lower import costs, and would offset some of the negative impacts of lower income growth. In effect, the negative correlation between these various risk factors provides some sort of an automatic stabiliser to livelihoods in these countries.
How individual countries are exposed to the various risk factors is summarised in the Annex tables below. These tables provide a synopsis of country-specific risks, covering the six channels of transmission for which a quantification was possible. Many other channels of transmission presented in this paper are still missing in these tables, owing to a lack of data. As more
0%
10%
20%
30%
40%
50%
60%
70%
80%
90%
100%
ArabStates East Asia and thePacific
Europe andCentral Asia
Latin Americaand the
Caribbean
South Asia Sub-SaharanAfrica
Developing Developed
SHAR
E O
F LE
VELS
OF
OVE
RALL
EXP
OSU
RE
D e v e l o p i n g c o u n t r i e s h a v e H i g h e r d e g r e e o f o v e r a l l d e m a n d e x p o s u r e
High Exposure Intermediate High Exposure Intermediate Low Exposure Low Exposure
Page 30 of 44
COVID-19: Channels of transmission to food and agriculture
information and data become available, the analysis will be updated and expanded to provide a more comprehensive picture of the exposure, covering a greater number of channels of transmission.
Page 31 of 44
COVID-19: Channels of transmission to food and agriculture
Box 1: Aggregating across channels of transmission
We have quantified the degrees of exposure for following channels of transmission: Supply side: intermediate inputs, fixed capital, labour, agricultural exports. Demand side: food expenditures, and agricultural imports. For each channel, based on quartiles of the underlying indicator (i.e. share of imports/exports, share of intermediate inputs), we group countries into four categories and assign values from 0 to 3, which refer to 4 degrees of exposure.
To quantify the overall degrees of exposure and compare overall exposure between countries and/or regions, we use the unweighted Manhattan distance to integrate the exposure through different channels. We have chosen this approach as it allows, inter alia, to assign weights to each channel of transmission as more data become available in the future.
The same principal approach is followed to create an assessment of the overall exposure on the supply side. Here the exposure is defined as the unweighted Manhattan distance from the minimum possible exposure (i.e. 0 at each channel) of four supply-related channels, i.e. intermediate inputs, fixed capital, labour, and agricultural exports. As the value of exposure for each channel can vary from 0 to 3, the value of the aggregated exposure ranges from 0 to 12. We finally classify the overall degree of supply exposure of each country into “Low exposure”, “Intermediate-low exposure”, “Intermediate-high exposure”, or “High exposure”, for values of the aggregated exposure falls into 0 to 3, 4 to 6, 7 to 9, or 10 to 12, respectively.
Similarly, an overall degree of demand exposure is defined as the unweighted Manhattan distance from the minimum possible exposure (i.e. 0 at each channel) of two demand-related channels: food expenditures and agricultural exports. As the sum of exposures for two channels ranges from 0 to 6, the criteria to classify four degrees of demand exposure from low to high is 0 to 1, 2 to 3, 4, and 5 to 6, respectively.
Definitions of commodity and country groups
The coverage of agriculture commodity is defined following Annex 1 of WTO Agreement on Agriculture. Energy commodity ranges from HS code 2701 to 2716. Overall commodity covers HS codes of 01-29, 31, 35, 40, 41, 44, 45, 47, 50, 51, 52, 71, 81, and other agriculture commodities that are not included here.
Countries/regions are grouped into developed and developing groups, and the developing group is further split into six subgroups, which are Arab States, East Asia and the Pacific, Europe and Central Asia, Latin America and the Caribbean, South Asia, and sub-Saharan Africa.
Data sources: • Trade data are based on Comtrade, using the highest level of disaggregation (transaction
level).• Data of food expenditure is from the world bank ICP 2011 results.
https://www.worldbank.org/en/programs/icp#5• Data on capital and labour intensity come from national accounts, supplemented through
various imputations.• For the Manhattan distance approach see e.g.
https://en.wikipedia.org/wiki/Taxicab_geometry
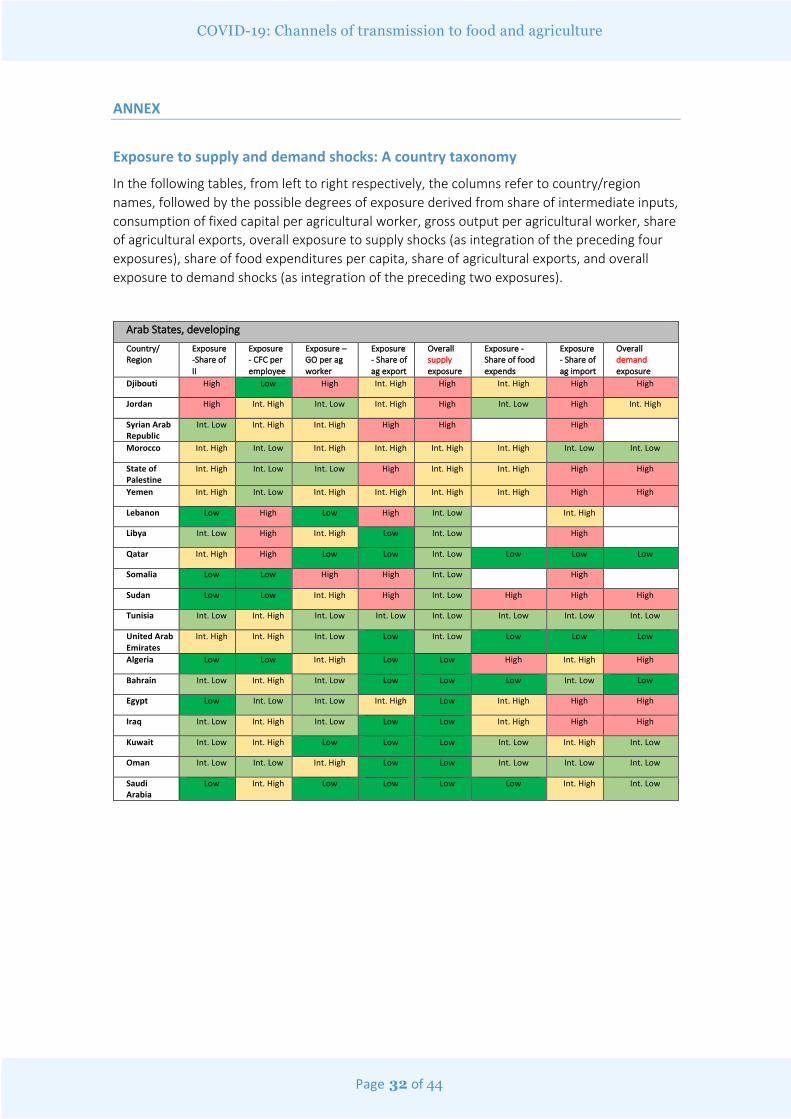
Page 32 of 44
COVID-19: Channels of transmission to food and agriculture
ANNEX
Exposure to supply and demand shocks: A country taxonomy
In the following tables, from left to right respectively, the columns refer to country/region names, followed by the possible degrees of exposure derived from share of intermediate inputs, consumption of fixed capital per agricultural worker, gross output per agricultural worker, share of agricultural exports, overall exposure to supply shocks (as integration of the preceding four exposures), share of food expenditures per capita, share of agricultural exports, and overall exposure to demand shocks (as integration of the preceding two exposures).
Arab States, developing
Country/ Region
Exposure -Share of II
Exposure - CFC per employee
Exposure – GO per ag worker
Exposure - Share of ag export
Overall supply exposure
Exposure - Share of food expends
Exposure - Share of ag import
Overall demand exposure
Djibouti High Low High Int. High High Int. High High High
Jordan High Int. High Int. Low Int. High High Int. Low High Int. High
Syrian Arab Republic
Int. Low Int. High Int. High High High High
Morocco Int. High Int. Low Int. High Int. High Int. High Int. High Int. Low Int. Low
State of Palestine
Int. High Int. Low Int. Low High Int. High Int. High High High
Yemen Int. High Int. Low Int. High Int. High Int. High Int. High High High
Lebanon Low High Low High Int. Low Int. High
Libya Int. Low High Int. High Low Int. Low High
Qatar Int. High High Low Low Int. Low Low Low Low
Somalia Low Low High High Int. Low High
Sudan Low Low Int. High High Int. Low High High High
Tunisia Int. Low Int. High Int. Low Int. Low Int. Low Int. Low Int. Low Int. Low
United Arab Emirates
Int. High Int. High Int. Low Low Int. Low Low Low Low
Algeria Low Low Int. High Low Low High Int. High High
Bahrain Int. Low Int. High Int. Low Low Low Low Int. Low Low
Egypt Low Int. Low Int. Low Int. High Low Int. High High High
Iraq Int. Low Int. High Int. Low Low Low Int. High High High
Kuwait Int. Low Int. High Low Low Low Int. Low Int. High Int. Low
Oman Int. Low Int. Low Int. High Low Low Int. Low Int. Low Int. Low
Saudi Arabia
Low Int. High Low Low Low Low Int. High Int. Low
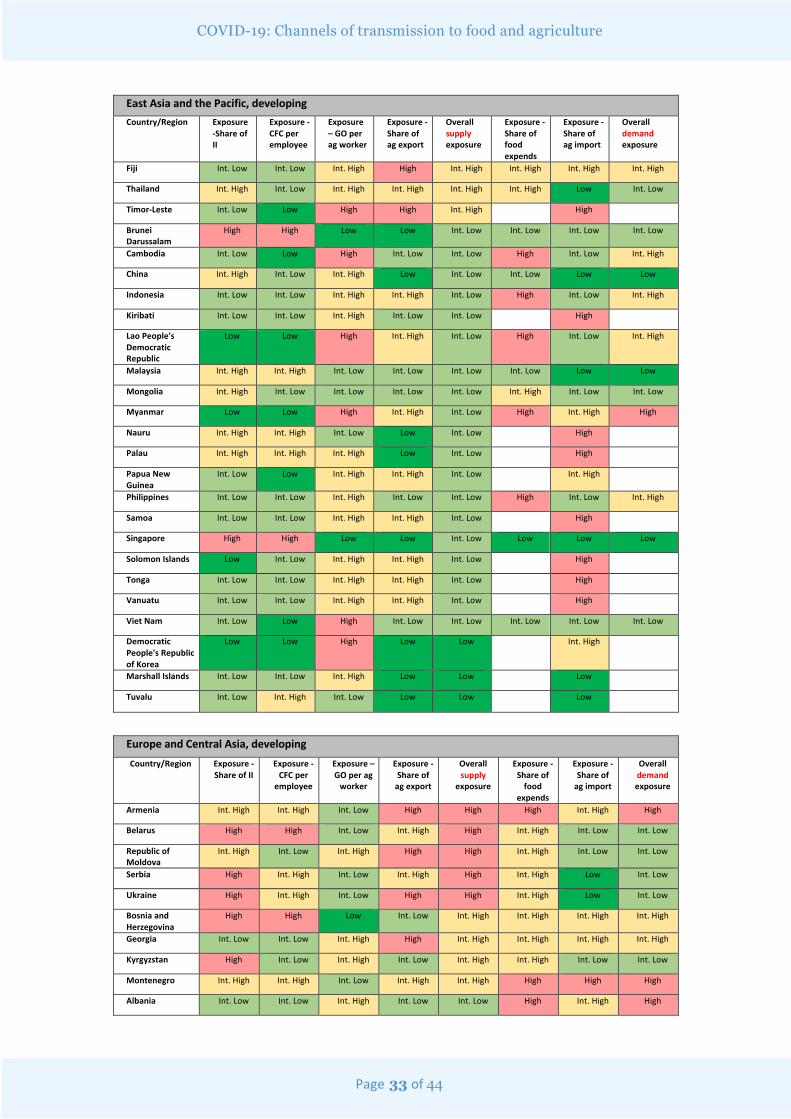
Page 33 of 44
COVID-19: Channels of transmission to food and agriculture
East Asia and the Pacific, developing Country/Region Exposure
-Share of II
Exposure - CFC per employee
Exposure – GO per ag worker
Exposure - Share of ag export
Overall supply exposure
Exposure - Share of food expends
Exposure - Share of ag import
Overall demand exposure
Fiji Int. Low Int. Low Int. High High Int. High Int. High Int. High Int. High
Thailand Int. High Int. Low Int. High Int. High Int. High Int. High Low Int. Low
Timor-Leste Int. Low Low High High Int. High High
Brunei Darussalam
High High Low Low Int. Low Int. Low Int. Low Int. Low
Cambodia Int. Low Low High Int. Low Int. Low High Int. Low Int. High
China Int. High Int. Low Int. High Low Int. Low Int. Low Low Low
Indonesia Int. Low Int. Low Int. High Int. High Int. Low High Int. Low Int. High
Kiribati Int. Low Int. Low Int. High Int. Low Int. Low High
Lao People's Democratic Republic
Low Low High Int. High Int. Low High Int. Low Int. High
Malaysia Int. High Int. High Int. Low Int. Low Int. Low Int. Low Low Low
Mongolia Int. High Int. Low Int. Low Int. Low Int. Low Int. High Int. Low Int. Low
Myanmar Low Low High Int. High Int. Low High Int. High High
Nauru Int. High Int. High Int. Low Low Int. Low High
Palau Int. High Int. High Int. High Low Int. Low High
Papua New Guinea
Int. Low Low Int. High Int. High Int. Low Int. High
Philippines Int. Low Int. Low Int. High Int. Low Int. Low High Int. Low Int. High
Samoa Int. Low Int. Low Int. High Int. High Int. Low High
Singapore High High Low Low Int. Low Low Low Low
Solomon Islands Low Int. Low Int. High Int. High Int. Low High
Tonga Int. Low Int. Low Int. High Int. High Int. Low High
Vanuatu Int. Low Int. Low Int. High Int. High Int. Low High
Viet Nam Int. Low Low High Int. Low Int. Low Int. Low Int. Low Int. Low
Democratic People's Republic of Korea
Low Low High Low Low Int. High
Marshall Islands Int. Low Int. Low Int. High Low Low Low
Tuvalu Int. Low Int. High Int. Low Low Low Low
Europe and Central Asia, developing Country/Region Exposure -
Share of II Exposure -
CFC per employee
Exposure – GO per ag
worker
Exposure - Share of
ag export
Overall supply
exposure
Exposure - Share of
food expends
Exposure - Share of
ag import
Overall demand exposure
Armenia Int. High Int. High Int. Low High High High Int. High High
Belarus High High Int. Low Int. High High Int. High Int. Low Int. Low
Republic of Moldova
Int. High Int. Low Int. High High High Int. High Int. Low Int. Low
Serbia High Int. High Int. Low Int. High High Int. High Low Int. Low
Ukraine High Int. High Int. Low High High Int. High Low Int. Low
Bosnia and Herzegovina
High High Low Int. Low Int. High Int. High Int. High Int. High
Georgia Int. Low Int. Low Int. High High Int. High Int. High Int. High Int. High
Kyrgyzstan High Int. Low Int. High Int. Low Int. High Int. High Int. Low Int. Low
Montenegro Int. High Int. High Int. Low Int. High Int. High High High High
Albania Int. Low Int. Low Int. High Int. Low Int. Low High Int. High High
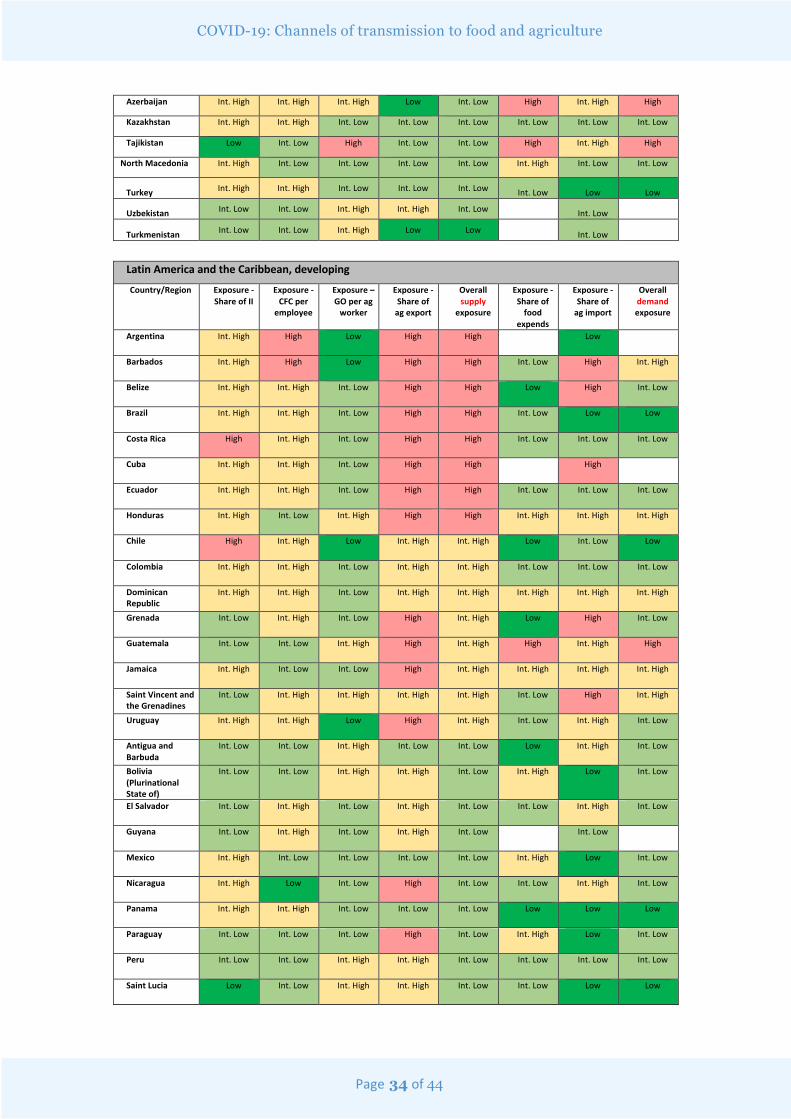
Page 34 of 44
COVID-19: Channels of transmission to food and agriculture
Azerbaijan Int. High Int. High Int. High Low Int. Low High Int. High High
Kazakhstan Int. High Int. High Int. Low Int. Low Int. Low Int. Low Int. Low Int. Low
Tajikistan Low Int. Low High Int. Low Int. Low High Int. High High
North Macedonia Int. High Int. Low Int. Low Int. Low Int. Low Int. High Int. Low Int. Low
Turkey Int. High Int. High Int. Low Int. Low Int. Low Int. Low Low Low
Uzbekistan Int. Low Int. Low Int. High Int. High Int. Low Int. Low
Turkmenistan Int. Low Int. Low Int. High Low Low Int. Low
Latin America and the Caribbean, developing
Country/Region Exposure -Share of II
Exposure - CFC per
employee
Exposure – GO per ag
worker
Exposure - Share of
ag export
Overall supply
exposure
Exposure - Share of
food expends
Exposure - Share of
ag import
Overall demand exposure
Argentina Int. High High Low High High
Low
Barbados Int. High High Low High High Int. Low High Int. High
Belize Int. High Int. High Int. Low High High Low High Int. Low
Brazil Int. High Int. High Int. Low High High Int. Low Low Low
Costa Rica High Int. High Int. Low High High Int. Low Int. Low Int. Low
Cuba Int. High Int. High Int. Low High High High
Ecuador Int. High Int. High Int. Low High High Int. Low Int. Low Int. Low
Honduras Int. High Int. Low Int. High High High Int. High Int. High Int. High
Chile High Int. High Low Int. High Int. High Low Int. Low Low
Colombia Int. High Int. High Int. Low Int. High Int. High Int. Low Int. Low Int. Low
Dominican Republic
Int. High Int. High Int. Low Int. High Int. High Int. High Int. High Int. High
Grenada Int. Low Int. High Int. Low High Int. High Low High Int. Low
Guatemala Int. Low Int. Low Int. High High Int. High High Int. High High
Jamaica Int. High Int. Low Int. Low High Int. High Int. High Int. High Int. High
Saint Vincent and the Grenadines
Int. Low Int. High Int. High Int. High Int. High Int. Low High Int. High
Uruguay Int. High Int. High Low High Int. High Int. Low Int. High Int. Low
Antigua and Barbuda
Int. Low Int. Low Int. High Int. Low Int. Low Low Int. High Int. Low
Bolivia (Plurinational State of)
Int. Low Int. Low Int. High Int. High Int. Low Int. High Low Int. Low
El Salvador Int. Low Int. High Int. Low Int. High Int. Low Int. Low Int. High Int. Low
Guyana Int. Low Int. High Int. Low Int. High Int. Low Int. Low
Mexico Int. High Int. Low Int. Low Int. Low Int. Low Int. High Low Int. Low
Nicaragua Int. High Low Int. Low High Int. Low Int. Low Int. High Int. Low
Panama Int. High Int. High Int. Low Int. Low Int. Low Low Low Low
Paraguay Int. Low Int. Low Int. Low High Int. Low Int. High Low Int. Low
Peru Int. Low Int. Low Int. High Int. High Int. Low Int. Low Int. Low Int. Low
Saint Lucia Low Int. Low Int. High Int. High Int. Low Int. Low Low Low
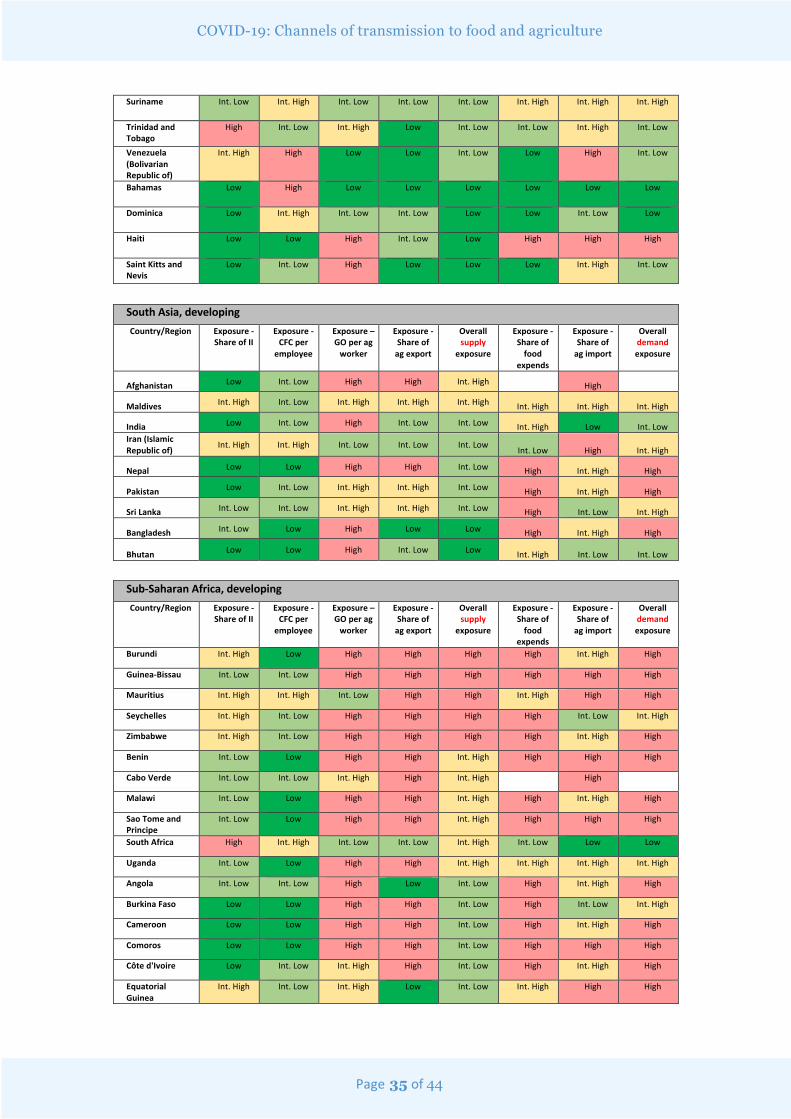
Page 35 of 44
COVID-19: Channels of transmission to food and agriculture
Suriname Int. Low Int. High Int. Low Int. Low Int. Low Int. High Int. High Int. High
Trinidad and Tobago
High Int. Low Int. High Low Int. Low Int. Low Int. High Int. Low
Venezuela (Bolivarian Republic of)
Int. High High Low Low Int. Low Low High Int. Low
Bahamas Low High Low Low Low Low Low Low
Dominica Low Int. High Int. Low Int. Low Low Low Int. Low Low
Haiti Low Low High Int. Low Low High High High
Saint Kitts and Nevis
Low Int. Low High Low Low Low Int. High Int. Low
South Asia, developing Country/Region Exposure -
Share of II Exposure -
CFC per employee
Exposure – GO per ag
worker
Exposure - Share of
ag export
Overall supply
exposure
Exposure - Share of
food expends
Exposure - Share of
ag import
Overall demand exposure
Afghanistan Low Int. Low High High Int. High High
Maldives Int. High Int. Low Int. High Int. High Int. High Int. High Int. High Int. High
India Low Int. Low High Int. Low Int. Low Int. High Low Int. Low Iran (Islamic Republic of) Int. High Int. High Int. Low Int. Low Int. Low Int. Low High Int. High
Nepal Low Low High High Int. Low High Int. High High
Pakistan Low Int. Low Int. High Int. High Int. Low High Int. High High
Sri Lanka Int. Low Int. Low Int. High Int. High Int. Low High Int. Low Int. High
Bangladesh Int. Low Low High Low Low High Int. High High
Bhutan Low Low High Int. Low Low Int. High Int. Low Int. Low
Sub-Saharan Africa, developing Country/Region Exposure -
Share of II Exposure -
CFC per employee
Exposure – GO per ag
worker
Exposure - Share of
ag export
Overall supply
exposure
Exposure - Share of
food expends
Exposure - Share of
ag import
Overall demand exposure
Burundi Int. High Low High High High High Int. High High
Guinea-Bissau Int. Low Int. Low High High High High High High
Mauritius Int. High Int. High Int. Low High High Int. High High High
Seychelles Int. High Int. Low High High High High Int. Low Int. High
Zimbabwe Int. High Int. Low High High High High Int. High High
Benin Int. Low Low High High Int. High High High High
Cabo Verde Int. Low Int. Low Int. High High Int. High High
Malawi Int. Low Low High High Int. High High Int. High High
Sao Tome and Principe
Int. Low Low High High Int. High High High High
South Africa High Int. High Int. Low Int. Low Int. High Int. Low Low Low
Uganda Int. Low Low High High Int. High Int. High Int. High Int. High
Angola Int. Low Int. Low High Low Int. Low High Int. High High
Burkina Faso Low Low High High Int. Low High Int. Low Int. High
Cameroon Low Low High High Int. Low High Int. High High
Comoros Low Low High High Int. Low High High High
Côte d'Ivoire Low Int. Low Int. High High Int. Low High Int. High High
Equatorial Guinea
Int. High Int. Low Int. High Low Int. Low Int. High High High
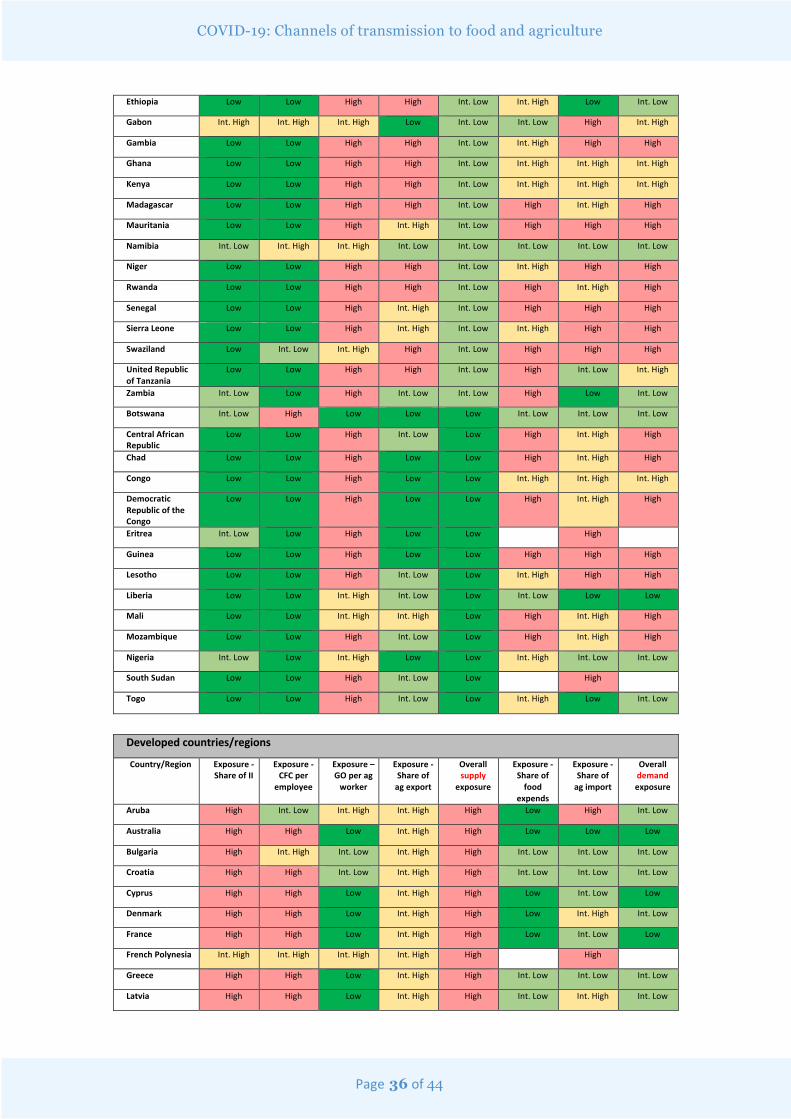
Page 36 of 44
COVID-19: Channels of transmission to food and agriculture
Ethiopia Low Low High High Int. Low Int. High Low Int. Low
Gabon Int. High Int. High Int. High Low Int. Low Int. Low High Int. High
Gambia Low Low High High Int. Low Int. High High High
Ghana Low Low High High Int. Low Int. High Int. High Int. High
Kenya Low Low High High Int. Low Int. High Int. High Int. High
Madagascar Low Low High High Int. Low High Int. High High
Mauritania Low Low High Int. High Int. Low High High High
Namibia Int. Low Int. High Int. High Int. Low Int. Low Int. Low Int. Low Int. Low
Niger Low Low High High Int. Low Int. High High High
Rwanda Low Low High High Int. Low High Int. High High
Senegal Low Low High Int. High Int. Low High High High
Sierra Leone Low Low High Int. High Int. Low Int. High High High
Swaziland Low Int. Low Int. High High Int. Low High High High
United Republic of Tanzania
Low Low High High Int. Low High Int. Low Int. High
Zambia Int. Low Low High Int. Low Int. Low High Low Int. Low
Botswana Int. Low High Low Low Low Int. Low Int. Low Int. Low
Central African Republic
Low Low High Int. Low Low High Int. High High
Chad Low Low High Low Low High Int. High High
Congo Low Low High Low Low Int. High Int. High Int. High
Democratic Republic of the Congo
Low Low High Low Low High Int. High High
Eritrea Int. Low Low High Low Low High
Guinea Low Low High Low Low High High High
Lesotho Low Low High Int. Low Low Int. High High High
Liberia Low Low Int. High Int. Low Low Int. Low Low Low
Mali Low Low Int. High Int. High Low High Int. High High
Mozambique Low Low High Int. Low Low High Int. High High
Nigeria Int. Low Low Int. High Low Low Int. High Int. Low Int. Low
South Sudan Low Low High Int. Low Low High
Togo Low Low High Int. Low Low Int. High Low Int. Low
Developed countries/regions
Country/Region Exposure -Share of II
Exposure - CFC per
employee
Exposure – GO per ag
worker
Exposure - Share of
ag export
Overall supply
exposure
Exposure - Share of
food expends
Exposure - Share of
ag import
Overall demand exposure
Aruba High Int. Low Int. High Int. High High Low High Int. Low
Australia High High Low Int. High High Low Low Low
Bulgaria High Int. High Int. Low Int. High High Int. Low Int. Low Int. Low
Croatia High High Int. Low Int. High High Int. Low Int. Low Int. Low
Cyprus High High Low Int. High High Low Int. Low Low
Denmark High High Low Int. High High Low Int. High Int. Low
France High High Low Int. High High Low Int. Low Low
French Polynesia Int. High Int. High Int. High Int. High High High
Greece High High Low Int. High High Int. Low Int. Low Int. Low
Latvia High High Low Int. High High Int. Low Int. High Int. Low
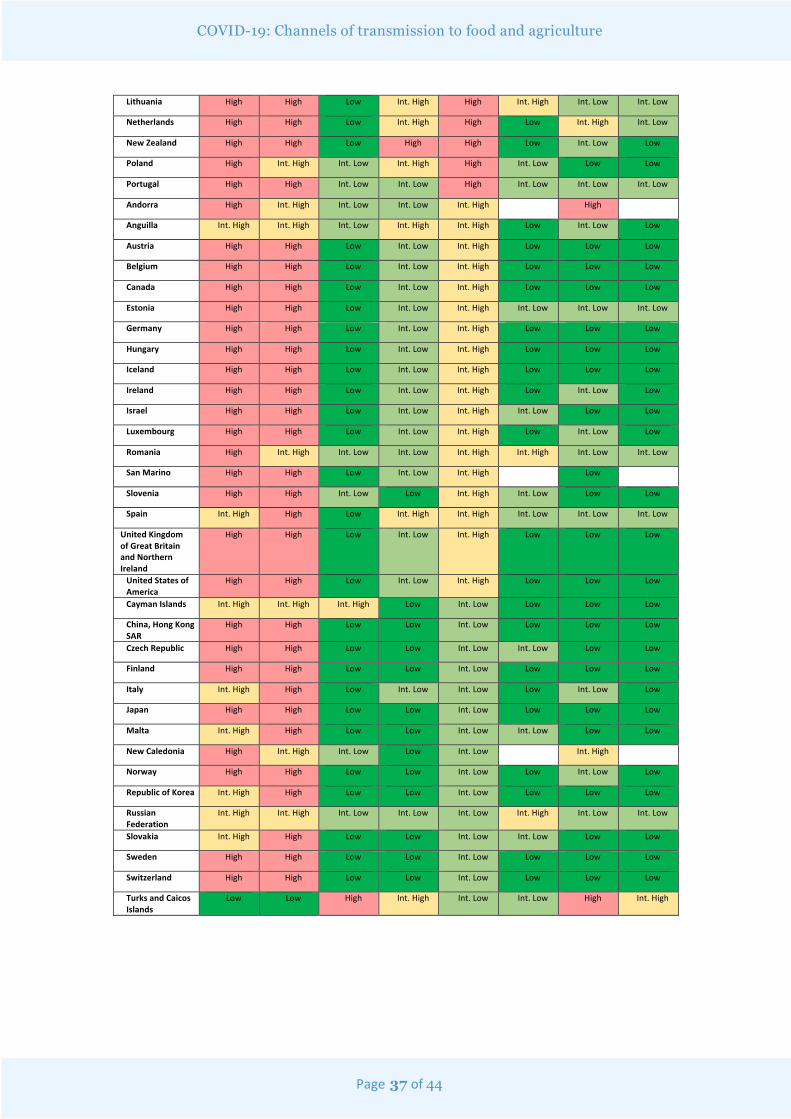
Page 37 of 44
COVID-19: Channels of transmission to food and agriculture
Lithuania High High Low Int. High High Int. High Int. Low Int. Low
Netherlands High High Low Int. High High Low Int. High Int. Low
New Zealand High High Low High High Low Int. Low Low
Poland High Int. High Int. Low Int. High High Int. Low Low Low
Portugal High High Int. Low Int. Low High Int. Low Int. Low Int. Low
Andorra High Int. High Int. Low Int. Low Int. High High
Anguilla Int. High Int. High Int. Low Int. High Int. High Low Int. Low Low
Austria High High Low Int. Low Int. High Low Low Low
Belgium High High Low Int. Low Int. High Low Low Low
Canada High High Low Int. Low Int. High Low Low Low
Estonia High High Low Int. Low Int. High Int. Low Int. Low Int. Low
Germany High High Low Int. Low Int. High Low Low Low
Hungary High High Low Int. Low Int. High Low Low Low
Iceland High High Low Int. Low Int. High Low Low Low
Ireland High High Low Int. Low Int. High Low Int. Low Low
Israel High High Low Int. Low Int. High Int. Low Low Low
Luxembourg High High Low Int. Low Int. High Low Int. Low Low
Romania High Int. High Int. Low Int. Low Int. High Int. High Int. Low Int. Low
San Marino High High Low Int. Low Int. High Low
Slovenia High High Int. Low Low Int. High Int. Low Low Low
Spain Int. High High Low Int. High Int. High Int. Low Int. Low Int. Low
United Kingdom of Great Britain and Northern Ireland
High High Low Int. Low Int. High Low Low Low
United States of America
High High Low Int. Low Int. High Low Low Low
Cayman Islands Int. High Int. High Int. High Low Int. Low Low Low Low
China, Hong Kong SAR
High High Low Low Int. Low Low Low Low
Czech Republic High High Low Low Int. Low Int. Low Low Low
Finland High High Low Low Int. Low Low Low Low
Italy Int. High High Low Int. Low Int. Low Low Int. Low Low
Japan High High Low Low Int. Low Low Low Low
Malta Int. High High Low Low Int. Low Int. Low Low Low
New Caledonia High Int. High Int. Low Low Int. Low Int. High
Norway High High Low Low Int. Low Low Int. Low Low
Republic of Korea Int. High High Low Low Int. Low Low Low Low
Russian Federation
Int. High Int. High Int. Low Int. Low Int. Low Int. High Int. Low Int. Low
Slovakia Int. High High Low Low Int. Low Int. Low Low Low
Sweden High High Low Low Int. Low Low Low Low
Switzerland High High Low Low Int. Low Low Low Low
Turks and Caicos Islands
Low Low High Int. High Int. Low Int. Low High Int. High
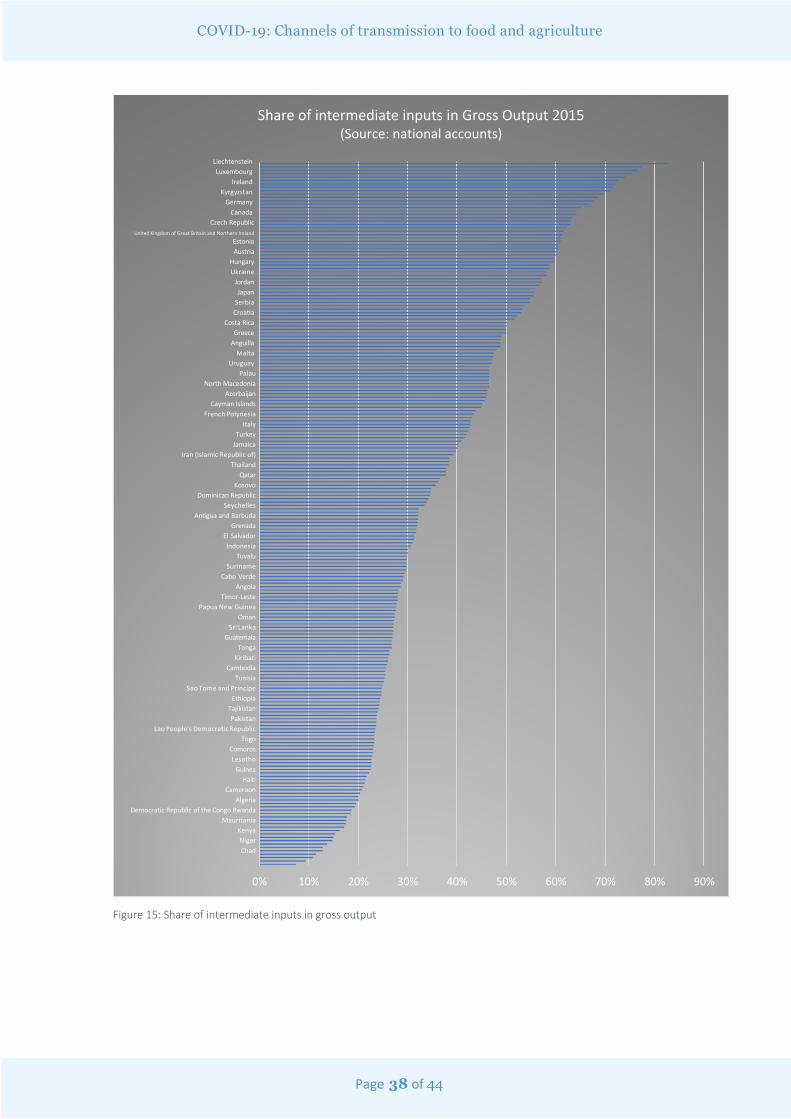
Page 38 of 44
COVID-19: Channels of transmission to food and agriculture
Figure 15: Share of intermediate inputs in gross output
0% 10% 20% 30% 40% 50% 60% 70% 80% 90%
LiechtensteinLuxembourg
IrelandKyrgyzstan
GermanyCanada
Czech RepublicUnited Kingdom of Great Britain and Northern Ireland
EstoniaAustria
HungaryUkraine
JordanJapan
SerbiaCroatia
Costa RicaGreece
AnguillaMalta
UruguayPalau
North Macedonia Azerbaijan
Cayman IslandsFrench Polynesia
ItalyTurkey
JamaicaIran (Islamic Republic of)
ThailandQatar
KosovoDominican Republic
SeychellesAntigua and Barbuda
GrenadaEl SalvadorIndonesia
TuvaluSuriname
Cabo VerdeAngola
Timor-LestePapua New Guinea
OmanSri Lanka
GuatemalaTonga
KiribatiCambodia
TunisiaSao Tome and Principe
EthiopiaTajikistanPakistan
Lao People's Democratic RepublicTogo
ComorosLesotho
GuineaHaiti
CameroonAlgeria
Democratic Republic of the Congo Rwanda Mauritania
KenyaNigerChad
Share of intermediate inputs in Gross Output 2015(Source: national accounts)
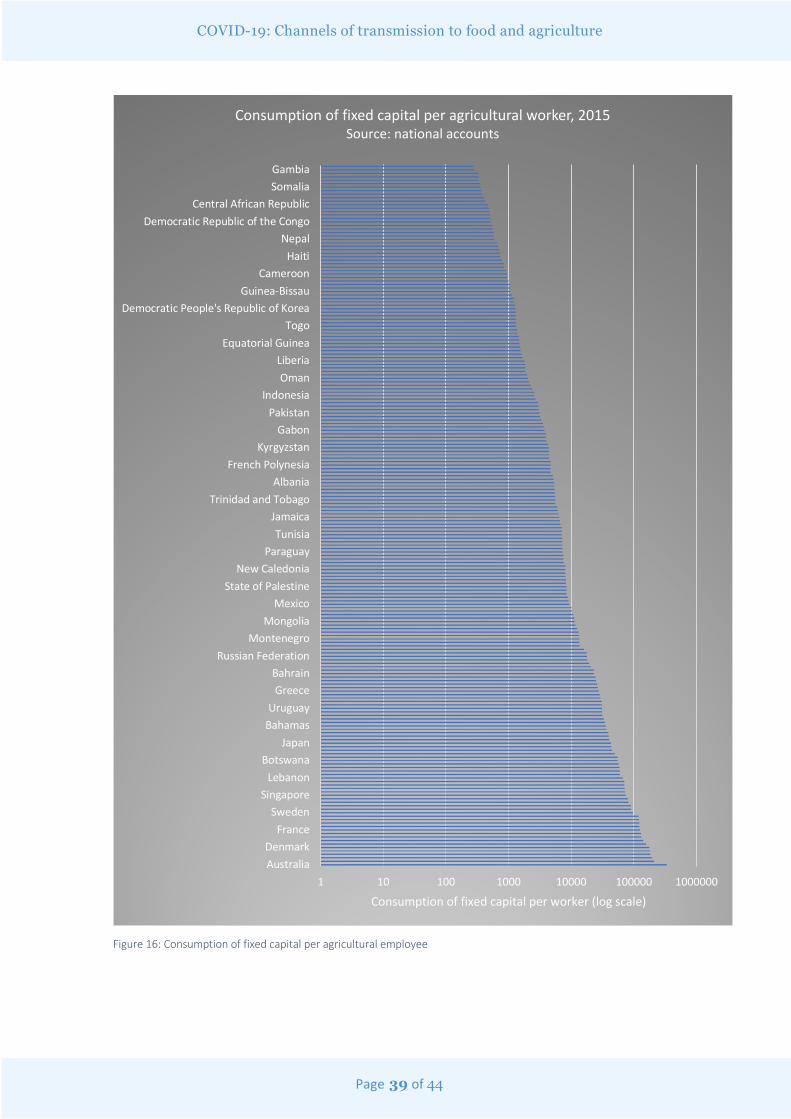
Page 39 of 44
COVID-19: Channels of transmission to food and agriculture
Figure 16: Consumption of fixed capital per agricultural employee
1 10 100 1000 10000 100000 1000000AustraliaDenmark
FranceSweden
SingaporeLebanon
BotswanaJapan
BahamasUruguay
GreeceBahrain
Russian FederationMontenegro
MongoliaMexico
State of PalestineNew Caledonia
ParaguayTunisia
JamaicaTrinidad and Tobago
AlbaniaFrench Polynesia
KyrgyzstanGabon
PakistanIndonesia
OmanLiberia
Equatorial GuineaTogo
Democratic People's Republic of KoreaGuinea-Bissau
CameroonHaiti
NepalDemocratic Republic of the Congo
Central African RepublicSomaliaGambia
Consumption of fixed capital per worker (log scale)
Consumption of fixed capital per agricultural worker, 2015Source: national accounts
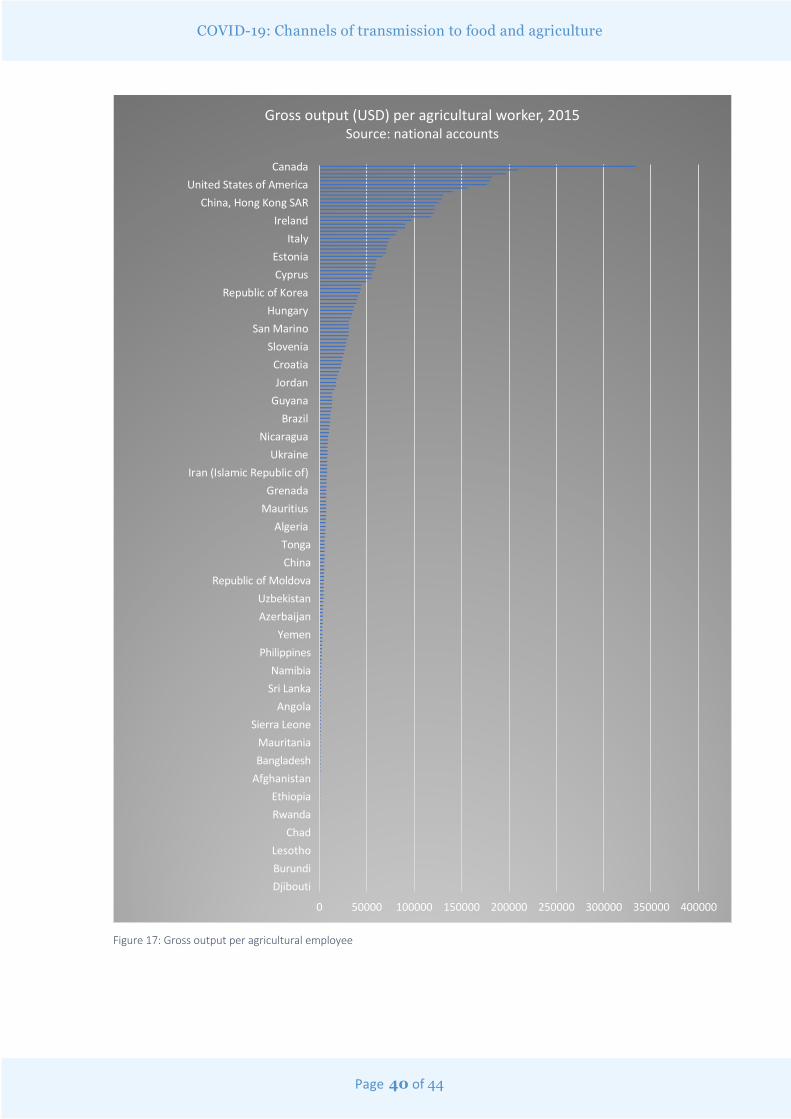
Page 40 of 44
COVID-19: Channels of transmission to food and agriculture
Figure 17: Gross output per agricultural employee
0 50000 100000 150000 200000 250000 300000 350000 400000
CanadaUnited States of America
China, Hong Kong SARIreland
ItalyEstoniaCyprus
Republic of KoreaHungary
San MarinoSlovenia
CroatiaJordan
GuyanaBrazil
NicaraguaUkraine
Iran (Islamic Republic of)Grenada
MauritiusAlgeria
TongaChina
Republic of MoldovaUzbekistanAzerbaijan
YemenPhilippines
NamibiaSri Lanka
AngolaSierra Leone
MauritaniaBangladesh
AfghanistanEthiopiaRwanda
ChadLesothoBurundiDjibouti
Gross output (USD) per agricultural worker, 2015Source: national accounts
Page 41 of 44
COVID-19: Channels of transmission to food and agriculture
Figure 18: Kazakhstan’s exports of merchandise trade, HS2
1.9%
Precious...
23%
Metals
MachinesAnimal...
4.1%
VegetableProducts
0.89%
Foods tuffs
61%
Mineral Products
6.7%
ChemicalProducts
Total: $44.1B
Page 42 of 44
COVID-19: Channels of transmission to food and agriculture
Figure 19: Changes in exchange rates against the United States Dollar, January 2020 – mid March 2020.
-30.0% -25.0% -20.0% -15.0% -10.0% -5.0% 0.0% 5.0%
Mexican Peso
Colombian Peso
Norwegian Krone
Namibian Dollar
Indonesian Rupiah
Tuvaluan Dollar
Icelandic Krona
Georgian Lari
Turkish Lira
Malaysian Ringgit
Kazakhstani Tenge
Thai Baht
South Korean Won
Argentine Peso
Nepalese Rupee
Mozambican Metical
Albanian Lek
Ugandan Shilling
Central African CFA Franc BEAC
Bosnian Convertible Mark
Sri Lankan Rupee
Chinese Yuan Renminbi
Algerian Dinar
IMF Special Drawing Rights
Swiss Franc
Congolese Franc
Taiwan New Dollar
Rwandan Franc
Guinean Franc
Philippine Peso
Kyrgyzstani Som
Cambodian Riel
North Korean Won
Turkmenistani Manat
Bahraini Dinar
Emirati Dirham
Omani Rial
Salvadoran Colon
Venezuelan Bolívar
Belizean Dollar
Iraqi Dinar
Nicaraguan Cordoba
Uzbekistani Som
Bolivian Bolíviano
Afghan Afghani
Exchange rate changes to the US Dollar Jan-Mar 2020


CA8430EN/1/04.20