Embed Size (px)
Citation preview

1
COVID-19 case doubling time associated with non-pharmaceutical
interventions and vaccination: a global experience
SUPPLEMENTARY DOCUMENT
Appendix S1 Flow chart of the study sample
Appendix S2 Sample countries, observed country days and government effectiveness scores
Appendix S3 Policy measures based on the Oxford COVID-19 Government Response Tracker
(OxCGRT) indicators
Appendix S4 Frequency and average duration of policy measures
Appendix S5 Summary of model variables
Appendix S6 Number of countries implemented the 11 policy measures by calendar date
Appendix S7 Results from regressions for COVID-19 case doubling time
Appendix S8 Sensitivity analysis: results from alternative specifications
Appendix S9 Residual diagnostics
Appendix S10 Cross validation of the study results
Appendix S11 Predicted versus observed trends of case doubling time for 137 countries

2
Appendix S1 Flow chart of the study sample
Figure S1. Flow chart of 137 countries analysed in this study
Downloaded data from Oxford COVID-19 Government Response
Tracker (OxCGRT) on 19 June 2021. 186 countries were identified in
the database.
4 countries/regions were removed due to data for total confirmed
COVID-19 cases were missing or decreasing over time:
- Benin, Guyana, Tonga, Turkmenistan
Merged with World Development Indicators
(WDI) data. Kosovo and Taiwan were removed
due to not in the WDI database.
Merged with Worldwide Governance
Indicators (WGI) data. Faeroe Islands was
removed due to not in the WGI database.
42 countries/regions were removed due to the following exclusion criterion:
(a) fewer than 500 confirmed cases as of 13 June 2021; (b) missing data in the OxCGRT database for
more than 90 days; (c) fewer than 1 million populations, and (d) fewer than 40 observations for the
case doubling time variable.
137 countries

3
Appendix S2 Sample countries, observed country days and government effectiveness scores
The study sample is composed of 137 countries over the period of 1st January 2020 – 13rd June,
2021. Observed country days refers to days since the first reported COVID-19 case until the last day
after which the case doubling time (the outcome variable) could not be calculated. See Methods for
calculation of case doubling time. The government effectiveness scores range from -2.5 to 2.5, with a
higher value indicating higher government effectiveness. We applied the latest 2019 scores. For
subgroup analysis presented in Figure 3 in the main text, we ranked countries according to their
effectiveness scores and divided them into three equal-sized groups: low, medium and high, denoted
by L, M, and H, respectively in Table S2.
Table S2. Sample countries, observed country days and government effectiveness scores
Country ISO code Continent Observed
days
Government effectiveness
Score Level
Afghanistan AFG Asia 266 -1.46 L
Angola AGO Africa 297 -1.12 L
Albania ALB Europe 312 -0.06 M
United Arab Emirates ARE Asia 359 1.38 H
Argentina ARG South America 356 -0.09 M
Australia AUS Oceania 183 1.57 H
Austria AUT Europe 293 1.49 H
Azerbaijan AZE Asia 286 -0.14 M
Burundi BDI Africa 352 -1.33 L
Belgium BEL Europe 287 1.03 H
Burkina Faso BFA Africa 297 -0.76 L
Bangladesh BGD Asia 242 -0.74 L
Bulgaria BGR Europe 310 0.34 H
Bahrain BHR Asia 368 0.30 M
Bosnia and Herzegovina BIH Europe 286 -0.63 L
Belarus BLR Europe 313 -0.18 M
Bolivia BOL South America 315 -0.70 L
Brazil BRA South America 331 -0.19 M
Botswana BWA Africa 339 0.43 H
Central African Republic CAF Africa 106 -1.75 L
Canada CAN North America 356 1.73 H
Switzerland CHE Europe 286 1.95 H
Chile CHL South America 348 1.06 H
Cote d'Ivoire CIV Africa 297 -0.48 M
4
Cameroon CMR Africa 370 -0.81 L
Democratic Republic of Congo COD Africa 295 -1.63 L
Congo COG Africa 274 -1.39 L
Colombia COL South America 316 0.07 M
Costa Rica CRI North America 304 0.42 H
Czech Republic CZE Europe 316 0.89 H
Germany DEU Europe 346 1.59 H
Denmark DNK Europe 301 1.94 H
Dominican Republic DOM North America 288 -0.36 M
Algeria DZA Africa 264 -0.52 M
Ecuador ECU South America 314 -0.40 M
Egypt EGY Africa 321 -0.42 M
Spain ESP Europe 331 1.00 H
Estonia EST Europe 367 1.17 H
Ethiopia ETH Africa 316 -0.63 L
Finland FIN Europe 374 1.93 H
France FRA Europe 362 1.38 H
Gabon GAB Africa 335 -0.90 L
United Kingdom GBR Europe 331 1.44 H
Georgia GEO Asia 288 0.83 H
Ghana GHA Africa 218 -0.21 M
Guinea GIN Africa 228 -0.78 L
Gambia GMB Africa 168 -0.63 L
Greece GRC Europe 377 0.41 H
Guatemala GTM North America 290 -0.68 L
Honduras HND North America 301 -0.61 L
Croatia HRV Europe 294 0.41 H
Haiti HTI North America 169 -2.02 L
Hungary HUN Europe 355 0.50 H
Indonesia IDN Asia 326 0.18 M
India IND Asia 443 0.17 M
Ireland IRL Europe 314 1.28 H
Iran IRN Asia 362 -0.55 M
Iraq IRQ Asia 336 -1.34 L
Israel ISR Asia 314 1.33 H
Italy ITA Europe 336 0.46 H
Jamaica JAM North America 358 0.50 H
Jordan JOR Asia 347 0.10 M

5
Japan JPN Asia 374 1.59 H
Kazakhstan KAZ Asia 320 0.12 M
Kenya KEN Africa 267 -0.38 M
Kyrgyz Republic KGZ Asia 221 -0.68 L
Cambodia KHM Asia 469 -0.58 L
South Korea KOR Asia 366 1.38 H
Kuwait KWT Asia 342 0.02 M
Laos LAO Asia 406 -0.78 L
Lebanon LBN Asia 335 -0.83 L
Liberia LBR Africa 161 -1.38 L
Libya LBY Africa 272 -1.92 L
Sri Lanka LKA Asia 462 -0.11 M
Lesotho LSO Africa 242 -0.83 L
Lithuania LTU Europe 305 1.04 H
Latvia LVA Europe 338 1.11 H
Morocco MAR Africa 253 -0.12 M
Moldova MDA Europe 282 -0.38 M
Madagascar MDG Africa 354 -1.14 L
Mexico MEX North America 287 -0.16 M
Mali MLI Africa 281 -1.06 L
Myanmar MMR Asia 236 -1.15 L
Mongolia MNG Asia 418 -0.19 M
Mozambique MOZ Africa 312 -0.82 L
Mauritania MRT Africa 270 -0.50 L
Mauritius MUS Africa 372 0.87 H
Malawi MWI Africa 290 -0.75 L
Malaysia MYS Asia 420 1.00 H
Namibia NAM Africa 311 0.10 M
Niger NER Africa 277 -0.80 L
Nigeria NGA Africa 302 -1.09 L
Nicaragua NIC North America 137 -0.77 L
Netherlands NLD Europe 314 1.80 H
Norway NOR Europe 344 1.86 H
Nepal NPL Asia 407 -1.05 L
New Zealand NZL Oceania 46 1.67 H
Oman OMN Asia 259 0.26 M
Pakistan PAK Asia 305 -0.68 L
Panama PAN North America 279 0.07 M

6
Peru PER South America 294 -0.07 M
Philippines PHL Asia 416 0.05 M
Papua New Guinea PNG Oceania 386 -0.81 L
Poland POL Europe 320 0.60 H
Portugal PRT Europe 308 1.15 H
Paraguay PRY South America 380 -0.53 M
Qatar QAT Asia 151 0.71 H
Romania ROU Europe 289 -0.28 M
Russia RUS Europe 316 0.15 M
Rwanda RWA Africa 307 0.19 M
Saudi Arabia SAU Asia 133 0.31 M
Senegal SEN Africa 303 -0.06 M
Singapore SGP Asia 122 2.22 H
Sierra Leone SLE Africa 182 -1.13 L
El Salvador SLV North America 249 -0.47 M
Serbia SRB Europe 310 0.02 M
Slovak Republic SVK Europe 306 0.67 H
Slovenia SVN Europe 306 1.08 H
Sweden SWE Europe 355 1.83 H
Eswatini SWZ Africa 293 -0.68 L
Chad TCD Africa 296 -1.57 L
Togo TGO Africa 358 -0.92 L
Thailand THA Asia 467 0.36 H
Tajikistan TJK Asia 76 -1.05 L
Timor-Leste TLS Asia 413 -0.88 L
Trinidad and Tobago TTO North America 425 0.10 M
Tunisia TUN Africa 322 -0.10 M
Turkey TUR Asia 349 0.05 M
Uganda UGA Africa 276 -0.59 L
Ukraine UKR Europe 311 -0.30 M
Uruguay URY South America 404 0.70 H
United States USA North America 328 1.49 H
Uzbekistan UZB Asia 190 -0.51 M
Vietnam VNM Asia 488 0.04 M
South Africa ZAF Africa 286 0.37 H
Zambia ZMB Africa 322 -0.68 L
Zimbabwe ZWE Africa 295 -1.21 L

7
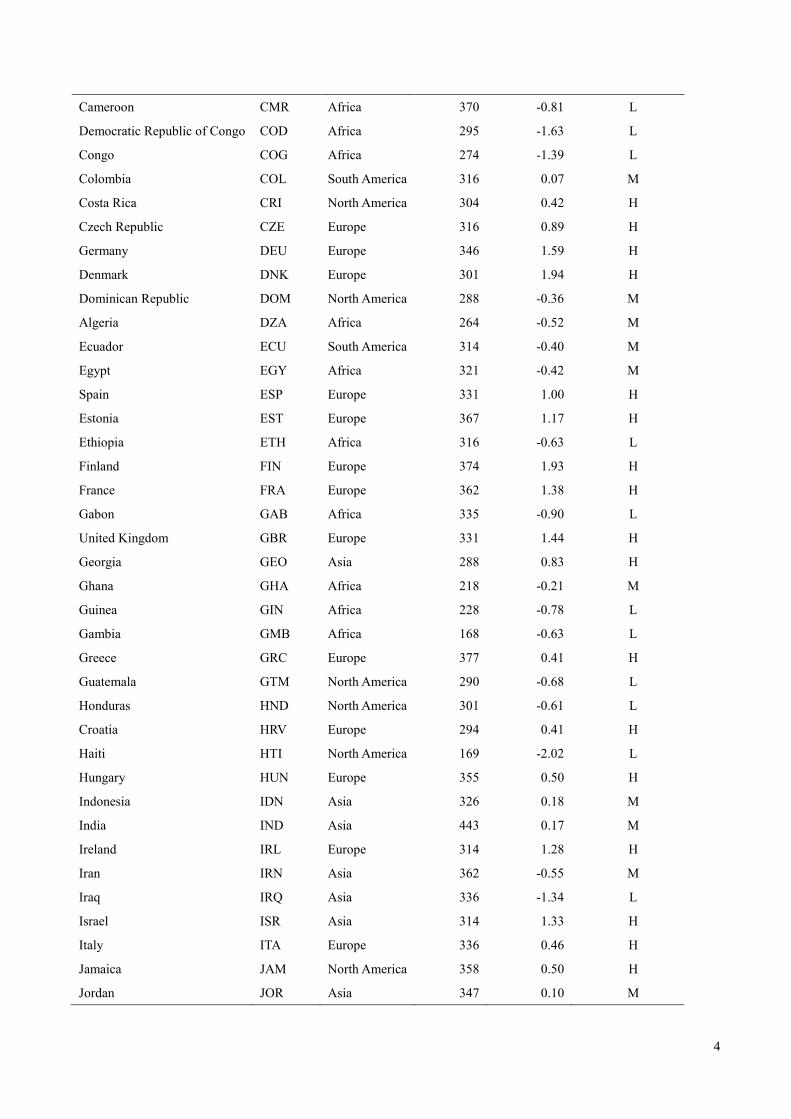
Appendix S3 Policy measures based on the Oxford COVID-19 Government Response Tracker
(OxCGRT) indicators
Table S3 provides the definition of policy measures used in this study and the corresponding
OxCGRT indicators. We focused on interventions that were actually enforced; thus for most
OxCGRT indicators, degree of 0 and 1 were treated as the reference group, i.e. no measures. In
addition, we combined the highest two degrees for stay-at-home requirements, testing policies, and
face covering. For vaccine rollout, we combined degrees of 1−5 into a single category because the
number of country-days for individual degrees was relatively small.
Table S3. Policy measures based on Oxford COVID-19 Government Response Tracker (OxCGRT)
indicators
OxCGRT indicators Policy measures in this study
Degree School closures
0 No measures No measures
1 Recommend closing No measures
2 Require closing (some levels or categories) Partial closures
3 Require closing (all levels) Full closures
Degree Workplace closures, or work-from-home
0 No measures No measures
1 Recommend closing No measures
2 Require closing (some sectors or categories) Partial closures
3 Require closing (all-but-essential workplaces) Full closures
Degree Cancellation of public events
0 No measures No measures
1 Recommend cancelling No measures
2 Require cancelling Requirement of cancellation
Degree Restrictions on gathering size
0 No restriction No limits or up to 1000 people
1 Restrictions on gatherings above 1000 people No limits or up to 1000 people
2 Restrictions on gatherings between 101-1000 people No limits or up to 1000 people
3 Restrictions on gatherings between 11-100 people Up to 100 people
4 Restrictions on gatherings of 10 people or less Up to 10 people
8
Degree Requirements to stay-at-home
0 No measures No measures
1 Recommend not leaving house No measures
2 Require not leaving house with exceptions for daily
exercise, grocery shopping and essential trips
Required, with exceptions
3 Require not leaving house with minimal exceptions Required, with exceptions
Degree Restrictions on international travel
0 No measures No international travel bans
1 Screening No international travel bans
2 Quarantine arrivals from high-risk regions No international travel bans
3 Ban on arrivals from some regions Bans on arrivals from some regions
4 Ban on all regions or total border closure Bans on arrivals from all regions
Degree Public information campaigns
0 No campaigns No or limited campaigns
1 Public officials urging caution about COVID-19 No or limited campaigns
2 Coordinated public information campaign Coordinated public campaigns
Degree Testing policy
0 No testing policy No or limited testing
1 Only those who meet specific criteria and have symptoms No or limited testing
2 Testing of anyone with COVID-19 symptoms Widespread testing
3 Open public testing Widespread testing
Degree Contact tracing
0 No contact tracing No or limited contact tracing
1 Contact tracing not done for all cases No or limited contact tracing
2 Contact tracing done for all identified cases Comprehensive contact tracing
Degree Face covering
0 No policy No measures
1 Recommended No measures
2 Required in some specified shared/public spaces Required in some places
3 Required in all shared/public spaces Required in all places
4 Required outside the home at all times Required in all places
Degree Vaccination policy
0 No availability No vaccination

9
1 Availability for one of the following: key
workers/clinically vulnerable groups/elderly groups
Vaccine rollout
2 Availability for two of the following: key
workers/clinically vulnerable groups/elderly groups
Vaccine rollout
3 Availability for all of the following: key workers/clinically
vulnerable groups/elderly groups
Vaccine rollout
4 Availability for all three plus partial additional availability Vaccine rollout
5 Universal availability Vaccine rollout
Note: Data for OxCGRT indicators were retrieved from https://COVIDtracker.bsg.ox.ac.uk/,
on 19 June, 2021. Data source: Hale Thomas, Sam Webster, Anna Petherick, Toby Phillips, and Beatriz Kira (2021). Oxford COVID-
19 Government Response Tracker, Blavatnik School of Government.

10
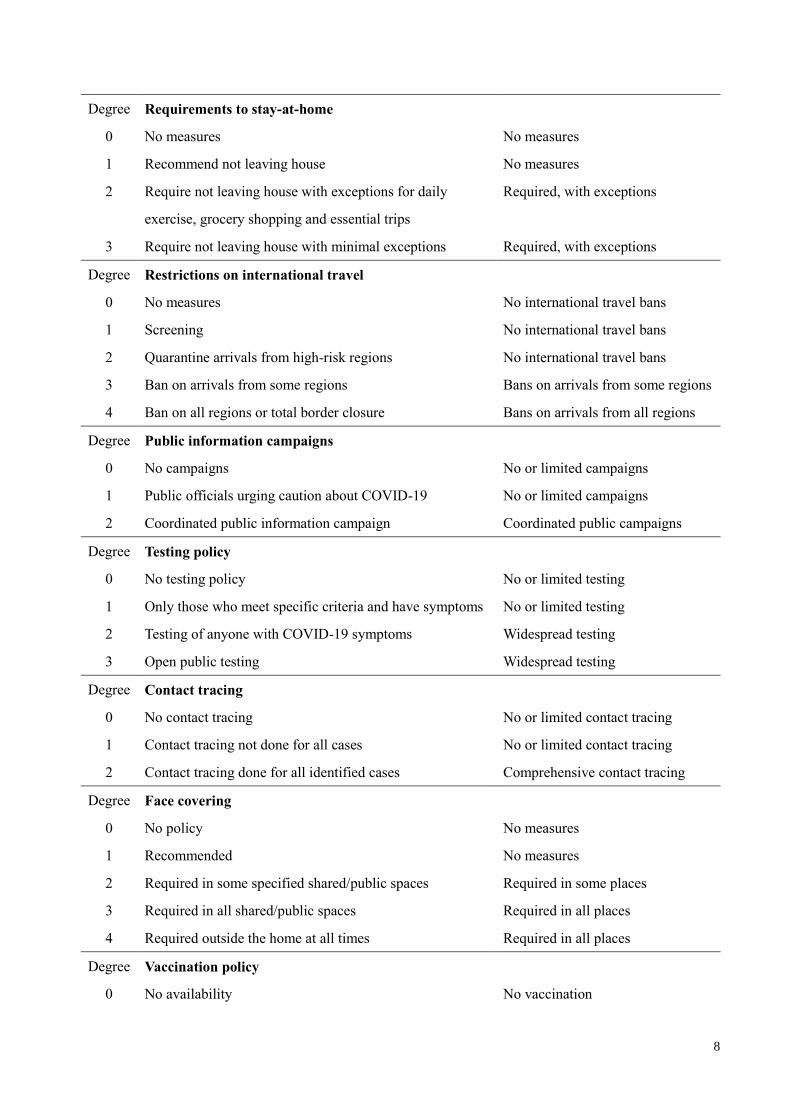
Appendix S4 Frequency and average duration of policy measures
Figures in Table S4 were calculated based on 137 sample countries over the period of 1st
January 2020 – 13rd June, 2021. The most frequently adopted policy was “workplace closures for
some sectors or categories” (355 times), followed by “requirements to stay-at-home with exceptions
for daily exercise, grocery shopping and essential trips” (289 times), and school closures at all levels
(272 times). With respect to average duration, coordinated public information campaigns had the
longest days (358 days), followed by comprehensive contact tracing (218 days) and cancellation of
public events (168 days).
Table S4. Frequency and average duration of COVID-19 policy measures
OxCGRT policy indicator
Total
country
days
Frequency
of adoption
Average
number of
days
Degree School closures
1 Recommend closing 14477 201 72.02
2 Require closing (some levels or categories) 15468 266 58.15
3 Require closing (all levels) 26856 272 98.74
Degree Workplace closures, or work-from-home
1 Recommend closing 12841 187 68.67
2 Require closing (some sectors or categories) 31102 355 87.61
3 Require closing (all-but-essential workplaces) 9832 216 45.52
Degree Cancellation of public events
1 Recommend cancelling 12400 202 61.39
2 Require cancelling 44159 263 167.90
Degree Restrictions on gathering size
1 Restrictions on gatherings above 1000 people 1687 43 39.23
2 Restrictions on gatherings between 101-1000 people 6062 129 46.99
3 Restrictions on gatherings between 11-100 people 19109 264 72.38
4 Restrictions on gatherings of 10 people or less 28992 248 116.90
Degree Requirements to stay-at-home
1 Recommend not leaving house 18622 256 72.74
2 Require not leaving house with exceptions for daily
exercise, grocery shopping and essential trips 24356 289 84.28
3 Require not leaving house with minimal exceptions 3546 84 42.21
Degree Restrictions on international travel
1 Screening 10674 175 60.99

11
2 Quarantine arrivals from high-risk regions 13578 226 60.08
3 Ban on arrivals from some regions 21761 257 84.67
4 Ban on all regions or total border closure 18685 169 110.56
Degree Public information campaigns
1 Public officials urging caution about COVID-19 4448 89 49.98
2 Coordinated public information campaign 61253 171 358.20
Degree Testing policy
1 Only those who meet specific criteria and have
symptoms 21365 163 131.07
2 Testing of anyone with COVID-19 symptoms 26265 163 161.14
3 Open public testing 16210 118 137.37
Degree Contact tracing
1 Contact tracing not done for all cases 23557 164 143.64
2 Contact tracing done for all identified cases 34397 158 217.70
Degree Face covering
1 Recommended 4071 65 62.63
2 Required in some specified shared/public spaces 9653 115 83.94
3 Required in all shared/public spaces 27124 199 136.30
4 Required outside the home at all times 13777 112 123.01
Degree Vaccination policy
1 Availability for one of the following: key
workers/clinically vulnerable groups/elderly groups 2639 86 30.69
2 Availability for two of the following: key
workers/clinically vulnerable groups/elderly groups 4693 102 46.01
3 Availability for all of the following: key
workers/clinically vulnerable groups/elderly groups 5250 114 46.05
4 Availability for all three plus partial additional
availability 2533 85 29.80
5 Universal availability 1280 30 42.67

12
Appendix S5 Summary of model variables
Table S5 summarises model variables based on the full sample, which had 4,2012 country days.
The table excludes all the squared terms in the Equation (1) in the main text. The mean log of case
doubling time was 3.8. The mean number of weeks from the first reported death to the earliest
intervention was −7.26, indicating that countries generally adopted at least one policy measure
before the first death was reported.
Table S5. Descriptive statistics of model variables
Variables Mean SD Min. Max.
Case doubling time (days, log) 3.80 1.14 0 6.05
Number of days since the first confirmed case 163.50 101.68 1 488
Number of days since the most recent implementation at date t
(0 if no policy at date t)
Partial school closures 10.61 26.49 0 207
Full school closures 45.00 69.31 0 349
Partial workplace closures 38.55 60.95 0 357
Full workplace closures 5.19 18.50 0 266
Cancellation of public events 77.83 85.93 0 418
Restriction on gatherings to 100 people 21.94 49.53 0 358
Restriction on gatherings to 10 people 35.42 62.81 0 341
Stay-at-home requirements 26.99 50.50 0 328
Bans on arrivals from some regions 25.46 54.39 0 325
Bans on arrivals from all regions 28.56 55.22 0 416
Coordinated public campaigns 151.80 104.21 0 487
Widespread testing 66.34 83.26 0 408
Comprehensive contact tracing 72.61 96.60 0 452
Face covering required in some places 13.48 41.90 0 328
Face covering required in all places 51.42 71.39 0 373
COVID-19 vaccine rollout 0.90 5.79 0 113
Government effectiveness scores (-2.5 – 2.5) 0.04 0.93 -2.02 2.22
Number of weeks from first death to the earliest policy -7.26 11.29 -61.14 1
Population (log) 16.58 1.41 13.96 21.05
Population aged 65 and above (%) 9.63 6.85 1.16 28.00
Number of people per squared kilometre of land area (hundreds) 1.74 4.82 0.02 79.53
Universal Health Coverage service coverage index (0–100) 65.38 15.09 28 89

13
GDP per capita adjusted by purchasing power parity (current
international dollars, log)
9.43 1.15 6.62 11.49
Death caused by communicable diseases and
maternal/prenatal/nutrition conditions (%)
21.62 20.28 1.3 65.3
Europe (=1) 0.26 0.44 0 1
Africa (=1) 0.28 0.45 0 1
Asia (=1) 0.29 0.45 0 1
North America (=1) 0.09 0.29 0 1
South America (=1) 0.07 0.26 0 1
Oceania (=1) 0.01 0.12 0 1
Note: N=42,102 country days. Data for government effectiveness scores were retrieved from Worldwide Governance Indicator
Database at http://info.worldbank.org/governance/wgi/#home. Data for country characteristics were collected from World
Development Indicators (WDI) at https://datatopics.worldbank.org/world-development-indicators/. The latest year WDI were available
for most countries was: year 2019 for population size, percentage of old people, and GDP per capita; year 2018 for population density;
year 2017 for University Health Coverage index, and year 2016 for cause of death. When a country had missing data in the designated
year, we replaced that missing value with the country’s recoded value from the previous one or two years.

14
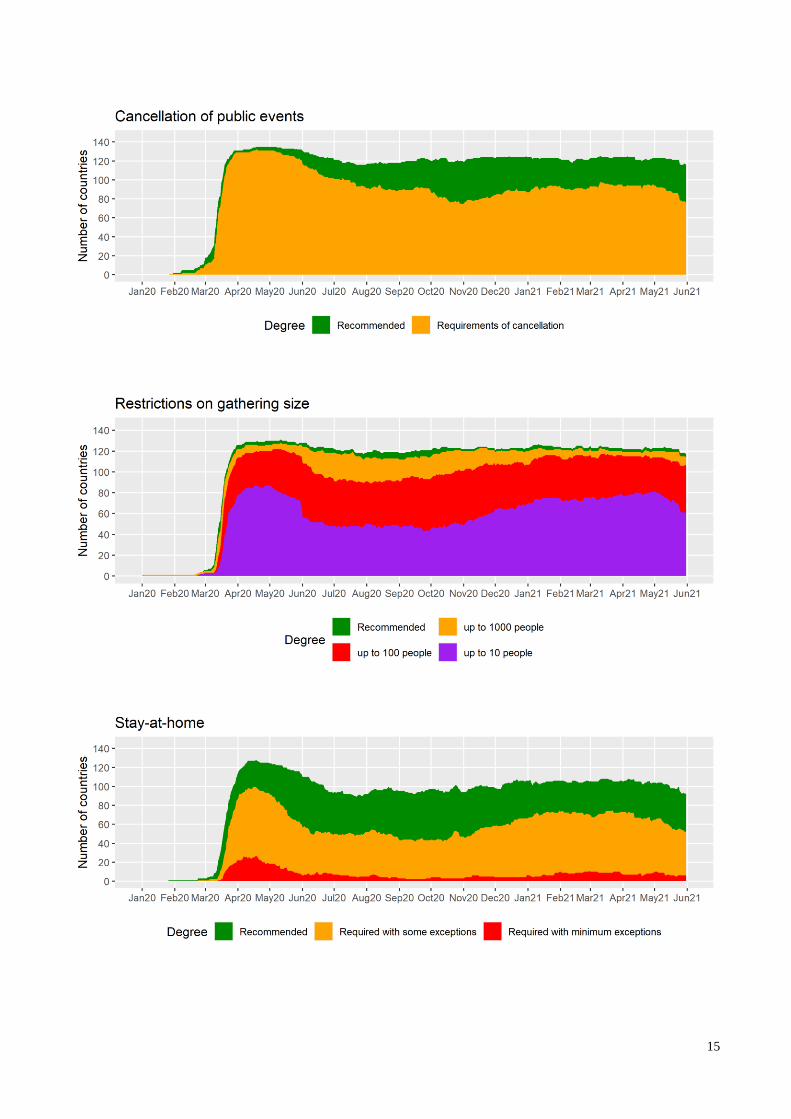
Appendix S6 Number of countries implemented the 11 policy measures by calendar date
Figure S6 illustrates the number of countries out of 137 sample countries that adopted
respective policy measures each day from 1 January 2020 to May 31 2021. The X-axis denotes
calendar date. For example, Jan20 refers to January 2020, and May21 refers to May 2021. Data for
all policy measures were obtained from Oxford COVID-19 Government Response Tracker
(OxCGRT) indicators database.
15

16

17
Figure S6. Number of countries implemented the 11 policy measures by calendar date.

18
Appendix S7 Results from regressions for COVID-19 case doubling time
Table S7.1 Results from regressions based on the full sample and by outbreak stages
Y: case doubling time (in log days) Full
sample
Subsample regressions by outbreak stages (cases)
<5,000 <20,000 <80,000 <320,000 <1,280,000
Predictors Coef. Coef. Coef. Coef. Coef. Coef.
No. of days since the most recent implementation
Partial school closures 0.0138*** 0.0008 0.0070* 0.0120*** 0.0127*** 0.0132***
Full school closures 0.0040** 0.0077* 0.0061* 0.0051* 0.0037* 0.0038**
Partial workplace closures 0.0009 0.0011 -0.0008 -0.0012 0.0005 0.0003
Full workplace closures 0.0141*** 0.0384*** 0.0312*** 0.0227*** 0.0248*** 0.0158***
Cancellation of public events 0.0021 0.0058** 0.0039 0.0019 0.0021 0.0017
Restriction on gatherings to 100 people 0.0028 -0.0039 -0.0021 0.0014 0.0021 0.0023
Restriction on gatherings to 10 people 0.003 0.0074 0.0077* 0.0046 0.0050** 0.0041*
Stay-at-home requirements 0.0015 0.0056* 0.0012 0.0018 0.002 0.0018
Bans on arrivals from some regions -0.0004 0.0033 0.0022 0.0021 0.0013 0.0002
Bans on arrivals from all regions 0.0018 0.0064* 0.002 0.003 0.0031 0.0021
Coordinated public campaigns 0.0039 0.0086** 0.0037 0.0036 0.0034 0.0038
Widespread testing -0.0023 -0.0022 -0.0022 -0.0029 -0.002 -0.0021
Comprehensive contact tracing -0.0019 -0.0017 0.0000 -0.0003 -0.0022 -0.0024
Face covering required in some places -0.0003 -0.004 0.0001 0.0021 0.0005 0.0000
Face covering required in all places -0.0001 0.0066* 0.0011 0.0012 0.0019 0.001
COVID-19 vaccine rollout 0.0196** 0.0176 0.019 0.0304** 0.0151* 0.0208**
Government effectiveness scores (-25 – 25) 0.0226* 0.0257* 0.0326** 0.0319** 0.0281** 0.0244*
No. of weeks from 1st death to earliest policy -0.014 -0.0164* -0.0125 -0.0129 -0.015 -0.0143
Population (log) -0.1607*** -0.1031* -0.1609*** -0.1668*** -0.1634*** -0.1553***
Population aged 65 and above (%) 0.0344 0.0261 0.0325 0.038 0.0384* 0.034
No. of people per km2 of land area -0.0083* -0.0038 -0.0073 -0.0095* -0.0086* -0.0081*
UHC service coverage index (0–100) 0.0046 -0.0062 -0.0026 -0.0021 0.0043 0.0044
GDP per capita adjusted by PPP (log) -0.2255* -0.1861 -0.3054** -0.2943** -0.2716* -0.2344*
Death caused by communicable diseases (%) 0.0024 -0.0042 -0.0048 -0.0021 0.0026 0.0024
Africa (=1) 0.0468 0.2711 0.2351 0.0913 0.0039 0.0361
Asia (=1) 0.2627 0.3215 0.4012 0.3197 0.2443 0.2534
North America (=1) -0.3071 0.073 -0.1478 -0.3013 -0.4304 -0.3499
South America (=1) -0.3705 -0.0528 -0.1231 -0.2351 -0.4141 -0.4043
Oceania (=1) 0.5917* 0.4409* 0.4683* 0.4591* 0.5520* 0.6089*
Number of observations (country days) 42102 17353 24762 31658 37935 40804
Note: UHC=universal health coverage; GDP=gross domestic product. Note: All models included the time trend, quadratic terms of
time and policy variables, and country-specific random intercepts and random coefficients of time. Country-clustered robust standard
errors were used. Legend: * p<0.05; ** p<0.01; *** p<0.001.

19
Table S7.2 Results from regressions by levels of government effectiveness
Y: case doubling time (in log days) Subsample regressions by government effectiveness
High Medium Low
Predictors Coef. Coef. Coef.
No. of days since the most recent implementation
Partial school closures 0.0163*** 0.0115** 0.007
Full school closures 0.0095* 0.0008 0.0036
Partial workplace closures 0.0026 -0.001 0.0024
Full workplace closures 0.0205*** 0.0116* 0.0125*
Cancellation of public events 0.0054** 0.0043 -0.0004
Restriction on gatherings to 100 people 0.0009 0.0028 0.0024
Restriction on gatherings to 10 people 0.0076*** 0.0015 -0.0035
Stay-at-home requirements 0.0075* 0.002 0.0004
Bans on arrivals from some regions 0.0022 -0.0028 0.0009
Bans on arrivals from all regions 0.0065* -0.0002 0.0009
Coordinated public campaigns 0.0042 0.0016 -0.0017
Widespread testing -0.0036 0.0016 -0.005
Comprehensive contact tracing -0.0008 0.0006 -0.0021
Face covering required in some places 0.0001 -0.0021 0.0086
Face covering required in all places 0.0000 -0.0008 0.003
COVID-19 vaccine rollout 0.0265* 0.0173 0.0031
Government effectiveness scores (-25 – 25) 0.0041 -0.0295 0.0159
No. of weeks from 1st death to earliest policy 0.0840** -0.0028 -0.0191*
Population (log) -0.2616*** -0.0941** -0.091
Population aged 65 and above (%) 0.0217 0.0435* -0.0748
No. of people per km2 of land area 0.0029 -0.0057 -0.0317
UHC service coverage index (0–100) 0.0236 0.0051 0.0032
GDP per capita adjusted by PPP (log) -0.2078 0.0587 -0.1911
Death caused by communicable diseases (%) -0.0164 0.0024 0.0064
Africa (=1) 0.796 0.4624 -1.723
Asia (=1) 0.5214* 0.4272 -1.0284
North America (=1) -0.4599 0.0007 -1.5287
South America (=1) -0.1965 -0.2 -1.5947
Oceania (=1) 0.621 (omitted) -1.1063
Number of countries 46 45 46
Number of observations 14661 14294 13147
Note: UHC=universal health coverage; GDP=gross domestic product. PPP=purchasing power parity. Note: All models included the
time trend, quadratic terms of time and policy variables, and country-specific random intercepts and random coefficients of time.
Country-clustered robust standard errors were used. Legend: * p<0.05; ** p<0.01; *** p<0.001

20
Appendix S8 Sensitivity analysis: results from alternative specifications
Sensitivity analysis was conducted to check the robustness of the study results. We examined
the collinearity by calculating the correlation coefficient (cc) of each pair of policy variables, and
excluded those that had a cc greater than 0.4. As Table S8.1 shows (figures in bold), cancellation of
public events (ID=5) was highly correlated with full school closures (0.42), partial workplace
closures (0.41) and restriction on gatherings to 10 people (0.44). Coordinated public campaigns
(ID=11) was highly correlated with widespread testing (0.46), comprehensive contact tracing (0.49),
and face covering required in all places (0.46). Therefore, we excluded these two policy measures
one by one from the main model. The results are presented under the heading of Model S1 and
Model S2 in Table S8.2. We found that results from alternative specifications are generally consistent
with those from the main model, except that in Model S1 “Restriction on gatherings to 10 people”
became positively associated with prolonged case doubling time.

21
Table S8.1 Pairwise correlation coefficients between policy variables
Policy measures ID 1 2 3 4 5 6 7 8 9 10 11 12 13 14 15 16
Partial school closures 1 1.00
Full school closures 2 -0.26 1.00
Partial workplace closures 3 0.14 0.16 1.00
Full workplace closures 4 -0.08 0.23 -0.18 1.00
Cancellation of public events 5 0.09 0.42 0.41 0.12 1.00
Restriction on gatherings to 100 people 6 0.09 0.00 -0.07 -0.05 0.15 1.00
Restriction on gatherings to 10 people 7 0.00 0.25 0.30 0.08 0.44 -0.25 1.00
Stay-at-home requirements 8 -0.01 0.28 0.13 0.25 0.36 0.20 0.21 1.00
Bans on arrivals from some regions 9 0.01 -0.08 0.11 0.00 0.13 -0.07 0.18 -0.01 1.00
Bans on arrivals from all regions 10 -0.03 0.20 0.09 0.04 0.20 0.04 0.12 0.07 -0.24 1.00
Coordinated public campaigns 11 0.15 0.10 0.31 -0.02 0.35 0.15 0.20 0.21 0.23 0.08 1.00
Widespread testing 12 0.06 0.11 0.18 -0.01 0.29 0.01 0.19 0.09 0.25 0.01 0.46 1.00
Comprehensive contact tracing 13 0.11 -0.01 0.23 0.02 0.18 -0.03 0.09 0.11 0.07 0.07 0.49 0.29 1.00
Face covering required in some places 14 0.06 -0.07 0.13 0.07 0.07 -0.07 -0.03 -0.08 0.19 0.02 0.17 0.17 0.15 1.00
Face covering required in all places 15 0.08 0.20 0.20 -0.03 0.35 0.27 0.24 0.32 0.01 0.02 0.46 0.23 0.25 -0.23 1.00
COVID-19 vaccine rollout 16 0.01 -0.01 0.07 0.04 0.10 0.01 0.10 0.04 0.04 0.04 0.31 0.15 0.17 0.00 0.17 1.00

22
Table S8.2 Results from alternative model specifications
Y: case doubling time (in log days) Main model Model S1 Model S2
Predictors Coef. Coef. Coef.
No. of days since the most recent implementation
Partial school closures 0.0138*** 0.0141*** 0.0139***
Full school closures 0.0040** 0.0043** 0.0039**
Partial workplace closures 0.0009 0.0015 0.001
Full workplace closures 0.0141*** 0.0143*** 0.0143***
Cancellation of public events 0.0021 0.0021
Restriction on gatherings to 100 people 0.0028 0.0034 0.0029
Restriction on gatherings to 10 people 0.003 0.0037** 0.0029
Stay-at-home requirements 0.0015 0.002 0.0014
Bans on arrivals from some regions -0.0004 -0.0004 -0.0002
Bans on arrivals from all regions 0.0018 0.0022 0.0019
Coordinated public campaigns 0.0039 0.0042
Widespread testing -0.0023 -0.0021 -0.002
Comprehensive contact tracing -0.0019 -0.002 -0.0018
Face covering required in some places -0.0003 -0.0001 -0.0005
Face covering required in all places -0.0001 0.0002 0.0001
COVID-19 vaccine rollout 0.0196** 0.0209** 0.0196**
Government effectiveness scores (-25 – 25) 0.0226* 0.0232* 0.0244**
Number of weeks from first death to the earliest policy -0.014 -0.0137 -0.0143*
Population (log) -0.1607*** -0.1604*** -0.1699***
Population aged 65 and above (%) 0.0344 0.0339 0.0343
Number of people per km2of land area -0.0083* -0.0082* -0.0079*
Universal Health Coverage service coverage index (0–100) 0.0046 0.0044 0.0043
GDP per capita adjusted by purchasing power parity (log) -0.2255* -0.2323* -0.2362*
Death caused by communicable diseases (%) 0.0024 0.002 0.0029
Africa (=1) 0.0468 0.0439 0.0293
Asia (=1) 0.2627 0.2585 0.2781
North America (=1) -0.3071 -0.3142 -0.2977
South America (=1) -0.3705 -0.3682 -0.3554
Oceania (=1) 0.5917* 0.5911* 0.5890*
Number of countries 137 137 137
Number of observations (country days) 42102 42103 42103
Note: All models included the time trend, quadratic terms of time and policy variables, and country-specific random intercepts and
random coefficients of time. Country-clustered robust standard errors were used. Legend: * p<0.05; ** p<0.01; *** p<0.001.

23
Appendix S9 Residual diagnostics
a. Distribution of predicted random intercepts for 137 countries
b. Distribution of predicted random slopes for 137 countries
Figure S9. Residual diagnostics. This study used the empirical Bayes prediction method to assign values to
country-specific random intercepts and random slopes, and assumed that they have a normal distribution. a.
Distribution of predicted random intercepts for 137 countries. b. Distribution of predicted random slopes for
137 countries. Predicted random slopes are positively skewed, but in general predicted random effects are
close to normal distributions.

24
Appendix S10 Cross validation of the study results
To check the stability and robustness of the study results, a cross-validation method was
applied. First, we randomly assigned 50% of the data for individual countries as the training data,
and saved the remaining data for testing (validation). Second, we ran the regression (Equation (1) in
the main text) using the training data to obtain coefficient estimates and country-specific random
intercepts and slopes of time. Third, we predicted the case doubling time (DT) for the testing data
using the estimated model and compared the fitted with observed DT (Table S10.1). The equation for
prediction is given by Equation (S1) in Appendix S11. Finally, the DT regression was run on the
testing data; the results were compared with those from the training data and from the full sample
(Table S10.2).
Table S10.1 shows that the root mean squared error (RMSE) calculated was only marginally
higher for testing (0.679) than for training (0.657) data. The correlation coefficient between fitted
and observed DT was only slightly lower for the testing data (0.802) than for the training data
(0.816). These results suggest that the study results seemed robust to different datasets. In addition,
Table S10.2 shows that the coefficient estimates were consistent for regressions using the full sample
(the main model), the training data and testing data.
We also performed random forest algorithm using Stata command rforest and compared the
prediction accuracy with that of the random-effect growth-curve model. The RMSE converged prior
to100 iterations; thus we set iterations to be 100. The lowest validation RMSE (calculated against the
testing data) occurred at 0.22 when the number of randomly selected variables at each split was 7.
This result shows that random forest model had a slightly higher prediction accuracy than the
empirical model used in this study. For the present study, the goal was to estimate the relative
effectiveness of a wide range of policy measures (which increased the RMSE); hence the random
forest model was used for validation only.
Table S10.1 Prediction accuracy based on RMSE and correlation coefficient
Root mean squared error Correlation coefficient
between fitted and observed DT
Own prediction from training data
(50% of the sample)
0.657 0.816
Prediction for testing data
(50% of the sample)
0.679 0.802

25
Table S10.2 Results from regressions using training and testing data
Y: case doubling time (in log days) Main model From
training data
From testing
data
Predictors Coef. Coef. Coef.
No. of days since the most recent implementation
Partial school closures 0.0138*** 0.0141*** 0.0135***
Full school closures 0.0040** 0.0039** 0.0040**
Partial workplace closures 0.0009 0.0008 0.001
Full workplace closures 0.0141*** 0.0135*** 0.0146***
Cancellation of public events 0.0021 0.0021 0.0022
Restriction on gatherings to 100 people 0.0028 0.0034 0.002
Restriction on gatherings to 10 people 0.003 0.0029 0.003
Stay-at-home requirements 0.0015 0.0017 0.0014
Bans on arrivals from some regions -0.0004 -0.0015 0.0008
Bans on arrivals from all regions 0.0018 0.0017 0.0017
Coordinated public campaigns 0.0039 0.0031 0.0043
Widespread testing -0.0023 -0.0019 -0.0026
Comprehensive contact tracing -0.0019 -0.0019 -0.0018
Face covering required in some places -0.0003 0.0002 -0.0011
Face covering required in all places -0.0001 -0.0002 0.0002
COVID-19 vaccine rollout 0.0196** 0.0195** 0.0203**
Government effectiveness scores (-25 – 25) 0.0226* 0.0229* 0.0202*
Number of weeks from first death to the earliest policy -0.014 -0.0126 -0.0116
Population (log) -0.1607*** -0.1485*** -0.1564***
Population aged 65 and above (%) 0.0344 0.0279 0.0289
Number of people per km2of land area -0.0083* -0.0066 -0.0077*
Universal Health Coverage service coverage index (0–100) 0.0046 0.0023 0.0033
GDP per capita adjusted by purchasing power parity (log) -0.2255* -0.1998 -0.1962
Death caused by communicable diseases (%) 0.0024 0.0032 0.0017
Africa (=1) 0.0468 -0.0648 0.0686
Asia (=1) 0.2627 0.2155 0.2541
North America (=1) -0.3071 -0.2842 -0.2881
South America (=1) -0.3705 -0.3754 -0.3365
Oceania (=1) 0.5917* 0.5 0.3409
Number of countries 137 137 137
Number of observations (country days) 42102 20959 21143
Note: All models included the time trend, quadratic terms of time and policy variables, and country-specific random intercepts and
random coefficients of time. Country-clustered robust standard errors were used. Legend: * p<0.05; ** p<0.01; *** p<0.001.

26
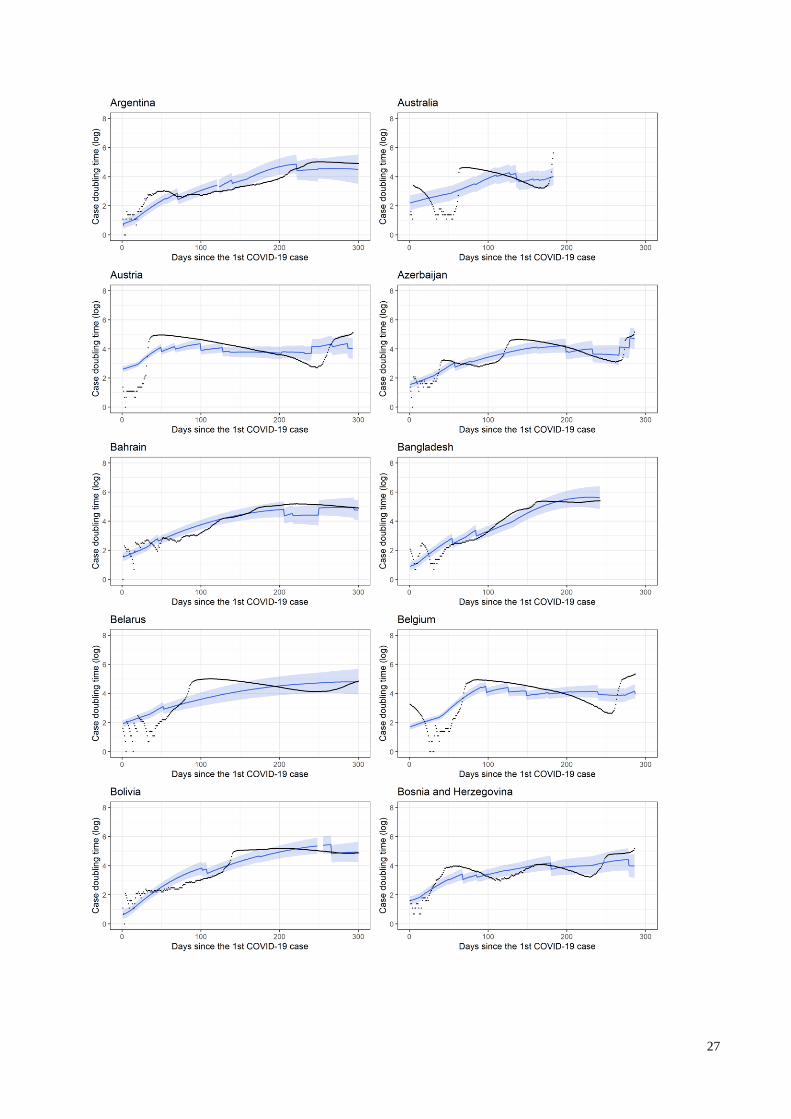
Appendix S11 Predicted versus observed trends of case doubling time for 137 countries
To examine the validity of the model, we predicted the case doubling time (DT) for individual
countries over time, and compared country-specific fitted regression lines with the real data, as
shown by figures below. Based on Equation (1) in the main text, the fitted DT was calculated as
follows:
�̂�𝑖𝑡 = 𝛼0̂ + 𝛼1̂𝑇𝑖𝑡 + 𝛼2̂𝑇𝑖𝑡2 + ∑ (�̃̂�𝑗
′ �̃�𝑗 + �̃̂�𝑗′�̃�𝑗)6
𝑗=1 + ∑ (�̃̂�𝑘′ �̃�𝑘 + �̃̂�𝑘
′ �̃�𝑘) + �̃̂�′�̃� + 𝜂1�̂� + 𝜂2�̂�𝑇𝑖𝑡5𝑘=1 . (S1)
Random intercepts and random slopes for individual countries were not estimated with other model
parameters. Instead, we assigned them values by using empirical Bayes predictions. The standard
practice is to assume that 𝜂1𝑖 and 𝜂2𝑖 have a normal prior distribution with a mean of zero and the
variance previously estimated by the maximum likelihood method. The normality assumption was
verified by residual diagnostics, as described in Appendix S9.
The following figures are displayed in the countries’ alphabetic order. The scattered black dots
represent observed data. The solid blue line is the predicted case doubling time (log). The shaded
area is the 95% confidence interval for the fixed part of the model.
27

28

29

30

31

32

33

34

35

36

37

38

39

40
Figure S11 Predicted versus observed trends of case doubling time for 137 countries