Embed Size (px)
Citation preview

Richard AboulafiaVice President, AnalysisTeal Group Corporation
www.tealgroup.com
Third Update; May 4, 2020
COVID-19 And Civil Aviation MarketsA Bit Like Falling Off A Cliff, Only Without the Nice View

Last Week’s DevelopmentsThrough May 1; Boeing Dominates News Flow
• Boeing/Embraer JV collapsed in acrimony.
• Brazilian government implies China an option; not realistic.
• Boeing announced $25 bn debt, move away from USG or capital market funding.
• Boeing announced long-awaited rate cuts.
• More optimistic outlook, farther-looking rate announcement than Airbus, but less realistic about downturn.
• Built/undelivered MAX pool revealed to be 450 jets; 50-100 more than anticipated.
• 787 at rate 10 this year (ex disruptions); to rate 7 by 2022.
• Airbus announced 1Q results; next rate changes known by June.
• Also, expectation of return to 2019 peak in 2023-25.
• Safran, others increasingly concerned about smaller suppliers’ health; may consider vertical acquisitions.
•Growing disconnect between relief measures, industry production plans and the downturn’s likely depth and duration.
COVID-19 And Aero MarketsIssues And Impact
• Apparently, these things come in pairs:• The fuel price shock is as important as traffic.
• Or trios. Recession too.
• Also, traffic de-link from economics already in play.
• And China – economy, relations with the West,
likelihood that it goes its own way in aviation,
diminished air travel growth, etc.…
•What’s different this time:• Airlines in better shape.
• Government more aggressive about response, so far.
• No more interest rate stimulus; third party finance stimulus also unrepeatable.
• Growth accelerated post 2008 due to several unusual factors (interest rate/fuel price bifurcation, emerging markets-particularly China); none are in play today.
• The enormous state aid question, and strings attached.• With state aid, a “synthetic market” pulls demand
forward.

“You don’t make the timeline, the virus makes the timeline.” (Dr. Fauci)
• The economy, and people’s willingness to fly, depends on Coronavirus, and really nothing else.
• Limited air travel recovery due
to secondary outbreaks until
vaccine, or effective post-infection
drug or herd immunity.
• Vaccine development/distribution
is an 18-24-month process.
• Therapeutic drugs may arrive sooner.
• Key growth markets might be hit later,
and worse, than China and the West.
• The most likely air traffic scenario is an L-shaped market, with an upward-angled floor, lasting 2-3 years.
• Another possibility scenario is a U-shaped recovery, with the floor lasting about two years. But it’s not a V.
• Return to traffic peak in 2023, we hope.
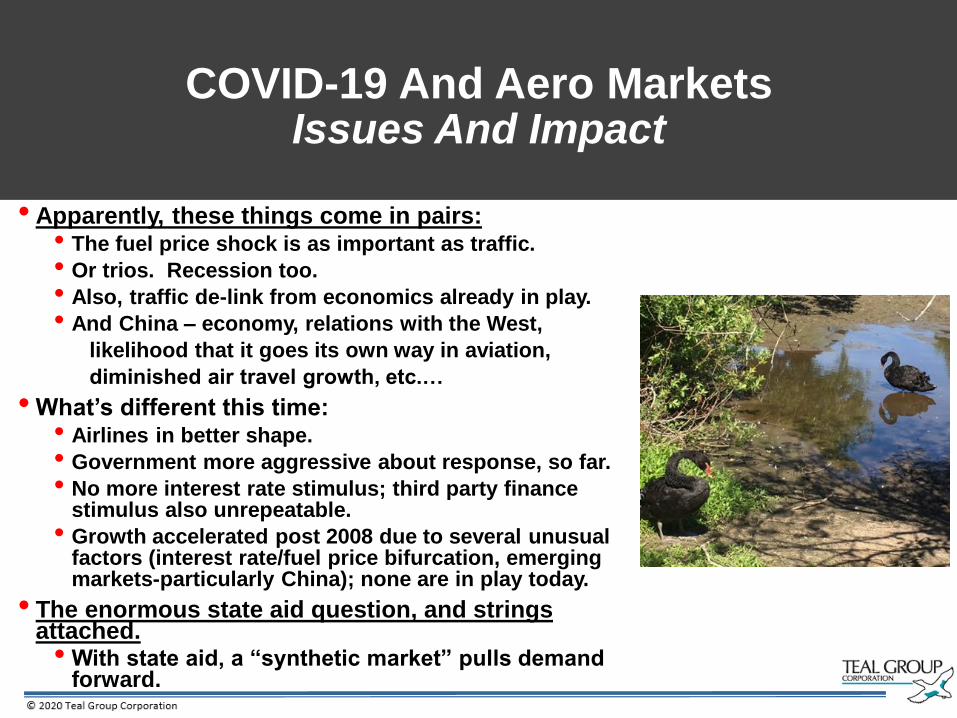
Aircraft Markets, In Good And Bad Years
World New Deliveries CAGR CAGR CAGR Change
In 2019 (2020 $) ’03-‘08 ’08-‘14 ’14-18 ’18-‘19
Jetliners-SA ($46.2 b) 9.7% 6.9% 5.0% -23.9%
Jetliners-TA ($55.3 b) 5.0% 13.5% 1.7% 2.0%
Regionals ($5.8 b) 3.9% -3.1% -5.2% -5.1%
Business Aircraft ($22.4 b) 16.7% -2.2% -5.0% 15.6%
Civil Rotorcraft ($3.9 b) 18.5% -2.5% -7.4% -6.6%
Military Rotorcraft($13.3 b) 10.6% 9.6% -11.8% 16.9%
Military Transports ($4.9 b) 3.2% -0.9% 0.2% -1.2%
Fighters ($24 b) 1.6% 0.8% 2.5% 25.5%
All Civil ($133.8 b) 9.7% 5.6% 1.4% -7.6%
All Military ($45.5 b) 3.9% 4.0% -3.3% 16.6%
Total ($179.3 b) 8.0% 5.2% 0.3% -2.4%

Aviation Segments By Damage
Most to Least
International traffic hit hardest and longest.
Already an overcapacity situation.
Secular shift towards single aisles already underway.
Twin aisle jetliners
Fuel prices a big problem.
China comeback uncertain.
Some relief due to deferred Airbus ramp, and MAX stop.
Single aisle jetliners
Large cabin strongly correlated with oil prices.
Small/medium strongly correlated with corporate profits, equities indices.
Business Jets
Oil and gas segment (large) hit again, before recovery even began.
Civil Rotorcraft
Emphasis on “shovel-ready.”
Advance development programs at greater risk.
Pure-play contractors in best shape; suppliers with most defense in best shape.
Military Programs
0
20
40
60
80
100
120
Valu
e In
2020 $
Bn
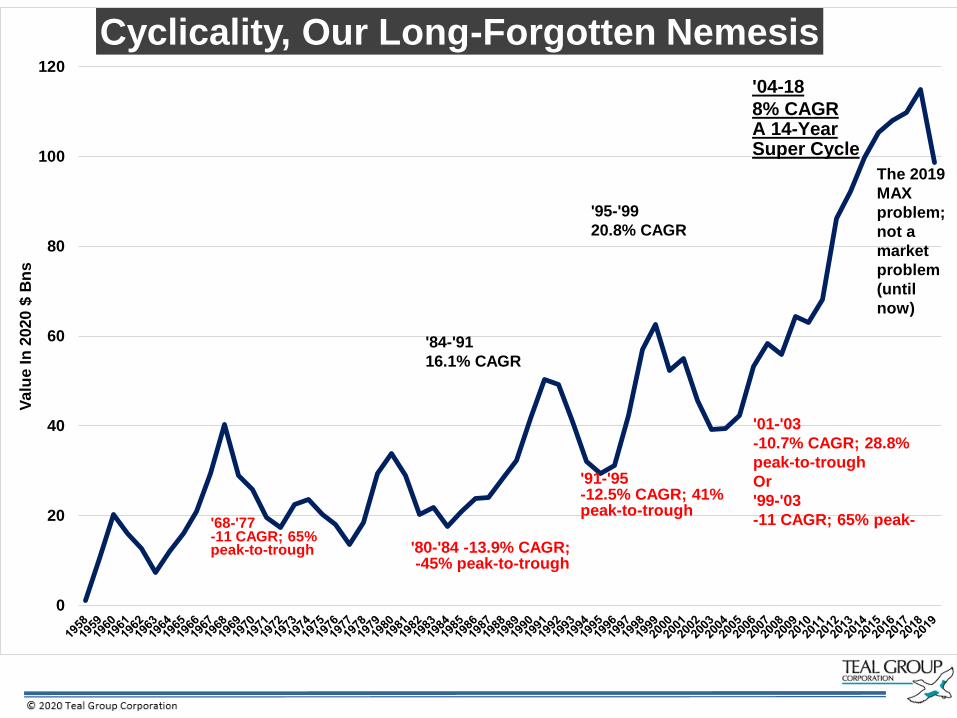
sCyclicality, Our Long-Forgotten Nemesis
'68-'77-11 CAGR; 65% peak-to-trough '80-'84 -13.9% CAGR;
-45% peak-to-trough
'91-'95-12.5% CAGR; 41% peak-to-trough
'01-'03
-10.7% CAGR; 28.8%
peak-to-trough
Or
'99-'03
-11 CAGR; 65% peak-
'84-'91
16.1% CAGR
'04-18
8% CAGRA 14-YearSuper Cycle
'95-'99
20.8% CAGR
The 2019
MAX
problem;
not a
market
problem
(until
now)

-55
-45
-35
-25
-15
-5
5
15
25
35
Y/T
Tra
ffic
Ch
na
ge
(%
)Traffic: Way Above Trend...Until March 2019
48% Decline in 2020? Down 90-95% Now2019 Totals: RPKs 4.2%, ASKs 3.4%, FTKs -3.3%
2018 Totals: RPKs 6.5%, FTKs 5.4%; 2017: RPKs 7.6%, FTKs 9%
RPKs ASKs FTKsSource: IATA

And Now, Unprecedented Numbers
•Traffic decline, parked fleet like no previous shock.• Per Paul Krugman, reflect a world economy in a “medically-induced coma;” -40% US GDP?
• Again, traffic recovery is determined by the virus, not politicians or economics.
• Backlogs holding up (MAX a concern), but meaningless in a downturn.
•Many early retirements coming, particularly twin aisles.• Primarily twin aisles; A380 bloodbath.
• Aftermarket catastrophe.• 48% down ASMs (hopefully), de-stocking, deferred maintenance/upgrades,
plentiful USM with early retirements.
0
1000
2000
3000
4000
5000
6000
World Air Traffic (RPM Bns)
0
2000
4000
6000
8000
10000
12000
14000
0%
10%
20%
30%
40%
50%
60%
70%
Pa
rke
d J
ets
Pe
rce
nt
Pa
rke
d
World Jet Fleet: Now ~65% Unemployed
Parked Percentage Of Total FleetSource:
Ascend/Jeffries
IATA's 48% y/y
2020 decline
still optimistic
about a 4Q
recovery

-6
-4
-2
0
2
4
6
8
10
12
14
16
7.5
7.7
7.9
8.1
8.3
8.5
8.7
8.9
9.1
9.3
9.5
Tra
ffic
Gro
wth
, y/y
Uti
lizati
on
(h
ou
rs p
er
day)
Lower Utilization Can Help With OvercapacityBut A 48%+ Traffic Drop Is Another Story
Traffic Growth UtilizationSource: Airline Monitor
0
20
40
60
80
100
120
0
2
4
6
8
10
12
14
16
18
'80 '82 '84 '86 '88 '90 '92 '94 '96 '98 '00 '02 '04 '06 '08 '10 '12 '14 '16 '18 20f
WT
I O
il P
rice in
201
6 $
/BB
l
Inte
rest
Rate
s (
Fed
era
l F
un
d E
ffecti
ve,
%)
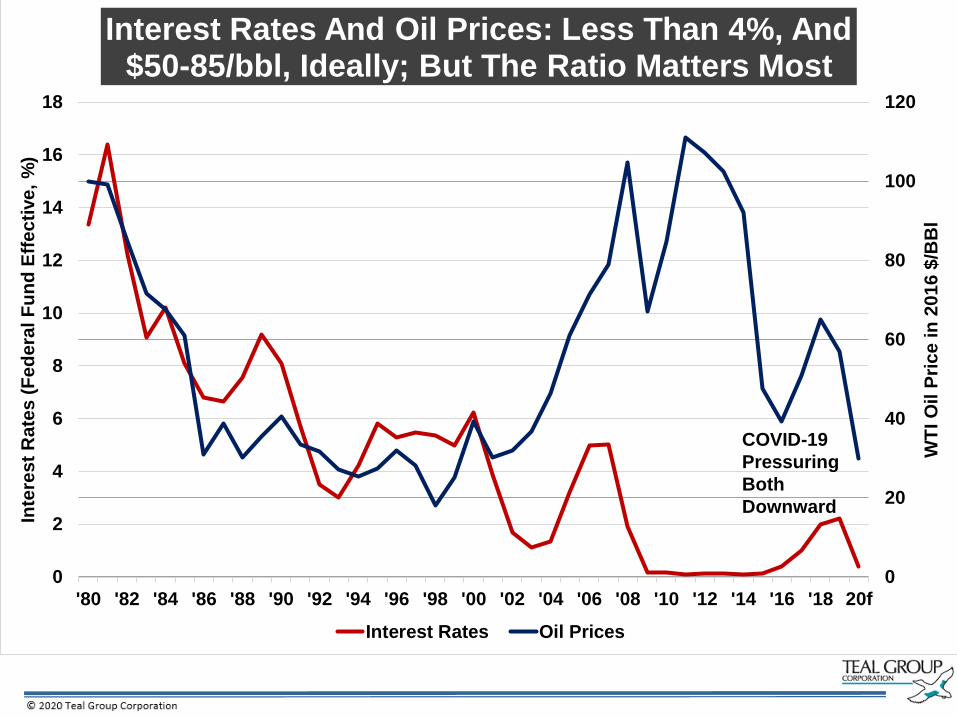
Interest Rates And Oil Prices: Less Than 4%, And $50-85/bbl, Ideally; But The Ratio Matters Most
Interest Rates Oil Prices
COVID-19
Pressuring
Both
Downward

0
100
200
300
400
500
2000 2001 2002 2003 2004 2005 2006 2007 2008 2009 2010 2011 2012 2013 2014 2015 2016 2017 2018 2019
BRIC Deliveries: Peaked; Watch ChinaGrowth May Not Resume For A Few Years
China Russia India Brazil
2018:
China is
23% of
world
Market
2000:
China is
2% of
world
Market

-1000
-500
0
500
1000
1500
2000
2500
3000
3500
Large Jetliner Orders And DeliveriesBook-To-Bill No Longer A Thing
Deliveries Net Orders

-
10
20
30
40
50
60
70
80
90
Deliveri
es I
n 2
02
0 $
Billio
ns
The Air Transport Market By Segment(As of January)
Regionals Single Aisles Twin Aisles
Some kind of
correction,
inevitably; also,
wait for next gen
Regionals, The Land Of Misery
Too much, too sudden
(A330s, 777s, 787s, Gulf
carriers, etc.)
The Correction Decade; shift
towards single aisles; A321neo
effect
737MAX
Problem, and
flood

-
10
20
30
40
50
60
70
80
90
Deli
ve
rie
s In
20
20
$ B
illi
on
sThe Air Transport Market By Segment
(May 1)
Regionals Single Aisles Twin Aisles
Return to peak: 2024
Now With Greater Misery
Too much, too sudden (A330s,
777s, 787s, Gulf carriers, etc.)
Hit Hardest and Longest; Capacity
hangover, international traffic
problems, and shift towards single
aisles
737MAX
Problem, and
flood;
includes
delivery of
~350 already-
built jets
Return to peak: after
2029... probably

0
10
20
30
40
50
60
70
80
Deli
ve
rie
s i
n 2
02
0 $
Billi
on
sSingle Aisle Deliveries: Protected By MAX Return (including jets
built already), and By Shift Away From Twin Aisles
A320ceo A320neo A321neo B737NG B737MAX CSeries/A220 C919/MS21

$0
$10
$20
$30
$40
$50
$60
Deli
ve
rie
s i
n 2
02
0 $
Bn
sTwin Aisles: Formerly Hot; Now Crowded And Depressed
A350 A330 A330neo A340 A380 B767 B777 B777X B787 B747

Jetliner Types And Fleets Trends And Themes
• Downsizing trend: demand for jets offering equivalent functionality and equal/better economics, fewer seats, than older models.
• Thus, A321neo will do well as replacement for older, mid-range twin aisles; A220
will do well as replacement for older 737s and A319/320s.
• Boeing single aisle product line now boxed in; MAX8 fine, but outflanked from above and below.
• A321neo increasingly dominant in 180/220-seat segment; CDB MAX10 order
conversion further indication that larger MAXs uncompetitive.
• Embraer JV termination means Boeing abandoning 100/130-seat segment.
• BA 25% R&D cut announced in 1Q call not a good sign for product development.
• MAX8 lease rates, orders (particularly lessor orders) also taking a hit.
• Boeing, in short, is therefore at risk of losing out due to airline downsizing.
• E-Jets will lose market share and/or profit without a large partner.
• A330neo increasingly at risk of MD-11-like fate.
• Almost all remaining quadjet fleets look set to retire young.
• Large twins (777X, A350-1000) look marginal for most of decade.

1h1997
1h2001
End2004
End2006
End2008
End2009
End2010
End2011
End2012
End2013
End2014
End2015
End2016
End2017
End2018
End2019
1Q2020
Boeing 130.0 107.8 79.5 199.1 300.4 271.1 270.0 300.1 317.0 365.3 421.2 412.9 398.9 402.1 408.0 378.8 367.3
Airbus 48.6 112.9 115.5 173.0 281.8 268.2 277.6 309.5 321.6 399.9 439.9 461.2 468.1 441.8 481.6 463.6 470.6
Bombardier — — — — — 1.9 3.3 4.9 5.5 6.7 9.0 9.0 8.7 8.5 — — —
0
50
100
150
200
250
300
350
400
450
500
20
20
$B
illi
on
sFirm Order Backlog Values: Boeing Taking A Hit

0
20
40
60
80
100
120
140
Deli
ve
rie
s i
n 2
02
0 $
Billi
on
sJetliner Market Shares By Deliveries
Airbus Seizes The Middle Market and First Place; Covid-19 Accelerates shift to Middle Market
Boeing Airbus ex 321neo A321neo COMAC/Irkut
Jetliner Types And Fleets: Trends And Themes
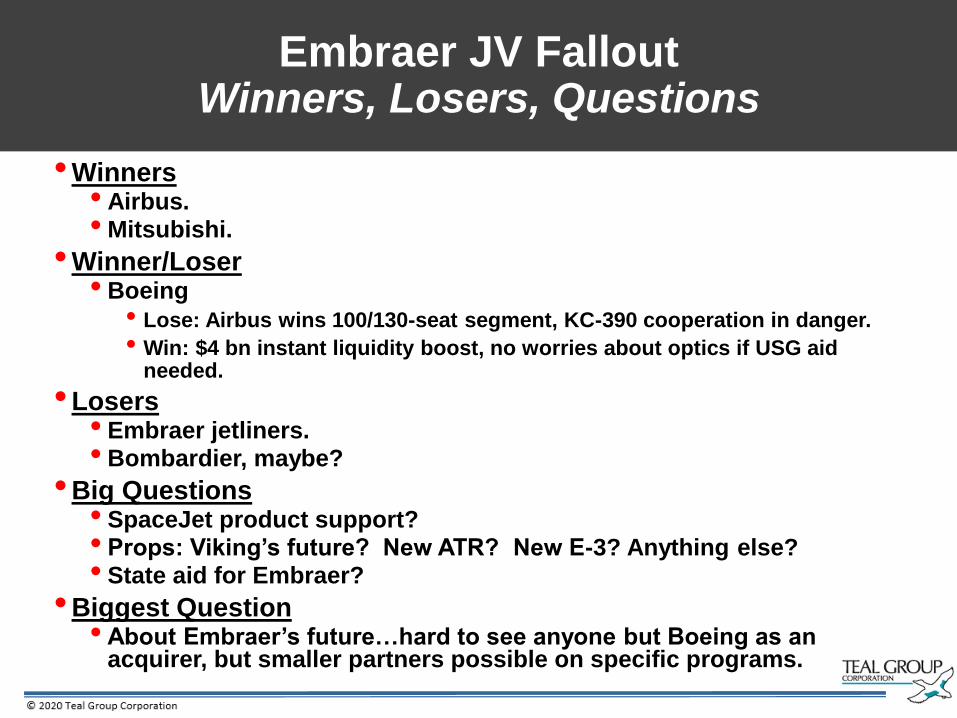
Embraer JV FalloutWinners, Losers, Questions
•Winners• Airbus.•Mitsubishi.
•Winner/Loser• Boeing
• Lose: Airbus wins 100/130-seat segment, KC-390 cooperation in danger.
• Win: $4 bn instant liquidity boost, no worries about optics if USG aid needed.
•Losers• Embraer jetliners.• Bombardier, maybe?
•Big Questions• SpaceJet product support?• Props: Viking’s future? New ATR? New E-3? Anything else?• State aid for Embraer?
•Biggest Question• About Embraer’s future…hard to see anyone but Boeing as an
acquirer, but smaller partners possible on specific programs.

0
1
2
3
4
5
6
7
8
'10 '11 '12 '13 '14 '15 '16 '17 '18 '19 '20 '21 '22 '23 '24 '25 '26 '27 '28 '29
Va
lue
of
Deli
ve
rie
s '2
0 $
Bil
lio
ns
Regional Deliveries By OEM (Value)
Bombardier CRJ Dash 8Q Embraer (pre-E-2) E-2 MRJ ATR SuperJet ARJ21
0
20
40
60
80
100
120
0
2
4
6
8
10
12
14
16
18
Oil P
rice
in
20
16
$/B
Bl
Deliveri
es i
n 2
02
0 $
Bn
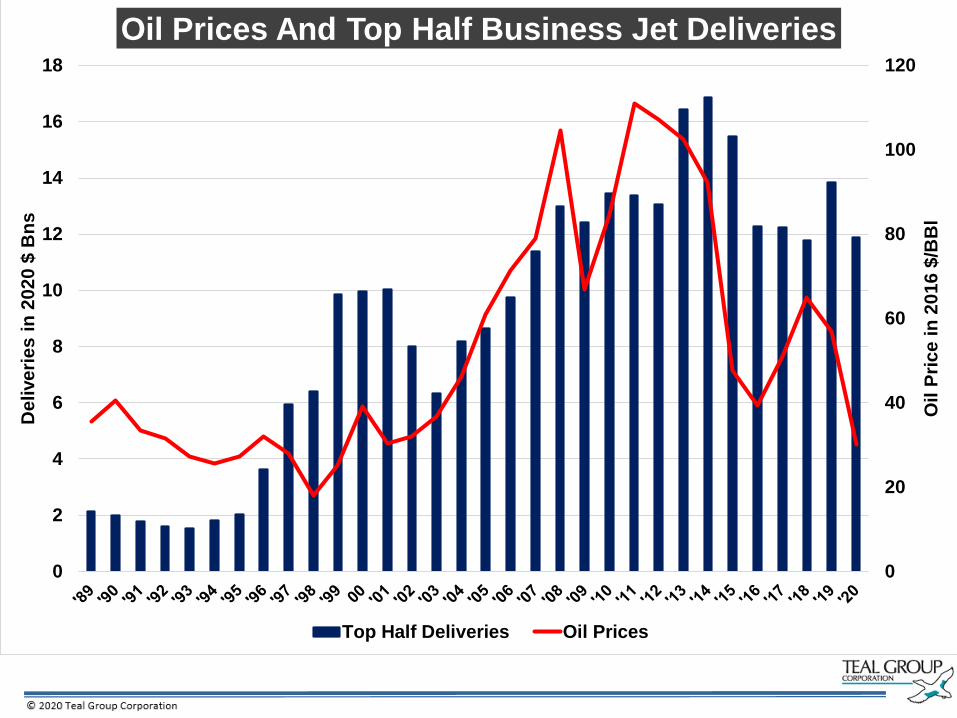
sOil Prices And Top Half Business Jet Deliveries
Top Half Deliveries Oil Prices

0
50
100
150
200
250
300
Bo
th In
dexe
d t
o 2
00
0 (
=10
0)
Business Jet Market Has Lagged Global Equities For Last Decade, But A Downturn Will Still Hurt
MSCI ACWI Market ValueACWI is a global equity markets index;
2020 is forecast for jets, April 1 for ACWI
$0
$2
$4
$6
$8
$10
$12
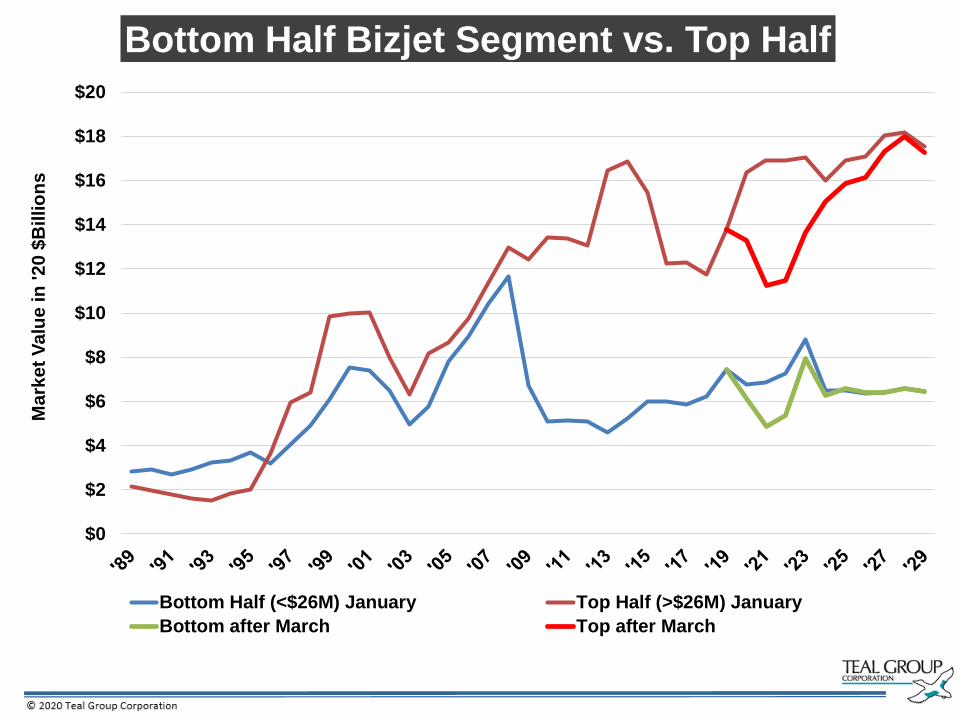
$14
$16
$18
$20
Mark
et
Valu
e in
'20 $
Billio
ns
Bottom Half Bizjet Segment vs. Top Half
Bottom Half (<$26M) January Top Half (>$26M) January
Bottom after March Top after March

$0.0
$0.5
$1.0
$1.5
$2.0
$2.5
$3.0
$3.5
$4.0
Mark
et
Valu
e i
n '20 $
Bil
lio
ns
Civil Helicopter Demand May Worsen For Large Models, Depending On Energy Prices
Large Cabin Large Cabin After March Other Civil Other Civil After March

Global Aircraft Market Outlook In One Page
Segment 2020 ’20-‘21 Risk Elevator Comment
Jetliners-SA -18.2% 22.3% Includes some already-built MAXs. Watch
China, fuel, traffic.
Jetliners-TA -33.0% -15.9% Overcapacity, slow international recovery,
secular shift to SAs
Regionals -13.3% -7.0% No Boeing supply chain effect on E-2; Scope
clause de-risked, but little growth.
Business Aircraft -17.0% -8.0% Another hit after many false starts over a
disappointing decade.
Civil Rotorcraft -6.7% -9.3% Large civil hit again. Too many new models
aimed at a weak segment (oil/gas).
Military Rotorcraft -1.6% 1.0% Programs end/slow; no risk of accelerated
downturn; FVL beyond forecast, exc FARA.
Military Transports -26.1% 9.1% A seriously underperforming market.
Fighters 2.9% 6.6% I like this market. F-35, plus strong Gen 4.5
All Civil -23.5% 0.3% SAJetliner snapback due to MAX, weakness
in other segments; more overcapacity risk.
All Military -0.1% 4.7% Global insecurity, Tension, Malice. Special
mission also boosts topline.
Total Industry -17.5% 1.7% No strong recovery until 2023

0
20
40
60
80
100
120
140
160
20
20
$ B
illi
on
sWorld Aircraft Deliveries By Value, 1989-2029
Military Civil (January) Civil (April)

Believe It Or Not…There’s Good News If You Look Hard Enough
•A much bigger industry and market – % v. numbers.
•An airline paradise, except for the traffic.
•Fuel, Jet costs, Crew costs, interest rates, government
support (for most, and for now).
•Stimulate traffic, or restore profit?
•Defense: budgets and export demand.
•Defense: industrial support.
•Companies: all about balance.
•Financial sector stronger going into this crisis.
•Less business jet frothiness.
•Globalization redeemed. Different, but redeemed.

COVID-19 And Civil Aviation Markets
For more information about Teal Group:
www.tealgroup.com
Tom Zoretich
Senior Economist