Embed Size (px)
Citation preview

F I N A L R E P O R T
Covered California
Consumer Tracking Survey
MAY 6, 2014 PRESENTED TO:
Covered California
560 J Street
Sacramento, CA 95814
PRESENTED BY:
NORC at the
University of Chicago
Larry L. Bye
Senior Fellow
601 Montgomery Street
San Francisco, CA 94111
(415) 315-2005

NORC | Covered California—Consumer Tracking Survey
FINAL REPORT | I
Table of Contents
Executive Summary ...................................................................................................... 1
1. Study Background and Objectives ........................................................................ 10
2. Study Methodology ................................................................................................. 11
2.1 Study Population ..................................................................................................... 11
2.2 Study/Sample Design .............................................................................................. 11
2.3 Survey Questionnaire Development ........................................................................ 12
2.4 Data Collection ........................................................................................................ 12
2.5 Response Rates ...................................................................................................... 13
2.6 Data Validation ........................................................................................................ 13
2.7 Weighting ................................................................................................................ 13
2.8 Analysis of Study Data ............................................................................................. 16
2.9 Study Team ............................................................................................................. 16
3. Tracking Survey Findings: Consumer Awareness, Knowledge, Attitudes, and Intentions ......................................................................................................... 17
3.1 Awareness of the ACA ............................................................................................. 17
3.2 Attitudes Toward the ACA ....................................................................................... 19
Overall Attitude: Will the ACA Be Bad or Good for You? ..................................................... 19
Other Attitudinal Measures ................................................................................................... 21
3.3 Awareness of Covered California ............................................................................ 23
3.4 Awareness of Covered California Television Advertising ......................................... 27
Unaided Television Advertising Awareness .......................................................................... 27
Aided Awareness of Major Television Advertisements ......................................................... 28
Total Awareness (Aided + Unaided) ..................................................................................... 29
3.5 Advertising Awareness and Key Campaign Success Metrics ................................... 32
3.6 Exposure to Community-Based Campaign Elements............................................... 34
Exposure to Community-Based Campaign Elements .......................................................... 34
The Link Between Exposure to Community-Based Elements and Key Campaign Success Metrics .................................................................................................................... 36

NORC | Covered California—Consumer Tracking Survey
FINAL REPORT | II
Exposure to Internet Versus Community-Based Activities ................................................... 38
The Link Between Use of the Internet for Information Seeking and Key Campaign Success Metrics .................................................................................................................... 40
Information from Friends and Family .................................................................................... 43
3.7 Knowledge ............................................................................................................... 44
Changes in Knowledge Since the Baseline study ................................................................ 44
Differences in Levels of Knowledge About Covered California ............................................ 46
3.8 Social/Normative Beliefs .......................................................................................... 48
3.9 Shopping Status ...................................................................................................... 51
3.10 Motivation and Experience of Purchasers .............................................................. 53
Purchaser Motivation ............................................................................................................ 53
Where Purchasers Purchased Their Plan ............................................................................ 54
Problems Encountered ......................................................................................................... 56
Ease of Purchase on the Covered California Website ......................................................... 57
Recommendations by Purchasers ........................................................................................ 57
3.11 Information-Seeking Among Non-Purchasers ........................................................ 59
Non-Purchasers Who Looked into Covered California ......................................................... 59
Where Non-Purchasers Sought Information ......................................................................... 60
Problems Non-Purchasers Encountered Finding Information .............................................. 61
Finding Out About the Cost of Coverage .............................................................................. 61
Price Concerns: Non-Purchaser Assessments Actual Versus Expected Costs ................... 62
Non-Purchaser Evaluation of Ease of Navigation................................................................. 63
Recommendations Non-Purchasers Received from People Close to Them ........................ 64
3.12 Purchase Status and Intentions ............................................................................. 66
Purchase Status .................................................................................................................... 66
Purchase Intentions .............................................................................................................. 67
Non-Purchaser Motivations for Planning to Get a Plan ........................................................ 70
Non-Purchaser Motivations for Not Planning to Get a Plan ................................................. 72
3.13 Prior Plan Cancellation .......................................................................................... 74
Cancellation Notices ............................................................................................................. 74
Subjective Comparison of the Covered California Plan and the Cancelled Plan ................. 75
Summary of the Subjective Assessment in Terms of Perceived Wins and Losses ............. 77
3.14 Language of Application Forms Among Spanish Speakers.................................... 78
Help in Completing the Application ....................................................................................... 79
3.15 Synthesis of Racial and Ethnic Differences ............................................................ 80
Awareness and Attitudes ...................................................................................................... 80
Knowledge, Social Normative Beliefs and Purchase/Shopping ........................................... 83
Motivations for Purchase and Purchase Experience ............................................................ 83
NORC | Covered California—Consumer Tracking Survey
FINAL REPORT | III
Non-purchaser Experiences with Covered California ........................................................... 85
Purchase Intentions and Motivations .................................................................................... 88
Appendix A: Questionnaire (English Language) ...................................................... 89
Appendix B: Questionnaire (Spanish Language) ................................................... 134
Appendix C: Areas and Counties in California ....................................................... 191
Appendix D: Additional Tables ................................................................................ 193

NORC | Covered California—Consumer Tracking Survey
FINAL REPORT | IV
List of Exhibits
Exhibit 2.1.1 Unweighted and Weighted Totals for Raking Variables ................................. 15
Exhibit 3.1.1: Have you heard, seen, or read about the Affordable Care Act? ..................... 18
Exhibit 3.2.1: Do you think the Affordable Care Act will be good for you, bad for you, or will it have no impact? ............................................................................... 20
Exhibit 3.2.2: Levels of Agreement with Other ACA Attitudinal Measures .......................... 22
Exhibit 3.3.1a: Aided and Unaided Awareness of Covered California.................................... 24
Exhibit 3.3.1b: Aided and Unaided Awareness of Covered California.................................... 25
Exhibit 3.3.1c: Aided and Unaided Awareness of Covered California.................................... 26
Exhibit 3.4.1: Unaided Awareness of TV Advertisements .................................................... 27
Exhibit 3.4.2a: Total and Unaided TV Ad Awareness ............................................................ 30
Exhibit 3.4.2b: Total and Unaided TV Ad Awareness ............................................................ 31
Exhibit 3.5.1a: The Link Between TV Advertising Awareness and Key Campaign Success Metrics ........................................................................................................... 33
Exhibit 3.5.1b: The Link Between TV Advertising Awareness and Key Campaign Success Metrics ........................................................................................................... 34
Exhibit 3.6.1a: Exposure to Community-Based Campaign Elements .................................... 35
Exhibit 3.6.1b: Exposure to Community-Based Campaign Elements .................................... 36
Exhibit 3.6.2: The Link Between Exposure to Community-Based Campaign Elements and Key Campaign Success Metrics ............................................................. 37
Exhibit 3.6.2a: Summary of Internet & Community-Based Element Exposure ....................... 39
Exhibit 3.6.2b: Summary of Internet & Community-Based Campaign Element Exposure ...... 40
Exhibit 3.6.3: The Link Between Internet Use for Information Seeking and Key Campaign Success Metrics ............................................................................................ 42
Exhibit 3.6.4: Percent Receiving Information from Friends and Family ................................ 43
Exhibit 3.7.1: Knowledge of Covered California (Percent of Correct Answers) .................... 45
Exhibit 3.7.1a: Knowledge of Covered California (Based on the Percentage of Correct Answers) by Demographics ........................................................................... 47
Exhibit 3.7.1b: Knowledge of Covered California (Based on the Percentage of Correct Answers) by Demographics ........................................................................... 48
Exhibit 3.8.1: Social Normative Beliefs ................................................................................ 50
Exhibit 3.9.1a: Shopping Status ............................................................................................ 52
Exhibit 3.9.1b: Shopping Status ............................................................................................ 53
Exhibit 3.10.1: Main Reason for Purchasing.......................................................................... 54

NORC | Covered California—Consumer Tracking Survey
FINAL REPORT | V
Exhibit 3.10.2: Where Did You Purchase Your Plan? ............................................................ 55
Exhibit 3.10.3: Most Common Problems Encountered While Purchasing Plan ...................... 56
Exhibit 3.10.4: Ease of Purchase (Among Purchasers on Web) ............................................ 57
Exhibit 3.10.5: Recommendations by Purchasers ................................................................. 58
Exhibit 3.11.1: Exploration of Purchasing Insurance (Among Non-purchasers) ..................... 59
Exhibit 3.11.2: Where Non-purchasers Sought Information ................................................... 60
Exhibit 3.11.3: Problems Encountered Finding Information or Applying (Among Non-purchasers) ................................................................................................... 61
Exhibit 3.11.4: Found Out Coverage Cost (Among Non-purchasers) .................................... 62
Exhibit 3.11.5: Costs Relative to Expectation (Among Non-purchasers Finding Cost of Plan) .............................................................................................................. 63
Exhibit 3.11.6: Ease of Navigation (Among Non-purchasers Using Website) ........................ 63
Exhibit 3.11.7: Recommendations of Covered California (Among Non-purchasers) .............. 64
Exhibit 3.12.1: Summary of the Status and Intentions of Purchasers and Non-Purchasers ... 66
Exhibit 3.12.2: Purchase Intentions (Among Non-purchasers) .............................................. 69
Exhibit 3.12.2a: Income and Purchase Intentions (Among Non-purchasers) .......................... 70
Exhibit 3.12.2b: Income and Purchase Intentions (Among Uninsured Non-purchasers) ........ 70
Exhibit 3.12.3: Reason for Planning to Get a Plan (Among Non-purchasers Planning to Get a Plan) .................................................................................................... 72
Exhibit 3.12.4: Reason for Not Planning to Get a Plan (Among Non-purchasers not Planning to Get a Plan).................................................................................. 73
Exhibit 3.13.1: Prior Plan Cancellations ................................................................................ 75
Exhibit 3.13.2: Plan Price Comparison (Among Those Purchasers Who Also Received Cancellation Notice) ...................................................................................... 76
Exhibit 3.13.3: Plan Quality Comparison (Among Those Purchasers Who Also Received Cancellation Notice) ...................................................................................... 77
Exhibit 3.13.4: Summary: Purchasers’ Subjective Assessment of Covered California Plan Versus a Cancelled Plan (Among Those Whose Prior Plan Was Cancelled) . 78
Exhibit 3.14.1: Language Used to Complete Government Forms (Among Spanish Speakers) ...................................................................................................... 79
Exhibit 3.14.2: Help in Completing the Application (Purchasers) ........................................... 80
Exhibit 3.15.1: Summary of Racial and Ethnic Differences in Awareness and Attitudes toward the ACA and Awareness of Covered California and its Outreach Program ........................................................................................................ 82
Exhibit 3.15.2: Summary of racial and ethnic differences in knowledge, social normative beliefs, and purchase and shopping for health insurance through Covered California ....................................................................................................... 83

NORC | Covered California—Consumer Tracking Survey
FINAL REPORT | VI
Exhibit 3.15.3: Summary of Racial and Ethnic Differences Among Purchasers in Motivations for Purchase, Purchase Experience and Willingness to Recommend Covered California .................................................................... 85
Exhibit 3.15.4: Summary of Racial and Ethnic Differences in Non-purchaser Experience and Willingness to Recommend Covered California ...................................... 87
Exhibit 3.15.5: Summary of Purchase Intentions and Motivations for Buying and Not Buying ........................................................................................................... 88

NORC | Covered California—Consumer Tracking Survey
FINAL REPORT | VII
List of Appendix Tables
Exhibit A.1: Aided Awareness of TV Advertisements (Among Those Not Reporting
Bogus Ad).................................................................................................... 193
Exhibit A.2: Knowledge of Covered California: Percentage with Correct Answers to the Statement (Statements with Highest Population Knowledge) ................. 194
Exhibit A3: Knowledge of Covered California: Percentage with Correct Answers to the Statement (Statements with Lowest Population Knowledge) ................. 195
Exhibit A.4: Purchase Status .......................................................................................... 196
Exhibit A.5: Purchase Status .......................................................................................... 197
Exhibit A.6: Any Problems Encountered Purchasing Plan—More-Experienced Problems ..................................................................................................... 198
Exhibit A.7: Any Problems Encountered Purchasing Plan—Least-Experienced Problems ..................................................................................................... 199
Exhibit A.8: Purchase Assistance ................................................................................... 200

NORC | Covered California—Consumer Tracking Survey
FINAL REPORT | 1
Executive Summary
During the open enrollment period from October 1, 2013, to March 31, 2014, more than 1 million
consumers enrolled in health insurance plans through Covered California. This Consumer Tracking
Study describes the reasons for Covered California’s success and suggests approaches for
maximizing enrollment in the future. It also assesses change over time since a baseline survey was
conducted prior to the launch of the 2014 open enrollment period. The current study was conducted
mid-course in the open enrollment season, from January 17 to February 27. It is based on 1,989
telephone interviews conducted in the respondent’s preferred language. A summary of major
findings follows.
Key Success Metrics
Awareness of and Attitudes Toward the ACA
Awareness of the ACA. Although awareness of the ACA was already very high when the baseline
study was conducted, it increased during the first few months of the open enrollment season (80%
to 87%). However, only 80% of those who remain uninsured are aware of the ACA. (Section 3.1)
Attitudes Toward the ACA. At the time of the tracking survey, the overall attitude is more positive
than negative, 47% versus 36%, and it is overwhelmingly positive among those who have purchased
insurance via Covered California (76% versus 13%). However, there has been a 6-point decrease in
positive attitudes (“ACA will be good for me”) and an 8-point increase in negative attitudes (“ACA
will be bad for me”) since the initial baseline study. In the tracking survey, just 28% of those who
have plans that are not part of Covered California have positive attitudes about the ACA. Nearly
three-quarters of this group agreed that “people should be able to keep the health plans they had
before the law went into effect, even if the government says they are not good enough,” suggesting
that their attitude may have been affected by plan cancellations and negative publicity from
opponents of the ACA. (Section 3.2)
Awareness of and Knowledge About Covered California
Awareness of Covered California. Unaided awareness of Covered California has increased nearly
20 times (from 3% to 51%) and total awareness has increased more than 6 times (from 12% to 79%)
since the baseline study was conducted. Even among those who remain uninsured in the tracking
survey, 73% are aware of Covered California and 42% can name it unaided. Lack of English-
language proficiency is the highest barrier to awareness of Covered California. This applies to both
Spanish speakers and speakers of other languages. (Section 3.3)

NORC | Covered California—Consumer Tracking Survey
FINAL REPORT | 2
Knowledge About Covered California. There were significant increases since the first survey in
ten of the eleven knowledge measures. The exception is a decrease from 48% to 38% in knowledge
that people with lower incomes will pay less out-of-pocket when they get care. There were increases
of at least 20 percentage points in three critical pieces of information: being able to get health
insurance with a pre-existing condition1 (59% to 83%), being able to shop for and buy it on the
Covered California website (54% to 79%), and having to pay a penalty if they don’t get it before
April 1 (53% to 75%). There have also been increases of at least 10 percentage points in knowledge
that low- and moderate-income people can get tax credits to reduce monthly premiums (38% to
51%) and that Covered California is the only place they can get these tax credits (23% to 37%).
(Section 3.7)
Differences in Knowledge Levels. One-quarter (25%) of consumers were classified as having
“high” levels of knowledge about Covered California in the tracking survey. Consistent with the
results on awareness, lack of language proficiency is the highest barrier to gaining knowledge about
Covered California. Partly because of this, consumers who are eligible for federal assistance are only
about half as likely to have high levels of knowledge as those whose incomes are too high for them
to qualify (17% versus 35%). (Section 3.7)
Social Normative Beliefs
There has been an increase since the baseline survey in the positive normative belief that “a lot of
people who did not have health insurance before are getting it now because it is the right thing to
do” (29% to 40%). This belief is positive because it both suggests a social trend and legitimizes it. It
is more prevalent among African Americans, Hispanics (especially those interviewed in Spanish),
and Asians than it is among Whites.
There has also been a much smaller increase in the negative normative belief that “most people like
me don’t have health insurance (34% to 38%). This, of course, represents reality but is also a
negative social norm because it could serve as an excuse for not getting health insurance. African
Americans (51%) and Hispanics (52%) are more likely to agree than Whites (25%) and Asians
(29%). Responses to this question should change as more African Americans and Hispanics enroll in
Covered California plans. (Section 3.8)
The Impact of TV Advertising and Other Campaign Elements
TV Advertising Awareness. About half (49%) of consumers are aware of Covered California
advertising either aided or unaided, and 28% are aware unaided.2 Total awareness is highest among
1 The single most important fact about Covered California based on ratings in the baseline study.
2 We collected aided recall data on ads that ran immediately prior to the survey data collection period. During the data collection period some new ads were introduced for which no recall data were collected.

NORC | Covered California—Consumer Tracking Survey
FINAL REPORT | 3
those who are in the 139%–199% of Federal Poverty Level (FPL) income tier and are thus eligible
for the most generous federal assistance. Consistent with other findings, awareness is lowest among
those with limited English-language proficiency. Total awareness also increases somewhat with age,
from 47% among 18- to 34-year-olds to 53% among 50- to 64-year-olds. (Section 3.4)
The Effect of the TV Advertising Campaign. There are large differences between those who are
aware of the advertising unaided and those who are not aware of any advertising, suggesting that the
advertising has played a major role in the success of Covered California.3 For example,
● Unaided awareness of Covered California (62% of those aware versus 43% of those not)
● High level of knowledge about Covered California (54% of those aware versus 17% of those
not)
● Application for and purchase of a plan through Covered California (37% of those aware
versus 25% of those not, a 50% difference)
How the TV Advertising Affects Exposure to the Other Campaign Elements. Advertising-
aware consumers are much more likely to have medium or high levels of community-based
campaign exposure than those who are not aware (53% of those with unaided ad awareness versus
43% of those with no ad awareness), suggesting there is a synergistic effect between the advertising
and community-based campaigns in which the advertising motivates some consumers to learn more
about Covered California by taking the initiative to go online, attend events, meet with counselors,
or visit government offices. (Section 3.5)
Exposure to the Community-Based Campaign Elements. In order to be exposed to the
community-based outreach campaign, a consumer must take action by attending an event,
consulting with an individual acting in an official capacity, or visiting a government office.
Respondents were classified into three groups according to their level of exposure to community-
based campaign elements: no exposure (52%), medium exposure (1 or 2 elements) (33%)), or high
exposure (3+ elements (15%)). Those most likely to report having no exposure include: consumers
ages 18-34 (58%), Whites (60%), males (57%), Northern Californians living outside the San
Francisco Bay Area (67%), and consumers with incomes between 200% and 399% of the federal
level (65%), who are eligible for federal assistance to help them pay for health insurance bought
through Covered California but may not know it. (Section 3.6)
The Effect of the Community-Based Campaign Elements. There are strong links between
exposure to community-based campaign elements and attitudes, shopping and purchase. For
3 We make the comparison between unaided and no awareness since they represent the two extremes on ad awareness. Unaided awareness is the highest level of awareness.

NORC | Covered California—Consumer Tracking Survey
FINAL REPORT | 4
example, 40% of consumers with high exposure but just 8% of those with no exposure have
enrolled in a plan through Covered California; 82% of consumers with high exposure but just 56%
of those with no exposure have either purchased or looked into purchasing a plan through Covered
California; and 60% of consumers with high exposure, but just 40% of those with no exposure, say
that “the ACA will be good for me.” (Section 3.6)
Thus, there seems to be a classic “two-step” flow of communication: advertising motivates
involvement in community based activities that are part of the outreach campaign and, then,
involvement in those more personal activities motivates consumers to develop positive attitudes
toward Covered California, look into enrolling, and, finally, enroll in a plan.
Information Seeking on the Internet. Just under half of consumers have used the Internet to
seek information about Covered California. Consumers most likely to use the Internet for this
purpose include 18 to 34 year-olds (54%), African Americans and Whites (both 56%), English
speakers (55%), and consumers with incomes too high to qualify for assistance (54%). (Section 3.6)
The Effect of Information Seeking on the Internet. Use of the Internet for information seeking
is strongly linked to all of the key campaign success metrics. For example, Internet users are more
likely than nonusers to be aware of Covered California (71% versus 33%), be aware of Covered
California advertising unaided (34% versus 22%), have a high level of knowledge about Covered
California (36% versus 17%), say, “Covered California will be good for me” (52% versus 42%), have
looked into or purchased a plan through Covered California (83% versus 50%)and be a Covered
California purchaser (26% versus 12%).
These findings illustrate the power of the Internet, especially since it is an extremely important
communication channel for reaching 18 to 34 year-olds. (Section 3.6)
The Purchase Decision
Shopping Status
Shopping Status Overview. Overall, 18% purchased health insurance via Covered California, 48%
shopped but didn’t purchase, and 34% didn’t shop. (Section 3.9)
Demographic Differences in Shopping Status. Although 18- to 34-year-olds are about equal to
their elders on awareness of and knowledge about Covered California and awareness of its
advertising, they are less likely to purchase (14% versus 24% for 50- to 64-year-olds). This group is
the most likely to shop but not buy insurance via Covered California (52% versus 41% of 50- to 64-
year-olds). Hispanics (56%), particularly those interviewed in Spanish (71%), are even more likely to
shop without buying. (Section 3.9)

NORC | Covered California—Consumer Tracking Survey
FINAL REPORT | 5
Motivations and Experience of Purchasers
Purchase Motivations. The most commonly cited purchase motivations are (1) saving money by
getting a lower cost or a federal subsidy (51%), (2) security, or the assurance that they will be able to
get health insurance and health care no matter what (33%), (3) avoiding the penalty (14%), (4) being
in control (9.2%), or (5) getting the health care they need without having to wait (9%). Very few
mentioned support for “Obamacare” or doing the right thing (5%). (Section 3.10)
Where They Purchased Their Plans. The website (64%) is the most important purchase vehicle,
especially for 18- to 34-year-olds (77%). Only 14%—but 32% of African Americans— purchased
through an insurance agent.4 Overall, relatively few called the toll-free number (8%) or met with a
Covered California counselor, but both were important vehicles for Spanish speakers (23% and
39%, respectively). (Section 3.10)
Ease of Purchase. Website purchasers were more likely to say the process was easy (44%) than
difficult (29%)—and only 15% said it was “very” difficult although website issues (29%) and
problems contacting Covered California (12%) were the most commonly reported problems.
Among 18- to 34-year-olds, the difference was 53% reporting it easy to 15% reporting it difficult.
Hispanics interviewed in Spanish were the most likely to report that the process was “very” difficult
(33%, compared to 15% of all respondents). (Section 3.10)
Recommendations by Purchasers. Purchasers who are pleased with their purchase are an
important source of influence, particularly among younger consumers and Asians. Six out of ten
purchasers have recommended purchasing a plan via Covered California to someone else, and 18- to
34-year-olds (66%) and Asians (67%) were the most likely to recommend. (Section 3.10)
Non-Purchaser Experience
Where Non-Purchasers Sought Information. Overall, 58% of non-purchasers looked into the
possibility of purchasing through Covered California. Hispanics (65%), particularly those
interviewed in Spanish (79%); African Americans (65%); and 18- to 34-year-olds were particularly
likely to say they had done so. Non-purchasers who shopped were most likely to go to the Covered
California website (38%), but others called the toll-free telephone number (12%), met with an
insurance agent (8%), met with a certified counselor (7%), or visited a government office (6%). Just
18% reported any difficulty finding information. (Section 3.11)
Price Concerns. As reported above, a substantial number of consumers—particularly younger
consumers, minorities, and those with limited English-language proficiency—looked but didn’t buy
4 It may be that this proportion was under-estimated in the survey since significant numbers of people may have made use of the web enrollment portal as well as agents.

NORC | Covered California—Consumer Tracking Survey
FINAL REPORT | 6
insurance via Covered California. Although only 28% said they found out how much their coverage
would cost, price concerns clearly discouraged purchases among many who found out the cost:
these non-purchasers were more than twice as likely to say that the Covered California plans they
looked at cost more than they expected (59%, compared to 26% who reported it cost less than they
expected). (Section 3.11)
Ease of Navigation of the Website. About the same proportion of non-purchasers as purchasers
said the Covered California website was easy to use (50% vs. 44%, respectively) and difficult to use
(33% versus 29%). Thus, navigation problems do not seem to be a significant factor depressing
enrollment. (Section 3.11)
The Role of Recommendations. Forty-two percent of non-purchasers have received
recommendations for or against purchasing insurance via Covered California, and these
recommendations are more positive (26%) than negative (16%). Consumers ages 18–34 are the most
likely to receive both positive and negative recommendations. Nearly half (48%) of African
Americans received positive recommendations and 19% received negative recommendations, giving
African Americans a very high positive-to-negative ratio of 2.53. Asians/Pacific Islanders also have
high positive-to-negative ratios while Whites have the lowest (25% versus 22%; ratio: 1.14). (Section
3.11)
Purchase Intentions and Motivations
Purchase Intentions. In addition Covered California purchasers, there are another 12% who have
applied but have not completed their purchase and another 20% who have not applied but say they
will. Thus, not counting those who said they “may” enroll, there seem to be about one-third who are
who have a high propensity for enrollment. (Section 3.12)
Motivations for Planning to Get a Plan. Saving money (lower cost and/or getting a subsidy) and
security (the assurance of being able to get insurance and health care no matter what) were the most
important motivations for planning to get a plan in the baseline study. Security (38%) was also the
most important motivation in the tracking study, but saving money has slipped from 41% to 21%,
and avoiding the penalty for noncompliance has increased from 1% to 27%, making it the second
most important reason. (Section 3.12)
Motivations for Not Planning to Get a Plan. There has been a very large decrease in mentions of
expense as a reason for not getting an insurance plan through Covered California (62% to 27%),
suggesting that consumers are becoming more aware of federal subsidies and other mechanisms for
reducing costs. There has also been a much smaller increase in the number saying they already have
or expect to get health insurance (21% to 30%), which is now the most important reason for not
planning to get a plan. Not knowing how to apply, while not very important overall (11%), is more

NORC | Covered California—Consumer Tracking Survey
FINAL REPORT | 7
important among African Americans (27%) and Hispanics (18%), especially Hispanics interviewed
in Spanish (21%). (Section 3.12)
The Impact of Cancellation of the Prior Plan
The Impact of Cancellation of Prior Plans. Overall, 20% of consumers indicated they had
received a cancellation notice or a notice that their insurance would not be renewed. One-third said
the notice was the result of the ACA, and one-third said the notice said they should visit Covered
California to enroll in a new plan. (Section 3.13)
Perceived Cost and Quality of the Covered California and Prior Plans. Consumers who
enrolled in Covered California after their plans were cancelled were asked to assess the cost and
quality of both plans. It is difficult to accurately assess both the true cost and the true quality of an
insurance plan, and it was even more difficult in this case because many, if not most, would have
had no experience with the Covered California plan. Nevertheless, based on these assessments, 48%
perceived themselves as winners in the outcome and 28% perceived themselves as losers; it was
impossible to determine the perceived status of 24% (e.g., a plan that costs more but is better, a plan
that costs the same and is the same quality, and a plan that costs less and is worse). (Section 3.13)
Does the Language Used on Forms Reflect the Percentage of Hispanics Who Have Enrolled?
There has been a great deal of concern about the seemingly slow pace of enrollment in Covered
California among Spanish-speaking Hispanics. However, a primary means of measuring enrollment
has been the number of enrollment forms completed in Spanish. The survey results indicate that
estimates based on this measure are not accurate because the majority of Spanish-speaking Hispanics
(55%) complete government forms mostly or only in English.
Moreover, almost all Hispanics interviewed in Spanish (93%), indicating limited English-language
proficiency, complete government forms mostly or only in English. They are able to do this because
they receive assistance. (Section 3.14)
Overview of Race/Ethnic Differences Identified in the Study
Covered California Awareness and Attitudes. Lack of language proficiency and possible cultural
differences appear to be barriers to awareness of and information seeking about Covered California.
The two groups least likely to be native English speakers, Hispanics and Asians/Pacific Islanders,
are also the least likely to be aware of the ACA and Covered California and the least likely to have
gone to the website to learn more. The outreach campaign may be helping to break down this
disparity since there are no meaningful subgroup differences in awareness of the TV advertising, and

NORC | Covered California—Consumer Tracking Survey
FINAL REPORT | 8
Asians/Pacific Islanders have the highest exposure to the non-advertising elements of the outreach
campaign. Despite similarly high levels of TV ad awareness, African Americans and Whites do not
agree on the ACA: African Americans have the most positive attitudes, while Whites have the most
negative attitudes.
Knowledge, Social Normative Beliefs and Purchase/Shopping. African Americans and
Whites are not only the most likely to be aware of Covered California, but they also know the
most about it. They are also the most likely to agree that a lot of uninsured people are getting
insurance now, suggesting that news about Covered California is spreading in the African
American community. Hispanics know the least about Covered California, and they are the least
likely to have purchased insurance through it; but they, along with African Americans, are the
most likely to have shopped Covered California but not purchased. This may indicate that many
Hispanics and African Americans are interested in enrolling but are in an earlier stage of
purchase cycle than other consumers.
Motivations for Purchase. Security is the most important motivator for African Americans,
but saving money is the most important motivator for other purchasers. Mentioned by about
one-fifth of Hispanics, avoiding the penalty for being uninsured is more important for Hispanics
than for other African Americans and Whites.
The Purchase Experience. Although the Covered California website5 is the most common
way of purchasing a health plan via Covered California for all subgroups, African Americans,
Hispanics and Asians/Pacific Islanders are much less likely to have used the website than
Whites. During the purchase process, these groups tended to rely more on people who could
help them navigate the system. These people included including insurance agents (African
Americans and, to a lesser extent, Asians/Pacific Islanders) and certified Covered California
counselors (Hispanics). Majorities of all purchaser subgroups say they would recommend
Covered California to a friend or family member.
Non-purchaser experience with Covered California. African American non-purchasers have
engaged in more information seeking than any other subgroup, including going to the Covered
California website, calling the Covered California toll-free number, and consulting with an
insurance agent. This high level of information seeking may be due in part to positive social
norms and word-of-mouth in the African American community: About twice as many African
Americans as other subgroups reported that someone close to them had recommended purchase
of a health plan through Covered California.
5 Figures on website purchases may include those who made use of the Web but also sought the assistance of insurance agents or Covered California certified counselors.

NORC | Covered California—Consumer Tracking Survey
FINAL REPORT | 9
Hispanics are the least likely to have found how much it would cost them to enroll in a health
insurance plan through Covered California. Although most non-purchasers who discovered the
cost say it was more than expected, Hispanics, along with African Americans, are the most likely
to say the cost was less than expected. This suggests that misperceptions about cost might have
deterred some Hispanics and African Americans from seriously considering enrollment in a plan
through Covered California, or even seeking information about it.
Purchase Intentions and Motivations. Among non-purchasers, Whites are by far the least
likely to say they plan to get coverage and the most likely to cite distrust of the ACA or
government as a reason. Expense is the most important reason for not planning to get a plan for
all subgroups, except African Americans, for whom not knowing how to apply is slightly more
important. African American non-purchasers overwhelming cite security as a reason for
planning to get a plan, and, while the results are not as dramatic, security is also the most
commonly cited reason among Hispanics and Whites. Security is not such an important
consideration for Asians/Pacific Islanders, who are more likely to cite saving money and
avoiding the penalty as reasons for planning to get insurance.

NORC | Covered California—Consumer Tracking Survey
FINAL REPORT | 10
1. Study Background and Objectives
A baseline survey of the Covered California consumer market was conducted in the summer of
2013. Data were used to guide the planning of the marketing/outreach campaign that was launched
prior to the 2014 open enrollment period. A series of tracking surveys has been planned to assess
changes in awareness, knowledge, attitudes, purchasing patterns and intentions overtime. In
addition, the tracking surveys will collect data on advertising recall and exposure to other campaign
elements as well as the relationship between campaign exposure and intended outcomes. This report
presents findings from the first tracking survey conducted in the winter of 2014.
The specific objectives of this study were to assess:
● Trends with regard to consumer awareness of the ACA and attitudes toward it,
● Trends with regard to Covered California awareness, knowledge about what it offering and
social norms related to the purchase of insurance,
● Motivations and experiences of Covered California plan purchasers,
● Information seeking and related experiences of non-purchasers,
● Purchase intent and related motivations among non-purchasers,
● Advertising recall and the extent of exposure to non-advertising elements of the
marketing/outreach campaign,
● The relationship between exposure to the campaign and critical intended outcomes, and,
● Differences in the above based on race/ethnicity, age and other important demographic
characteristics.

NORC | Covered California—Consumer Tracking Survey
FINAL REPORT | 11
2. Study Methodology
This section of the report describes the methods used to complete the study.
2.1 Study Population
The study included two main populations: uninsured and individually—or privately—insured
Californians. Uninsured Californians are those who are not currently covered by any health
insurance, including insurance obtained through an employer, purchased directly, or granted through
a government program. Individually insured Californians are those who purchase private insurance
without any assistance from an employer or the government. The individually insured included those
who had recently purchased plans from Covered California as well as those who have plans from
other sources.
In addition, qualified respondents had to meet the following selection criteria:
● 18 – 64 years of age
● Legal resident of California
● Decision-maker about healthcare for himself/herself or family
● Total family income above 100% Federal Poverty Level (FPL)
2.2 Study/Sample Design
This study serves as a follow-up to a baseline and market segmentation study done for Covered
California last year. In order to sample the study populations, we developed a statewide sample of
the general household population as well as targeted samples of two groups that would not be
captured in large enough numbers in the statewide sample—African Americans and Asian/Pacific
Islanders. The general population sample included both a landline and cell telephone random-digit
dial component. To increase the number of “millenials” (18-34 year-olds) surveyed, we increased the
proportion of cell phone sample that were drawn relative to the baseline sample design. The two
race/ethnic oversamples included households randomly selected from a list of state households
thought to be made up of populations of interest. This list was developed by Marketing Systems
Group (MSG), a leading supplier of high-quality survey samples, using a variety of databases
containing information on the demographic characteristics of U.S. households. In some cases, the
use of data on ethnic surnames is also incorporated into the database-development process. It is
important to recognize that since not all California Asian/Pacific Islander and African American
households are represented in these databases, it is possible that the households captured in our

NORC | Covered California—Consumer Tracking Survey
FINAL REPORT | 12
samples are not fully representative of those two race/ethnic groups. Nevertheless, this approach is
a cost-effective one that is often used to ensure sufficient diversity in survey samples.
2.3 Survey Questionnaire Development
In conjunction with Covered California, the NORC study team developed the tracking survey
questionnaire. The final questionnaire included measures on the following topics:
● Awareness of the ACA and Covered California,
● Unaided Advertising Awareness,
● Aided Advertising Awareness (Recognition of Major Television Ads),
● Exposure to Other Campaign Elements,
● Knowledge About Covered California,
● Purchase Status and Intention,
● Prior Plan Comparison,
● Purchaser Motivations and Experience,
● Non-Purchaser Motivations and Experience,
● Access to the Internet and a Checking Account,
● Ethnicity, Race, and Language Use, and
● Classification Variables (e.g., ZIP code, age, health status).
2.4 Data Collection
Data were collected using NORC’s computer-assisted telephone interviewing (CATI) system. This
system supports industry-standard dialing procedures and allows for online audio and visual
monitoring and audio recording to guarantee high data quality. Data collection began on January 17,
2014, and continued through February 27, 2014. Interviews were conducted in English and Spanish
with live, real-time translation services available for those respondents who wanted to complete the
interview in any another languages.
The number of calls placed to get an interview with each sampled household varied based on a
number of factors, including the history of previous attempts to contact the household and sample
type. In general, we attempted to make at least six calls to nonresponding households at different
times of day and on different days of the week over at least a two-week period. Except in cases
where a household requested to be taken off our calling list or where a respondent was hostile, we
NORC | Covered California—Consumer Tracking Survey
FINAL REPORT | 13
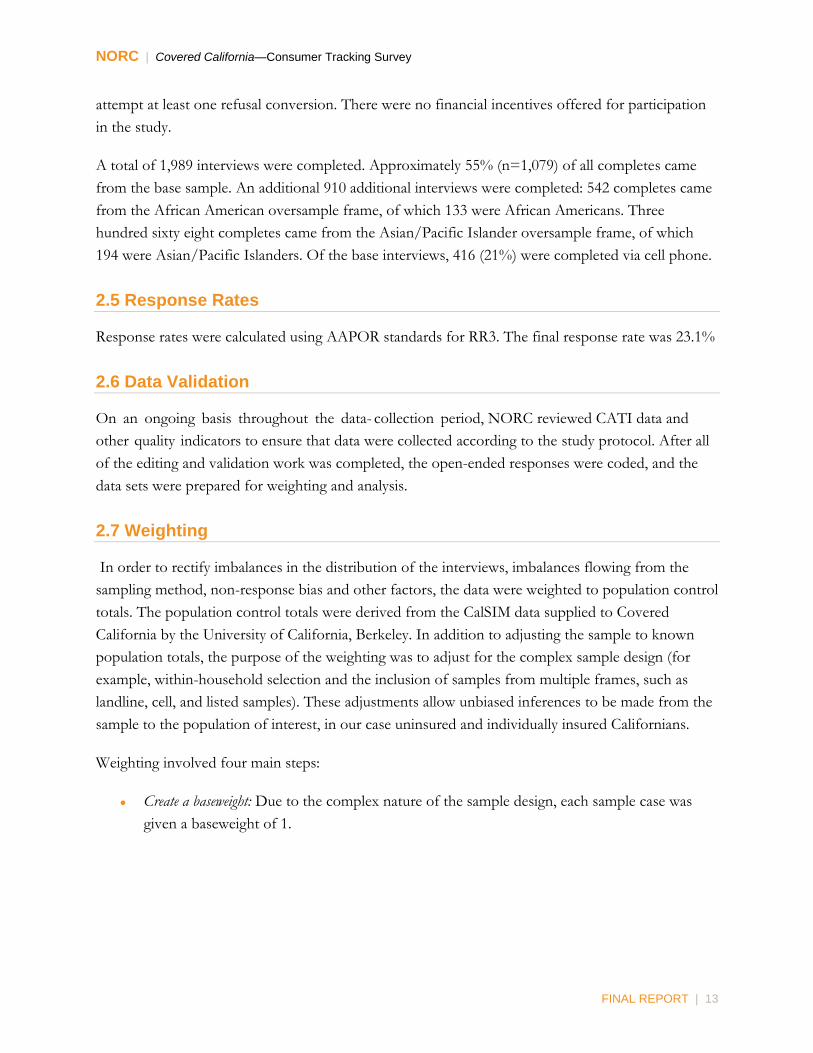
attempt at least one refusal conversion. There were no financial incentives offered for participation
in the study.
A total of 1,989 interviews were completed. Approximately 55% (n=1,079) of all completes came
from the base sample. An additional 910 additional interviews were completed: 542 completes came
from the African American oversample frame, of which 133 were African Americans. Three
hundred sixty eight completes came from the Asian/Pacific Islander oversample frame, of which
194 were Asian/Pacific Islanders. Of the base interviews, 416 (21%) were completed via cell phone.
2.5 Response Rates
Response rates were calculated using AAPOR standards for RR3. The final response rate was 23.1%
2.6 Data Validation
On an ongoing basis throughout the data- collection period, NORC reviewed CATI data and
other quality indicators to ensure that data were collected according to the study protocol. After all
of the editing and validation work was completed, the open-ended responses were coded, and the
data sets were prepared for weighting and analysis.
2.7 Weighting
In order to rectify imbalances in the distribution of the interviews, imbalances flowing from the
sampling method, non-response bias and other factors, the data were weighted to population control
totals. The population control totals were derived from the CalSIM data supplied to Covered
California by the University of California, Berkeley. In addition to adjusting the sample to known
population totals, the purpose of the weighting was to adjust for the complex sample design (for
example, within-household selection and the inclusion of samples from multiple frames, such as
landline, cell, and listed samples). These adjustments allow unbiased inferences to be made from the
sample to the population of interest, in our case uninsured and individually insured Californians.
Weighting involved four main steps:
● Create a baseweight: Due to the complex nature of the sample design, each sample case was
given a baseweight of 1.

NORC | Covered California—Consumer Tracking Survey
FINAL REPORT | 14
● Adjust for multiple chance of selection: Most households that own at least one cell phone are more
likely to have multiple cell phones associated with the household, as a cell phone is
considered more of a personal device. Therefore, households from the cell-phone frame are
adjusted to account for multiple chances of selection in the cell-phone frame. Since a large
majority of households only have one landline number, this adjustment was not needed on
the landline frames.
● Adjust for overlap between the cell-phone and landline frames: Cases that were deemed eligible from
both the landline and cell-phone frames were adjusted to account for the multiple chance of
selection. These cases had their weights adjusted in half to account for this overlap in
frames.
● Rake to Population Control Totals: The adjusted weights are raked to known population control
totals. The control total variable used for raking were age, sex, insurance status,
race/ethnicity, English proficiency, and telephone status. This allows for subgroups within
the sample to sum to known subgroup totals within the target population. These raked
weights are the final weight used in the analyses.
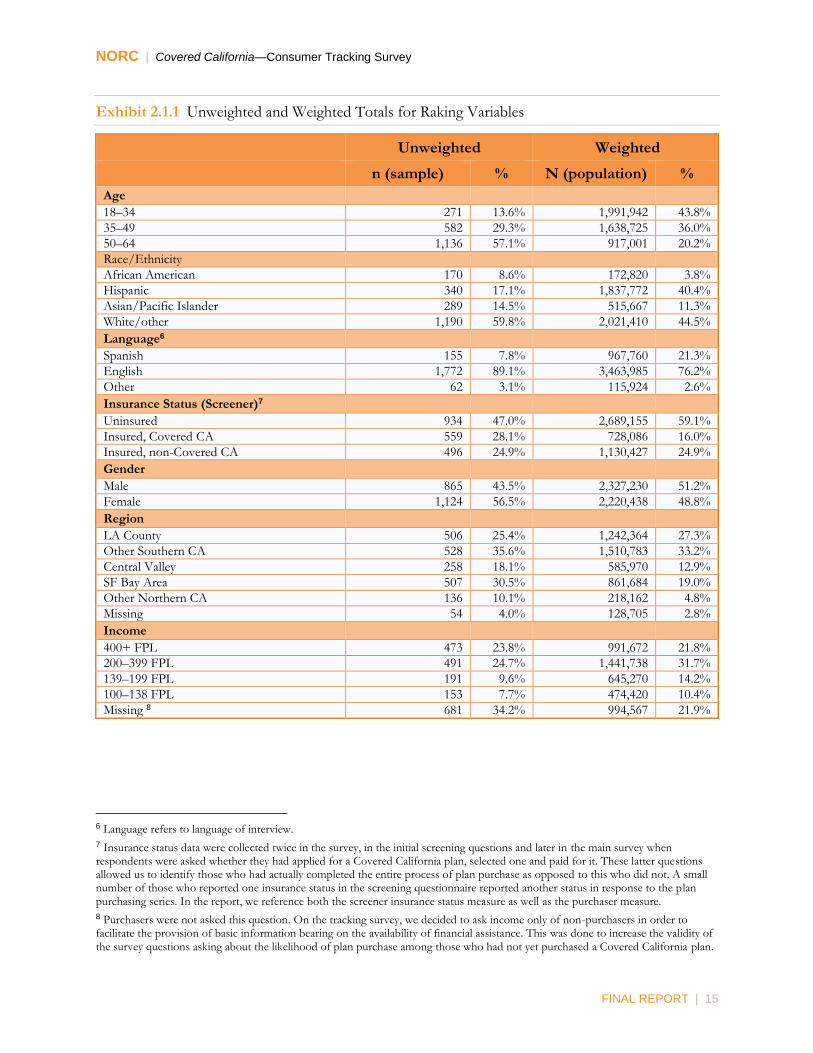
Table 2.1 presents the impact of weighting on the sample demographics. It displays the unweighted
and weighted totals for variables used in the raking.
NORC | Covered California—Consumer Tracking Survey
FINAL REPORT | 15
Exhibit 2.1.1 Unweighted and Weighted Totals for Raking Variables
Unweighted Weighted
n (sample) % N (population) %
Age
18–34 271 13.6% 1,991,942 43.8%
35–49 582 29.3% 1,638,725 36.0%
50–64 1,136 57.1% 917,001 20.2%
Race/Ethnicity
African American 170 8.6% 172,820 3.8%
Hispanic 340 17.1% 1,837,772 40.4%
Asian/Pacific Islander 289 14.5% 515,667 11.3%
White/other 1,190 59.8% 2,021,410 44.5%
Language6
Spanish 155 7.8% 967,760 21.3%
English 1,772 89.1% 3,463,985 76.2%
Other 62 3.1% 115,924 2.6%
Insurance Status (Screener)7
Uninsured 934 47.0% 2,689,155 59.1%
Insured, Covered CA 559 28.1% 728,086 16.0%
Insured, non-Covered CA 496 24.9% 1,130,427 24.9%
Gender
Male 865 43.5% 2,327,230 51.2%
Female 1,124 56.5% 2,220,438 48.8%
Region
LA County 506 25.4% 1,242,364 27.3%
Other Southern CA 528 35.6% 1,510,783 33.2%
Central Valley 258 18.1% 585,970 12.9%
SF Bay Area 507 30.5% 861,684 19.0%
Other Northern CA 136 10.1% 218,162 4.8%
Missing 54 4.0% 128,705 2.8%
Income
400+ FPL 473 23.8% 991,672 21.8%
200–399 FPL 491 24.7% 1,441,738 31.7%
139–199 FPL 191 9.6% 645,270 14.2%
100–138 FPL 153 7.7% 474,420 10.4%
Missing 8 681 34.2% 994,567 21.9%
6 Language refers to language of interview.
7 Insurance status data were collected twice in the survey, in the initial screening questions and later in the main survey when respondents were asked whether they had applied for a Covered California plan, selected one and paid for it. These latter questions allowed us to identify those who had actually completed the entire process of plan purchase as opposed to this who did not. A small number of those who reported one insurance status in the screening questionnaire reported another status in response to the plan purchasing series. In the report, we reference both the screener insurance status measure as well as the purchaser measure.
8 Purchasers were not asked this question. On the tracking survey, we decided to ask income only of non-purchasers in order to facilitate the provision of basic information bearing on the availability of financial assistance. This was done to increase the validity of the survey questions asking about the likelihood of plan purchase among those who had not yet purchased a Covered California plan.

NORC | Covered California—Consumer Tracking Survey
FINAL REPORT | 16
2.8 Analysis of Study Data
Given our study objectives, our main focus in data analysis was to assess:
● Change over time in awareness, knowledge and other intended campaign outcomes,
● Advertising recall and the extent of exposure to non-advertising elements of the
marketing/outreach campaign,
● The relationship between exposure to the campaign and critical intended outcomes,
● Motivations and experiences of Covered California plan purchasers,
● Information seeking and related experiences of non-purchasers,
● Purchase intent and related motivations among non-purchasers,
● Differences in the above based on race/ethnicity, age and other important demographic
characteristics.
For the measures in each of these areas, descriptive analyses were conducted for each demographic
category of interest—insurance status, age, race/ethnicity, and language—as well as the selected
substantive variables. In some cases we expanded the analysis to also look at differences by sex,
region, and income. We also, for some variables, examined differences by Covered California
awareness, ad recall, knowledge, and purchase intent.
With regard to region, the state was divided into five areas: Los Angeles County, Other Southern
California, Central Valley, San Francisco Bay Area, and Other Northern California. See Appendix
for a list of the counties included in each area.
This report presents 95% confidence intervals. Statistical comparisons between any two estimates
can be made by comparing the confidence intervals of the two statistics. If the intervals do not
overlap, then there is a statistically significant difference between the two estimates at the .05 level.
2.9 Study Team
Larry L. Bye, NORC Senior Fellow, headed the study team. Along with Dr. Rebecca Quarles of
QSA Analytics, he designed the survey questionnaire and actively participated in data analysis and
report writing. Senior Survey Director Margrethe Montgomery provided project support and
monitored costs. Martin Barron, Senior Research Scientist, provided methodological support and
oversaw the data-analysis effort. Jennifer Vanicek, Survey Director I, managed the technical
questionnaire development and data collection. Terra Gore, Research Analyst, provided additional
project and analytic support.

NORC | Covered California—Consumer Tracking Survey
FINAL REPORT | 17
3. Tracking Survey Findings: Consumer Awareness, Knowledge, Attitudes, and Intentions
This section of the report describes the results of the study.
3.1 Awareness of the ACA
Between summer 2013—before the Covered California exchange opened for business and the
outreach campaign started—and January/February of 2014—when this first tracking study was
conducted)—eight in ten consumers were aware of the ACA. Since then, awareness increased 7
percentage points (from 80% to 87%).
Awareness of the ACA is now as high among 18- to 34-year-olds (86%) as it is among 35- to 49-
year-olds (86%), and it is about as high as it is among 50- to 64-year-olds (89%). Still, there remains
an awareness gap between the insured—whether via Covered California (92%) or other means
(93%)—and those who remain uninsured (83%). English proficiency seems to play a role in
awareness: there is an awareness gap between Whites (94%) and African Americans (89%), who are
almost all English speakers, and both Hispanics (81%) and Asians/Pacific Islanders (80%).

NORC | Covered California—Consumer Tracking Survey
FINAL REPORT | 18
Exhibit 3.1.1: Have you heard, seen, or read about the Affordable Care Act?
% Yes
All (n=1,989)9 86.8% (84.0% – 89.7%)
Survey Round Wave 1 (n=1,989) 86.8% (84.0% – 89.7%)
Baseline (n=2,756) 79.5% (76.8% – 82.2%)
Insurance Status (Screener) Uninsured (n=934) 82.8% (78.6% – 87.1%) Insured, Covered CA (n=559) 92.1% (87.3% – 96.9%)
Insured, non-Covered CA (n=496) 93.0% (88.8% – 97.1%)
Age 18–34 (n=271) 86.2% (81.5% – 91.0%)
35–49 (n=582) 86.2% (81.4% – 91.0%)
50–64 (n=1,136) 89.2% (84.9% – 93.5%)
Race/Ethnicity African American (n=170) 88.5% (75.6% – 100.0%)
Hispanic (n=340) 81.1% (75.5% – 86.8%)
Asian/Pacific Islander (n=289) 80.1% (71.0% – 89.2%)
White/other (n=1,190) 93.6% (91.1% – 96.1%)
Language Spanish (n=155) 79.7% (71.5% – 87.8%) English (n=1,772) 89.6% (86.9% – 92.4%) Other (n=62) 63.3% (38.9% – 87.7%)
9 Readers are cautioned that when reading tables showing data for less than the entire study sample, the number of respondents displayed can vary based on data weights and “don’t know” and missing responses.

NORC | Covered California—Consumer Tracking Survey
FINAL REPORT | 19
3.2 Attitudes Toward the ACA
Overall Attitude: Will the ACA Be Bad or Good for You?
On balance, attitudes toward the ACA are somewhat more positive than negative, but they have
become more negative since the baseline study. This may be partly due to negative publicity
surrounding the cancellation of some individual insurance policies that do not meet the
requirements of the ACA.
The percentage saying the Act will be bad for them has increased 8 percentage points since the
baseline study was conducted in the summer of 2013, and the percentage saying it will be good for
them has decreased by 6 percentage points. Still more hold favorable (47%) than unfavorable (36%)
attitudes toward the Act, and the verdict of those who have gotten coverage under the Act is
strongly positive (76% versus 13%).
The only consumers who are more negative than positive are insured by plans that are not part of
Covered California (49% to 28%). Since there has been a great deal of publicity about plans being
cancelled because they do not comply with ACA requirements, some of these consumers may be
concerned that their current plan is vulnerable to cancellation. Publicity about problems with the
federal website could also play a role.
Positive attitudes toward the Act increase with age—from 43% among 18- to 34-year-olds to 51%
among 50- to 64-year-olds—but this does not mean that younger people are more negative than
older people about the effect of the Act on them. They are simply more uncertain. African
Americans are the most positive group, while Whites and Hispanics are the most negative.

NORC | Covered California—Consumer Tracking Survey
FINAL REPORT | 20
Exhibit 3.2.1: Do you think the Affordable Care Act will be good for you, bad for you, or will it have no impact?
Good Bad No Impact
All (n=1,989) 47.0% 36.2% 16.8% (42.7% – 51.2%) (32.1% – 40.3%) (13.5% – 20.1%)
Survey Round
Wave 1 (n=1,989) 47.0% 36.2% 16.8% (42.7% – 51.2%) (32.1% – 40.3%) (13.5% – 20.1%)
Baseline (n=2,756) 52.5% 27.6% 19.9% (48.8% – 56.1%) (24.4% – 30.7%) (17.0% – 22.9%)
Insurance Status (Screener)
Uninsured (n=934) 47.0% 37.3% 15.7% (40.9% – 53.1%) (31.4% – 43.2%) (11.1% – 20.3%)
Insured, Covered CA (n=559) 76.3% 12.8% 10.9% (68.2% – 84.4%) (6.4% – 19.3%) (4.8% – 16.9%)
Insured, non-Covered CA (n=496) 27.6% 49.3% 23.1% (20.6% – 34.7%) (41.7% – 56.9%) (16.6% – 29.6%)
Age
18–34 (n=271) 43.1% 35.4% 21.5% (35.4% – 50.8%) (27.9% – 42.9%) (15.1% – 28.0%)
35–49 (n=582) 49.5% 37.0% 13.6% (43.0% – 55.9%) (30.8% – 43.1%) (9.3% – 17.8%)
50–64 (n=1,136) 50.8% 36.5% 12.7% (45.1% – 56.6%) (30.8% – 42.2%) (8.9% – 16.4%)
Race/Ethnicity
African American (n=170) 68.2% 8.4% 23.4% (51.3% – 85.0%) (1.1% – 15.7%) (6.6% – 40.3%)
Hispanic (n=340) 51.6% 34.0% 14.5% (43.5% – 59.6%) (26.3% – 41.6%) (8.7% – 20.2%)
Asian/Pacific Islander (n=289) 48.5% 25.3% 26.2% (37.9% – 59.0%) (15.8% – 34.9%) (16.3% – 36.1%)
White/other (n=1,190) 41.4% 42.4% 16.2% (35.9% – 46.9%) (36.9% – 47.9%) (11.7% – 20.6%)
Language
Spanish (n=155) 58.4% 32.6% 9.1% (46.9% – 69.8%) (21.8% – 43.4%) (1.8% – 16.3%)
English (n=1,772) 43.7% 37.5% 18.8% (39.2% – 48.2%) (33.1% – 41.9%) (15.0% – 22.5%)
Other (n=62) 69.5% 15.5% 15.0% (52.6% – 86.4%) (2.9% – 28.2%) (3.2% – 26.8%)

NORC | Covered California—Consumer Tracking Survey
FINAL REPORT | 21
Other Attitudinal Measures
Overall, two-thirds, including nearly three-quarters of those insured by plans that are not part of
Covered California, agree with the statement “people should be able to keep the health insurance
plans they had before the new law went into effect, even if the government says they’re not good
enough.” This reinforces the idea that cancellation of some existing policies, and the attendant
publicity, has had a negative impact on attitudes among consumers insured by plans that are not part
of Covered California.
The results also suggest that the widely publicized idea that “the new law is going to be repealed” is
depressing enrollment. Nearly three out of ten (28%) of the uninsured agree, compared to 12% of
those now insured under Covered California. Minorities also distrust government “to do the right
thing on health insurance,” particularly among those insured by plans that are not part of Covered
California.
However, most accept the idea that “many people who couldn’t get health insurance before will be
able to get it under the new law,” although the level of acceptance varies widely, from 82% of those
who have gotten insurance under Covered California to just 64% of those who remain uninsured. In
addition, half overall and close to seven in ten of those now insured by Covered California agree
with the statement that “the new law is an improvement over the health insurance system we had
before.”
The opinions of 18- to 34-year-olds about the ACA do not differ from those of their elders in any
meaningful way. There are, however, racial/ethnic differences. African Americans are the most likely
to agree “the new law is an improvement over the health insurance system we had before,” but they
are also the most likely to agree that “the new law is going to be repealed.” Whites are the most
likely to agree that “people should be able to keep the health insurance they had before” and “I
don’t trust the government to do the right thing on health insurance.” Both Whites and African
Americans are more likely than Hispanics and Asians10 to agree that “many people who couldn’t get
health insurance before will be able to get it under the new law.”
10 The term “Asian,” as used in this report, includes both Asians and Pacific Islanders.

NORC | Covered California—Consumer Tracking Survey
FINAL REPORT | 22
Exhibit 3.2.2: Levels of Agreement with Other ACA Attitudinal Measures
Many who couldn’t get insurance can get it
now
Should be able to keep plans that don’t meet
requirements
The new law is an
improvement over the old
I don't trust the
government on health insurance
The new law is going to be repealed
All (n=1,989) 69.1% 66.5% 48.8% 36.5% 23.7% (65.5% – 72.7%) (62.9% – 70.2%) (45.0% – 52.6%) (32.8% – 40.1%) (20.5% – 27.0%)
Insurance Status (Screener)
Uninsured (n=934) 64.3% 63.6% 45.1% 36.1% 28.0% (59.2% – 69.4%) (58.5% – 68.8%) (39.8% – 50.4%) (31.1% – 41.2%) (23.3% – 32.8%)
Insured, Covered CA (n=559) 82.0% 65.1% 68.9% 26.7% 11.9% (75.1% – 89.0%) (57.5% – 72.6%) (61.2% – 76.5%) (19.6% – 33.8%) (6.9% – 16.9%)
Insured, non-Covered CA (n=496)
72.2% 74.4% 44.6% 43.5% 21.2% (65.8% – 78.6%) (67.9% – 80.9%) (37.5% – 51.8%) (36.6% – 50.5%) (15.6% – 26.7%)
Age
18–34 (n=271) 69.1% 68.0% 49.7% 33.2% 21.4% (62.8% – 75.5%) (61.5% – 74.4%) (42.9% – 56.6%) (26.8% – 39.6%) (15.7% – 27.0%)
35–49 (n=582) 66.7% 66.5% 49.1% 38.0% 23.5% (60.9% – 72.4%) (60.8% – 72.2%) (43.2% – 55.0%) (32.4% – 43.7%) (18.6% – 28.4%)
50–64 (n=1,136) 73.5% 63.5% 46.2% 40.9% 29.4% (68.7% – 78.3%) (58.0% – 69.0%) (40.9% – 51.5%) (35.6% – 46.2%) (23.7% – 35.0%)
Race/Ethnicity
African American (n=170) 72.0% 61.4% 66.4% 14.2% 30.2% (56.2% – 87.9%) (46.8% – 75.9%) (51.0% – 81.8%) (7.1% – 21.3%) (15.9% – 44.5%)
Hispanic (n=340) 63.3% 61.8% 48.7% 32.0% 24.6% (56.6% – 70.0%) (55.0% – 68.5%) (41.7% – 55.6%) (25.6% – 38.4%) (18.7% – 30.5%)
Asian/Pacific Islander (n=289) 67.6% 60.3% 57.9% 19.9% 17.9% (57.9% – 77.2%) (50.5% – 70.2%) (48.3% – 67.5%) (13.6% – 26.2%) (11.0% – 24.9%)
White/other (n=1,190) 74.6% 72.9% 45.1% 46.7% 23.9% (70.1% – 79.0%) (68.3% – 77.5%) (39.9% – 50.2%) (41.5% – 51.8%) (19.4% – 28.4%)
Language
Spanish (n=155) 64.1% 55.4% 53.5% 32.9% 30.1% (54.6% – 73.5%) (45.6% – 65.1%) (43.7% – 63.3%) (23.7% – 42.1%) (21.0% – 39.2%)
English (n=1,772) 71.0% 70.5% 47.3% 38.0% 22.2% (67.1% – 74.8%) (66.7% – 74.3%) (43.2% – 51.5%) (34.0% – 42.0%) (18.8% – 25.6%)
Other (n=62) 55.6% 40.8% 53.7% 20.1% 16.4% (32.9% – 78.4%) (21.2% – 60.3%) (31.3% – 76.1%) (6.9% – 33.3%) (5.6% – 27.2%)

NORC | Covered California—Consumer Tracking Survey
FINAL REPORT | 23
3.3 Awareness of Covered California
Awareness of Covered California has increased nearly 20 times (from 3% to 51%), and total
awareness has increased more than 6 times (from 12% to 79%) since the baseline study was
conducted. Even among those who remain uninsured, 73% are aware of Covered California and
42% can name it unaided.
Youth may be a barrier to enrollment, but it is not a barrier to awareness of Covered California: 18-
to 34-year-olds are more likely to be aware of Covered California unaided (53%) than are either 35-
to 49-year-olds (50%) or 50- to 64-year-olds (48%).
However, lack of English-language proficiency is a higher barrier to awareness of Covered
California. Californians who were interviewed in Spanish (69%) or another, often Asian, language
(49%) are much less likely to be aware of Covered California than are those who were interviewed in
English (82%), and only small minorities of both Spanish-speakers (28%) and speakers of other
languages (16%) can name the organization unaided.
There is some evidence that unaided awareness of Covered California is lowest among those who
could benefit from it most. When we examined the relationship between income and awareness
among those who had not purchased a Covered California plan, just over four in ten who could
either qualify for federal assistance under Covered California (42%) and even fewer of those who
would be eligible for expanded Medi-Cal (34%) are aware unaided, compared to 66% of those
whose incomes would disqualify them from any type of assistance. Unaided awareness is highest in
the San Francisco Bay Area (63%) and other parts of Northern California (62%) and lowest in the
Central Valley (43%) and Los Angeles County (46%).

NORC | Covered California—Consumer Tracking Survey
FINAL REPORT | 24
Exhibit 3.3.1a: Aided and Unaided Awareness of Covered California
Unaided Awareness of Covered CA
Aided Awareness of Covered CA
Aided+Unaided Awareness of Covered CA
All (n=1,989) 51.1% 27.4% 78.5% (47.3% – 55.0%) (24.0% – 30.8%) (75.2% – 81.9%)
Survey Round
Wave 1 (n=1,989) 51.1% 27.4% 78.5% (47.3% – 55.0%) (24.0% – 30.8%) (75.2% – 81.9%)
Baseline (n=2,756) 2.6% 9.7% 12.1% (1.8% – 3.5%) (8.1% – 11.3%) (10.3% – 13.8%)
Insurance Status (Screener)
Uninsured (n=934) 41.9% 31.1% 73.0% (36.7% – 47.1%) (26.3% – 36.0%) (68.2% – 77.8%)
Insured, Covered CA (n=559) 63.4% 26.9% 90.3% (55.3% – 71.5%) (19.6% – 34.2%) (84.7% – 95.9%)
Insured, non-Covered CA (n=496) 65.2% 18.9% 84.1%
(58.3% – 72.2%) (13.6% – 24.1%) (78.1% – 90.1%)
Age
18–34 (n=271) 53.4% 22.2% 75.6% (46.5% – 60.3%) (16.5% – 27.8%) (69.5% – 81.6%)
35–49 (n=582) 50.1% 29.9% 80.0% (44.2% – 56.0%) (24.4% – 35.5%) (74.9% – 85.1%)
50–64 (n=1,136) 48.0% 34.3% 82.3% (42.7% – 53.2%) (28.9% – 39.8%) (77.4% – 87.2%)
Race/Ethnicity
African American (n=170) 60.2% 20.5% 80.7% (45.8% – 74.5%) (11.3% – 29.8%) (67.4% – 93.9%)
Hispanic (n=340) 35.6% 37.3% 72.9% (29.0% – 42.3%) (30.6% – 44.0%) (66.6% – 79.3%)
Asian/Pacific Islander (n=289) 44.5% 24.8% 69.3% (35.0% – 53.9%) (17.3% – 32.3%) (59.4% – 79.1%)
White/other (n=1,190) 66.1% 19.7% 85.8% (61.3% – 71.0%) (15.8% – 23.5%) (82.0% – 89.6%)
Language
Spanish (n=155) 28.2% 40.3% 68.5% (19.3% – 37.1%) (30.8% – 49.9%) (59.3% – 77.7%)
English (n=1,772) 58.7% 23.6% 82.3% (54.6% – 62.8%) (20.2% – 27.0%) (78.9% – 85.7%)
Other (n=62) 16.0% 33.4% 49.4% (3.3% – 28.7%) (12.1% – 54.8%) (27.8% – 71.1%)

NORC | Covered California—Consumer Tracking Survey
FINAL REPORT | 25
Exhibit 3.3.1b: Aided and Unaided Awareness of Covered California
Unaided Awareness of Covered CA
Aided Awareness of Covered CA
Aided+Unaided Awareness of Covered CA
All (n=1,989) 51.1% 27.4% 78.5% (47.3% – 55.0%) (24.0% – 30.8%) (75.2% – 81.9%)
Gender
Male (n=865) 48.5% 26.6% 75.2% (43.0% – 54.1%) (21.7% – 31.6%) (70.0% – 80.3%)
Female (n=1,124) 53.8% 28.2% 82.0% (48.6% – 59.1%) (23.6% – 32.8%) (77.8% – 86.3%)
Region
LA County (n=506) 45.7% 31.3% 77.0% (38.5% – 53.0%) (24.5% – 38.1%) (70.5% – 83.5%)
Other Southern CA (n=528) 50.5% 25.7% 76.3% (43.5% – 57.6%) (19.7% – 31.8%) (69.8% – 82.7%)
Central Valley (n=258) 43.2% 37.3% 80.4% (32.4% – 53.9%) (26.5% – 48.0%) (71.1% – 89.7%)
SF Bay Area (n=507) 62.9% 20.4% 83.3% (55.4% – 70.5%) (14.1% – 26.6%) (77.5% – 89.2%)
Other Northern CA (n=136) 61.9% 21.0% 83.0% (46.1% – 77.8%) (10.7% – 31.3%) (67.8% – 98.2%)
Income (Non-purchasers only)
400+ FPL (n=473) 65.7% 18.8% 84.6% (58.3% – 73.1%) (13.1% – 24.5%) (78.5% – 90.7%)
200–399 FPL (n=491) 41.6% 28.4% 70.1% (34.6% – 48.7%) (22.0% – 34.8%) (63.2% – 76.9%)
139–199 FPL (n=191) 41.6% 38.1% 79.7% (30.5% – 52.7%) (27.3% – 48.9%) (70.8% – 88.6%)
100–138 FPL (n=153) 34.0% 30.1% 64.1% (22.9% – 45.1%) (18.7% – 41.6%) (51.9% – 76.3%)

NORC | Covered California—Consumer Tracking Survey
FINAL REPORT | 26
Exhibit 3.3.1c: Aided and Unaided Awareness of Covered California
Unaided Awareness of Covered CA
Aided Awareness of Covered CA
Aided+Unaided Awareness of Covered CA
All (n=1,989) 51.1% 27.4% 78.5% (47.3% – 55.0%) (24.0% – 30.8%) (75.2% – 81.9%)
Ad Awareness
Unaided ad awareness (n=646) 62.2% 31.0% 93.3% (55.2% – 69.2%) (24.4% – 37.6%) (89.3% – 97.2%)
Aided ad awareness only (n=427) 56.7% 27.9% 84.6% (48.4% – 65.0%) (20.2% – 35.6%) (78.4% – 90.8%)
No ad awareness (n=916) 42.9% 25.2% 68.1% (37.6% – 48.2%) (20.6% – 29.8%) (62.8% – 73.4%)
Knowledge Composite11
Low knowledge (n=514) 26.5% 33.8% 60.4% (20.4% – 32.7%) (27.3% – 40.3%) (53.5% – 67.2%)
Medium knowledge (n=734) 56.3% 27.9% 84.2% (50.1% – 62.4%) (22.4% – 33.4%) (79.4% – 89.0%)
High knowledge (n=741) 77.4% 17.8% 95.3% (72.1% – 82.8%) (13.2% – 22.5%) (92.1% – 98.4%)
Purchase Status 12
Covered CA applied for but not purchased (n=226)
53.5% 32.0% 85.4% (42.9% – 64.1%) (22.3% – 41.6%) (77.4% – 93.5%)
Covered CA purchaser (n=606) 67.0% 28.6% 95.6% (59.6% – 74.4%) (21.4% – 35.8%) (93.0% – 98.2%)
Not enrolled but will (n=243) 40.7% 33.6% 74.3% (31.2% – 50.2%) (24.3% – 42.8%) (65.5% – 83.1%)
Not enrolled but may (n=302) 40.0% 29.1% 69.1% (31.4% – 48.6%) (21.0% – 37.2%) (60.8% – 77.3%)
Not enrolled and will not (n=552) 58.7% 20.0% 78.7% (51.6% – 65.8%) (14.8% – 25.1%) (72.1% – 85.2%)
Shopping Status
Purchased (n=606) 67.0% 28.6% 95.6% (59.6% – 74.4%) (21.4% – 35.8%) (93.0% – 98.2%)
No purchase but looked (n=753) 55.4% 29.5% 84.8% (49.6% – 61.2%) (24.1% – 34.8%) (80.4% – 89.3%)
No purchase and did not look (n=630) 36.8% 23.9% 60.7% (30.5% – 43.1%) (18.8% – 29.0%) (54.0% – 67.3%)
11 See definition on page 40.
12 This measure differentiates between those who only started the purchase process and those who fully completed it by paying for the plan or reporting that they intended to pay in the immediate future. Those who did neither were asked about their future enrollment intentions. As a result the entire sample can be segmented across these measures.

NORC | Covered California—Consumer Tracking Survey
FINAL REPORT | 27
3.4 Awareness of Covered California Television Advertising
Unaided Television Advertising Awareness
Overall, 28% remembered seeing “advertising asking Californians to purchase insurance under the
Affordable Care Act” and played back13 content that is “definitely” or “probably” an actual Covered
California advertisement. Only television advertising was captured in the coding of the unaided
awareness data. Unaided TV ad awareness did not vary by either age or race/ethnicity; however,
those interviewed in either Spanish (20%) or another (usually Asian) language (22%) were less likely
to be able to play back a Covered California ad than those who were interviewed in English (30%).
Exhibit 3.4.1: Unaided Awareness of TV Advertisements
Definitely a CC Ad
Probably a CC ad
Cannot Tell if CC Ad
Not CC or No Ad Described
All (n=1,989) 15.1% 12.9% 2.6% 69.5% (12.4% – 17.7%) (10.3% – 15.5%) (1.2% – 3.9%) (66.0% – 73.0%)
Insurance Status (Screener)
Uninsured (n=934) 11.8% 13.1% 1.9% 73.2% (8.5% – 15.1%) (9.5% – 16.8%) (0.4% – 3.4%) (68.5% – 77.8%)
Insured, Covered CA (n=559) 20.8% 13.9% 5.3% 60.0% (14.4% – 27.2%) (8.2% – 19.7%) (0.1% – 10.4%) (51.8% – 68.2%)
Insured, non-Covered CA (n=496) 19.3% 11.5% 2.4% 63.1% (13.5% – 25.0%) (6.9% – 16.2%) (0.0% – 4.9%) (60.0% – 73.6%)
Age
18–34 (n=271) 16.7% 11.2% 4.6% 67.5% (11.6% – 21.8%) (6.8% – 15.5%) (1.6% – 7.7%) (61.0% - 73.9%)
35–49 (n=582) 12.6% 15.7% 0.4% 71.3% (9.3% – 16.0%) (11.0% – 20.3%) (0.1% – 0.8%) (66.0% - 76.6%)
50–64 (n=1,136) 15.9% 11.5% 1.9% 70.6% (12.6% – 19.2%) (8.7% – 14.3%) (1.1% – 2.8%) (66.4% - 74.9%)
Race/Ethnicity
African American (n=170) 20.0% 9.5% 2.8% 67.7% (9.6% – 30.4%) (2.8% – 16.2%) (0.0% – 6.3%) (55.2% - 80.3%)
Hispanic (n=340) 11.5% 15.0% 3.1% 70.5% (7.1% – 15.8%) (10.0% – 19.9%) (0.3% – 5.9%) (64.1% - 76.8%)
Asian/Pacific Islander (n=289) 9.6% 13.8% 0.0% 76.6% (5.6% – 13.6%) (6.9% – 20.7%) N.A. (69.0% - 84.3%)
White/other (n=1,190) 19.4% 11.0% 2.8% 66.9% (15.2% – 23.5%) (7.7% – 14.2%) (1.1% – 4.4%) (62.0% - 71.8%)
Language
Spanish (n=155) 5.7% 14.6% 1.4% 78.3% (1.8% – 9.7%) (7.8% – 21.3%) (0.0% – 4.0%) (70.5% - 86.1%)
English (n=1,772) 18.1% 12.2% 3.0% 66.7% (14.9% – 21.3%) (9.4% – 15.0%) (1.4% – 4.6%) (62.7% - 70.7%)
Other (n=62) 2.8% 18.7% 0.0% 78.5% (0.0% – 7.0%) (5.2% – 32.2%) N.A. (64.3% - 92.7%)
13 NORC personnel evaluated open-ended responses to a question asking respondents to describe the advertising. Respondents who gave a description judged as “probably” or “definitely” an actual Covered California advertisement were categorized as aware unaided.

NORC | Covered California—Consumer Tracking Survey
FINAL REPORT | 28
Aided Awareness of Major Television Advertisements
Respondents were read descriptions of major television advertisements and asked whether or not
they had seen each one.14 One of the descriptions was bogus (not shown below), and those who said
they had seen it were eliminated from the analysis. As noted on the descriptions below, all of the
advertisements except two were shown in both English and Spanish, while one advertisement was
shown only in Spanish and another only in Asian languages.
● The ad shows a worried-looking young woman waiting for a bus and looking at the
symptoms of asthma on her smartphone. She looks relieved when she sees a doctor’s
appointment on her calendar. The message is: Welcome to Covered California. Now you can
no longer be denied because of a pre-existing condition. (Spanish & English)
● The ad shows a young man on a bike taking a bad spill and then shows him in a hospital
bed. The message is: To those who have encountered a bump on the road: welcome to
Covered California, a new affordable health plan so you can be ready for what comes your
way. (Spanish & English)
● The ad shows a family in a car driving from Sacramento to Salinas to San Diego. The ad
welcomes people to Covered California and a new state of health. It says that there is now
equal access to quality health insurance—that those who need financial assistance will get it
and that no one will be denied because of a pre-existing condition. (Spanish & English)
● The ad shows a mother and sick child, then an injured worker, and then an injured athlete,
and says: To those who have worried, suffered in silence, hoped and lived in a state of fear,
welcome to a new state of health where everyone can get quality affordable health insurance,
financial help for those in need, and nobody can be denied because of a pre-existing
condition. (Spanish & English)
● The ad shows people opening doors and says that Californians will welcome a new
marketplace of affordable health insurance and nobody can be denied because of a pre-
existing condition. (Spanish Only)
● The ad shows a man looking at his medicine, then two women looking up diabetes on the
computer, then a couple looking at their bills. The ad says that there is now equal access to
affordable health insurance and you may get help paying for your insurance. (Asian Only)
14 We collected aided recall data on ads that ran immediately prior to the survey data collection period. During the data collection period some new ads were introduced for which no recall data were collected.
NORC | Covered California—Consumer Tracking Survey
FINAL REPORT | 29
Both of the ads with the highest recognition among its intended audience15 stress the fact that
Californians can no longer be denied insurance because of a pre-existing condition. One of the ads
was targeted only to Spanish speakers, and the other was targeted to both English and Spanish
speakers. The Spanish ad showed people opening doors and welcoming a new marketplace of
affordable health insurance. Overall recognition for this ad is 24%, and it is just as high for the
uninsured (25%) as it is for those already insured by Covered California (22%). In addition,
recognition of this Spanish-only ad is close to twice as high for 50- to 64-year-olds as for 18- to 34-
year-olds (20%) or 35- to 49-year-olds (21%). Recognition was lowest for the ad targeted to Asians.
Recognition of the English/Spanish ad followed the common pattern of being most recognized by
those who are already insured. Recognition increases with age.
Total Awareness (Aided + Unaided)
About half (49%) of consumers are aware of Covered California TV advertising either aided or
unaided. Total awareness is highest among those who are in the 139% to 199% income tier (54%)
and are, thus, eligible for the most generous federal assistance. However, it is much lower for those
eligible for expanded Medi-Cal (38%). It increases slightly with age, from 47% among 18- to 34-
year-olds to 53% among 50- to 64-year-olds, but there are no age differences in unaided awareness.
Total awareness is also lower among those interviewed in Spanish (42%) or another language,
usually an Asian one, (34%) than among those interviewed in English (51%).
15 The percentages in the table below are based on the intended audiences based on those who speak the language or languages used in the advertising.

NORC | Covered California—Consumer Tracking Survey
FINAL REPORT | 30
Exhibit 3.4.2a: Total and Unaided TV Ad Awareness
Unaided Ad Awareness
Total (Aided+Unaided) Ad Awareness
All (n=1,989) 27.9% 48.5% (24.5% – 31.3%) (44.7% – 52.3%)
Insurance Status (Screener)
Uninsured (n=934) 24.9% 46.3% (20.4% – 29.5%) (41.0% – 51.6%)
Insured, Covered CA (n=559) 34.7% 56.3% (27.0% – 42.5%) (48.0% – 64.6%)
Insured, non-Covered CA (n=496) 30.8% 48.7% (24.1% – 37.4%) (41.6% – 55.8%)
Age
18–34 (n=271) 27.9% 46.6% (21.7% – 34.1%) (39.7% – 53.4%)
35–49 (n=582) 28.3% 48.6% (23.0% – 33.6%) (42.8% – 54.5%)
50–64 (n=1,136) 27.4% 52.5% (23.3% – 31.6%) (47.1% – 57.9%)
Race/Ethnicity
African American (n=170) 29.5% 46.8% (17.4% – 41.6%) (32.1% – 61.5%)
Hispanic (n=340) 26.4% 49.0% (20.4% – 32.5%) (42.1% – 56.0%)
Asian/Pacific Islander (n=289) 23.4% 43.5% (15.7% – 31.0%) (34.0% – 52.9%)
White/other (n=1,190) 30.3% 49.5% (25.5% – 35.1%) (44.3% – 54.6%)
Language
Spanish (n=155) 20.3% 41.9% (12.8% – 27.9%) (32.3% – 51.5%)
English (n=1,772) 30.3% 50.8% (26.4% – 34.2%) (46.7% – 55.0%)
Other (n=62) 21.5% 34.1% (7.3% – 35.7%) (15.8% – 52.3%)

NORC | Covered California—Consumer Tracking Survey
FINAL REPORT | 31
Exhibit 3.4.2b: Total and Unaided TV Ad Awareness
Unaided Ad Awareness
Total (Aided+Unaided) Ad Awareness
All (n=1,989) 27.9% 48.5% (24.5% – 31.3%) (44.7% – 52.3%)
Gender
Male (n=865) 25.2% 44.7% (20.4% – 30.0%) (39.2% – 50.3%)
Female (n=1,124) 30.8% 52.5% (26.0% – 35.7%) (47.3% – 57.7%)
Region
LA County (n=506) 32.5% 53.1% (25.6% – 39.3%) (45.7% – 60.4%)
Other Southern CA (n=528) 30.0% 52.2% (23.5% – 36.5%) (45.1% – 59.2%)
Central Valley (n=258) 19.7% 34.1% (12.1% – 27.2%) (24.3% – 43.9%)
SF Bay Area (n=507) 22.4% 45.7% (16.2% – 28.6%) (37.9% – 53.5%)
Other Northern CA (n=136) 33.7% 54.5% (17.6% – 49.8%) (38.3% – 70.8%)
Income (Non-purchasers only)
400+ FPL (n=473) 28.1% 48.3% (21.2% – 35.0%) (40.6% – 56.1%)
200–399 FPL (n=491) 26.3% 45.0% (20.0% – 32.7%) (37.9% – 52.2%)
139–199 FPL (n=191) 29.4% 53.8% (19.0% – 39.8%) (42.7% – 64.9%)
100–138 FPL (n=153) 20.8% 38.3%

NORC | Covered California—Consumer Tracking Survey
FINAL REPORT | 32
3.5 Advertising Awareness and Key Campaign Success Metrics
Advertising awareness is linked to the following key metrics that reflect campaign success. There are
large differences between those who are aware of the advertising unaided and those who are not
aware of any ads. For example:
● Unaided awareness of Covered California (62% versus 43%)
● High level of knowledge about Covered California (54% versus 17%)
● Application for and purchase of a plan through Covered California (37% versus 25%, 50%
higher)
● Medium or high exposure to community-based campaign elements (53% versus 43%)
These results suggest that the advertising has had an important and synergistic impact on the success
of Covered California. The advertising has not only created awareness but it has also motivated
some consumers to learn more about Covered California by consulting with a counselor, going to an
event or otherwise engaging in the community-based outreach campaign (discussed in detail in the
next section). All of the elements of the community-based campaign require the consumer to take
initiative, and taking initiative, consulting with another person and going to an event can be
interpreted as a public statement of interest in Covered California. Social science theory and research
show that both taking initiative and making public statements are often precursors to action. Thus,
there is a synergistic effect between the advertising and community-based campaign elements.

NORC | Covered California—Consumer Tracking Survey
FINAL REPORT | 33
Exhibit 3.5.1a: The Link Between TV Advertising Awareness and Key Campaign Success Metrics
Ad Aware Unaided
(n=646)
Ad Aware Aided Only
(n=427)
Not Aware of Any Ads
(n=916)
All
(n=1,989)
Covered CA Awareness
Unaided awareness (n=1,197) 62.2% 56.7% 42.9% 51.1% (55.2% – 69.2%) (48.4% – 65.0%) (37.6% – 48.2%) (47.3% – 55.0%)
Aided awareness only (n=514) 31.0% 27.9% 25.2% 27.4% (24.4% – 37.6%) (20.2% – 35.6%) (20.6% – 29.8%) (24.0% – 30.8%)
Neither (n=278) 6.7% 15.4% 31.9% 21.5% (2.8% – 10.7%) (9.2% – 21.6%) (26.6% – 37.2%) (18.1% – 24.8%)
Covered CA Knowledge Composite
High knowledge (n=741) 54.2% 33.4% 17.1% 35.9% (47.4% – 60.9%) (27.3% – 39.5%) (11.5% – 22.6%) (32.0% – 39.7%)
Medium knowledge (n=734) 32.0% 40.6% 41.9% 38.1% (25.7% – 38.2%) (34.6% – 46.7%) (34.9% – 48.9%) (34.4% – 41.8%)
Low knowledge (n=514) 13.9% 25.9% 41.1% 26.1% (9.6% – 18.1%) (21.2% – 30.7%) (34.3% – 47.8%) (23.0% – 29.2%)
Overall Attitude Toward the ACA
ACA will be good for me 48.0% 53.3% 43.7% 47.0% (40.4% – 55.6%) (44.0% – 62.7%) (37.7% – 49.8%) (42.7% – 51.2%)
ACA will be bad for me 35.0% 34.2% 37.7% 36.2% (27.6% – 42.4%) (25.3% – 43.1%) (31.8% – 43.6%) (32.1% – 40.3%)
ACA will have no impact on me 17.0% 12.5% 18.6% 16.8% (10.9% – 23.1%) (6.8% – 18.2%) (13.6% – 23.5%) (13.5% – 20.1%)
Purchase Status
Covered CA purchaser (n=606) 23.4% 20.6% 15.1% 18.6% (18.0% – 28.8%) (14.3% – 26.9%) (11.5% – 18.7%) (15.9% – 21.3%)
Covered CA applied for but not purchased (n=226)
14.0% 14.5% 10.1% 12.1% (9.3% – 18.6%) (8.4% – 20.7%) (7.0% – 13.3%) (9.7% – 14.6%)
Not enrolled but will (n=243) 16.9% 19.9% 20.7% 19.5% (11.0% – 22.8%) (12.9% – 26.8%) (15.8% – 25.6%) (16.1% – 22.8%)
Not enrolled but may (n=302) 17.8% 22.3% 26.9% 23.4% (11.6% – 24.0%) (14.8% – 29.8%) (21.7% – 32.0%) (19.9% – 26.9%)
Not enrolled and will not (n=552) 27.9% 22.7% 27.2% 26.4% (21.5% – 34.3%) (16.0% – 29.4%) (22.5% – 31.8%) (23.1% – 29.7%)
Shopping Status
Purchased (n=606) 22.9% 20.1% 14.6% 18.0% (17.7% – 28.2%) (13.9% – 26.2%) (11.1% – 18.0%) (15.4% – 20.7%)
No purchase but looked (n=753) 48.6% 52.8% 45.3% 47.8% (41.5% – 55.8%) (44.5% – 61.0%) (39.9% – 50.8%) (43.9% – 51.6%)
No purchase and did not look (n=630) 28.5% 27.2% 40.1% 34.2% (21.7% – 35.2%) (20.0% – 34.3%) (34.8% – 45.4%) (30.5% – 37.8%)

NORC | Covered California—Consumer Tracking Survey
FINAL REPORT | 34
Exhibit 3.5.1b: The Link Between TV Advertising Awareness and Key Campaign Success Metrics
Ad Aware Unaided
(n=646)
Ad Aware Aided Only
(n=427)
Not Aware of Any Ads
(n=916)
All
(n=1,989)
Community-Based Campaign Exposure
No exposure (n=564) 47.4% 47.5% 56.7% 52.2% (40.3% - 54.6%) (39.3% - 55.8%) (51.4% - 62.0%) (48.4% - 56.0%)
Medium exposure (n=780) 35.7% 35.7% 30.6% 33.0% (28.9% - 42.4%) (27.6% - 43.7%) (25.6% - 35.5%) (29.5% - 36.6%)
High exposure (n=645) 16.9% 16.8% 12.7% 14.7% (12.0% - 21.8%) (10.6% - 23.0%) (9.4% - 16.1%) (12.2% - 17.3%)
Internet Exposure
No Internet (n=956) 41.7% 48.3% 58.9% 51.9% (34.6% - 48.7%) (40.0% - 56.6%) (53.6% - 64.2%) (48.0% - 55.7%)
Internet (n=1,033) 58.3% 51.7% 41.1% 48.1% (51.3% - 65.4%) (43.4% - 60.0%) (35.8% - 46.4%) (44.3% - 52.0%)
3.6 Exposure to Community-Based Campaign Elements
Exposure to Community-Based Campaign Elements
Community-based campaign elements include events (e.g. at a health fair, a workshop, an event at
church, etc.) or communications from a non-family/friend person (e.g. insurance agent or staff at a
government office) 16. Respondents were classified into three groups according to their level of
exposure, as follows:
● No exposure 52%
● Medium exposure (1 or 2 elements) 33%
● High exposure (3+ elements) 15%
The likelihood of exposure varies with age, race/ethnicity, language, gender, region and income
relative to the federal poverty level. Those most likely to report no exposure include:
● Consumers ages 18-34 (58%)
● Whites (60%)
● Males (57%)
16 In an early draft of this report, we grouped community-based elements with Internet elements in order to present a net “non-advertising” exposure measure. Since the Covered California Internet campaign includes both advertising and non-advertising elements we revised this section of the report to take a separate look at community-based and Internet elements.

NORC | Covered California—Consumer Tracking Survey
FINAL REPORT | 35
● Consumers living in Northern California outside San Francisco (67%)
● Consumers with incomes that are 200% to 399% of the federal poverty level (65%). These
consumers are eligible for federal assistance under the ACA but may not be aware of it.
Exhibit 3.6.1a: Exposure to Community-Based Campaign Elements
No Exposure Medium Exposure High Exposure
All (n=1,989) 52.2% 33.0% 14.7% (48.4% - 56.0%) (29.5% - 36.6%) (12.2% - 17.3%)
Insurance Status (Screener)
Uninsured (n=934) 57.6% 29.8% 12.6% (52.4% - 62.8%) (25.0% - 34.6%) (9.1% - 16.1%)
Insured, Covered CA (n=559) 25.9% 39.2% 34.9% (18.3% - 33.6%) (31.2% - 47.3%) (27.1% - 42.6%)
Insured, non-Covered CA (n=496) 56.3% 36.8% 6.9% (49.3% - 63.3%) (29.9% - 43.6%) (4.0% - 9.8%)
Age
18–34 (n=271) 57.6% 30.1% 12.3% (50.9% - 64.3%) (23.8% - 36.3%) (8.0% - 16.7%)
35–49 (n=582) 48.6% 33.0% 18.4% (42.7% - 54.4%) (27.5% - 38.6%) (13.9% - 22.9%)
50–64 (n=1,136) 47.0% 39.5% 13.5% (41.7% - 52.4%) (34.1% - 45.0%) (10.8% - 16.1%)
Race/Ethnicity
African American (n=170) 47.4% 38.1% 14.5% (32.3% - 62.6%) (23.1% - 53.0%) (7.4% - 21.7%)
Hispanic (n=340) 49.9% 34.7% 15.4% (42.9% - 56.8%) (28.1% - 41.4%) (10.6% - 20.2%)
Asian/Pacific Islander (n=289) 33.1% 40.6% 26.4% (23.9% - 42.3%) (31.1% - 50.0%) (18.0% - 34.7%)
White/other (n=1,190) 59.6% 29.2% 11.2% (54.7% - 64.5%) (24.7% - 33.7%) (8.3% - 14.1%)
Language
Spanish (n=155) 53.4% 30.6% 15.9% (43.6% - 63.2%) (21.6% - 39.7%) (9.0% - 22.9%)
English (n=1,772) 52.2% 33.7% 14.2% (48.1% - 56.3%) (29.7% - 37.6%) (11.5% - 16.8%)
Other (n=62) 42.8% 34.6% 22.6% (20.9% - 64.7%) (16.0% - 53.3%) (2.8% - 42.3%)

NORC | Covered California—Consumer Tracking Survey
FINAL REPORT | 36
Exhibit 3.6.1b: Exposure to Community-Based Campaign Elements
No Exposure Medium Exposure High Exposure
All (n=1,989) 52.2% 33.0% 14.7% (48.4% - 56.0%) (29.5% - 36.6%) (12.2% - 17.3%)
Gender
Male (n=865) 56.8% 31.1% 12.0% (51.4% - 62.3%) (26.0% - 36.3%) (8.6% - 15.4%)
Female (n=1,124) 47.3% 35.0% 17.6% (42.1% - 52.6%) (30.1% - 40.0%) (13.8% - 21.5%)
Region
LA County (n=506) 53.0% 32.7% 14.3% (45.7% - 60.3%) (25.8% - 39.6%) (9.7% - 18.9%)
Other Southern CA (n=528) 53.7% 32.0% 14.2% (46.7% - 60.8%) (25.5% - 38.6%) (9.5% - 18.9%)
Central Valley (n=258) 47.7% 34.4% 17.9% (36.6% - 58.7%) (24.2% - 44.6%) (9.6% - 26.3%)
SF Bay Area (n=507) 47.0% 35.1% 17.9% (39.2% - 54.8%) (27.6% - 42.6%) (12.1% - 23.8%)
Other Northern CA (n=136) 67.2% 24.6% 8.1% (54.8% - 79.7%) (14.0% - 35.3%) (2.8% - 13.5%)
Income (Non-purchasers only)
400+ FPL (n=473) 55.1% 35.8% 9.1% (47.5% - 62.8%) (28.5% - 43.2%) (4.9% - 13.2%)
200–399 FPL (n=491) 65.1% 22.5% 12.5% (58.3% - 71.8%) (16.6% - 28.3%) (7.8% - 17.2%)
139–199 FPL (n=191) 54.9% 33.7% 11.3% (43.9% - 66.0%) (23.1% - 44.3%) (5.0% - 17.6%)
100–138 FPL (n=153) 50.0% 38.7% 11.3% (37.7% - 62.4%) (26.2% - 51.2%) (3.7% - 18.9%)
The Link Between Exposure to Community-Based Elements and Key Campaign Success Metrics
There are strong links between exposure to community-based campaign elements and knowledge,
attitudes and both shopping and purchase behavior. For example,
● 40% of consumers with high exposure but just 8% of those with no exposure have enrolled
in a plan through Covered California.
● 82% of consumers with high exposure but just 56% of those with no exposure have either
purchased or looked into purchasing a plan through Covered California.
● 60% of consumers with high exposure but just 40% of those with no exposure say, “the
ACA will be good for me.”
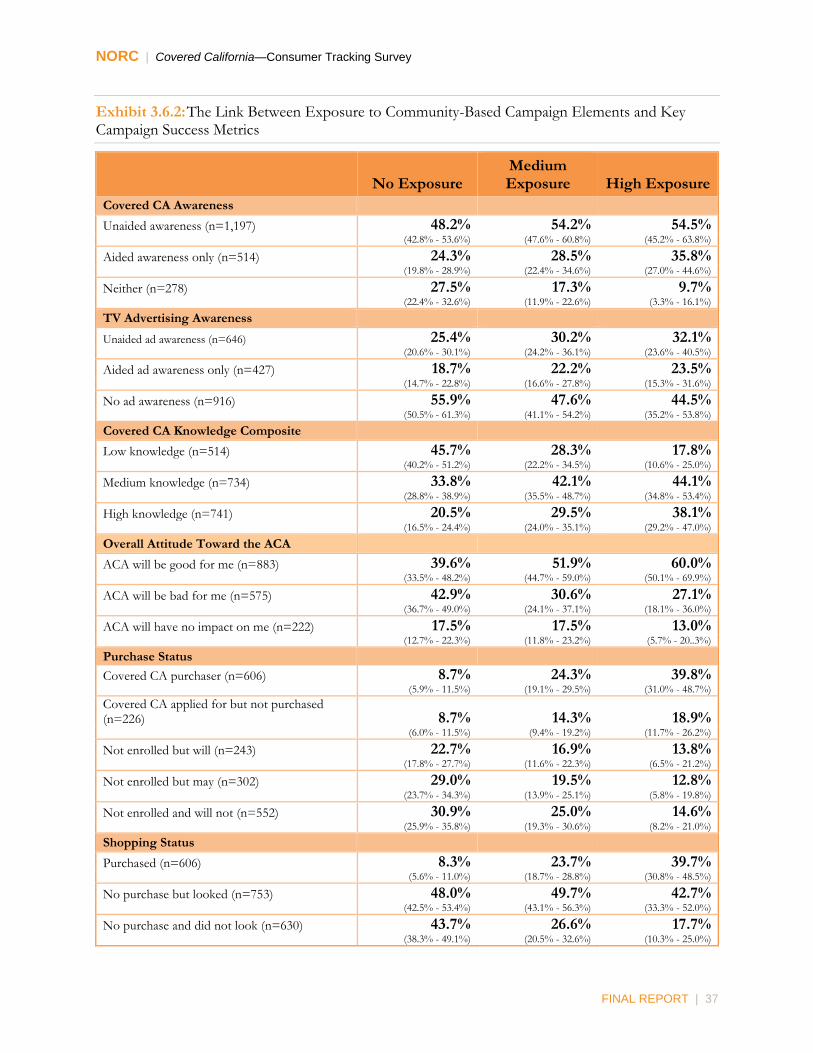
NORC | Covered California—Consumer Tracking Survey
FINAL REPORT | 37
Exhibit 3.6.2: The Link Between Exposure to Community-Based Campaign Elements and Key Campaign Success Metrics
No Exposure
Medium Exposure High Exposure
Covered CA Awareness
Unaided awareness (n=1,197) 48.2% 54.2% 54.5% (42.8% - 53.6%) (47.6% - 60.8%) (45.2% - 63.8%)
Aided awareness only (n=514) 24.3% 28.5% 35.8% (19.8% - 28.9%) (22.4% - 34.6%) (27.0% - 44.6%)
Neither (n=278) 27.5% 17.3% 9.7% (22.4% - 32.6%) (11.9% - 22.6%) (3.3% - 16.1%)
TV Advertising Awareness
Unaided ad awareness (n=646) 25.4% 30.2% 32.1% (20.6% - 30.1%) (24.2% - 36.1%) (23.6% - 40.5%)
Aided ad awareness only (n=427) 18.7% 22.2% 23.5% (14.7% - 22.8%) (16.6% - 27.8%) (15.3% - 31.6%)
No ad awareness (n=916) 55.9% 47.6% 44.5% (50.5% - 61.3%) (41.1% - 54.2%) (35.2% - 53.8%)
Covered CA Knowledge Composite Low knowledge (n=514) 45.7% 28.3% 17.8%
(40.2% - 51.2%) (22.2% - 34.5%) (10.6% - 25.0%)
Medium knowledge (n=734) 33.8% 42.1% 44.1% (28.8% - 38.9%) (35.5% - 48.7%) (34.8% - 53.4%)
High knowledge (n=741) 20.5% 29.5% 38.1% (16.5% - 24.4%) (24.0% - 35.1%) (29.2% - 47.0%)
Overall Attitude Toward the ACA
ACA will be good for me (n=883) 39.6% 51.9% 60.0% (33.5% - 48.2%) (44.7% - 59.0%) (50.1% - 69.9%)
ACA will be bad for me (n=575) 42.9% 30.6% 27.1% (36.7% - 49.0%) (24.1% - 37.1%) (18.1% - 36.0%)
ACA will have no impact on me (n=222) 17.5% 17.5% 13.0% (12.7% - 22.3%) (11.8% - 23.2%) (5.7% - 20..3%)
Purchase Status Covered CA purchaser (n=606) 8.7% 24.3% 39.8%
(5.9% - 11.5%) (19.1% - 29.5%) (31.0% - 48.7%)
Covered CA applied for but not purchased (n=226) 8.7% 14.3% 18.9%
(6.0% - 11.5%) (9.4% - 19.2%) (11.7% - 26.2%)
Not enrolled but will (n=243) 22.7% 16.9% 13.8% (17.8% - 27.7%) (11.6% - 22.3%) (6.5% - 21.2%)
Not enrolled but may (n=302) 29.0% 19.5% 12.8% (23.7% - 34.3%) (13.9% - 25.1%) (5.8% - 19.8%)
Not enrolled and will not (n=552) 30.9% 25.0% 14.6% (25.9% - 35.8%) (19.3% - 30.6%) (8.2% - 21.0%)
Shopping Status Purchased (n=606) 8.3% 23.7% 39.7%
(5.6% - 11.0%) (18.7% - 28.8%) (30.8% - 48.5%)
No purchase but looked (n=753) 48.0% 49.7% 42.7% (42.5% - 53.4%) (43.1% - 56.3%) (33.3% - 52.0%)
No purchase and did not look (n=630) 43.7% 26.6% 17.7% (38.3% - 49.1%) (20.5% - 32.6%) (10.3% - 25.0%)

NORC | Covered California—Consumer Tracking Survey
FINAL REPORT | 38
Exposure to Internet Versus Community-Based Activities
Consumers are equally likely to seek information from the Internet and attend community-based
events and meetings (both 48%). Those who are now insured through Covered California are
particularly likely to have used the Internet (64%) for information and to have attended a
community-based event or meeting (74%).
Key differences in participation between Internet and community-based outreach activities include:
● 18 to 34 year-olds are more likely to use the Internet than to get involved in community-
based activities (54% vs. 42%), while 50 to 64 year-olds are more likely to get involved in
community based activities (53%) than to use the Internet (36%).
● The heaviest Internet users, African Americans and Whites (both 56%) are almost as likely
to get involved in community-based activities (both 53%). Asians/Pacific Islanders (67%)
are the most likely to get involved in community-based activities and substantial numbers say
they used the Internet to get information (49%). The same patterns holds to a lesser extent
for Hispanics, with 39% using the Internet and 50% participating in community-based
activities This suggests that there is synergy between use of the Internet and involvement in
community-based activities.
● English-speaking consumers are more likely to use the Internet (55%) than to get involved in
community-based activities (48%); conversely those who speak Spanish are more likely to get
involved in community-based activities (47%) than to use the Internet (28%). Consumers
who speak “other” (mostly Asian) languages also depend more on community-based
activities (57%) than the Internet (25%) to learn about Covered California.
● Consumers living in the San Francisco Bay Area are more likely than residents of other areas
to both use both the Internet (55%) and community-based activities (53%) to get
information about Covered California. However, residents of the Central Valley (52%) are
also likely to get involved in community-based activities.
● Only about four in ten of those with incomes that qualify them for federal assistance (FPL
139% to 399%) have used the Internet to get information about Covered California,
compared to 54% of those with incomes too high to qualify for assistance.

NORC | Covered California—Consumer Tracking Survey
FINAL REPORT | 39
Exhibit 3.6.2a: Summary of Internet & Community-Based Element Exposure
Any Internet Information
Attended Any Event
Any Person in Official Capacity
Any Community Exposure
(event and person
combined)
All (n=1,989) 48.1% 20.4% 39.2% 47.8% (44.3% – 52.0%) (17.3% – 23.6%) (35.6% – 42.9%) (44.0% - 51.6%)
Insurance Status (Screener)
Uninsured (n=934) 44.2% 20.4% 32.5% 42.4% (39.0% – 49.5%) (16.1% – 24.7%) (27.6% – 37.4%) (37.2% - 47.6%)
Insured, Covered CA (n=559) 63.8% 33.3% 68.8% 74.1% (55.9% – 71.7%) (25.2% – 41.4%) (60.7% – 76.9%) (66.4% - 81.7%)
Insured, non-Covered CA (n=496) 47.3% 12.2% 36.2% 43.7% (40.2% – 54.4%) (7.2% – 17.1%) (29.7% – 42.7%) (36.7% - 50.7%)
Age
18–34 (n=271) 53.5% 19.5% 33.1% 42.4% (46.6% – 60.3%) (14.2% – 24.8%) (26.8% – 39.5%) (35.7% - 49.1%)
35–49 (n=582) 48.3% 23.3% 42.9% 51.4% (42.5% – 54.2%) (17.9% – 28.7%) (37.1% – 48.6%) (45.6% - 57.3%)
50–64 (n=1,136) 36.2% 17.2% 46.0% 53.0% (31.5% – 40.9%) (13.4% – 21.0%) (40.7% – 51.3%) (47.6% - 58.3%)
Race/Ethnicity
African American (n=170) 55.9% 24.3% 43.8% 52.6% (40.7% – 71.1%) (14.1% – 34.6%) (28.9% – 58.7%) (37.4% - 67.7%)
Hispanic (n=340) 38.8% 23.2% 37.3% 50.1% (32.0% – 45.6%) (17.4% – 29.1%) (30.7% – 44.0%) (43.2% - 57.1%)
Asian/Pacific Islander (n=289) 48.6% 35.9% 57.7% 66.9% (39.0% – 58.3%) (26.3% – 45.6%) (48.0% – 67.4%) (57.7% - 76.1%)
White/other (n=1,190) 55.8% 13.5% 35.9% 52.6% (50.7% – 60.9%) (9.8% – 17.2%) (31.2% – 40.6%) (37.4% - 67.7%)
Language
Spanish (n=155) 28.1% 21.8% 36.7% 46.6% (19.1% – 37.0%) (13.7% – 29.9%) (27.3% – 46.1%) (36.8% - 56.4%)
English (n=1,772) 54.5% 19.8% 39.5% 47.8% (50.4% – 58.6%) (16.4% – 23.2%) (35.5% – 43.4%) (43.7% - 51.9%)
Other (n=62) 25.1% 27.3% 53.6% 57.2% (4.9% – 45.4%) (6.5% – 48.2%) (31.9% – 75.3%) (35.3% - 79.1%)
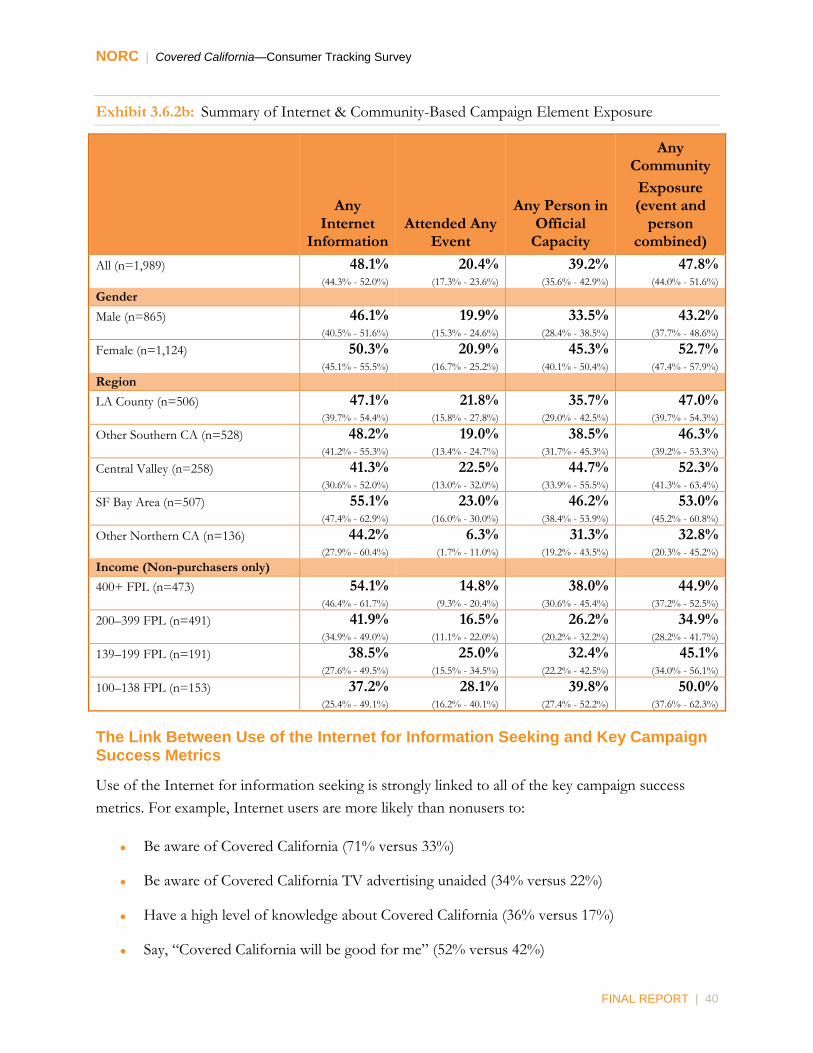
NORC | Covered California—Consumer Tracking Survey
FINAL REPORT | 40
Exhibit 3.6.2b: Summary of Internet & Community-Based Campaign Element Exposure
Any Internet
Information Attended Any
Event
Any Person in Official
Capacity
Any Community
Exposure (event and
person combined)
All (n=1,989) 48.1% 20.4% 39.2% 47.8% (44.3% - 52.0%) (17.3% - 23.6%) (35.6% - 42.9%) (44.0% - 51.6%)
Gender
Male (n=865) 46.1% 19.9% 33.5% 43.2% (40.5% - 51.6%) (15.3% - 24.6%) (28.4% - 38.5%) (37.7% - 48.6%)
Female (n=1,124) 50.3% 20.9% 45.3% 52.7% (45.1% - 55.5%) (16.7% - 25.2%) (40.1% - 50.4%) (47.4% - 57.9%)
Region
LA County (n=506) 47.1% 21.8% 35.7% 47.0% (39.7% - 54.4%) (15.8% - 27.8%) (29.0% - 42.5%) (39.7% - 54.3%)
Other Southern CA (n=528) 48.2% 19.0% 38.5% 46.3% (41.2% - 55.3%) (13.4% - 24.7%) (31.7% - 45.3%) (39.2% - 53.3%)
Central Valley (n=258) 41.3% 22.5% 44.7% 52.3% (30.6% - 52.0%) (13.0% - 32.0%) (33.9% - 55.5%) (41.3% - 63.4%)
SF Bay Area (n=507) 55.1% 23.0% 46.2% 53.0% (47.4% - 62.9%) (16.0% - 30.0%) (38.4% - 53.9%) (45.2% - 60.8%)
Other Northern CA (n=136) 44.2% 6.3% 31.3% 32.8% (27.9% - 60.4%) (1.7% - 11.0%) (19.2% - 43.5%) (20.3% - 45.2%)
Income (Non-purchasers only)
400+ FPL (n=473) 54.1% 14.8% 38.0% 44.9% (46.4% - 61.7%) (9.3% - 20.4%) (30.6% - 45.4%) (37.2% - 52.5%)
200–399 FPL (n=491) 41.9% 16.5% 26.2% 34.9% (34.9% - 49.0%) (11.1% - 22.0%) (20.2% - 32.2%) (28.2% - 41.7%)
139–199 FPL (n=191) 38.5% 25.0% 32.4% 45.1% (27.6% - 49.5%) (15.5% - 34.5%) (22.2% - 42.5%) (34.0% - 56.1%)
100–138 FPL (n=153) 37.2% 28.1% 39.8% 50.0% (25.4% - 49.1%) (16.2% - 40.1%) (27.4% - 52.2%) (37.6% - 62.3%)
The Link Between Use of the Internet for Information Seeking and Key Campaign Success Metrics
Use of the Internet for information seeking is strongly linked to all of the key campaign success
metrics. For example, Internet users are more likely than nonusers to:
● Be aware of Covered California (71% versus 33%)
● Be aware of Covered California TV advertising unaided (34% versus 22%)
● Have a high level of knowledge about Covered California (36% versus 17%)
● Say, “Covered California will be good for me” (52% versus 42%)

NORC | Covered California—Consumer Tracking Survey
FINAL REPORT | 41
● Be a Covered California purchasers (26% versus 12%)
It is important to recognize that many who used the Internet to seek information were also exposed
to Covered California advertising, although our survey measures did not allow us to distinguish
Internet advertising exposure from exposure to other Internet information.
These findings illustrate the power of the Internet, especially since it is an extremely important
communication channel for reaching 18 to 34 year-olds.

NORC | Covered California—Consumer Tracking Survey
FINAL REPORT | 42
Exhibit 3.6.3: The Link Between Internet Use for Information Seeking and Key Campaign Success Metrics
No Internet Internet All
Covered CA Awareness
Unaided awareness (n=1,197) 33.0% 70.7% 51.1% (28.1% - 37.9%) (65.6% - 75.8%) (47.3% - 55.0%)
Aided awareness only (n=514) 31.6% 22.9% 27.4% (26.6% - 36.6%) (18.3% - 27.4%) (24.0% - 30.8%)
Neither (n=278) 35.4% 6.5% 21.5% (30.1% - 40.7%) (3.3% - 9.6%) (18.1% - 24.8%)
TV Advertising Awareness
Unaided ad awareness (n=646) 22.4% 33.9% 27.9% (18.0% - 26.9%) (28.7% - 39.0%) (24.5% - 31.3%)
Aided ad awareness only (n=427) 19.1% 22.1% 20.6% (15.1% - 23.2%) (17.5% - 26.7%) (17.5% - 23.6%)
No ad awareness (n=916) 58.4% 44.0% 51.5% (53.2% - 63.7%) (38.6% - 49.4%) (47.7% - 55.3%)
Covered CA Knowledge Composite
Low knowledge (n=514) 48.1% 22.7% 35.9% (42.7% - 53.5%) (17.6% - 27.7%) (32.0% - 39.7%)
Medium knowledge (n=734) 35.3% 41.0% 38.1% (30.2% - 40.4%) (35.7% - 46.4%) (34.4% - 41.8%)
High knowledge (n=741) 16.6% 36.3% 26.1% (13.0% - 20.2%) (31.3% - 41.3%) (23.0% - 29.2%)
Overall Attitude Toward the ACA
ACA will be good for me (n=883) 41.5% 51.5% 47.0% (35.3% - 47.7%) (45.8% - 57.3%) (42.7% - 51.2%)
ACA will be bad for me (n=575) 40.3% 32.8% 36.2% (34.1% - 46.5%) (27.4% - 38.2%) (32.1% - 40.3%)
ACA will have no impact on me (n=222) 18.2% 15.7% 16.8% (13.2% - 23.2%) (11.3% - 20.1%) (13.5% - 20.1%)
Purchase Status
Covered CA purchaser (n=606) 11.5% 26.1% 18.6% (8.5% - 14.5%) (21.6% - 30.5%) (15.9% - 21.3%)
Covered CA applied for but not purchased (n=226) 8.9% 15.5% 12.1% (6.0% - 11.8%) (11.6% - 19.4%) (9.7% - 14.6%)
Not enrolled but will (n=243) 21.8% 17.1% 19.5% (16.9% - 26.6%) (12.5% - 21.6%) (16.1% - 22.8%)
Not enrolled but may (n=302) 28.4% 18.2% 23.4% (23.1% - 33.6%) (13.6% - 22.8%) (19.9% - 26.9%)
Not enrolled and will not (n=552) 29.5% 23.2% 26.4% (24.7% - 34.4%) (18.7% - 27.7%) (23.1% - 29.7%)
Shopping Status
Purchased (n=606) 11.0% 25.7% 18.0% (8.1% - 13.8%) (21.3% - 30.1%) (15.4% - 20.7%)
No purchase but looked (n=753) 39.3% 56.9% 47.8% (34.0% - 44.7%) (51.6% - 62.2%) (43.9% - 51.6%)
No purchase and did not look (n=630) 49.7% 17.5% 34.2% (44.3% - 55.1%) (13.2% - 21.7%) (30.5% - 37.8%)

NORC | Covered California—Consumer Tracking Survey
FINAL REPORT | 43
Information from Friends and Family
More than one-third (35%) of respondents named friends and family as a source of information
about Covered California. Friends and family seem to have exerted a positive influence, since 53%
of those receiving information that way are now insured via Covered California, compared to just
33% of those who remain uninsured. Friends and family are an especially important source of
information for Asians (43%) and African Americans (38%). It is less important for Hispanics
interviewed in Spanish (28%), perhaps because relatively few unacculturated Hispanics have health
insurance and, at the time, relatively few had enrolled in Covered California.
Exhibit 3.6.4: Percent Receiving Information from Friends and Family
Percent who Received Some Information About Covered
CA from Friends/Family
All (n=1,989) 34.7% (31.0% – 38.4%)
Insurance Status (Screener)
Uninsured (n=934) 33.2% (28.1% – 38.3%)
Insured, Covered CA (n=559) 52.6% (44.4% – 60.7%)
Insured, non-Covered CA (n=496) 26.8% (20.4% – 33.2%)
Age
18–34 (n=271) 43.6% (36.7% – 50.4%)
35–49 (n=582) 30.1% (24.8% – 35.3%)
50–64 (n=1,136) 23.7% (19.1% – 28.3%)
Race/Ethnicity
African American (n=170) 38.0% (22.5% – 53.5%)
Hispanic (n=340) 32.2% (25.6% – 38.9%)
Asian/Pacific Islander (n=289) 42.6% (33.0% – 52.2%)
White/other (n=1,190) 34.6% (29.5% – 39.8%)
Language
Spanish (n=155) 27.6% (18.6% – 36.6%)
English (n=1,772) 36.6% (32.5% – 40.7%)
Other (n=62) 36.6% (15.5% – 57.6%)

NORC | Covered California—Consumer Tracking Survey
FINAL REPORT | 44
3.7 Knowledge
Changes in Knowledge Since the Baseline study
There have been increases of at least 20 percentage points in knowledge of three critical pieces of
information:
● Consumers can get health insurance through Covered California even if they have a pre-
existing condition (59% to 83%).17
● They can shop and buy it on the Covered California website (54% to 79%).
● They will have to pay a penalty if they don’t get it before April 1 (53% to 75%).
There have also been increases of at least 10 percentage points in the percentage knowing that:
● Low- and moderate-income people can get tax credits to help reduce monthly premiums
(38% to 51%) and
● Covered California is the only place they can get these tax credits (23% to 37%).
Knowledge that Covered California offers private health insurance plans that will compete for your
business has increased 5 percentage points (37% to 42%).
However, there has been a 10-percentage-point decrease in the number knowing that people with
lower incomes will pay less for out-of-pocket costs when they get health care (48% to 38%).
Several negative misperceptions about Covered California have been at least partially corrected.
There have been increases in the number who know that the following statements are false:
● Covered California is operated by the health insurance industry (22% to 36%)
● Covered California offers only government health insurance plans (27% to 45%)
● The health plans meet people's basic needs but generally are not as good as the plans sold
elsewhere (24% to 32%)
● Covered California is a welfare program (35% to 43%)
17 This fact was rated as the most important fact about Covered California in the baseline study.

NORC | Covered California—Consumer Tracking Survey
FINAL REPORT | 45
Exhibit 3.7.1: Knowledge of Covered California (Percent of Correct Answers)
Baseline (n=2,756)
Wave 1 (n=1,989) Difference
Covered California is operated by the health insurance industry. (False)
22.2% 35.5% 13.3%
(19.7% – 24.7%) (32.0% – 39.0%)
Covered California offers only government health insurance plans. (False)
26.8% 44.9% 18.1%
(24.2% – 29.5%) (41.2% – 48.7%)
The health plans meet people's basic needs but generally are not as good as the plans sold elsewhere. (False)
23.5% 32.1% 8.6%
(20.9% – 26.1%) (28.7% – 35.6%)
People with low and moderate incomes receive a tax credit to reduce their monthly cost or premium. (True)
37.8% 51.1% 13.3%
(34.8% – 40.8%) (47.3% – 54.9%)
People with lower incomes pay less for out-of-pocket costs than they have to pay when go to get health care. These are costs the patient has to cover before the insurance begins paying. (True)
48.2% 37.9% -10.3%
(45.1% – 51.3%) (34.2% – 41.6%)
You can get information, compare plans, and get health insurance by going online to the Covered California website. (True)
53.9% 78.6% 24.7%
(50.8% – 57.0%) (75.4% – 81.8%)
Most people who don't have health insurance by April 2014 will have to pay a penalty. (True)
52.7% 75.2% 22.5%
(49.6% – 55.8%) (72.0% – 78.4%)
Covered California is a welfare program. (False) 34.5% 43.1% 8.6%
(31.6% – 37.4%) (39.4% – 46.8%)
Covered California is the only place low- and moderate-income people can get tax credits to help reduce the cost of the monthly health plan premium. (True)
23.1% 37.4% 14.3%
(20.4% – 25.8%) (33.7% – 41.0%)
Covered California offers private health insurance plans that will compete for your business. (True)
36.9% 42.0% 5.1%
(33.9% – 39.9%) (38.3% – 45.7%)
You can get health insurance through Covered California even if you have a pre-existing condition. (True)
58.6% 82.8% 24.2%
(55.5% – 61.7%) (79.8% – 85.9%)
As one might expect, those who have already gotten insurance through Covered California are more
knowledgeable than those who remain uninsured about all of the facts included in the survey.
However, very strong majorities of the uninsured know the key facts:
● You can get health insurance through Covered California even if you have pre-existing
condition (77%).
● You can shop for it and enroll in a plan on the Covered California website (74%).
● You will have to pay a penalty if you don’t enroll before April 1 (74%).

NORC | Covered California—Consumer Tracking Survey
FINAL REPORT | 46
Differences in Levels of Knowledge About Covered California
Consumers were categorized according to whether their knowledge of Covered California is high
(26%), medium (38%), or low (26%). Those with four or less correct answers were classified as
having low Covered CA knowledge, those with five to seven correct answers were classified as
having medium Covered CA knowledge, and those with eight or more correct answers were
classified as having high Covered CA knowledge.
Like the results on awareness, these results show that lack of English-language proficiency is a
serious barrier to learning about Covered California: consumers interviewed in Spanish (8%) or
another non-English language (3%) are very unlikely to have high levels of knowledge of the
program. However, 18-to 34-year-olds, a group that tends to perceive little need for health
insurance, are no less likely to have high knowledge levels than are older consumers.
Ironically, consumers who are eligible for federal assistance are only about half as likely to have a
high level of knowledge about Covered California (17%) as those whose incomes are too high to
qualify for assistance (35%). Residents of the San Francisco Bay Area (32%), other parts of
Northern California (34%), and Los Angeles County (31%) are the most likely to have high
knowledge levels.

NORC | Covered California—Consumer Tracking Survey
FINAL REPORT | 47
Exhibit 3.7.1a: Knowledge of Covered California (Based on the Percentage of Correct Answers) by Demographics
Low Knowledge Medium
Knowledge High
Knowledge
All (n=1,989) 35.9% 38.1% 26.1% (32.0% – 39.7%) (34.4% – 41.8%) (23.0% – 29.2%)
Insurance Status (Screener)
Uninsured (n=934) 47.5% 34.9% 17.6% (42.2% – 52.8%) (29.9% – 39.8%) (13.8% – 21.4%)
Insured, Covered-CA (n=559) 13.3% 43.3% 43.4% (7.5% – 19.1%) (34.8% – 51.7%) (35.5% – 51.4%)
Insured, non-Covered-CA (n=496) 22.7% 42.4% 34.9% (16.4% – 28.9%) (35.3% – 49.5%) (28.5% – 41.4%)
Age
18–34 (n=271) 33.4% 41.8% 24.8% (26.8% – 40.1%) (35.0% – 48.5%) (19.1% – 30.5%)
35–49 (n=582) 39.2% 34.2% 26.7% (33.1% – 45.2%) (28.7% – 39.6%) (22.1% – 31.3%)
50–64 (n=1,136) 35.2% 37.1% 27.7% (29.4% – 40.9%) (32.1% – 42.1%) (23.8% – 31.6%)
Race/Ethnicity
African American (n=170) 30.9% 23.7% 45.4% (15.4% – 46.4%) (13.1% – 34.4%) (30.4% – 60.3%)
Hispanic (n=340) 48.3% 38.0% 13.8% (41.3% – 55.2%) (31.2% – 44.7%) (9.4% – 18.1%)
Asian/Pacific Islander (n=289) 30.1% 44.4% 25.4% (21.0% – 39.2%) (34.8% – 54.1%) (17.7% – 33.2%)
White/other (n=1,190) 26.5% 37.8% 35.8% (21.7% – 31.2%) (32.8% – 42.8%) (30.9% – 40.6%)
Language
Spanish (n=155) 58.5% 33.4% 8.0% (48.9% – 68.2%) (24.2% – 42.7%) (3.0% – 13.0%)
English (n=1,772) 29.2% 38.9% 31.9% (25.3% – 33.2%) (34.8% – 43.0%) (28.2% – 35.5%)
Other (n=62) 44.3% 52.4% 3.3% (22.5% – 66.0%) (30.8% – 74.1%) (0.2% – 6.4%)

NORC | Covered California—Consumer Tracking Survey
FINAL REPORT | 48
Exhibit 3.7.1b: Knowledge of Covered California (Based on the Percentage of Correct Answers) by Demographics
Low Knowledge Medium
Knowledge High
Knowledge
All (n=1,989) 35.9% 38.1% 26.1% (32.0% – 39.7%) (34.4% – 41.8%) (23.0% – 29.2%)
Gender
Male (n=865) 39.4% 34.8% 25.8% (33.8% – 45.0%) (29.5% – 40.1%) (21.3% – 30.3%)
Female (n=1,124) 32.2% 41.5% 26.3% (27.1% – 37.2%) (36.3% – 46.7%) (22.1% – 30.6%)
Region
LA County (n=506) 34.0% 34.9% 31.0% (26.7% – 41.3%) (28.1% – 41.8%) (24.6% – 37.5%)
Other Southern CA (n=528) 40.5% 39.7% 19.8% (33.4% – 47.6%) (32.8% – 46.6%) (14.8% – 24.9%)
Central Valley (n=258) 43.2% 37.5% 19.3% (32.1% – 54.3%) (26.8% – 48.1%) (11.5% – 27.1%)
SF Bay Area (n=507) 28.1% 39.7% 32.2% (20.7% – 35.5%) (31.9% – 47.5%) (25.5% – 38.8%)
Other Northern CA (n=136) 21.2% 44.4% 34.4% (8.0% – 34.5%) (28.0% – 60.7%) (19.0% – 49.8%)
Income (Non-purchasers only)
400+ FPL (n=473) 28.1% 36.8% 35.1% (20.5% – 35.6%) (29.3% – 44.2%) (28.2% – 42.1%)
200–399 FPL (n=491) 45.9% 36.8% 17.3% (38.7% – 53.1%) (29.9% – 43.7%) (12.3% – 22.3%)
139–199 FPL (n=191) 47.0% 36.2% 16.9% (35.8% – 58.2%) (25.6% – 46.7%) (8.4% – 25.3%)
100–138 FPL (n=153) 45.1% 39.2% 15.7% (32.7% – 57.4%) (27.2% – 51.2%) (7.1% – 24.3%)
3.8 Social/Normative Beliefs
Social normative beliefs—that is, beliefs about the attitudes and perceptions of others—often
influence behavior. This study examined two such beliefs, one positive and one negative. The
positive social normative belief (“A lot of people who did not have health insurance before are
getting it now because it is the right thing to do”) both suggests a social trend and legitimizes it. The
negative social normative belief (“Most people like me don’t have health insurance”) gives the
uninsured a rationale for not getting insurance. About four in ten strongly agree with both the
positive (40%) and negative statements (38%).
There has been an increase in the positive normative belief that “a lot of people who did not have
health insurance before are getting it now because it is the right thing to do” (29% to 40%). There
has also been a much smaller increase in the negative normative belief that “most people like me
don’t have health insurance (34% to 38%).

NORC | Covered California—Consumer Tracking Survey
FINAL REPORT | 49
There is evidence that social norms are a positive influence in racially/ethnically diverse
communities and neighborhoods. All of the diverse groups—African Americans (57%), Hispanics
interviewed in Spanish (55%), Hispanics generally (48%), Asians (47%), and those interviewed in
“other” (mainly Asian) languages (52%)—are more likely than Whites (29%) to strongly agree with
the positive statement that “a lot of people who didn’t have health insurance before are getting it
now because it is the right thing to do.” On the other hand, fewer 18- to 34-year-olds (36%) than
older consumers (43%) strongly agree with this positive social norm.
There is also evidence that the negative social norm, “most people like me don’t have health
insurance,” is having a depressing effect on enrollment. Nearly twice as many consumers who
remain uninsured (51%) as those who have gotten insurance via Covered California (27%) strongly
agree with this statement.
This de-motivating idea is stronger among consumers under age 50 (39%, strongly agree) than it is
for 50- to 64-year-olds (31%). It is also more prevalent among African Americans (51%) and
Hispanics (52%), groups more likely to be uninsured, than it is among Whites (25%) and Asians
(29%), who are more affluent on average and more likely to be uninsured. Thus, it reflects reality for
many of the uninsured that could benefit most from getting insurance via Covered California. This
reality, however, should change as more consumers in African American and Hispanic communities
get health insurance.

NORC | Covered California—Consumer Tracking Survey
FINAL REPORT | 50
Exhibit 3.8.1: Social Normative Beliefs
Strongly Agree
A Lot of Uninsured People Are Getting
Insurance Now
Strongly Agree
Most People Like Me Don’t Have Insurance
All (n=1,989) 39.6% 37.5% (35.8% – 43.4%) (33.6% – 41.3%)
Survey Round
Wave 1 (n=1,989) 39.6% 37.5% (35.8% – 43.4%) (33.6% – 41.3%)
Baseline (n=2,756) 28.9% 33.5% (25.9% – 31.9%) (30.4% – 36.5%)
Insurance Status (Screener)
Uninsured (n=934) 42.9% 50.9% (37.5% – 48.2%) (45.5% – 56.3%)
Insured, Covered CA (n=559) 45.3% 26.9% (37.1% – 53.6%) (19.5% – 34.3%)
Insured, non-Covered CA (n=496) 28.0% 11.4% (21.4% – 34.6%) (5.9% – 17.0%)
Age
18–34 (n=271) 35.7% 39.2% (29.0% – 42.3%) (32.3% – 46.1%)
35–49 (n=582) 42.5% 38.9% (36.5% – 48.5%) (32.9% – 44.8%)
50–64 (n=1,136) 43.0% 30.9% (37.6% – 48.4%) (25.3% – 36.5%)
Race/Ethnicity
African American (n=170) 57.3% 51.2% (42.8% – 71.7%) (35.2% – 67.1%)
Hispanic (n=340) 47.9% 51.8% (40.9% – 54.8%) (44.8% – 58.8%)
Asian/Pacific Islander (n=289) 46.5% 29.4% (36.7% – 56.3%) (20.3% – 38.6%)
White/other (n=1,190) 28.7% 24.8% (24.0% – 33.4%) (20.2% – 29.5%)
Language
Spanish (n=155) 55.4% 58.7% (45.7% – 65.2%) (49.0% – 68.5%)
English (n=1,772) 34.7% 31.3% (30.7% – 38.7%) (27.3% – 35.4%)
Other (n=62) 52.0% 37.4% (30.1% – 74.0%) (16.4% – 58.5%)

NORC | Covered California—Consumer Tracking Survey
FINAL REPORT | 51
3.9 Shopping Status
Overall, 18% purchased health insurance via Covered California, 48% shopped but didn’t purchase,
and 34% didn’t shop.
Consumers ages 18–34 are just as likely to shop as their elders, but they tend to shop but not buy
(52% versus 46% of 35- to 49-year-olds and 41% of 50- to 64-year-olds). Actual purchase increases
with age from 14% for 18- to 34-year-olds to 20% for 35- to 49-year-olds to 34% for 50- to 64-year-
olds.
Hispanics also tend to shop but not buy (56%): only 13% made a purchase. This pattern is even
stronger for Hispanics interviewed in Spanish: just 11% made a purchase, while 71% shopped
without buying. Of all the racial/ethnic groups, Asians (25%) are the most likely to be purchasers,
and this is especially true for those interviewed in a language other than Spanish or English (31%).
Consumers who are eligible for federal assistance are most likely to have shopped without buying:
66% of those in the 139%-199% FPL tier (who are eligible for the most generous assistance) and
60% of those in the 200%–399% FPL tier shopped but did not buy insurance via Covered
California.18
18 Since only non-purchasers were asked their income, we cannot compare the FPL levels of purchasers to non-purchasers.

NORC | Covered California—Consumer Tracking Survey
FINAL REPORT | 52
Exhibit 3.9.1a: Shopping Status
Purchased No Purchase But Looked
No Purchase and Did Not
Look
All (n=1,989) 18.0% 47.8% 34.2% (15.4% – 20.7%) (43.9% – 51.6%) (30.5% – 37.8%)
Age
18–34 (n=271) 13.7% 52.2% 34.1% (9.3% – 18.1%) (45.3% – 59.1%) (27.5% – 40.7%)
35–49 (n=582) 19.8% 46.1% 34.1% (15.5% – 24.1%) (40.2% – 52.0%) (28.5% – 39.7%)
50–64 (n=1,136) 24.4% 41.1% 34.5% (20.0% – 28.7%) (35.6% – 46.6%) (29.7% – 39.3%)
Race/Ethnicity
African American (n=170) 20.0% 51.9% 28.1% (9.8% – 30.2%) (36.9% – 66.8%) (14.5% – 41.7%)
Hispanic (n=340) 13.1% 56.0% 30.9% (8.9% – 17.3%) (49.1% – 62.9%) (24.4% – 37.3%)
Asian/Pacific Islander (n=289) 24.9% 42.4% 32.7% (17.1% – 32.7%) (32.9% – 51.9%) (23.2% – 42.2%)
White/other (n=1,190) 20.6% 41.3% 38.1% (16.7% – 24.5%) (36.2% – 46.4%) (33.1% – 43.1%)
Language
Spanish (n=155) 10.6% 70.5% 19.0% (4.9% – 16.2%) (61.6% – 79.3%) (11.3% – 26.7%)
English (n=1,772) 19.7% 41.9% 38.4% (16.7% – 22.7%) (37.7% – 46.0%) (34.3% – 42.5%)
Other (n=62) 31.4% 34.7% 34.0% (11.2% – 51.6%) (13.7% – 55.6%) (13.9% – 54.1%)

NORC | Covered California—Consumer Tracking Survey
FINAL REPORT | 53
Exhibit 3.9.1b: Shopping Status
Purchased No Purchase But Looked
No Purchase and Did Not
Look
All (n=1,989) 18.0% 47.8% 34.2% (15.4% – 20.7%) (43.9% – 51.6%) (30.5% – 37.8%)
Gender
Male (n=865) 16.5% 44.1% 39.5% (12.8% – 20.2%) (38.5% – 49.7%) (34.0% – 45.0%)
Female (n=1,124) 19.7% 51.7% 28.6% (16.0% – 23.4%) (46.5% – 56.9%) (24.0% – 33.3%)
Region
LA County (n=506) 15.9% 45.5% 38.6% (11.2% – 20.7%) (38.2% – 52.8%) (31.3% – 45.8%)
Other Southern CA (n=528) 13.3% 54.1% 32.6% (9.4% – 17.3%) (47.1% – 61.0%) (26.0% – 39.2%)
Central Valley (n=258) 16.7% 53.8% 29.5% (9.4% – 24.0%) (42.9% – 64.6%) (19.8% – 39.2%)
SF Bay Area (n=507) 30.2% 37.7% 32.1% (23.0% – 37.4%) (30.1% – 45.3%) (24.8% – 39.4%)
Other Northern CA (n=136) 13.4% 43.5% 43.1% (6.5% – 20.3%) (27.2% – 59.7%) (26.4% – 59.8%)
Income (Non-purchasers only)
400+ FPL (n=473) N.A. 56.2% 43.8% N.A. (48.6% – 63.8%) (36.2% – 51.4%)
200–399 FPL (n=491) N.A. 60.3% 39.7% N.A. (53.3% – 67.3%) (32.7% – 46.7%)
139–199 FPL (n=191) N.A. 65.9% 34.1% N.A. (55.4% – 76.4%) (23.6% – 44.6%)
100–138 FPL (n=153) N.A. 50.6% 49.4% N.A. (38.2% – 62.9%) (37.1% – 61.8%)
3.10 Motivation and Experience of Purchasers
Purchaser Motivation
More than half (51%) of purchasers say that saving money (by getting a lower cost or a federal
subsidy) is the main reason they enrolled in a Covered California health insurance plan. One-third
cited security, or assurance that one will be able to get both insurance and health care no matter
what happens, making it the second most important reason. The third most-important reason—
avoiding the penalty for not being insured—was cited by 14%. The idea of being in control (that is,
being able to get the health care when needed and wanted without having to wait) was mentioned by
just 9%. All of these consumer benefits outweighed the idea of getting health insurance through
Covered California because it “is the right thing to do” or because of support for “Obamacare”
(5%).

NORC | Covered California—Consumer Tracking Survey
FINAL REPORT | 54
Saving money is more important to Whites (57%) than to other racial/ethnic groups, and it is least
important to African Americans (41%), who place a higher priority on security (51%) than other
groups. Whites and consumers ages 50–64 (both 39%) also place a relatively high value on security,
while Asians (16%) place a low value on it. The penalty does not seem to be a motivator for young
consumers and African Americans: just 8% of purchasers in the 18–34 age group and 4% of African
Americans cited it as the main reason for purchase.
Exhibit 3.10.1: Main Reason for Purchasing
Saving Money
Being in Control Security
Mandated/
Avoid Penalty
Right Thing to
Do Better Health
All (n=606) 51.9% 9.2% 32.7% 14.0% 4.5% 1.3% (44.1% – 59.7%) (5.4% – 13.0%) (25.4% – 39.9%) (8.5% – 19.6%) (1.5% – 7.5%) (0.4% – 2.2%)
Age
18–34 (n=46) 53.8% 4.7% 33.5% 7.6% 2.4% 0.5% (36.8% – 70.8%) (0.0% – 10.4%) (17.4% – 49.6%) (0.0% – 15.4%) (0.0% – 7.2%) (0.0% – 1.6%)
35–49 (n=166) 50.1% 13.5% 27.5% 21.1% 6.6% 1.0% (38.4% – 61.7%) (5.8% – 21.2%) (17.6% – 37.4%) (9.8% – 32.3%) (0.4% – 12.8%) (0.0% – 2.3%)
50–64 (n=394) 52.4% 8.5% 39.2% 11.7% 3.8% 2.7% (42.5% – 62.3%) (4.6% – 12.3%) (29.4% – 48.9%) (7.4% – 16.0%) (1.6% – 6.1%) (0.4% – 5.0%)
Race/Ethnicity
African American (n=50) 41.1% 9.5% 51.1% 4.3% 0.0% 8.2% (16.6% – 65.5%) (1.4% – 17.6%) (24.9% – 77.4%) (0.0% – 9.9%) N.A. (0.0% – 18.6%)
Hispanic (n=67) 45.8% 11.2% 27.8% 22.1% 0.0% 1.4% (29.0% – 62.6%) (2.4% – 20.0%) (14.6% – 41.0%) (6.5% – 37.6%) N.A. (0.0% – 3.3%)
Asian/Pacific Islander (n=110)
51.4% 16.1% 16.0% 15.9% 13.5% 1.5% (34.0% – 68.7%) (2.6% – 29.6%) (7.6% – 24.4%) (3.7% – 28.1%) (0.0% – 27.7%) (0.0% – 3.5%)
White/other (n=379) 56.6% 6.0% 39.1% 9.6% 4.6% 0.6% (46.2% – 66.9%) (2.8% – 9.2%) (28.6% – 49.5%) (6.1% – 13.2%) (1.1% – 8.2%) (0.0% – 1.4%)
Language
Spanish (n=24) 26.8% 11.7% 30.3% 38.8% 0.2% 2.5% (2.0% – 51.6%) (0.0% – 26.7%) (6.5% – 54.2%) (10.2% – 67.3%) (0.0% – 0.7%) (0.0% – 6.8%)
English (n=557) 54.9% 8.7% 33.8% 10.4% 5.3% 0.9% (46.8% – 63.0%) (4.8% – 12.7%) (26.0% – 41.5%) (6.4% – 14.4%) (1.7% – 8.9%) (0.2% – 1.7%)
Other (n=25) 66.9% 11.7% 18.5% 13.4% 0.0% 4.9% (38.5% – 95.4%) (0.0% – 26.6%) (0.0% – 38.9%) (0.0% – 30.7%) N.A. (0.0% – 12.3%)
Where Purchasers Purchased Their Plan
While the website is the most common venue for purchasing health insurance under Covered
California, personal consultation and the toll-free number play a vital role for consumers who may
have limited computer skills or English-language proficiency. Sixty-three percent of purchasers,
including 77% of 18- to 34-year-olds and 75% of Whites, purchased their plan on the Covered
California website. Relatively few consulted with insurance agents (14%) or a Covered California

NORC | Covered California—Consumer Tracking Survey
FINAL REPORT | 55
counselor (11%) or called the Covered California toll-free number (8%).19 However, insurance
agents were especially popular among African Americans (32%), Asians (27%), and consumers
interviewed in another (usually Asian) language (41%), while Hispanics interviewed in Spanish were
likely to consult with a Covered California counselor (39%) or call the toll-free number (23%).
Exhibit 3.10.2: Where Did You Purchase Your Plan?
Covered California Website
Covered California Toll-Free Number
Covered California Certified
Counselor Insurance
Agent
A Government
Office
All (n=606) 62.5% 8.2% 11.2% 13.7% 4.4% (55.0% – 70.0%) (4.2% – 12.2%) (5.9% – 16.5%) (8.9% – 18.6%) (0.8% – 8.0%)
Age
18–34 (n=46) 77.0% 3.7% 0.7% 12.6% 5.9% (62.1% – 91.9%) (0.0% – 9.7%) (0.0% – 2.2%) (0.0% – 25.3%) (0.0% – 13.9%)
35–49 (n=166) 56.9% 9.2% 15.7% 13.8% 4.4% (45.1% – 68.6%) (1.4% – 17.0%) (6.0% – 25.4%) (8.2% – 19.3%) (0.0% – 10.3%)
50–64 (n=394) 53.6% 12.0% 17.0% 15.0% 2.5% (43.4% – 63.7%) (6.6% – 17.3%) (5.6% – 28.4%) (10.3% – 19.7%) (0.0% – 5.5%)
Race/Ethnicity
African American (n=50) 42.8% 11.0% 11.2% 31.7% 3.3% (18.0% – 67.5%) (0.0% – 23.0%) (0.0% – 27.5%) (1.1% – 62.3%) (0.0% – 8.0%)
Hispanic (n=67) 50.4% 14.7% 21.1% 9.0% 4.8% (33.4% – 67.4%) (3.0% – 26.4%) (6.6% – 35.6%) (0.0% – 18.7%) (0.0% – 10.7%)
Asian/Pacific Islander (n=110) 47.2% 6.6% 8.6% 26.6% 10.9% (31.0% – 63.4%) (0.0% – 15.4%) (2.4% – 14.9%) (15.0% – 38.2%) (0.0% – 25.7%)
White/other (n=379) 75.2% 4.7% 6.2% 11.5% 2.4% (66.7% – 83.7%) (2.5% – 6.9%) (1.3% – 11.2%) (5.5% – 17.5%) (0.0% – 6.8%)
Language
Spanish (n=24) 35.9% 23.3% 38.7% 2.2% 0.0% (6.8% – 64.9%) (0.3% – 46.3%) (10.8% – 66.5%) (0.0% – 5.7%) N.A.
English (n=557) 67.3% 6.2% 6.9% 14.6% 5.1% (59.7% – 74.8%) (3.1% – 9.3%) (2.7% – 11.1%) (9.1% – 20.1%) (0.9% – 9.3%)
Other (n=25) 31.3% 3.5% 22.6% 41.4% 1.3% (6.2% – 56.3%) (0.0% – 10.4%) (0.0% – 48.2%) (14.8% – 67.9%) (0.0% – 3.8%)
19 Covered California has separate data indicating a much high proportion of enrollments coming from agents. It is possible that some survey respondents may have made extensive use of the web enrollment portal even though they later completed the enrollment with an agent

NORC | Covered California—Consumer Tracking Survey
FINAL REPORT | 56
Problems Encountered
Website problems were mentioned by 29% of purchasers. The only other problems mentioned by
more than 5% were problems contacting Covered California (12%), problems with the process
(8%), and confusion about the process, information, or insurance (6%). Problems with contacting
Covered California were noted most often by residents of Northern California (other than San
Francisco) (31%).
Exhibit 3.10.3: Most Common Problems Encountered While Purchasing Plan
Any Problem Reported
Website Problems
Problems Contacting Covered California
Problems with the Process
Confusion About
Process/
Information
All (n=606) 53.0% 29.4% 12.4% 8.0% 5.7% (45.2% – 60.8%) (22.1% – 36.7%) (7.2% – 17.6%) (3.3% – 12.7%) (2.3% – 9.1%)
Age
18–34 (n=46) 58.4% 32.0% 13.6% 12.8% 4.4% (42.1% – 74.8%) (16.0% – 48.1%) (0.9% – 26.4%) (0.0% – 25.5%) (0.0% – 10.8%)
35–49 (n=166) 51.6% 30.5% 10.8% 5.4% 6.1% (39.8% – 63.4%) (19.1% – 41.9%) (4.1% – 17.5%) (1.4% – 9.4%) (0.0% – 12.2%)
50–64 (n=394) 48.4% 24.5% 13.3% 6.0% 6.7% (38.6% – 58.2%) (17.5% – 31.5%) (8.3% – 18.3%) (3.3% – 8.7%) (3.0% – 10.3%)
Race/Ethnicity
African American (n=50) 43.7% 37.0% 24.5% 0.5% 2.8% (15.8% – 71.6%) (7.5% – 66.6%) (0.0% – 56.4%) (0.0% – 1.4%) (0.0% – 7.4%)
Hispanic (n=67) 49.6% 20.4% 20.5% 10.4% 1.9% (32.9% – 66.3%) (6.7% – 34.1%) (5.8% – 35.3%) (0.0% – 21.3%) (0.0% – 4.7%)
Asian/Pacific Islander (n=110)
46.4% 24.3% 6.4% 14.5% 4.2%
(28.7% – 64.0%) (10.0% – 38.6%) (1.4% – 11.4%) (0.0% – 32.7%) (0.3% – 8.1%)
White/other (n=379) 57.9% 35.8% 8.5% 5.2% 8.6% (47.8% – 68.0%) (25.4% – 46.1%) (5.1% – 11.9%) (2.2% – 8.2%) (2.4% – 14.7%)
Language
Spanish (n=24) 49.7% 21.7% 15.2% 2.2% 0.0% (22.4% – 76.9%) (0.0% – 47.0%) (0.0% – 33.6%) (0.0% – 5.6%) N.A.
English (n=557) 53.9% 32.0% 12.6% 7.4% 6.8% (45.9% – 62.0%) (24.2% – 39.7%) (7.0% – 18.2%) (3.0% – 11.7%) (2.8% – 10.9%)
Other (n=25) 46.2% 5.2% 0.0% 36.1% 0.0% (5.0% – 87.4%) (0.0% – 15.6%) N.A. (0.0% – 83.0%) N.A.

NORC | Covered California—Consumer Tracking Survey
FINAL REPORT | 57
Ease of Purchase on the Covered California Website
A little over four in ten (44%) said purchasing insurance on the Covered California website was easy
or very easy, and 29% said it was difficult or very difficult. Perceived difficulty is clearly age related:
just 14% of 18- to 34-year-olds reported any difficulty, compared to 47% of 50- to 64-year-olds. It is
also related to race/ethnicity and language: 42% of Asians indicated that the process was difficult or
very difficult. Hispanics interviewed in Spanish were likely to report that the process was very
difficult (33%, compared to 15% of all respondents).
Exhibit 3.10.4: Ease of Purchase (Among Purchasers on Web)
Very Easy Easy Neither
Easy/Difficult Difficult Very
Difficult
All (n=606)
21.8% 22.6% 26.2% 14.3% 15.0% (13.1% – 30.5%) (14.5% – 30.7%) (17.2% – 35.3%) (7.2% – 21.4%) (8.2% – 21.8%)
Age
18–34 (n=46)
28.9% 23.9% 32.5% 10.2% 4.4% (10.6% – 47.3%) (8.8% – 38.9%) (13.4% – 51.6%) (0.0% – 22.4%) (0.0% – 9.6%)
35–49 (n=166)
19.8% 24.3% 21.8% 13.9% 20.2% (8.5% – 31.1%) (10.5% – 38.2%) (11.2% – 32.3%) (3.8% – 24.0%) (5.3% – 35.1%)
50–64 (n=394)
12.8% 17.8% 22.5% 21.8% 25.0% (7.7% – 18.0%) (10.7% – 25.0%) (15.1% – 29.9%) (7.4% – 36.2%) (14.3% – 35.8%)
Race/Ethnicity
African American (n=50)
15.5% 49.0% 24.8% 8.1% 2.5% (1.3% – 29.8%) (19.6% – 78.4%) (0.0% – 49.7%) (0.0% – 19.2%) (0.0% – 6.3%)
Hispanic (n=67)
19.5% 24.8% 27.0% 5.0% 23.7% (1.3% – 37.7%) (3.9% – 45.7%) (4.6% – 49.4%) (0.0% – 10.5%) (3.0% – 44.3%)
Asian/Pacific Islander (n=110)
20.7% 15.5% 21.3% 24.2% 18.2% (0.0% – 44.3%) (2.7% – 28.3%) (5.7% – 36.9%) (0.0% – 51.0%) (4.0% – 32.5%)
White/other (n=379)
23.2% 21.7% 26.9% 16.5% 11.7% (11.9% – 34.5%) (12.1% – 31.3%) (15.8% – 38.0%) (6.7% – 26.3%) (5.0% – 18.5%)
Language
Spanish (n=24) 26.8% 37.8% 1.9% 0.7% 32.7% (0.0% – 68.2%) (0.0% – 92.4%) (0.0% – 6.1%) (0.0% – 2.3%) (0.0% – 83.7%)
English (n=557) 21.4% 20.8% 28.5% 15.5% 13.7% (12.5% – 30.4%) (13.5% – 28.2%) (19.0% – 38.0%) (7.9% – 23.2%) (7.6% – 19.8%)
Other (n=25) 22.5% 67.2% 0.0% 0.0% 10.3% (0.0% – 52.9%) (28.8% – 100.0%) N.A. N.A. (0.0% – 31.0%)
Recommendations by Purchasers
Purchasers who are pleased with their purchase are an important source of influence, particularly
among younger consumers and Asians. Six out of ten overall purchasers have recommended
purchasing a plan via Covered California to someone else, with 18- to 34-year-olds (66%) and Asians
(67%) the most likely to recommend it. This is a strong recommendation, given the fact that, at the

NORC | Covered California—Consumer Tracking Survey
FINAL REPORT | 58
time of the first tracking study was conducted, most purchasers would have had little experience
with their new insurance policy.
Exhibit 3.10.5: Recommendations by Purchasers
Recommended Covered
California
All (n=606) 60.4% (52.6% – 68.3%)
Age
18–34 (n=46) 66.1% (49.4% – 82.9%)
35–49 (n=166) 58.9% (47.0% – 70.8%)
50–64 (n=394) 55.7% (45.4% – 65.9%)
Race/Ethnicity
African American (n=50) 54.4% (26.7% – 82.1%)
Hispanic (n=67) 61.6% (44.9% – 78.2%)
Asian/Pacific Islander (n=110) 67.3% (52.1% – 82.5%)
White/other (n=379) 58.1% (47.5% – 68.8%)
Language
Spanish (n=24) 56.5% (28.5% – 84.4%)
English (n=557) 60.7% (52.5% – 69.0%)
Other (n=25) 65.8% (35.3% – 96.3%)

NORC | Covered California—Consumer Tracking Survey
FINAL REPORT | 59
3.11 Information-Seeking Among Non-Purchasers
Non-Purchasers Who Looked into Covered California
Overall, 58% of non-purchasers have looked into the possibility of purchasing a health plan through
Covered California. Non-purchasers most likely to have looked into purchase include Hispanics
interviewed in Spanish (79%), African Americans (65%), all Hispanics (65%), and 18- to 34-year-
olds (61%).).
Exhibit 3.11.1: Exploration of Purchasing Insurance (Among Non-purchasers)
Looked into the Possibility of Purchasing
All (n=1,383) 58.3% (54.0% – 62.6%)
Age
18–34 (n=225) 60.5% (53.1% – 67.8%)
35–49 (n=416) 57.5% (50.9% – 64.1%)
50–64 (n=742) 54.4% (48.2% – 60.6%)
Race/Ethnicity
African American (n=120) 64.8% (48.3% – 81.4%)
Hispanic (n=273) 64.5% (57.2% – 71.7%)
Asian/Pacific Islander (n=179) 56.5% (44.9% – 68.0%)
White/other (n=811) 52.0% (46.1% – 57.9%)
Language
Spanish (n=131) 78.8% (70.2% – 87.3%)
English (n=1,215) 52.1% (47.4% – 56.9%)
Other (n=37) 50.5% (24.5% – 76.6%)

NORC | Covered California—Consumer Tracking Survey
FINAL REPORT | 60
Where Non-Purchasers Sought Information
Like purchasers, non-purchasers were most likely to seek information from the Covered California
website (38%). Fewer called the toll-free number (12%) or met with a certified educator or
counselor (7%) or insurance agent (8%); fewer still visited a government office (6%). African
Americans (53%) and 18- to 34-year-olds (43%) were most likely to use the website, while Hispanics
(31%), Hispanics interviewed in Spanish (28%), and consumers interviewed in other, usually Asian,
languages (30%) were least likely to do so.
Exhibit 3.11.2: Where Non-purchasers Sought Information
Covered California Website
Toll-Free Number
Certified Educator
or Counselor
Insurance Agent
Government Office for Social Services Other
All (n=1,383) 38.1% 12.4% 7.1% 8.1% 5.7% 16.9% (33.9% – 42.3%) (9.5% – 15.3%) (4.8% – 9.4%) (6.0% – 10.3%) (3.6% – 7.8%) (13.5% – 20.3%)
Age
18–34 (n=225) 42.8% 7.5% 8.0% 5.8% 4.8% 19.6% (35.5% – 50.2%) (3.7% – 11.3%) (4.0% – 12.0%) (2.5% – 9.2%) (1.6% – 8.0%) (13.6% – 25.5%)
35–49 (n=416) 34.8% 18.6% 7.7% 9.9% 7.4% 15.4% (28.6% – 41.0%) (13.0% – 24.2%) (3.8% – 11.6%) (6.1% – 13.6%) (3.4% – 11.3%) (10.3% – 20.6%)
50–64 (n=742) 32.6% 12.9% 3.9% 10.4% 4.8% 13.0% (26.9% – 38.4%) (7.6% – 18.2%) (2.2% – 5.6%) (6.4% – 14.5%) (2.0% – 7.5%) (8.3% – 17.6%)
Race/Ethnicity
African American (n=120) 52.3% 32.7% 12.1% 16.2% 3.8% 10.8% (34.9% – 69.8%) (14.0% – 51.5%) (0.0% – 27.0%) (0.0% – 32.5%) (0.0% – 7.9%) (2.3% – 19.3%)
Hispanic (n=273) 30.6% 14.4% 8.7% 5.7% 10.1% 21.0% (23.6% – 37.7%) (9.1% – 19.6%) (4.4% – 13.0%) (2.3% – 9.1%) (5.7% – 14.5%) (14.7% – 27.4%)
Asian/Pacific Islander (n=179) 41.3% 9.3% 9.7% 12.8% 2.8% 13.9% (30.5% – 52.2%) (2.5% – 16.0%) (3.1% – 16.2%) (6.4% – 19.2%) (0.2% – 5.4%) (6.7% – 21.1%)
White/other (n=811) 43.5% 9.5% 4.5% 8.7% 2.2% 14.0% (37.6% – 49.4%) (6.2% – 12.8%) (1.9% – 7.0%) (5.7% – 11.7%) (0.4% – 4.1%) (9.7% – 18.2%)
Language
Spanish (n=131) 27.9% 19.7% 10.0% 5.1% 12.6% 27.3% (18.4% – 37.4%) (11.2% – 28.1%) (3.9% – 16.1%) (0.6% – 9.5%) (6.0% – 19.2%) (17.6% – 36.9%)
English (n=1,215) 41.5% 10.0% 6.3% 8.5% 3.6% 13.5% (36.8% – 46.2%) (7.4% – 12.6%) (3.8% – 8.7%) (6.1% – 10.8%) (1.8% – 5.5%) (10.2% – 16.8%)
Other (n=37) 30.3% 17.9% 6.2% 29.2% 3.0% 20.9% (4.1% – 56.4%) (0.0% – 44.5%) (0.0% – 15.1%) (3.1% – 55.2%) (0.0% – 8.9%) (2.1% – 39.8%)

NORC | Covered California—Consumer Tracking Survey
FINAL REPORT | 61
Problems Non-Purchasers Encountered Finding Information
Eighteen percent of non-purchasers reported a problem finding information. Specifically, 7%
mentioned problems with the website, while 4% mentioned problems contacting Covered
California.
Exhibit 3.11.3: Problems Encountered Finding Information or Applying (Among Non-purchasers)
Any Problem Reported
Issues with the Website
Problems Contacting Covered
CA
Confusion About
Process/ Informatio
n
Problems with Costs
All (n=1,383) 17.7% 6.5% 3.5% 3.3% 1.8% (14.5% – 20.9%) (4.5% – 8.5%) (2.0% – 5.1%) (1.8% – 4.9%) (0.8% – 2.9%)
Age
18–34 (n=225) 14.9% 7.1% 1.3% 2.8% 1.5% (9.9% – 20.0%) (3.4% – 10.7%) (0.0% – 3.1%) (0.5% – 5.1%) (0.0% – 3.1%)
35–49 (n=416) 18.7% 5.9% 5.9% 1.7% 2.2% (13.3% – 24.1%) (3.0% – 8.7%) (2.3% – 9.4%) (0.5% – 2.9%) (0.1% – 4.3%)
50–64 (n=742) 22.8% 6.4% 4.5% 7.8% 2.0% (17.2% – 28.4%) (4.3% – 8.4%) (2.4% – 6.7%) (2.7% – 12.9%) (0.9% – 3.2%)
Race/Ethnicity
African American (n=120) 17.2% 13.8% 5.2% 0.5% 1.7% (5.3% – 29.1%) (2.3% – 25.4%) (0.0% – 13.9%) (0.0% – 1.6%) (0.0% – 4.4%)
Hispanic (n=273) 20.7% 6.2% 5.2% 3.6% 2.3% (14.5% – 26.8%) (2.6% – 9.8%) (1.9% – 8.5%) (0.6% – 6.5%) (0.0% – 4.5%)
Asian/Pacific Islander (n=179)
16.8% 4.5% 1.6% 5.9% 3.3%
(8.9% – 24.8%) (1.4% – 7.6%) (0.0% – 3.3%) (0.3% – 11.5%) (0.0% – 6.8%)
White/other (n=811) 15.1% 6.7% 2.2% 2.8% 1.1% (11.4% – 18.7%) (4.0% – 9.4%) (1.2% – 3.3%) (1.3% – 4.2%) (0.4% – 1.8%)
Language
Spanish (n=131) 22.5% 4.0% 5.4% 5.4% 2.1% (13.6% – 31.4%) (0.0% – 8.3%) (1.0% – 9.8%) (0.4% – 10.4%) (0.0% – 4.9%)
English (n=1,215) 16.6% 7.4% 3.0% 2.7% 1.8% (13.3% – 19.8%) (5.1% – 9.8%) (1.5% – 4.6%) (1.5% – 4.0%) (0.6% – 2.9%)
Other (n=37) 5.9% 2.1% 1.0% 1.9% 1.0% (0.0% – 11.8%) (0.0% – 5.1%) (0.0% – 2.9%) (0.0% – 5.6%) (0.0% – 2.9%)
Finding Out About the Cost of Coverage
Just 28% of non-purchasers who looked for information actually found out what they would have to
pay to get coverage, indicating that the majority did not get very far along in the application process

NORC | Covered California—Consumer Tracking Survey
FINAL REPORT | 62
or check the cost calculator on the website. Only 18% of Hispanics and 16% of Hispanics
interviewed in Spanish found out the cost of coverage.
Exhibit 3.11.4: Found Out Coverage Cost (Among Non-purchasers)
% Who Found Out How Much Their Monthly Premium Would Cost
All (n=1,383) 27.5% (23.8% – 31.3%)
Age
18–34 (n=225) 30.4% (23.7% – 37.2%)
35–49 (n=416) 25.3% (20.0% – 30.6%)
50–64 (n=742) 24.6% (19.7% – 29.5%)
Race/Ethnicity
African American (n=120) 33.2% (16.2% – 50.2%)
Hispanic (n=273) 18.3% (12.6% – 24.0%)
Asian/Pacific Islander (n=179) 31.2% (21.3% – 41.1%)
White/other (n=811) 35.3% (29.7% – 41.0%)
Language
Spanish (n=131) 16.1% (8.7% – 23.5%)
English (n=1,215) 31.5% (27.2% – 35.9%)
Other (n=37) 12.3% (1.0% – 23.6%)
Price Concerns: Non-Purchaser Assessments Actual Versus Expected Costs
Fifty-nine percent of non-purchasers who found out what insurance via Covered California would
cost said it cost more than they had expected. Just 26% said it cost less than expected. Price
concerns seem to be a problem for all groups: for example, consumers ages 18–34 were less likely

NORC | Covered California—Consumer Tracking Survey
FINAL REPORT | 63
than other groups to say the insurance cost more than expected, but more of them said it cost more
than expected (51% versus 34%).
Exhibit 3.11.5: Costs Relative to Expectation (Among Non-purchasers Finding Cost of Plan)
Covered CA Costs More
Covered CA Costs Less About the Same
All (n=418) 58.8% 25.9% 15.3% (50.8% – 66.8%) (18.6% – 33.2%) (9.3% – 21.4%)
Age
18–34 (n=75) 50.9% 33.7% 15.4% (37.8% – 64.0%) (21.3% – 46.1%) (5.3% – 25.5%)
35–49 (n=125) 68.3% 14.2% 17.6% (57.8% – 78.7%) (6.5% – 21.8%) (9.0% – 26.1%)
50–64 (n=218) 66.4% 22.9% 10.7% (57.0% – 75.9%) (13.5% – 32.2%) (5.3% – 16.0%)
Race/Ethnicity
African American (n=29) 64.8% 35.2% 0.0% (34.3% – 95.4%) (4.6% – 65.7%) N.A.
Hispanic (n=47) 55.6% 37.4% 7.0% (37.3% – 73.9%) (19.6% – 55.3%) (0.0% – 17.1%)
Asian/Pacific Islander (n=61) 56.2% 18.4% 25.3% (38.0% – 74.4%) (1.7% – 35.2%) (10.2% – 40.5%)
White/other (n=281) 60.3% 21.4% 18.3% (50.1% – 70.5%) (12.8% – 29.9%) (9.5% – 27.1%)
Language
Spanish (n=17) 65.9% 34.1% 0.0% (40.4% – 91.3%) (8.7% – 59.6%) N.A.
English (n=393) 57.5% 25.2% 17.3% (49.1% – 65.9%) (17.5% – 32.9%) (10.6% – 24.1%)
Other (n=8 92.0% 0.0% 8.0% (76.1% – 100.0%) N.A. (0.0% – 23.9%)
Non-Purchaser Evaluation of Ease of Navigation
Non-purchasers who used the website, like purchasers, were more likely to say that the Covered
California website is easy (50%) than difficult to navigate (33%). Overall, 17% said it was “very
difficult” to navigate. African Americans (36%), consumers ages 35–49 (24%) or ages 50–64 (28%),
Hispanics (25%), and Hispanics interviewed in Spanish (34%) were especially likely to say navigation
was very difficult.
Exhibit 3.11.6: Ease of Navigation (Among Non-purchasers Using Website)
Very Easy Easy Neither
Easy/Difficult Difficult Very
Difficult
All (n=561) 33.5% 16.2% 16.4% 16.6% 17.4% (26.6% – 40.3%) (11.2% – 21.2%) (11.6% – 21.2%) (11.7% – 21.5%) (12.3% – 22.4%)

NORC | Covered California—Consumer Tracking Survey
FINAL REPORT | 64
Age
18–34 (n=106) 42.4% 16.2% 15.9% 15.5% 10.0% (31.3% – 53.6%) (8.2% – 24.1%) (7.9% – 23.8%) (8.1% – 23.0%) (3.2% – 16.8%)
35–49 (n=169) 27.7% 16.8% 17.1% 14.2% 24.3% (18.0% – 37.5%) (8.7% – 24.9%) (10.1% – 24.1%) (7.7% – 20.7%) (14.4% – 34.1%)
50–64 (n=286) 15.6% 14.9% 16.8% 25.1% 27.6% (9.8% – 21.3%) (9.3% – 20.6%) (11.3% – 22.2%) (12.4% – 37.9%) (19.0% – 36.3%)
Race/Ethnicity
African American (n=53) 6.0% 17.0% 26.0% 14.5% 36.4% (0.0% – 12.1%) (2.0% – 32.1%) (0.3% – 51.8%) (1.6% – 27.5%) (9.5% – 63.2%)
Hispanic (n=80) 40.7% 10.7% 9.7% 14.2% 24.7% (26.9% – 54.4%) (1.9% – 19.4%) (1.1% – 18.3%) (4.8% – 23.6%) (13.1% – 36.4%)
Asian/Pacific Islander (n=81) 19.2% 26.1% 14.9% 29.0% 10.8% (4.0% – 34.4%) (13.2% – 39.0%) (6.3% – 23.4%) (14.1% – 43.9%) (3.2% – 18.5%)
White/other (n=347) 34.5% 17.7% 20.4% 15.7% 11.6% (25.3% – 43.7%) (10.5% – 25.0%) (13.7% – 27.2%) (9.2% – 22.2%) (7.0% – 16.2%)
Language
Spanish (n=33) 30.0% 12.3% 10.0% 14.0% 33.7% (11.6% – 48.4%) (0.0% – 25.9%) (0.0% – 21.4%) (0.0% – 29.0%) (14.9% – 52.6%)
English (n=518) 34.8% 17.3% 17.9% 16.1% 13.9% (27.3% – 42.2%) (11.8% – 22.7%) (12.6% – 23.3%) (11.3% – 21.0%) (9.4% – 18.4%)
Other (n=10 6.5% 3.2% 6.9% 65.2% 18.3% (0.0% – 17.4%) (0.0% – 10.3%) (0.0% – 18.6%) (22.7% – 100.0%) (0.0% – 49.6%)
Recommendations Non-Purchasers Received from People Close to Them
Forty-two percent of non-purchasers have received recommendations for or against purchasing
insurance via Covered California, and these recommendations were more positive (26%) than
negative (16%). Consumers ages 18–34 were the most likely to receive both positive and negative
recommendations. Nearly half (48%) of African Americans received positive recommendations,
more than any other racial/ethnic group, and 18% received negative recommendations, giving
African Americans the highest positive to negative ratio of 2.53. Whites have the lowest ratio of
positive to negative recommendation (25% versus 22%; ratio: 1.14).
Exhibit 3.11.7: Recommendations of Covered California (Among Non-purchasers)
Had Someone Close Recommend
Purchase
Had Someone Close Recommend
AGAINST Purchase
All (n=1,383) 26.1% 15.6% (22.3% – 30.0%) (12.6% – 18.7%)
Age
18–34 (n=225) 31.1% 19.0% (24.2% – 38.0%) (13.3% – 24.8%)
35–49 (n=416) 22.9% 12.1% (17.4% – 28.4%) (8.5% – 15.8%)
50–64 (n=742) 20.1% 14.0% (15.2% – 24.9%) (10.4% – 17.6%)

NORC | Covered California—Consumer Tracking Survey
FINAL REPORT | 65
Race/Ethnicity
African American (n=120) 47.7% 17.9% (29.9% – 65.5%) (2.0% – 33.9%)
Hispanic (n=273) 25.8% 10.6% (19.1% – 32.6%) (6.2% – 14.9%)
Asian/Pacific Islander (n=179) 26.3% 10.0% (17.5% – 35.2%) (4.2% – 15.9%)
White/other (n=811) 24.6% 21.9% (19.3% – 29.9%) (16.9% – 26.9%)
Language
Spanish (n=131) 20.1% 8.2% (11.6% – 28.5%) (2.5% – 14.0%)
English (n=1,215) 28.3% 18.3% (23.9% – 32.7%) (14.7% – 21.9%)
Other (n=37) 18.3% 3.0% (4.4% – 32.3%) (0.0% – 6.6%)

NORC | Covered California—Consumer Tracking Survey
FINAL REPORT | 66
3.12 Purchase Status and Intentions
Purchase Status
In addition to the 19% who are Covered California purchasers, there are another 12% who have
applied but have not completed their purchase and another 20% who have not applied but say they
will. Not counting those who said they “may” enroll, there seems to be about 32% who have a high
propensity for enrollment.
Exhibit 3.12.1: Summary of the Status and Intentions of Purchasers and Non-Purchasers

NORC | Covered California—Consumer Tracking Survey
FINAL REPORT | 67
Applied For But
Not Purchased Purchaser
Not Enrolled But Will
Not Enrolled But May
Not Enrolled and Will
Not
All (n=1,989) 12.1% 18.6% 19.5% 23.4% 26.4%
(9.7% – 14.6%) (15.9% – 21.3%) (16.1% – 22.8%) (19.9% – 26.9%) (23.1% –
29.7%)
Insurance Status (Screener)
Uninsured (n=934) 15.5% 8.8% 28.2% 30.0% 17.4%
(11.8% – 19.2%) (6.1% – 11.6%) (23.2% – 33.3%) (24.9% – 35.0%) (13.4% –
21.4%)
Insured, Covered-CA (n=559)
9.7% 73.8% 4.7% 5.3% 6.6%
(4.6% – 14.8%) (65.7% – 81.8%) (1.2% – 8.1%) (0.1% – 10.5%) (1.9% – 11.4%)
Insured, non-Covered-CA (n=496)
5.6% 5.4% 8.3% 19.6% 61.0%
(3.0% – 8.2%) (2.1% – 8.8%) (3.6% – 13.0%) (13.3% – 26.0%) (53.7% –
68.4%)
Age
18–34 (n=271) 13.2% 14.0% 18.3% 29.8% 24.8%
(8.7% – 17.6%) (9.5% – 18.5%) (12.8% – 23.8%) (23.3% – 36.3%) (18.7% –
30.8%)
35–49 (n=582) 10.2% 20.4% 22.4% 21.0% 26.0%
(6.7% – 13.6%) (16.0% – 24.8%) (16.7% – 28.1%) (16.0% – 26.0%) (21.2% –
30.8%)
50–64 (n=1,136) 13.3% 25.4% 16.8% 13.6% 30.9%
(9.7% – 17.0%) (20.9% – 29.9%) (11.7% – 21.8%) (9.4% – 17.8%) (26.3% –
35.5%)
Race/Ethnicity African American (n=170) 14.7% 20.9% 23.7% 21.0% 19.8% (6.4% – 22.9%) (10.2% – 31.5%) (9.6% – 37.9%) (7.0% – 35.0%) (6.3% – 33.2%)
Hispanic (n=340) 12.1% 13.5% 31.7% 28.4% 14.3% (7.8% – 16.4%) (9.2% – 17.8%) (25.0% – 38.4%) (21.9% – 35.0%) (9.3% – 19.2%)
Asian/Pacific Islander (n=289)
15.3% 25.9% 17.9% 14.4% 26.5%
(8.2% – 22.4%) (17.8% – 33.9%) (9.7% – 26.1%) (6.9% – 21.9%) (18.1% –
34.8%)
White/other (n=1,190) 11.1% 21.2% 8.4% 21.3% 38.0%
(7.8% – 14.4%) (17.2% – 25.2%) (5.5% – 11.3%) (16.6% – 26.0%) (33.0% –
43.1%)
Language
Spanish (n=155) 10.6% 11.0% 42.1% 27.8% 8.5% (4.8% – 16.5%) (5.1% – 16.9%) (32.1% – 52.1%) (18.8% – 36.8%) (3.0% – 14.0%)
English (n=1,772) 12.6% 20.2% 12.6% 22.8% 31.8%
(9.8% – 15.3%) (17.1% – 23.2%) (9.7% – 15.5%) (19.0% – 26.7%) (27.9% –
35.7%)
Other (n=62) 10.8% 32.9% 39.6% 2.9% 13.8% (1.5% – 20.1%) (11.8% – 53.9%) (16.6% – 62.6%) (0.0% – 5.8%) (0.0% – 28.3%)
Purchase Intentions
Non-purchasers are fairly equally divided among those who said that they “will,” “may,” and “will
not” get coverage.

NORC | Covered California—Consumer Tracking Survey
FINAL REPORT | 68
Best Prospects
Those who said they “will” get coverage are the best prospects in the near term. They are on the
cusp of being converted, but it may take a little push to motivate them to take action. Hispanics
(46%), African Americans (41%), and Asians (37%) are more likely to be prospects than Whites
(16%). There is one caveat: Marketing scientists have often observed that Hispanics are likely to
overstate their purchase intent in surveys. Lagging Hispanic enrollment figures suggest that this may
be the case for Covered California.
Middling Prospects
Agreeing that one “may” get coverage might indicate uncertainty, or it might simply be a polite way
of saying “no.” Consumer 18- to 34-years-old (38%) and Hispanics (35%) are most likely to be in
this middling category.
“Hard-Sell” Prospects
“Hard-sell” prospects include consumers who don’t plan to get health insurance through Covered
California, because they already have health insurance or expect to get it soon (e.g., Medicare) or due
to expense, lack of information, or distrust of the government or Obamacare. All of these
consumers will be difficult to sell on the idea of getting insurance through Covered California.
Whites (53%) and consumers ages 50–64 (45%) are the most likely to be “hard-sell” prospects.
Relationship between Income and Purchase Intentions
We examined the relationship between purchase intentions and income among non-purchasers
supplying income data. As expected, the subsidy- eligible were far more likely to express interest in
purchase than those not eligible for subsidies or other assistance.

NORC | Covered California—Consumer Tracking Survey
FINAL REPORT | 69
Exhibit 3.12.2: Purchase Intentions (Among Non-purchasers)
Will Get Coverage
May Get Coverage
Will Not Get Coverage
All (n=1,383) 32.0% 31.8% 36.1% (27.7% – 36.3%) (27.6% – 36.1%) (32.0% – 40.2%)
Age
18–34 (n=225) 29.7% 37.8% 32.5% (22.7% – 36.8%) (30.4% – 45.3%) (25.4% – 39.5%)
35–49 (n=416) 35.3% 28.2% 36.5% (28.3% – 42.3%) (22.0% – 34.4%) (30.2% – 42.8%)
50–64 (n=742) 31.7% 23.5% 44.8% (25.1% – 38.3%) (17.4% – 29.6%) (38.5% – 51.1%)
Race/Ethnicity
African American (n=120) 41.3% 28.4% 30.3% (23.5% – 59.1%) (11.3% – 45.5%) (13.2% – 47.4%)
Hispanic (n=273) 46.3% 35.0% 18.7% (38.5% – 54.0%) (27.6% – 42.4%) (12.8% – 24.7%)
Asian/Pacific Islander (n=179) 36.8% 24.1% 39.1% (24.9% – 48.7%) (13.6% – 34.6%) (27.8% – 50.3%)
White/other (n=811) 16.0% 30.8% 53.3% (11.5% – 20.4%) (24.9% – 36.6%) (47.2% – 59.4%)
Language
Spanish (n=131) 56.0% 34.5% 9.5% (45.4% – 66.6%) (24.4% – 44.5%) (3.4% – 15.7%)
English (n=1,215) 23.5% 31.8% 44.7% (19.3% – 27.7%) (27.0% – 36.5%) (39.9% – 49.5%)
Other (n=37) 72.1% 4.3% 23.6% (50.1% – 94.1%) (0.0% – 8.9%) (2.3% – 45.0%)

NORC | Covered California—Consumer Tracking Survey
FINAL REPORT | 70
Exhibit 3.12.2a: Income and Purchase Intentions (Among Non-purchasers)
Will Get Coverage
May Get Coverage
Will Not Get Coverage
Income
400+ FPL (n=452) 14.2% 19.6% 66.2% (7.6% - 20.8%) (13.2% - 26.0%) (58.3% - 74.1%)
200–399 FPL (n=473) 40.4% 34.8% 24.8% (33.1% - 47.6%) (27.7% - 41.9%) (18.8% - 30.8%)
139–199 FPL (n=176) 40.6% 41.0% 18.4% (29.3% - 51.9%) (29.6% - 52.5%) (9.7% - 27.2%)
100–138 FPL (n=145) 32.9% 40.2% 26.9% (21.2% - 44.7%) (27.6% - 52.8%) (16.2% - 37.5%)
Exhibit 3.12.2b: Income and Purchase Intentions (Among Uninsured Non-purchasers)
Will Get Coverage
May Get Coverage
Will Not Get Coverage
Income
400+ FPL (n=138) 16.5% 42.6% 40.8% (1.9% - 31.1%) (17.7% - 67.6%) (15.6% - 66.1%)
200–399 FPL (n=344) 27.1% 28.0% 44.9% (13.0% - 41.2%) (15.1% - 40.8%) (30.5% - 59.4%)
139–199 FPL (n=138) 45.2% 35.5% 19.3% (36.7% - 53.7%) (27.3% - 43.7%) (13.0% - 25.6%)
100–138 FPL (n=112) 41.4% 41.6% 17.0% (28.6% - 54.2%) (28.9% - 54.3%) (7.5% - 26.5%)
Non-Purchaser Motivations for Planning to Get a Plan
Saving money (lower cost and/or getting a subsidy) and security (the assurance of being able to get
insurance and health care no matter what) were the most important motivations for planning to get
a plan in the baseline study. Security (38%) was also the most important motivation in the tracking
study, but saving money has slipped from 41% to 21%, and avoiding the penalty for noncompliance
has increased from 1% to 27%, making it the second-most-important reason.
Cited by 38%, security (assurance of being able to get health insurance and health care no matter
what) is the main reason non-purchasers give for planning to purchase a plan through Covered
California.
Although relatively few purchasers say they purchased a plan to avoid the penalty, it is a much more
important factor for non-purchasers who plan to purchase a plan: 27% say it is the main reason they
plan to purchase. The third most important reason is saving money (21%), which was by far the
most important reason purchasers gave for enrolling in Covered California. The fourth-most-
NORC | Covered California—Consumer Tracking Survey
FINAL REPORT | 71
important reason is being in control in terms of access to health care, having more choices, and not
having to wait for health care services (19%).
Among 18- to 34-year-olds, security (35%) and avoiding penalties (32%) are, by far, the most
important reasons for planning to purchase a plan.
Security is overwhelmingly the most important factor for African Americans (81%), while security
(41%) and avoiding the penalty (32%) are the most important factors for Hispanics. Asians place
roughly equal importance on saving money (28%) and avoiding the penalty (27%), but saving money
(28%) and security (30%) are especially important factors among less acculturated Asians (41%).
Among Whites, the most important factors are security (31%), saving money (26%), and avoiding
the penalty (20%).

NORC | Covered California—Consumer Tracking Survey
FINAL REPORT | 72
Exhibit 3.12.3: Reason for Planning to Get a Plan (Among Non-purchasers Planning to Get a Plan)
Saving Money
Being in Control Security
Avoid
Penalty
Right Thing to
Do Better Health
All (n=351) 21.1% 18.7% 37.6% 27.3% 5.7% 8.4% (14.6% – 27.7%) (11.7% – 25.7%) (29.6% – 45.7%) (19.2% – 35.4%) (2.0% – 9.3%) (4.0% – 12.7%)
Survey Round
Wave 1 (n=351) 21.1% 18.7% 37.6% 27.3% 5.7% 8.4% (14.6% – 27.6%) (11.7% – 25.7%) (29.6% – 45.7%) (19.2% – 35.3%) (2.0% – 9.3%) (4.0% – 12.7%)
Baseline (n=648) 41.2% 26.5% 40.4% 1.2% 2.6% 13.1% (34.5% – 47.9%) (20.3% – 32.7%) (33.7% – 47.0%) (0.2% – 2.3%) (0.1% – 5.1%) (8.5% – 17.7%)
Age
18–34 (n=63) 18.9% 14.4% 34.9% 32.2% 5.7% 5.8% (8.1% – 29.8%) (3.9% – 24.9%) (21.3% – 48.6%) (18.2% – 46.1%) (0.0% – 12.0%) (0.0% – 12.0%)
35–49 (n=111) 16.6% 27.9% 36.6% 30.3% 5.9% 11.4% (7.4% – 25.8%) (15.1% – 40.8%) (24.0% – 49.3%) (17.4% – 43.3%) (0.1% – 11.8%) (3.0% – 19.7%)
50–64 (n=177) 36.0% 9.2% 46.2% 9.2% 4.9% 8.0% (22.2% – 49.7%) (3.6% – 14.9%) (32.8% – 59.6%) (2.6% – 15.8%) (0.1% – 9.6%) (2.1% – 13.9%)
Race/Ethnicity
African American (n=51) 15.2% 7.8% 81.3% 4.5% 0.0% 1.8% (3.1% – 27.3%) (0.0% – 19.2%) (68.3% – 94.4%) (0.0% – 9.4%) N.A. (0.0% – 3.7%)
Hispanic (n=114) 18.5% 25.3% 40.5% 31.5% 3.8% 8.5% (9.8% – 27.2%) (14.9% – 35.7%) (29.2% – 51.9%) (20.2% – 42.7%) (0.2% – 7.4%) (2.8% – 14.1%)
Asian/Pacific Islander (n=56) 28.4% 3.5% 18.8% 27.1% 13.8% 16.5% (9.9% – 46.9%) (0.0% – 8.5%) (3.9% – 33.7%) (6.5% – 47.8%) (0.0% – 27.7%) (0.0% – 34.7%)
White/other (n=130) 25.8% 10.1% 31.0% 19.8% 7.8% 5.0% (12.8% – 38.8%) (1.2% – 19.0%) (18.4% – 43.6%) (6.2% – 33.3%) (0.0% – 18.2%) (0.0% – 10.0%)
Language
Spanish (n=65) 16.2% 26.7% 42.6% 32.5% 2.7% 8.9% (5.7% – 26.7%) (13.2% – 40.2%) (27.9% – 57.2%) (18.2% – 46.8%) (0.0% – 6.8%) (1.5% – 16.3%)
English (n=266) 23.0% 12.8% 34.7% 25.4% 7.1% 8.2% (14.8% – 31.2%) (5.6% – 20.1%) (25.3% – 44.1%) (15.3% – 35.4%) (1.5% – 12.6%) (2.5% – 13.9%)
Other (n=20) 40.9% 18.5% 29.6% 5.1% 14.8% 6.0% (4.9% – 76.8%) (0.0% – 48.0%) (0.0% – 60.8%) (0.0% – 11.4%) (0.0% – 36.5%) (0.0% – 15.6%)
Non-Purchaser Motivations for Not Planning to Get a Plan
There has been a very large decrease in mentions of expense as a reason for not getting an insurance
plan through Covered California (62% to 27%), suggesting that consumers are becoming more
aware of federal subsidies and other mechanisms for reducing costs. There has also been a much
smaller increase in the number saying they already have or expect to get health insurance soon (21%
to 30%).
The most common motivation for not planning to purchase a plan is already having or expecting to
have a health insurance (30%). This would include those who have purchased plans outside of
Covered California, gotten or expect to get a job with an organization that offers health insurance to

NORC | Covered California—Consumer Tracking Survey
FINAL REPORT | 73
employees, and those who are eligible for Medi-Cal. Expense (27%) is the second most common
reason, but – as mentioned earlier – there has been a sharp decline in the percentage mentioning
expense as a reason for not planning to buy. “No need” was mentioned by just 4%, and website and
phone lines by just 2%.
Not trusting the ACA or government (13%) remains a factor, as does not knowing how to apply
(11%). Distrust of the ACA or government is most prevalent among Whites (18%), while not
knowing how to apply is most prevalent among African Americans (27%) and Hispanics (18%),
particularly those interviewed in Spanish (21%)
Exhibit 3.12.4: Reason for Not Planning to Get a Plan (Among Non-purchasers not Planning to Get a Plan)
Expense
Don't trust ACA or govm’t No need
Don't know how to apply
Website/
phone problems
Already have Other
All (n=722) 27.3% 13.0% 4.4% 10.8% 1.7% 30.4% 17.5% (21.9% – 32.7%) (9.1% – 16.9%) (1.9% – 7.0%) (6.9% – 14.8%) (0.8% – 2.6%) (25.1% – 35.7%) (12.8% – 22.2%)
Survey Round
Wave 1 (n=722) 27.3% 13.0% 4.4% 10.8% 1.7% 30.4% 17.5% (21.9% – 32.7%) (9.1% – 16.9%) (1.9% – 7.0%) (6.9% – 14.8%) (0.8% – 2.6%) (25.1% – 35.7%) (12.8% – 22.2%)
Baseline (n=727) 62.2% 15.4% 5.5% 0.9% 0.0% 21.2% 3.6% (56.6% – 67.7%) (11.5% – 19.4%) (2.4% – 8.6%) (0.2% – 1.7%) N.A. (16.8% – 25.6%) (1.1% – 6.0%)
Age
18–34 (n=117) 29.4% 12.7% 5.2% 10.9% 1.1% 23.3% 17.6% (20.0% – 38.9%) (6.1% – 19.3%) (0.6% – 9.8%) (4.5% – 17.4%) (0.0% – 2.5%) (14.5% – 32.1%) (10.0% – 25.3%)
35–49 (n=215) 26.4% 11.4% 2.8% 12.0% 2.0% 36.4% 18.6% (18.3% – 34.4%) (6.1% – 16.7%) (0.4% – 5.1%) (5.2% – 18.8%) (0.4% – 3.7%) (27.9% – 44.9%) (10.8% – 26.4%)
50–64 (n=390) 23.4% 16.4% 5.3% 8.5% 2.4% 37.7% 15.3% (16.0% – 30.8%) (9.1% – 23.8%) (0.0% – 10.7%) (3.9% – 13.1%) (0.6% – 4.3%) (29.9% – 45.6%) (8.4% – 22.3%)
Race/Ethnicity
African American (n=42)
21.1% 3.1% 9.2% 27.1% 0.5% 31.1% 8.8% (5.9% – 36.3%) (0.0% – 6.6%) (0.0% – 26.1%) (5.9% – 48.3%) (0.0% – 1.6%) (8.1% – 54.2%) (0.0% – 23.0%)
Hispanic (n=112) 27.1% 8.0% 5.8% 17.6% 0.9% 20.3% 24.1% (16.6% – 37.6%) (2.1% – 13.9%) (0.3% – 11.3%) (8.2% – 27.0%) (0.0% – 2.4%) (10.8% – 29.8%) (13.8% – 34.4%)
Asian/Pacific Islander (n=73)
32.2% 5.7% 1.1% 6.0% 2.3% 32.1% 20.2% (15.3% – 49.0%) (0.0% – 12.3%) (0.0% – 2.6%) (0.3% – 11.7%) (0.0% – 5.4%) (16.7% – 47.5%) (6.9% – 33.5%)
White/other (n=495) 26.8% 17.7% 3.9% 6.8% 2.1% 36.4% 13.3% (19.9% – 33.7%) (11.9% – 23.6%) (0.8% – 7.0%) (3.0% – 10.5%) (0.8% – 3.5%) (29.3% – 43.4%) (8.2% – 18.3%)
Language
Spanish (n=46) 30.0% 6.6% 3.5% 21.4% 0.0% 9.3% 34.5% (13.9% – 46.2%) (0.0% – 15.2%) (0.0% – 9.7%) (6.5% – 36.4%) N.A. (0.0% – 19.8%) (17.9% – 51.2%)
English (n=666) 26.9% 14.3% 4.6% 8.8% 2.0% 34.5% 13.9% (21.2% – 32.7%) (10.0% – 18.7%) (1.8% – 7.4%) (5.2% – 12.5%) (0.9% – 3.1%) (28.6% – 40.4%) (9.4% – 18.3%)
Other (n=10) 10.9% 0.0% 5.7% 6.5% 0.0% 13.0% 63.9% (0.0% – 32.6%) N.A. (0.0% – 17.6%) (0.0% – 20.1%) N.A. (0.0% – 31.8%) (24.9%–100.0%)

NORC | Covered California—Consumer Tracking Survey
FINAL REPORT | 74
3.13 Prior Plan Cancellation
Cancellation Notices
Overall, 20% of the consumers surveyed indicated that they had received a cancellation notice for
their health insurance or a notice that the health insurance would not be renewed. Among this
group,
● One-half (55%) said the notice indicated that the cancellation was the result of the ACA, and
● One-third (30%) said the notice said they should visit Covered California to enroll in a new
plan.
The groups most likely to receive cancellation notices were ages 50–64 (24%), Asian (29%), white
(26%), and English speakers (24%)—in other words, more established and affluent groups.

NORC | Covered California—Consumer Tracking Survey
FINAL REPORT | 75
Exhibit 3.13.1: Prior Plan Cancellations
Received Cancellation
Notice
Notice Attributed
Affordable Care Act
Directed to Covered CA
All (n=1,989) 19.7% 54.8% 30.4% (17.0% – 22.4%) (47.4% – 62.2%) (23.9% – 36.9%)
Insurance Status (Screener)
Uninsured (n=934) 13.1% 31.6% 33.4% (9.9% – 16.2%) (21.1% – 42.2%) (22.0% – 44.8%)
Insured, Covered-CA (n=559) 31.9% 48.9% 26.3% (24.5% – 39.3%) (35.6% – 62.2%) (16.3% – 36.3%)
Insured, non-Covered-CA (n=496) 27.6% 85.3% 30.0% (21.8% – 33.5%) (78.6% – 92.0%) (18.9% – 41.1%)
Age
18–34 (n=271) 17.5% 48.3% 26.3% (12.8% – 22.2%) (34.1% – 62.6%) (14.2% – 38.4%)
35–49 (n=582) 20.2% 57.8% 32.0% (16.0% – 24.4%) (46.1% – 69.4%) (21.9% – 42.0%)
50–64 (n=1,136) 23.6% 60.8% 34.5% (19.5% – 27.6%) (51.9% – 69.6%) (24.9% – 44.0%)
Race/Ethnicity
African American (n=170) 18.6% 46.4% 24.2% (8.0% – 29.2%) (15.4% – 77.4%) (4.6% – 43.8%)
Hispanic (n=340) 10.9% 44.5% 43.2% (6.8% – 15.0%) (25.2% – 63.8%) (23.9% – 62.5%)
Asian/Pacific Islander (n=289) 28.7% 55.1% 34.7% (20.4% – 37.0%) (38.1% – 72.1%) (20.1% – 49.3%)
White/other (n=1,190) 25.5% 59.2% 24.5% (21.5% – 29.6%) (50.4% – 68.0%) (17.7% – 31.4%)
Language
Spanish (n=155) 6.3% 28.3% 23.2% (1.7% – 10.9%) (0.0% – 62.2%) (0.0% – 56.7%)
English (n=1,772) 23.5% 57.4% 31.0% (20.3% – 26.7%) (49.9% – 65.0%) (24.4% – 37.7%)
Other (n=62) 18.3% 29.8% 24.6% (4.7% – 31.8%) (1.9% – 57.8%) (0.9% – 48.3%)
Subjective Comparison of the Covered California Plan and the Cancelled Plan
Consumers who enrolled in Covered California were also asked to compare the quality of their new
plan to the quality of their prior plan. Any assessment of a service that has not been used very much
is questionable. Since even the longest-term Covered California enrollees could not have started
using their plans before January 1, 2014, the month the tracking interviewing began, these early
assessments cannot be consider reliable. They should become more reliable over time as enrollees
gain experience with their plan.

NORC | Covered California—Consumer Tracking Survey
FINAL REPORT | 76
At this early stage, enrollees are more likely to say their new plan is better than the cancelled plan
(38% versus 20%). They are evenly split on cost with 36% saying it costs more and 38% saying it
costs less than the cancelled plan.
Exhibit 3.13.2: Plan Price Comparison (Among Those Purchasers Who Also Received Cancellation Notice)
Covered CA Plan Costs
More About the Same Covered CA
Plan Costs Less
All (n=207) 35.9% 26.3% 37.8% (23.8% – 47.9%) (12.5% – 40.1%) (26.5% – 49.2%)
Age
18–34 (n=17) 38.4% 46.9% 14.7% (12.3% – 64.5%) (19.1% – 74.7%) (0.0% – 32.2%)
35–49 (n=51) 32.5% 11.4% 56.1% (18.2% – 46.9%) (0.0% – 24.3%) (40.1% – 72.0%)
50–64 (n=139) 36.0% 11.8% 52.2% (25.6% – 46.5%) (3.4% – 20.2%) (41.1% – 63.2%)
Race/Ethnicity
African American (n=13) 87.1% 6.1% 6.8% (68.2% – 100.0%) (0.0% – 17.6%) (0.0% – 18.7%)
Hispanic (n=12) 66.1% 17.3% 16.6% (34.9% – 97.4%) (0.0% – 40.6%) (0.0% – 39.2%)
Asian/Pacific Islander (n=32) 37.2% 33.5% 29.3% (14.3% – 60.1%) (2.8% – 64.2%) (9.9% – 48.7%)
White/other (n=150) 25.9% 27.4% 46.6% (11.8% – 40.0%) (8.8% – 46.1%) (30.5% – 62.8%)
Language
Spanish (n=3) 100.0% 0.0% 0.0% N.A. N.A. N.A.
English (n=201) 34.8% 26.9% 38.3% (22.4% – 47.2%) (12.6% – 41.3%) (26.6% – 49.9%)
Other (n=3) 45.7% 14.1% 40.2% (0.0% – 100.0%) (0.0% – 42.3%) (0.0% – 96.8%)

NORC | Covered California—Consumer Tracking Survey
FINAL REPORT | 77
Exhibit 3.13.3: Plan Quality Comparison (Among Those Purchasers Who Also Received Cancellation Notice)
Variable Label Covered CA Plan Better About the Same
Covered CA Plan Worse
All (n=1,989) 37.7% 42.6% 19.7% (25.1% – 50.4%) (29.0% – 56.1%) (8.7% – 30.7%)
Age
18–34 (n=271) 25.2% 54.3% 20.5% (0.5% – 49.9%) (26.2% – 82.5%) (0.0% – 44.2%)
35–49 (n=582) 45.8% 35.9% 18.3% (29.1% – 62.5%) (20.0% – 51.8%) (6.7% – 29.9%)
50–64 (n=1,136) 48.6% 31.2% 20.2% (37.0% – 60.1%) (20.5% – 41.8%) (12.6% – 27.9%)
Race/Ethnicity
African American (n=170) 17.2% 22.9% 59.8% (0.0% – 41.1%) (0.0% – 59.7%) (8.9% – 100.0%)
Hispanic (n=340) 37.6% 47.4% 15.0% (4.8% – 70.4%) (10.2% – 84.7%) (0.0% – 36.3%)
Asian/Pacific Islander (n=289) 45.9% 38.6% 15.6% (17.2% – 74.5%) (6.9% – 70.2%) (1.2% – 29.9%)
White/other (n=1,190) 37.2% 44.3% 18.5% (21.0% – 53.5%) (27.3% – 61.2%) (4.7% – 32.3%)
Language
Spanish (n=155) 91.8% 8.2% 0.0% (71.8% – 100.0%) (0.0% – 28.2%) N.A.
English (n=1,772) 37.2% 43.4% 19.4% (24.4% – 50.0%) (29.6% – 57.1%) (8.2% – 30.7%)
Other (n=62) 23.5% 19.0% 57.4% (0.0% – 68.9%) (0.0% – 57.4%) (0.0% – 100.0%)
Summary of the Subjective Assessment in Terms of Perceived Wins and Losses
The following table shows each possible outcome in terms of both cost and perceived quality of the
cancelled and new Covered California plans and asks: How many can be considered winners and
losers? Overall, 48% are clear winners, while 28% are clear losers, at least according to their own
assessment of the two plans. Whether the consumers in the “not determined” column are winners
or losers depends on their health status. For example, consumers who pay more for a better plan
will win if they use the improved benefits, while those who pay less for a worse plan will only win if
they don’t have many medical expenses.

NORC | Covered California—Consumer Tracking Survey
FINAL REPORT | 78
Exhibit 3.13.4: Summary: Purchasers’ Subjective Assessment of Covered California Plan Versus a Cancelled Plan (Among Those Whose Prior Plan Was Cancelled)
Subjective
Winners
Subjective
Losers
Not Determined
Covered CA plan costs more and is better. - - 13%
Covered CA plan costs more and is the same. - 12% -
Covered CA plan costs more and is worse. - 15% -
Covered CA plan costs the same and is better. 5% - -
Covered CA plan costs the same and is the same. - - 4%
Covered CA plan costs the same and is worse. - 1% -
Covered CA plan costs less and is better. 25% - -
Covered CA plan costs less and is the same. 18% - -
Covered CA plan costs less and is worse. - - 7%
Total 48% 28% 24%
3.14 Language of Application Forms Among Spanish Speakers
There has been a great deal of concern about the seemingly slow pace of enrollment in Covered
California among Spanish-speaking Hispanics. However, a primary means of measuring enrollment
has been the number of enrollment forms completed in Spanish. The survey results indicate that
estimates based on this measure are not accurate because the majority of Spanish-speaking Hispanics
(55%) complete government forms mostly or only in English.

NORC | Covered California—Consumer Tracking Survey
FINAL REPORT | 79
Exhibit 3.14.1: Language Used to Complete Government Forms (Among Spanish Speakers)
Only
Spanish Mostly Spanish
English and
Spanish Equally
Mostly English
Only English
Did Not Fill Out
All (n=400) 22.1% 8.5% 7.9% 11.8% 42.7% 7.1% (16.2% – 27.9%) (4.5% – 12.5%) (4.2% – 11.5%) (7.3% – 16.3%) (36.0% – 49.3%) (3.7% – 10.5%)
Age
18–34 (n=82) 18.0% 4.2% 5.1% 9.6% 59.4% 3.7% (8.7% – 27.4%) (0.0% – 8.9%) (0.0% – 10.2%) (2.6% – 16.6%) (47.8% – 70.9%) (0.0% – 8.2%)
35–49 (n=133) 26.6% 14.2% 12.4% 14.7% 25.9% 6.1% (16.6% – 36.6%) (5.9% – 22.6%) (5.0% – 19.9%) (7.0% – 22.3%) (17.3% – 34.5%) (0.9% – 11.3%)
50–64 (n=185) 22.4% 7.4% 5.3% 11.2% 37.0% 16.8% (12.1% – 32.7%) (1.3% – 13.4%) (1.4% – 9.2%) (3.1% – 19.3%) (26.9% – 47.2%) (7.2% – 26.3%)
Race/Ethnicity
African American (n=7) 0.0% 0.0% 0.0% 0.0% 93.4% 6.6%
N.A. N.A. N.A. N.A. (81.2% – 100.0%)
(0.0% – 18.8%)
Hispanic (n=279) 25.6% 9.9% 9.1% 12.5% 34.9% 7.9% (18.9% – 32.3%) (5.3% – 14.5%) (4.9% – 13.3%) (7.6% – 17.5%) (27.8% – 42.1%) (4.0% – 11.8%)
Asian/Pacific Islander (n=2)
0.0% 0.0% 0.0% 0.0% 100.0% 0.0% N.A. N.A. N.A. N.A. N.A. N.A.
White/other (n=112) 0.0% 0.0% 0.0% 7.3% 90.9% 1.8%
N.A. N.A. N.A. (0.0% – 17.5%) (80.4% – 100.0%)
(0.0% – 4.6%)
Interview Language
Spanish (n=155) 41.5% 16.5% 11.2% 9.4% 8.8% 12.6% (31.7% – 51.2%) (9.1% – 24.0%) (5.2% – 17.2%) (3.8% – 15.1%) (3.2% – 14.5%) (6.3% – 18.9%)
English (n=245) 1.4% 0.0% 4.3% 14.3% 78.6% 1.3% (0.0% – 3.2%) N.A. (0.3% – 8.3%) (7.3% – 21.3%) (70.8% – 86.5%) (0.1% – 2.5%)
Help in Completing the Application
Overall, 56% of all purchasers—but 73% of Hispanics and 92% of Hispanics interviewed in
Spanish—indicated that they received help in completing the application. This not only explains why
so many Hispanics completed all or part of their forms in English but also reinforces the point that
the language in which forms are completed is a poor measure of Spanish speaker participation in
Covered California.
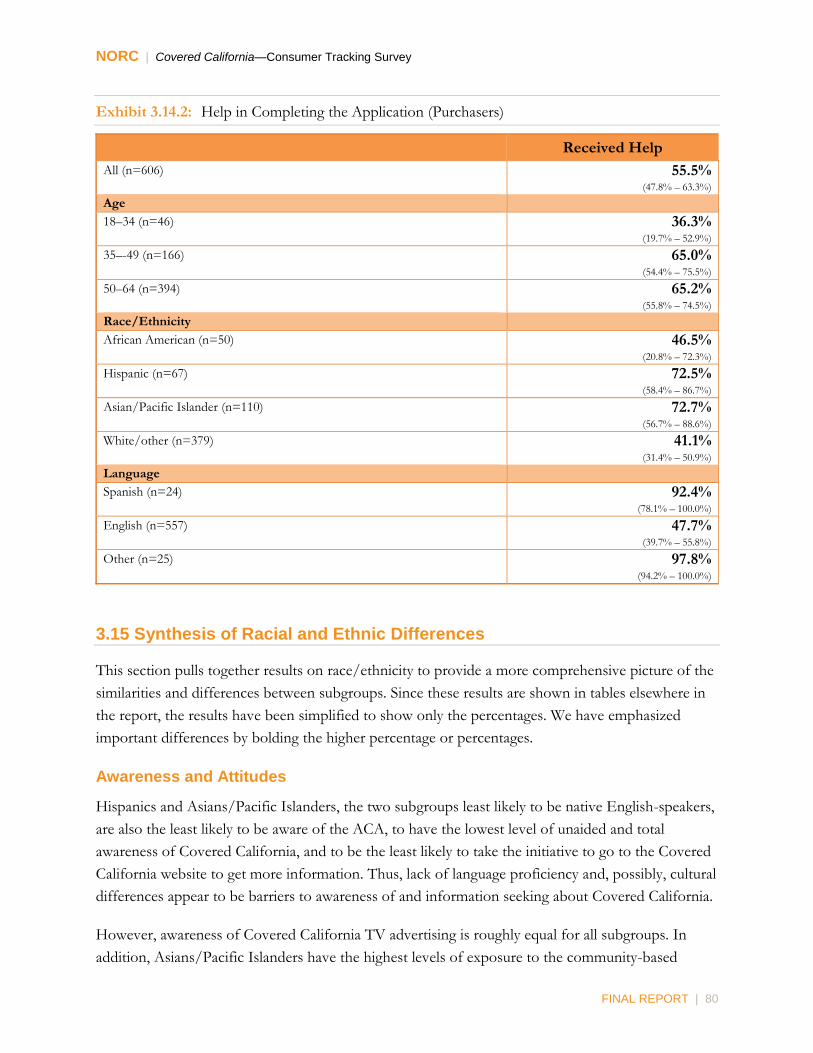
NORC | Covered California—Consumer Tracking Survey
FINAL REPORT | 80
Exhibit 3.14.2: Help in Completing the Application (Purchasers)
Received Help
All (n=606) 55.5% (47.8% – 63.3%)
Age
18–34 (n=46) 36.3% (19.7% – 52.9%)
35–-49 (n=166) 65.0% (54.4% – 75.5%)
50–64 (n=394) 65.2% (55.8% – 74.5%)
Race/Ethnicity
African American (n=50) 46.5% (20.8% – 72.3%)
Hispanic (n=67) 72.5% (58.4% – 86.7%)
Asian/Pacific Islander (n=110) 72.7% (56.7% – 88.6%)
White/other (n=379) 41.1% (31.4% – 50.9%)
Language
Spanish (n=24) 92.4% (78.1% – 100.0%)
English (n=557) 47.7% (39.7% – 55.8%)
Other (n=25) 97.8% (94.2% – 100.0%)
3.15 Synthesis of Racial and Ethnic Differences
This section pulls together results on race/ethnicity to provide a more comprehensive picture of the
similarities and differences between subgroups. Since these results are shown in tables elsewhere in
the report, the results have been simplified to show only the percentages. We have emphasized
important differences by bolding the higher percentage or percentages.
Awareness and Attitudes
Hispanics and Asians/Pacific Islanders, the two subgroups least likely to be native English-speakers,
are also the least likely to be aware of the ACA, to have the lowest level of unaided and total
awareness of Covered California, and to be the least likely to take the initiative to go to the Covered
California website to get more information. Thus, lack of language proficiency and, possibly, cultural
differences appear to be barriers to awareness of and information seeking about Covered California.
However, awareness of Covered California TV advertising is roughly equal for all subgroups. In
addition, Asians/Pacific Islanders have the highest levels of exposure to the community-based

NORC | Covered California—Consumer Tracking Survey
FINAL REPORT | 81
campaign, and Whites have the lowest levels. This suggests that the outreach campaign may be
breaking down racial/ethnic disparities in information and information seeking.
Despite having similarly high levels of awareness, African Americans and Whites do not have similar
attitudes toward Covered California and the ACA. Of all the subgroups, African Americans are the
most likely to say that the ACA will be good for them, while Whites are the most likely to say the
ACA will be bad for them. Agreement with specific statements suggests reasons for this difference
in attitudes. For example, Whites are the most likely to agree that people with health insurance
should be able to keep plans that don’t meet the requirements of the ACA and that they don’t trust
the government on health insurance, while African Americans are the most likely to agree that the
new law is an improvement over the old system.
Generally, Hispanics and Asians/Pacific Islanders have average awareness and attitudes, although
Whites and Hispanics are more likely to say they don’t trust the government on health insurance
than African Americans or Asians/Pacific Islanders while African Americans and Asians/Pacific
Islanders are more likely to say the new law is an improvement over the old.

NORC | Covered California—Consumer Tracking Survey
FINAL REPORT | 82
Exhibit 3.15.1: Summary of Racial and Ethnic Differences in Awareness and Attitudes toward the ACA and Awareness of Covered California and its Outreach Program
African American Hispanic
Asian/Pacific Islander White/Other
Awareness of the ACA
Aware of the ACA (aided) 88.5% 81.1% 80.1% 93.6%
Overall Attitude toward the ACA
ACA will be good for me 68.2% 51.6% 48.5% 41.4%
ACA will be bad for me 8.4% 34.0% 25.3% 42.4%
ACA will have no impact 23.4% 14.5% 26.2% 16.2%
Specific Attitudes toward the ACA
Many who couldn’t get insurance can get it now
72.0% 63.3% 67.6% 74.6%
Should be able to keep plans that don’t meet requirements
61.4% 61.8% 60.3% 72.9%
The new law is an improvement over the old
66.4% 48.7% 57.9% 45.1%
I don't trust the government on health insurance
14.2% 32.0% 19.9% 46.7%
The new law is going to be repealed
30.2% 24.6% 17.9% 23.9%
Awareness of Covered California
Unaided awareness 60.2% 35.6% 44.5% 66.1%
Aided awareness 20.5% 37.3% 24.8% 19.7%
Total awareness 80.7% 72.9% 69.3% 85.8%
Awareness of Covered California TV Advertising
Unaided awareness20 29.5% 26.4% 23.4% 30.3%
Total awareness 46.8% 49.0% 43.5% 49.5%
Community-Based and Internet Campaign Exposure
No community-based exposure 47.4% 49.9% 33.1% 59.6%
Medium community-based exposure
38.1% 34.7% 40.6% 29.2%
High community-based exposure 14.5% 15.4% 26.4% 11.2%
Any Internet campaign exposure 55.9% 38.8% 48.6% 55.8%
Friends and Family as an Information Source
Friends/family (received some information)
38.0% 32.2% 42.6% 34.6%
20 NORC personnel evaluated open-ended responses to a question asking respondents to describe the advertising. Respondents who gave a description judged as “probably” or “definitely” an actual Covered California advertisement were categorized as aware unaided.

NORC | Covered California—Consumer Tracking Survey
FINAL REPORT | 83
Knowledge, Social Normative Beliefs and Purchase/Shopping
African Americans and Whites are not only the most likely to be aware of Covered California, but
they also know the most about it. Hispanics, by contrast, have the lowest knowledge levels. African
Americans also seem alert to the changes in the insurance system since they are the most likely to
know that a lot of uninsured people are getting insurance now. Hispanics and Asians/Pacific
Islanders are not far behind, but relatively few Whites indicated that they know about this particular
change. Reflecting reality, both African Americans and Hispanics are more likely than Asians/Pacific
Islanders and Whites to agree that most people like me don’t have insurance.
Of all the subgroups, Hispanics are the least likely to say they have purchased insurance through
Covered California; but they, along with African Americans are the most likely to say they have
shopped but not purchased. Whites are the most likely to say they did not shop.
Exhibit 3.15.2: Summary of racial and ethnic differences in knowledge, social normative beliefs, and purchase and shopping for health insurance through Covered California
African
American Hispanic Asian/Pacific
Islander White/Other
Knowledge
Low knowledge 30.9% 48.3% 30.1% 26.5%
Medium knowledge 23.7% 38.0% 44.4% 37.8%
High knowledge 45.4% 13.8% 25.4% 35.8%
Social Normative Beliefs
A lot of uninsured people are getting insurance now
57.3% 47.9% 46.5% 28.7%
Most people like me don’t have insurance
51.2% 51.8% 29.4% 24.8%
Purchase and Shopping Status
Purchased 20.0% 13.1% 24.9% 20.6%
No purchase but looked 51.9% 56.0% 42.4% 41.3%
No purchase and did not look 28.1% 30.9% 32.7% 38.1%
Motivations for Purchase and Purchase Experience
Motivations for Purchase
Saving money is the most important motivator for purchasers among all subgroups except African
Americans, but it is somewhat more important for Whites and Asians/Pacific Islanders than it is for
Hispanics. Security is the most important motivator for African Americans. Mentioned by about
one-fifth of Hispanics, avoiding the penalty for being uninsured is more important for Hispanics
than for African Americans or Whites.

NORC | Covered California—Consumer Tracking Survey
FINAL REPORT | 84
Purchase Experience
The Covered California website21 is the most common way of purchasing a health plan via Covered
California for all subgroups, but African Americans, Hispanics, and Asians/Pacific Islanders are
much less likely to use it than Whites. These groups tend to seek assistance from either insurance
agents (African Americans and, to a lesser extent, Asians/Pacific Islanders) and Covered California
certified counselors (Hispanics).
African Americans and Whites are the most likely to report encountering problems with the website,
while African Americans and Hispanics are the most likely to report problems contacting Covered
California. Still, African Americans who used the website to make their purchase are more likely to
say that the process was easy or very easy than any other subgroup, while Asians/Pacific Islanders
are the most likely to say it was difficult or very difficult.
Despite these differences in experience, majorities of all the subgroups indicated that they would
recommend Covered California to a friend or family member.
21 Figures on website purchases may include those made on the Web with the assistance of insurance agents or Covered California certified counselors.
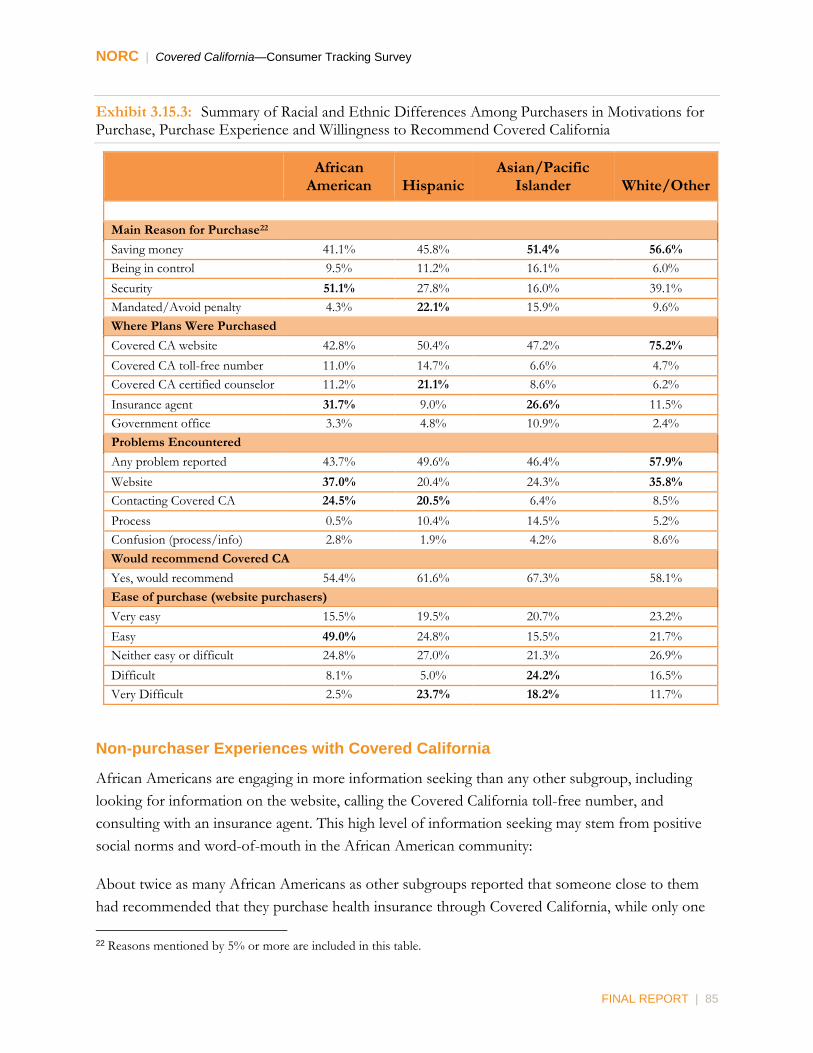
NORC | Covered California—Consumer Tracking Survey
FINAL REPORT | 85
Exhibit 3.15.3: Summary of Racial and Ethnic Differences Among Purchasers in Motivations for Purchase, Purchase Experience and Willingness to Recommend Covered California
African
American Hispanic Asian/Pacific
Islander White/Other
Main Reason for Purchase22
Saving money 41.1% 45.8% 51.4% 56.6%
Being in control 9.5% 11.2% 16.1% 6.0%
Security 51.1% 27.8% 16.0% 39.1%
Mandated/Avoid penalty 4.3% 22.1% 15.9% 9.6%
Where Plans Were Purchased
Covered CA website 42.8% 50.4% 47.2% 75.2%
Covered CA toll-free number 11.0% 14.7% 6.6% 4.7%
Covered CA certified counselor 11.2% 21.1% 8.6% 6.2%
Insurance agent 31.7% 9.0% 26.6% 11.5%
Government office 3.3% 4.8% 10.9% 2.4%
Problems Encountered
Any problem reported 43.7% 49.6% 46.4% 57.9%
Website 37.0% 20.4% 24.3% 35.8%
Contacting Covered CA 24.5% 20.5% 6.4% 8.5%
Process 0.5% 10.4% 14.5% 5.2%
Confusion (process/info) 2.8% 1.9% 4.2% 8.6%
Would recommend Covered CA
Yes, would recommend 54.4% 61.6% 67.3% 58.1%
Ease of purchase (website purchasers)
Very easy 15.5% 19.5% 20.7% 23.2%
Easy 49.0% 24.8% 15.5% 21.7%
Neither easy or difficult 24.8% 27.0% 21.3% 26.9%
Difficult 8.1% 5.0% 24.2% 16.5%
Very Difficult 2.5% 23.7% 18.2% 11.7%
Non-purchaser Experiences with Covered California
African Americans are engaging in more information seeking than any other subgroup, including
looking for information on the website, calling the Covered California toll-free number, and
consulting with an insurance agent. This high level of information seeking may stem from positive
social norms and word-of-mouth in the African American community:
About twice as many African Americans as other subgroups reported that someone close to them
had recommended that they purchase health insurance through Covered California, while only one
22 Reasons mentioned by 5% or more are included in this table.

NORC | Covered California—Consumer Tracking Survey
FINAL REPORT | 86
in five said that someone recommended against it. This gives African Americans a positive-to-
negative ratio of 2.53. Hispanics and Asians/Pacific Islanders also have high positive-to-negative
ratios while Whites have the lowest ratio of 1.14).
Of all the subgroups, Hispanics are the least likely to have found out how much a Covered
California insurance plan would cost them. Among those who found out, majorities of all subgroups
indicated that the costs are higher than expected. African Americans and Hispanics, however, are
more likely than Asians/Pacific Islanders and Whites to say that the costs are lower than expected.
In general, African Americans found the website more difficult to navigate than did other non-
purchaser subgroups. The navigation experiences of other subgroups were mixed. Hispanics and, to
a lesser extent, Whites were more likely to find the website very easy to navigate, but Hispanics were
also among the most likely to find the website very difficult to navigate. Asians/Pacific Islanders are
relatively unlikely to say the website was “very” difficult or easy, and are about equally likely to say it
was “easy” or “difficult.”

NORC | Covered California—Consumer Tracking Survey
FINAL REPORT | 87
Exhibit 3.15.4: Summary of Racial and Ethnic Differences in Non-purchaser Experience and Willingness to Recommend Covered California
African
American Hispanic Asian/Pacific
Islander White/Other
Where non-purchasers sought information
Covered CA website 52.3% 30.6% 41.3% 43.5%
Covered CA toll-free number 32.7% 14.4% 9.3% 9.5%
Covered CA certified counselor 12.1% 8.7% 9.7% 4.5%
Insurance agent 16.2% 5.7% 12.8% 8.7%
Government office 3.8% 10.1% 2.8% 2.2%
Other 10.8% 21.0% 13.9% 14.0%
Problems encountered
Any problem reported 17.2% 20.7% 16.8% 15.1%
Website 13.8% 6.2% 4.5% 6.7%
Contacting Covered CA 5.2% 5.2% 1.6% 2.2%
Confusion (process/info) 0.5% 3.6% 5.9% 2.8%
Costs 1.7% 2.3% 3.3% 1.1%
Finding out about the costs
Yes, found out about costs 33.2% 18.3% 31.2% 35.3%
Costs relative to expectations (found out about costs)
Covered CA is more 64.8% 55.6% 56.2% 60.3%
Covered CA is less 35.2% 37.4% 18.4% 21.4%
Covered CA is about the same 0.0% 7.0% 25.3% 18.3%
Recommendations from others
Recommended for purchase 47.7% 25.8% 26.3% 24.6%
Recommended against purchase 17.9% 10.6% 10.0% 21.9%
Ratio: Positive to negative 2.53 2.43 2.63 1.14
Ease of navigation (non-purchasers using the website)
Very easy 6.0% 40.7% 19.2% 34.5%
Easy 17.0% 10.7% 26.1% 17.7%
Neither easy or difficult 26.0% 9.7% 14.9% 20.4%
Difficult 14.5% 14.2% 29.0% 15.7%
Very difficult 36.4% 24.7% 10.8% 11.6%

NORC | Covered California—Consumer Tracking Survey
FINAL REPORT | 88
Purchase Intentions and Motivations
Whites are the least likely to say they will get coverage and the most likely to say they will not get it.
When asked about their motivation for not planning to get a plan, expense was the most frequently
cited reason for all subgroups except African Americans, who are slightly more likely to say that they
didn’t know how to apply, which is a factor for Hispanics also. Whites are the most likely subgroup
to cite distrust of the ACA or government as a reason.
When non-purchasers who said they plan to get coverage are asked about their motivations, African
Americans overwhelming cited security, and, while the results are not as dramatic, security was also
the most commonly cited reason among Hispanics and Whites. Security is not such an important
consideration for Asians/Pacific Islanders, who are more likely to cite saving money and penalty
avoidance as reasons for planning to get insurance. Penalty avoidance is also an important
consideration for Hispanics. Asians/Pacific Islanders are the only group with more than 10%
mentioning “doing the right thing” and “better health” as reasons for planning to get health
insurance.
Exhibit 3.15.5: Summary of Purchase Intentions and Motivations for Buying and Not Buying
African
American Hispanic Asian/Pacific
Islander White/Other
Purchase intentions
Will get coverage 41.3% 46.3% 36.8% 16.0%
May get coverage 28.4% 35.0% 24.1% 30.8%
Will not get coverage 30.3% 18.7% 39.1% 53.3%
Non-purchaser motivations for planning to get plan (will get a plan)
Saving money 15.2% 18.5% 28.4% 25.8%
Being in control 7.8% 25.3% 3.5% 10.1%
Security 81.3% 40.5% 18.8% 31.0%
Penalty avoidance 4.5% 31.5% 27.1% 19.8%
Right thing to do 0.0% 3.8% 13.8% 7.8%
Better health 1.8% 8.5% 16.5% 5.0%
Non-purchaser motivations for not planning to get a plan ( will not get a plan)
Expense 21.1% 27.1% 32.2% 26.8%
Don’t trust ACA or government
3.1% 8.0% 5.7% 17.7%
No need 9.2% 5.8% 1.1% 3.9%
Don’t know how to apply 27.1% 17.6% 6.0% 6.8%
Already have/plan to get 0.5% 0.9% 2.3% 2.1%
Other 31.1% 20.3% 32.1% 36.4%

NORC | Covered California—Consumer Tracking Survey
FINAL REPORT | 89
Appendix A: Questionnaire (English Language)
Covered California Market Tracking Study
Respondent Selection and Screening
INTRO1 Hello, my name is ______ and I’m calling on behalf of the state of California. We are conducting an important survey about how changes to the health insurance system may affect California residents and we’d like to ask your opinions. We are not selling anything. This call will be recorded or monitored.
S1 Am I speaking to someone who lives in this household who is over 17 years old?
1 YES 2 THIS IS A BUSINESS GO TO S1 EXIT 3 NO, NEW PERSON COMES TO PHONE GO TO S3 4 NO ONE OVER 17 LIVES IN THIS HOUSEHOLD GO TO S1 EXIT 5 NO ONE OVER 17 IS HOME RIGHT NOW GO TO S1B 6 NO ONE OVER 17 USES THIS CELLPHONE
[DISPLAY ONLY FOR CELL SAMPLE] GO TO S1 EXIT
99 REFUSED GO TO S1B
S3 Hello, my name is _____ and I’m calling from NORC at the University of Chicago. We are conducting a study on important health care issues affecting all Californians and would like to ask your opinions. We are not selling anything. This call will be recorded or monitored. Are you over 17 years old?
1 Yes 2 No GO TO S3B 77 Don’t know GO TO S1B 99 Refused GO TO S1B
S3B May I speak to someone over 17 years old?
1 Yes GO TO S3 2 No GO TO S1B
S1B I’ll try back again later. Thank you.
LANG_TYPE INTERVIEWER: WHAT LANGUAGE IS NEEDED TO CONDUCT THIS INTERVIEW
1 ENGLISH CONTINUE 2 SPANISH CONTINUE 3 OTHER LANGUAGE FOLLOW LANGUAGE LINE
PROCEDURES

NORC | Covered California—Consumer Tracking Survey
FINAL REPORT | 90
S_CELL ASK ONLY IF LIST_RDD_CELL=2 (CELL SAMPLE) Am I speaking to you on your cell phone?
1 Yes GO TO S_WARM 2 No GO TO S_CRIT
S_WARM ASK ONLY IF LIST_RDD_CELL=2 (CELL SAMPLE) If you are currently driving a car or doing any activity that requires your full attention I need to call you back at a later time.
1 CONTINUE 2 CALL BACK
S_CRIT
I would like to speak to a person in your household who is age 18 to 64 and makes decisions about health care for themselves or their family. Would that be you or someone else? READ IF NECESSARY: Family includes any children you claim as dependents on your income tax return whether they live with you full time or not.
1 RESPONDENT CONTINUE TO SCR_CONSENT 2 NEW PERSON COMES TO
PHONE GO TO S_NEW
3 PERSON NOT AVAILABLE SET CALL BACK 4 NO ONE BETWEEN THE AGES
OF 18 AND 64 LIVES HERE THANK AND CLOSE
99 REFUSED THANK AND CLOSE
SCR_CONSENT I only need 2 minutes of your time to determine if you are eligible for the survey. Your participation is voluntary and everything you say is completely confidential. I’d like to continue now unless you have any questions. READ IF NECESSARY: The survey is about important health care issues that will affect all Californians. If you have any questions about the survey, I can provide you with a free number for you to call.
1 CONTINUE CONTINUE TO S4 2 NEW PERSON COMES TO
PHONE GO TO S_NEW
99 REFUSE EXIT, CODE AS REFUSAL

NORC | Covered California—Consumer Tracking Survey
FINAL REPORT | 91
S4 (OLD 1.5)
Are you currently covered by health insurance? This includes health insurance obtained through a job, purchased directly, HMOs or prepaid plans like Kaiser (KY-ZER), government programs such as Medi-Cal, Medicare, military programs such as Champus or Champ VA, or the Indian Health Service.
1 Yes CONTINUE TO S4A 2 No CLASSIFY AS UNINSURED AND SKIP TO S5 77 Don’t know GO TO S4_DK 99 Refused EXIT AND CODE AS REFUSAL NOTE TO PROGRAMMER: IF S4=2 SET UNINSURED=1, ELSE SET UNINSURED=0
S4_DK Is there anyone in your household who can answer questions about health insurance coverage?
1 YES, NEW PERSON COMES TO PHONE
GO TO S_NEW
2 YES, BUT THAT PERSON IS NOT AVAILABLE
SET A CALL BACK
3 NO THANK AND CLOSE 77 DON’T KNOW THANK AND CLOSE 99 REFUSED THANK AND CLOSE
CLOSE: Those are all the questions I have. I’d like to thank you for taking time to speak to me today.
S4A (NEW)
Do you get your health insurance through your job or a family member’s job?
1 Yes THANK AND CLOSE 2 No GO TO S4B 77 Don’t know THANK AND CLOSE 99 Refused THANK AND CLOSE
CLOSE: Those are all the questions I have. I’d like to thank you for taking time to speak to me today.
S4B (NEW) Do you get your health insurance through the new health insurance marketplace which opened last October? (NEW) READ IF NECESSARY: The new health insurance marketplace opened October 1, 2013.
1 Yes CLASSIFY AS COVERED CA AND SKIP TO S5 2 No CONTINUE 77 Don’t know CONTINUE 99 Refused THANK AND CLOSE NOTE TO PROGRAMMER: IF S4B=1 SET COVEREDCA=1, ELSE SET COVEREDCA=0

NORC | Covered California—Consumer Tracking Survey
FINAL REPORT | 92
S4C (NEW)
I am going to read some government programs that provide health insurance. Tell me whether you get your health insurance through any of these government programs:
S4_C1 Medi-Cal
1. Yes 2. No 77. Don’t know 99. Refused
S4_C2 Medicare
1. Yes 2. No 77. Don’t know 99. Refused
S4_C3 Military programs such as Champus or Champ VA
1. Yes 2. No 77. Don’t know 99. Refused
S4_C4 Indian Health Service 1. Yes 2. No 77. Don’t know 99. Refused
IF R SAYS YES TO ANY OF THE ITEMS ABOVE (S4_C1 THROUGH S4_C4 THEN THANK AND CLOSE. ELSE CONTINUE TO S4D.
S4D Do you get your health insurance through a plan that you or someone in your family purchased on their own from some place other than the new health insurance marketplace, which opened last October (October 1, 2013)? (NEW)
1 Yes GO TO S5 2 No THANK AND CLOSE 77 Don’t know THANK AND CLOSE 99 Refused THANK AND CLOSE
S5 Are you 18 to 25 years old, 26 to 34 years old, 35 to 49 years old, 50 to 64 years old, or 65 or older? (OLD 1.4)
1 UNDER 18 GO TO S5B 2 18 – 25 CONTINUE TO S7, SET FLAG UNDER35=1 3 26 - 34 CONTINUE TO S7, SET FLAG UNDER35=1 4 35- 49 CONTINUE TO S7 5 50 - 64 CONTINUE TO S7 6 65+ GO TO S5B 77 DON’T KNOW THANK AND CLOSE 99 REFUSED THANK AND CLOSE
CLOSE: Those are all the questions I have. I’d like to thank you for taking time to speak to me today.

NORC | Covered California—Consumer Tracking Survey
FINAL REPORT | 93
S5B (OLD 1.4B)
Is there anyone in this household between the ages of 18 and 64?
1 Yes, new person comes to
phone GO TO S_NEW
2 No THANK AND CLOSE 77 Don’t know THANK AND CLOSE 99 Refused THANK AND CLOSE
CLOSE: Those are all the questions I have. I’d like to thank you for taking time to speak to me today.
S_NEW Hello, my name is _____ and I’m calling from NORC at the University of Chicago. We are conducting a study on important health care issues affecting all Californians and would like to ask your opinions. We are not selling anything. This call will be recorded or monitored. GO TO S_CRIT, CYCLE THROUGH ALL QUESTIONS AGAIN
S6 (OLD 1.6)
To the best of your knowledge, are you a legal resident of California? READ IF NECESSARY: To be a legal resident of California, you must be a United States citizen or permanent resident, live in California all or most of the year, file a California tax return, and be eligible for State benefits.
1 Yes CONTINUE 2 No THANK AND CLOSE 77 Don’t know THANK AND CLOSE 99 Refused THANK AND CLOSE
CLOSE: Those are all the questions I have. I’d like to thank you for taking time to speak to me today.
S7 The topic of this study is health insurance. People who buy health insurance sometimes cover family members, as well as themselves. Including yourself, how many people are there in your family? READ IF NECESSARY: Family includes any children you claim as dependents on your income tax return whether they live with you full time or not. . (NEW)
RECORD NUMBER IF MORE THAN ONE CLASSIFY AS “FAMILY” 77 DON’T KNOW THANK AND CLOSE
99 REFUSED THANK AND CLOSE
NOTE TO PROGRAMMER: IF S7=1, SET FAMILY=0, ELSE IF S7 NOT IN (77,99) SET FAMILY=1.

NORC | Covered California—Consumer Tracking Survey
FINAL REPORT | 94
CLOSE: Those are all the questions I have. I’d like to thank you for taking time to speak to me today.
S8 (NEW)
Your family income includes all the money that any family member brings in from any source before taxes are taken out. Remember that family includes any children you claim as dependents on your income tax return whether they live with you full time or not. To the best of your knowledge was your family income for 2013 under or over [100% PL for family size]?
1 UNDER THANK AND CLOSE 2 OVER CONTINUE 3 EXACTLY [INSERT 100% FPL] CONTINUE 77 DON’T KNOW THANK AND CLOSE 99 REFUSED THANK AND CLOSE
CLOSE: Those are all the questions I have. I’d like to thank you for taking time to speak to me today.
CONSENT Before I continue, I would like you to know that your participation in this survey is voluntary. Everything you say is completely confidential. You may choose not to answer any questions you don’t wish to answer, or end the interview at any time with no impact on the benefits you may receive. The survey will take about 15 to 20 minutes. READ IF NECESSARY: The survey is about important health care issues that will affect all Californians. If you have any questions about the survey, I can provide you with a free number for you to call.

NORC | Covered California—Consumer Tracking Survey
FINAL REPORT | 95
Section 1. Awareness of ACA and Covered California
1_1 (OLD 6.1, MODIFIED)
Have you heard, seen, or read anything about the Affordable Care Act, the new health care law proposed by President Obama and passed by Congress?
1 YES CONTINUE 2 NO SKIP TO 1_2 77 DON’T KNOW SKIP TO 1_2 99 REFUSED SKIP TO 1_2
1_1A (OLD 6.1B)
Based on what you have heard, do you think the Affordable Care Act will be good for you, bad for you, or will it have no impact?
1 GOOD 2 BAD 3 NO IMPACT 77 DON’T KNOW 99 REFUSED
1_1B (NEW)
I’ll read a list of statements that some people have made about the Affordable Care Act. As I read each one, please tell me whether or not you agree or disagree with it. READ. RANDOMIZE.
A People should be able to keep the health insurance plans they had before the new law went into effect, even if the government says they’re not good enough.
B Many people who couldn’t get health insurance before will be able to get it under the new law.
C The new law is going to be repealed. D The new law is an improvement over the health insurance system we had before. E I don’t trust the government to do the right thing on health insurance
1_2 (OLD 6.2*)
Have you heard or read anything about where Californians can go to get health insurance under the Affordable Care Act?
1 YES CONTINUE 2 NO SKIP TO Q1_2B 77 DON’T KNOW SKIP TO Q1_2B 99 REFUSED SKIP TO Q1_2B

NORC | Covered California—Consumer Tracking Survey
FINAL REPORT | 96
1_2A (OLD 6.1C* and 6.2A)
Where can they go? PROBE: DO NOT READ CATEGORIES. PROBE FOR MULTIPLE RESPONSES AND ACCEPT UP TO 3.
1 COVERED CALIFORNIA SKIP TO SECTION 2 2 CALIFORNIA HEALTH BENEFIT EXCHANGE SKIP TO SECTION 2 3 WEBSITE 4 TOLLFREE NUMBER/CALL CENTER 5 INSURANCE ENROLLMENT COUNSELORS 6 COUNTY ELIGIBILITY WORKERS OR MEDI-CAL
INSURANCE AGENTS
7 OTHER: SPECIFY 8 CANNOT REMEMBER/NOT SURE 77 DON’T KNOW 99 REFUSED
Q1_2AOTH ENTER OTHER SPECIFY ____________
1_2B (OLD 6.2 A)
[ASK ONLY IF THE NAME “COVERED CALIFORNIA” OR “CALIFORNIA HEALTH BENEFIT EXCHANGE” NOT MENTIONED IN 1_2A (1_2A NOT IN (1, 2).] Have you heard or read anything about an organization called Covered California?
1 YES CONTINUE TO SECTION 2 2 NO CONTINUE TO SECTION 2 77 DON’T KNOW CONTINUE TO SECTION 2 99 REFUSED CONTINUE TO SECTION 2
ASK ABOUT COVERED CALIFORNIA IN SECTIONS 2 & 3 WHETHER OR NOT RESPONDENT IS AWARE OF IT.

NORC | Covered California—Consumer Tracking Survey
FINAL REPORT | 97
Section 2: Unaided Advertising Awareness
2_1 NEW
Have you seen or heard any advertisements asking Californians to purchase health insurance under the Affordable Care Act? I mean commercials or ads, not news stories or other things in the media.
1 YES CONTINUE 2 NO SKIP TO SECTION 3 77 DON’T KNOW/NOT SURE SKIP TO SECTION 3 99 REFUSED SKIP TO SECTION 3
2_1A (NEW)
Let’s start with one of the ads you saw. What do you remember seeing or hearing in the ad? Who was in the ad? What happened?
OPEN END. PROBE FOR UP TO 3 RESPONSES. 77 Don’t know 99 Refused
2_1B (NEW)
What organization sponsored the ad? Please tell me what you remember.
OPEN END. PROBE FOR SPECIFIC NAME 77 DON’T KNOW 99 REFUSED
2_1C (NEW)
Where did you see or hear the ad?
OPEN END. PROBE FOR UP TO 3 RESPONSES. DO NOT READ RESPONSES.
1 TELEVISION 2 RADIO 3 NEWSPAPERS/MAGAZINES/OTHER PRINT 4 BUS/OTHER TRANSIT ADVERTISING 5 BILLBOARD/OTHER OUTDOOR ADVERTISING 6 INTERNET/ONLINE 7 OTHER: SPECIFY GO TO 2_1C_OTH 77 DON’T KNOW 99 REFUSED
2_1C_OTH ENTER OTHER SPECIFY _____________

NORC | Covered California—Consumer Tracking Survey
FINAL REPORT | 98
2_1D (NEW)
On a scale of zero to 10, where zero means “not at all believable” and 10 means “extremely believable, how believable was the ad?
Response set =0-10 scale 77 Don’t know 99 Refused
[ABOVE ITEMS REPEAT FOR UP TO 2 ADDITIONAL ADVERTISEMENTS.]
2_2 (NEW)
Have you seen any other ads urging Californians to purchase health insurance under the Affordable Care Act?
1 Yes GO TO 2_2A 2 No GO TO SECTION 3 77 Don’t know GO TO SECTION 3 99 Refused GO TO SECTION 3
2_2A (NEW)
What do you remember seeing or hearing in the ad? Who was in the ad? What happened?
OPEN END. PROBE FOR UP TO 3 RESPONSES. REPEAT QUESTION AS NECESSARY.
77 Don’t know 99 Refused
2_2B (NEW)
What organization sponsored the ad? Please tell me what you remember.
OPEN END. PROBE FOR SPECIFIC NAME 77 Don’t know 99 Refused
2_2C (NEW)
Where did you see or hear the ad?
OPEN END. PROBE FOR UP TO 3 RESPONSES. DO NOT READ RESPONSES.
1 TELEVISION 2 RADIO 3 NEWSPAPERS/MAGAZINES/OTHER PRINT 4 BUS/OTHER TRANSIT ADVERTISING 5 BILLBOARD/OTHER OUTDOOR ADVERTISING 6 INTERNET/ONLINE 7 OTHER: SPECIFY GO TO 2_2C_OTH 77 DON’T KNOW 99 REFUSED

NORC | Covered California—Consumer Tracking Survey
FINAL REPORT | 99
2_2C_OTH ENTER OTHER SPECIFY _____________
2_2D (NEW)
On a scale of zero to 10, where zero means “not at all believable” and 10 means “extremely believable, how believable was the ad?
Response set =0-10 scale 77 Don’t know 99 Refused
2_3 (NEW)
Have you seen any other ads urging Californians to purchase health insurance under the Affordable Care Act?
1 Yes GO TO 2_3A 2 No GO TO NEXT SECTION 77 Don’t know GO TO NEXT SECTION 99 Refused GO TO NEXT SECTION
2_3A (NEW)
What do you remember seeing or hearing in the ad? Who was in the ad? What happened?
OPEN END. PROBE FOR UP TO 3 RESPONSES. REPEAT QUESTION AS NECESSARY.
77 Don’t know 99 Refused
2_3B (NEW)
What organization sponsored the ad? Please tell me what you remember.
OPEN END. PROBE FOR SPECIFIC NAME 77 Don’t know 99 Refused
2_3C (NEW)
Where did you see or hear the ad?
OPEN END. PROBE FOR UP TO 3 RESPONSES. DO NOT READ RESPONSES.
1 TELEVISION 2 RADIO 3 NEWSPAPERS/MAGAZINES/OTHER PRINT 4 BUS/OTHER TRANSIT ADVERTISING 5 BILLBOARD/OTHER OUTDOOR ADVERTISING 6 INTERNET/ONLINE 7 OTHER: SPECIFY GO TO 2_3C_OTH 77 DON’T KNOW 99 REFUSED

NORC | Covered California—Consumer Tracking Survey
FINAL REPORT | 100
2_3C_OTH ENTER OTHER SPECIFY _____________
2_3D (NEW)
On a scale of zero to 10, where zero means “not at all believable” and 10 means “extremely believable, how believable was the ad?
Response set =0-10 scale 77 Don’t know 99 Refused

NORC | Covered California—Consumer Tracking Survey
FINAL REPORT | 101
Section 4. Recognition of Major Television Ads
4_1 (NEW)
Now I am going to ask you about some specific advertisements that are running on television. As I mentioned before, this advertising campaign is new. Also, some of the ads may not have run in your areas, or may have run in a different language. So we don’t expect anyone to remember all of the ads. … [READ. RANDOMIZE.]
4_1.1 The ad shows a worried-looking young woman waiting for a bus and looking at the symptoms of asthma on her smartphone. She looks relieved when she sees a doctor’s appointment on her calendar. The message is: Welcome to Covered California. Now you can no longer be denied because of a pre-existing condition. Do you happen to remember that ad, or not, or are you not sure?
4_1.2 The ad shows a young man on a bike taking a bad spill and then shows him in a hospital bed. The message is: To those who have encountered a bump on the road, welcome to Covered California, a new affordable health plan so you can be ready for what comes your way. Do you happen to remember that ad, or not, or are you not sure?
4_1.3 The ad shows a family in a car driving from Sacramento to Salinas to San Diego. The ad welcomes people to Covered California and a new state of health. It says that there is now equal access to quality health insurance – that those who need financial assistance will get it and that no one will be denied because of a pre-existing condition. Do you happen to remember that ad, or not, or are you not sure?
4_1.4 The ad shows mother and sick child, then an injured worker and an injured athlete, and says: To those who have worried, suffered in silence, hoped and lived in a state of fear, welcome to a new state of health where everyone can get quality affordable health insurance, financial help for those in need, and nobody can be denied because of a pre-existing condition. Do you happen to remember that ad, or not, or are you not sure?
4_1.5 The ad shows people opening doors and says that Californians will welcome a new market place of affordable health insurance and nobody can be denied because of a pre-existing condition. Do you happen to remember that ad, or not, or are you not sure?
4_1.6 The ad shows a man looking at his medicine, then two women looking up diabetes on the computer, then a couple looking at their bills. The ad says that there is now equal access to affordable health insurance and you may get help paying for your insurance. Do you happen to remember that ad, or not, or are you not sure?
4_1.7 The ad shows an older woman who talks about the many years she searched for health insurance but was always denied coverage because of her age. She says that this has now changed and that she and others like her can go to Covered California to get quality coverage and even financial assistance..

NORC | Covered California—Consumer Tracking Survey
FINAL REPORT | 102
Do you happen to remember that ad, or not, or are you not sure? RESPONSE SET FOR EACH OF THE ABOVE 1 YES, HAVE SEEN 2 NO, HAVE NOT SEEN 77 DON’T KNOW/NOT SURE 99 REFUSED

NORC | Covered California—Consumer Tracking Survey
FINAL REPORT | 103
Section 5: Exposure to Other Campaign Elements
5_1 (NEW)
[ASK ALL.] Have you seen any information about Covered California on the internet?
1 Yes CONTINUE 2 No SKIP TO 5_2 77 Don’t know SKIP TO 5_2 99 Refused SKIP TO 5_2
5_1A Have you gotten any information about Covered California ...
[READ. RANDOMIZE.]
Yes No DK Ref 5_1A1 From a You Tube video 1 2 77 99 5_1A2 On Facebook 1 2 77 99 5_1A3 On Twitter 1 2 77 99 5_1A4 By going to the Covered California Website 1 2 77 99 5_1A5 [THIS ITEM SHOULD ALWAYS FOLLOW ITEM
5_1A5] By going to some other website
1 2 77 99
5_1A6 By going to the library to use the Internet 1 2 77 99
5_2 (NEW)
Have you received information about Covered California …? [READ. RANDOMIZE.]
Yes No DK Ref 5_2A At a health fair 1 2 77 99 5_2B At a workshop or seminar 1 2 77 99 5_2C At an event at your church or other place of worship 1 2 77 99 5_2D At an event at a school or college 1 2 77 99 5_2E [ALWAYS ASK LAST]: At some other type of event you
attended. (ACCEPT UP TO 3 RESPONSES) 1 2 77 99
5_2E_OTH ENTER OTHER SPECIFY _____________
5_3 (NEW)
Have you received information about Covered California from friends or family?
1 Yes 2 No 77 Don’t Know 99 Refuse

NORC | Covered California—Consumer Tracking Survey
FINAL REPORT | 104
5_4 (NEW)
Have you talked in person with any of the following to get information about Covered California…? [READ. RANDOMIZE.[
Yes No DK Ref 5_4A A Covered California certified educator or enrollment
counselor 1 2 77 99
5_4B An insurance agent 1 2 77 99 5_4C Staff at a government office that enrolls people in social
services 1 2 77 99
5_4D Staff at a clinic or other organization that works with Covered California
1 2 77 99
5_4E Health plan representative 1 2 77 99

NORC | Covered California—Consumer Tracking Survey
FINAL REPORT | 105
Section 6. Knowledge about Covered California
6 (OLD 6.4)
Here are some statements that people have made about Covered California. For each, please tell me whether you think it is true, false or if you are not sure.
RANDOMIZE ORDER 6_1 – 6_11
6_1 (OLD 6.41 MODIFIED)
Covered California is operated by the health insurance industry.
1 True 2 False 77 Don’t know/Not sure 99 Refused READ IF NECESSARY: This is a statement that people have made about Covered California. Please tell me whether you think it is true, false or if you are not sure.
6_2 (OLD 6.42 MODIFIED)
Covered California offers only government health insurance plans.
1 True 2 False 77 Don’t know/Not sure 99 Refused
READ IF NECESSARY: This is a statement that people have made about Covered California. Please tell me whether you think it is true, false or if you are not sure.
6_3 (OLD 6.44 MODIFIED)
The health plans meet people’s basic needs but generally are not as good as the plans sold elsewhere.
1 True 2 False 77 Don’t know/Not sure 99 Refused.
READ IF NECESSARY: This is a statement that people have made about Covered California. Please tell me whether you think it is true, false or if you are not sure.
6_4 (OLD 6.45 MODIFIED)
People with low and moderate incomes receive a tax credit to reduce their monthly cost or premium.
1 True 2 False 77 Don’t know/Not sure 99 Refused

NORC | Covered California—Consumer Tracking Survey
FINAL REPORT | 106
READ IF NECESSARY: This is a statement that people have made about Covered California. Please tell me whether you think it is true, false or if you are not sure.
6_5 (OLD 6.46 MODIFIED)
People with lower incomes pay less for the out-of-pocket costs they have to pay when they go to get health care. These are costs the patient has to cover before the insurance begins paying.
1 True 2 False 77 Don’t know/Not sure 99 Refused
READ IF NECESSARY: This is a statement that people have made about Covered California. Please tell me whether you think it is true, false or if you are not sure.
6_6 (OLD 6.47 MODIFIED)
You can get information, compare plans and get health insurance by going online to the Covered California website.
1 True 2 False 77 Don’t know/Not sure 99 Refused
READ IF NECESSARY: This is a statement that people have made about Covered California. Please tell me whether you think it is true, false or if you are not sure.
6_7 (OLD 6.48 MODIFIED)
Most people who don’t have health insurance by April 2014 will have to pay a penalty.
1 True 2 False 77 Don’t know/Not sure 99 Refused READ IF NECESSARY: This is a statement that people have made about Covered California. Please tell me whether you think it is true, false or if you are not sure.

NORC | Covered California—Consumer Tracking Survey
FINAL REPORT | 107
6_8 (OLD 6.49 MODIFIED)
Covered California is a welfare program.
1 True 2 False 77 Don’t know/Not sure 99 Refused
READ IF NECESSARY: This is a statement that people have made about Covered California the new marketplace. Please tell me whether you think it is true, false or if you are not sure.
6_9 (NEW)
Covered California is the only place low- and moderate-income people can get tax credits to help reduce the cost of the monthly health plan premium.
1 True 2 False 77 Don’t know/Not sure 99 Refused
READ IF NECESSARY: This is a statement that people have made about Covered California. Please tell me whether you think it is true, false or if you are not sure.
6_10 (OLD 6.411 MODIFIED)
Covered California offers private health insurance plans that will compete for your business.
1 True 2 False 77 Don’t know/Not sure 99 Refused
READ IF NECESSARY: This is a statement that people have made about Covered California. Please tell me whether you think it is true, false or if you are not sure.
6_11 (OLD 6.412 MODIFIED)
You can get health insurance through Covered California even if you have a pre-existing condition. INTERVIEWER INSTRUCTION: A pre-existing condition is a medical problem you have at the time you apply for health insurance..
1 True 2 False 77 Don’t know/Not sure 99 Refused

NORC | Covered California—Consumer Tracking Survey
FINAL REPORT | 108
READ IF NECESSARY: This is a statement that people have made about Covered California. Please tell me whether you think it is true, false or if you are not sure.
Section 6B. Importance of Facts about Covered California
6B_1 (OLD 6.5)
Now I will read you a list of facts about Covered California. As I read each one, please tell how important it is or was in your decision about whether or not to shop for health insurance at Covered California. Please use a scale of zero to 10, where “zero” means that it is not important at all and “10” means that it is extremely important.
RANDOMIZE ORDER 6_1.1-6_1.7
6B_11 (OLD 6.51)
The California State Government operates Covered California. ENTER NUMBER ______ (range: 0-10, 77, 99) READ IF NECESSARY: Please tell me how important this will be in your decision about whether or not to shop for health insurance at Covered California. Please use a scale of zero to 10, where “zero” means that it is not important at all and “10” means that it is extremely important.
6B_12 (OLD 6.52)
(ALWAYS READ AFTER 6B_11. DO NOT RANDOMIZE.) Covered California offers a number of private health insurance plans. ENTER NUMBER ______ (range: 0-10, 77, 99) READ IF NECESSARY: Please tell me how important this will be in your decision about whether or not to shop for health insurance at Covered California. Please use a scale of zero to 10, where “zero” means that it is not important at all and “10” means that it is extremely important.
6B_13 (OLD 6.53)
It will be easy to compare insurance plans and select the one that is best for you. ENTER NUMBER ______ (range: 0-10, 77, 99) READ IF NECESSARY: Please tell me how important this will be in your decision about whether or not to shop for health insurance at Covered California. Please use a scale of zero to 10, where “zero” means that it is not important at all and “10” means that it is extremely important.
6B_14 (OLD 6.54)
All plans are screened to make sure they offer the services people need, including preventive care. ENTER NUMBER ______ (range: 0-10, 77, 99)

NORC | Covered California—Consumer Tracking Survey
FINAL REPORT | 109
READ IF NECESSARY: Please tell me how important this will be in your decision about whether or not to shop for health insurance at Covered California. Please use a scale of zero to 10, where “zero” means that it is not important at all and “10” means that it is extremely important.
6B_15 (OLD 6.55)
People with low and moderate incomes receive a tax credit to reduce their monthly cost or premium. ENTER NUMBER ______ (range: 0-10, 77, 99) READ IF NECESSARY: Please tell me how important this will be in your decision about whether or not to shop for health insurance at Covered California. Please use a scale of zero to 10, where “zero” means that it is not important at all and “10” means that it is extremely important.
6B_16 (OLD 6.56)
(ALWAYS READ AFTER 6_B15. DO NOT RANDOMIZE.) People with lower incomes will also pay less for out-of-pocket costs when they use health care. ENTER NUMBER ______ (range: 0-10, 77, 99) READ IF NECESSARY: Please tell me how important this will be in your decision about whether or not to shop for health insurance at Covered California. Please use a scale of zero to 10, where “zero” means that it is not important at all and “10” means that it is extremely important.
6B_17 (OLD 6.57 MODIFIED)
You cannot be denied because of a pre-existing condition. INTERVIEWER INSTRUCTION: A pre-existing condition is a medical problem you have at the time you apply for health insurance. ENTER NUMBER ______ (range: 0-10, 77, 99) READ IF NECESSARY: Please tell me how important this will be in your decision about whether or not to shop for health insurance at Covered California. Please use a scale of zero to 10, where “zero” means that it is not important at all and “10” means that it is extremely important.
6B_18 (OLD 6.58, MODIFIED)
Most people who don’t get health insurance before April 1, 2014 will have to pay a penalty. ENTER NUMBER ______ (range: 0-10, 77, 99) READ IF NECESSARY: Please tell me how important this will be in your decision about whether or not to shop for health insurance at Covered California. Please use a scale of zero to 10, where “zero” means that it is not important at all and “10” means that it is extremely important.

NORC | Covered California—Consumer Tracking Survey
FINAL REPORT | 110
6B_3 (OLD 5.38)
Now I’ll read some statements people have made about their health. As I do please tell me whether you agree strongly, agree somewhat, disagree somewhat or disagree strongly. A lot of people who didn’t have health insurance before are getting it now because it is the right thing to do.
1 Agree strongly 2 Agree somewhat 3 Disagree somewhat 4 Disagree strongly 77 DON’T KNOW/NO OPINION 99 REFUSED
6B_4 (OLD 5.39)
Most people like me don’t have health insurance. READ IF NECESSARY: Please tell me whether you agree strongly, agree somewhat, disagree somewhat or disagree strongly.
1 Agree strongly 2 Agree somewhat 3 Disagree somewhat 4 Disagree strongly 77 DON’T KNOW/NO
OPINION
99 REFUSED

NORC | Covered California—Consumer Tracking Survey
FINAL REPORT | 111
Section 7: Purchase Status and Intention
7_1A (NEW) Have you applied for a health insurance plan through Covered California?
1 Yes CONTINUE 2 No SKIP TO SECTION 7B, CODE AS NON
PURCHASER (SET NONPURCHASER=1) 77 DON’T KNOW SKIP TO SECTION 7B, CODE AS NON
PURCHASER (SET NONPURCHASER=1) 99 REFUSED SKIP TO SECTION 7B CODE AS NON
PURCHASER (SET NONPURCHASER=1)
7_1B (NEW) Have you selected your plan?
1 Yes CONTINUE 2 No SKIP TO SECTION 7B, CODE AS NON
PURCHASER (SET NONPURCHASER=1) 77 DON’T KNOW SKIP TO SECTION 7B, CODE AS NON
PURCHASER (SET NONPURCHASER=1) 99 REFUSED SKIP TO SECTION 7B, CODE AS NON
PURCHASER (SET NONPURCHASER=1)
7_1C (NEW) Did you complete your purchase by paying for your plan?
1 YES GO TO SECTION 7B– CODE AS PURCHASER (SET PURCHASER=1)
2 NO GO TO 7_1D 77 DON’T
KNOW GO TO 7_1D
99 REFUSED GO TO 7_1D
7_1D (NEW) Do you plan to complete your purchase by paying for your plan?
1 YES GO TO SECTION 7B– CODE AS PURCHASER (SET PURCHASER=1)
2 NO SKIP TO SECTION 7B, CODE AS NON PURCHASER (SET NONPURCHASER=1)
77 DON’T KNOW
SKIP TO SECTION 7B, CODE AS NON PURCHASER (SET NONPURCHASER=1)
99 REFUSED SKIP TO SECTION 7B, CODE AS NON PURCHASER (SET NONPURCHASER=1)

NORC | Covered California—Consumer Tracking Survey
FINAL REPORT | 112
Section 7B. Prior Plan Comparison
7B_1 In the last few months of 2013, did you receive a cancellation notice for your health insurance or a notice that your insurance would not be renewed? READ IF NECESSARY: By last few months we mean since October 2013.
1 Yes CONTINUE 2 No SKIP TO NEXT SECTION,
SECTION 8 IF PURCHASER=1 SECTION 9 IF NONPURCHASER=1
77 Don’t know SKIP TO NEXT SECTION, SECTION 8 IF PURCHASER=1 SECTION 9 IF NONPURCHASER=1
99 Refused SKIP TO NEXT SECTION, SECTION 8 IF PURCHASER=1 SECTION 9 IF NONPURCHASER=1
7B_2 Did the notice you received say that the cancellation was the result of the
Affordable Care Act? READ IF NECESSARY: The Affordable Care Act is the new health care law proposed by President Obama and passed by Congress.
1 Yes CONTINUE 2 No CONTINUE 77 Don’t know CONTINUE 99 Refused CONTINUE
7B_3 Did the notice say that you should visit Covered California to enroll in a new
plan?
1 Yes CONTINUE 2 No CONTINUE 77 Don’t know CONTINUE 99 Refused CONTINUE
IF PURCHASER=1 CONTINUE TO 7B_4, ELSE SKIP TO SECTION 9
7B_4 Did the plan you purchased through Covered California cost more, less, or about the same as the plan that was cancelled?
1 More CONTINUE 2 About the Same CONTINUE 3 Less CONTINUE 77 Don’t know CONTINUE

NORC | Covered California—Consumer Tracking Survey
FINAL REPORT | 113
99 Refused CONTINUE
7B_5 Do you think the plan you purchased through Covered California is better,
worse, or about the same as the plan that was cancelled?
1 Better CONTINUE 2 About the Same CONTINUE 3 Worse CONTINUE 77 Don’t know CONTINUE 99 Refused CONTINUE

NORC | Covered California—Consumer Tracking Survey
FINAL REPORT | 114
Section 8. Purchaser Motivations and Experience
ASK ALL PURCHASERS (PURCHASER=1) (THOSE WHO HAVE PAID FOR A PLAN, SELECTED ONE, OR APPLIED AND INTEND TO COMPLETE THE PURCHASE FROM ABOVE)
8_1 (NEW)
What are the main reasons you decided to purchase health insurance through Covered California?
OPEN END. PROBE FOR MULTIPLE RESPONSES. ACCEPT UP TO 3. ___________________
77 DON’T KNOW 99 REFUSED
8_2 (NEW)
Where did you go to apply for or purchase your plan? (READ RESPONSES BELOW)
1 Covered California website GO TO 8_2A 2 Covered California toll free number GO TO 8_2A 3 Covered California certified educator or enrollment
counselor in your neighborhood GO TO 8_2A
4 Insurance agent GO TO 8_2A 5 A government office where you can enroll in social
services GO TO 8_2A
77 Don’t know GO TO 8_2A 99 Refused GO TO 8_2A
8_2A (NEW)
Did you encounter any problems that made it difficult for you to apply or purchase your plan?
1 Yes CONTINUE 2 No SKIP TO 8_4 77 Don’t know SKIP TO 8_4 99 Refused SKIP TO 8_4
8_2A1 (NEW)
Please tell me about those problems.
OPEN END. PROBE FOR MULTIPLE RESPONSES. ACCEPT UP TO 3. 77. DON’T KNOW 99. REFUSED
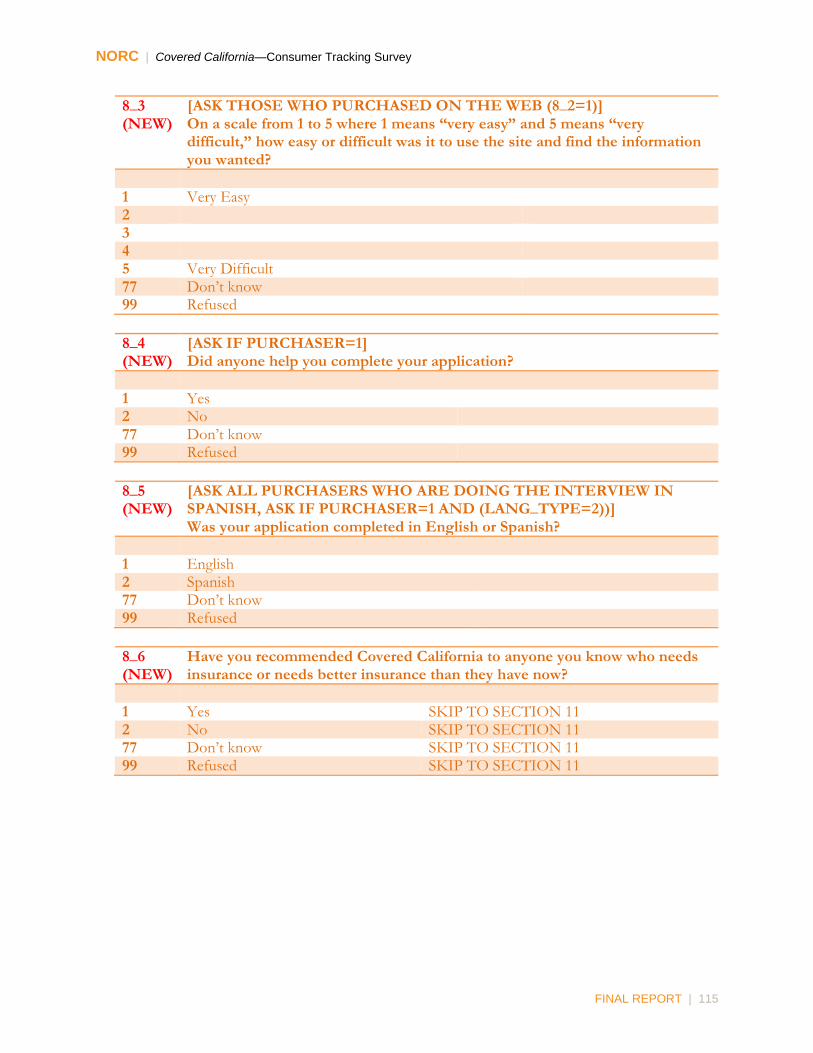
NORC | Covered California—Consumer Tracking Survey
FINAL REPORT | 115
8_3 (NEW)
[ASK THOSE WHO PURCHASED ON THE WEB (8_2=1)] On a scale from 1 to 5 where 1 means “very easy” and 5 means “very difficult,” how easy or difficult was it to use the site and find the information you wanted?
1 Very Easy 2 3 4 5 Very Difficult 77 Don’t know 99 Refused
8_4 (NEW)
[ASK IF PURCHASER=1] Did anyone help you complete your application?
1 Yes 2 No 77 Don’t know 99 Refused
8_5 (NEW)
[ASK ALL PURCHASERS WHO ARE DOING THE INTERVIEW IN SPANISH, ASK IF PURCHASER=1 AND (LANG_TYPE=2))] Was your application completed in English or Spanish?
1 English 2 Spanish 77 Don’t know 99 Refused
8_6 (NEW)
Have you recommended Covered California to anyone you know who needs insurance or needs better insurance than they have now?
1 Yes SKIP TO SECTION 11 2 No SKIP TO SECTION 11 77 Don’t know SKIP TO SECTION 11 99 Refused SKIP TO SECTION 11

NORC | Covered California—Consumer Tracking Survey
FINAL REPORT | 116
Section 9. Non-Purchaser Motivations and Experience
ASK ALL NON-PURCHASERS, INCLUDING APPLICANT NON-PURCHASERS [ASK IF NON-PURCHASER=1]
9_2 (NEW)
[ASK IF NON-PURCHASER=1]. Have you looked into the possibility of purchasing health insurance through Covered California?
1 Yes CONTINUE 2 No SKIP TO 9_4 77 Don’t know SKIP TO 9_4 99 Refused SKIP TO 9_4
9_2B (NEW)
[ASK ALL NON-PURCHASERS LOOKED INTO POSSIBILITY OF HEALTH INSURANCE (ASK IF NONPURCHASER=1 AND 9_2=1).] Where did you go to look for information about the possibility of purchasing health insurance through Covered California? READ IF NECESSARY: For each, tell me “Yes”, “No”, or you’re not sure.
Yes No DK Ref 9_2B1 Online to the Covered California website 1 2 77 99 9_2B2 The Covered California toll free telephone number 1 2 77 99 9_2B3 A Covered California certified educator or enrollment
counselor in your neighborhood 1 2 77 99
9_2B4 Meet with an insurance agent 1 2 77 99 9_2B5 Visit a government office that enrolls people in social
services 1 2 77 99
9_2B6 Or do something else to get information (Specify) 1 2 77 99 ALL SKIP TO 9_2C
9_2C (NEW)
[ASK ALL NON-PURCHASERS WHO DID NOT GO TO THE WEBSITE (ASK IF NONPURCHASER=1 AND 9_2=1 ).] Did you encounter any problems that made it difficult for you to find information or apply for a plan?
1 Yes CONTINUE 2 No GO TO 9_3 77 Don’t know GO TO 9_3 99 Refused GO TO 9_3
9_2D (NEW) Please tell me about those problems.
OPEN END. DO NOT READ CATEGORIES. PROBE FOR MULTIPLE RESPONSES. ACCEPT UP TO 3.

NORC | Covered California—Consumer Tracking Survey
FINAL REPORT | 117
9_3 (NEW)
[ASK THOSE WHO HAVE LOOKED INTO THE POSSIBILITY OF BUYING HEALTH INSURANCE (ASK IF NONPURCHASER=1 AND 9_2=1).] Did you find out about how much your monthly cost or premium would be?
1 Yes CONTINUE 2 No SKIP TO 9_3E 77 Don’t Know SKIP TO 9_3E 88 Refused SKIP TO 9_3E
9_3A (NEW)
[ASK IF THEY FOUND OUT THE COST (ASK IF 9_3=1).] Was the cost more or less than you expected?
1 More 2 Less 3 About the same 77 Don’t Know 88 Refused
9_3E (NEW)
[ASK THOSE WHO USED THE WEBSITE (-9_2B1=1).] On scale from 1 to 5 where 1 means “very easy” and 5 means “very difficult,” how easy or difficult was it to navigate the site and find the information you wanted? (NEW)
1 Very easy CONTINUE 2 3 4 5 Very difficult CONTINUE 77 Don’t know CONTINUE 99 Refused CONTINUE
9_4 (NEW)
[ASK ALL NON-PURCHASERS (NONPURCHASER=1).] Has a friend, family member or anyone else close to you recommended that you purchase health insurance on Covered California?
1 Yes 2 No 77 Don’t know 99 Refused

NORC | Covered California—Consumer Tracking Survey
FINAL REPORT | 118
9_5 (NEW)
[ASK ALL NON-PURCHASERS (NONPURCHASER=1).] Has a friend, family member or anyone else close to you recommended AGAINST purchasing health insurance through Covered California?
1 Yes 2 No 77 Don’t know 99 Refused

NORC | Covered California—Consumer Tracking Survey
FINAL REPORT | 119
Section 10: Purchase Intent After Hearing About Financial Assistance
ASK ALL NON-PURCHASERS, INCLUDING APPLICANT NON-PURCHASERS (NONPURCHASER=1).
10_1 (NEW)
If you were going to buy a health insurance policy, how many of your family members would you include on the policy?
# ENTER NUMBER (RANGE 1-20, 77, 99)
77 Don’t Know - SKIP TO 10_2
99 Refused - SKIP TO 10_2
10_1A (NEW)
[IF 10_1>1 THEN FILL “A family of [NUMBER FROM 10_1]” ELSE FILL “A single person”) with a total income under (400% FPL: TAKE FROM TABLE) would be eligible for financial assistance from the federal government to help them pay for health insurance? Is your income under (400% FPL: TAKE FROM TABLE)?
1 Yes, applies CONTINUE 2 No, does not apply SKIP TO 10_1D 77 Don’t Know SKIP TO 10_1D 99 Refused SKIP TO 10_1D
10_1B (NEW)
[IF 10_1>1 THEN FILL “A family of [NUMBER FROM 10_1]” ELSE FILL “A single person”) with a total income between (200%-399% FPL: TAKE FROM TABLE) qualifies for financial assistance from the federal government that lowers the amount of monthly premiums? Is your income between (200%-399% FPL: TAKE FROM TABLE) ?
1 Yes, applies SKIP TO 10_2 2 No, does not apply CONTINUE 77 Don’t Know CONTINUE 99 Refused CONTINUE
10_1C (NEW)
[IF 10_1>1 THEN FILL “A family of [NUMBER FROM 10_1]” ELSE FILL “A single person”) with a total income between (139%-199% FPL: TAKE FROM TABLE) qualifies for financial assistance from the federal government that lowers the amount of monthly premiums and also helps pay for out-of-pocket costs like co-pays (the amount you have to pay when you receive medical services) and deductibles (the amount you have to spend before your health insurance coverage starts)? Is your income between (139%-199% FPL: TAKE FROM TABLE)?
1 Yes, applies SKIP TO 10_2 2 No, does not apply CONTINUE 77 Don’t Know CONTINUE 99 Refused CONTINUE

NORC | Covered California—Consumer Tracking Survey
FINAL REPORT | 120
10_1D (NEW)
IF Q10_1A=2 THEN FILL: “READ ONLY: [IF 10_1>1 THEN FILL “A family of [NUMBER FROM 10_1]”ELSE FILL “A single person”) with a total income of (400% FPL: TAKE FROM TABLE) or more is not eligible for financial assistance from the federal government.” ELSE IF Q10_1A=1 THEN FILL: “READ ONLY: [IF 10_1>1 THEN FILL “A family of [NUMBER FROM 10_1]”ELSE FILL “A single person”) with a total income of less than (139% FPL: TAKE FROM TABLE) is eligible for financial assistance from the federal government that lowers the amount of monthly premiums and also helps pay for out-of-pocket costs like co-pays and deductibles.”
10_2 (OLD 8.6, MODIFIED)
Insurance can be purchased from Covered California for 2014 through April 1, 2014. Which best describes you: I will get health insurance, I may get health insurance, or I will not get health insurance through Covered California before April 1, 2014?"
1 I WILL GET HEALTH INSURANCE THROUGH COVERED CALIFORNIA
CONTINUE
2 I MAY GET HEALTH INSURANCE THROUGH COVERED CALIFORNIA
SKIP TO 10_2B
3 I WILL NOT GET HEALTH INSURANCE THROUGH COVERED CALIFORNIA
SKIP TO 10_2B
77 Don’t know SKIP TO SECTION 11
99 Refused SKIP TO SECTION 11

NORC | Covered California—Consumer Tracking Survey
FINAL REPORT | 121
Motivators (ASK ALL WHO PLAN TO GET INSURANCE (10_2 =1))
10_2A (OLD 8.6A)
What are the main reasons you plan to get health insurance through Covered California? [ACCEPT UP TO 3] OPEN END. INTERVIEWER INSTRUCTION: If only one or two reasons given, ask “Are there any other reasons?”
OTHER, SPECIFY OTHER, SPECIFY OTHER, SPECIFY
Barriers (ASK ALL WHO DO NOT PLAN TO GET INSURANCE (10_2=3)
10_2B (OLD 8.6B)
What are the main reasons you DO NOT plan to get health insurance through the Covered California? PROBE: Are there any other reasons? OPEN END. OPEN END. ACCEPT UP TO 3.
OTHER, SPECIFY OTHER, SPECIFY OTHER, SPECIFY

NORC | Covered California—Consumer Tracking Survey
FINAL REPORT | 122
Section 11. Access to the Internet and a Checking Account
Internet Access and Use 11_1 (OLD 9.1)
Do you use the Internet using a computer, tablet or smart phone? [MARK ALL THAT APPLY] READ IF NECESSARY: Which do you use most, a computer, tablet or smartphone?
1 YES, COMPUTER 2 YES, TABLET 3 YES, SMARTPHONE 4 NO, DOES NOT USE THE INTERNET SKIP TO SECTION 11_1C 77 DON’T KNOW SKIP TO SECTION 11_1C 99 REFUSED SKIP TO SECTION 11_1C
11_1A (OLD 9.1A)
How often do you use the Internet? Do you use it every day or almost every day, several days a week, once a week, several times a month, once a month, or less than once a month?
1 EVERY DAY OR ALMOST EVERY DAY 2 SEVERAL DAYS A WEEK 3 ONCE A WEEK 4 SEVERAL TIMES A MONTH 5 ONCE A MONTH 6 LESS THAN ONCE A MONTH 77 DON’T KNOW 99 REFUSED
11_1C (OLD 10.1)
Do you have a checking account that you use to pay bills?
1 YES 2 NO 77 DON’T KNOW 99 REFUSED

NORC | Covered California—Consumer Tracking Survey
FINAL REPORT | 123
Section 11B. Ethnicity, Race, and Language Use
11B_1 (OLD 11.9)
(ASK ALL) Are you either Hispanic or Latino?
1 Yes 2 No 77 Don’t know 99 Refused
11B_2 (OLD 1.10)
(ASK ALL) [IF 11B_1 = 1, “Hispanics and Latinos can be of any race.”] What is your primary racial heritage? Are you… [READ RESPONSES]
1 African American or Black 2 Asian or Pacific Islander 3 American Indian or Alaska Native 4 White or Caucasian 5 VOL: HISPANIC OR LATINO 6 Other: specify GO TO 11B2_OTH 77 Don’t Know 99 Refused
11B_2OTH ENTER OTHER SPECIFY _____________
11B_2A (NEW)
[ASK IF INTERIVEW IS IN ENGLISH [LANG_TYPE=1, ELSE SKIP TO 11B_2C] Do you ever use a language other than English?
1 YES GO TO 11B_2B 2 NO SKIP TO SECTION 12 77 DON’T KNOW SKIP TO SECTION 12 99 REFUSED SKIP TO SECTION 12
11B_2B (NEW)
(ASK IF 11B_2A=1)) What language is that? READ IF NECESSARY: Which other language do you speak most often? RECORD ONLY ONE LANGUAGE.
INSERT LANGUAGE IN EACH QUESTION BELOW
1 SPANISH GO TO 11B_3 2 MANDARIN (CHINESE) GO TO 11B_3 3 CANTONESE (CHINESE) GO TO 11B_3 4 CHINESE (UNSPECIFIED) GO TO 11B_3 5 KOREAN GO TO 11B_3 6 VIETNAMESE GO TO 11B_3
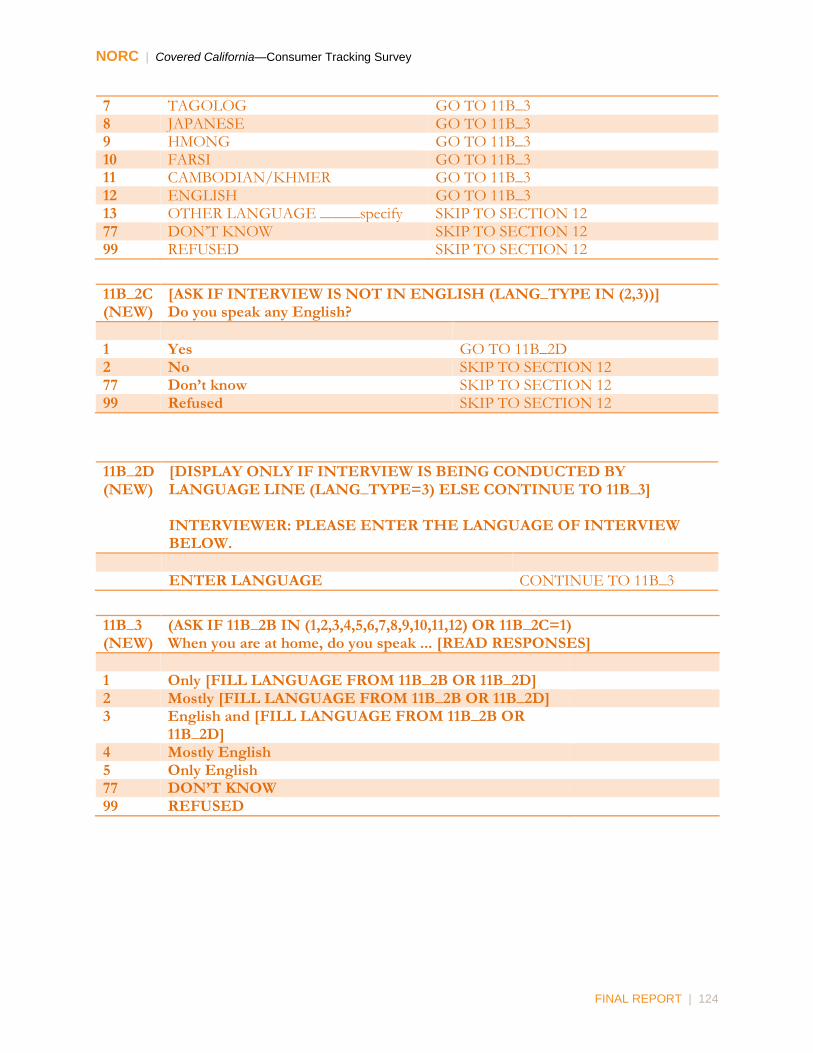
NORC | Covered California—Consumer Tracking Survey
FINAL REPORT | 124
7 TAGOLOG GO TO 11B_3 8 JAPANESE GO TO 11B_3 9 HMONG GO TO 11B_3 10 FARSI GO TO 11B_3 11 CAMBODIAN/KHMER GO TO 11B_3 12 ENGLISH GO TO 11B_3 13 OTHER LANGUAGE _____specify SKIP TO SECTION 12 77 DON’T KNOW SKIP TO SECTION 12 99 REFUSED SKIP TO SECTION 12
11B_2C (NEW)
[ASK IF INTERVIEW IS NOT IN ENGLISH (LANG_TYPE IN (2,3))] Do you speak any English?
1 Yes GO TO 11B_2D 2 No SKIP TO SECTION 12 77 Don’t know SKIP TO SECTION 12 99 Refused SKIP TO SECTION 12
11B_2D (NEW)
[DISPLAY ONLY IF INTERVIEW IS BEING CONDUCTED BY LANGUAGE LINE (LANG_TYPE=3) ELSE CONTINUE TO 11B_3] INTERVIEWER: PLEASE ENTER THE LANGUAGE OF INTERVIEW BELOW.
ENTER LANGUAGE CONTINUE TO 11B_3
11B_3 (NEW)
(ASK IF 11B_2B IN (1,2,3,4,5,6,7,8,9,10,11,12) OR 11B_2C=1) When you are at home, do you speak ... [READ RESPONSES]
1 Only [FILL LANGUAGE FROM 11B_2B OR 11B_2D] 2 Mostly [FILL LANGUAGE FROM 11B_2B OR 11B_2D] 3 English and [FILL LANGUAGE FROM 11B_2B OR
11B_2D]
4 Mostly English 5 Only English 77 DON’T KNOW 99 REFUSED

NORC | Covered California—Consumer Tracking Survey
FINAL REPORT | 125
11B_4 (NEW)
(ASK IF 11B_2B IN (1,2,3,4,5,6,7,8,9,10,11,12) OR 11B_2C=1) Would you say you read [FILL LANGUAGE FROM 11B_2B OR 11B_2D] very well, well, a little, very little, or not at all?
1 VERY WELL 2 WELL 3 A LITTLE 4 VERY LITTLE 5 NOT AT ALL 77 DON’T KNOW 99 REFUSED
11B_5 (OLD 11.12)
(ASK IF 11B_2B IN (1,2,3,4,5,6,7,8,9,10,11,12) OR 11B_2C=1) Would you say you read English very well, well, a little, very little, or not at all?
1 VERY WELL 2 WELL 3 A LITTLE 4 VERY LITTLE 5 NOT AT ALL 77 DON’T KNOW 99 REFUSED
11B_6 (NEW)
(ASK IF 11B_2B IN (1,2,3,4,5,6,7,8,9,10,11,12) OR 11B_2C=1) When you watch television, do you watch ... READ?
1 Only [FILL LANGUAGE FROM 11B_2B OR 11B_2D]
language television
2 Mostly [FILL LANGUAGE FROM 11B_2B OR 11B_2D] language television
3 English and [FILL LANGUAGE FROM 11B_2B OR 11B_2D] television equally
4 Mostly English language television 5 Only English language television 6 VOL. DO NOT WATCH TELEVISION 77 DON’T KNOW 99 REFUSED

NORC | Covered California—Consumer Tracking Survey
FINAL REPORT | 126
11B_7 (NEW)
[ASK ONLY IF INTERVIEW IS IN SPANISH OR IF RESPONDENT INDICATES THEY SPEAK SPANISH (IF 11B_2B =1 OR LANG_TYPE=2) What language do you use when you vote or fill out government forms ...?
1 Only [FILL LANGUAGE FROM 11B_2B OR
11B_2D]
2 Mostly [FILL LANGUAGE FROM 11B_2B OR 11B_2D]
3 English and [FILL LANGUAGE FROM 11B_2B OR 11B_2D]
4 Mostly English 5 Only English 6 VOL. DO NOT VOTE OR FILL OUT GOVERNMENT FORMS 77 DON’T KNOW 99 REFUSED

NORC | Covered California—Consumer Tracking Survey
FINAL REPORT | 127
Section 12. Classification Variables
12_0 ASK ONLY IF NECESSARY. Are you male or female?
1 MALE 2 FEMALE 99 REFUSED
12_1 (OLD 2.1)
Are you currently employed, self-employed, retired, a full-time homemaker, a student, or unemployed?
1 EMPLOYED BY SOMEONE ELSE CONTINUE 2 SELF-EMPLOYED (NOTE: INCLUDES
INDEPENDENT CONTRACTORS) CONTINUE
3 RETIRED SKIP TO Q12_2 4 FULL-TIME HOMEMAKER SKIP TO Q12_2 5 STUDENT SKIP TO Q12_2 6 UNEMPLOYED SKIP TO Q12_2 77 DON’T KNOW SKIP TO Q12_2 99 REFUSED SKIP TO Q12_2
12_1A (OLD 2.1A, MODIFIED)
Are you employed 30 hours per week or more OR less than 30 hours per week?
1 30 HOURS PER WEEK OR MORE 2 LESS THAN 30 HOURS PER WEEK 3 VARIES 77 DON’T KNOW 99 REFUSED
12_2 (OLD 11.1)
In general, would you say your health is excellent, very good, good, fair, or poor?
1 EXCELLENT 2 VERY GOOD 3 GOOD 4 FAIR 5 POOR 77 DON’T KNOW 99 REFUSED

NORC | Covered California—Consumer Tracking Survey
FINAL REPORT | 128
12_3 (OLD 11.2, MODIFIED)
ASK ONLY IF S7>1 Remember the family includes any children you claim as dependents on your income tax return whether they live with you full time or not. Do any of your family members have only fair or poor health?
1 Yes 2 No 77 Don’t know 99 Refused
12_4 (OLD 11.3A MODIFIED)
Do you or any family members have a disability that limits activities?
1 Yes 2 No 77 Don’t know 99 Refused
12_5 (OLD 11.3B MODIFIED)
Do you or any family members have a chronic or long-lasting condition?
1 Yes 2 No 77 Don’t know 99 Refused
12_6 (OLD 11.4 MODIFIED)
Have you or any family members ever been denied health care coverage because of a health problem or pre-existing condition? INTERVIEWER INSTRUCTION: A pre-existing condition is a health problem that someone has at the time of applying for insurance.
1 Yes 2 No 77 Don’t know 99 Refused

NORC | Covered California—Consumer Tracking Survey
FINAL REPORT | 129
12_7 (OLD 11.5)
What is the highest grade in school or year of college that you have completed?
1 NO SCHOOLING OR LESS THAN GRADE SCHOOL 2 GRADE/ELEMENTARY SCHOOL 3 SOME HIGH SCHOOL (DID NOT GRADUATE) 4 HIGH SCHOOL GRADUATE 5 VOCATIONAL OR TECHNICAL SCHOOL (NOT COLLEGE) 6 SOME COLLEGE 7 4-YEAR COLLEGE GRADUATE 8 POST-GRADUATE DEGREE 77 DON’T KNOW 99 REFUSED
Check Point: If LST_RDD_CELL IN (2) THEN ASK SL_LANDLINE, ELSE SKIP TO C11Q15_CELL
SL_LANDLINE The next few questions are about the telephones in your household. Do you have a landline telephone in your household? READ AS NECESSARY: Please do not include: - Modem-only lines, - Fax-only lines, - Lines used just for home security systems, - Beepers, - Skype - Pagers, or - Cell phones. Please include Voice Over I.P. or VOIP numbers.
1 Yes 2 No 77 Don’t Know 99 Refused

NORC | Covered California—Consumer Tracking Survey
FINAL REPORT | 130
C11Q15_CELL (MODIFIED)
[IF SL_LANDLINE NOT DISPLAYED, THEN DISPLAY: “The next few questions are about the telephones in your household.”] In total, how many working cell phones do you and your family members have available for personal use? Please do not count cell phones that are used only for business purposes. [If LST_RDD_CELL=0,1 and NEWPHONE_FLAG=0 then display: "Please include the number we called." ELSE If LST_RDD_CELL=0,1 a and NEWPHONE_FLAG=1 then display: “Please include [OLD_NUMBER].” ] [If LST_RDD_CELL=0,1 a and NEWPHONE_FLAG=1 display "INTERVIEWER NOTE: THE NUMBER FOR THIS CASE WAS CHANGED BY THE RESPONDENT ON A PREVIOUS CALL.”]
1 ONE 2 TWO 3 THREE OR MORE 4 NONE GO TO C11Q16 77 DON’T KNOW 99 REFUSED
C11Q15_CELL_USUALLY
How many of these cell phones do the adults in this household usually use? [If LST_RDD_CELL=0,1 a and NEWPHONE_FLAG=0 then display: "Please include the number we called." ELSE If LST_RDD_CELL=0,1 a and NEWPHONE_FLAG=1 then display “Please include [OLD_NUMBER].”] [IF LST_RDD_CELL=0,1 a then display: "INTERVIEWER NOTE: THE NUMBER WE CALLED IS ASSUMED TO BE USUALLY USED, SO THE ANSWER MUST BE AT LEAST "ONE""] [If LST_RDD_CELL=0,1 a and NEWPHONE_FLAG=1 display "INTERVIEWER NOTE: THE NUMBER FOR THIS CASE WAS CHANGED BY THE RESPONDENT ON A PREVIOUS CALL.]
1 ONE 2 TWO 3 THREE OR MORE 4 NONE 77 DON’T KNOW 99 REFUSED
Check Point: IF (LST_RDD_CELL=0,1 AND SL_LANDLINE=2) THEN SKIP TO 12.8; ELSE ASK C11Q16

NORC | Covered California—Consumer Tracking Survey
FINAL REPORT | 131
C11Q16 Of all the telephone calls that you and your household receive, are nearly all received on cell phones, nearly all received on landline phones, or some received on cell phones and some received on landline phones?
1 NEARLY ALL RECEIVED ON CELL PHONES 2 NEARLY ALL RECEIVED ON LANDLINE PHONES 3 SOME RECEIVED ON CELL PHONES AND SOME ON LANDLINE PHONES 77 DON’T KNOW 99 REFUSED
12_8 (OLD 11.8)
What is your zip code? ENTER 77777 FOR Don’t know ENTER 99999 FOR REFUSED
ENTER ZIP CODE ______ ENTER NUMBER ______
12_9 (OLD 11.8B)
In what county do you live? ENTER DK FOR DON’T KNOW ENTER REF FOR REFUSED
__________
12_13 (NEW)
With which political party do you most strongly identify – Democratic or Republican?
1 Democrat ASKQ12_13A
2 Republican ASK Q12_13A 3 VOL. Tea Party 4 VOL. Libertarian 5 VOL. Other 6 VOL. Independent ASK Q12_13B 77 Don’t know 99 Refused
12_13A (NEW)
Are you a strong or weak (Democrat/Republican)?
1 Strong SKIP TO TERM 2 Weak SKIP TO TERM 77 Don’t know SKIP TO TERM 99 Refused SKIP TO TERM

NORC | Covered California—Consumer Tracking Survey
FINAL REPORT | 132
12_13B (NEW)
Do you lean toward the Democratic or Republican Party?
1 Democratic 2 Republican 3 Neither/Both/Independent 4 Other: Specify 77 Don’t Know 99 Refused
TERM: Those are all the questions I have. Thank you for taking time to speak to me today.

NORC | Covered California—Consumer Tracking Survey
FINAL REPORT | 133
Answering Machine Scripts MSG_FIRST (New cases): Hello, my name is ______. The state of California is conducting an important survey about how changes to the health insurance system may affect California residents and we’d like to ask your opinions. We are not selling anything. We’ll try to contact you again soon but please feel free to return our call anytime at 1-888-246-9504. MSG_APPT (Missed appointment) Hello. The state of California is conducting an important survey about how changes to the health insurance system may affect California residents and we’d like to ask your opinions. I'm sorry that we've missed you. When we spoke previously about this important study, you requested that we call you back at this time. We'll try to contact you again soon but please feel free to return our call anytime at 1-888-246-9504. MSG_CB (Breakoffs): Hello. Recently you started a survey about how changes to the health insurance system may affect California residents. I'm sorry that we've missed you. We'll try to contact you again soon but please feel free to return our call anytime at 1-888-246-9504.
Call Back Scripts INTRO_SCB (Screener breakoffs) Hello, my name is ____. Earlier, someone in your household started a survey about how changes in the health insurance system may affect California residents. I'm calling back now to continue the interview. INTRO_MCB (Main interview breakoffs) Hello, my name is ____. Earlier, someone in your household started a survey about how changes in the health insurance system may affect California residents. I'm calling back now to continue the interview. May I speak with [INSERT NAME IF AVAILABLE, ELSE FILL “the person who started that inter

NORC | Covered California—Consumer Tracking Survey
FINAL REPORT | 134
Appendix B: Questionnaire (Spanish Language)
Covered California Market Baseline/Segmentation Study
Covered California Market 1st Tracking Survey: January 2014 Spanish Translation
INTRO1 Hello, my name is ______ and I’m calling on behalf of the state of California. We are conducting an important survey about how changes to the health insurance system may affect California residents and we’d like to ask your opinions. We are not selling anything. This call will be recorded or monitored. Hola, mi nombre es ______ y estoy llamando en nombre del estado de California. Estamos llevando a cabo una importante encuesta acerca de los cambios en el sistema de seguro de salud y cómo pueden afectar a los residentes de California y nos gustaría pedirle su opinión. No estamos vendiendo nada. Esta llamada será grabada o monitoreada.
S1 Am I speaking to someone who lives in this household who is over 17 years old? ¿Estoy hablando con alguien que vive en este hogar que tiene más de 17 años de edad?
1 YES 2 THIS IS A BUSINESS GO TO S1 EXIT 3 NO, NEW PERSON COMES TO PHONE GO TO S3 4 NO ONE OVER 17 LIVES IN THIS HOUSEHOLD GO TO S1 EXIT 5 NO ONE OVER 17 IS HOME RIGHT NOW GO TO S1B 6 NO ONE OVER 17 USES THIS CELLPHONE
[DISPLAY ONLY FOR CELL SAMPLE] GO TO S1 EXIT
99 REFUSED GO TO S1B
S3 Hello, my name is _____ and I’m calling from NORC at the University of Chicago. We are conducting a study on important health care issues affecting all Californians and would like to ask your opinions. We are not selling anything. This call will be recorded or monitored. Are you over 17 years old? Hola, mi nombre es _____ y yo estoy llamando de NORC de la Universidad de Chicago. Estamos llevando a cabo un estudio sobre importantes problemas de cuidado de salud que afectan a todos los californianos y quisiera pedirle a usted sus opiniones. No estamos vendiendo nada. Esta llamada será grabada o monitoreada. ¿Tiene usted más de 17 años de edad?
1 Yes 2 No GO TO S3B 77 Don’t know GO TO S1B 99 Refused GO TO S1B

NORC | Covered California—Consumer Tracking Survey
FINAL REPORT | 135
S3B May I speak to someone over 17 years old? ¿Podría hablar con alguien que tenga más de 17 años de edad?
1 Yes GO TO S3 2 No GO TO S1B
S1B I’ll try back again later. Thank you. Voy a llamar de nuevo más tarde. Gracias.
S_CELL ASK ONLY IF LIST_RDD_CELL=2 (CELL SAMPLE) Am I speaking to you on your cell phone? ¿Estoy hablando con usted en su teléfono celular?
1 Yes GO TO S_WARM 2 No GO TO S_CRIT
S_WARM ASK ONLY IF LIST_RDD_CELL=2 (CELL SAMPLE) If you are currently driving a car or doing any activity that requires your full attention I need to call you back at a later time. Si usted actualmente está conduciendo un automóvil o haciendo cualquier actividad que requiera su atención total. Necesito llamaré en otro momento.
1 CONTINUE 2 CALL BACK
S_CRIT
I would like to speak to a person in your household who is age 18 to 64 and makes decisions about health care for themselves or their family. Would that be you or someone else? Me gustaría hablar con una persona en su hogar que tiene de 18 años a 64 años de edad y que toma decisiones acerca de cuidado de la salud para si mismo o sus familiares. ¿Podría ser esa persona usted o alguien más? READ IF NECESSARY: Family includes any children you claim as dependents on your income tax return whether they live with you full time or not. READ IF NECESSARY: La familia incluye a cualquier niño que usted reclama como dependiente en su declaración de impuestos ya sea que viva con usted a tiempo completo o no.
1 RESPONDENT CONTINUE 2 NEW PERSON COMES TO
PHONE GO TO S_NEW
3 PERSON NOT AVAILABLE SET CALL BACK 4 NO ONE BETWEEN THE AGES
OF 18 AND 64 LIVES HERE THANK AND CLOSE
99 REFUSED THANK AND CLOSE

NORC | Covered California—Consumer Tracking Survey
FINAL REPORT | 136
SCR_CONSENT I only need 2 minutes of your time to determine if you are eligible for the survey. Your participation is voluntary and everything you say is completely confidential. I’d like to continue now unless you have any questions. READ IF NECESSARY: The survey is about important health care issues that will affect all Californians. If you have any questions about the survey, I can provide you with a free number for you to call. Sólo necesito dos minutos de su tiempo para determinar si es elegible para la encuesta. Su participación es voluntaria y todo lo que nos brinda se mantendrá completamente confidencial. Me gustaría continuar si no tiene alguna pregunta. READ IF NECESSARY: La encuesta es sobre temas importantes de cuidado de salud que afectarán a todos los residentes de California. Si tiene alguna pregunta sobre la encuesta, le puedo proveer un número gratuito que puede llamar.
1 CONTINUE CONTINUE TO S4 2 NEW PERSON COMES TO
PHONE GO TO S_NEW
99 REFUSE EXIT, CODE AS REFUSAL
S4 (OLD 1.5)
Are you currently covered by health insurance? This includes health insurance obtained through a job, purchased directly, HMOs or prepaid plans like Kaiser (KY-ZER), government programs such as Medi-Cal, Medicare, military programs such as Champus or Champ VA, or the Indian Health Service. ¿Está usted cubierto/a actualmente por un seguro de salud? Esto incluye el seguro de salud obtenido a través de un trabajo, comprado directamente, los HMO o planes prepagados como Kaiser (KY-ZER), los programas de gobierno tales como Medi-Cal, Medicare, programas militares como Champus o Champ VA, o el Servicio de Indian Health Service.
1 Yes CONTINUE TO S4A 2 No CLASSIFY AS UNINSURED AND SKIP TO S5 77 Don’t know GO TO S4_DK 99 Refused EXIT AND CODE AS REFUSAL NOTE TO PROGRAMMER: IF S4=2 SET UNINSURED=1, ELSE SET UNINSURED=0

NORC | Covered California—Consumer Tracking Survey
FINAL REPORT | 137
S4_DK Is there anyone in your household who can answer questions about health insurance coverage? ¿Hay alguien en su hogar que pueda responder a preguntas acerca de la cobertura de seguro de salud?
1 YES, NEW PERSON COMES TO PHONE
GO TO S_NEW
2 YES, BUT THAT PERSON IS NOT AVAILABLE
SET A CALL BACK
3 NO THANK AND CLOSE 77 DON’T KNOW THANK AND CLOSE 99 REFUSED THANK AND CLOSE
CLOSE: Those are all the questions I have. I’d like to thank you for taking time to speak to me today. CLOSE: Esas son todas las preguntas que tengo. Me gustaría darle las gracias por tomarse el tiempo para hablar conmigo hoy.
S4A (NEW)
Do you get your health insurance through your job or a family member’s job? ¿Consiguió usted su seguro de salud a través de su trabajo o del trabajo de algún miembro de la familia?
1 Yes THANK AND CLOSE 2 No GO TO S4B 77 Don’t know THANK AND CLOSE 99 Refused THANK AND CLOSE
CLOSE: Those are all the questions I have. I’d like to thank you for taking time to speak to me today. CLOSE: Esas son todas las preguntas que tengo. Me gustaría darle las gracias por tomarse el tiempo para hablar conmigo hoy.
S4B (NEW) Do you get your health insurance through the new health insurance marketplace which opened last October? (NEW) ¿Consiguió usted su seguro de salud a través del nuevo mercado de seguros de salud, que abrió el pasado mes de octubre? READ IF NECESSARY: The new health insurance marketplace opened October 1, 2013. READ IF NECESSARY: El nuevo mercado de seguros de salud abrió el primero de octubre 2013.
1 Yes CLASSIFY AS COVERED CA AND SKIP TO S5 2 No CONTINUE 77 Don’t know CONTINUE 99 Refused THANK AND CLOSE NOTE TO PROGRAMMER: IF S4B=1 SET COVEREDCA=1, ELSE SET COVEREDCA=0

NORC | Covered California—Consumer Tracking Survey
FINAL REPORT | 138
S4C (NEW)
I am going to read some government programs that provide health insurance. Tell me whether you get your health insurance through any of these government programs: Yo voy a leerle una lista de algunos programas gubernamentales que ofrecen seguro de salud. Dígame si usted consigue su seguro de salud a través de cualquiera de estos programas de gobierno:
S4_C1 Medi-Cal
3. Yes 4. No 77. Don’t know 99. Refused
S4_C2 Medicare
3. Yes 4. No 77. Don’t know 99. Refused
S4_C3 Military programs such as Champus or Champ VA Programas militares como Champus, o Champ VA
3. Yes 4. No 77. Don’t know 99. Refused
S4_C4 Indian Health Service Servicio de Salud Indígena (Indian Health Service)
3. Yes 4. No 77. Don’t know 99. Refused
IF R SAYS YES TO ANY OF THE ITEMS ABOVE (S4_C1 THROUGH S4_C4 THEN THANK AND CLOSE. ELSE CONTINUE TO S4D.
S4D Do you get your health insurance through a plan that you or someone in your family purchased on their own from some place other than the new health insurance marketplace, which opened last October (October 1, 2013)? (NEW) ¿Consiguió usted su seguro de salud a través de un plan que usted o alguien de su familia adquirió por su cuenta de algún lugar que no sea el nuevo mercado de seguros de salud, que abrió en octubre pasado (el primero de octubre de 2013)?
1 Yes GO TO S5 2 No THANK AND CLOSE 77 Don’t know THANK AND CLOSE 99 Refused THANK AND CLOSE

NORC | Covered California—Consumer Tracking Survey
FINAL REPORT | 139
S5 Are you 18 to 25 years old, 26 to 34 years old, 35 to 49 years old, 50 to 64 years old, or 65 or older? (OLD 1.4) ¿Tiene usted entre 18 años a 25 años de edad, 26 a 34 años de edad, 35 a 49 años de edad, 50 a 64 años de edad, o 65 años de edad o más?
1 UNDER 18 GO TO S5B 2 18 – 25 CONTINUE TO S7, SET FLAG UNDER35=1 3 26 - 34 CONTINUE TO S7, SET FLAG UNDER35=1 4 35- 49 CONTINUE TO S7 5 50 - 64 CONTINUE TO S7 6 65+ GO TO S5B 77 DON’T KNOW THANK AND CLOSE 99 REFUSED THANK AND CLOSE
CLOSE: Those are all the questions I have. I’d like to thank you for taking time to speak to me today.
CLOSE: Esas son todas las preguntas que tengo. Me gustaría darle las gracias por tomarse el tiempo para hablar conmigo hoy.
S5B (OLD1.4B)
Is there anyone in this household between the ages of 18 and 64? ¿Hay alguien en este hogar entre las edades de 18 y 64 años?
1 Yes, new person comes to
phone GO TO S_NEW
2 No THANK AND CLOSE 77 Don’t know THANK AND CLOSE 99 Refused THANK AND CLOSE
CLOSE: Those are all the questions I have. I’d like to thank you for taking time to speak to me today.
CLOSE: Esas son todas las preguntas que tengo. Me gustaría darle las gracias por tomarse el tiempo para hablar conmigo hoy.
S_NEW Hello, my name is _____ and I’m calling from NORC at the University of Chicago. We are conducting a study on important health care issues affecting all Californians and would like to ask your opinions. We are not selling anything. This call will be recorded or monitored. Hola, mi nombre es _____ y yo estoy llamando desde NORC de la Universidad de Chicago. Estamos llevando a cabo un estudio sobre importantes problemas de salud que afectan a todos los californianos y quisiera pedirle a usted sus opiniones. No estamos vendiendo nada. Esta llamada será grabada o monitoreada. GO TO S_CRIT, CYCLE THROUGH ALL QUESTIONS AGAIN

NORC | Covered California—Consumer Tracking Survey
FINAL REPORT | 140
S6 (OLD 1.6)
To the best of your knowledge, are you a legal resident of California? A lo mejor de su conocimiento, ¿es usted un/a residente legal de California? READ IF NECESSARY: To be a legal resident of California, you must be a United States citizen or permanent resident, live in California all or most of the year, file a California tax return, and be eligible for State benefits. READ IF NECESSARY: Para ser un/a residente legal de California, usted debe ser un/a ciudadano/a de los Estados Unidos o residente permanente, vivir en California todo o la mayor parte del año, presentar una declaración de impuestos de California, y ser elegible para los beneficios del Estado.
1 Yes CONTINUE 2 No THANK AND CLOSE 77 Don’t know THANK AND CLOSE 99 Refused THANK AND CLOSE
CLOSE: Those are all the questions I have. I’d like to thank you for taking time to speak to me today.
CLOSE: Esas son todas las preguntas que tengo. Me gustaría darle las gracias por tomarse el tiempo para hablar conmigo hoy.
S7 The topic of this study is health insurance. People who buy health insurance sometimes cover family members, as well as themselves. Including yourself, how many people are there in your family? El tema de este estudio es el seguro de salud. La gente que compra un seguro de salud a veces lo compra para los miembros de la familia, así como para sí mismo. Incluyéndose usted ¿cuántas personas hay en su familia? READ IF NECESSARY: Family includes any children you claim as dependents on your income tax return whether they live with you full time or not. . (NEW) READ IF NECESSARY: La familia incluye a cualquier niño que usted reclama como dependiente en su declaración de impuestos ya sea que viva con usted a tiempo completo o no.
RECORD NUMBER IF MORE THAN ONE CLASSIFY AS “FAMILY” 77 DON’T KNOW THANK AND CLOSE
99 REFUSED THANK AND CLOSE
NOTE TO PROGRAMMER: IF S7=1, SET FAMILY=0, ELSE IF S7 NOT IN (77,99) SET FAMILY=1.
CLOSE: Those are all the questions I have. I’d like to thank you for taking time to speak to me today.
CLOSE: Esas son todas las preguntas que tengo. Me gustaría darle las gracias por tomarse el tiempo para hablar conmigo hoy.

NORC | Covered California—Consumer Tracking Survey
FINAL REPORT | 141
S8 (NEW)
Your family income includes all the money that any family member brings in from any source before taxes are taken out. Remember that family includes any children you claim as dependents on your income tax return whether they live with you full time or not. To the best of your knowledge was your family income for 2013 under or over [100% PL for family size]? Su ingreso familiar incluye todo el dinero que cualquier miembro de la familia gana de cualquier fuente de ingreso antes de descontar los impuestos. Recuerde que la familia incluye a cualquier niño/a que usted reclama como dependiente en su declaración de impuestos ya sea que viva con usted a tiempo completo o no. A lo mejor de su conocimiento ¿fue su ingreso familiar para el año 2013 debajo o encima del [100% PL tamaño de la familia]?
1 UNDER THANK AND CLOSE 2 OVER CONTINUE 3 EXACTLY [INSERT 100% FPL] CONTINUE 77 DON’T KNOW THANK AND CLOSE 99 REFUSED THANK AND CLOSE
CLOSE: Those are all the questions I have. I’d like to thank you for taking time to speak to me today.
CLOSE: Esas son todas las preguntas que tengo. Me gustaría darle las gracias por tomarse el tiempo para hablar conmigo hoy.
CONSENT Before I continue, I would like you to know that your participation in this survey is voluntary. Everything you say is completely confidential. You may choose not to answer any questions you don’t wish to answer, or end the interview at any time with no impact on the benefits you may receive. The survey will take about 15-20 minutes. In order to review my work, this call will be recorded and my supervisor may listen as I ask the questions. Antes de continuar, quiero que usted sepa que su participación en esta encuesta es voluntaria. Todo lo que diga es completamente confidencial. Usted puede optar por no contestar cualquier pregunta que no desee contestar o terminar la entrevista en cualquier momento sin ningún impacto en los beneficios que pueda recibir. La encuesta le tomará aproximadamente 15-20 minutos. Con el fin de revisar mi trabajo, esta llamada será grabada y mi supervisor puede escuchar mientras hago las preguntas. READ IF NECESSARY: The survey is about important health care issues that will affect all Californians. If you have any questions about the survey, I can provide you with a free number for you to call. READ IF NECESSARY: La encuesta se trata de importantes temas de salud que afectan a todos los californianos. Si usted tiene alguna pregunta acerca de la encuesta, puedo darle un número gratuito para que usted llame.

NORC | Covered California—Consumer Tracking Survey
FINAL REPORT | 142
Section 1. Awareness of ACA and Covered California
1_1 (OLD 6.1, MODIFIED)
Have you heard, seen, or read anything about the Affordable Care Act, the new health care law proposed by President Obama and passed by Congress? ¿Ha oído, visto o leído usted algo acerca de la Ley de Asistencia Accesible (Affordable Care Act), la nueva ley de salud propuesta por el presidente Obama y aprobada por el Congreso?
1 YES CONTINUE 2 NO SKIP TO 1_2 77 DON’T KNOW SKIP TO 1_2 99 REFUSED SKIP TO 1_2
1_1A (OLD 6.1B)
Based on what you have heard, do you think the Affordable Care Act will be good for you, bad for you, or will it have no impact? Basado en lo que usted ha oído, ¿cree usted que la Ley de Asistencia Accesible (Affordable Care Act) será buena para usted, mala para usted, o no va a tener ningún impacto?
1 GOOD 2 BAD 3 NO IMPACT 77 DON’T KNOW 99 REFUSED
1_1B (NEW)
I’ll read a list of statements that some people have made about the Affordable Care Act. As I read each one, please tell me whether or not you agree or disagree with it. READ. RANDOMIZE. Voy a leerle a usted una lista de afirmaciones que algunas personas han hecho sobre la Ley de Asistencia Accesible (Affordable Care Act). Al leer cada una, por favor dígame si usted está de acuerdo o en desacuerdo con ella. READ. RANDOMIZE
A People should be able to keep the health insurance plans they had before the new law went into effect, even if the government says they’re not good enough. Las personas deberían poder mantener los planes de seguro de salud que tenían antes de que la nueva ley entrara en vigor, incluso si el gobierno dice que no son lo suficientemente buenos.
B Many people who couldn’t get health insurance before will be able to get it under the new law. Muchas personas que no podían conseguir un seguro de salud antes serán capaces de conseguirlo con la nueva ley.
C The new law is going to be repealed. La nueva ley va a ser derogada.
D The new law is an improvement over the health insurance system we had before. La nueva ley es una mejora sobre el sistema de salud que teníamos anteriormente.

NORC | Covered California—Consumer Tracking Survey
FINAL REPORT | 143
E I don’t trust the government to do the right thing on health insurance Yo no confío que el gobierno haga lo correcto cuando se trata de seguro de salud
1_2 (OLD 6.2*)
Have you heard or read anything about where Californians can go to get health insurance under the Affordable Care Act? ¿Ha oído o leído usted algo donde pueden ir los californianos a conseguir un seguro de salud bajo la Ley de Asistencia Accesible (Affordable Care Act)?
1 YES CONTINUE 2 NO SKIP TO Q1_2B 77 DON’T KNOW SKIP TO Q1_2B 99 REFUSED SKIP TO Q1_2B
1_2A (OLD 6.1C* and 6.2A)
Where can they go? ¿Adónde pueden ir? PROBE: DO NOT READ CATEGORIES. PROBE FOR MULTIPLE RESPONSES AND ACCEPT UP TO 3.
1 COVERED CALIFORNIA SKIP TO SECTION 2 2 CALIFORNIA HEALTH BENEFIT EXCHANGE 3 WEBSITE 4 TOLLFREE NUMBER/CALL CENTER 5 INSURANCE ENROLLMENT COUNSELORS 6 COUNTY ELIGIBILITY WORKERS OR MEDI-CAL
INSURANCE AGENTS
7 OTHER: SPECIFY 8 CANNOT REMEMBER/NOT SURE 77 DON’T KNOW 99 REFUSED
Q1_2AOTH ENTER OTHER SPECIFY ____________
1_2B (OLD 6.2 A)
[ASK ONLY IF THE NAME “COVERED CALIFORNIA” OR “CALIFORNIA HEALTH BENEFIT EXCHANGE” NOT MENTIONED IN 1_2A (1_2A NOT IN (1, 2).] Have you heard or read anything about an organization called Covered California? ¿Ha oído o leído algo sobre una organización llamada Covered California?
1 YES CONTINUE TO SECTION 2 2 NO CONTINUE TO SECTION 2 77 DON’T KNOW CONTINUE TO SECTION 2 99 REFUSED CONTINUE TO SECTION 2
ASK ABOUT COVERED CALIFORNIA IN SECTIONS 2 & 3 WHETHER OR NOT RESPONDENT IS AWARE OF IT.

NORC | Covered California—Consumer Tracking Survey
FINAL REPORT | 144

NORC | Covered California—Consumer Tracking Survey
FINAL REPORT | 145
Section 2: Unaided Advertising Awareness
2_1 NEW
Have you seen or heard any advertisements asking Californians to purchase health insurance under the Affordable Care Act? I mean commercials or ads, not news stories or other things in the media. ¿Ha visto u oído usted algún anuncio pidiendo a los californianos comprar un seguro de salud bajo la Ley de Asistencia Accesible (Affordable Care Act)? Me refiero a los comerciales o anuncios, y no las noticias u otras cosas en los medios de comunicación.
1 YES CONTINUE 2 NO SKIP TO SECTION 3 77 DON’T KNOW/NOT SURE SKIP TO SECTION 3 99 REFUSED SKIP TO SECTION 3
2_1A (NEW)
Let’s start with one of the ads you saw. What do you remember seeing or hearing in the ad? Who was in the ad? What happened? Empecemos con uno de los anuncios que usted vio. ¿Qué recuerda haber visto u oído en el anuncio? ¿Quién estaba en el anuncio? ¿Qué pasó?
OPEN END. PROBE FOR UP TO 3 RESPONSES. 77 Don’t know 99 Refused
2_1B (NEW)
What organization sponsored the ad? Please tell me what you remember. ¿Qué organización patrocinó el anuncio? Por favor, dígame que recuerda usted.
OPEN END. PROBE FOR SPECIFIC NAME 77 DON’T KNOW 99 REFUSED
2_1C (NEW)
Where did you see or hear the ad? ¿Dónde vio o escuchó usted el anuncio?
OPEN END. PROBE FOR UP TO 3 RESPONSES. DO NOT READ RESPONSES.
1 TELEVISION 2 RADIO 3 NEWSPAPERS/MAGAZINES/OTHER PRINT 4 BUS/OTHER TRANSIT ADVERTISING 5 BILLBOARD/OTHER OUTDOOR ADVERTISING 6 INTERNET/ONLINE 7 OTHER: SPECIFY GO TO 2_1C_OTH 77 DON’T KNOW 99 REFUSED

NORC | Covered California—Consumer Tracking Survey
FINAL REPORT | 146
2_1C_OTH ENTER OTHER SPECIFY _____________
2_1D (NEW)
On a scale of zero to 10, where zero means “not at all believable” and 10 means “extremely believable, how believable was the ad? En una escala de cero a 10, donde cero significa "nada creíble" y 10 significa "muy creíble, ¿qué tan creíble era el anuncio?
Response set =0-10 scale 77 Don’t know 99 Refused
[ABOVE ITEMS REPEAT FOR UP TO 2 ADDITIONAL ADVERTISEMENTS.]
2_2 (NEW)
Have you seen any other ads urging Californians to purchase health insurance under the Affordable Care Act? ¿Ha visto usted otros anuncios urgiendo a los californianos a comprar seguro de salud bajo la Ley de Asistencia Accesible (Affordable Care Act)?
1 Yes GO TO 2_2A 2 No GO TO SECTION 3 77 Don’t know GO TO SECTION 3 99 Refused GO TO SECTION 3
2_2A (NEW)
What do you remember seeing or hearing in the ad? Who was in the ad? What happened? ¿Qué recuerda usted haber visto u oído en el anuncio? ¿Quién estaba en el anuncio? ¿Qué pasó?
OPEN END. PROBE FOR UP TO 3 RESPONSES. REPEAT QUESTION AS NECESSARY.
77 Don’t know 99 Refused
2_2B (NEW)
What organization sponsored the ad? Please tell me what you remember. ¿Qué organización patrocinó el anuncio? Por favor, dígame que recuerda usted.
OPEN END. PROBE FOR SPECIFIC NAME 77 Don’t know 99 Refused
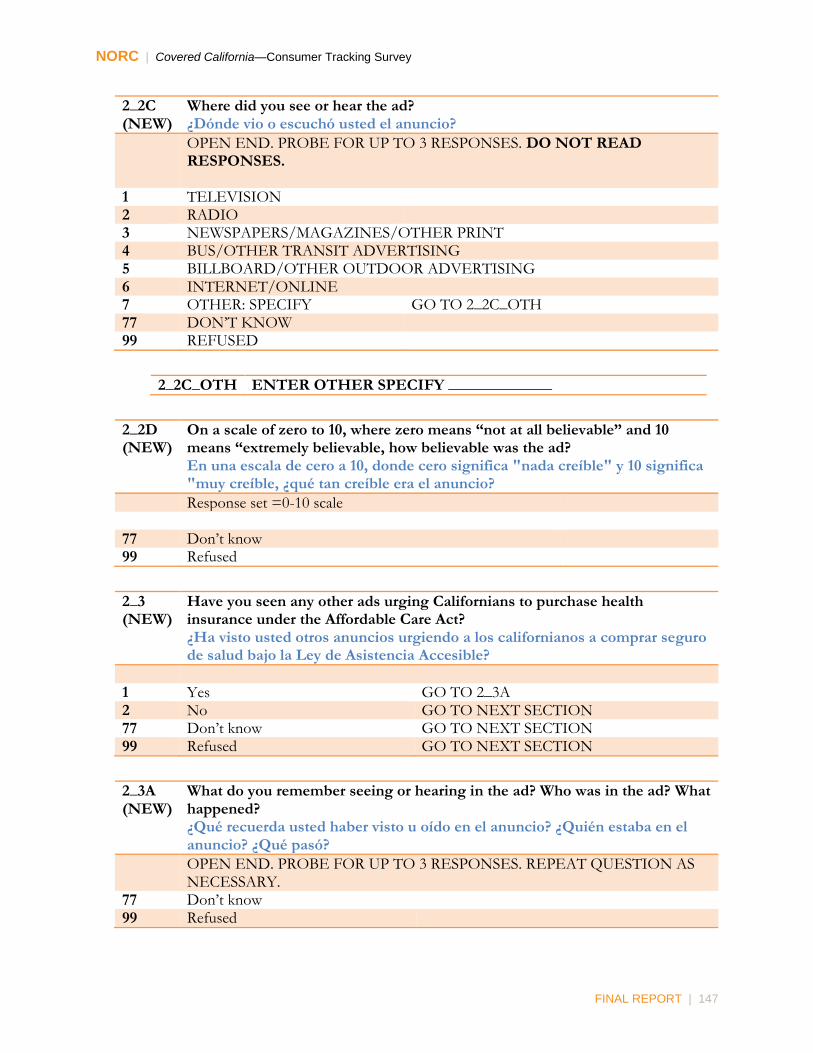
NORC | Covered California—Consumer Tracking Survey
FINAL REPORT | 147
2_2C (NEW)
Where did you see or hear the ad? ¿Dónde vio o escuchó usted el anuncio?
OPEN END. PROBE FOR UP TO 3 RESPONSES. DO NOT READ RESPONSES.
1 TELEVISION 2 RADIO 3 NEWSPAPERS/MAGAZINES/OTHER PRINT 4 BUS/OTHER TRANSIT ADVERTISING 5 BILLBOARD/OTHER OUTDOOR ADVERTISING 6 INTERNET/ONLINE 7 OTHER: SPECIFY GO TO 2_2C_OTH 77 DON’T KNOW 99 REFUSED
2_2C_OTH ENTER OTHER SPECIFY _____________
2_2D (NEW)
On a scale of zero to 10, where zero means “not at all believable” and 10 means “extremely believable, how believable was the ad? En una escala de cero a 10, donde cero significa "nada creíble" y 10 significa "muy creíble, ¿qué tan creíble era el anuncio?
Response set =0-10 scale 77 Don’t know 99 Refused
2_3 (NEW)
Have you seen any other ads urging Californians to purchase health insurance under the Affordable Care Act? ¿Ha visto usted otros anuncios urgiendo a los californianos a comprar seguro de salud bajo la Ley de Asistencia Accesible?
1 Yes GO TO 2_3A 2 No GO TO NEXT SECTION 77 Don’t know GO TO NEXT SECTION 99 Refused GO TO NEXT SECTION
2_3A (NEW)
What do you remember seeing or hearing in the ad? Who was in the ad? What happened? ¿Qué recuerda usted haber visto u oído en el anuncio? ¿Quién estaba en el anuncio? ¿Qué pasó?
OPEN END. PROBE FOR UP TO 3 RESPONSES. REPEAT QUESTION AS NECESSARY.
77 Don’t know 99 Refused

NORC | Covered California—Consumer Tracking Survey
FINAL REPORT | 148
2_3B (NEW)
What organization sponsored the ad? Please tell me what you remember. ¿Qué organización patrocinó el anuncio? Por favor, dígame que recuerda usted.
OPEN END. PROBE FOR SPECIFIC NAME 77 Don’t know 99 Refused
2_3C (NEW)
Where did you see or hear the ad? ¿Dónde vio o escuchó usted el anuncio?
OPEN END. PROBE FOR UP TO 3 RESPONSES. DO NOT READ RESPONSES.
1 TELEVISION 2 RADIO 3 NEWSPAPERS/MAGAZINES/OTHER PRINT 4 BUS/OTHER TRANSIT ADVERTISING 5 BILLBOARD/OTHER OUTDOOR ADVERTISING 6 INTERNET/ONLINE 7 OTHER: SPECIFY GO TO 2_3C_OTH 77 DON’T KNOW 99 REFUSED
2_3C_OTH ENTER OTHER SPECIFY _____________
2_3D (NEW)
On a scale of zero to 10, where zero means “not at all believable” and 10 means “extremely believable, how believable was the ad? En una escala de cero a 10, donde cero significa "nada creíble" y 10 significa "muy creíble, ¿qué tan creíble era el anuncio?
Response set =0-10 scale 77 Don’t know 99 Refused

NORC | Covered California—Consumer Tracking Survey
FINAL REPORT | 149
Section 4. Recognition of Major Television Ads
4_1 (NEW)
Now I am going to ask you about some specific advertisements that are running on television. As I mentioned before, this advertising campaign is new. Also, some of the ads may not have run in your areas, or may have run in a different language. So we don’t expect anyone to remember all of the ads. … [READ. RANDOMIZE.] Ahora voy a preguntarle sobre algunos anuncios específicos que se ven en la televisión. Como he mencionado antes, esta campaña publicitaria es nueva. Además, algunos de los anuncios posiblemente no fueron emitidos en su área o fueron emitidos en un idioma diferente. Así que no esperamos que nadie recuerde todos los anuncios.
4_1.1 The ad shows a worried-looking young woman waiting for a bus and looking at the symptoms of asthma on her smartphone. She looks relieved when she sees a doctor’s appointment on her calendar. The message is: Welcome to Covered California. Now you can no longer be denied because of a pre-existing condition. El anuncio muestra a una mujer joven con aspecto preocupado a la espera de un autobús y mirando en su smart phone los síntomas de asma. Ella se siente aliviada al ver una cita médica en su calendario. El mensaje es: Bienvenido a Covered California. Ahora ya no se le puede negar a usted seguro debido a una condición pre-existente. Do you happen to remember that ad, or not, or are you not sure? ¿Recuerda usted ese anuncio o no, o no está seguro/a?
4_1.2 The ad shows a young man on a bike taking a bad spill and then shows him in a hospital bed. The message is: To those who have encountered a bump on the road, welcome to Covered California, a new affordable health plan so you can be ready for what comes your way. El anuncio muestra a un joven en una bicicleta que tiene un accidente y luego lo muestra en una cama de hospital. El mensaje es: Para los que se han encontrado con un obstáculo en el camino, bienvenidos a Covered California, un nuevo plan de salud accesible para que usted pueda estar listo/a para lo que pase. Do you happen to remember that ad, or not, or are you not sure? ¿Recuerda usted ese anuncio o no, o no está seguro/a?
4_1.3 The ad shows a family in a car driving from Sacramento to Salinas to San Diego. The ad welcomes people to Covered California and a new state of health. It says that there is now equal access to quality health insurance – that those who need financial assistance will get it and that no one will be denied because of a pre-existing condition. El anuncio muestra a una familia en un coche manejando de Sacramento a Salinas y a San Diego. El anuncio les da la bienvenida a las personas a Covered California y a un nuevo estado de salud. Dice que ahora hay igualdad de acceso al seguro de salud de calidad - que los que necesitan ayuda financiera lo conseguirán y que a nadie se le negará debido a una condición pre-existente. Do you happen to remember that ad, or not, or are you not sure? ¿Recuerda usted ese anuncio o no, o no está seguro/a?

NORC | Covered California—Consumer Tracking Survey
FINAL REPORT | 150
4_1.4 The ad shows mother and sick child, then an injured worker and an injured athlete, and says: To those who have worried, suffered in silence, hoped and lived in a state of fear, welcome to a new state of health where everyone can get quality affordable health insurance, financial help for those in need, and nobody can be denied because of a pre-existing condition. El anuncio muestra a una madre y a su niño enfermo, a continuación, un trabajador lesionado y un atleta lesionado, y dice: Para los que se han preocupado, sufrido en silencio, esperado y vivido en un estado de miedo, bienvenidos a un nuevo estado de salud, donde todo el mundo puede conseguir seguro de salud accesible y de calidad , ayuda financiera a los necesitados, y a nadie se le puede negar un seguro debido a una condición pre-existente Do you happen to remember that ad, or not, or are you not sure? ¿Recuerda usted ese anuncio o no, o no está seguro/a?
4_1.5 [ASK ONLY IF RESPONDENT IDENTIFIES AS HISPANIC IN (3A_1=1 OR 3A_2=5).] The ad shows people opening doors and says that Californians will welcome a new market place of affordable health insurance and nobody can be denied because of a pre-existing condition. El anuncio muestra a personas que abren puertas y dice que los californianos darán la bienvenida a un nuevo mercado de seguro de salud accesible y a nadie se le puede negar un seguro debido a una condición pre-existente. Do you happen to remember that ad, or not, or are you not sure? ¿Recuerda usted ese anuncio o no, o no está seguro/a?
4_1.6 [ASK ONLY IF RESPONDENT IDENTIFIES AS ASIAN OR OTHER IN (3A_2=3 or 6).] The ad shows a man looking at his medicine, then two women looking up diabetes on the computer, then a couple looking at their bills. The ad says that there is now equal access to affordable health insurance and you may get help paying for your insurance. El anuncio muestra a un hombre que mira sus medicamentos, y a continuación, dos mujeres buscan información en la computadora acerca de la diabetes, y luego se ve una pareja que está mirando sus facturas. El anuncio dice que ahora hay igualdad de acceso a un seguro de salud accesible y se puede obtener ayuda para pagar su seguro de salud. Do you happen to remember that ad, or not, or are you not sure? ¿Recuerda usted ese anuncio o no, o no está seguro/a?
4_1.7 The ad shows an older woman who talks about the many years she searched for health insurance but was always denied coverage because of her age. She says that this has now changed and that she and others like her can go to t Covered California to get quality coverage and even financial assistance.. El anuncio muestra a una mujer mayor que habla de los muchos años que ha buscado un seguro de salud, pero siempre se le negaba la cobertura debido a su edad. Ella dice que esto ha cambiado ahora y que ella y otros como ella pueden ir a Covered California para obtener una cobertura de calidad e incluso ayuda financiera. Do you happen to remember that ad, or not, or are you not sure?

NORC | Covered California—Consumer Tracking Survey
FINAL REPORT | 151
¿Recuerda usted ese anuncio o no, o no está seguro/a? RESPONSE SET FOR EACH OF THE ABOVE 1 YES, HAVE SEEN 2 NO, HAVE NOT SEEN 77 DON’T KNOW/NOT SURE 99 REFUSED

NORC | Covered California—Consumer Tracking Survey
FINAL REPORT | 152
Section 5: Exposure to Other Campaign Elements
5_1 (NEW)
[ASK ALL.] Have you seen any information about Covered California on the internet? ¿Ha visto usted alguna información acerca de Covered California en el Internet?
1 Yes CONTINUE 2 No SKIP TO 5_2 77 Don’t know SKIP TO 5_2 99 Refused SKIP TO 5_2
5_1A Have you gotten any information about Covered California ...
¿Ha conseguido usted alguna información acerca de Covered California...? [READ. RANDOMIZE.]
Yes No DK Ref 5_1A1 From a You Tube video
De un video en You Tube 1 2 77 99
5_1A2 On Facebook Por Facebook
1 2 77 99
5_1A3 On Twitter Por Twitter
1 2 77 99
5_1A4 By going to the Covered California Website Por ir al sitio web de Covered California
1 2 77 99
5_1A5 [THIS ITEM SHOULD ALWAYS FOLLOW ITEM 5_1A5] By going to some other website Por ir a otro sitio web
1 2 77 99
5_1A6 By going to the library to use the Internet Por ir a la biblioteca para usar el Internet
1 2 77 99
5_2 (NEW)
Have you received information about Covered California …? ¿Ha recibido usted alguna información acerca de Covered California? ... [READ. RANDOMIZE.]
Yes No DK Ref 5_2A At a health fair
En una feria de salud 1 2 77 99
5_2B At a workshop or seminar En un taller o seminario
1 2 77 99
5_2C At an event at your church or other place of worship En un evento en su iglesia u otro lugar de oración
1 2 77 99
5_2D At an event at a school or college En un evento en una escuela o universidad
1 2 77 99

NORC | Covered California—Consumer Tracking Survey
FINAL REPORT | 153
5_2E [ALWAYS ASK LAST]: Or, some other type of event you attended. (ACCEPT UP TO 3 RESPONSES) [ALWAYS ASK LAST]: O en algún otro tipo de evento a que usted asistió. (ACCEPT UP TO 3 RESPONSES)
1 2 77 99
5_2E_OTH ENTER OTHER SPECIFY _____________
5_3 (NEW)
Have you received information about Covered California from friends or family? ¿Ha recibido usted información sobre Covered California de sus amigos o familiares?
1 Yes 2 No 77 Don’t Know 99 Refuse
5_4 (NEW)
Have you talked in person with any of the following to get information about Covered California…? [READ. RANDOMIZE.[ ¿Ha hablado usted personalmente con alguna de las siguientes personas para obtener información acerca de Covered California...?
Yes No DK Ref 5_4A A Covered California certified educator or enrollment
counselor Un educador certificado de Covered California o consejero de inscripción
1 2 77 99
5_4B An insurance agent Un agente de seguros
1 2 77 99
5_4C Staff at a government office that enrolls people in social services El personal de una oficina de gobierno que inscribe a la gente en los servicios sociales
1 2 77 99
5_4D Staff at a clinic or other organization that works with Covered California El personal de una clínica u otra organización que trabaja con Covered California
1 2 77 99
5_4E Health plan representative Representante de un plan de salud
1 2 77 99
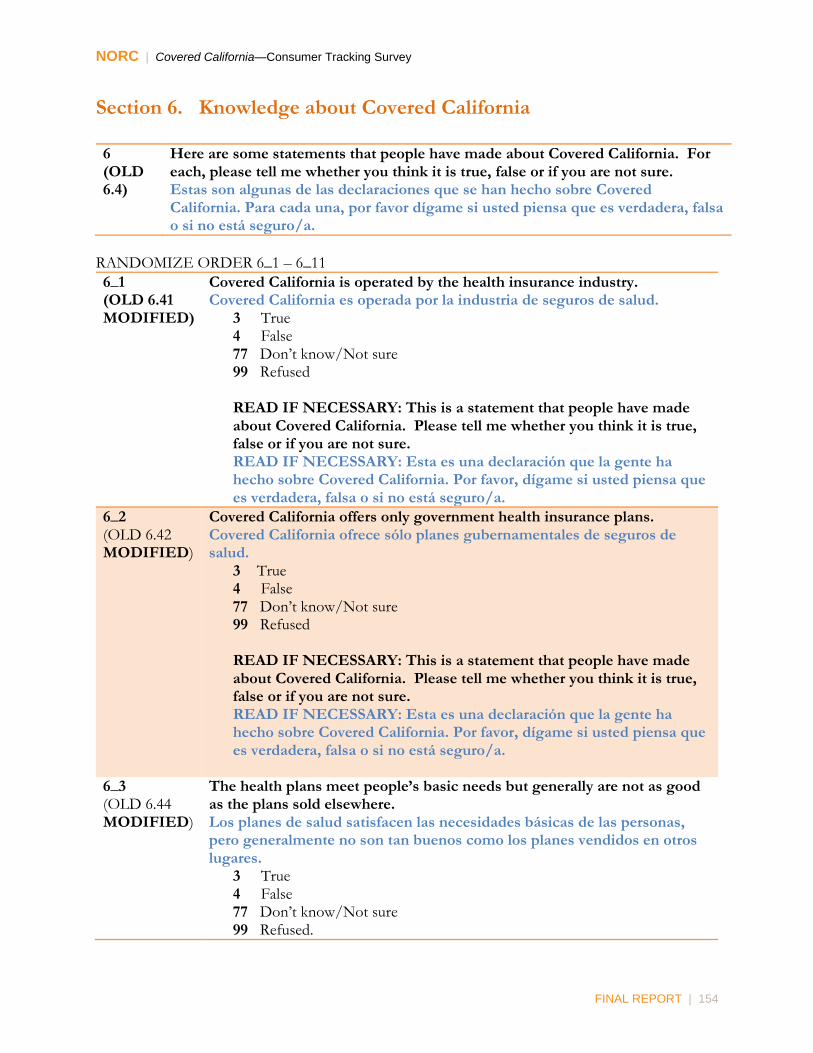
NORC | Covered California—Consumer Tracking Survey
FINAL REPORT | 154
Section 6. Knowledge about Covered California
6 (OLD 6.4)
Here are some statements that people have made about Covered California. For each, please tell me whether you think it is true, false or if you are not sure. Estas son algunas de las declaraciones que se han hecho sobre Covered California. Para cada una, por favor dígame si usted piensa que es verdadera, falsa o si no está seguro/a.
RANDOMIZE ORDER 6_1 – 6_11
6_1 (OLD 6.41 MODIFIED)
Covered California is operated by the health insurance industry. Covered California es operada por la industria de seguros de salud.
3 True 4 False 77 Don’t know/Not sure 99 Refused READ IF NECESSARY: This is a statement that people have made about Covered California. Please tell me whether you think it is true, false or if you are not sure. READ IF NECESSARY: Esta es una declaración que la gente ha hecho sobre Covered California. Por favor, dígame si usted piensa que es verdadera, falsa o si no está seguro/a.
6_2 (OLD 6.42 MODIFIED)
Covered California offers only government health insurance plans. Covered California ofrece sólo planes gubernamentales de seguros de salud.
3 True 4 False 77 Don’t know/Not sure 99 Refused
READ IF NECESSARY: This is a statement that people have made about Covered California. Please tell me whether you think it is true, false or if you are not sure. READ IF NECESSARY: Esta es una declaración que la gente ha hecho sobre Covered California. Por favor, dígame si usted piensa que es verdadera, falsa o si no está seguro/a.
6_3 (OLD 6.44 MODIFIED)
The health plans meet people’s basic needs but generally are not as good as the plans sold elsewhere. Los planes de salud satisfacen las necesidades básicas de las personas, pero generalmente no son tan buenos como los planes vendidos en otros lugares.
3 True 4 False 77 Don’t know/Not sure 99 Refused.
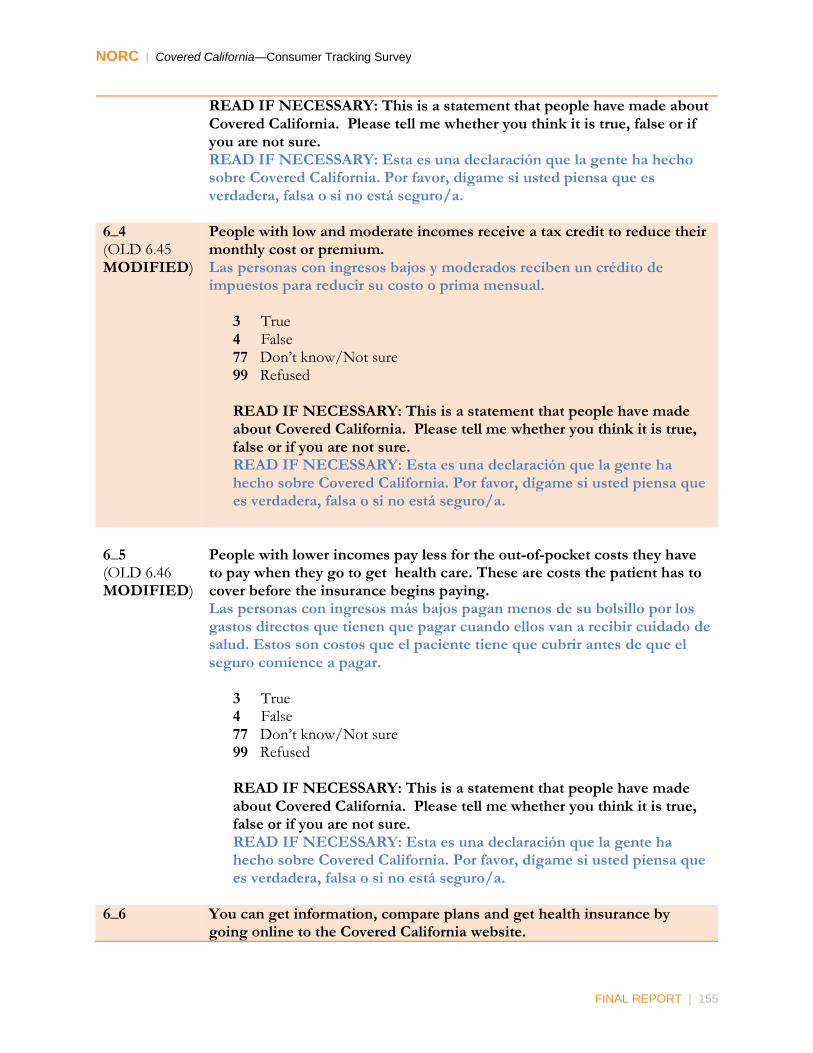
NORC | Covered California—Consumer Tracking Survey
FINAL REPORT | 155
READ IF NECESSARY: This is a statement that people have made about Covered California. Please tell me whether you think it is true, false or if you are not sure. READ IF NECESSARY: Esta es una declaración que la gente ha hecho sobre Covered California. Por favor, dígame si usted piensa que es verdadera, falsa o si no está seguro/a.
6_4 (OLD 6.45 MODIFIED)
People with low and moderate incomes receive a tax credit to reduce their monthly cost or premium. Las personas con ingresos bajos y moderados reciben un crédito de impuestos para reducir su costo o prima mensual.
3 True 4 False 77 Don’t know/Not sure 99 Refused
READ IF NECESSARY: This is a statement that people have made about Covered California. Please tell me whether you think it is true, false or if you are not sure. READ IF NECESSARY: Esta es una declaración que la gente ha hecho sobre Covered California. Por favor, dígame si usted piensa que es verdadera, falsa o si no está seguro/a.
6_5 (OLD 6.46 MODIFIED)
People with lower incomes pay less for the out-of-pocket costs they have to pay when they go to get health care. These are costs the patient has to cover before the insurance begins paying. Las personas con ingresos más bajos pagan menos de su bolsillo por los gastos directos que tienen que pagar cuando ellos van a recibir cuidado de salud. Estos son costos que el paciente tiene que cubrir antes de que el seguro comience a pagar.
3 True 4 False 77 Don’t know/Not sure 99 Refused
READ IF NECESSARY: This is a statement that people have made about Covered California. Please tell me whether you think it is true, false or if you are not sure. READ IF NECESSARY: Esta es una declaración que la gente ha hecho sobre Covered California. Por favor, dígame si usted piensa que es verdadera, falsa o si no está seguro/a.
6_6 You can get information, compare plans and get health insurance by going online to the Covered California website.

NORC | Covered California—Consumer Tracking Survey
FINAL REPORT | 156
(OLD 6.47 MODIFIED)
Usted puede obtener información, comparar los planes y obtener un seguro de salud por Internet en el sitio web de Covered California.
3 True 4 False 77 Don’t know/Not sure 99 Refused
READ IF NECESSARY: This is a statement that people have made about Covered California. Please tell me whether you think it is true, false or if you are not sure. READ IF NECESSARY: Esta es una declaración que la gente ha hecho sobre Covered California. Por favor, dígame si usted piensa que es verdadera, falsa o si no está seguro/a.
6_7 (OLD 6.48 MODIFIED)
Most people who don’t have health insurance by April 2014 will have to pay a penalty. La mayoría de las personas que no tengan seguro de salud para abril 2014 tendrán que pagar una multa.
3 True 4 False 77 Don’t know/Not sure 99 Refused READ IF NECESSARY: This is a statement that people have made about Covered California. Please tell me whether you think it is true, false or if you are not sure. READ IF NECESSARY: Esta es una declaración que la gente ha hecho sobre Covered California. Por favor, dígame si usted piensa que es verdadera, falsa o si no está seguro/a.
6_8 (OLD 6.49 MODIFIED)
Covered California is a welfare program. Covered California es un programa de bienestar.
3 True 4 False 77 Don’t know/Not sure 99 Refused
READ IF NECESSARY: This is a statement that people have made about Covered California the new marketplace. Please tell me whether you think it is true, false or if you are not sure. READ IF NECESSARY: Esta es una declaración que la gente ha hecho sobre Covered California. Por favor, dígame si usted piensa que es verdadera, falsa o si no está seguro/a.

NORC | Covered California—Consumer Tracking Survey
FINAL REPORT | 157
6_9 (NEW)
Covered California is the only place low- and moderate-income people can get tax credits to help reduce the cost of the monthly health plan premium. Covered California es el único lugar donde la gente de bajos y moderados ingresos puede obtener créditos de impuestos para ayudar a reducir el costo de la prima mensual del plan de salud.
3 True 4 False 77 Don’t know/Not sure 99 Refused
READ IF NECESSARY: This is a statement that people have made about Covered California. Please tell me whether you think it is true, false or if you are not sure. READ IF NECESSARY: Esta es una declaración que la gente ha hecho sobre Covered California. Por favor, dígame si usted piensa que es verdadera, falsa o si no está seguro/a.
6_10 (OLD 6.411 MODIFIED)
Covered California offers private health insurance plans that will compete for your business. Covered California ofrece planes de seguros de salud privados que competirán para su negocio.
3 True 4 False 77 Don’t know/Not sure 99 Refused
READ IF NECESSARY: This is a statement that people have made about Covered California. Please tell me whether you think it is true, false or if you are not sure. READ IF NECESSARY: Esta es una declaración que la gente ha hecho sobre Covered California. Por favor, dígame si usted piensa que es verdadera, falsa o si no está seguro/a.
6_11 (OLD 6.412 MODIFIED)
You can get health insurance through Covered California even if you have a pre-existing condition. Usted puede obtener un seguro de salud a través de Covered California incluso si usted tiene una condición pre-existente. INTERVIEWER INSTRUCTION: A pre-existing condition is a medical problem you have at the time you apply for health insurance.. INSTRUCCIÓN PARA EL ENTREVISTADOR: Una condición preexistente es un problema médico que uno tiene en el momento de aplicar para el seguro de salud ..

NORC | Covered California—Consumer Tracking Survey
FINAL REPORT | 158
3 True 4 False 77 Don’t know/Not sure 99 Refused
READ IF NECESSARY: This is a statement that people have made about Covered California. Please tell me whether you think it is true, false or if you are not sure. READ IF NECESSARY: Esta es una declaración que la gente ha hecho sobre Covered California. Por favor, dígame si usted piensa que es verdadera, falsa o si no está seguro/a.
Section 6B. Importance of Facts about Covered California 6B_1 (OLD 6.5)
Now I will read you a list of facts about Covered California. As I read each one, please tell how important it is or was in your decision about whether or not to shop for health insurance at Covered California. Please use a scale of zero to 10, where “zero” means that it is not important at all and “10” means that it is extremely important. Ahora le voy a leer una lista de hechos acerca de Covered California. Al yo leerle cada una, por favor dígame lo importante que es o haya sido este hecho en su decisión acerca de si debe o no comprar un seguro de salud a Covered California. Por favor, utilice una escala de cero a 10, donde el "cero" significa que no es importante en absoluto, y "10" significa que es extremadamente importante.
RANDOMIZE ORDER 6_1.1-6_1.7
6B_11 (OLD 6.51)
The California State Government will operate Covered California. El Gobierno del Estado de California operará Covered California. ENTER NUMBER ______ (range: 0-10, 77, 99) READ IF NECESSARY: Please tell me how important this will be in your decision about whether or not to shop for health insurance at Covered California. Please use a scale of zero to 10, where “zero” means that it is not important at all and “10” means that it is extremely important. READ IF NECESSARY: Por favor, dígame cuán importante será en su decisión sobre si debe o no comprar un seguro de salud por Covered California. Por favor, utilice una escala de cero a 10, donde el "cero" significa que no es importante en absoluto, y "10" significa que es extremadamente importante.
6B_12 (OLD 6.52)
(ALWAYS READ AFTER 6B_11. DO NOT RANDOMIZE.) Covered California will offer a number of private health insurance plans. Covered California ofrecerá una serie de planes de seguros de salud privados.

NORC | Covered California—Consumer Tracking Survey
FINAL REPORT | 159
ENTER NUMBER ______ (range: 0-10, 77, 99) READ IF NECESSARY: Please tell me how important this will be in your decision about whether or not to shop for health insurance at Covered California. Please use a scale of zero to 10, where “zero” means that it is not important at all and “10” means that it is extremely important. READ IF NECESSARY: Por favor, dígame cuán importante será en su decisión sobre si debe o no comprar un seguro de salud por Covered California. Por favor, utilice una escala de cero a 10, donde el "cero" significa que no es importante en absoluto, y "10" significa que es extremadamente importante.
6B_13 (OLD 6.53)
It will be easy to compare insurance plans and select the one that is best for you. Será fácil comparar los planes de seguros y seleccionar el que es mejor para usted. ENTER NUMBER ______ (range: 0-10, 77, 99) READ IF NECESSARY: Please tell me how important this will be in your decision about whether or not to shop for health insurance at Covered California. Please use a scale of zero to 10, where “zero” means that it is not important at all and “10” means that it is extremely important. READ IF NECESSARY: Por favor, dígame cuán importante será en su decisión sobre si debe o no comprar un seguro de salud por Covered California. Por favor, utilice una escala de cero a 10, donde el "cero" significa que no es importante en absoluto, y "10" significa que es extremadamente importante.
6B_14 (OLD 6.54)
All plans will be screened to make sure they offer the services people need, including preventive care. Todos los planes serán evaluados para asegurarse de que ofrecen los servicios que las personas necesitan, incluyendo la atención preventiva. ENTER NUMBER ______ (range: 0-10, 77, 99) READ IF NECESSARY: Please tell me how important this will be in your decision about whether or not to shop for health insurance at Covered California. Please use a scale of zero to 10, where “zero” means that it is not important at all and “10” means that it is extremely important. READ IF NECESSARY: Por favor, dígame cuán importante será en su decisión sobre si debe o no comprar un seguro de salud por Covered California. Por favor, utilice una escala de cero a 10, donde el "cero" significa que no es importante en absoluto, y "10" significa que es extremadamente importante.

NORC | Covered California—Consumer Tracking Survey
FINAL REPORT | 160
6B_15 (OLD 6.55)
People with low and moderate incomes will receive a tax credit to reduce their monthly cost or premium. Las personas con ingresos bajos y moderados recibirán un crédito de impuestos para reducir su costo o prima mensual. ENTER NUMBER ______ (range: 0-10, 77, 99) READ IF NECESSARY: Please tell me how important this will be in your decision about whether or not to shop for health insurance at Covered California. Please use a scale of zero to 10, where “zero” means that it is not important at all and “10” means that it is extremely important. READ IF NECESSARY: Por favor, dígame cuán importante será en su decisión sobre si debe o no comprar un seguro de salud por Covered California. Por favor, utilice una escala de cero a 10, donde el "cero" significa que no es importante en absoluto, y "10" significa que es extremadamente importante.
6B_16 (OLD 6.56)
(ALWAYS READ AFTER 6_B15. DO NOT RANDOMIZE.) People with lower incomes will also pay less for out-of-pocket costs when they use health care. Las personas con ingresos más bajos también pagarán menos por gastos directos de su bolsillo cuando utilizan la atención de salud. ENTER NUMBER ______ (range: 0-10, 77, 99) READ IF NECESSARY: Please tell me how important this will be in your decision about whether or not to shop for health insurance at Covered California. Please use a scale of zero to 10, where “zero” means that it is not important at all and “10” means that it is extremely important. READ IF NECESSARY: Por favor, dígame cuán importante será en su decisión sobre si debe o no comprar un seguro de salud por Covered California. Por favor, utilice una escala de cero a 10, donde el "cero" significa que no es importante en absoluto, y "10" significa que es extremadamente importante.
6B_17 (OLD 6.57 MODIFIED)
You cannot be denied because of a pre-existing condition. No se le puede negar a usted seguro debido a una condición pre-existente. INTERVIEWER INSTRUCTION: A pre-existing condition is a medical problem you have at the time you apply for health insurance. INSTRUCCIÓN PARA EL ENTREVISTADOR: Una condición preexistente es un problema médico que uno tiene en el momento de aplicar para el seguro de salud. ENTER NUMBER ______ (range: 0-10, 77, 99) READ IF NECESSARY: Please tell me how important this will be in your decision about whether or not to shop for health insurance at Covered

NORC | Covered California—Consumer Tracking Survey
FINAL REPORT | 161
California. Please use a scale of zero to 10, where “zero” means that it is not important at all and “10” means that it is extremely important. READ IF NECESSARY: Por favor, dígame cuán importante será en su decisión sobre si debe o no comprar un seguro de salud por Covered California. Por favor, utilice una escala de cero a 10, donde el "cero" significa que no es importante en absoluto, y "10" significa que es extremadamente importante.
6B_18 (OLD 6.58, MODIFIED)
Most people who don’t get health insurance before April 1, 2014 will have to pay a penalty. La mayoría de las personas que no reciben seguro de salud antes del primero de abril 2014 tendrán que pagar una multa. ENTER NUMBER ______ (range: 0-10, 77, 99) READ IF NECESSARY: Please tell me how important this will be in your decision about whether or not to shop for health insurance at Covered California. Please use a scale of zero to 10, where “zero” means that it is not important at all and “10” means that it is extremely important. READ IF NECESSARY: Por favor, dígame cuán importante será en su decisión sobre si debe o no comprar un seguro de salud por Covered California. Por favor, utilice una escala de cero a 10, donde el "cero" significa que no es importante en absoluto, y "10" significa que es extremadamente importante.
6B_3 (OLD 5.38)
Now I’ll read some statements people have made about their health. As I do please tell me whether you agree strongly, agree somewhat, disagree somewhat or disagree strongly. Ahora voy a leerle algunas declaraciones que personas han hecho sobre su propia salud. Mientras lo hago, por favor, dígame si está muy de acuerdo, algo de acuerdo, en desacuerdo o muy en desacuerdo. A lot of people who didn’t have health insurance before are getting it now because it is the right thing to do. Muchas personas que no tenían seguro de salud antes, lo están consiguiendo ahora, porque es lo correcto.
1 Agree strongly 2 Agree somewhat 3 Disagree somewhat 4 Disagree strongly 77 DON’T KNOW/NO OPINION 99 REFUSED

NORC | Covered California—Consumer Tracking Survey
FINAL REPORT | 162
6B_4 (OLD 5.39)
Most people like me don’t have health insurance. La mayoría de la gente como yo no tiene seguro de salud. READ IF NECESSARY: Please tell me whether you agree strongly, agree somewhat, disagree somewhat or disagree strongly. READ IF NECESSARY: Por favor, dígame si está usted muy de acuerdo, algo de acuerdo, en desacuerdo o muy en desacuerdo.
1 Agree strongly 2 Agree somewhat 3 Disagree somewhat 4 Disagree strongly 77 DON’T KNOW/NO
OPINION
99 REFUSED

NORC | Covered California—Consumer Tracking Survey
FINAL REPORT | 163
Section 7: Purchase Status and Intention
7_1A (NEW) Have you applied for a health insurance plan through Covered California? ¿Ha aplicado usted para un plan de seguro de salud a través de Covered California?
1 Yes CONTINUE 2 No SKIP TO SECTION 9, CODE AS NON
PURCHASER (SET NONPURCHASER=1) 77 DON’T KNOW SKIP TO SECTION 9, CODE AS NON
PURCHASER (SET NONPURCHASER=1) 99 REFUSED SKIP TO SECTION 9, CODE AS NON
PURCHASER (SET NONPURCHASER=1)
7_1B (NEW) Have you selected your plan?
¿Ha seleccionado usted su plan?
1 Yes CONTINUE 2 No SKIP TO SECTION 9, CODE AS NON
PURCHASER (SET NONPURCHASER=1) 77 DON’T KNOW SKIP TO SECTION 9, CODE AS NON
PURCHASER (SET NONPURCHASER=1) 99 REFUSED SKIP TO SECTION 9, CODE AS NON
PURCHASER (SET NONPURCHASER=1)
7_1C (NEW) Did you complete your purchase by paying for your plan? ¿Completó usted su compra pagando por su plan?
1 YES GO TO SECTION 8– CODE AS PURCHASER (SET PURCHASER=1)
2 NO GO TO 7_1D 77 DON’T
KNOW GO TO 7_1D
99 REFUSED GO TO 7_1D
7_1D (NEW) Do you plan to complete your purchase by paying for your plan?
¿Planea usted completar su compra pagando por su plan?
1 YES GO TO SECTION 8– CODE AS PURCHASER (SET PURCHASER=1)
2 NO SKIP TO SECTION 9, CODE AS NON PURCHASER (SET NONPURCHASER=1)
77 DON’T KNOW
SKIP TO SECTION 9, CODE AS NON PURCHASER (SET NONPURCHASER=1)
99 REFUSED SKIP TO SECTION 9, CODE AS NON PURCHASER (SET NONPURCHASER=1)

NORC | Covered California—Consumer Tracking Survey
FINAL REPORT | 164
Section 7B. Prior Plan Comparison
7B_1 In the last few months of 2013, did you receive a cancellation notice for your health insurance or a notice that your insurance would not be renewed? En los últimos meses del año 2013, ¿recibió usted una notificación de cancelación de su seguro de salud o un aviso de que su seguro no le sería renovado? READ IF NECESSARY: By last few months we mean since October 2013. READ IF NECESSARY: Por últimos meses nos referimos desde Octubre de 2013.
1 Yes CONTINUE 2 No SKIP TO NEXT SECTION, SECTION 8 IF
PURCHASER=1 SECTION 9 IF NONPURCHASER=1
77 Don’t know SKIP TO NEXT SECTION, SECTION 8 IF PURCHASER=1 SECTION 9 IF NONPURCHASER=1
99 Refused SKIP TO NEXT SECTION, SECTION 8 IF PURCHASER=1 SECTION 9 IF NONPURCHASER=1
7B_2 Did the notice you received say that the cancellation was the result of the
Affordable Care Act? ¿El aviso que recibió decía que la cancelación era el resultado de la Ley de Asistencia Accesible (Affordable Care Act)? READ IF NECESSARY: The Affordable Care Act is the new health care law proposed by President Obama and passed by Congress. READ IF NECESSARY: La Ley de Asistencia Accesible (Affordable Care Act) es la nueva ley de atención de la salud propuesta por el Presidente Obama y aprobado por el Congreso.
1 Yes CONTINUE 2 No CONTINUE 77 Don’t know CONTINUE 99 Refused CONTINUE
7B_3 Did the notice say that you should visit Covered California to enroll in a new
plan? ¿Decía el aviso que usted debería visitar Covered California para inscribirse en un nuevo plan?
1 Yes CONTINUE 2 No CONTINUE 77 Don’t know CONTINUE 99 Refused CONTINUE

NORC | Covered California—Consumer Tracking Survey
FINAL REPORT | 165
IF PURCHASER=1 CONTINUE TO 7B_4, ELSE SKIP TO SECTION 9
7B_4 Did the plan you purchased through Covered California cost more, less, or
about the same as the plan that was cancelled? ¿El plan que ha adquirido a través de Covered California costó más, menos o más o menos igual que el plan que fue cancelado?
1 MORE CONTINUE 2 ABOUT THE SAME CONTINUE 3 LESS CONTINUE 77 DON’T KNOW CONTINUE 99 REFUSED CONTINUE
7B_5 Do you think the plan you purchased through Covered California is better,
worse, or about the same as the plan that was cancelled? ¿Cree usted que el plan que ha adquirido a través de Covered California es mejor, peor, o casi lo mismo que el plan que fue cancelado?
1 BETTER CONTINUE 2 ABOUT THE SAME CONTINUE 3 WORSE CONTINUE 77 DON’T KNOW CONTINUE 99 REFUSED CONTINUE

NORC | Covered California—Consumer Tracking Survey
FINAL REPORT | 166
Section 8. Purchaser Motivations and Experience
ASK ALL PURCHASERS (PURCHASER=1) (THOSE WHO HAVE PAID FOR A PLAN, SELECTED ONE, OR APPLIED AND INTEND TO COMPLETE THE PURCHASE FROM ABOVE)
8_1 (NEW)
What are the main reasons you decided to purchase health insurance through Covered California? ¿Cuáles son las razones principales por las cuales decidió usted adquirir un seguro de salud a través de Covered California?
OPEN END. PROBE FOR MULTIPLE RESPONSES. ACCEPT UP TO 3. ___________________
77 DON’T KNOW 99 REFUSED
8_2 (NEW)
Where did you go to apply for or purchase your plan? (READ RESPONSES BELOW) ¿Adónde fue usted para aplicar o comprar su plan?
1 Covered California website
Al sitio web de Covered California SKIP TO 8_3
2 Covered California toll free number Al número de teléfono gratuito para Covered California
GO TO 8_2A
3 Covered California certified educator or enrollment counselor in your neighborhood A un educador certificado de Covered California o a u consejero de inscripción en su vecindario
GO TO 8_2A
4 Insurance agent A un agente de seguros
GO TO 8_2A
5 A government office where you can enroll in in social services A una oficina del gobierno donde usted puede inscribirse en los servicios sociales
GO TO 8_2A
77 Don’t know No sé
GO TO 8_2A
99 Refused Rechazó
GO TO 8_2A

NORC | Covered California—Consumer Tracking Survey
FINAL REPORT | 167
8_2A (NEW)
Did you encounter any problems that made it difficult for you to apply or purchase your plan? ¿Encontró usted algún problema que hizo difícil el aplicar o comprar su plan?
1 Yes CONTINUE 2 No SKIP TO 8_4 77 Don’t know SKIP TO 8_4 99 Refused SKIP TO 8_4
8_2A1 (NEW)
Please tell me about those problems. Por favor hábleme sobre esos problemas.
OPEN END. PROBE FOR MULTIPLE RESPONSES. ACCEPT UP TO 3. 77. DON’T KNOW 99. REFUSED
8_3 (NEW)
[ASK THOSE WHO PURCHASED ON THE WEB (8_2=1)] On a scale from 1 to 5 where 1 means “very easy” and 5 means “very difficult,” how easy or difficult was it to use the site and find the information you wanted? En una escala de 1 a 5, donde 1 significa "muy fácil" y 5 significa "muy difícil", ¿qué tan fácil o difícil le fue para usted usar el sitio y encontrar la información que buscaba?
1 Easy 2 3 4 5 Difficult 77 Don’t know 99 Refused
8_4 (NEW)
[ASK IF PURCHASER=1] Did anyone help you complete your application? ¿Alguien le ayudó a usted completar su aplicación?
1 Yes 2 No 77 Don’t know 99 Refused
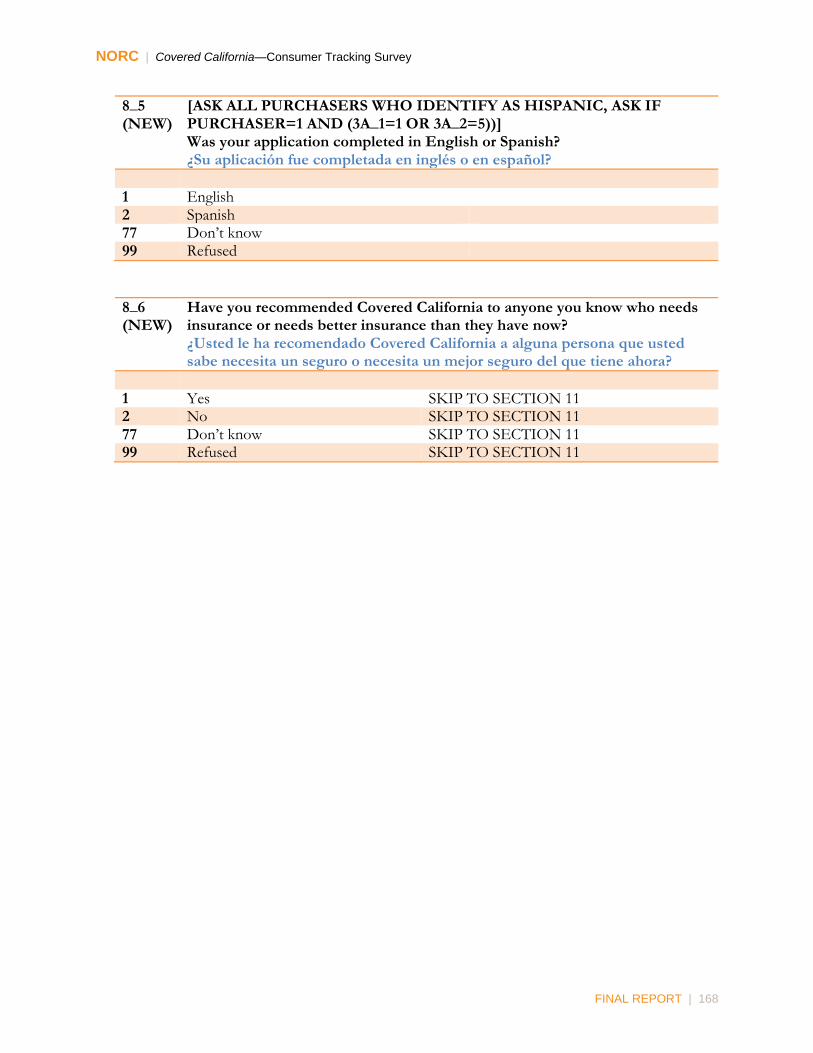
NORC | Covered California—Consumer Tracking Survey
FINAL REPORT | 168
8_5 (NEW)
[ASK ALL PURCHASERS WHO IDENTIFY AS HISPANIC, ASK IF PURCHASER=1 AND (3A_1=1 OR 3A_2=5))] Was your application completed in English or Spanish? ¿Su aplicación fue completada en inglés o en español?
1 English 2 Spanish 77 Don’t know 99 Refused
8_6 (NEW)
Have you recommended Covered California to anyone you know who needs insurance or needs better insurance than they have now? ¿Usted le ha recomendado Covered California a alguna persona que usted sabe necesita un seguro o necesita un mejor seguro del que tiene ahora?
1 Yes SKIP TO SECTION 11 2 No SKIP TO SECTION 11 77 Don’t know SKIP TO SECTION 11 99 Refused SKIP TO SECTION 11

NORC | Covered California—Consumer Tracking Survey
FINAL REPORT | 169
Section 9. Non-Purchaser Motivations and Experience
ASK ALL NON-PURCHASERS, INCLUDING APPLICANT NON-PURCHASERS [ASK IF NON-PURCHASER=1]
9_2 (NEW)
[ASK IF NON-PURCHASER=1]. Have you looked into the possibility of purchasing health insurance through Covered California? ¿Ha considerado usted la posibilidad de comprar un seguro de salud a través de Covered California?
1 Yes CONTINUE 2 No SKIP TO 9_3 77 Don’t know SKIP TO 9_3 99 Refused SKIP TO 9_3
9_2B (NEW)
[ASK ALL NON-PURCHASERS LOOKED INTO POSSIBILITY OF HEALTH INSURANCE (ASK IF NONPURCHASER=1 AND 9_2=1).] Where did you go to look for information about the possibility of purchasing health insurance through Covered California? ¿A dónde fue usted para buscar información sobre la posibilidad de comprar un seguro de salud a través de Covered California? READ IF NECESSARY: For each, tell me “Yes”, “No”, or you’re not sure. READ IF NECESSARY: Para cada, dígame “Sí”, “No”, o no está seguro/a.
Yes No DK Ref 9_2B1 Online to the Covered California website
En el internet por el sitio web de Covered California 1 2 77 99
9_2B2 The Covered California toll free telephone number El número de teléfono gratuito de Covered California
1 2 77 99
9_2B3 A Covered California certified educator or enrollment counselor in your neighborhood Un educador certificado de Covered California o un consejero de inscripción en su vecindario
1 2 77 99
9_2B4 Meet with an insurance agent Reunirse con un agente de seguros
1 2 77 99
9_2B5 Visit a government office that enrolls people in social services Visitar una oficina del gobierno que inscribe a la gente en los servicios sociales
1 2 77 99
9_2B6 Or do something else to get information (Specify) O hacer algo más para obtener información (Especifique)
1 2 77 99
IF 9_2B1=1 THEN SKIP TO 9_3, ELSE GO TO 9_2C

NORC | Covered California—Consumer Tracking Survey
FINAL REPORT | 170
9_2C (NEW)
[ASK ALL NON-PURCHASERS WHO DID NOT GO TO THE WEBSITE (ASK IF NONPURCHASER=1 AND 9_2B1≠1).] Did you encounter any problems that made it difficult for you to find information or apply for a plan? ¿Tuvo usted algún problema que hizo difícil encontrar la información o aplicar para un plan?
1 Yes CONTINUE 2 No GO TO 9_3 77 Don’t know GO TO 9_3 99 Refused GO TO 9_3
9_2D (NEW) Please tell me about those problems. Por favor hábleme acerca de esos problemas.
OPEN END. DO NOT READ CATEGORIES. PROBE FOR MULTIPLE RESPONSES. ACCEPT UP TO 3.
9_3 (NEW)
[ASK THOSE WHO HAVE LOOKED INTO THE POSSIBILITY OF BUYING HEALTH INSURANCE (ASK IF NONPURCHASER=1 AND 9_2=1).] Did you find out about how much your monthly cost or premium would be? ¿Averiguó usted acerca de cuánto sería el costo o prima mensual?
1 Yes CONTINUE 2 No SKIP TO
9_3C
77 Don’t Know SKIP TO 9_3C
88 Refused SKIP TO 9_3C
9_3A (NEW)
[ASK IF THEY FOUND OUT THE COST (ASK IF 9_3=1).] Was the cost more or less than you expected? ¿El costo fue más alto o más bajo de lo que usted esperaba?
1 More 2 Less 3 About the same 77 Don’t Know 88 Refused
9_3E (NEW)
[ASK THOSE WHO USED THE WEBSITE (9_3D=1).]

NORC | Covered California—Consumer Tracking Survey
FINAL REPORT | 171
On scale from 1 to 5 where 1 means “very easy” and 5 means “very difficult,” how easy or difficult was it to navigate the site and find the information you wanted? (NEW) En una escala de 1 a 5, donde 1 significa "muy fácil" y 5 significa "muy difícil", ¿qué tan fácil o difícil le fue para usted usar el sitio y encontrar la información que buscaba?
1 Easy CONTINUE 2 3 4 5 Difficult CONTINUE 77 Don’t know CONTINUE 99 Refused CONTINUE
9_3F (NEW)
[ASK THOSE REPORTING USE OF ANY INFO SOURCE OTHER THAN THE WEBSITE (ASK ONLY IF 9_2B1 NOT=1)] Did you encounter any problems that prevented you from getting the information you wanted or purchasing a health insurance plan? ¿Encontró usted algún problema que le impidió obtener la información que quería o que le impidió que comprara un plan de seguro de salud?
1 Yes CONTINUE 2 No SKIP TO 9_4 77 Don’t know SKIP TO 9_4 99 Refused SKIP TO 9_4
9_3G (NEW)
Please tell me about those problems. Por favor hábleme acerca de esos problemas.
OPEN END. DO NOT READ CATEGORIES. PROBE FOR MULTIPLE RESPONSES. ACCEPT UP TO 3.
9_4 (NEW)
[ASK ALL NON-PURCHASERS (NONPURCHASER=1).] Has a friend, family member or anyone else close to you recommended that you purchase health insurance on Covered California? Un amigo, un familiar o alguien cercano a usted ¿le ha recomendado que comprara un seguro salud en Covered California?
1 Yes 2 No 77 Don’t know 99 Refused
NORC | Covered California—Consumer Tracking Survey
FINAL REPORT | 172
9_5 (NEW)
[ASK ALL NON-PURCHASERS (NONPURCHASER=1).] Has a friend, family member or anyone else close to you recommended AGAINST purchasing health insurance through Covered California? Un amigo, un familiar o alguien cercano a usted ¿le ha recomendado que NO comprara un seguro salud en Covered California?
1 Yes 2 No 77 Don’t know 99 Refused

NORC | Covered California—Consumer Tracking Survey
FINAL REPORT | 173
Section 10: Purchase Intent After Hearing About Financial Assistance
ASK ALL NON-PURCHASERS, INCLUDING APPLICANT NON-PURCHASERS (NONPURCHASER=1).
10_1 (NEW)
If you were going to buy a health insurance policy, how many of your family members would you include on the policy? IF R REFUSES: If you can tell me how many family members you would insure I can give you some information about whether financial assistance might be available. IF R SAYS WON'T BUY INSURANCE: In a moment I will ask you whether or not you plan to buy insurance but now I’d like to know how many family members you would insure if you did buy it. Based on this I can let you know whether financial assistance might be available. This could make a difference in what you decide to do. Si usted fuera a comprar una póliza de seguro de salud, ¿a cuántos de los miembros de su familia incluiría en la póliza? IF R REFUSES: Si usted me puede decir cuantos miembros de la familia aseguraría, yo le puedo dar un poco de información sobre si la asistencia financiera podría estar disponible IF R SAYS WON'T BUY INSURANCE: En un momento le preguntaré si planea comprar el seguro pero ahora me gustaría saber cuantos miembros de la familia aseguraría si realmente lo compra. Basado en esto le puedo decir si la asistencia financiera podría estar disponible. Esto podría hacer una diferencia en lo que decide hacer.
# ENTER NUMBER (RANGE 1-20, 77, 99)
77 Don’t Know
99 Refused
10_1A (NEW)
[IF 10_1>1 THEN FILL “A family of [NUMBER FROM 10_1]” ELSE FILL “A single person”) with a total income under (400% FPL: TAKE FROM TABLE) would be eligible for financial assistance from the federal government to help them pay for health insurance? Is your income under [400% FPL]? [IF 10_1>1 THEN FILL “Una familia de [NUMBER FROM 10_1]” ELSE FILL "Una persona soltera"), con un ingreso total bajo (400% del FPL: TAKE FROM TABLE) sería elegible para la ayuda financiera del gobierno

NORC | Covered California—Consumer Tracking Survey
FINAL REPORT | 174
federal para ayudar a pagar por un seguro de salud. ¿Es el ingreso de (usted/su familia) menos de [400% FPL]?
1 Yes, applies CONTINUE 2 No, does not apply SKIP TO 10_1D 77 Don’t Know SKIP TO 10_1D 99 Refused SKIP TO 10_1D
10_1B (NEW)
[IF 10_1>1 THEN FILL “A family of [NUMBER FROM 10_1]” ELSE FILL “A single person”) with a total income between (200%-399% FPL: TAKE FROM TABLE) qualifies for financial assistance from the federal government that lowers the amount of monthly premiums? Is your income between [200% FPL] and [399% FPL]? [IF 10_1>1 THEN FILL “Una familia de [NUMBER FROM 10_1]” ELSE FILL"Una persona soltera"), con un ingreso total entre (200% –399% FPL: TAKE FROM TABLE) califica para la ayuda financiera del gobierno federal que reduce el monto de las primas mensuales. ¿Es el ingreso de (usted/su familia) entre [200% FPL] y [399% FPL]?
1 Yes, applies SKIP TO 10_2 2 No, does not apply CONTINUE 77 Don’t Know CONTINUE 99 Refused CONTINUE
10_1C (NEW)
[IF 10_1>1 THEN FILL “A family of [NUMBER FROM 10_1]” ELSE FILL “A single person”) with a total income between (139%-199% FPL: TAKE FROM TABLE) qualifies for financial assistance from the federal government that lowers the amount of monthly premiums and also helps pay for out-of-pocket costs like co-pays (the amount you have to pay when you receive medical services) and deductibles (the amount you have to spend before your health insurance coverage starts)? Is your income between [139% FPL] and [199% FPL]? [IF 10_1>1 THEN FILL “Una familia de [NUMBER FROM 10_1]” ELSE FILL "Una persona soltera"), con un ingreso total entre (139% –199% FPL: TAKE FROM TABLE ) califica para la ayuda financiera del gobierno federal que reduce el monto de las primas mensuales y también le ayuda a pagar los costos de su propio bolsillo, como co-pagos (la cantidad que usted tiene que pagar cuando recibe servicios médicos) y los deducibles (la cantidad que tiene que pagar antes de que comience su cobertura de su seguro de salud)? ¿Es el ingreso de (usted/su familia) entre [139% FPL] y [199% FPL]?
1 Yes, applies SKIP TO 10_2 2 No, does not apply CONTINUE 77 Don’t Know CONTINUE 99 Refused CONTINUE

NORC | Covered California—Consumer Tracking Survey
FINAL REPORT | 175
10_1D (NEW)
READ ONLY: [IF 10_1>1 THEN FILL “A family of [NUMBER FROM 10_1]”ELSE FILL “A single person”) with a total income of (400% FPL: TAKE FROM TABLE) or more is not eligible for financial assistance from the federal government. READ ONLY: [IF 10_1>1 THEN FILL “Una familia de [NUMBER FROM 10_1]” ELSE FILL "Una persona soltera"), con un ingreso total de (400% FPL: TAKE FROM TABLE ) o más no es elegible para la ayuda financiera del gobierno federal.
10_2 (OLD 8.6, MODIFIED)
Insurance can be purchased from Covered California for 2014 through April 1, 2014. Which best describes you: I will get health insurance, I may get health insurance, or I will not get health insurance through Covered California before April 1, 2014?" El seguro puede ser comprado de Covered California para 2014 hasta el primero de abril de 2014. ¿Qué es lo que lo/a describe mejor?: Voy a conseguir un seguro de salud, posiblemente voy a conseguir un seguro de salud, o no voy a conseguir un seguro de salud a través de Covered California antes del primero de abril 2014."
1 I WILL GET HEALTH INSURANCE THROUGH COVERED CALIFORNIA
CONTINUE
2 I MAY GET HEALTH INSURANCE THROUGH COVERED CALIFORNIA
SKIP TO 10_2B
3 I WILL NOT GET HEALTH INSURANCE THROUGH COVERED CALIFORNIA
SKIP TO 10_2B
77 Don’t know SKIP TO 10_3 99 Refused SKIP TO 10_3
Motivators (ASK ALL WHO PLAN TO GET INSURANCE (10_2 =1))
10_2A (OLD 8.6A)
What are the main reasons you plan to get health insurance through Covered California? [ACCEPT UP TO 3] OPEN END. DO NOT READ CATEGORIES. ¿Cuáles son las razones principales por las que usted planea obtener un seguro de salud a través de Covered California? INTERVIEWER INSTRUCTION: If only one or two reasons given, ask “Are there any other reasons?” INTERVIEWER INSTRUCTION: Si sólo hay una o dos razones dadas, pregunte "¿Hay alguna otra razón?"
SAVE MONEY/GOOD DEAL SECURITY/PEACE OF MIND NEED INSURANCE/COVERAGE/HEALTH CARE CAN COVER FAMILY, NOT JUST SELF PREVENTIVE BENEFITS/AVOID EMERGENCIES OTHER, SPECIFY OTHER, SPECIFY

NORC | Covered California—Consumer Tracking Survey
FINAL REPORT | 176
OTHER, SPECIFY
Barriers (ASK ALL WHO DO NOT PLAN TO GET INSURANCE (10_2=3)
10_2B (OLD 8.6B)
What are the main reasons you DO NOT plan to get health insurance through the Covered California? PROBE: Are there any other reasons? OPEN END. OPEN END. DO NOT READ CATEGORIES. ACCEPT UP TO 3. ¿Cuáles son las razones por las cuales usted no va a obtener un seguro de salud a través de Covered California? PROGBE: ¿Hay alguna otra razón?
TOO EXPENSIVE DON’T’ NEED IT COVERAGE ISN’T GOOD/CONCERNS ABOUT QUALITY DON’T AGREE WITH ACA, OBAMACARE DON’T KNOW HOW TO APPLY/NEED MORE INFORMATION MOVING OUT OF STATE OTHER, SPECIFY OTHER, SPECIFY OTHER, SPECIFY

NORC | Covered California—Consumer Tracking Survey
FINAL REPORT | 177
Section 11. Access to the Internet and a Checking Account
Internet Access and Use 11_1 (OLD 9.1)
Do you use the Internet using a computer, tablet or smart phone? [MARK ALL THAT APPLY] ¿Utiliza usted el Internet, una computadora, tableta o smart phone? READ IF NECESSARY: Which do you use most, a computer, tablet or smartphone? READ IF NECESSARY: ¿Cuál es lo que más utiliza, una computadora, tableta o smart phone?
1 YES, COMPUTER 2 YES, TABLET 3 YES, SMARTPHONE 4 NO, DOES NOT USE THE INTERNET SKIP TO SECTION 11_1C 77 DON’T KNOW SKIP TO SECTION 11_1C 99 REFUSED SKIP TO SECTION 11_1C
11_1A (OLD 9.1A)
How often do you use the Internet? Do you use it every day or almost every day, several days a week, once a week, several times a month, once a month, or less than once a month? ¿Con qué frecuencia utiliza usted el Internet? ¿Lo utiliza todos los días o casi todos los días, varios días a la semana, una vez a la semana, varias veces al mes, una vez al mes, o menos de una vez al mes?
1 EVERY DAY OR ALMOST EVERY DAY 2 SEVERAL DAYS A WEEK 3 ONCE A WEEK 4 SEVERAL TIMES A MONTH 5 ONCE A MONTH 6 LESS THAN ONCE A MONTH 77 DON’T KNOW 99 REFUSED
11_1C (OLD 10.1)
Do you have a checking account that you use to pay bills? ¿Tiene usted una cuenta de cheques que utiliza para pagar las cuentas?
1 YES 2 NO 77 DON’T KNOW 99 REFUSED

NORC | Covered California—Consumer Tracking Survey
FINAL REPORT | 178
Section 11B. Ethnicity, Race, and Language Use
11B_1 (OLD 11.9)
(ASK ALL) Are you either Hispanic or Latino? ¿Es usted hispano/a o latino/a?
1 Yes 2 No 77 Don’t know 99 Refused
11B_2 (OLD 1.10)
(ASK ALL) [IF 11B_1 = 1, “Hispanics and Latinos can be of any race.”] What is your primary racial heritage? Are you… [READ RESPONSES] (ASK ALL) [IF 11B_1 = 1, “Los hispanos y los latinos pueden ser de cualquier raza.” ¿Cuál es su herencia racial primaria? ¿Es usted……[READ RESPONSES]
1 African American or Black Afroamericano/a o Negro/a
2 Asian or Pacific Islander Asiático/a o de las Islas del Pacífico
3 American Indian or Alaska Native Indio/a americano/a o Nativo/a de Alaska
4 White or Caucasian Blanco/a o caucásico/a
5 VOL: HISPANIC OR LATINO 6 Other: specify GO TO 11B2_OTH 77 Don’t Know 99 Refused
11B_2OTH ENTER OTHER SPECIFY _____________
11B_2A (NEW)
[ASK IF INTERIVEW IS IN ENGLISH [LANG_TYPE=1, ELSE SKIP TO 11B_2C] Do you ever use a language other than English? ¿Alguna vez usted usa algún otro idioma que no sea inglés?
1 YES GO TO 11B_2B 2 NO SKIP TO SECTION 12 77 DON’T KNOW SKIP TO SECTION 12 99 REFUSED SKIP TO SECTION 12

NORC | Covered California—Consumer Tracking Survey
FINAL REPORT | 179
11B_2B (NEW)
(ASK IF 11B_2A=1)) What language is that? ¿Qué idioma es ese? READ IF NECESSARY: Which other language do you speak most often? ¿Qué otro idioma habla usted con más frecuencia? RECORD ONLY ONE LANGUAGE.
INSERT LANGUAGE IN EACH QUESTION BELOW
1 SPANISH GO TO 11B_3 2 MANDARIN (CHINESE) GO TO 11B_3 3 CANTONESE (CHINESE) GO TO 11B_3 4 CHINESE (UNSPECIFIED) GO TO 11B_3 5 KOREAN GO TO 11B_3 6 VIETNAMESE GO TO 11B_3 7 TAGOLOG GO TO 11B_3 8 JAPANESE GO TO 11B_3 9 HMONG GO TO 11B_3 10 FARSI GO TO 11B_3 11 CAMBODIAN/KHMER GO TO 11B_3 12 ENGLISH GO TO 11B_3 13 OTHER LANGUAGE _____specify SKIP TO SECTION 12 77 DON’T KNOW SKIP TO SECTION 12 99 REFUSED SKIP TO SECTION 12
11B_2C (NEW)
[ASK IF INTERVIEW IS NOT IN ENGLISH (LANG_TYPE IN (2,3))] Do you speak any English? ¿Habla usted algo de inglés?
1 Yes GO TO 11B_2D 2 No SKIP TO SECTION 12 77 Don’t know SKIP TO SECTION 12 99 Refused SKIP TO SECTION 12
11B_2D (NEW)
[DISPLAY ONLY IF INTERVIEW IS BEING CONDUCTED BY LANGUAGE LINE (LANG_TYPE=3) ELSE CONTINUE TO 11B_3] INTERVIEWER: PLEASE ENTER THE LANGUAGE OF INTERVIEW BELOW.
ENTER LANGUAGE CONTINUE TO 11B_3

NORC | Covered California—Consumer Tracking Survey
FINAL REPORT | 180
11B_3 (NEW)
(ASK IF 11B_2B IN (1,2,3,4,5,6,7,8,9,10,11,12) OR 11B_2C=1) When you are at home, do you speak ... [READ RESPONSES] Cuando está en casa, ¿habla usted....
1 Only [FILL LANGUAGE FROM 11B_2B]
Sólo [FILL LANGUAGE FROM 11B_2B]
2 Mostly [FILL LANGUAGE FROM 11B_2B] Mayormente[FILL LANGUAGE FROM 11B_2B]
3 English and [FILL LANGUAGE FROM 11B_2B] Inglés y [FILL LANGUAGE FROM 11B_2B]
4 Mostly English Mayormente inglés
5 Only English Sólo inglés
77 DON’T KNOW 99 REFUSED
11B_4 (NEW)
(ASK IF 11B_2B IN (1,2,3,4,5,6,7,8,9,10,11,12) OR 11B_2C=1) Would you say you read [FILL LANGUAGE FROM 11B_2B] very well, well, a little, very little, or not at all? ¿Diría usted que lee [FILL LANGUAGE FROM 11B_2B] muy bien, bien, un poco, muy poco, o nada en absoluto?
1 VERY WELL 2 WELL 3 A LITTLE 4 VERY LITTLE 5 NOT AT ALL 77 DON’T KNOW 99 REFUSED
11B_5 (OLD 11.12)
(ASK IF 11B_2B IN (1,2,3,4,5,6,7,8,9,10,11,12) OR 11B_2C=1) Would you say you read English very well, well, a little, very little, or not at all? ¿Diría usted que lee inglés muy bien, bien, un poco, muy poco, o nada en absoluto?
1 VERY WELL 2 WELL 3 A LITTLE 4 VERY LITTLE 5 NOT AT ALL 77 DON’T KNOW 99 REFUSED

NORC | Covered California—Consumer Tracking Survey
FINAL REPORT | 181
11B_6 (NEW)
(ASK IF 11B_2B IN (1,2,3,4,5,6,7,8,9,10,11,12) OR 11B_2C=1) When you watch television, do you watch ... READ? Cuando usted ve la televisión, ¿ve usted ...
1 Only [FILL LANGUAGE FROM 11B_2B] language television
Sólo television en [FILL LANGUAGE FROM 11B_2B]
2 Mostly [FILL LANGUAGE FROM 11B_2B] language television Mayormente televisión en [FILL LANGUAGE FROM 11B_2B]
3 English and [FILL LANGUAGE FROM 11B_2B] television equally Igualmente televisión en inglés y en [FILL LANGUAGE FROM 11B_2B]
4 Mostly English language television Mayormente televisión en inglés
5 Only English language television Sólo televisión en inglés
6 VOL. DO NOT WATCH TELEVISION 77 DON’T KNOW 99 REFUSED
11B_7 (NEW)
[ASK ONLY IF INTERVIEW IS IN SPANISH OR IF RESPONDENT INDICATES THEY SPEAK SPANISH (IF 11B_2B =1 OR LANG_TYPE=2) What language do you use when you vote or fill out government forms ... READ? ¿Qué idioma usa usted cuando vota o llena formularios del gobierno ...?
1 Only [FILL LANGUAGE FROM 11B_2B]
Sólo [FILL LANGUAGE FROM 11B_2B]
2 Mostly [FILL LANGUAGE FROM 11B_2B] Mayormente [FILL LANGUAGE FROM 11B_2B]
3 English and [FILL LANGUAGE FROM 11B_2B] Inglés y [FILL LANGUAGE FROM 11B_2B]
4 Mostly English Mayormente inglés
5 Only English Sólo inglés
6 VOL. DO NOT VOTE OR FILL OUT GOVERNMENT FORMS 77 DON’T KNOW 99 REFUSED

NORC | Covered California—Consumer Tracking Survey
FINAL REPORT | 182

NORC | Covered California—Consumer Tracking Survey
FINAL REPORT | 183
Section 12. Classification Variables
12_0 ASK ONLY IF NECESSARY. Are you male or female? ASK ONLY IF NECESSARY: ¿Es usted hombre o mujer?
1 MALE 2 FEMALE 99 REFUSED
12_1 (OLD 2.1)
Are you currently employed, self-employed, retired, a full-time homemaker, a student, or unemployed? ¿Está usted actualmente empleado/a, trabaja por cuenta propia, está jubilado/a, es una ama de casa de tiempo completo, o es un/a estudiante o desempleado/a?
1 EMPLOYED BY SOMEONE ELSE CONTINUE 2 SELF-EMPLOYED (NOTE: INCLUDES
INDEPENDENT CONTRACTORS) CONTINUE
3 RETIRED SKIP TO Q12_2 4 FULL-TIME HOMEMAKER SKIP TO Q12_2 5 STUDENT SKIP TO Q12_2 6 UNEMPLOYED SKIP TO Q12_2 77 DON’T KNOW SKIP TO Q12_2 99 REFUSED SKIP TO Q12_2
12_1A (OLD 2.1A, MODIFIED)
Are you employed 30 hours per week or more OR less than 30 hours per week? ¿Está usted trabajando 30 horas a la semana o más, o menos de 30 horas a la semana?
1 30 HOURS PER WEEK OR MORE 2 LESS THAN 30 HOURS PER WEEK 3 VARIES 77 DON’T KNOW 99 REFUSED
12_2 (OLD 11.1)
In general, would you say your health is excellent, very good, good, fair, or poor? En general, ¿diría usted que su salud es excelente, muy buena, buena, regular o mala?
1 EXCELLENT 2 VERY GOOD 3 GOOD 4 FAIR 5 POOR 77 DON’T KNOW 99 REFUSED

NORC | Covered California—Consumer Tracking Survey
FINAL REPORT | 184
12_3 (OLD 11.2, MODIFIED)
Remember the family includes any children you claim as dependents on your income tax return whether they live with you full time or not. Do any of your family members have only fair or poor health? Recuerde que la familia incluye a cualquier niño/a que usted reclama como dependiente en su declaración de impuestos ya sea que viva con usted a tiempo completo o no. ¿Alguno de los miembros de su familia tiene salud regular o mala?
1 Yes 2 No 77 Don’t know 99 Refused
12_4 (OLD 11.3A MODIFIED)
Do you or any family members have a disability that limits activities? ¿Usted o algún miembro de la familia tiene una discapacidad que limita las actividades?
1 Yes 2 No 77 Don’t know 99 Refused
12_5 (OLD 11.3B MODIFIED)
Do you or any family members have a chronic or long-lasting condition? ¿Usted o algún miembro de la familia tiene una enfermedad crónica o de larga duración?
1 Yes 2 No 77 Don’t know 99 Refused
12_6 (OLD 11.4 MODIFIED)
Have you or or any family members ever been denied health care coverage because of a health problem or pre-existing condition? ¿A usted o a alguno de sus familiares le han negado alguna vez la cobertura de salud debido a un problema de salud o una condición preexistente? INTERVIEWER INSTRUCTION: A pre-existing condition is a health problem that someone has at the time of applying for insurance. INTERVIEWER INSTRUCTION: Una condición preexistente es un problema de salud que una persona tiene en el momento de aplicar para el seguro.
1 Yes 2 No 77 Don’t know 99 Refused

NORC | Covered California—Consumer Tracking Survey
FINAL REPORT | 185
12_7 (OLD 11.5)
What is the highest grade in school or year of college that you have completed? ¿Cuál es el grado más alto en la escuela o el año de universidad que usted ha completado?
1 NO SCHOOLING OR LESS THAN GRADE SCHOOL 2 GRADE/ELEMENTARY SCHOOL 3 SOME HIGH SCHOOL (DID NOT GRADUATE) 4 HIGH SCHOOL GRADUATE 5 VOCATIONAL OR TECHNICAL SCHOOL (NOT COLLEGE) 6 SOME COLLEGE 7 4-YEAR COLLEGE GRADUATE 8 POST-GRADUATE DEGREE 77 DON’T KNOW 99 REFUSED
Check Point: If RDD_NCCELL_CCELL IN (2,3) THEN ASK SL_LANDLINE, ELSE SKIP TO C11Q17_CELL
SL_LANDLINE The next few questions are about the telephones in your household. Las siguientes preguntas son acerca de los teléfonos de su hogar. Do you have a landline telephone in your household? ¿Tiene usted un teléfono fijo en su hogar? READ AS NECESSARY: Please do not include: - Modem-only lines, - Fax-only lines, - Lines used just for home security systems, - Beepers, - Skype - Pagers, or - Cell phones. READ AS NECESSARY Por favor no incluya: - Líneas sólo para Módem, - Líneas sólo de Fax, - Líneas utilizadas sólo para los sistemas de seguridad, - Beepers, - Skype - Buscapersonas, o - Los teléfonos celulares. Please include Voice Over I.P. or VOIP numbers. Por favor incluya Voz sobre I.P. o los números de VoIP.
1 Yes 2 No 77 Don’t Know 99 Refused

NORC | Covered California—Consumer Tracking Survey
FINAL REPORT | 186
C11Q15_CELL (MODIFIED)
[IF SL_LANDLINE NOT DISPLAYED, THEN DISPLAY: “The next few questions are about the telephones in your household.”] "Las siguientes preguntas son acerca de los teléfonos en su hogar."] In total, how many working cell phones do you and your family members have available for personal use? Please do not count cell phones that are used only for business purposes. En total, cuantos teléfonos celulares que funcionan tienen usted y los miembros de su familia disponibles para su uso personal? Por favor no incluya los teléfonos celulares que se utilizan sólo para fines comerciales. [If RDD_NCCELL_CCELL=2,3 and NEWPHONE_FLAG=0 then display: "Please include the number we called." ELSE If RDD_NCCELL_CCELL=2,3 and NEWPHONE_FLAG=1 then display: “Please include [OLD_NUMBER].” ] [If RDD_NCCELL_CCELL=2,3 y NEWPHONE_FLAG=0 entonces muestra: "Por favor incluya el número que llamamos." ELSE If RDD_NCCELL_CCELL=2,3 y NEWPHONE_FLAG=1 entonces muestra: “Por favor incluya [OLD_NUMBER].” ] [If RDD_NCCELL_CCELL=2,3 and NEWPHONE_FLAG=1 display "INTERVIEWER NOTE: THE NUMBER FOR THIS CASE WAS CHANGED BY THE RESPONDENT ON A PREVIOUS CALL.”] [If RDD_NCCELL_CCELL=2,3 y NEWPHONE_FLAG=1 muestra "INTERVIEWER NOTE: THE NUMBER FOR THIS CASE WAS CHANGED BY THE RESPONDENT ON A PREVIOUS CALL.”]
1 One 2 Two 3 Three or more 4 None GO TO C11Q16 77 Don’t Know 99 Refused
C11Q15_CELL_USUALLY
How many of these cell phones do the adults in this household usually use? ¿Cuántos de estos teléfonos celulares suelen utilizar los adultos en esta familia? [If RDD_NCCELL_CELL=2,3 and NEWPHONE_FLAG=0 then display: "Please include the number we called." ELSE If RDD_NCCELL_CCELL=2,3 and NEWPHONE_FLAG=1 then display “Please include [OLD_NUMBER].”] [If RDD_NCCELL_CCELL=2,3 y NEWPHONE_FLAG=0 entonces muestra: "Por favor incluya el número que llamamos." ELSE If RDD_NCCELL_CCELL=2,3 y NEWPHONE_FLAG=1 entonces muestra: “Por favor incluya [OLD_NUMBER].” ]

NORC | Covered California—Consumer Tracking Survey
FINAL REPORT | 187
[IF RDD_NCCELL_CELL=2,3 then display: "INTERVIEWER NOTE: THE NUMBER WE CALLED IS ASSUMED TO BE USUALLY USED, SO THE ANSWER MUST BE AT LEAST "ONE""] [If RDD_NCCELL_CCELL=2,3 and NEWPHONE_FLAG=1 display "INTERVIEWER NOTE: THE NUMBER FOR THIS CASE WAS CHANGED BY THE RESPONDENT ON A PREVIOUS CALL.]
1 ONE 2 TWO 3 THREE OR MORE 4 NONE 77 DON’T KNOW 99 REFUSED
Check Point: IF (RDD_NCCELL_CCELL=2,3 AND SL_LANDLINE=2) THEN SKIP TO 12.8; ELSE ASK C11Q16
C11Q16 Of all the telephone calls that you and your household receive, are nearly all received on cell phones, nearly all received on landline phones, or some received on cell phones and some received on landline phones? De todas las llamadas telefónicas que usted y su grupo familiar recibe, ¿reciben casi todas llamadas en los teléfonos celulares, reciben casi todas en teléfonos de línea fija o algunas se reciben en los teléfonos celulares y algunas se reciben en los teléfonos de línea fija?
1 NEARLY ALL RECEIVED ON CELL PHONES 2 NEARLY ALL RECEIVED ON LANDLINE PHONES 3 SOME RECEIVED ON CELL PHONES AND SOME ON LANDLINE PHONES 77 DON’T KNOW 99 REFUSED
12_8 (OLD 11.8)
What is your zip code? ¿Cuál es su código postal? ENTER 77777 FOR Don’t know ENTER 99999 FOR REFUSED
ENTER ZIP CODE ______ ENTER NUMBER ______
12_9 (OLD 11.8B)
In what county do you live? ¿En qué país vive usted? ENTER DK FOR DON’T KNOW ENTER REF FOR REFUSED
__________

NORC | Covered California—Consumer Tracking Survey
FINAL REPORT | 188
12_13 (NEW)
With which political party do you most strongly identify – Democratic or Republican? ¿Con qué partido político se identifica usted más fuertemente - demócrata o republicano?
1 DEMOCRAT ASKQ12_13A
2 REPUBLICAN ASK Q12_13A 3 VOL. TEA PARTY 4 VOL. LIBERTARIAN 5 VOL. OTHER 6 VOL. INDEPENDENT ASK Q12_13B 77 DON’T KNOW 99 REFUSED
12_13A (NEW)
Are you a strong or weak (Democrat/Republican)? ¿Se identifica usted fuertemente o no tan fuertemente como (Demócrata/Republicano/a)?
1 STRONG SKIP TO TERM 2 WEAK SKIP TO TERM 77 DON’T KNOW SKIP TO TERM 99 REFUSED SKIP TO TERM
12_13B (NEW)
Do you lean toward the Democratic or Republican Party? ¿Se inclina usted hacia el Partido Demócrata o Republicano?
1 DEMOCRATIC 2 REPUBLICAN 3 NEITHER/BOTH/INDEPENDENT 4 OTHER: SPECIFY 77 DON’T KNOW 99 REFUSED
TERM: Those are all the questions I have. Thank you for taking time to speak to me today. Esas son todas las preguntas que tengo. Gracias por tomarse el tiempo para hablar conmigo hoy.

NORC | Covered California—Consumer Tracking Survey
FINAL REPORT | 189
Answering Machine Scripts
MSG_FIRST (New cases): Hello, my name is ______. The state of California is conducting an important survey about how changes to the health insurance system may affect California residents and we’d like to ask your opinions. We are not selling anything. We’ll try to contact you again soon but please feel free to return our call anytime at 1-888-246-9504. MSG_FIRST: Hola, mi nombre es ______. El estado de California está llevando a cabo una importante encuesta acerca de cómo los cambios en el sistema de seguro de salud pueden afectar a los residentes de California y nos gustaría pedirle a usted sus opiniones. No estamos vendiendo nada. Vamos a tratar de ponernos en contacto con usted otra vez pronto, pero no dude en devolver nuestra llamada a cualquier hora al 1-888-246-9504. MSG_APPT (Missed appointment) Hello. The state of California is conducting an important survey about how changes to the health insurance system may affect California residents and we’d like to ask your opinions. I'm sorry that we've missed you. When we spoke previously about this important study, you requested that we call you back at this time. We'll try to contact you again soon but please feel free to return our call anytime at 1-888-246-9504. MSG_APPT Hola. El estado de California está llevando a cabo una importante encuesta acerca de cómo los cambios en el sistema de seguro de salud pueden afectar a los residentes de California y nos gustaría pedirle a usted sus opiniones. Lamento que no lo/a hayamos podido contactar. Cuando hablamos anteriormente acerca de este importante estudio, usted pidió que le devolviéramos la llamada en este momento. Vamos a tratar de ponernos en contacto con usted otra vez pronto, pero no dude en devolver nuestra llamada a cualquier hora al 1-888-246-9504. MSG_CB (Breakoffs): Hello. Recently you started a survey about how changes to the health insurance system may affect California residents. I'm sorry that we've missed you. We'll try to contact you again soon but please feel free to return our call anytime at 1-888-246-9504. MSG_CB: Hola. Recientemente usted comenzó una encuesta sobre cómo los cambios en el sistema de seguro de salud pueden afectar a los residentes de California. Lamento que no lo/a hayamos podido contactar. Lo contactaremos de pronto, pero no dude en devolver nuestra llamada a cualquier hora al 1-888-246-9504.

NORC | Covered California—Consumer Tracking Survey
FINAL REPORT | 190
Call-Back Scripts
INTRO_SCB (Screener breakoffs) Hello, my name is ____. Earlier, someone in your household started a survey about how changes in the health insurance system may affect California residents. I'm calling back now to continue the interview. Hola, mi nombre es ____. Anteriormente, alguien en su casa comenzó una encuesta sobre cómo los cambios en el sistema de seguro de salud pueden afectar a los residentes de California. Estoy llamando para continuar la entrevista ahora. INTRO_MCB (Main interview breakoffs) Hello, my name is ____. Earlier, someone in your household started a survey about how changes in the health insurance system may affect California residents. I'm calling back now to continue the interview. May I speak with [INSERT NAME IF AVAILABLE, ELSE FILL “the person who started that interview”]? INTRO_MCB Hola, mi nombre es ____. Anteriormente, alguien en su casa comenzó una encuesta sobre cómo los cambios en el sistema de seguro de salud pueden afectar a los residentes de California. Estoy llamando para continuar la entrevista ahora. ¿Podría hablar con [INSERT NAME IF AVAILABLE, ELSE FILL "la persona que inició la entrevista"]?

NORC | Covered California—Consumer Tracking Survey
FINAL REPORT | 191
Appendix C: Areas and Counties in California
Los Angeles County—Area 1
Los Angeles County
Other Southern California—Area 2
Imperial County
Orange County
Riverside County
San Bernardino County
San Diego County
San Luis Obispo County
Santa Barbara County
Ventura County
Central Valley—Area 3
Alpine County
Amador County
Calaveras County
El Dorado County
Fresno County
Inyo County
Kern County
Kings County
Madera County
Mariposa County
Merced County
Mono County
Sacramento County
San Benito County
San Joaquin County
Stanislaus County
Tulare County
Tuolumne County

NORC | Covered California—Consumer Tracking Survey
FINAL REPORT | 192
San Francisco Bay Area—Area 4
Alameda County
Contra Costa County
Marin County
Monterey County
Napa County
San Francisco County
San Mateo County
Santa Clara County
Santa Cruz County
Solano County
Sonoma County
Yolo County
Other Northern California—Area 5
Butte County
Colusa County
Del Norte County
Glenn County
Humboldt County
Lake County
Lassen County
Mendocino County
Modoc County
Nevada County
Placer County
Plumas County
Shasta County
Sierra County
Siskiyou County
Sutter County
Tehama County
Trinity County
Yuba County

NORC | Covered California—Consumer Tracking Survey
FINAL REPORT | 193
Appendix D: Additional Tables
Exhibit A.1: Aided Awareness of TV Advertisements (Among Those Not Reporting Bogus Ad)
Young woman
waiting for bus
Young man who
had a biking
accident
Family driving thru the state in a
car
Mother and sick
child, injured worker
People opening
doors
Man looking at medicine
Older woman
searching for insurance
(Bogus23 Ad)
All (n=1,989)24 21.3% 11.4% 15.6% 13.3% 23.8% 5.6% 14.3% (17.9%–24.7%) (9.0%–13.9%) (12.7%–18.4%) (10.7%–15.8%) (16.0%–31.6%) (0.0%–11.9%) (11.6%–17.0%)
Insurance Status (Screener)
Uninsured (n=934) 18.5% 8.2% 15.4% 12.2% 24.5% 1.8% 16.4% (14.1%–22.9%) (5.4%–11.0%) (11.4%–19.4%) (8.6%–15.7%) (16.1%–33.0%) (0.0%–5.0%) (12.3%–20.4%)
Insured, Covered CA (n=559) 29.5% 17.5% 20.4% 18.6% 22.1% 3.0% 13.3% (20.8%–38.1%) (10.4%–24.5%) (13.8%–27.1%) (12.2%–25.0%) (0.0%–46.7%) (0.0%–6.6%) (8.5%–18.0%)
Insured, non-Covered CA (n=496)
22.3% 14.9% 13.0% 12.3% 11.9% 14.5% 9.9% (15.9%–28.7%) (9.6%–20.1%) (7.9%–18.0%) (7.7%–16.9%) (0.0%–35.2%) (0.0%–34.4%) (5.9%–13.9%)
Age
18–34 (n=271) 18.9% 11.1% 12.2% 10.6% 20.2% 0.0% 11.9% (13.1%–24.6%) (6.6%–15.7%) (7.9%–16.6%) (6.3%–14.8%) (7.6%–32.9%) N.A. (7.5%–16.3%)
35–49 (n=582) 20.9% 9.7% 18.1% 14.5% 20.9% 10.0% 16.1% (15.7%–26.2%) (6.6%–12.8%) (12.9%–23.2%) (10.2%–18.7%) (9.5%–32.3%) (0.0%–22.8%) (11.5%–20.7%)
50–64 (n=1,136) 27.4% 15.3% 18.8% 17.2% 37.9% 5.7% 16.0% (21.8%–33.0%) (11.8%–18.9%) (13.9%–23.7%) (12.7%–21.7%) (21.5%–54.4%) (0.8%–10.6%) (11.8%–20.3%)
Race/Ethnicity
African American (n=170) 19.1% 16.1% 18.0% 17.1% 0.0% 0.0% 20.0% (9.5%–28.6%) (5.1%–27.2%) (5.9%–30.0%) (5.9%–28.3%) N.A. N.A. (10.7%–29.3%)
Hispanic (n=340) 20.5% 8.9% 16.8% 13.1% 24.0% 0.0% 19.5% (14.2%–26.7%) (4.9%–12.8%) (11.3%–22.2%) (7.9%–18.3%) (16.2%–31.8%) N.A. (14.1%–24.8%)
Asian/Pacific Islander (n=289) 14.7% 8.4% 13.2% 12.4% 0.0% 6.3% 9.6% (8.6%–20.9%) (1.9%–14.8%) (6.4%–20.1%) (6.1%–18.7%) N.A. (0.0%–14.1%) (4.3%–14.9%)
White/other (n=1,190) 23.8% 14.0% 15.0% 13.3% 0.0% 3.4% 10.2% (19.0%–28.5%) (10.3%–17.6%) (11.2%–18.8%) (10.2%–16.5%) N.A. (0.0%–10.1%) (7.0%–13.4%)
Language
Spanish (n=155) 18.0% 5.4% 15.7% 11.8% 20.6% 0.0% 22.7% (9.4%–26.6%) (0.3%–10.5%) (7.8%–23.6%) (4.5%–19.1%) (11.7%–29.6%) N.A. (14.8%–30.6%)
English (n=1,772) 22.5% 13.1% 15.8% 13.9% 30.1% 5.4% 12.3% (18.8% – 26.3%) (10.3% – 15.9%) (12.7% – 18.9%) (11.1% – 16.7%) (15.5% – 44.6%) (0.0% – 12.5%) (9.5% – 15.0%)
Other (n=62) 7.3% 7.4% 6.8% 4.4% 0.0% 6.8% 2.7% (0.0% – 15.4%) (0.0% – 16.8%) (0.0% – 18.5%) (0.0% – 10.6%) N.A. (0.0% – 17.8%) (0.0% – 5.5%)
23 Percentages for the “bogus” ad are based on all respondents.
24 The n’s for some the ads were less than the n for the whole sample. The ads exclusively targeted to non-English speakers were asked only of those who tended to media in the other languages.

NORC | Covered California—Consumer Tracking Survey
FINAL REPORT | 194
Knowledge About Covered California Additional Tables
Exhibit A.2: Knowledge of Covered California: Percentage with Correct Answers to the Statement (Statements with Highest Population Knowledge)
Variable Label
Pre-existing
condition Go to the website Penalty
Tax credit
Offers Only
Govm’t Plans
Welfare program
All (n=1,989) 82.8% 78.6% 75.2% 51.1% 44.9% 43.1%
(79.8% –
85.9%) (75.4% –
81.8%) (72.0% –
78.4%) (47.3% –
54.9%) (41.2% –
48.7%) (39.4% –
46.8%)
Survey Round
Wave 1 (n=1,989) 82.8% 78.6% 75.2% 51.1% 44.9% 43.1%
(79.8% –
85.9%) (75.4% –
81.8%) (72.0% –
78.4%) (47.3% –
54.9%) (41.2% –
48.7%) (39.4% –
46.8%)
Baseline (n=2,756) 58.6% 53.9% 52.7% 37.8% 26.8% 34.5%
(55.5% –
61.7%) (50.8% –
57.0%) (49.6% –
55.8%) (34.8% –
40.8%) (24.2% –
29.5%) (31.6% –
37.4%)
Insurance Status (Screener)
Uninsured (n=934) 77.3% 73.8% 77.3% 42.1% 34.5% 33.6%
(72.8% –
81.7%) (69.1% –
78.5%) (73.1% –
81.5%) (36.9% –
47.3%) (29.6% –
39.4%) (28.8% –
38.3%)
Insured, Covered CA (n=559) 92.5% 87.8% 81.5% 71.8% 63.9% 57.2%
(87.7% –
97.3%) (81.8% –
93.8%) (75.8% –
87.2%) (63.9% –
79.6%) (55.8% –
72.0%) (48.7% –
65.7%)
Insured, non-Covered CA (n=496)
90.0% 84.2% 66.2% 59.3% 57.5% 57.1% (84.9% –
95.0%) (79.0% –
89.4%) (59.2% –
73.1%) (52.3% –
66.3%) (50.5% –
64.6%) (50.0% –
64.3%)
Age
18–34 (n=271) 85.6% 82.1% 74.0% 46.8% 46.1% 43.4%
(80.6% –
90.5%) (76.7% –
87.6%) (68.0% –
79.9%) (39.9% –
53.6%) (39.3% –
53.0%) (36.7% –
50.2%)
35–49 (n=582) 79.8% 74.5% 78.4% 52.7% 45.1% 40.6%
(74.8% –
84.9%) (69.1% –
79.8%) (73.9% –
82.8%) (46.8% –
58.6%) (39.4% –
50.8%) (35.1% –
46.1%)
50–64 (n=1,136) 82.3% 78.4% 72.4% 57.6% 42.0% 47.0%
(77.1% –
87.6%) (73.7% –
83.2%) (67.6% –
77.1%) (52.1% –
63.0%) (37.1% –
46.9%) (41.8% –
52.3%)
Race/Ethnicity
African American (n=170) 74.5% 75.0% 69.1% 32.6% 53.4% 70.3%
(58.7% –
90.2%) (59.5% –
90.6%) (55.7% –
82.6%) (21.0% –
44.2%) (38.3% –
68.6%) (56.5% –
84.0%)
Hispanic (n=340) 78.9% 71.9% 80.3% 44.1% 27.1% 25.2%
(73.2% –
84.6%) (65.6% –
78.1%) (74.7% –
85.8%) (37.2% –
51.0%) (21.1% –
33.0%) (19.5% –
30.9%)
Asian/Pacific Islander (n=289) 82.7% 79.0% 67.8% 53.5% 51.5% 43.5%
(75.8% –
89.7%) (71.3% –
86.6%) (59.0% –
76.5%) (43.8% –
63.2%) (41.8% –
61.1%) (34.1% –
53.0%)
White/other (n=1,190) 87.2% 85.0% 73.1% 58.5% 58.8% 57.2%
(83.4% –
91.0%) (81.3% –
88.7%) (68.6% –
77.6%) (53.4% –
63.6%) (53.7% –
64.0%) (52.0% –
62.4%)
Language
Spanish (n=155) 73.7% 66.3% 87.6% 43.7% 15.0% 7.5%
(65.3% –
82.1%) (57.1% –
75.6%) (81.2% –
94.0%) (33.9% –
53.4%) (8.1% – 21.8%) (2.7% – 12.3%)
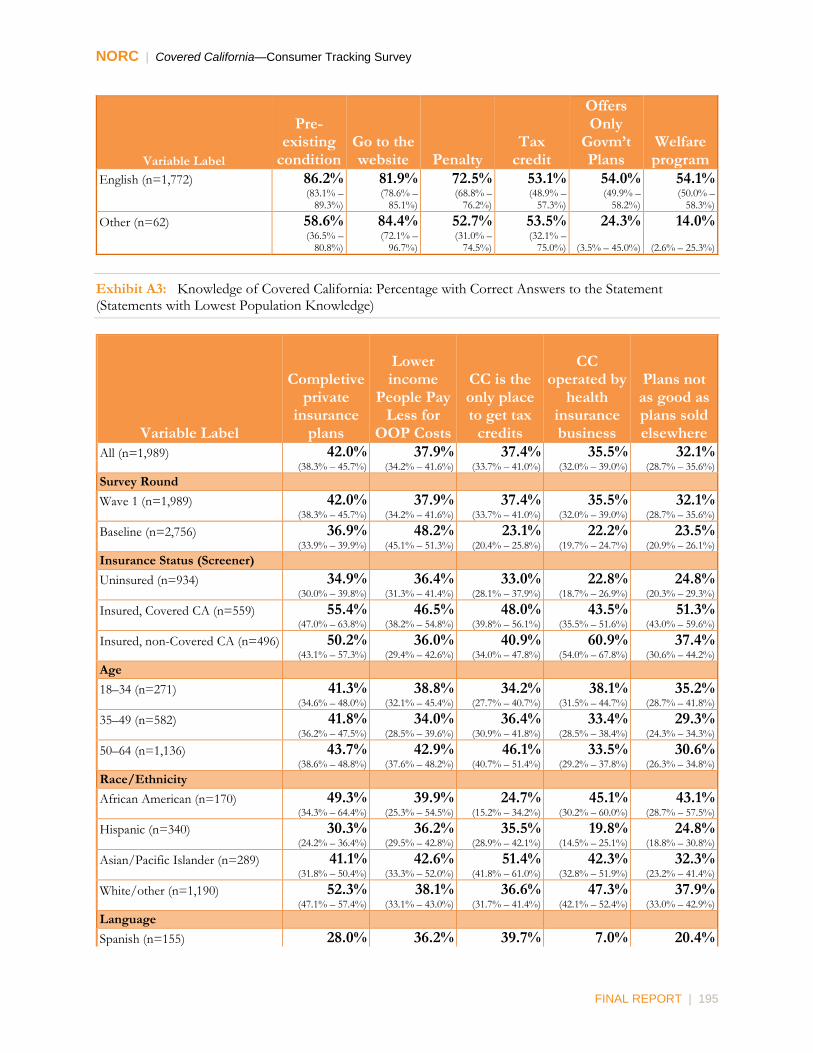
NORC | Covered California—Consumer Tracking Survey
FINAL REPORT | 195
Variable Label
Pre-existing
condition Go to the website Penalty
Tax credit
Offers Only
Govm’t Plans
Welfare program
English (n=1,772) 86.2% 81.9% 72.5% 53.1% 54.0% 54.1%
(83.1% –
89.3%) (78.6% –
85.1%) (68.8% –
76.2%) (48.9% –
57.3%) (49.9% –
58.2%) (50.0% –
58.3%)
Other (n=62) 58.6% 84.4% 52.7% 53.5% 24.3% 14.0%
(36.5% –
80.8%) (72.1% –
96.7%) (31.0% –
74.5%) (32.1% –
75.0%) (3.5% – 45.0%) (2.6% – 25.3%)
Exhibit A3: Knowledge of Covered California: Percentage with Correct Answers to the Statement (Statements with Lowest Population Knowledge)
Variable Label
Completive private
insurance plans
Lower income
People Pay Less for
OOP Costs
CC is the only place to get tax
credits
CC operated by
health insurance business
Plans not as good as plans sold elsewhere
All (n=1,989) 42.0% 37.9% 37.4% 35.5% 32.1% (38.3% – 45.7%) (34.2% – 41.6%) (33.7% – 41.0%) (32.0% – 39.0%) (28.7% – 35.6%)
Survey Round
Wave 1 (n=1,989) 42.0% 37.9% 37.4% 35.5% 32.1% (38.3% – 45.7%) (34.2% – 41.6%) (33.7% – 41.0%) (32.0% – 39.0%) (28.7% – 35.6%)
Baseline (n=2,756) 36.9% 48.2% 23.1% 22.2% 23.5% (33.9% – 39.9%) (45.1% – 51.3%) (20.4% – 25.8%) (19.7% – 24.7%) (20.9% – 26.1%)
Insurance Status (Screener)
Uninsured (n=934) 34.9% 36.4% 33.0% 22.8% 24.8% (30.0% – 39.8%) (31.3% – 41.4%) (28.1% – 37.9%) (18.7% – 26.9%) (20.3% – 29.3%)
Insured, Covered CA (n=559) 55.4% 46.5% 48.0% 43.5% 51.3% (47.0% – 63.8%) (38.2% – 54.8%) (39.8% – 56.1%) (35.5% – 51.6%) (43.0% – 59.6%)
Insured, non-Covered CA (n=496) 50.2% 36.0% 40.9% 60.9% 37.4% (43.1% – 57.3%) (29.4% – 42.6%) (34.0% – 47.8%) (54.0% – 67.8%) (30.6% – 44.2%)
Age
18–34 (n=271) 41.3% 38.8% 34.2% 38.1% 35.2% (34.6% – 48.0%) (32.1% – 45.4%) (27.7% – 40.7%) (31.5% – 44.7%) (28.7% – 41.8%)
35–49 (n=582) 41.8% 34.0% 36.4% 33.4% 29.3% (36.2% – 47.5%) (28.5% – 39.6%) (30.9% – 41.8%) (28.5% – 38.4%) (24.3% – 34.3%)
50–64 (n=1,136) 43.7% 42.9% 46.1% 33.5% 30.6% (38.6% – 48.8%) (37.6% – 48.2%) (40.7% – 51.4%) (29.2% – 37.8%) (26.3% – 34.8%)
Race/Ethnicity
African American (n=170) 49.3% 39.9% 24.7% 45.1% 43.1% (34.3% – 64.4%) (25.3% – 54.5%) (15.2% – 34.2%) (30.2% – 60.0%) (28.7% – 57.5%)
Hispanic (n=340) 30.3% 36.2% 35.5% 19.8% 24.8% (24.2% – 36.4%) (29.5% – 42.8%) (28.9% – 42.1%) (14.5% – 25.1%) (18.8% – 30.8%)
Asian/Pacific Islander (n=289) 41.1% 42.6% 51.4% 42.3% 32.3% (31.8% – 50.4%) (33.3% – 52.0%) (41.8% – 61.0%) (32.8% – 51.9%) (23.2% – 41.4%)
White/other (n=1,190) 52.3% 38.1% 36.6% 47.3% 37.9% (47.1% – 57.4%) (33.1% – 43.0%) (31.7% – 41.4%) (42.1% – 52.4%) (33.0% – 42.9%)
Language
Spanish (n=155) 28.0% 36.2% 39.7% 7.0% 20.4%

NORC | Covered California—Consumer Tracking Survey
FINAL REPORT | 196
Variable Label
Completive private
insurance plans
Lower income
People Pay Less for
OOP Costs
CC is the only place to get tax
credits
CC operated by
health insurance business
Plans not as good as plans sold elsewhere
(19.4% – 36.7%) (26.9% – 45.6%) (30.2% – 49.3%) (2.6% – 11.5%) (12.6% – 28.3%)
English (n=1,772) 46.5% 38.7% 35.9% 43.5% 35.9% (42.4% – 50.6%) (34.6% – 42.7%) (32.0% – 39.7%) (39.4% – 47.6%) (31.9% – 39.8%)
Other (n=62) 24.7% 28.5% 62.7% 34.5% 18.9% (8.4% – 41.1%) (13.7% – 43.3%) (42.7% – 82.7%) (12.5% – 56.4%) (4.1% – 33.8%)
Exhibit A.4: Purchase Status
Applied For But
Not Purchased Purchaser
Not Enrolled But Will
Not Enrolled But May
Will Not Enroll
All (n=1,989) 12.1% 18.6% 19.5% 23.4% 26.4% (9.7% – 14.6%) (15.9% – 21.3%) (16.1% – 22.8%) (19.9% – 26.9%) (23.1% – 29.7%)
Insurance Status (Screener)
Uninsured (n=934) 15.5% 8.8% 28.2% 30.0% 17.4% (11.8% – 19.2%) (6.1% – 11.6%) (23.2% – 33.3%) (24.9% – 35.0%) (13.4% – 21.4%)
Insured, Covered CA (n=559) 9.7% 73.8% 4.7% 5.3% 6.6% (4.6% – 14.8%) (65.7% – 81.8%) (1.2% – 8.1%) (0.1% – 10.5%) (1.9% – 11.4%)
Insured, non-Covered CA (n=496)
5.6% 5.4% 8.3% 19.6% 61.0% (3.0% – 8.2%) (2.1% – 8.8%) (3.6% – 13.0%) (13.3% – 26.0%) (53.7% – 68.4%)
Age
18–34 (n=271) 13.2% 14.0% 18.3% 29.8% 24.8% (8.7% – 17.6%) (9.5% – 18.5%) (12.8% – 23.8%) (23.3% – 36.3%) (18.7% – 30.8%)
35–49 (n=582) 10.2% 20.4% 22.4% 21.0% 26.0% (6.7% – 13.6%) (16.0% – 24.8%) (16.7% – 28.1%) (16.0% – 26.0%) (21.2% – 30.8%)
50–64 (n=1,136) 13.3% 25.4% 16.8% 13.6% 30.9% (9.7% – 17.0%) (20.9% – 29.9%) (11.7% – 21.8%) (9.4% – 17.8%) (26.3% – 35.5%)
Race/Ethnicity
African American (n=170) 14.7% 20.9% 23.7% 21.0% 19.8% (6.4% – 22.9%) (10.2% – 31.5%) (9.6% – 37.9%) (7.0% – 35.0%) (6.3% – 33.2%)
Hispanic (n=340) 12.1% 13.5% 31.7% 28.4% 14.3% (7.8% – 16.4%) (9.2% – 17.8%) (25.0% – 38.4%) (21.9% – 35.0%) (9.3% – 19.2%)
Asian/Pacific Islander (n=289) 15.3% 25.9% 17.9% 14.4% 26.5% (8.2% – 22.4%) (17.8% – 33.9%) (9.7% – 26.1%) (6.9% – 21.9%) (18.1% – 34.8%)
White/other (n=1,190) 11.1% 21.2% 8.4% 21.3% 38.0% (7.8% – 14.4%) (17.2% – 25.2%) (5.5% – 11.3%) (16.6% – 26.0%) (33.0% – 43.1%)
Language
Spanish (n=155) 10.6% 11.0% 42.1% 27.8% 8.5% (4.8% – 16.5%) (5.1% – 16.9%) (32.1% – 52.1%) (18.8% – 36.8%) (3.0% – 14.0%)
English (n=1,772) 12.6% 20.2% 12.6% 22.8% 31.8% (9.8% – 15.3%) (17.1% – 23.2%) (9.7% – 15.5%) (19.0% – 26.7%) (27.9% – 35.7%)
Other (n=62) 10.8% 32.9% 39.6% 2.9% 13.8% (1.5% – 20.1%) (11.8% – 53.9%) (16.6% – 62.6%) (0.0% – 5.8%) (0.0% – 28.3%)

NORC | Covered California—Consumer Tracking Survey
FINAL REPORT | 197
Exhibit A.5: Purchase Status
Applied For But
Not Purchased Purchaser
Not Enrolled But Will
Not Enrolled But May
Will Not Enroll
All (n=1,989) 12.1% 18.6% 19.5% 23.4% 26.4% (9.7% – 14.6%) (15.9% – 21.3%) (16.1% – 22.8%) (19.9% – 26.9%) (23.1% – 29.7%)
Gender
Male (n=865) 10.1% 16.9% 21.5% 24.4% 27.0% (6.9% – 13.4%) (13.1% – 20.8%) (16.4% – 26.6%) (19.2% – 29.6%) (22.2% – 31.8%)
Female (n=1,124) 14.2% 20.3% 17.3% 22.3% 25.9% (10.6% – 17.8%) (16.5% – 24.1%) (13.1% – 21.6%) (17.6% – 27.0%) (21.3% – 30.4%)
Region
LA County (n=506) 7.9% 16.3% 21.2% 25.6% 29.0% (4.8% – 10.9%) (11.5% – 21.1%) (14.7% – 27.8%) (18.6% – 32.6%) (22.4% – 35.7%)
Other Southern CA (n=528) 15.0% 13.8% 23.3% 23.0% 24.8% (9.7% – 20.4%) (9.7% – 17.9%) (16.9% – 29.7%) (16.8% – 29.3%) (18.9% – 30.8%)
Central Valley (n=258) 14.7% 16.9% 21.7% 25.0% 21.6% (7.5% – 21.9%) (9.6% – 24.3%) (11.7% – 31.8%) (14.5% – 35.5%) (13.2% – 30.0%)
SF Bay Area (n=507) 11.3% 31.4% 13.0% 20.3% 24.0% (6.5% – 16.1%) (23.9% – 38.8%) (7.2% – 18.9%) (13.5% – 27.2%) (17.8% – 30.1%)
Other Northern CA (n=136) 10.9% 13.6% 5.6% 26.9% 43.0% (3.9% – 17.9%) (6.6% – 20.5%) (0.4% – 10.8%) (10.9% – 43.0%) (26.1% – 59.9%)
Income (Non-Purchasers)
400+ FPL (n=473) 10.2% 0.0% 11.7% 16.1% 62.1% (5.0% – 15.4%) N.A. (5.5% – 17.8%) (10.3% – 21.9%) (54.1% – 70.0%)
200–399 FPL (n=491) 13.4% 0.0% 33.0% 31.8% 21.9% (9.2% – 17.6%) N.A. (25.9% – 40.0%) (24.7% – 38.8%) (16.1% – 27.6%)
139–199 FPL (n=191) 16.4% 0.0% 27.6% 39.2% 16.8% (8.8% – 23.9%) N.A. (17.2% – 38.1%) (27.7% – 50.6%) (8.1% – 25.5%)
100–138 FPL (n=153) 27.8% 0.0% 16.6% 35.6% 20.0% (16.4% – 39.1%) N.A. (8.3% – 25.0%) (23.2% – 48.0%) (10.6% – 29.3%)
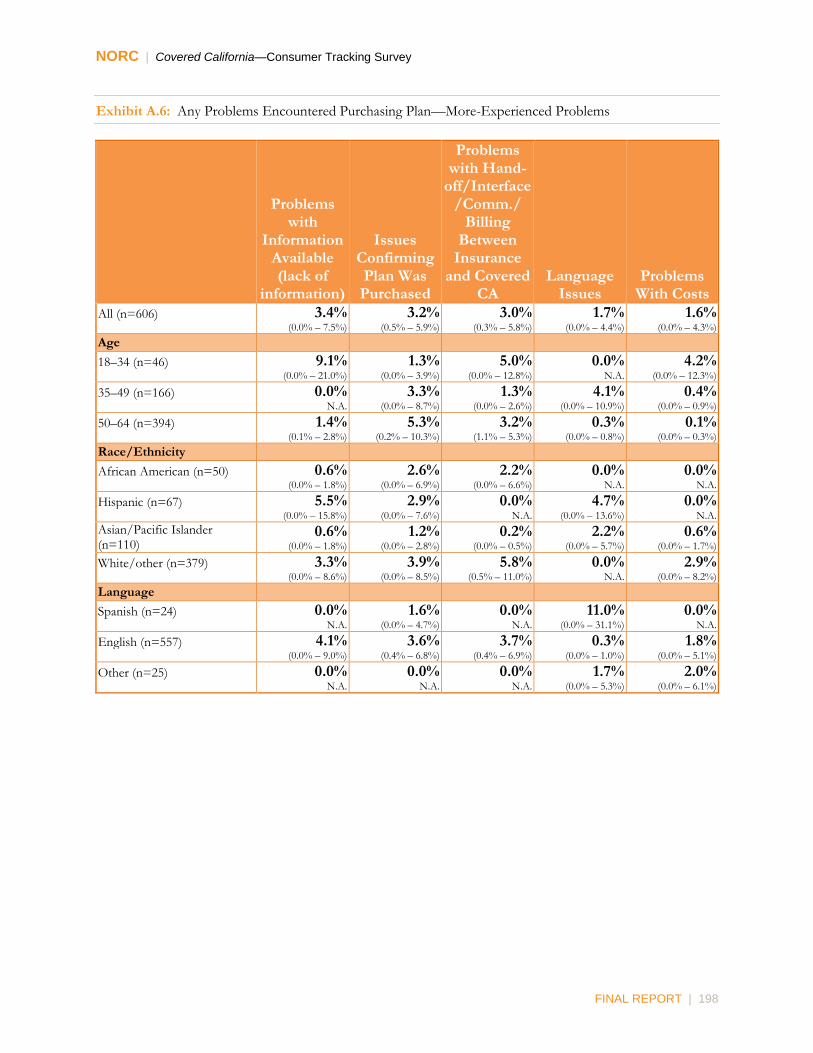
NORC | Covered California—Consumer Tracking Survey
FINAL REPORT | 198
Exhibit A.6: Any Problems Encountered Purchasing Plan—More-Experienced Problems
Problems with
Information Available (lack of
information)
Issues Confirming Plan Was Purchased
Problems with Hand-
off/Interface/Comm./
Billing Between
Insurance and Covered
CA Language
Issues Problems
With Costs
All (n=606) 3.4% 3.2% 3.0% 1.7% 1.6% (0.0% – 7.5%) (0.5% – 5.9%) (0.3% – 5.8%) (0.0% – 4.4%) (0.0% – 4.3%)
Age
18–34 (n=46) 9.1% 1.3% 5.0% 0.0% 4.2% (0.0% – 21.0%) (0.0% – 3.9%) (0.0% – 12.8%) N.A. (0.0% – 12.3%)
35–49 (n=166) 0.0% 3.3% 1.3% 4.1% 0.4% N.A. (0.0% – 8.7%) (0.0% – 2.6%) (0.0% – 10.9%) (0.0% – 0.9%)
50–64 (n=394) 1.4% 5.3% 3.2% 0.3% 0.1% (0.1% – 2.8%) (0.2% – 10.3%) (1.1% – 5.3%) (0.0% – 0.8%) (0.0% – 0.3%)
Race/Ethnicity
African American (n=50) 0.6% 2.6% 2.2% 0.0% 0.0% (0.0% – 1.8%) (0.0% – 6.9%) (0.0% – 6.6%) N.A. N.A.
Hispanic (n=67) 5.5% 2.9% 0.0% 4.7% 0.0% (0.0% – 15.8%) (0.0% – 7.6%) N.A. (0.0% – 13.6%) N.A.
Asian/Pacific Islander (n=110)
0.6% 1.2% 0.2% 2.2% 0.6% (0.0% – 1.8%) (0.0% – 2.8%) (0.0% – 0.5%) (0.0% – 5.7%) (0.0% – 1.7%)
White/other (n=379) 3.3% 3.9% 5.8% 0.0% 2.9% (0.0% – 8.6%) (0.0% – 8.5%) (0.5% – 11.0%) N.A. (0.0% – 8.2%)
Language
Spanish (n=24) 0.0% 1.6% 0.0% 11.0% 0.0% N.A. (0.0% – 4.7%) N.A. (0.0% – 31.1%) N.A.
English (n=557) 4.1% 3.6% 3.7% 0.3% 1.8% (0.0% – 9.0%) (0.4% – 6.8%) (0.4% – 6.9%) (0.0% – 1.0%) (0.0% – 5.1%)
Other (n=25) 0.0% 0.0% 0.0% 1.7% 2.0% N.A. N.A. N.A. (0.0% – 5.3%) (0.0% – 6.1%)

NORC | Covered California—Consumer Tracking Survey
FINAL REPORT | 199
Exhibit A.7: Any Problems Encountered Purchasing Plan—Least-Experienced Problems
Privacy/ Security
Concerns
Length of Time it Took
Problems with
Coverage of Plans
Eligibility for Plans
Cancellation of Existing
Plan
All (n=606) 1.4% 0.9% 0.2% 0.1% 0.0% (0.0% – 4.0%) (0.1% – 1.7%) (0.0% – 0.4%) (0.0% – 0.2%) (0.0% – 0.1%)
Age
18–34 (n=46) 0.0% 0.0% 0.0% 0.0% 0.0% N.A. N.A. N.A. N.A. N.A.
35–49 (n=166) 3.5% 0.7% 0.0% 0.0% 0.0% (0.0% – 10.1%) (0.0% – 2.2%) N.A. N.A. N.A.
50–64 (n=394) 0.0% 2.2% 0.7% 0.4% 0.1% N.A. (0.1% – 4.3%) (0.0% – 1.5%) (0.0% – 0.8%) (0.0% – 0.3%)
Race/Ethnicity
African American (n=50) 0.0% 0.7% 0.0% 0.0% 0.0% N.A. (0.0% – 2.2%) N.A. N.A. N.A.
Hispanic (n=67) 4.7% 1.1% 0.2% 0.0% 0.0% (0.0% – 13.6%) (0.0% – 2.8%) (0.0% – 0.7%) N.A. N.A.
Asian/Pacific Islander (n=110) 0.0% 0.6% 0.0% 0.0% 0.0% N.A. (0.0% – 1.7%) N.A. N.A. N.A.
White/other (n=379) 0.0% 0.9% 0.3% 0.2% 0.1% N.A. (0.0% – 2.0%) (0.0% – 0.6%) (0.0% – 0.4%) (0.0% – 0.2%)
Language
Spanish (n=24) 11.0% 2.0% 0.2% 0.0% 0.0% (0.0% – 31.1%) (0.0% – 6.1%) (0.0% – 0.7%) N.A. N.A.
English (n=557) 0.0% 0.7% 0.2% 0.1% 0.0% N.A. (0.0% – 1.5%) (0.0% – 0.4%) (0.0% – 0.3%) (0.0% – 0.1%)
Other (n=25) 0.0% 1.3% 0.0% 0.0% 0.0% N.A. (0.0% – 3.3%) N.A. N.A. N.A.

NORC | Covered California—Consumer Tracking Survey
FINAL REPORT | 200
Exhibit A.8: Purchase Assistance
Received Help Completing Application
Recommended Covered California
All (n=606) 55.5% 60.4% (47.8% – 63.3%) (52.6% – 68.3%)
Age
18–34 (n=46) 36.3% 66.1% (19.7% – 52.9%) (49.4% – 82.9%)
35–49 (n=166) 65.0% 58.9% (54.4% – 75.5%) (47.0% – 70.8%)
50–64 (n=394) 65.2% 55.7% (55.8% – 74.5%) (45.4% – 65.9%)
Race/Ethnicity
African American (n=50) 46.5% 54.4% (20.8% – 72.3%) (26.7% – 82.1%)
Hispanic (n=67) 72.5% 61.6% (58.4% – 86.7%) (44.9% – 78.2%)
Asian/Pacific Islander (n=110) 72.7% 67.3% (56.7% – 88.6%) (52.1% – 82.5%)
White/other (n=379) 41.1% 58.1% (31.4% – 50.9%) (47.5% – 68.8%)
Language
Spanish (n=24) 92.4% 56.5% (78.1% – 100.0%) (28.5% – 84.4%)
English (n=557) 47.7% 60.7% (39.7% – 55.8%) (52.5% – 69.0%)
Other (n=25) 97.8% 65.8% (94.2% – 100.0%) (35.3% – 96.3%)