Embed Size (px)
Citation preview

CREATE
Performance Analysis System for
Colleges of Education
Center for Research, Evaluation and Advancement of Teacher Education
www.createtx.org
August, 2008
An Introduction to the
PACE System:
Year 2 Angelo State University

CREATE
Performance Analysis System for
Colleges of Education
August, 2008
An Introduction to the
PACE System:
PACE Committee Members
Mona Wineburg William E. Reaves John Beck Sherri Lowrey Robert Cox Ed Fuller
Year 2

CREATE COORDINATING COMMITTEE
Kenneth R. Craycraft, Chairman Vice Chancellor for Academic Affairs
The Texas State University System
Frank Ashley III Vice Chancellor for Academic Affairs The Texas A&M University System
Jerald Strickland
Interim Sr. Vice Chancellor for Academic Affairs The University of Houston System
Pedro Reyes Associate Vice Chancellor for Academic Affairs
The University of Texas System
Mona S. Wineburg Executive Director
CREATE
CREATE ADVISORY COUNCIL
Lois Adams-Rogers
Chief Operating Officer Council of Chief State School Officers
Michael Hinojosa Superintendent
Dallas Independent School District
Genevieve Brown Dean, College of Education
Sam Houston State University
Lynn House Assistant Commissioner
Mississippi Institutions of Higher Learning
Jill Burk Dean, College of Education Tarleton State University
Sabrina Laine Director, National Comprehensive Center for
Teacher Quality
Jeanne Burns Associate Commissioner for Teacher Initiatives
Governor’s Office of Education / Louisiana Board of Regents
Linda Mora Deputy Superintendent for Curriculum & Instruction
Northside Independent School District
Charles Coble The Third Mile Group, LLC
Nancy Pelz-Paget Director of Education Grants
Aspen Institute
Ed Crowe Principal Investigator
Carnegie Corporation of New York
Rosanne Stripling Vice President for Academic Affairs Texas A&M University - Texarkana
Jeanne Gerlach
Dean, College of Education The University of Texas at Arlington
Johnny Veselka Executive Director
Texas Association of School Administrators
Humberto Gonzalez Dean, College of Education
Texas A&M International University
Jo Ann Wheeler Managing Director, Product Development
Region 4 Education Service Center
Robert Wimpelberg Dean, College of Education
University of Houston
i
TABLE OF CONTENTS
Performance Analysis for Colleges of Education (PACE)
Overview Purpose and Objectives of PACE ..............................................................................................1 CREATE Assumptions about the Professional Influence and Impact of Colleges of Education ...................................................................................................................................3 The Proximal Zone of Professional Impact (PZPI): A Contextual Framework for Assessing Long-Term Influence and Impact of Colleges of Education ....................................4 Data Sets Used in the PACE Report ..........................................................................................5 How to Use and Apply the PACE Report..................................................................................6 PACE Reports I. Educational Trends in My University’s Proximal Zone of
Professional Impact A. Descriptive Reports on the Characteristics of Schools in the Proximal Zone of
Professional Impact ..................................................................................................7
A.1. Summary of Public School Enrollment in Proximal Zone of Professional Impact ................................................................................................................9
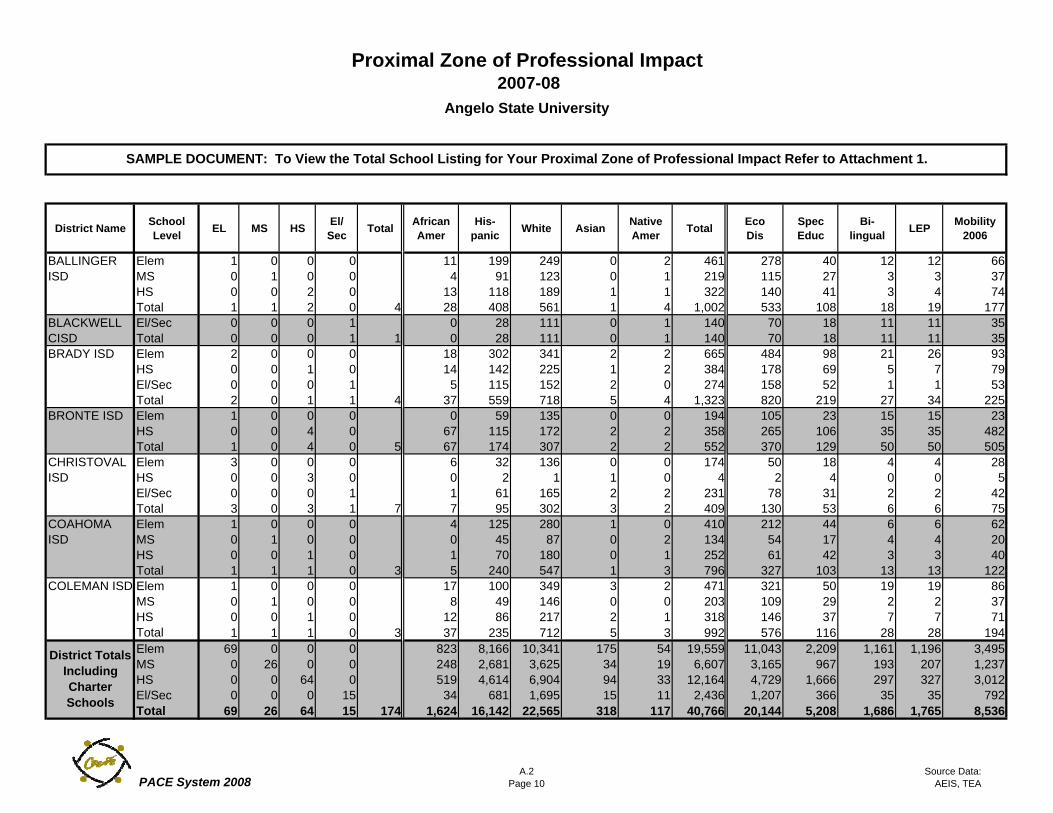
A.2. Public School Enrollment by District in the Proximal Zone of Professional Impact (Sample)...............................................................................................10
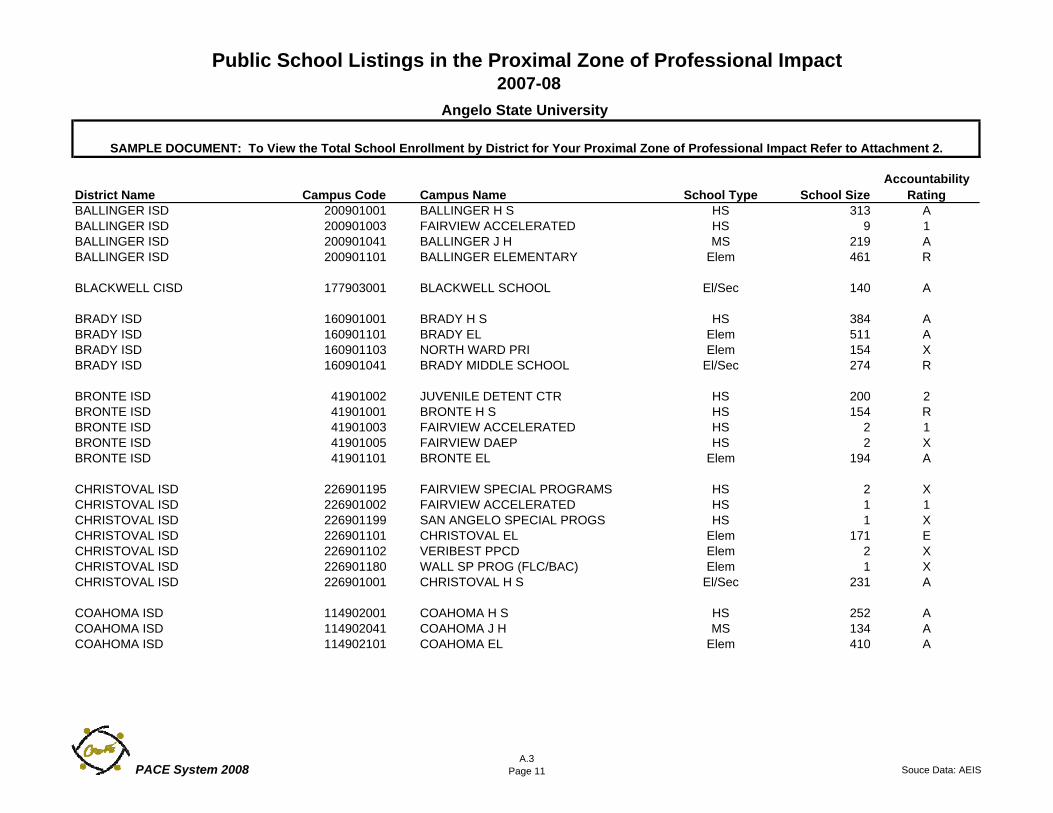
A.3. School Listing in the Proximal Zone of Professional Impact (Sample) ..........11
B. Educational Trend Reports on Schools in the Proximal Zone of Professional Impact ......................................................................................................................12
B.1. Student Enrollment Trends in Proximal Zone of Professional Impact ............14
B.2. Student Achievement Trends in Proximal Zone of Professional Impact
B.2.a. Percentage Passing Mathematics TAKS, 2004-2007 ..........................16
B.2.b. Percentage Passing English Language Arts/Reading TAKS, 2004-2007 ............................................................................................17
ii
B.2.c. Variability of TAKS Achievement Rates by Ethnicity
Figure 1: Variability in TAKS Achievement Rates in High School Mathematics by Ethnicity....................................................18
Figure 2: Variability in TAKS Achievement Rates in Middle School Mathematics by Ethnicity....................................................19
Figure 3: Variability in TAKS Achievement Rates in Elementary School Mathematics by Ethnicity........................................20
Figure 4: Variability in TAKS Achievement Rates in High School Language Arts/Reading by Ethnicity ..................................21
Figure 5: Variability in TAKS Achievement Rates in Middle School Language Arts/Reading by Ethnicity ..................................22
Figure 6: Variability in TAKS Achievement Rates in Elementary School Language Arts/Reading by Ethnicity ......................23
B.2.d. Highest- and Lowest-Achieving Schools in Mathematics by Level
Chart 1: 30 Highest-Achieving High Schools in Mathematics .........24
Chart 2: 30 Lowest-Achieving High Schools in Mathematics..........25
Chart 3: 30 Highest-Achieving Middle Schools in Mathematics......26
Chart 4: 30 Lowest-Achieving Middle Schools in Mathematics ......27
Chart 5: 30 Highest-Achieving Elementary Schools in Mathematics ........................................................................28
Chart 6: 30 Lowest-Achieving Elementary Schools in Mathematics ........................................................................29
B.2.e. Highest and Lowest Achieving Schools in Reading by Level
Chart 1: 30 Highest-Achieving High Schools in Reading ................30
Chart 2: 30 Lowest-Achieving High Schools in Reading .................31
Chart 3: 30 Highest-Achieving Middle Schools in Reading.............32
Chart 4: 30 Lowest-Achieving Middle Schools in Reading..............33
Chart 5: 30 Highest-Achieving Elementary Schools in Reading ......34
Chart 6: 30 Lowest-Achieving Elementary Schools in Reading.......35
II. University and Teacher Education Trends
C. University and Teacher Production Reports........................................................36
C.1. Five-Year University Production Trends.........................................................37
C.2. Teacher Production Trends for University Completers ...................................38
C.3. Other Producers of Teachers in Proximal Zone of Professional Impact .........39
iii
C.4. Initial Certification Production by Level .........................................................40
C.5. Teacher Production by Race/Ethnicity ............................................................41
D. Professional Impact Trend Reports ......................................................................42
D.1. Teacher Supply and Demand in the Proximal Zone of Professional Impact
Chart 1: High School .....................................................................................43
Chart 2: Middle School .................................................................................44
Chart 3: Elementary School ..........................................................................45
D.2. Percentage of Newly-Certified Teachers Employed Inside and Outside the Proximal Zone of Professional Impact ............................................................46
D.3. Percentage of University-Prepared Teachers Employed in PZPI Districts .....47
D.4. Concentration of University Completers in Proximal Zone of Professional Impact
D.4.a. High School .........................................................................................48
D.4.b. Middle School......................................................................................49
D.4.c. Elementary School ...............................................................................50
D.5. Comparison of Teacher Retention Trends
D.5.a. Five-Year Retention of 2003 Certification Cohort ..............................51
D.5.b. Five-Year Retention of 2003 Certification Cohort by School Level
Figure 1: High School .......................................................................52
Figure 2: Middle School....................................................................53
Figure 3: Elementary School .............................................................54
III. University Benchmarks to Guide Improvement
E. Comparison Reports of Teacher Production .......................................................55
E.1. Comparison of Teacher Production in Nearby Geographic Area....................56
E.2. Five-Year Production Ratios ...........................................................................57
E.3. Comparison of Longitudinal Certificate Production Trends Between Target University and Other Universities ...................................................................59
E.4. Comparison of Newly-Certified Teachers Employed Inside and Outside the Proximal Zone of Professional Impact in Nearby Geographic Area...............60
E.5. Teacher Retention Comparison Among Universities in Same Geographic Area..............................................................................................61
Information Regarding Data Validation and Data Requests....................................................62

iv
IV. Attachments Attachment 1: Public School Enrollment by District in the Proximal Zone of
Professional Impact
Attachment 2: Individual School Listing in the Proximal Zone of Professional Impact

PACE 2008 1
PERFOMANCE ANALYSIS SYSTEM FOR COLLEGES OF EDUCATION
(PACE)
Purpose and Objectives of PACE As a consortium of universities devoted to on-going analysis and continuous quality improvement of university-based teacher preparation, the Center for Research, Evaluation and Advancement of Teacher Education (CREATE) seeks to develop planning and information systems that can assist universities in professional analysis of their teacher preparation initiatives, particularly as these practices relate to long-term teacher influence and effect. The preparation of effective teachers for Texas public schools is of paramount importance in assuring sound economic footing and an enhanced quality of life for all Texans. To this end, university-based teacher preparation is of great public significance in the state, worthy of careful attention, and an important subject of continuous quality improvement. PACE is offered in support of the teacher preparation programs associated with the CREATE consortium. PACE presents a useful reporting system for universities and their Colleges of Education centered on public schools. Reports are intended to be used as a planning and resource tool that can assist teacher education leaders in assessing needs, targeting refinements in their preparation programs, and evaluating organizational effects over time. PACE reports are intended to address the following objectives:
1. Present a system which describes and charts a Proximal Zone of Professional Impact (PZPI) for each CREATE institution, within which to consider long-term program interventions and measure effectiveness of university teacher preparation programs.
2. Provide a school-centered tool that can assist in the continuous quality improvement of university-based teacher preparation programs.
3. Provide information that will enable university and school leaders to track long-term trends related to public school teaching and learning in their immediate area.
4. Provide information that will enable university and school leaders to track long term teacher production trends in relation to regional demand.
5. Supply a structured format which will enable university and public school leaders to engage in systematic analysis of achievement and staffing patterns in their immediate vicinity.
PACE 2008 2
As an information system, the PACE reports are a work in progress and subject to continuous quality improvement. For Year 2, the core reports have been retained but refined. New reports have been added in response to requests by constituents for additional information. While these reports offer a “core” data set that can assist all consortium members in establishing a school-centered planning focus, these PACE data must be augmented with local program information in order to thoroughly answer critical evaluation questions about each institution’s teacher preparation programs. In this regard, PACE is offered as a common data platform that will hopefully encourage expanded “mining” efforts related to local university information systems in order to inform improved teacher preparation practices at the campus and regional level. It is also important to note that PACE reports are derived from Texas state data sources. Large files of this size and scope are always subject to variability and standard degree of error. To this end, it is imperative that PACE users verify and authenticate these reported institutional data prior to final analysis and interpretation. In efforts to refine the data, CREATE staff stand ready to assist in clarifying questions or issues regarding data quality. Further details on the procedures to follow to contact CREATE regarding data errors, questions, and further data requests can be found on the last page of this report.

PACE 2008 3
CREATE Assumptions About the Professional Influence and Impact of Colleges of Education
The PACE system is based upon key assumptions that are central to CREATE’s mission and program of work. CREATE assumes the following with regard to the professional influence and impact of Colleges of Education.
A. Colleges of Education are an integral component of a system of public education and, as such, have a professional obligation to contribute to the continuous quality improvement of public school teaching and student learning.
B. Colleges of Education can and do influence continuous quality improvement of
public school teaching and student learning through their core functions of: a. teacher preparation, b. research and development, and c. service to the profession.
C. To optimize professional influence, Colleges of Education leaders must regularly
assess the status of public school teaching and student learning, and based upon identified needs, work with their public school partners to develop and implement program interventions that support measured improvement over time.
D. The College of Education’s long-term effects on public school teaching and
student learning can best be assessed through: 1) on-going analysis of the College’s teacher production, placement and retention trends; 2) faculty and graduate student research and development activities; and 3) faculty and staff service to the local profession as implemented in a Proximal Zone of Professional Impact (PZPI).
E. Faculty involvement in planning, implementing and/or assessing educational interventions in the PZPI should be actively encouraged within every College of Education, and faculty participation should be awarded paramount weight in the university’s tenure and promotion criteria.
PACE 2008 4
The Proximal Zone of Professional Impact (PZPI): A Contextual Framework for Assessing Long-Term Influence and
Impact of Colleges of Education To facilitate consistent long-term assessment of institutional impact, and afford comparative analysis, CREATE has established a Proximal Zone of Professional Impact (PZPI) for CREATE institutions. The Proximal Zone of Professional Impact is comprised of the university and all school districts and campuses within a seventy-five mile radius. This proximal zone describes a “P-16” professional community in the immediate vicinity of each university, and provides each College of Education a professional laboratory setting in which to collaboratively design and implement program improvements over time and to gauge their long-term success. While this Proximal Zone of Professional Impact does not convey the complete impact scenario of the university’s teacher preparation programs, it does provide a common and consistent setting in which the university may measure program effects over time. From CREATE’s perspective, the PZPI offers the following advantages:
A. It presents a useful frame of reference for Colleges of Education to utilize in assessing teaching and learning trends over time in the particular geographic area nearest their institution.
B. It provides Colleges of Education a field laboratory for research and development
activities related to planned instructional interventions. C. It establishes parameters of a professional community that are consistently
defined across the CREATE consortium, enabling long-term program benchmarking and institutional comparisons.
D. It provides geographic boundaries that correlate to the university’s primary
admission centers.
E. It affords a structure for long-term regional networking and professional partnerships among public and higher education institutions in the zone.
PACE 2008 5
Data Sets Used in the PACE Report These analyses are based on five data sets, three of which are available to the public through the Texas Education Agency (TEA). Teacher Certification Data Set. This data set, provided by TEA, includes each Texas teaching certificate obtained by a qualified applicant as well as the date the individual received the teaching certificate. The data matches individuals to the program recommending certification and is available from 1994 through the current year. These data do not distinguish between middle and high school certificates, but do differentiate elementary and secondary certificates. The data include the race/ethnicity, gender, and age of each individual. Finally, the Teacher Certification Data Set is a dynamic data set in that changes are made on a daily basis. The TEA staff is constantly updating and refining errors in the data set. Thus, any analysis based on a Teacher Certification Data Set purchased in May of 2008 will likely differ somewhat from an analysis based on a data set purchased in July of 2008. Teacher Assignment Data Set. This data set provided by TEA includes the specific course and subject area assignments by percentage of full-time equivalent (FTE) for every teacher of record in every Texas public school. The data matches each teacher to the district and school or schools in which he or she teaches. The data set is available from the mid-1980s to the current year. The Teacher Assignment Data Set for each academic year is made available in March of that academic year. Academic Excellence Indicator System (AEIS). This data is available from the TEA website and includes data on students, staff, finances, accountability ratings, test scores, and non-test score information related to student achievement and drop outs. The data is available for every public school in Texas since 1993. Newly created schools are not included in the system until at least one year after they have opened. Texas Higher Education Accountability System. This data is used to track performance on critical measures that exemplify higher education institutions' missions. An interactive website (http://www.txhighereddata.org/Interactive/Accountability/) provides information related to four success goals of the Texas Higher Education Closing the Gaps plan. The goals call for closing the gaps within Texas in four areas: student participation, student success, excellence, and research. Mathematics, biological sciences, and physical science degree awards was downloaded from the THECB Prep Online site (http://www.txhighereddata.org/Interactive/PREP_New/). Proximal Zone of Professional Impact (PZPI). This data set contains a list of the schools and districts within a 75-mile radius from each teacher preparation program associated with CREATE. The data set was produced by CREATE and simply indicates whether a district and school is in a preparation program’s Proximal Zone of Professional Impact.
PACE 2008 6
How to Use and Apply The PACE Report PACE is intended as a tool to assist universities, their Colleges of Education, and their leadership team in analyzing teaching and learning trends within their institutions and within the public schools of the surrounding area. PACE offers a structure to monitor and gauge long-term professional improvement. The data included in this report are important, therefore, only to the degree that each university will choose to address them in a systematic and continuous manner, and organize mechanisms within their own institutions to apply these analyses for the on-going refinement of their own teacher preparation program, as well as other educational programs. Based on this intended use, we recommend the following actions associated with the PACE reports:
1. Organize and empower a teacher preparation leadership team which includes both university and public school partners (a standing work committee) to analyze and interpret these data as well as recommend organizational improvements based on the needs identified. (Where possible, we suggest you might provide the leadership team access to graduate student support to facilitate the work).
2. Verify and validate the state data sets to be certain that they are relatively consistent with comparable data reported by your university. Extend and augment these data with university data bases and programmatic information available only at your institution.
3. Develop an institutional report which identifies regional teaching and learning needs. Disseminate this report extensively within and outside the institution.
4. Plan, implement and evaluate program improvements intended to address regional teaching and learning needs. Encourage experimental research and development projects based on these planned interventions.
5. Build regional collaboratives based on the needs identified and the organizational interventions pursued.
How CREATE Can Assist CREATE will continue to refine the PACE reports and data sets for annual distribution. However, for member institutions that seriously pursue the recommended steps above, CREATE will make every effort to deliver additional support and technical assistance to university/school leadership teams by:
1. Developing customized reports for active university teams. 2. Consulting with leadership teams regarding analysis and interpretation of data. 3. Facilitating meetings and other local events that employ these data in a
systematic manner for program improvement. 4. Evaluating university-based initiatives to design and implement program
improvements.
I. Educational Trends in My University’s Proximal Zone of Professional Impact
PACE 2008
A. DESCRIPTIVE REPORTS ON THE CHARACTERISTICS OF SCHOOLS IN THE PROXIMAL
ZONE OF PROFESSIONAL IMPACT
PACE 2008
7
SECTION A: Descriptive Reports on School Characteristics in the Proximal Zone of Professional Impact
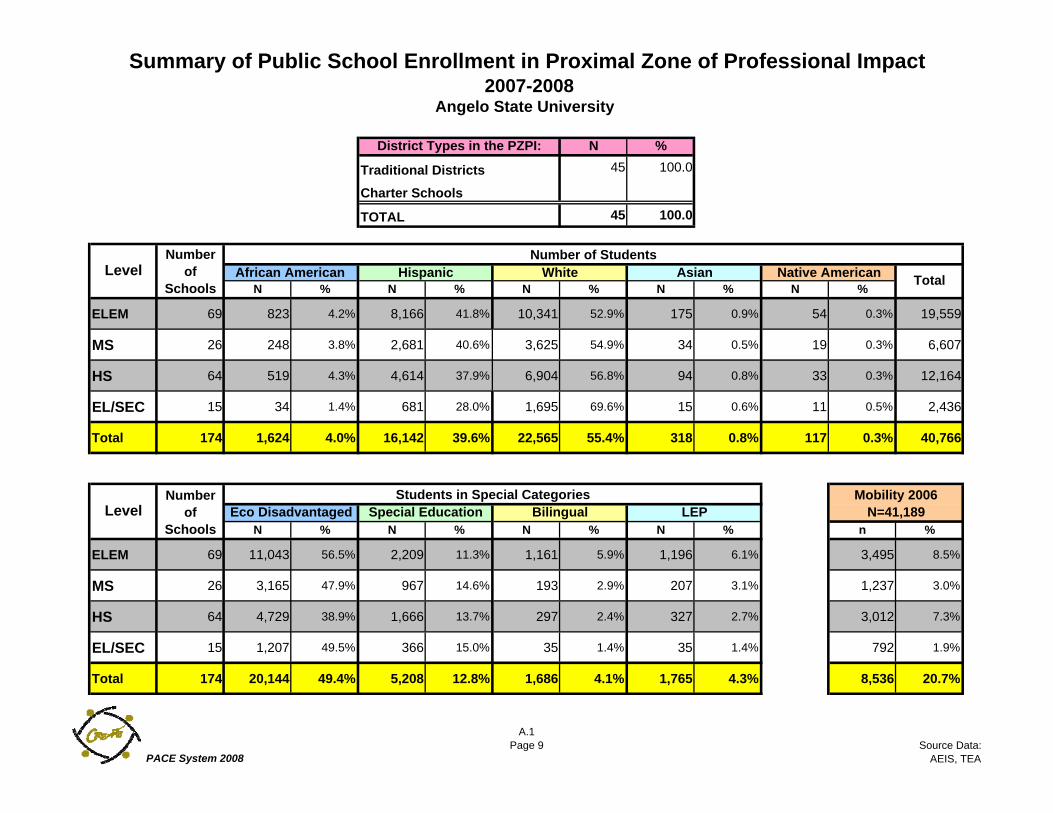
Section A consists of descriptive reports regarding the characteristics of public and charter schools located within a 75-mile radius of the target university. The data sources and definitions used to generate the various reports are discussed below. The source data for each report can be found in the lower right-hand corner of each document. A. 1: Summary of Public School Enrollment in the Proximal Zone of Professional Impact
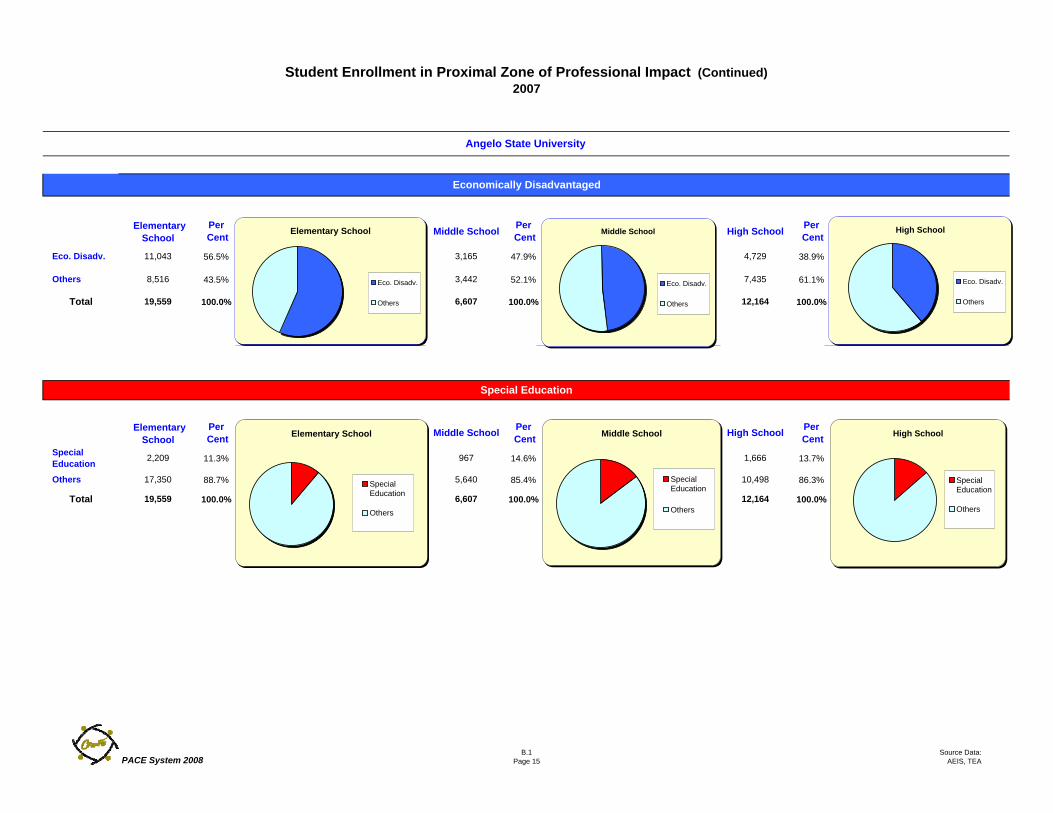
(PZPI) This report provides a summary of enrollment within the PZPI by various subpopulations of students. The data include the number and percent by school level for race/ethnicity, economically disadvantaged, special education, bilingual, and LEP students. Percentages of students in special categories will NOT add up to 100% because different denominators are used to calculate level percentages. Mobility for the PZPI is calculated by level and lags one year behind enrollment information. The definitions of the subpopulations are described below:
Economically Disadvantaged: Economically disadvantaged students are those coded as eligible for free or reduced price lunch or eligible for other public assistance.
See also Campus Group and Total Students. (Source: PEIMS, Oct. 2005, Oct. 2004; and TEA Student Assessment Division) Limited English Proficient (LEP): These are students identified as limited English proficient by the Language Proficiency Assessment Committee (LPAC) according to criteria established in the Texas Administrative Code. Not all pupils identified as LEP receive bilingual or English as a second language instruction, although most do.
For more information see Campus Group and TAKS/SDAA II/TAKS-I Participation (Source: PEIMS, Oct. 2005).
At-Risk: Listed as a special category in PACE 2007, this category of students was discontinued in the 2008 TEA dataset.
Special Education: This refers to the population served by programs for students with disabilities. (Source: PEIMS, Oct. 2005, Oct. 2004, and TEA Student Assessment Division)
Mobility (from Campus Profile Section): A student is considered to be mobile if he or she has been in membership at the school for less than 83% of the school year (i.e., has missed six or more weeks at a particular school). The district mobility rate reflects school-to-school mobility. See Comparable Improvement. (Source: PEIMS, June 2000.
A.2: Public School Enrollment by District in the Proximal Zone of Professional Impact
This report shows the first page of a supplemental document (See Attachment 1 for a full inventory) giving an alphabetical listing of all districts and charter schools in the target university’s PZPI. These data provide the number of schools by school level for each district (elementary, middle, high, and elementary/
8
secondary). Aggregated student enrollment data for each district within the PZPI by school level for selected student subpopulations are shown as well as the number of students who were added to the mobility count.
A.3: Public School Listing in the Zone of Professional ImpactThis report is the first page of a supplemental document (See Attachment 2 for a full inventory) listing all public schools (which includes charter schools) by district within the university’s PZPI. The listing includes the district name, campus code and name, school type (elementary, middle, high, and elementary/secondary) and size of school. The campus accountability rating has also been provided using the following system:
A=Academically Acceptable L= Academically Unacceptable R=Recognized E= Exemplary 1=Not Rated 2=Not Rated X=Not Rated
Requirements for each rating system can be found in the 2007 Accountability Manual on the TEA website.
Summary of Public School Enrollment in Proximal Zone of Professional Impact 2007-2008
N %
Traditional Districts 45 100.0
Charter Schools
TOTAL 45 100.0
N % N % N % N % N %
ELEM 69 823 4.2% 8,166 41.8% 10,341 52.9% 175 0.9% 54 0.3% 19,559
MS 26 248 3.8% 2,681 40.6% 3,625 54.9% 34 0.5% 19 0.3% 6,607
HS 64 519 4.3% 4,614 37.9% 6,904 56.8% 94 0.8% 33 0.3% 12,164
EL/SEC 15 34 1.4% 681 28.0% 1,695 69.6% 15 0.6% 11 0.5% 2,436
Total 174 1,624 4.0% 16,142 39.6% 22,565 55.4% 318 0.8% 117 0.3% 40,766
N % N % N % N % n %
ELEM 69 11,043 56.5% 2,209 11.3% 1,161 5.9% 1,196 6.1% 3,495 8.5%
MS 26 3,165 47.9% 967 14.6% 193 2.9% 207 3.1% 1,237 3.0%
HS 64 4,729 38.9% 1,666 13.7% 297 2.4% 327 2.7% 3,012 7.3%
EL/SEC 15 1,207 49.5% 366 15.0% 35 1.4% 35 1.4% 792 1.9%
Total 174 20,144 49.4% 5,208 12.8% 1,686 4.1% 1,765 4.3% 8,536 20.7%
African American Hispanic White
Number of
Schools
Students in Special CategoriesEco Disadvantaged Special Education Bilingual LEP
Mobility 2006 N=41,189
Angelo State University
District Types in the PZPI:
Number of StudentsLevel Asian Total
Number of
SchoolsNative American
Level
PACE System 2008
A.1Page 9 Source Data:
AEIS, TEA
Proximal Zone of Professional Impact 2007-08
District Name School Level EL MS HS El/
Sec Total African Amer
His-panic White Asian Native
Amer Total Eco Dis
Spec Educ
Bi-lingual LEP Mobility
2006
Elem 1 0 0 0 11 199 249 0 2 461 278 40 12 12 66MS 0 1 0 0 4 91 123 0 1 219 115 27 3 3 37HS 0 0 2 0 13 118 189 1 1 322 140 41 3 4 74Total 1 1 2 0 4 28 408 561 1 4 1,002 533 108 18 19 177El/Sec 0 0 0 1 0 28 111 0 1 140 70 18 11 11 35Total 0 0 0 1 1 0 28 111 0 1 140 70 18 11 11 35Elem 2 0 0 0 18 302 341 2 2 665 484 98 21 26 93HS 0 0 1 0 14 142 225 1 2 384 178 69 5 7 79El/Sec 0 0 0 1 5 115 152 2 0 274 158 52 1 1 53Total 2 0 1 1 4 37 559 718 5 4 1,323 820 219 27 34 225Elem 1 0 0 0 0 59 135 0 0 194 105 23 15 15 23HS 0 0 4 0 67 115 172 2 2 358 265 106 35 35 482Total 1 0 4 0 5 67 174 307 2 2 552 370 129 50 50 505Elem 3 0 0 0 6 32 136 0 0 174 50 18 4 4 28HS 0 0 3 0 0 2 1 1 0 4 2 4 0 0 5El/Sec 0 0 0 1 1 61 165 2 2 231 78 31 2 2 42Total 3 0 3 1 7 7 95 302 3 2 409 130 53 6 6 75Elem 1 0 0 0 4 125 280 1 0 410 212 44 6 6 62MS 0 1 0 0 0 45 87 0 2 134 54 17 4 4 20HS 0 0 1 0 1 70 180 0 1 252 61 42 3 3 40Total 1 1 1 0 3 5 240 547 1 3 796 327 103 13 13 122Elem 1 0 0 0 17 100 349 3 2 471 321 50 19 19 86MS 0 1 0 0 8 49 146 0 0 203 109 29 2 2 37HS 0 0 1 0 12 86 217 2 1 318 146 37 7 7 71Total 1 1 1 0 3 37 235 712 5 3 992 576 116 28 28 194Elem 69 0 0 0 823 8,166 10,341 175 54 19,559 11,043 2,209 1,161 1,196 3,495MS 0 26 0 0 248 2,681 3,625 34 19 6,607 3,165 967 193 207 1,237HS 0 0 64 0 519 4,614 6,904 94 33 12,164 4,729 1,666 297 327 3,012El/Sec 0 0 0 15 34 681 1,695 15 11 2,436 1,207 366 35 35 792Total 69 26 64 15 174 1,624 16,142 22,565 318 117 40,766 20,144 5,208 1,686 1,765 8,536
Angelo State University
SAMPLE DOCUMENT: To View the Total School Listing for Your Proximal Zone of Professional Impact Refer to Attachment 1.
BALLINGER ISD
BLACKWELL CISD
COLEMAN ISD
District Totals Including Charter Schools
BRADY ISD
BRONTE ISD
CHRISTOVAL ISD
COAHOMA ISD
PACE System 2008A.2
Page 10Source Data:
AEIS, TEA
Public School Listings in the Proximal Zone of Professional Impact 2007-08
District Name Campus Code Campus Name School Type School SizeAccountability
RatingBALLINGER ISD 200901001 BALLINGER H S HS 313 ABALLINGER ISD 200901003 FAIRVIEW ACCELERATED HS 9 1BALLINGER ISD 200901041 BALLINGER J H MS 219 ABALLINGER ISD 200901101 BALLINGER ELEMENTARY Elem 461 R
BLACKWELL CISD 177903001 BLACKWELL SCHOOL El/Sec 140 A
BRADY ISD 160901001 BRADY H S HS 384 ABRADY ISD 160901101 BRADY EL Elem 511 ABRADY ISD 160901103 NORTH WARD PRI Elem 154 XBRADY ISD 160901041 BRADY MIDDLE SCHOOL El/Sec 274 R
BRONTE ISD 41901002 JUVENILE DETENT CTR HS 200 2BRONTE ISD 41901001 BRONTE H S HS 154 RBRONTE ISD 41901003 FAIRVIEW ACCELERATED HS 2 1BRONTE ISD 41901005 FAIRVIEW DAEP HS 2 XBRONTE ISD 41901101 BRONTE EL Elem 194 A
CHRISTOVAL ISD 226901195 FAIRVIEW SPECIAL PROGRAMS HS 2 XCHRISTOVAL ISD 226901002 FAIRVIEW ACCELERATED HS 1 1CHRISTOVAL ISD 226901199 SAN ANGELO SPECIAL PROGS HS 1 XCHRISTOVAL ISD 226901101 CHRISTOVAL EL Elem 171 ECHRISTOVAL ISD 226901102 VERIBEST PPCD Elem 2 XCHRISTOVAL ISD 226901180 WALL SP PROG (FLC/BAC) Elem 1 XCHRISTOVAL ISD 226901001 CHRISTOVAL H S El/Sec 231 A
COAHOMA ISD 114902001 COAHOMA H S HS 252 ACOAHOMA ISD 114902041 COAHOMA J H MS 134 ACOAHOMA ISD 114902101 COAHOMA EL Elem 410 A
SAMPLE DOCUMENT: To View the Total School Enrollment by District for Your Proximal Zone of Professional Impact Refer to Attachment 2.
Angelo State University
PACE System 2008A.3
Page 11 Souce Data: AEIS
B. EDUCATIONAL TREND REPORTS ON SCHOOLS IN THE PROXIMAL ZONE OF PROFESSIONAL IMPACT
Achievement Trends
PACE 2008
12
SECTION B: Educational Trend Reports on Schools in the Proximal Zone of Professional Impact
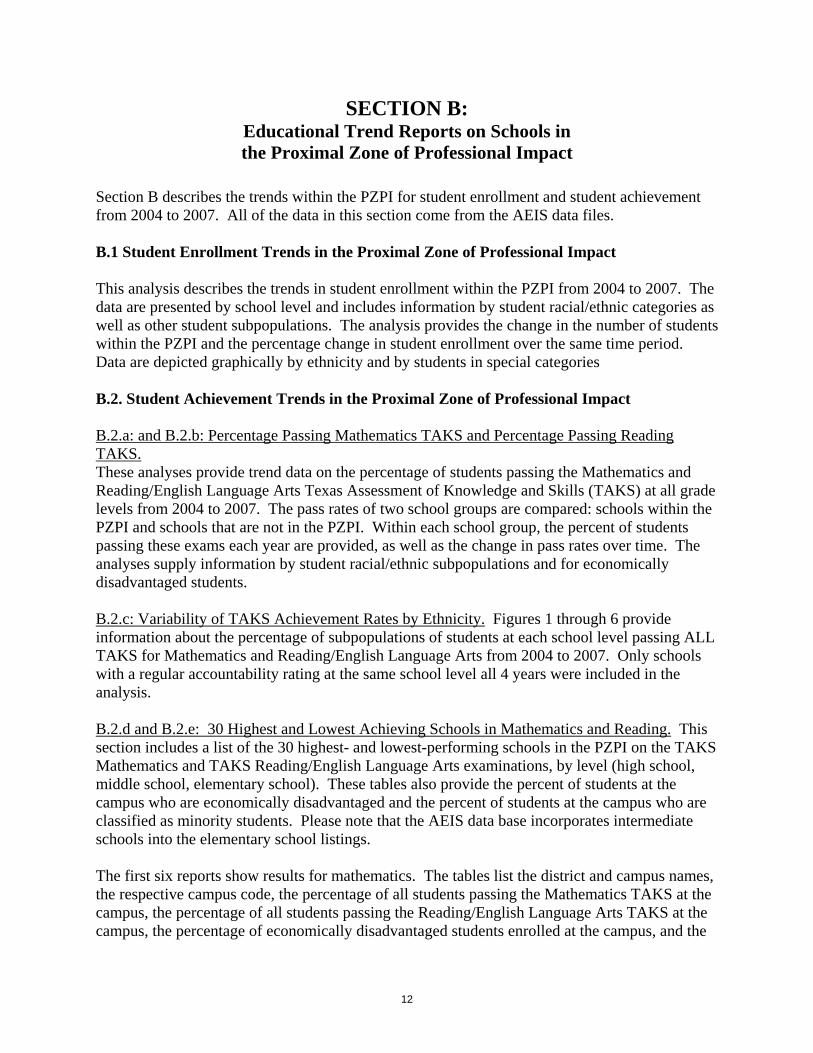
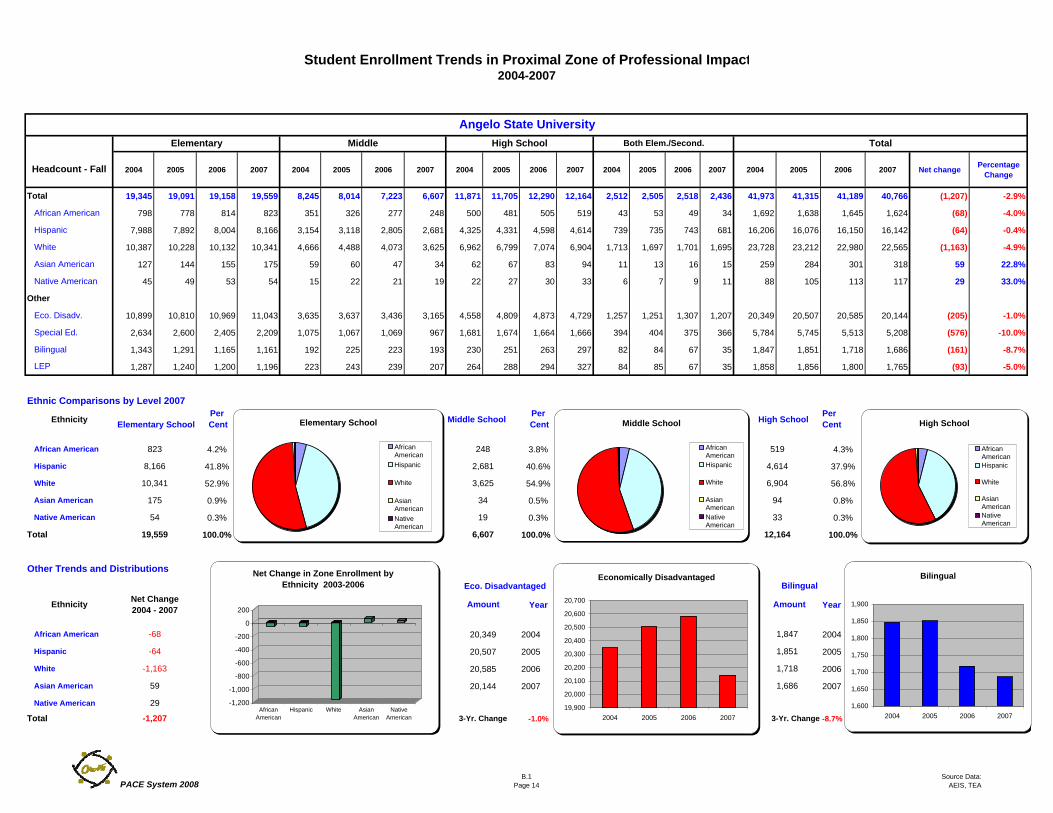
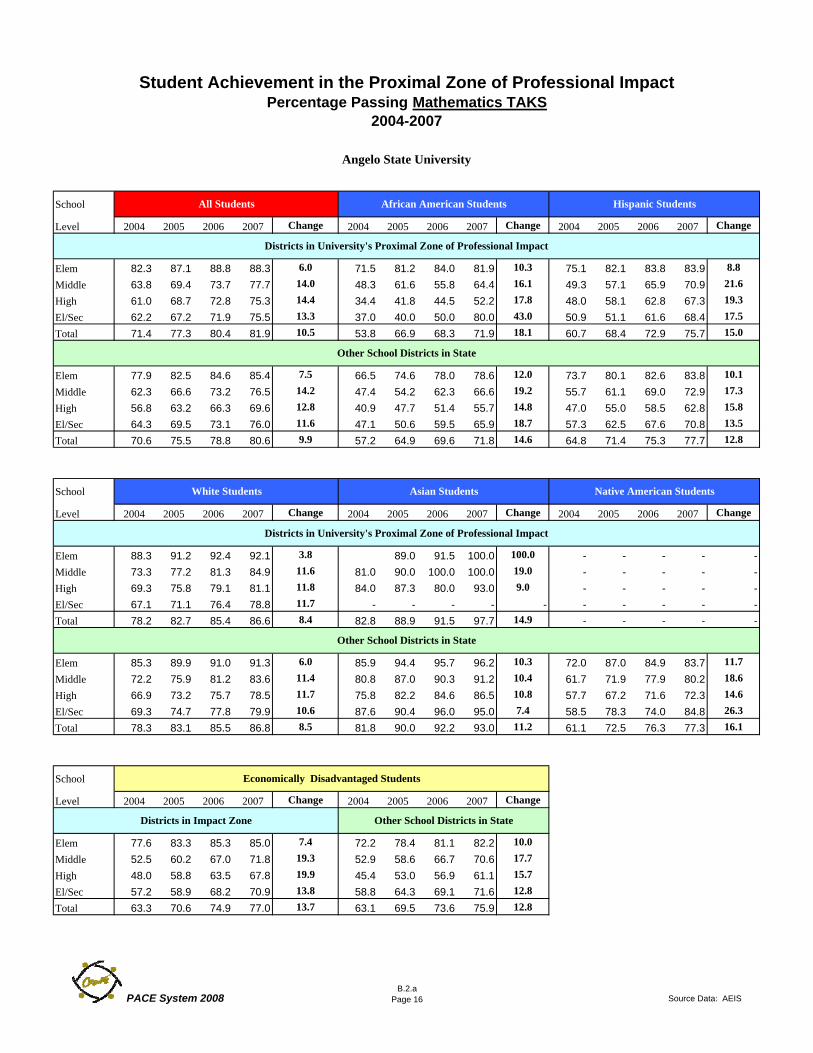
Section B describes the trends within the PZPI for student enrollment and student achievement from 2004 to 2007. All of the data in this section come from the AEIS data files. B.1 Student Enrollment Trends in the Proximal Zone of Professional Impact This analysis describes the trends in student enrollment within the PZPI from 2004 to 2007. The data are presented by school level and includes information by student racial/ethnic categories as well as other student subpopulations. The analysis provides the change in the number of students within the PZPI and the percentage change in student enrollment over the same time period. Data are depicted graphically by ethnicity and by students in special categories B.2. Student Achievement Trends in the Proximal Zone of Professional Impact B.2.a: and B.2.b: Percentage Passing Mathematics TAKS and Percentage Passing Reading TAKS. These analyses provide trend data on the percentage of students passing the Mathematics and Reading/English Language Arts Texas Assessment of Knowledge and Skills (TAKS) at all grade levels from 2004 to 2007. The pass rates of two school groups are compared: schools within the PZPI and schools that are not in the PZPI. Within each school group, the percent of students passing these exams each year are provided, as well as the change in pass rates over time. The analyses supply information by student racial/ethnic subpopulations and for economically disadvantaged students. B.2.c: Variability of TAKS Achievement Rates by Ethnicity. Figures 1 through 6 provide information about the percentage of subpopulations of students at each school level passing ALL TAKS for Mathematics and Reading/English Language Arts from 2004 to 2007. Only schools with a regular accountability rating at the same school level all 4 years were included in the analysis. B.2.d and B.2.e: 30 Highest and Lowest Achieving Schools in Mathematics and Reading. This section includes a list of the 30 highest- and lowest-performing schools in the PZPI on the TAKS Mathematics and TAKS Reading/English Language Arts examinations, by level (high school, middle school, elementary school). These tables also provide the percent of students at the campus who are economically disadvantaged and the percent of students at the campus who are classified as minority students. Please note that the AEIS data base incorporates intermediate schools into the elementary school listings. The first six reports show results for mathematics. The tables list the district and campus names, the respective campus code, the percentage of all students passing the Mathematics TAKS at the campus, the percentage of all students passing the Reading/English Language Arts TAKS at the campus, the percentage of economically disadvantaged students enrolled at the campus, and the
13
percentage of minority students (African American, Hispanic, or Native American) enrolled at the campus. The rankings for the highest performing schools on Mathematics TAKS are in descending order. The rankings for the lowest performing schools on Mathematics TAKS show the lowest school first and then show scores in ascending order. The Reading/English Language Arts TAKS results are included in the mathematics section to show the relationship between Mathematics and Reading/English Language Arts performance. The last six analyses show results for Reading/English Language Arts TAKS. The highest performing schools for Reading/English Language Arts are listed first and then ranked in descending order. The rankings for lowest performing schools for Reading/English Language Arts list results on the Reading/English Language Arts TAKS first and then are ranked in ascending order.
2004 2005 2006 2007 2004 2005 2006 2007 2004 2005 2006 2007 2004 2005 2006 2007 2004 2005 2006 2007 Net change Percentage Change
19,345 19,091 19,158 19,559 8,245 8,014 7,223 6,607 11,871 11,705 12,290 12,164 2,512 2,505 2,518 2,436 41,973 41,315 41,189 40,766 (1,207) -2.9%
798 778 814 823 351 326 277 248 500 481 505 519 43 53 49 34 1,692 1,638 1,645 1,624 (68) -4.0%
7,988 7,892 8,004 8,166 3,154 3,118 2,805 2,681 4,325 4,331 4,598 4,614 739 735 743 681 16,206 16,076 16,150 16,142 (64) -0.4%
10,387 10,228 10,132 10,341 4,666 4,488 4,073 3,625 6,962 6,799 7,074 6,904 1,713 1,697 1,701 1,695 23,728 23,212 22,980 22,565 (1,163) -4.9%
127 144 155 175 59 60 47 34 62 67 83 94 11 13 16 15 259 284 301 318 59 22.8%
45 49 53 54 15 22 21 19 22 27 30 33 6 7 9 11 88 105 113 117 29 33.0%
10,899 10,810 10,969 11,043 3,635 3,637 3,436 3,165 4,558 4,809 4,873 4,729 1,257 1,251 1,307 1,207 20,349 20,507 20,585 20,144 (205) -1.0%
2,634 2,600 2,405 2,209 1,075 1,067 1,069 967 1,681 1,674 1,664 1,666 394 404 375 366 5,784 5,745 5,513 5,208 (576) -10.0%
1,343 1,291 1,165 1,161 192 225 223 193 230 251 263 297 82 84 67 35 1,847 1,851 1,718 1,686 (161) -8.7%
1,287 1,240 1,200 1,196 223 243 239 207 264 288 294 327 84 85 67 35 1,858 1,856 1,800 1,765 (93) -5.0%
Per Cent
Per Cent
PerCent
4.2% 3.8% 4.3%
41.8% 40.6% 37.9%
52.9% 54.9% 56.8%
0.9% 0.5% 0.8%
0.3% 0.3% 0.3%
100.0% 100.0% 100.0%
Eco. Disadvantaged
Year Year
20,349 2004 2004
20,507 2005 2005
20,585 2006 2006
20,144 2007 2007
-1.0% -8.7%3-Yr. Change
Total
African American
Hispanic
-68
-64
White
Net Change 2004 - 2007
Both Elem./Second.
African American
3-Yr. Change
High School
Hispanic
White 10,341
Native American
-1,207
Other
LEP
Student Enrollment Trends in Proximal Zone of Professional Impact2004-2007
Asian American
Headcount - Fall
Angelo State University
Total
White
African American
Elementary Middle
Bilingual
Native American
Total
Asian American
Ethnicity
59
29
Ethnic Comparisons by Level 2007
Special Ed.
Eco. Disadv.
6,607
Ethnicity Elementary School
823
-1,163
8,166
Total 19,559
Hispanic
1,851
33
12,164
Asian American 175 34 94
Native American 54 19
1,847
Other Trends and Distributions
Bilingual
Amount Amount
1,686
Middle School
3,625
248
2,681
High School
6,904
519
4,614
1,718
Elementary School
AfricanAmericanHispanic
White
AsianAmericanNativeAmerican
Middle School
AfricanAmericanHispanic
White
AsianAmericanNativeAmerican
High School
AfricanAmericanHispanic
White
AsianAmericanNativeAmerican
Bilingual
1,600
1,650
1,700
1,750
1,800
1,850
1,900
2004 2005 2006 2007
Economically Disadvantaged
19,900
20,000
20,100
20,200
20,300
20,400
20,500
20,600
20,700
2004 2005 2006 2007
-1,200
-1,000
-800
-600
-400
-200
0
200
AfricanAmerican
Hispanic White AsianAmerican
NativeAmerican
Net Change in Zone Enrollment by Ethnicity 2003-2006
PACE System 2008B.1
Page 14Source Data:
AEIS, TEA
Per Cent
Per Cent
Per Cent
56.5% Eco. Disa 47.9% Eco. Dis 38.9%
43.5% Others 52.1% Others 61.1%
100.0% 100.0% Total 100.0%
Per Cent
Per Cent
Per Cent
11.3% 14.6% 13.7%
88.7% 85.4% 86.3%
100.0% 100.0% 100.0%
Student Enrollment in Proximal Zone of Professional Impact (Continued)2007
Angelo State University
Economically Disadvantaged
Elementary School Middle School High School
Eco. Disadv. 11,043 3,165 4,729
Others 8,516 3,442 7,435
Total 19,559 6,607 12,164
Special Education
Elementary School
Middle School High School
Special Education 2,209 967 1,666
Others 17,350 5,640 10,498
Total 19,559 6,607 12,164
Elementary School
Eco. Disadv.
Others
Elementary School
SpecialEducation
Others
Middle School
SpecialEducation
Others
High School
SpecialEducation
Others
High School
Eco. Disadv.
Others
Middle School
Eco. Disadv.
Others
PACE System 2008B.1
Page 15Source Data:
AEIS, TEA
Student Achievement in the Proximal Zone of Professional ImpactPercentage Passing Mathematics TAKS
2004-2007
School
Level 2004 2005 2006 2007 Change 2004 2005 2006 2007 Change 2004 2005 2006 2007 Change
Elem 82.3 87.1 88.8 88.3 6.0 71.5 81.2 84.0 81.9 10.3 75.1 82.1 83.8 83.9 8.8
Middle 63.8 69.4 73.7 77.7 14.0 48.3 61.6 55.8 64.4 16.1 49.3 57.1 65.9 70.9 21.6
High 61.0 68.7 72.8 75.3 14.4 34.4 41.8 44.5 52.2 17.8 48.0 58.1 62.8 67.3 19.3
El/Sec 62.2 67.2 71.9 75.5 13.3 37.0 40.0 50.0 80.0 43.0 50.9 51.1 61.6 68.4 17.5
Total 71.4 77.3 80.4 81.9 10.5 53.8 66.9 68.3 71.9 18.1 60.7 68.4 72.9 75.7 15.0
Elem 77.9 82.5 84.6 85.4 7.5 66.5 74.6 78.0 78.6 12.0 73.7 80.1 82.6 83.8 10.1
Middle 62.3 66.6 73.2 76.5 14.2 47.4 54.2 62.3 66.6 19.2 55.7 61.1 69.0 72.9 17.3
High 56.8 63.2 66.3 69.6 12.8 40.9 47.7 51.4 55.7 14.8 47.0 55.0 58.5 62.8 15.8
El/Sec 64.3 69.5 73.1 76.0 11.6 47.1 50.6 59.5 65.9 18.7 57.3 62.5 67.6 70.8 13.5
Total 70.6 75.5 78.8 80.6 9.9 57.2 64.9 69.6 71.8 14.6 64.8 71.4 75.3 77.7 12.8
School
Level 2004 2005 2006 2007 Change 2004 2005 2006 2007 Change 2004 2005 2006 2007 Change
Elem 88.3 91.2 92.4 92.1 3.8 89.0 91.5 100.0 100.0 - - - - -Middle 73.3 77.2 81.3 84.9 11.6 81.0 90.0 100.0 100.0 19.0 - - - - -High 69.3 75.8 79.1 81.1 11.8 84.0 87.3 80.0 93.0 9.0 - - - - -El/Sec 67.1 71.1 76.4 78.8 11.7 - - - - - - - - - -Total 78.2 82.7 85.4 86.6 8.4 82.8 88.9 91.5 97.7 14.9 - - - - -
Elem 85.3 89.9 91.0 91.3 6.0 85.9 94.4 95.7 96.2 10.3 72.0 87.0 84.9 83.7 11.7
Middle 72.2 75.9 81.2 83.6 11.4 80.8 87.0 90.3 91.2 10.4 61.7 71.9 77.9 80.2 18.6
High 66.9 73.2 75.7 78.5 11.7 75.8 82.2 84.6 86.5 10.8 57.7 67.2 71.6 72.3 14.6
El/Sec 69.3 74.7 77.8 79.9 10.6 87.6 90.4 96.0 95.0 7.4 58.5 78.3 74.0 84.8 26.3
Total 78.3 83.1 85.5 86.8 8.5 81.8 90.0 92.2 93.0 11.2 61.1 72.5 76.3 77.3 16.1
School
Level 2004 2005 2006 2007 Change 2004 2005 2006 2007 Change
Elem 77.6 83.3 85.3 85.0 7.4 72.2 78.4 81.1 82.2 10.0
Middle 52.5 60.2 67.0 71.8 19.3 52.9 58.6 66.7 70.6 17.7
High 48.0 58.8 63.5 67.8 19.9 45.4 53.0 56.9 61.1 15.7
El/Sec 57.2 58.9 68.2 70.9 13.8 58.8 64.3 69.1 71.6 12.8
Total 63.3 70.6 74.9 77.0 13.7 63.1 69.5 73.6 75.9 12.8
Asian Students Native American Students
Angelo State University
All Students African American Students Hispanic Students
Districts in University's Proximal Zone of Professional Impact
Other School Districts in State
White Students
Districts in University's Proximal Zone of Professional Impact
Other School Districts in State
Economically Disadvantaged Students
Districts in Impact Zone Other School Districts in State
PACE System 2008B.2.a
Page 16 Source Data: AEIS
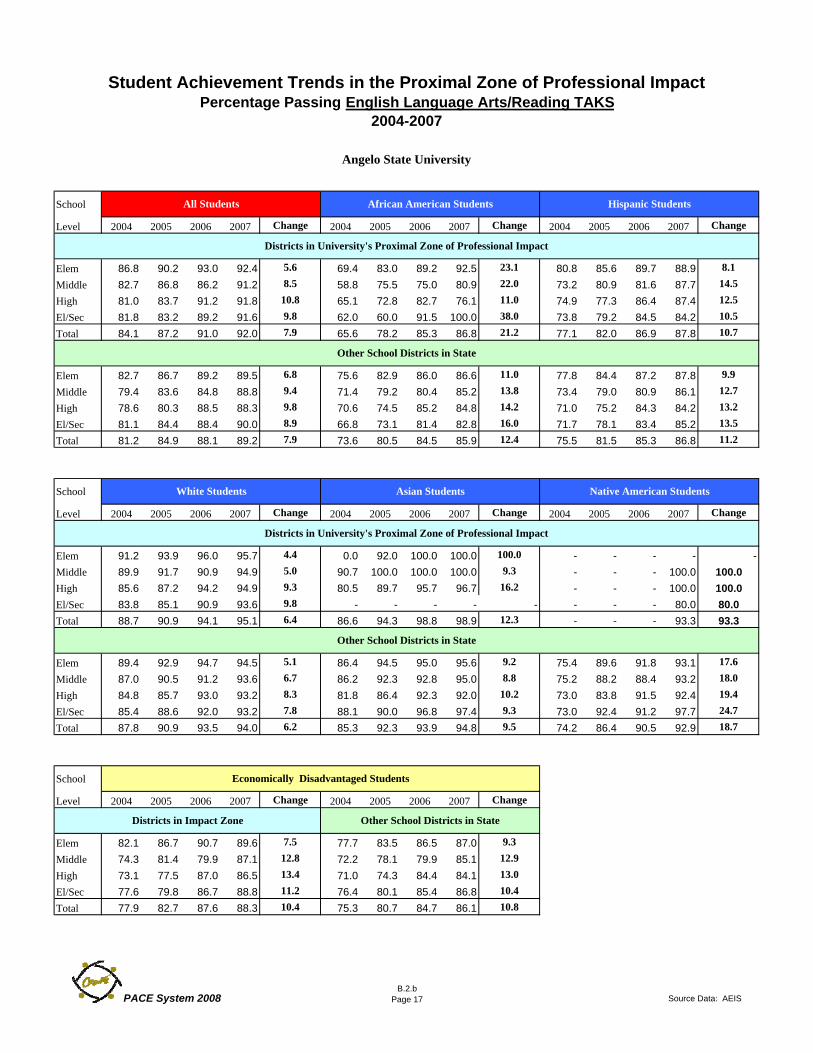
Student Achievement Trends in the Proximal Zone of Professional ImpactPercentage Passing English Language Arts/Reading TAKS
2004-2007
School
Level 2004 2005 2006 2007 Change 2004 2005 2006 2007 Change 2004 2005 2006 2007 Change
Elem 86.8 90.2 93.0 92.4 5.6 69.4 83.0 89.2 92.5 23.1 80.8 85.6 89.7 88.9 8.1
Middle 82.7 86.8 86.2 91.2 8.5 58.8 75.5 75.0 80.9 22.0 73.2 80.9 81.6 87.7 14.5
High 81.0 83.7 91.2 91.8 10.8 65.1 72.8 82.7 76.1 11.0 74.9 77.3 86.4 87.4 12.5
El/Sec 81.8 83.2 89.2 91.6 9.8 62.0 60.0 91.5 100.0 38.0 73.8 79.2 84.5 84.2 10.5
Total 84.1 87.2 91.0 92.0 7.9 65.6 78.2 85.3 86.8 21.2 77.1 82.0 86.9 87.8 10.7
Elem 82.7 86.7 89.2 89.5 6.8 75.6 82.9 86.0 86.6 11.0 77.8 84.4 87.2 87.8 9.9
Middle 79.4 83.6 84.8 88.8 9.4 71.4 79.2 80.4 85.2 13.8 73.4 79.0 80.9 86.1 12.7
High 78.6 80.3 88.5 88.3 9.8 70.6 74.5 85.2 84.8 14.2 71.0 75.2 84.3 84.2 13.2
El/Sec 81.1 84.4 88.4 90.0 8.9 66.8 73.1 81.4 82.8 16.0 71.7 78.1 83.4 85.2 13.5
Total 81.2 84.9 88.1 89.2 7.9 73.6 80.5 84.5 85.9 12.4 75.5 81.5 85.3 86.8 11.2
School
Level 2004 2005 2006 2007 Change 2004 2005 2006 2007 Change 2004 2005 2006 2007 Change
Elem 91.2 93.9 96.0 95.7 4.4 0.0 92.0 100.0 100.0 100.0 - - - - -Middle 89.9 91.7 90.9 94.9 5.0 90.7 100.0 100.0 100.0 9.3 - - - 100.0 100.0High 85.6 87.2 94.2 94.9 9.3 80.5 89.7 95.7 96.7 16.2 - - - 100.0 100.0El/Sec 83.8 85.1 90.9 93.6 9.8 - - - - - - - - 80.0 80.0Total 88.7 90.9 94.1 95.1 6.4 86.6 94.3 98.8 98.9 12.3 - - - 93.3 93.3
Elem 89.4 92.9 94.7 94.5 5.1 86.4 94.5 95.0 95.6 9.2 75.4 89.6 91.8 93.1 17.6
Middle 87.0 90.5 91.2 93.6 6.7 86.2 92.3 92.8 95.0 8.8 75.2 88.2 88.4 93.2 18.0
High 84.8 85.7 93.0 93.2 8.3 81.8 86.4 92.3 92.0 10.2 73.0 83.8 91.5 92.4 19.4
El/Sec 85.4 88.6 92.0 93.2 7.8 88.1 90.0 96.8 97.4 9.3 73.0 92.4 91.2 97.7 24.7
Total 87.8 90.9 93.5 94.0 6.2 85.3 92.3 93.9 94.8 9.5 74.2 86.4 90.5 92.9 18.7
School
Level 2004 2005 2006 2007 Change 2004 2005 2006 2007 Change
Elem 82.1 86.7 90.7 89.6 7.5 77.7 83.5 86.5 87.0 9.3
Middle 74.3 81.4 79.9 87.1 12.8 72.2 78.1 79.9 85.1 12.9
High 73.1 77.5 87.0 86.5 13.4 71.0 74.3 84.4 84.1 13.0
El/Sec 77.6 79.8 86.7 88.8 11.2 76.4 80.1 85.4 86.8 10.4
Total 77.9 82.7 87.6 88.3 10.4 75.3 80.7 84.7 86.1 10.8
Districts in University's Proximal Zone of Professional Impact
Other School Districts in State
White Students Asian Students Native American Students
Angelo State University
All Students African American Students Hispanic Students
Economically Disadvantaged Students
Districts in Impact Zone Other School Districts in State
Districts in University's Proximal Zone of Professional Impact
Other School Districts in State
PACE System 2008B.2.b
Page 17 Source Data: AEIS
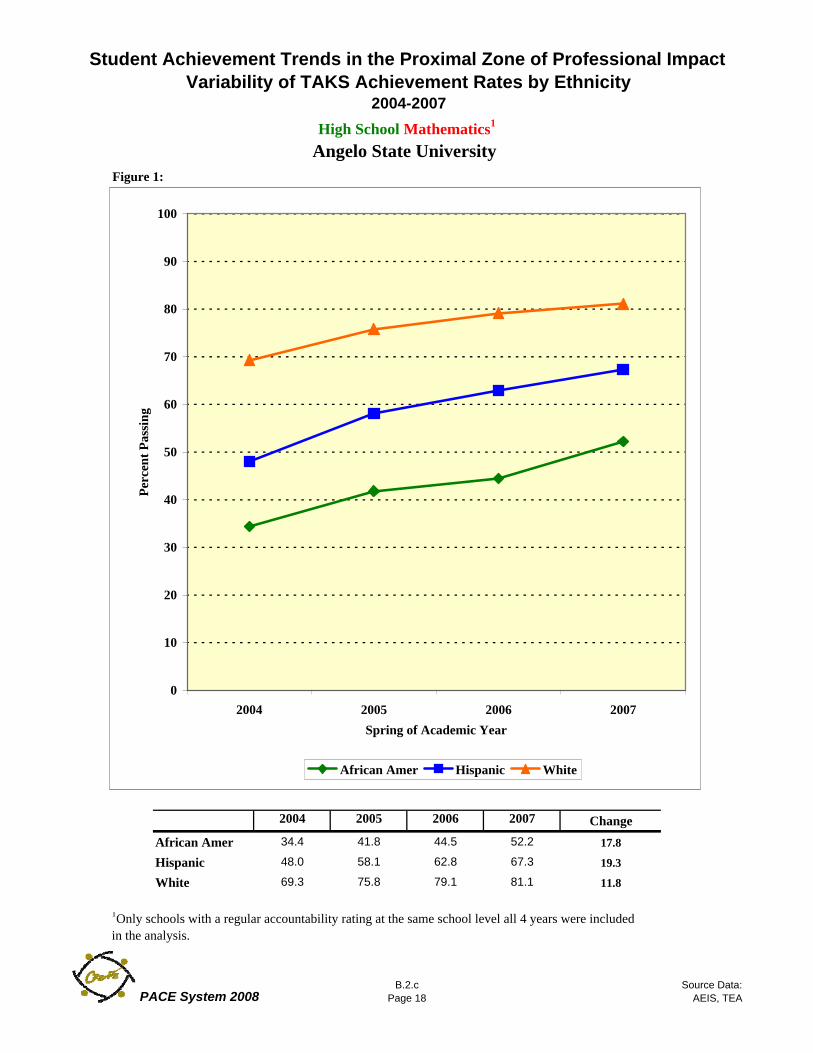
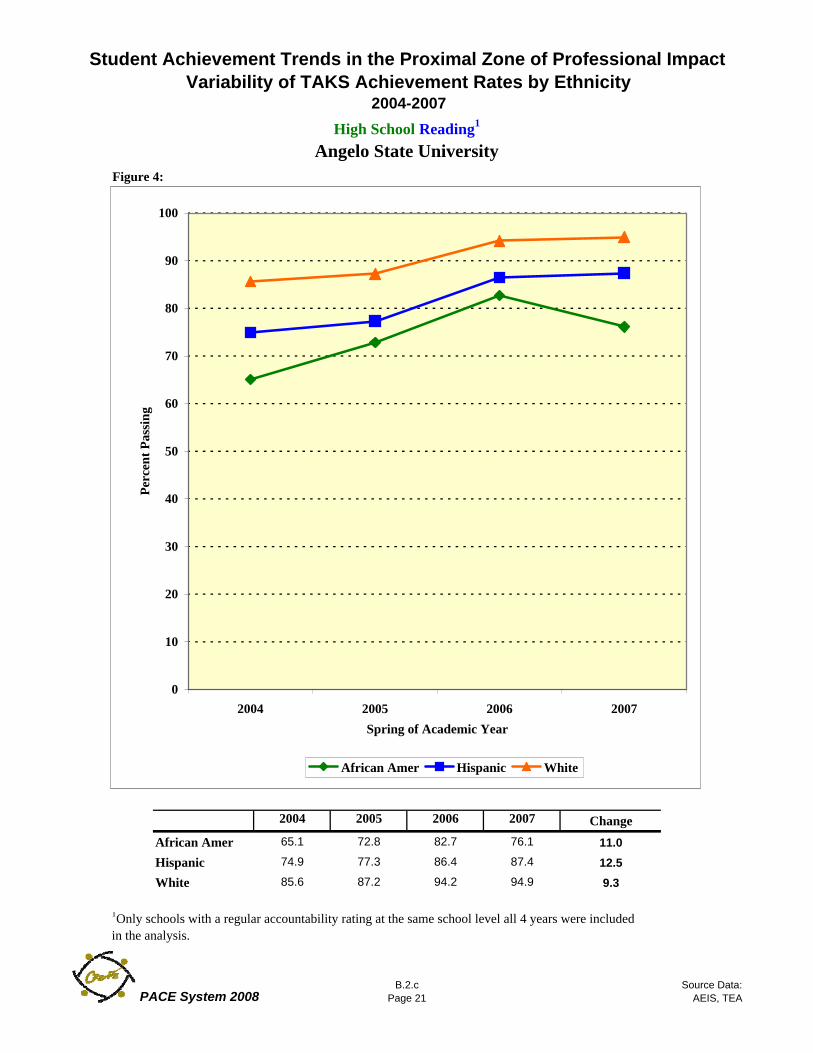
Student Achievement Trends in the Proximal Zone of Professional ImpactVariability of TAKS Achievement Rates by Ethnicity
2004-2007
Figure 1:
2004 2005 2006 2007 ChangeAfrican Amer 34.4 41.8 44.5 52.2 17.8
Hispanic 48.0 58.1 62.8 67.3 19.3
White 69.3 75.8 79.1 81.1 11.8
High School Mathematics1
Angelo State University
1Only schools with a regular accountability rating at the same school level all 4 years were included in the analysis.
0
10
20
30
40
50
60
70
80
90
100
2004 2005 2006 2007Spring of Academic Year
Perc
ent P
assi
ng
African Amer Hispanic White
PACE System 2008B.2.c
Page 18Source Data:
AEIS, TEA
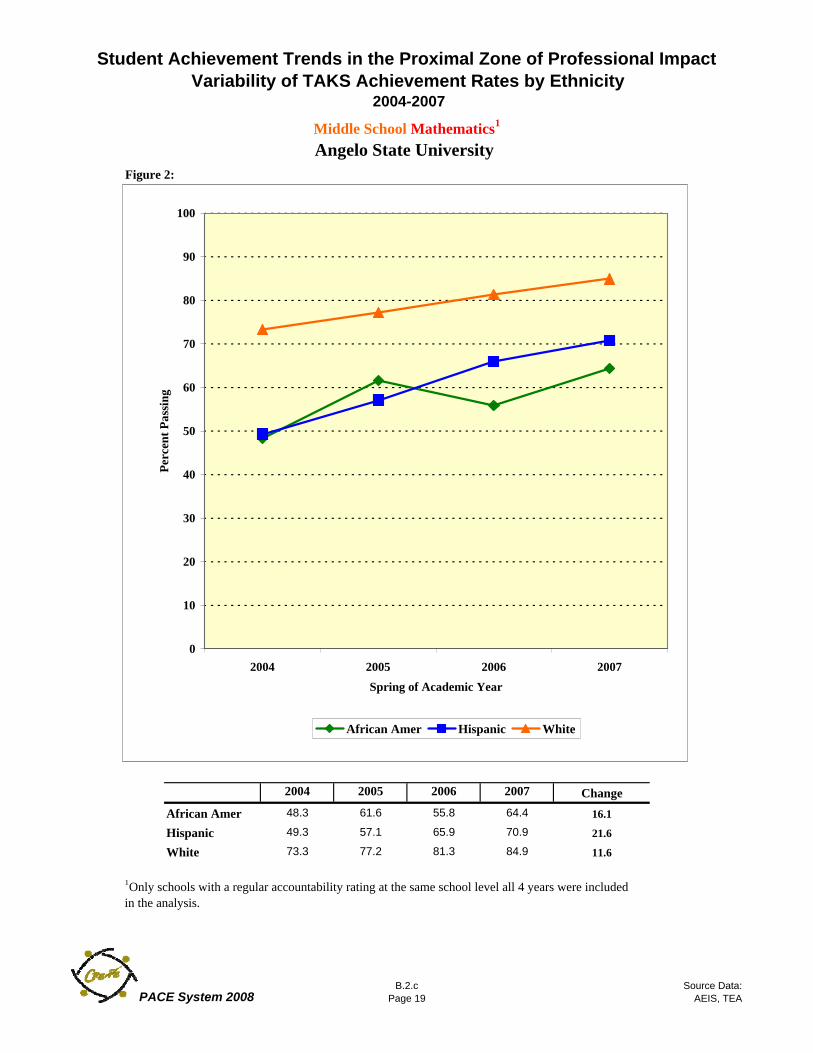
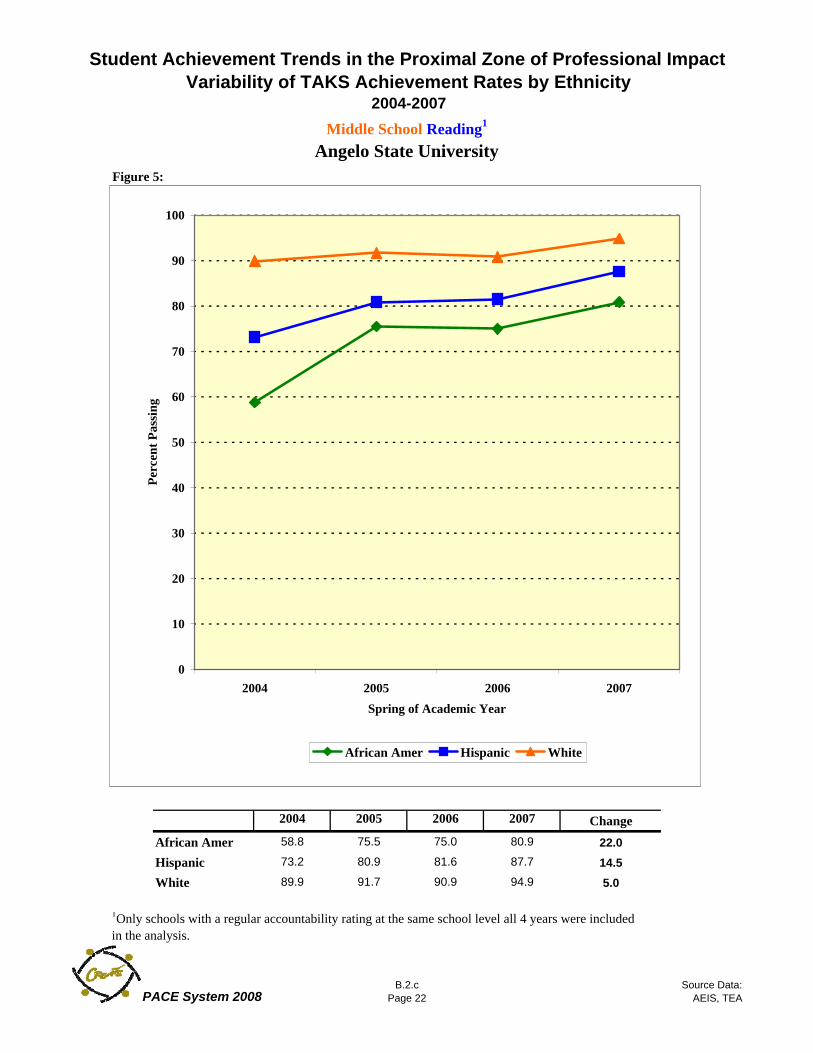
Student Achievement Trends in the Proximal Zone of Professional ImpactVariability of TAKS Achievement Rates by Ethnicity
2004-2007
Figure 2:
2004 2005 2006 2007 ChangeAfrican Amer 48.3 61.6 55.8 64.4 16.1
Hispanic 49.3 57.1 65.9 70.9 21.6
White 73.3 77.2 81.3 84.9 11.6
Middle School Mathematics1
Angelo State University
1Only schools with a regular accountability rating at the same school level all 4 years were included in the analysis.
0
10
20
30
40
50
60
70
80
90
100
2004 2005 2006 2007Spring of Academic Year
Perc
ent P
assi
ng
African Amer Hispanic White
PACE System 2008B.2.c
Page 19Source Data:
AEIS, TEA
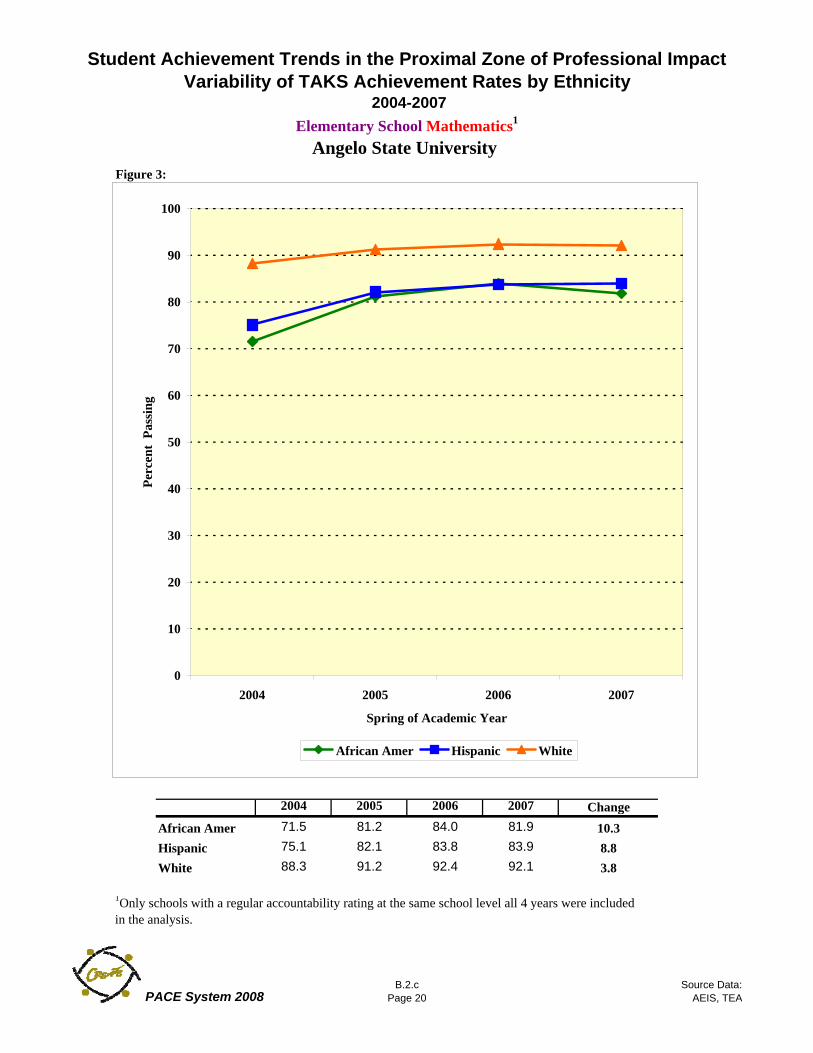
Student Achievement Trends in the Proximal Zone of Professional ImpactVariability of TAKS Achievement Rates by Ethnicity
2004-2007
Figure 3:
2004 2005 2006 2007 ChangeAfrican Amer 71.5 81.2 84.0 81.9 10.3Hispanic 75.1 82.1 83.8 83.9 8.8White 88.3 91.2 92.4 92.1 3.8
Elementary School Mathematics1
Angelo State University
1Only schools with a regular accountability rating at the same school level all 4 years were included in the analysis.
0
10
20
30
40
50
60
70
80
90
100
2004 2005 2006 2007
Spring of Academic Year
Perc
ent
Pass
ing
African Amer Hispanic White
PACE System 2008B.2.c
Page 20Source Data:
AEIS, TEA
Student Achievement Trends in the Proximal Zone of Professional ImpactVariability of TAKS Achievement Rates by Ethnicity
2004-2007
Figure 4:
2004 2005 2006 2007 ChangeAfrican Amer 65.1 72.8 82.7 76.1 11.0Hispanic 74.9 77.3 86.4 87.4 12.5White 85.6 87.2 94.2 94.9 9.3
High School Reading1
Angelo State University
1Only schools with a regular accountability rating at the same school level all 4 years were included in the analysis.
0
10
20
30
40
50
60
70
80
90
100
2004 2005 2006 2007Spring of Academic Year
Perc
ent P
assi
ng
African Amer Hispanic White
PACE System 2008B.2.c
Page 21Source Data:
AEIS, TEA
Student Achievement Trends in the Proximal Zone of Professional ImpactVariability of TAKS Achievement Rates by Ethnicity
2004-2007
Figure 5:
2004 2005 2006 2007 ChangeAfrican Amer 58.8 75.5 75.0 80.9 22.0Hispanic 73.2 80.9 81.6 87.7 14.5White 89.9 91.7 90.9 94.9 5.0
Middle School Reading1
Angelo State University
1Only schools with a regular accountability rating at the same school level all 4 years were included in the analysis.
0
10
20
30
40
50
60
70
80
90
100
2004 2005 2006 2007Spring of Academic Year
Perc
ent P
assi
ng
African Amer Hispanic White
PACE System 2008B.2.c
Page 22Source Data:
AEIS, TEA
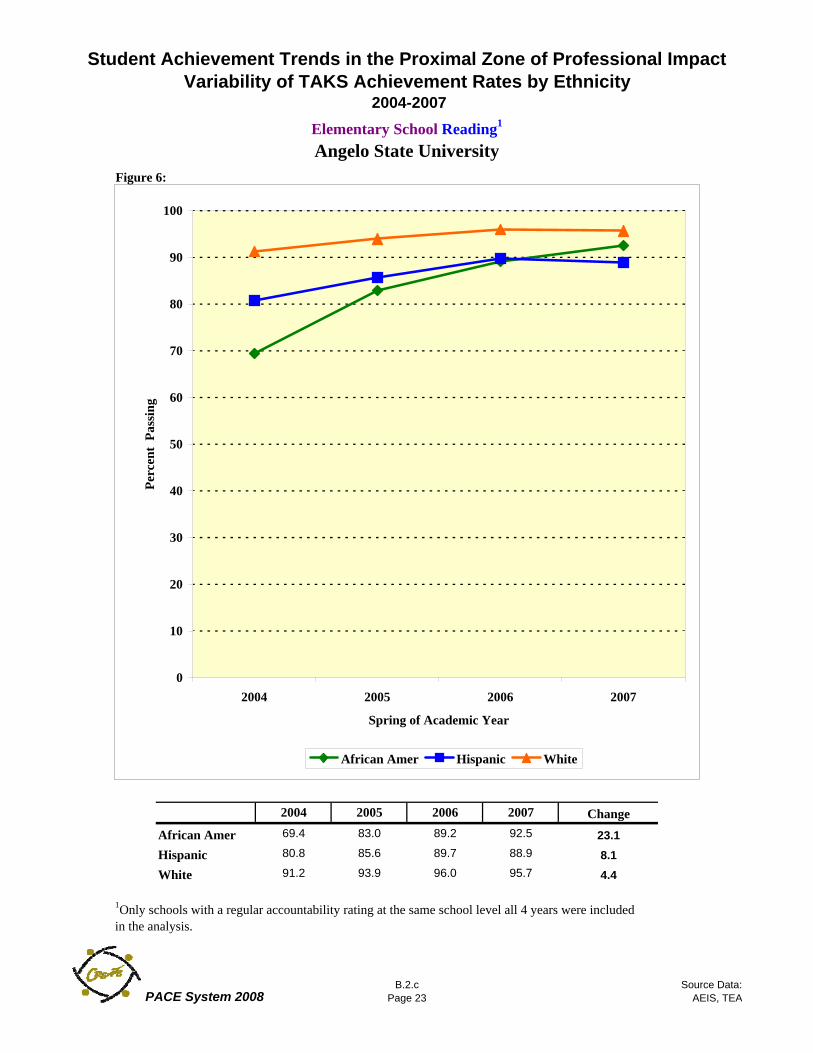
Student Achievement Trends in the Proximal Zone of Professional ImpactVariability of TAKS Achievement Rates by Ethnicity
2004-2007
Figure 6:
2004 2005 2006 2007 ChangeAfrican Amer 69.4 83.0 89.2 92.5 23.1Hispanic 80.8 85.6 89.7 88.9 8.1White 91.2 93.9 96.0 95.7 4.4
Elementary School Reading1
Angelo State University
1Only schools with a regular accountability rating at the same school level all 4 years were included in the analysis.
0
10
20
30
40
50
60
70
80
90
100
2004 2005 2006 2007
Spring of Academic Year
Perc
ent
Pass
ing
African Amer Hispanic White
PACE System 2008B.2.c
Page 23Source Data:
AEIS, TEA
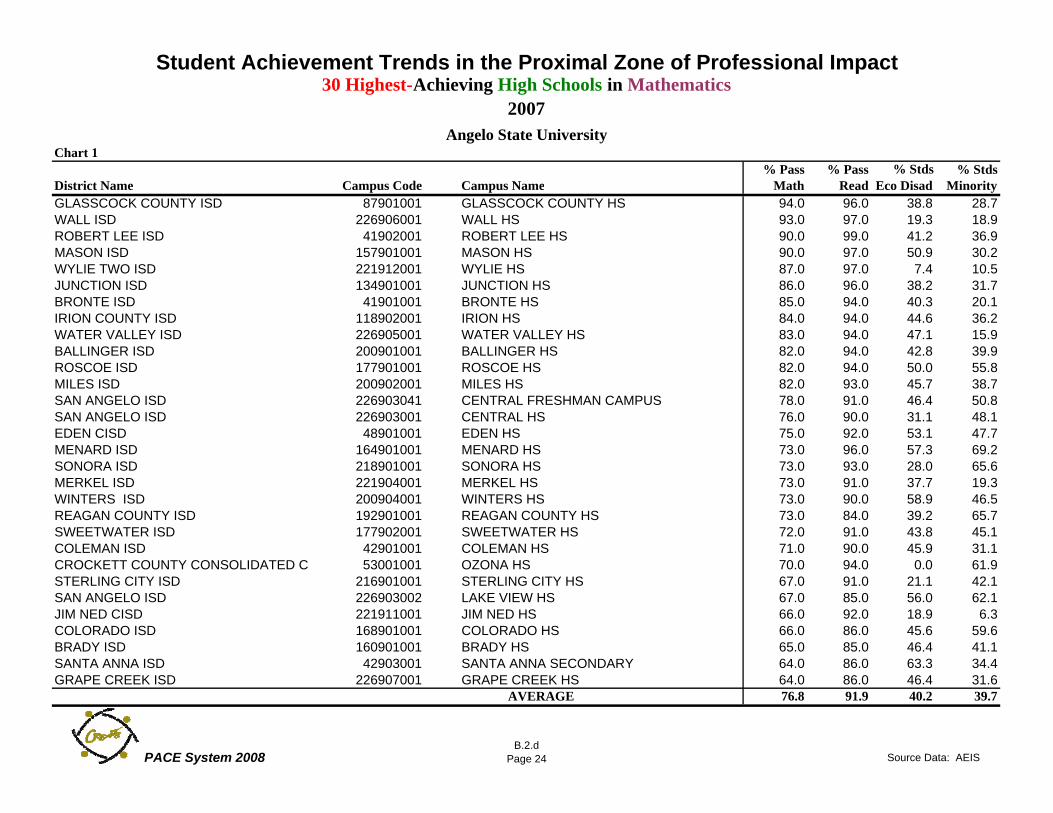
Student Achievement Trends in the Proximal Zone of Professional Impact
Chart 1% Pass % Pass % Stds % Stds
District Name Campus Code Campus Name Math Read Eco Disad MinorityGLASSCOCK COUNTY ISD 87901001 GLASSCOCK COUNTY HS 94.0 96.0 38.8 28.7WALL ISD 226906001 WALL HS 93.0 97.0 19.3 18.9ROBERT LEE ISD 41902001 ROBERT LEE HS 90.0 99.0 41.2 36.9MASON ISD 157901001 MASON HS 90.0 97.0 50.9 30.2WYLIE TWO ISD 221912001 WYLIE HS 87.0 97.0 7.4 10.5JUNCTION ISD 134901001 JUNCTION HS 86.0 96.0 38.2 31.7BRONTE ISD 41901001 BRONTE HS 85.0 94.0 40.3 20.1IRION COUNTY ISD 118902001 IRION HS 84.0 94.0 44.6 36.2WATER VALLEY ISD 226905001 WATER VALLEY HS 83.0 94.0 47.1 15.9BALLINGER ISD 200901001 BALLINGER HS 82.0 94.0 42.8 39.9ROSCOE ISD 177901001 ROSCOE HS 82.0 94.0 50.0 55.8MILES ISD 200902001 MILES HS 82.0 93.0 45.7 38.7SAN ANGELO ISD 226903041 CENTRAL FRESHMAN CAMPUS 78.0 91.0 46.4 50.8SAN ANGELO ISD 226903001 CENTRAL HS 76.0 90.0 31.1 48.1EDEN CISD 48901001 EDEN HS 75.0 92.0 53.1 47.7MENARD ISD 164901001 MENARD HS 73.0 96.0 57.3 69.2SONORA ISD 218901001 SONORA HS 73.0 93.0 28.0 65.6MERKEL ISD 221904001 MERKEL HS 73.0 91.0 37.7 19.3WINTERS ISD 200904001 WINTERS HS 73.0 90.0 58.9 46.5REAGAN COUNTY ISD 192901001 REAGAN COUNTY HS 73.0 84.0 39.2 65.7SWEETWATER ISD 177902001 SWEETWATER HS 72.0 91.0 43.8 45.1COLEMAN ISD 42901001 COLEMAN HS 71.0 90.0 45.9 31.1CROCKETT COUNTY CONSOLIDATED CS 53001001 OZONA HS 70.0 94.0 0.0 61.9STERLING CITY ISD 216901001 STERLING CITY HS 67.0 91.0 21.1 42.1SAN ANGELO ISD 226903002 LAKE VIEW HS 67.0 85.0 56.0 62.1JIM NED CISD 221911001 JIM NED HS 66.0 92.0 18.9 6.3COLORADO ISD 168901001 COLORADO HS 66.0 86.0 45.6 59.6BRADY ISD 160901001 BRADY HS 65.0 85.0 46.4 41.1SANTA ANNA ISD 42903001 SANTA ANNA SECONDARY 64.0 86.0 63.3 34.4GRAPE CREEK ISD 226907001 GRAPE CREEK HS 64.0 86.0 46.4 31.6
76.8 91.9 40.2 39.7 AVERAGE
30 Highest-Achieving High Schools in Mathematics 2007
Angelo State University
PACE System 2008B.2.d
Page 24 Source Data: AEIS
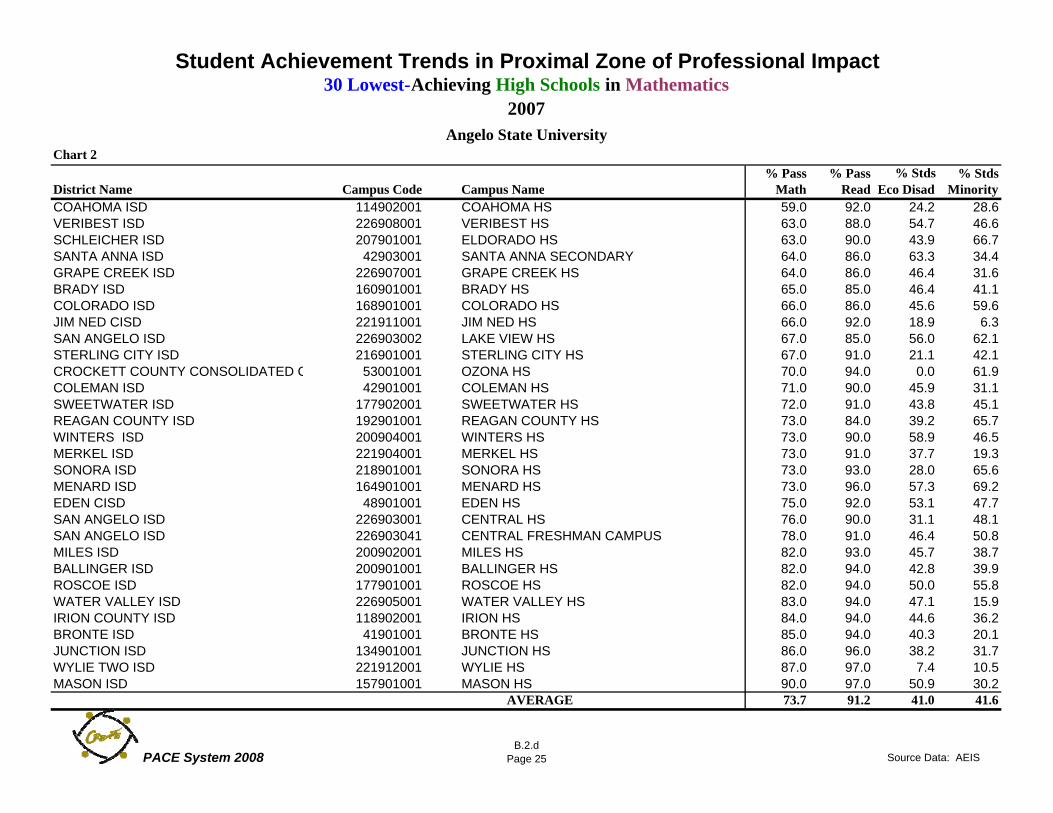
Student Achievement Trends in Proximal Zone of Professional Impact
Chart 2% Pass % Pass % Stds % Stds
District Name Campus Code Campus Name Math Read Eco Disad MinorityCOAHOMA ISD 114902001 COAHOMA HS 59.0 92.0 24.2 28.6VERIBEST ISD 226908001 VERIBEST HS 63.0 88.0 54.7 46.6SCHLEICHER ISD 207901001 ELDORADO HS 63.0 90.0 43.9 66.7SANTA ANNA ISD 42903001 SANTA ANNA SECONDARY 64.0 86.0 63.3 34.4GRAPE CREEK ISD 226907001 GRAPE CREEK HS 64.0 86.0 46.4 31.6BRADY ISD 160901001 BRADY HS 65.0 85.0 46.4 41.1COLORADO ISD 168901001 COLORADO HS 66.0 86.0 45.6 59.6JIM NED CISD 221911001 JIM NED HS 66.0 92.0 18.9 6.3SAN ANGELO ISD 226903002 LAKE VIEW HS 67.0 85.0 56.0 62.1STERLING CITY ISD 216901001 STERLING CITY HS 67.0 91.0 21.1 42.1CROCKETT COUNTY CONSOLIDATED C 53001001 OZONA HS 70.0 94.0 0.0 61.9COLEMAN ISD 42901001 COLEMAN HS 71.0 90.0 45.9 31.1SWEETWATER ISD 177902001 SWEETWATER HS 72.0 91.0 43.8 45.1REAGAN COUNTY ISD 192901001 REAGAN COUNTY HS 73.0 84.0 39.2 65.7WINTERS ISD 200904001 WINTERS HS 73.0 90.0 58.9 46.5MERKEL ISD 221904001 MERKEL HS 73.0 91.0 37.7 19.3SONORA ISD 218901001 SONORA HS 73.0 93.0 28.0 65.6MENARD ISD 164901001 MENARD HS 73.0 96.0 57.3 69.2EDEN CISD 48901001 EDEN HS 75.0 92.0 53.1 47.7SAN ANGELO ISD 226903001 CENTRAL HS 76.0 90.0 31.1 48.1SAN ANGELO ISD 226903041 CENTRAL FRESHMAN CAMPUS 78.0 91.0 46.4 50.8MILES ISD 200902001 MILES HS 82.0 93.0 45.7 38.7BALLINGER ISD 200901001 BALLINGER HS 82.0 94.0 42.8 39.9ROSCOE ISD 177901001 ROSCOE HS 82.0 94.0 50.0 55.8WATER VALLEY ISD 226905001 WATER VALLEY HS 83.0 94.0 47.1 15.9IRION COUNTY ISD 118902001 IRION HS 84.0 94.0 44.6 36.2BRONTE ISD 41901001 BRONTE HS 85.0 94.0 40.3 20.1JUNCTION ISD 134901001 JUNCTION HS 86.0 96.0 38.2 31.7WYLIE TWO ISD 221912001 WYLIE HS 87.0 97.0 7.4 10.5MASON ISD 157901001 MASON HS 90.0 97.0 50.9 30.2
73.7 91.2 41.0 41.6
30 Lowest-Achieving High Schools in Mathematics
AVERAGE
2007Angelo State University
PACE System 2008B.2.d
Page 25 Source Data: AEIS
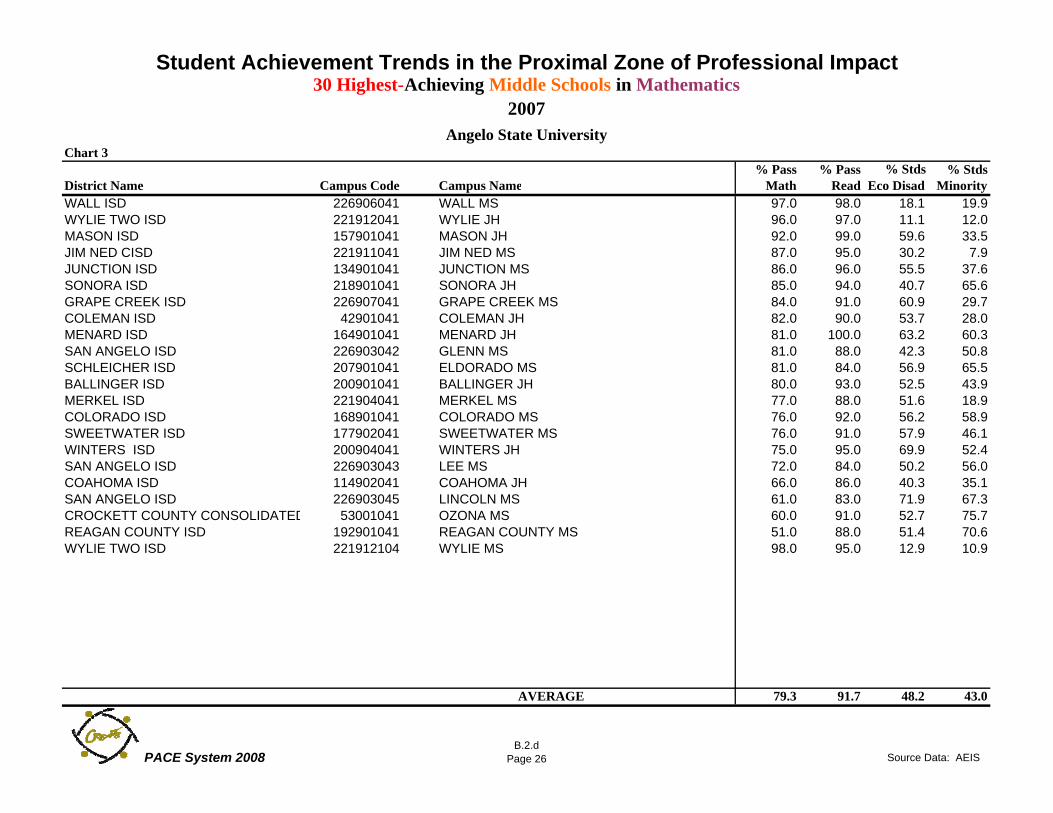
Student Achievement Trends in the Proximal Zone of Professional Impact
Chart 3% Pass % Pass % Stds % Stds
District Name Campus Code Campus Name Math Read Eco Disad MinorityWALL ISD 226906041 WALL MS 97.0 98.0 18.1 19.9WYLIE TWO ISD 221912041 WYLIE JH 96.0 97.0 11.1 12.0MASON ISD 157901041 MASON JH 92.0 99.0 59.6 33.5JIM NED CISD 221911041 JIM NED MS 87.0 95.0 30.2 7.9JUNCTION ISD 134901041 JUNCTION MS 86.0 96.0 55.5 37.6SONORA ISD 218901041 SONORA JH 85.0 94.0 40.7 65.6GRAPE CREEK ISD 226907041 GRAPE CREEK MS 84.0 91.0 60.9 29.7COLEMAN ISD 42901041 COLEMAN JH 82.0 90.0 53.7 28.0MENARD ISD 164901041 MENARD JH 81.0 100.0 63.2 60.3SAN ANGELO ISD 226903042 GLENN MS 81.0 88.0 42.3 50.8SCHLEICHER ISD 207901041 ELDORADO MS 81.0 84.0 56.9 65.5BALLINGER ISD 200901041 BALLINGER JH 80.0 93.0 52.5 43.9MERKEL ISD 221904041 MERKEL MS 77.0 88.0 51.6 18.9COLORADO ISD 168901041 COLORADO MS 76.0 92.0 56.2 58.9SWEETWATER ISD 177902041 SWEETWATER MS 76.0 91.0 57.9 46.1WINTERS ISD 200904041 WINTERS JH 75.0 95.0 69.9 52.4SAN ANGELO ISD 226903043 LEE MS 72.0 84.0 50.2 56.0COAHOMA ISD 114902041 COAHOMA JH 66.0 86.0 40.3 35.1SAN ANGELO ISD 226903045 LINCOLN MS 61.0 83.0 71.9 67.3CROCKETT COUNTY CONSOLIDATED 53001041 OZONA MS 60.0 91.0 52.7 75.7REAGAN COUNTY ISD 192901041 REAGAN COUNTY MS 51.0 88.0 51.4 70.6WYLIE TWO ISD 221912104 WYLIE MS 98.0 95.0 12.9 10.9
79.3 91.7 48.2 43.0 AVERAGE
Angelo State University
30 Highest-Achieving Middle Schools in Mathematics 2007
PACE System 2008B.2.d
Page 26 Source Data: AEIS
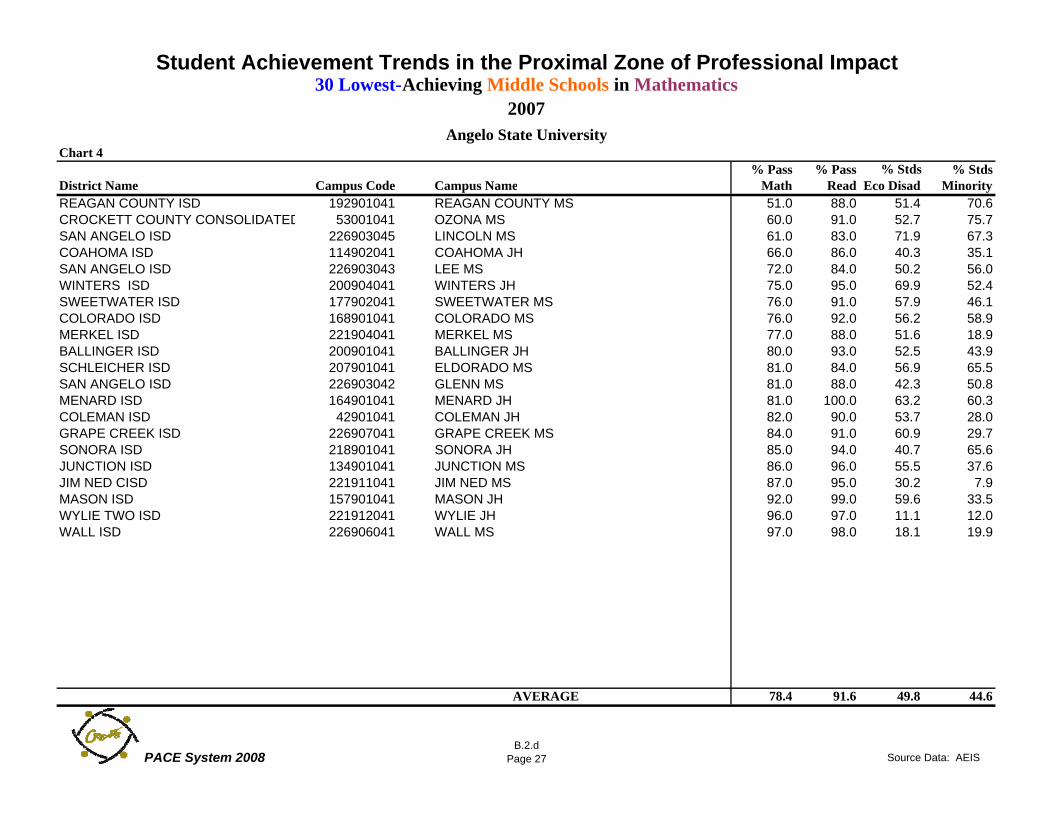
Student Achievement Trends in the Proximal Zone of Professional Impact
Chart 4% Pass % Pass % Stds % Stds
District Name Campus Code Campus Name Math Read Eco Disad MinorityREAGAN COUNTY ISD 192901041 REAGAN COUNTY MS 51.0 88.0 51.4 70.6CROCKETT COUNTY CONSOLIDATED 53001041 OZONA MS 60.0 91.0 52.7 75.7SAN ANGELO ISD 226903045 LINCOLN MS 61.0 83.0 71.9 67.3COAHOMA ISD 114902041 COAHOMA JH 66.0 86.0 40.3 35.1SAN ANGELO ISD 226903043 LEE MS 72.0 84.0 50.2 56.0WINTERS ISD 200904041 WINTERS JH 75.0 95.0 69.9 52.4SWEETWATER ISD 177902041 SWEETWATER MS 76.0 91.0 57.9 46.1COLORADO ISD 168901041 COLORADO MS 76.0 92.0 56.2 58.9MERKEL ISD 221904041 MERKEL MS 77.0 88.0 51.6 18.9BALLINGER ISD 200901041 BALLINGER JH 80.0 93.0 52.5 43.9SCHLEICHER ISD 207901041 ELDORADO MS 81.0 84.0 56.9 65.5SAN ANGELO ISD 226903042 GLENN MS 81.0 88.0 42.3 50.8MENARD ISD 164901041 MENARD JH 81.0 100.0 63.2 60.3COLEMAN ISD 42901041 COLEMAN JH 82.0 90.0 53.7 28.0GRAPE CREEK ISD 226907041 GRAPE CREEK MS 84.0 91.0 60.9 29.7SONORA ISD 218901041 SONORA JH 85.0 94.0 40.7 65.6JUNCTION ISD 134901041 JUNCTION MS 86.0 96.0 55.5 37.6JIM NED CISD 221911041 JIM NED MS 87.0 95.0 30.2 7.9MASON ISD 157901041 MASON JH 92.0 99.0 59.6 33.5WYLIE TWO ISD 221912041 WYLIE JH 96.0 97.0 11.1 12.0WALL ISD 226906041 WALL MS 97.0 98.0 18.1 19.9
78.4 91.6 49.8 44.6 AVERAGE
30 Lowest-Achieving Middle Schools in Mathematics 2007
Angelo State University
PACE System 2008B.2.d
Page 27 Source Data: AEIS
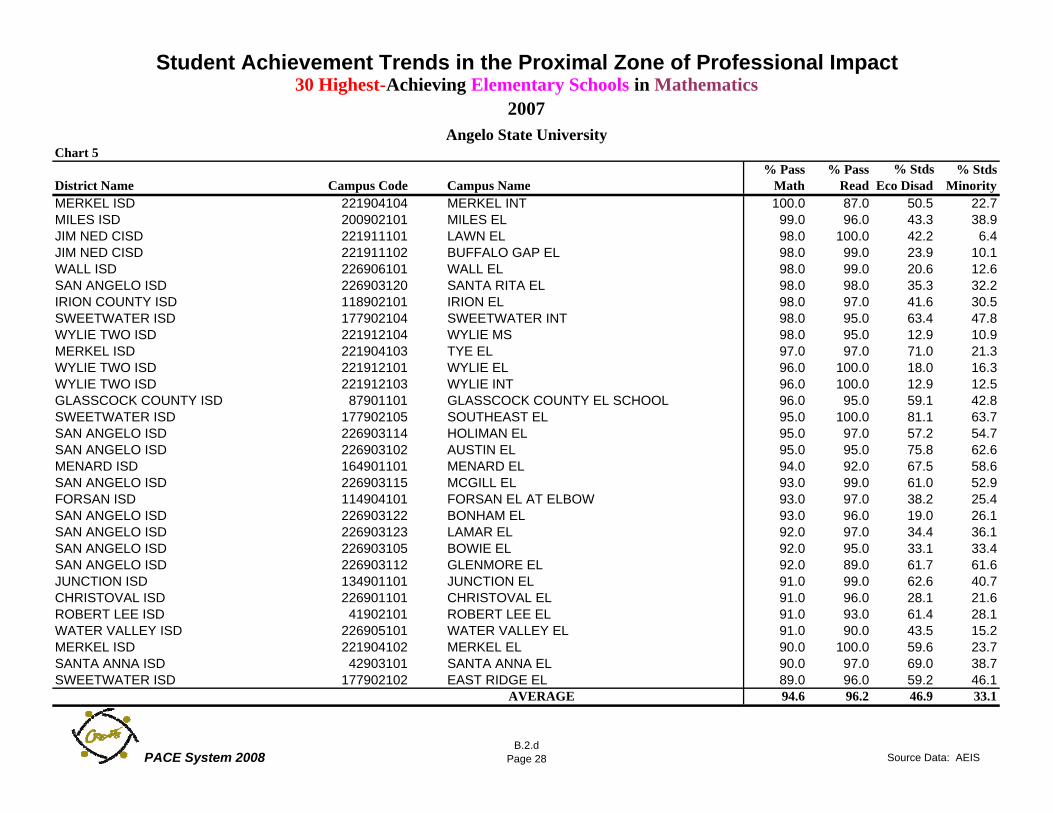
Student Achievement Trends in the Proximal Zone of Professional Impact
Chart 5% Pass % Pass % Stds % Stds
District Name Campus Code Campus Name Math Read Eco Disad MinorityMERKEL ISD 221904104 MERKEL INT 100.0 87.0 50.5 22.7MILES ISD 200902101 MILES EL 99.0 96.0 43.3 38.9JIM NED CISD 221911101 LAWN EL 98.0 100.0 42.2 6.4JIM NED CISD 221911102 BUFFALO GAP EL 98.0 99.0 23.9 10.1WALL ISD 226906101 WALL EL 98.0 99.0 20.6 12.6SAN ANGELO ISD 226903120 SANTA RITA EL 98.0 98.0 35.3 32.2IRION COUNTY ISD 118902101 IRION EL 98.0 97.0 41.6 30.5SWEETWATER ISD 177902104 SWEETWATER INT 98.0 95.0 63.4 47.8WYLIE TWO ISD 221912104 WYLIE MS 98.0 95.0 12.9 10.9MERKEL ISD 221904103 TYE EL 97.0 97.0 71.0 21.3WYLIE TWO ISD 221912101 WYLIE EL 96.0 100.0 18.0 16.3WYLIE TWO ISD 221912103 WYLIE INT 96.0 100.0 12.9 12.5GLASSCOCK COUNTY ISD 87901101 GLASSCOCK COUNTY EL SCHOOL 96.0 95.0 59.1 42.8SWEETWATER ISD 177902105 SOUTHEAST EL 95.0 100.0 81.1 63.7SAN ANGELO ISD 226903114 HOLIMAN EL 95.0 97.0 57.2 54.7SAN ANGELO ISD 226903102 AUSTIN EL 95.0 95.0 75.8 62.6MENARD ISD 164901101 MENARD EL 94.0 92.0 67.5 58.6SAN ANGELO ISD 226903115 MCGILL EL 93.0 99.0 61.0 52.9FORSAN ISD 114904101 FORSAN EL AT ELBOW 93.0 97.0 38.2 25.4SAN ANGELO ISD 226903122 BONHAM EL 93.0 96.0 19.0 26.1SAN ANGELO ISD 226903123 LAMAR EL 92.0 97.0 34.4 36.1SAN ANGELO ISD 226903105 BOWIE EL 92.0 95.0 33.1 33.4SAN ANGELO ISD 226903112 GLENMORE EL 92.0 89.0 61.7 61.6JUNCTION ISD 134901101 JUNCTION EL 91.0 99.0 62.6 40.7CHRISTOVAL ISD 226901101 CHRISTOVAL EL 91.0 96.0 28.1 21.6ROBERT LEE ISD 41902101 ROBERT LEE EL 91.0 93.0 61.4 28.1WATER VALLEY ISD 226905101 WATER VALLEY EL 91.0 90.0 43.5 15.2MERKEL ISD 221904102 MERKEL EL 90.0 100.0 59.6 23.7SANTA ANNA ISD 42903101 SANTA ANNA EL 90.0 97.0 69.0 38.7SWEETWATER ISD 177902102 EAST RIDGE EL 89.0 96.0 59.2 46.1
94.6 96.2 46.9 33.1 AVERAGE
30 Highest-Achieving Elementary Schools in Mathematics2007
Angelo State University
PACE System 2008B.2.d
Page 28 Source Data: AEIS
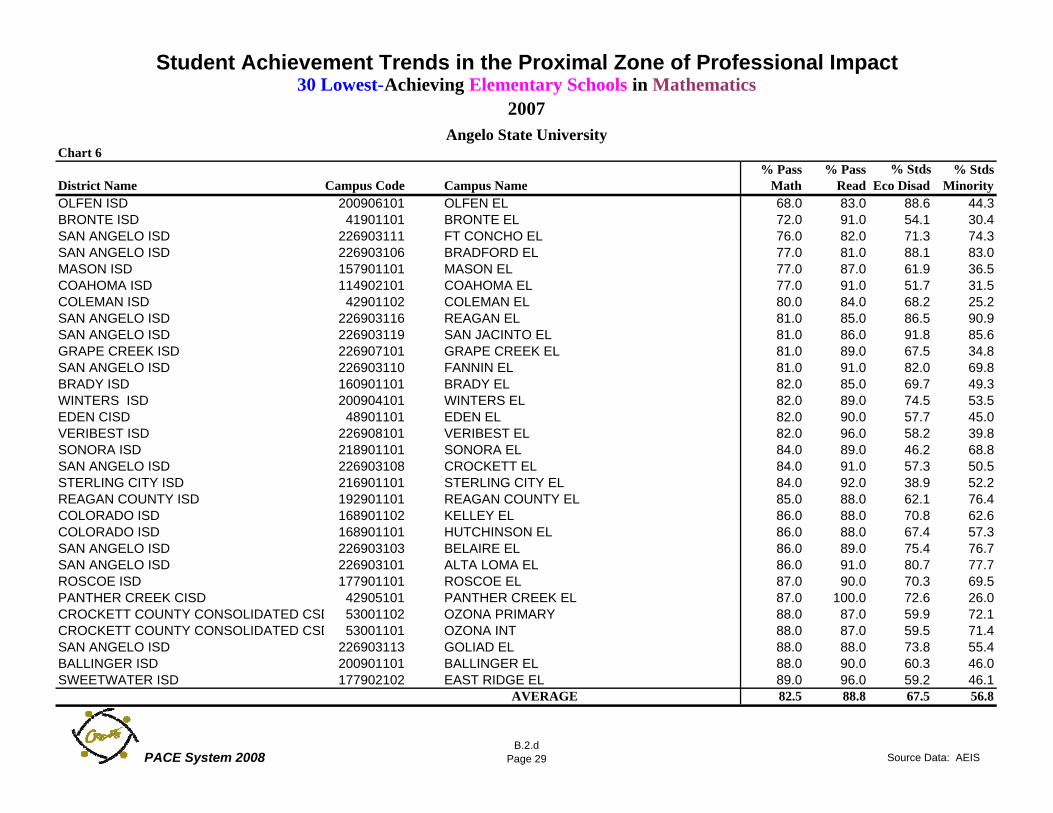
Student Achievement Trends in the Proximal Zone of Professional Impact
Chart 6% Pass % Pass % Stds % Stds
District Name Campus Code Campus Name Math Read Eco Disad MinorityOLFEN ISD 200906101 OLFEN EL 68.0 83.0 88.6 44.3BRONTE ISD 41901101 BRONTE EL 72.0 91.0 54.1 30.4SAN ANGELO ISD 226903111 FT CONCHO EL 76.0 82.0 71.3 74.3SAN ANGELO ISD 226903106 BRADFORD EL 77.0 81.0 88.1 83.0MASON ISD 157901101 MASON EL 77.0 87.0 61.9 36.5COAHOMA ISD 114902101 COAHOMA EL 77.0 91.0 51.7 31.5COLEMAN ISD 42901102 COLEMAN EL 80.0 84.0 68.2 25.2SAN ANGELO ISD 226903116 REAGAN EL 81.0 85.0 86.5 90.9SAN ANGELO ISD 226903119 SAN JACINTO EL 81.0 86.0 91.8 85.6GRAPE CREEK ISD 226907101 GRAPE CREEK EL 81.0 89.0 67.5 34.8SAN ANGELO ISD 226903110 FANNIN EL 81.0 91.0 82.0 69.8BRADY ISD 160901101 BRADY EL 82.0 85.0 69.7 49.3WINTERS ISD 200904101 WINTERS EL 82.0 89.0 74.5 53.5EDEN CISD 48901101 EDEN EL 82.0 90.0 57.7 45.0VERIBEST ISD 226908101 VERIBEST EL 82.0 96.0 58.2 39.8SONORA ISD 218901101 SONORA EL 84.0 89.0 46.2 68.8SAN ANGELO ISD 226903108 CROCKETT EL 84.0 91.0 57.3 50.5STERLING CITY ISD 216901101 STERLING CITY EL 84.0 92.0 38.9 52.2REAGAN COUNTY ISD 192901101 REAGAN COUNTY EL 85.0 88.0 62.1 76.4COLORADO ISD 168901102 KELLEY EL 86.0 88.0 70.8 62.6COLORADO ISD 168901101 HUTCHINSON EL 86.0 88.0 67.4 57.3SAN ANGELO ISD 226903103 BELAIRE EL 86.0 89.0 75.4 76.7SAN ANGELO ISD 226903101 ALTA LOMA EL 86.0 91.0 80.7 77.7ROSCOE ISD 177901101 ROSCOE EL 87.0 90.0 70.3 69.5PANTHER CREEK CISD 42905101 PANTHER CREEK EL 87.0 100.0 72.6 26.0CROCKETT COUNTY CONSOLIDATED CSD 53001102 OZONA PRIMARY 88.0 87.0 59.9 72.1CROCKETT COUNTY CONSOLIDATED CSD 53001101 OZONA INT 88.0 87.0 59.5 71.4SAN ANGELO ISD 226903113 GOLIAD EL 88.0 88.0 73.8 55.4BALLINGER ISD 200901101 BALLINGER EL 88.0 90.0 60.3 46.0SWEETWATER ISD 177902102 EAST RIDGE EL 89.0 96.0 59.2 46.1
82.5 88.8 67.5 56.8 AVERAGE
30 Lowest-Achieving Elementary Schools in Mathematics2007
Angelo State University
PACE System 2008B.2.d
Page 29 Source Data: AEIS
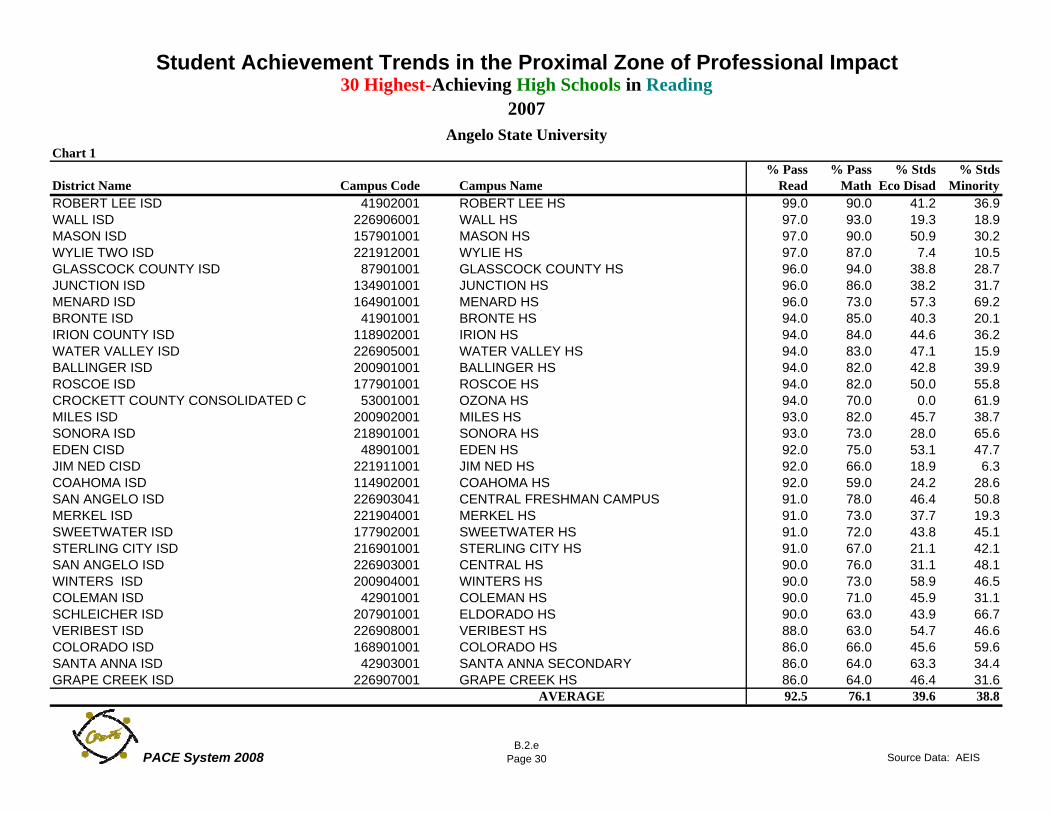
Student Achievement Trends in the Proximal Zone of Professional Impact
Chart 1% Pass % Pass % Stds % Stds
District Name Campus Code Campus Name Read Math Eco Disad MinorityROBERT LEE ISD 41902001 ROBERT LEE HS 99.0 90.0 41.2 36.9WALL ISD 226906001 WALL HS 97.0 93.0 19.3 18.9MASON ISD 157901001 MASON HS 97.0 90.0 50.9 30.2WYLIE TWO ISD 221912001 WYLIE HS 97.0 87.0 7.4 10.5GLASSCOCK COUNTY ISD 87901001 GLASSCOCK COUNTY HS 96.0 94.0 38.8 28.7JUNCTION ISD 134901001 JUNCTION HS 96.0 86.0 38.2 31.7MENARD ISD 164901001 MENARD HS 96.0 73.0 57.3 69.2BRONTE ISD 41901001 BRONTE HS 94.0 85.0 40.3 20.1IRION COUNTY ISD 118902001 IRION HS 94.0 84.0 44.6 36.2WATER VALLEY ISD 226905001 WATER VALLEY HS 94.0 83.0 47.1 15.9BALLINGER ISD 200901001 BALLINGER HS 94.0 82.0 42.8 39.9ROSCOE ISD 177901001 ROSCOE HS 94.0 82.0 50.0 55.8CROCKETT COUNTY CONSOLIDATED CS 53001001 OZONA HS 94.0 70.0 0.0 61.9MILES ISD 200902001 MILES HS 93.0 82.0 45.7 38.7SONORA ISD 218901001 SONORA HS 93.0 73.0 28.0 65.6EDEN CISD 48901001 EDEN HS 92.0 75.0 53.1 47.7JIM NED CISD 221911001 JIM NED HS 92.0 66.0 18.9 6.3COAHOMA ISD 114902001 COAHOMA HS 92.0 59.0 24.2 28.6SAN ANGELO ISD 226903041 CENTRAL FRESHMAN CAMPUS 91.0 78.0 46.4 50.8MERKEL ISD 221904001 MERKEL HS 91.0 73.0 37.7 19.3SWEETWATER ISD 177902001 SWEETWATER HS 91.0 72.0 43.8 45.1STERLING CITY ISD 216901001 STERLING CITY HS 91.0 67.0 21.1 42.1SAN ANGELO ISD 226903001 CENTRAL HS 90.0 76.0 31.1 48.1WINTERS ISD 200904001 WINTERS HS 90.0 73.0 58.9 46.5COLEMAN ISD 42901001 COLEMAN HS 90.0 71.0 45.9 31.1SCHLEICHER ISD 207901001 ELDORADO HS 90.0 63.0 43.9 66.7VERIBEST ISD 226908001 VERIBEST HS 88.0 63.0 54.7 46.6COLORADO ISD 168901001 COLORADO HS 86.0 66.0 45.6 59.6SANTA ANNA ISD 42903001 SANTA ANNA SECONDARY 86.0 64.0 63.3 34.4GRAPE CREEK ISD 226907001 GRAPE CREEK HS 86.0 64.0 46.4 31.6
AVERAGE 92.5 76.1 39.6 38.8
30 Highest-Achieving High Schools in Reading 2007
Angelo State University
PACE System 2008B.2.e
Page 30 Source Data: AEIS
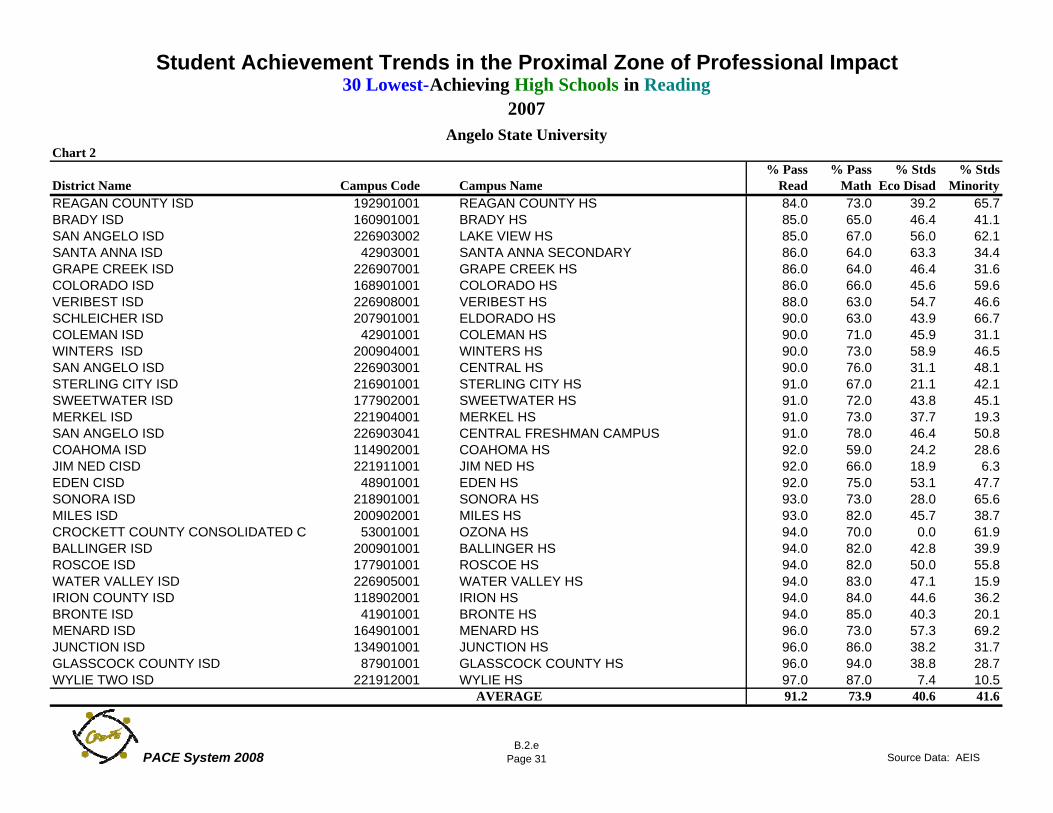
Student Achievement Trends in the Proximal Zone of Professional Impact
Chart 2% Pass % Pass % Stds % Stds
District Name Campus Code Campus Name Read Math Eco Disad MinorityREAGAN COUNTY ISD 192901001 REAGAN COUNTY HS 84.0 73.0 39.2 65.7BRADY ISD 160901001 BRADY HS 85.0 65.0 46.4 41.1SAN ANGELO ISD 226903002 LAKE VIEW HS 85.0 67.0 56.0 62.1SANTA ANNA ISD 42903001 SANTA ANNA SECONDARY 86.0 64.0 63.3 34.4GRAPE CREEK ISD 226907001 GRAPE CREEK HS 86.0 64.0 46.4 31.6COLORADO ISD 168901001 COLORADO HS 86.0 66.0 45.6 59.6VERIBEST ISD 226908001 VERIBEST HS 88.0 63.0 54.7 46.6SCHLEICHER ISD 207901001 ELDORADO HS 90.0 63.0 43.9 66.7COLEMAN ISD 42901001 COLEMAN HS 90.0 71.0 45.9 31.1WINTERS ISD 200904001 WINTERS HS 90.0 73.0 58.9 46.5SAN ANGELO ISD 226903001 CENTRAL HS 90.0 76.0 31.1 48.1STERLING CITY ISD 216901001 STERLING CITY HS 91.0 67.0 21.1 42.1SWEETWATER ISD 177902001 SWEETWATER HS 91.0 72.0 43.8 45.1MERKEL ISD 221904001 MERKEL HS 91.0 73.0 37.7 19.3SAN ANGELO ISD 226903041 CENTRAL FRESHMAN CAMPUS 91.0 78.0 46.4 50.8COAHOMA ISD 114902001 COAHOMA HS 92.0 59.0 24.2 28.6JIM NED CISD 221911001 JIM NED HS 92.0 66.0 18.9 6.3EDEN CISD 48901001 EDEN HS 92.0 75.0 53.1 47.7SONORA ISD 218901001 SONORA HS 93.0 73.0 28.0 65.6MILES ISD 200902001 MILES HS 93.0 82.0 45.7 38.7CROCKETT COUNTY CONSOLIDATED CS 53001001 OZONA HS 94.0 70.0 0.0 61.9BALLINGER ISD 200901001 BALLINGER HS 94.0 82.0 42.8 39.9ROSCOE ISD 177901001 ROSCOE HS 94.0 82.0 50.0 55.8WATER VALLEY ISD 226905001 WATER VALLEY HS 94.0 83.0 47.1 15.9IRION COUNTY ISD 118902001 IRION HS 94.0 84.0 44.6 36.2BRONTE ISD 41901001 BRONTE HS 94.0 85.0 40.3 20.1MENARD ISD 164901001 MENARD HS 96.0 73.0 57.3 69.2JUNCTION ISD 134901001 JUNCTION HS 96.0 86.0 38.2 31.7GLASSCOCK COUNTY ISD 87901001 GLASSCOCK COUNTY HS 96.0 94.0 38.8 28.7WYLIE TWO ISD 221912001 WYLIE HS 97.0 87.0 7.4 10.5
91.2 73.9 40.6 41.6 AVERAGE
30 Lowest-Achieving High Schools in Reading 2007
Angelo State University
PACE System 2008B.2.e
Page 31 Source Data: AEIS
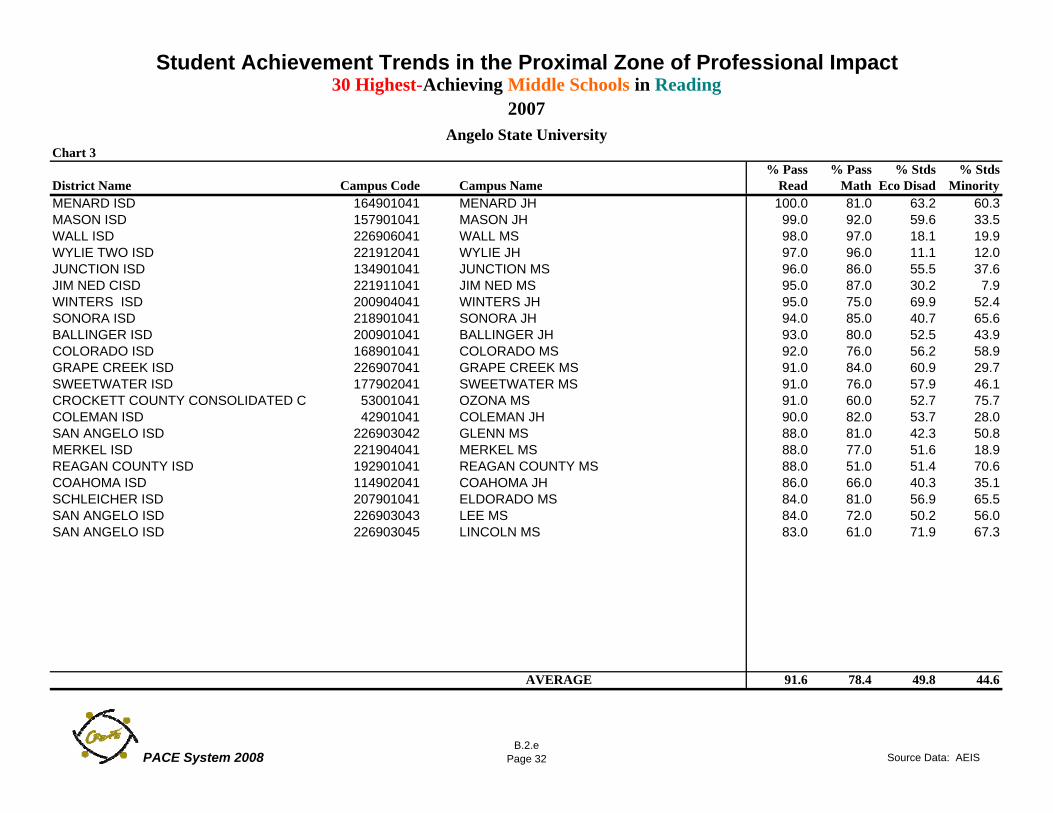
Student Achievement Trends in the Proximal Zone of Professional Impact
Chart 3% Pass % Pass % Stds % Stds
District Name Campus Code Campus Name Read Math Eco Disad MinorityMENARD ISD 164901041 MENARD JH 100.0 81.0 63.2 60.3MASON ISD 157901041 MASON JH 99.0 92.0 59.6 33.5WALL ISD 226906041 WALL MS 98.0 97.0 18.1 19.9WYLIE TWO ISD 221912041 WYLIE JH 97.0 96.0 11.1 12.0JUNCTION ISD 134901041 JUNCTION MS 96.0 86.0 55.5 37.6JIM NED CISD 221911041 JIM NED MS 95.0 87.0 30.2 7.9WINTERS ISD 200904041 WINTERS JH 95.0 75.0 69.9 52.4SONORA ISD 218901041 SONORA JH 94.0 85.0 40.7 65.6BALLINGER ISD 200901041 BALLINGER JH 93.0 80.0 52.5 43.9COLORADO ISD 168901041 COLORADO MS 92.0 76.0 56.2 58.9GRAPE CREEK ISD 226907041 GRAPE CREEK MS 91.0 84.0 60.9 29.7SWEETWATER ISD 177902041 SWEETWATER MS 91.0 76.0 57.9 46.1CROCKETT COUNTY CONSOLIDATED CS 53001041 OZONA MS 91.0 60.0 52.7 75.7COLEMAN ISD 42901041 COLEMAN JH 90.0 82.0 53.7 28.0SAN ANGELO ISD 226903042 GLENN MS 88.0 81.0 42.3 50.8MERKEL ISD 221904041 MERKEL MS 88.0 77.0 51.6 18.9REAGAN COUNTY ISD 192901041 REAGAN COUNTY MS 88.0 51.0 51.4 70.6COAHOMA ISD 114902041 COAHOMA JH 86.0 66.0 40.3 35.1SCHLEICHER ISD 207901041 ELDORADO MS 84.0 81.0 56.9 65.5SAN ANGELO ISD 226903043 LEE MS 84.0 72.0 50.2 56.0SAN ANGELO ISD 226903045 LINCOLN MS 83.0 61.0 71.9 67.3
91.6 78.4 49.8 44.6 AVERAGE
30 Highest-Achieving Middle Schools in Reading2007
Angelo State University
PACE System 2008B.2.e
Page 32 Source Data: AEIS
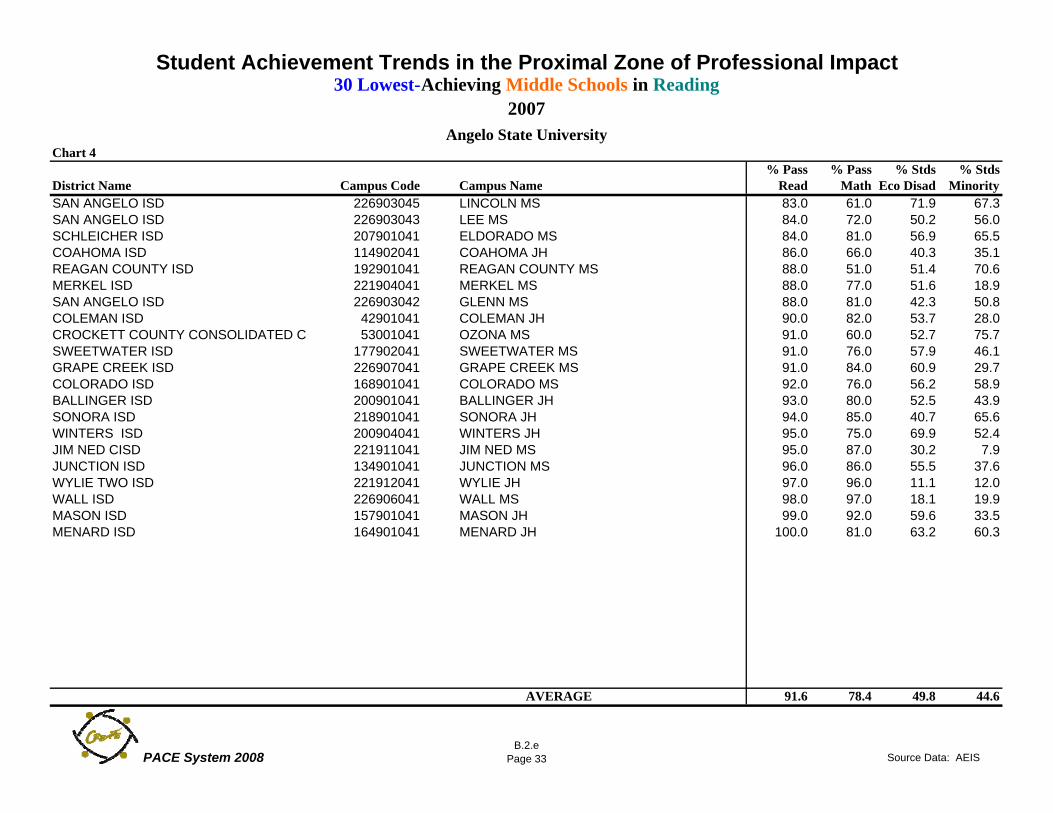
Student Achievement Trends in the Proximal Zone of Professional Impact
Chart 4% Pass % Pass % Stds % Stds
District Name Campus Code Campus Name Read Math Eco Disad MinoritySAN ANGELO ISD 226903045 LINCOLN MS 83.0 61.0 71.9 67.3SAN ANGELO ISD 226903043 LEE MS 84.0 72.0 50.2 56.0SCHLEICHER ISD 207901041 ELDORADO MS 84.0 81.0 56.9 65.5COAHOMA ISD 114902041 COAHOMA JH 86.0 66.0 40.3 35.1REAGAN COUNTY ISD 192901041 REAGAN COUNTY MS 88.0 51.0 51.4 70.6MERKEL ISD 221904041 MERKEL MS 88.0 77.0 51.6 18.9SAN ANGELO ISD 226903042 GLENN MS 88.0 81.0 42.3 50.8COLEMAN ISD 42901041 COLEMAN JH 90.0 82.0 53.7 28.0CROCKETT COUNTY CONSOLIDATED CS 53001041 OZONA MS 91.0 60.0 52.7 75.7SWEETWATER ISD 177902041 SWEETWATER MS 91.0 76.0 57.9 46.1GRAPE CREEK ISD 226907041 GRAPE CREEK MS 91.0 84.0 60.9 29.7COLORADO ISD 168901041 COLORADO MS 92.0 76.0 56.2 58.9BALLINGER ISD 200901041 BALLINGER JH 93.0 80.0 52.5 43.9SONORA ISD 218901041 SONORA JH 94.0 85.0 40.7 65.6WINTERS ISD 200904041 WINTERS JH 95.0 75.0 69.9 52.4JIM NED CISD 221911041 JIM NED MS 95.0 87.0 30.2 7.9JUNCTION ISD 134901041 JUNCTION MS 96.0 86.0 55.5 37.6WYLIE TWO ISD 221912041 WYLIE JH 97.0 96.0 11.1 12.0WALL ISD 226906041 WALL MS 98.0 97.0 18.1 19.9MASON ISD 157901041 MASON JH 99.0 92.0 59.6 33.5MENARD ISD 164901041 MENARD JH 100.0 81.0 63.2 60.3
91.6 78.4 49.8 44.6 AVERAGE
30 Lowest-Achieving Middle Schools in Reading2007
Angelo State University
PACE System 2008B.2.e
Page 33 Source Data: AEIS
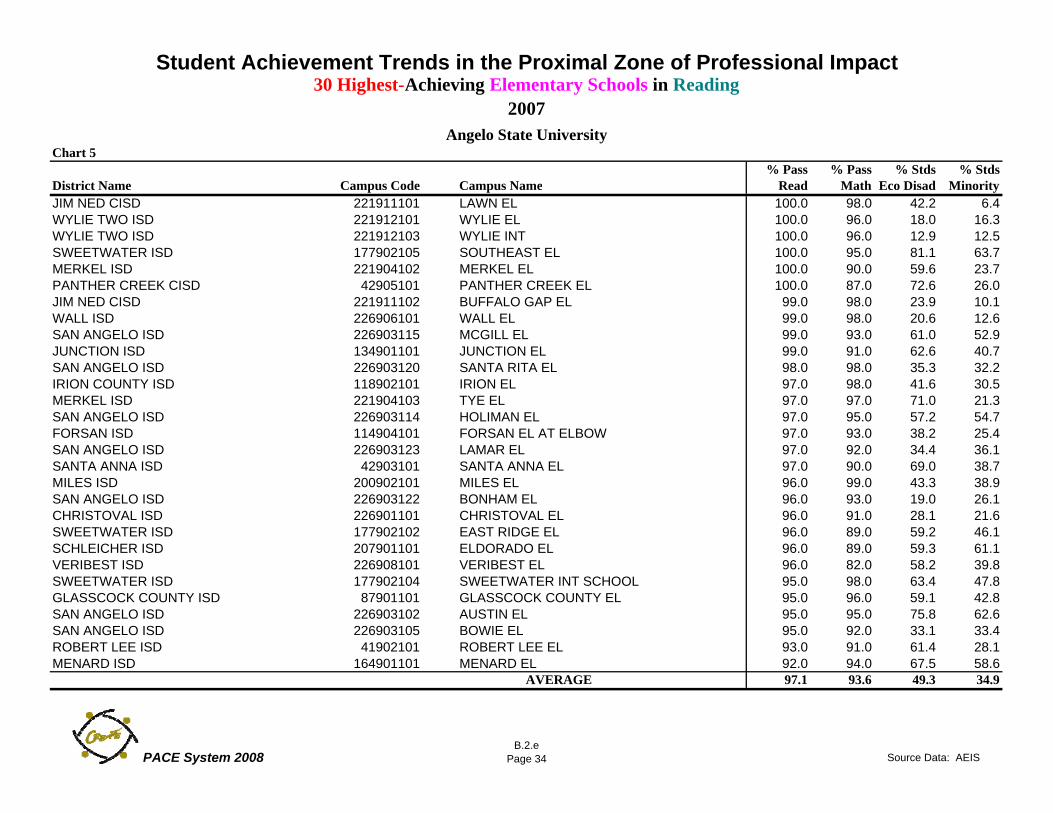
Student Achievement Trends in the Proximal Zone of Professional Impact
Chart 5% Pass % Pass % Stds % Stds
District Name Campus Code Campus Name Read Math Eco Disad MinorityJIM NED CISD 221911101 LAWN EL 100.0 98.0 42.2 6.4WYLIE TWO ISD 221912101 WYLIE EL 100.0 96.0 18.0 16.3WYLIE TWO ISD 221912103 WYLIE INT 100.0 96.0 12.9 12.5SWEETWATER ISD 177902105 SOUTHEAST EL 100.0 95.0 81.1 63.7MERKEL ISD 221904102 MERKEL EL 100.0 90.0 59.6 23.7PANTHER CREEK CISD 42905101 PANTHER CREEK EL 100.0 87.0 72.6 26.0JIM NED CISD 221911102 BUFFALO GAP EL 99.0 98.0 23.9 10.1WALL ISD 226906101 WALL EL 99.0 98.0 20.6 12.6SAN ANGELO ISD 226903115 MCGILL EL 99.0 93.0 61.0 52.9JUNCTION ISD 134901101 JUNCTION EL 99.0 91.0 62.6 40.7SAN ANGELO ISD 226903120 SANTA RITA EL 98.0 98.0 35.3 32.2IRION COUNTY ISD 118902101 IRION EL 97.0 98.0 41.6 30.5MERKEL ISD 221904103 TYE EL 97.0 97.0 71.0 21.3SAN ANGELO ISD 226903114 HOLIMAN EL 97.0 95.0 57.2 54.7FORSAN ISD 114904101 FORSAN EL AT ELBOW 97.0 93.0 38.2 25.4SAN ANGELO ISD 226903123 LAMAR EL 97.0 92.0 34.4 36.1SANTA ANNA ISD 42903101 SANTA ANNA EL 97.0 90.0 69.0 38.7MILES ISD 200902101 MILES EL 96.0 99.0 43.3 38.9SAN ANGELO ISD 226903122 BONHAM EL 96.0 93.0 19.0 26.1CHRISTOVAL ISD 226901101 CHRISTOVAL EL 96.0 91.0 28.1 21.6SWEETWATER ISD 177902102 EAST RIDGE EL 96.0 89.0 59.2 46.1SCHLEICHER ISD 207901101 ELDORADO EL 96.0 89.0 59.3 61.1VERIBEST ISD 226908101 VERIBEST EL 96.0 82.0 58.2 39.8SWEETWATER ISD 177902104 SWEETWATER INT SCHOOL 95.0 98.0 63.4 47.8GLASSCOCK COUNTY ISD 87901101 GLASSCOCK COUNTY EL 95.0 96.0 59.1 42.8SAN ANGELO ISD 226903102 AUSTIN EL 95.0 95.0 75.8 62.6SAN ANGELO ISD 226903105 BOWIE EL 95.0 92.0 33.1 33.4ROBERT LEE ISD 41902101 ROBERT LEE EL 93.0 91.0 61.4 28.1MENARD ISD 164901101 MENARD EL 92.0 94.0 67.5 58.6
97.1 93.6 49.3 34.9 AVERAGE
30 Highest-Achieving Elementary Schools in Reading 2007
Angelo State University
PACE System 2008B.2.e
Page 34 Source Data: AEIS
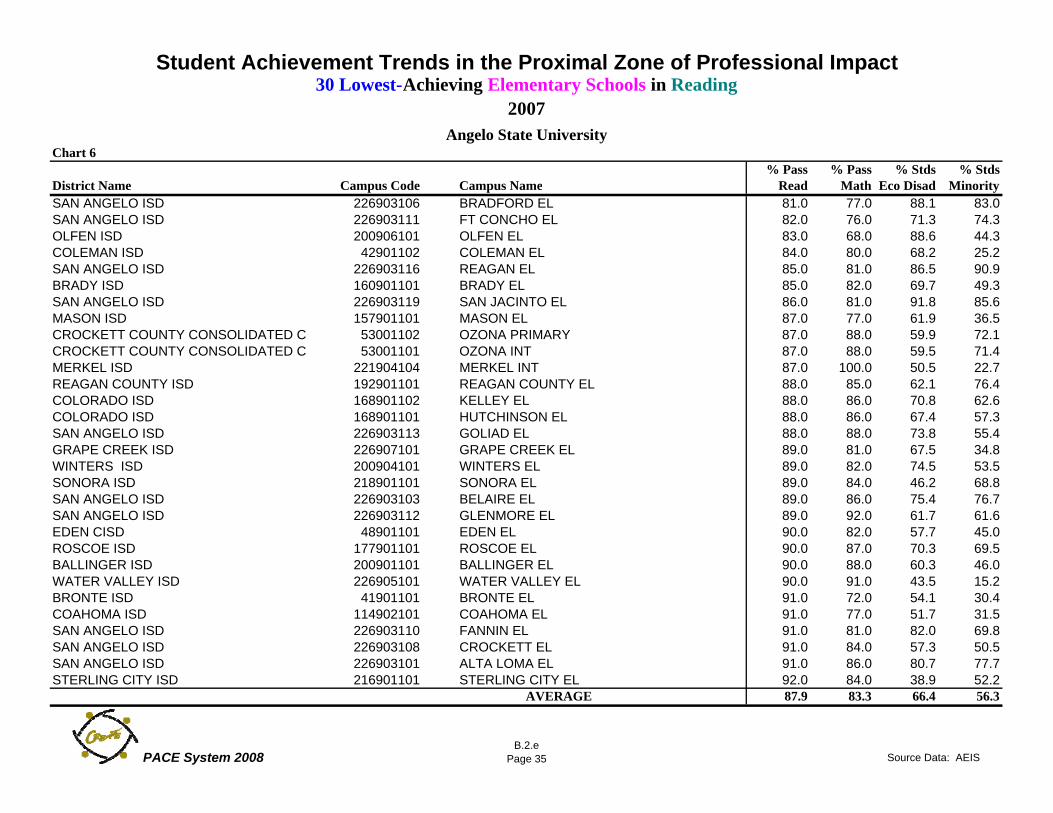
Student Achievement Trends in the Proximal Zone of Professional Impact
Chart 6% Pass % Pass % Stds % Stds
District Name Campus Code Campus Name Read Math Eco Disad MinoritySAN ANGELO ISD 226903106 BRADFORD EL 81.0 77.0 88.1 83.0SAN ANGELO ISD 226903111 FT CONCHO EL 82.0 76.0 71.3 74.3OLFEN ISD 200906101 OLFEN EL 83.0 68.0 88.6 44.3COLEMAN ISD 42901102 COLEMAN EL 84.0 80.0 68.2 25.2SAN ANGELO ISD 226903116 REAGAN EL 85.0 81.0 86.5 90.9BRADY ISD 160901101 BRADY EL 85.0 82.0 69.7 49.3SAN ANGELO ISD 226903119 SAN JACINTO EL 86.0 81.0 91.8 85.6MASON ISD 157901101 MASON EL 87.0 77.0 61.9 36.5CROCKETT COUNTY CONSOLIDATED CS 53001102 OZONA PRIMARY 87.0 88.0 59.9 72.1CROCKETT COUNTY CONSOLIDATED CS 53001101 OZONA INT 87.0 88.0 59.5 71.4MERKEL ISD 221904104 MERKEL INT 87.0 100.0 50.5 22.7REAGAN COUNTY ISD 192901101 REAGAN COUNTY EL 88.0 85.0 62.1 76.4COLORADO ISD 168901102 KELLEY EL 88.0 86.0 70.8 62.6COLORADO ISD 168901101 HUTCHINSON EL 88.0 86.0 67.4 57.3SAN ANGELO ISD 226903113 GOLIAD EL 88.0 88.0 73.8 55.4GRAPE CREEK ISD 226907101 GRAPE CREEK EL 89.0 81.0 67.5 34.8WINTERS ISD 200904101 WINTERS EL 89.0 82.0 74.5 53.5SONORA ISD 218901101 SONORA EL 89.0 84.0 46.2 68.8SAN ANGELO ISD 226903103 BELAIRE EL 89.0 86.0 75.4 76.7SAN ANGELO ISD 226903112 GLENMORE EL 89.0 92.0 61.7 61.6EDEN CISD 48901101 EDEN EL 90.0 82.0 57.7 45.0ROSCOE ISD 177901101 ROSCOE EL 90.0 87.0 70.3 69.5BALLINGER ISD 200901101 BALLINGER EL 90.0 88.0 60.3 46.0WATER VALLEY ISD 226905101 WATER VALLEY EL 90.0 91.0 43.5 15.2BRONTE ISD 41901101 BRONTE EL 91.0 72.0 54.1 30.4COAHOMA ISD 114902101 COAHOMA EL 91.0 77.0 51.7 31.5SAN ANGELO ISD 226903110 FANNIN EL 91.0 81.0 82.0 69.8SAN ANGELO ISD 226903108 CROCKETT EL 91.0 84.0 57.3 50.5SAN ANGELO ISD 226903101 ALTA LOMA EL 91.0 86.0 80.7 77.7STERLING CITY ISD 216901101 STERLING CITY EL 92.0 84.0 38.9 52.2
87.9 83.3 66.4 56.3 AVERAGE
30 Lowest-Achieving Elementary Schools in Reading2007
Angelo State University
PACE System 2008B.2.e
Page 35 Source Data: AEIS
II. University and Teacher Education Trends
PACE 2008
C. UNIVERSITY AND TEACHER PRODUCTION REPORTS
PACE 2008

36
SECTION C: University and Teacher Production Reports
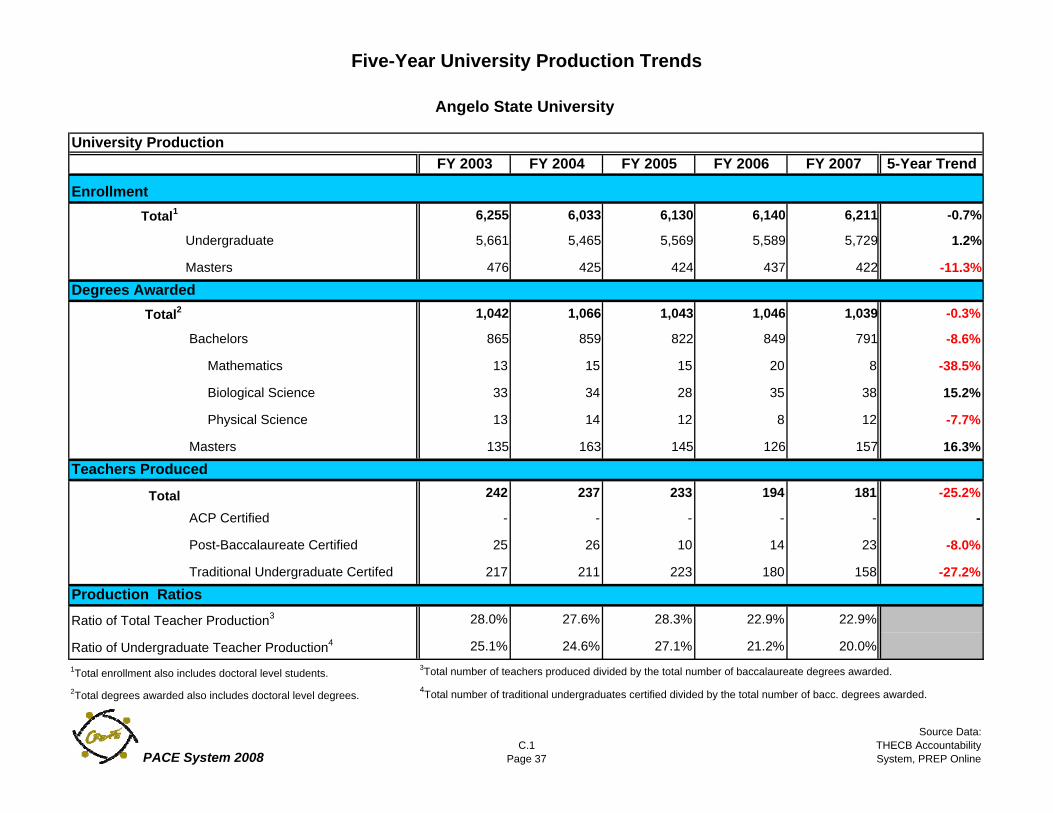
Section C provides data on the university production trends, university teacher and certificate production, as well as data regarding other producers of teachers in the PZPI. C.1: Five-Year University Production Trends. This report shows five-year trend data (FY2003-2007) regarding university enrollment, degrees awarded and the number of teachers produced. Production ratios were calculated for two different populations. First, a ratio of total teacher production was calculated by dividing the total number of teachers produced by the total number of baccalaureate degrees awarded. Second a ratio of undergraduate teacher production ratio was calculated by dividing the number of traditional undergraduates certified by the total number of baccalaureate degrees awarded. C.2: Teacher Production Trends for University Completers. This analysis provides the total number of teachers produced from 1997 through 2007. Teacher production is defined as the total number of individuals (unduplicated) receiving initial teacher certification from a program during the complete academic year from September 1st through August 31st. Thus, the 2007 production counts include all individuals from a program who obtained certification from September 1, 2006 through August 31, 2007. It is important to note that certification cohorts are not graduation cohorts. A program typically graduates more individuals than those who actually obtain certification in that year. Individuals often graduate and obtain certification in a subsequent academic year. Certification data are based upon when the individual initially applies for certification. For example, a person can complete a program in AY 2003, yet decide not to obtain certification until AY 2006. Such an individual would be included in the 2006 certification cohort rather than the 2003 certification cohort. TEA generally uses the date of the initial application as the date of certification. C.3: Other Producers of Teachers in the Proximal Zone of Professional Impact. This report shows the production trends for other suppliers of teachers in the same PZPI as the target university sorted from highest to lowest producer. C4: Initial Teacher Certification Production by Level. This analysis shows initial certificate production broken down by level over a ten-year period (1998-2007). The number of certificates is greater than the number of teachers produced since many teachers obtain more than one certificate. A 10-year and 5-year average certificate production is calculated. When possible a 5-year change is calculated. An asterisk (*) in the 5-year change column indicates the inability to calculate a 5-year change. The 5-year average for selected certificates is plotted in a table below the chart. C.5: Teacher Production by Race/Ethnicity. This analysis provides the number and percentages of individuals obtaining certification by race/ethnicity for AY 1997 through AY 2007 certification year equals fiscal year. The race/ethnicity of the individual is self-reported.
Five-Year University Production Trends
University ProductionFY 2003 FY 2004 FY 2005 FY 2006 FY 2007 5-Year Trend
Enrollment Total1 6,255 6,033 6,130 6,140 6,211 -0.7%
Undergraduate 5,661 5,465 5,569 5,589 5,729 1.2%
Masters 476 425 424 437 422 -11.3%Degrees Awarded Total2 1,042 1,066 1,043 1,046 1,039 -0.3%
Bachelors 865 859 822 849 791 -8.6%
Mathematics 13 15 15 20 8 -38.5%
Biological Science 33 34 28 35 38 15.2%
Physical Science 13 14 12 8 12 -7.7%
Masters 135 163 145 126 157 16.3%Teachers Produced
Total 242 237 233 194 181 -25.2%
ACP Certified - - - - - -
Post-Baccalaureate Certified 25 26 10 14 23 -8.0%
Traditional Undergraduate Certifed 217 211 223 180 158 -27.2%Production Ratios
Ratio of Total Teacher Production3 28.0% 27.6% 28.3% 22.9% 22.9%
Ratio of Undergraduate Teacher Production4 25.1% 24.6% 27.1% 21.2% 20.0%1Total enrollment also includes doctoral level students. 3Total number of teachers produced divided by the total number of baccalaureate degrees awarded.
2Total degrees awarded also includes doctoral level degrees. 4Total number of traditional undergraduates certified divided by the total number of bacc. degrees awarded.
Angelo State University
PACE System 2008C.1
Page 37
Source Data: THECB Accountability System, PREP Online
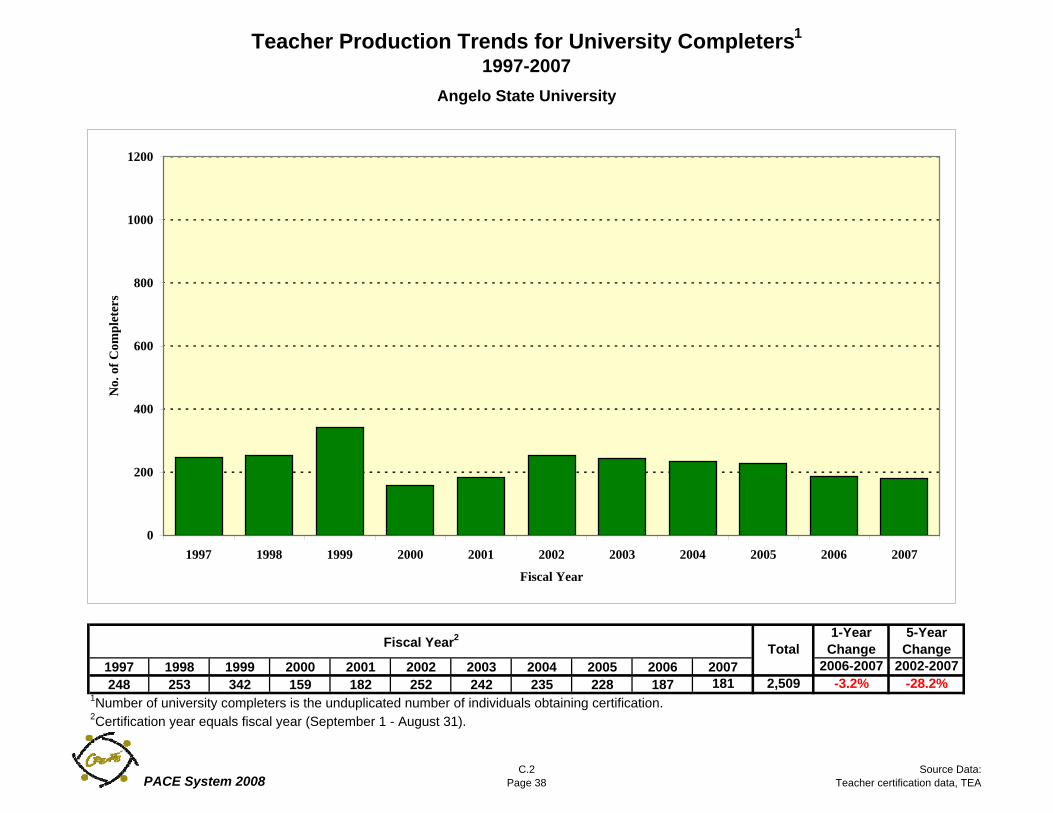
Teacher Production Trends for University Completers1
1997-2007
1-Year Change
5-Year Change
1997 1998 1999 2000 2001 2002 2003 2004 2005 2006 2007 2006-2007 2002-2007248 253 342 159 182 252 242 235 228 187 181 2,509 -3.2% -28.2%
1Number of university completers is the unduplicated number of individuals obtaining certification.2Certification year equals fiscal year (September 1 - August 31).
Angelo State University
Fiscal Year2Total
0
200
400
600
800
1000
1200
1997 1998 1999 2000 2001 2002 2003 2004 2005 2006 2007
Fiscal Year
No.
of C
ompl
eter
s
PACE System 2008C.2
Page 38Source Data:
Teacher certification data, TEA
Other Producers of Teachers in the Proximal Zone of Professional Impact 1997-2007
Angelo State University
There are no other producers of teachers in this zone.
PACE System 2008C.3
Page 39
Source Data:Teacher certification files, TEA
AEIS
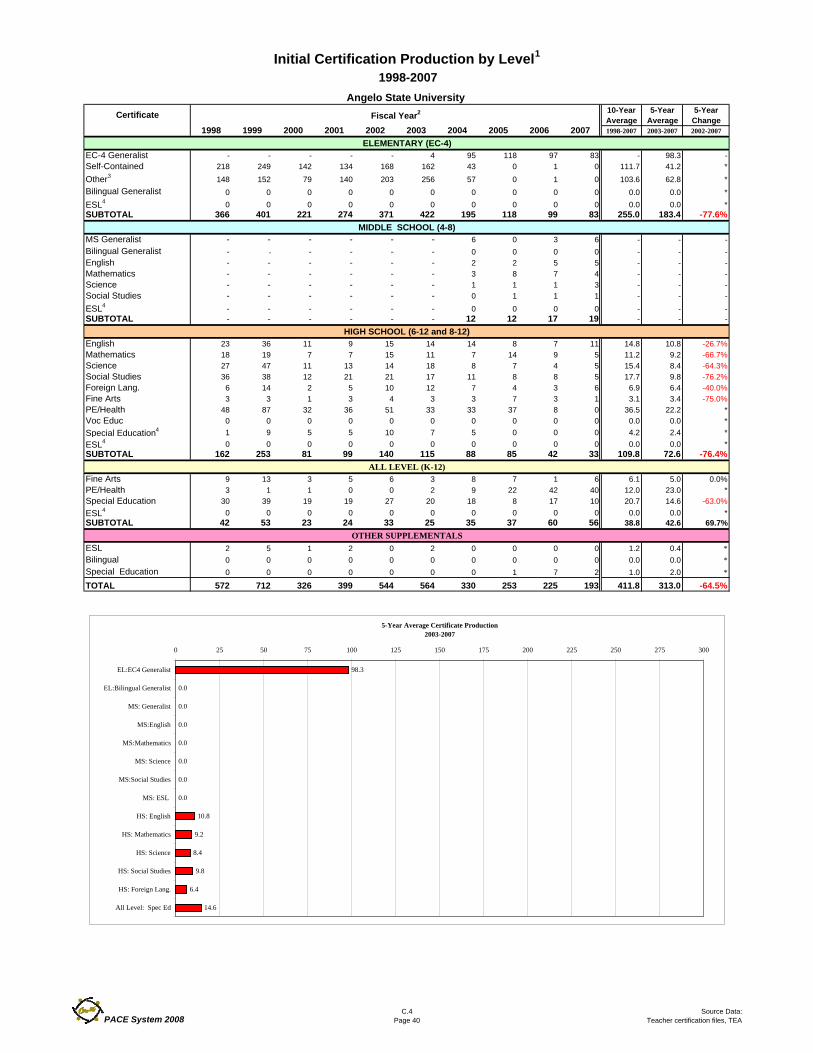
Initial Certification Production by Level1
1998-2007
10-Year 5-Year 5-YearAverage Average Change
1998 1999 2000 2001 2002 2003 2004 2005 2006 2007 1998-2007 2003-2007 2002-2007
EC-4 Generalist - - - - - 4 95 118 97 83 - 98.3 -Self-Contained 218 249 142 134 168 162 43 0 1 0 111.7 41.2 *Other3 148 152 79 140 203 256 57 0 1 0 103.6 62.8 *Bilingual Generalist 0 0 0 0 0 0 0 0 0 0 0.0 0.0 *ESL4 0 0 0 0 0 0 0 0 0 0 0.0 0.0 *SUBTOTAL 366 401 221 274 371 422 195 118 99 83 255.0 183.4 -77.6%
MS Generalist - - - - - - 6 0 3 6 - - -Bilingual Generalist - - - - - - 0 0 0 0 - - -English - - - - - - 2 2 5 5 - - -Mathematics - - - - - - 3 8 7 4 - - -Science - - - - - - 1 1 1 3 - - -Social Studies - - - - - - 0 1 1 1 - - -ESL4 - - - - - - 0 0 0 0 - - -SUBTOTAL - - - - - - 12 12 17 19 - - -
English 23 36 11 9 15 14 14 8 7 11 14.8 10.8 -26.7%Mathematics 18 19 7 7 15 11 7 14 9 5 11.2 9.2 -66.7%Science 27 47 11 13 14 18 8 7 4 5 15.4 8.4 -64.3%Social Studies 36 38 12 21 21 17 11 8 8 5 17.7 9.8 -76.2%Foreign Lang. 6 14 2 5 10 12 7 4 3 6 6.9 6.4 -40.0%Fine Arts 3 3 1 3 4 3 3 7 3 1 3.1 3.4 -75.0%PE/Health 48 87 32 36 51 33 33 37 8 0 36.5 22.2 *Voc Educ 0 0 0 0 0 0 0 0 0 0 0.0 0.0 *Special Education4 1 9 5 5 10 7 5 0 0 0 4.2 2.4 *ESL4 0 0 0 0 0 0 0 0 0 0 0.0 0.0 *SUBTOTAL 162 253 81 99 140 115 88 85 42 33 109.8 72.6 -76.4%
Fine Arts 9 13 3 5 6 3 8 7 1 6 6.1 5.0 0.0%PE/Health 3 1 1 0 0 2 9 22 42 40 12.0 23.0 *Special Education 30 39 19 19 27 20 18 8 17 10 20.7 14.6 -63.0%ESL4 0 0 0 0 0 0 0 0 0 0 0.0 0.0 *SUBTOTAL 42 53 23 24 33 25 35 37 60 56 38.8 42.6 69.7%
ESL 2 5 1 2 0 2 0 0 0 0 1.2 0.4 *Bilingual 0 0 0 0 0 0 0 0 0 0 0.0 0.0 *Special Education 0 0 0 0 0 0 0 1 7 2 1.0 2.0 *
TOTAL 572 712 326 399 544 564 330 253 225 193 411.8 313.0 -64.5%
NumberEL:EC4 Ge 98.3EL:Bilingu 0.0MS: Gener -MS:English-MS:Mathem-MS: Scienc-MS:Social -MS: ESL -HS: English 10.8HS: Mathem 9.2HS: Scienc 8.4HS: Social 9.8HS: Foreign 6.4All Level: 14.6
Angelo State University
ELEMENTARY (EC-4)
HIGH SCHOOL (6-12 and 8-12)
MIDDLE SCHOOL (4-8)
ALL LEVEL (K-12)
Fiscal Year2 Certificate
OTHER SUPPLEMENTALS
98.3
0.0
0.0
0.0
0.0
0.0
0.0
0.0
10.8
9.2
8.4
9.8
6.4
14.6
0 25 50 75 100 125 150 175 200 225 250 275 300
EL:EC4 Generalist
EL:Bilingual Generalist
MS: Generalist
MS:English
MS:Mathematics
MS: Science
MS:Social Studies
MS: ESL
HS: English
HS: Mathematics
HS: Science
HS: Social Studies
HS: Foreign Lang.
All Level: Spec Ed
5-Year Average Certificate Production2003-2007
PACE System 2008C.4
Page 40Source Data:
Teacher certification files, TEA
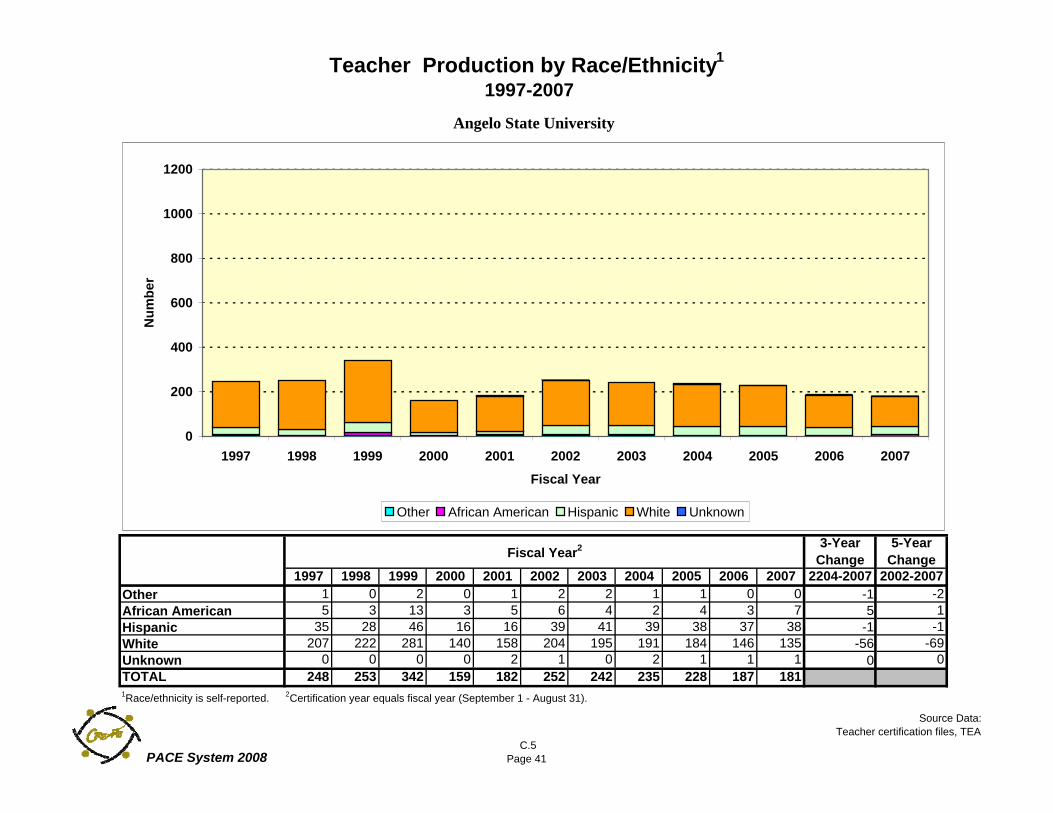
Teacher Production by Race/Ethnicity1
1997-2007
1997 1998 1999 2000 2001 2002 2003 2004 2005 2006 2007 2204-2007 2002-20071 0 2 0 1 2 2 1 1 0 0 -1 -25 3 13 3 5 6 4 2 4 3 7 5 1
35 28 46 16 16 39 41 39 38 37 38 -1 -1207 222 281 140 158 204 195 191 184 146 135 -56 -69
0 0 0 0 2 1 0 2 1 1 1 0 0248 253 342 159 182 252 242 235 228 187 181
1Race/ethnicity is self-reported. 2Certification year equals fiscal year (September 1 - August 31).
UnknownTOTAL
African AmericanHispanicWhite
Angelo State University
Other
Fiscal Year2 3-Year Change
5-Year Change
0
200
400
600
800
1000
1200
1997 1998 1999 2000 2001 2002 2003 2004 2005 2006 2007
Fiscal Year
Num
ber
Other African American Hispanic White Unknown
PACE System 2008 C.5
Page 41
Source Data:Teacher certification files, TEA
D. PROFESSIONAL IMPACT TREND REPORTS
PACE 2008
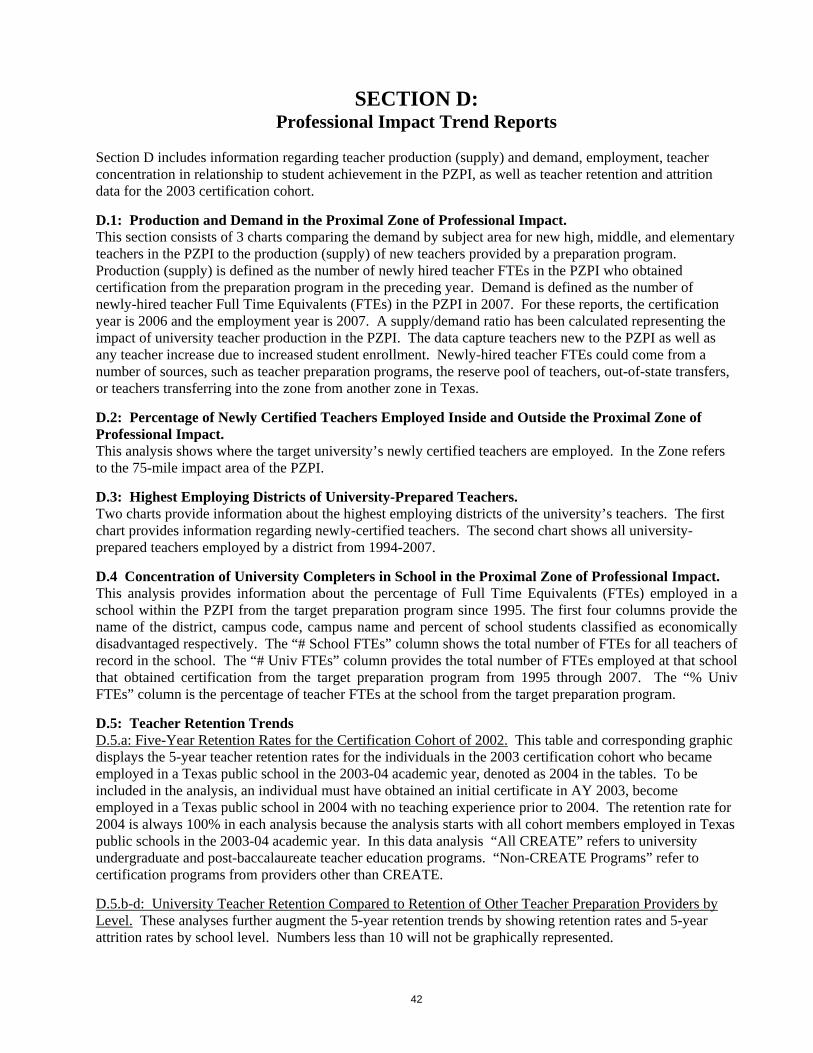
42
SECTION D: Professional Impact Trend Reports
Section D includes information regarding teacher production (supply) and demand, employment, teacher concentration in relationship to student achievement in the PZPI, as well as teacher retention and attrition data for the 2003 certification cohort. D.1: Production and Demand in the Proximal Zone of Professional Impact. This section consists of 3 charts comparing the demand by subject area for new high, middle, and elementary teachers in the PZPI to the production (supply) of new teachers provided by a preparation program. Production (supply) is defined as the number of newly hired teacher FTEs in the PZPI who obtained certification from the preparation program in the preceding year. Demand is defined as the number of newly-hired teacher Full Time Equivalents (FTEs) in the PZPI in 2007. For these reports, the certification year is 2006 and the employment year is 2007. A supply/demand ratio has been calculated representing the impact of university teacher production in the PZPI. The data capture teachers new to the PZPI as well as any teacher increase due to increased student enrollment. Newly-hired teacher FTEs could come from a number of sources, such as teacher preparation programs, the reserve pool of teachers, out-of-state transfers, or teachers transferring into the zone from another zone in Texas. D.2: Percentage of Newly Certified Teachers Employed Inside and Outside the Proximal Zone of Professional Impact. This analysis shows where the target university’s newly certified teachers are employed. In the Zone refers to the 75-mile impact area of the PZPI. D.3: Highest Employing Districts of University-Prepared Teachers. Two charts provide information about the highest employing districts of the university’s teachers. The first chart provides information regarding newly-certified teachers. The second chart shows all university-prepared teachers employed by a district from 1994-2007. D.4 Concentration of University Completers in School in the Proximal Zone of Professional Impact. This analysis provides information about the percentage of Full Time Equivalents (FTEs) employed in a school within the PZPI from the target preparation program since 1995. The first four columns provide the name of the district, campus code, campus name and percent of school students classified as economically disadvantaged respectively. The “# School FTEs” column shows the total number of FTEs for all teachers of record in the school. The “# Univ FTEs” column provides the total number of FTEs employed at that school that obtained certification from the target preparation program from 1995 through 2007. The “% Univ FTEs” column is the percentage of teacher FTEs at the school from the target preparation program. D.5: Teacher Retention Trends D.5.a: Five-Year Retention Rates for the Certification Cohort of 2002. This table and corresponding graphic displays the 5-year teacher retention rates for the individuals in the 2003 certification cohort who became employed in a Texas public school in the 2003-04 academic year, denoted as 2004 in the tables. To be included in the analysis, an individual must have obtained an initial certificate in AY 2003, become employed in a Texas public school in 2004 with no teaching experience prior to 2004. The retention rate for 2004 is always 100% in each analysis because the analysis starts with all cohort members employed in Texas public schools in the 2003-04 academic year. In this data analysis “All CREATE” refers to university undergraduate and post-baccalaureate teacher education programs. “Non-CREATE Programs” refer to certification programs from providers other than CREATE. D.5.b-d: University Teacher Retention Compared to Retention of Other Teacher Preparation Providers by Level. These analyses further augment the 5-year retention trends by showing retention rates and 5-year attrition rates by school level. Numbers less than 10 will not be graphically represented.
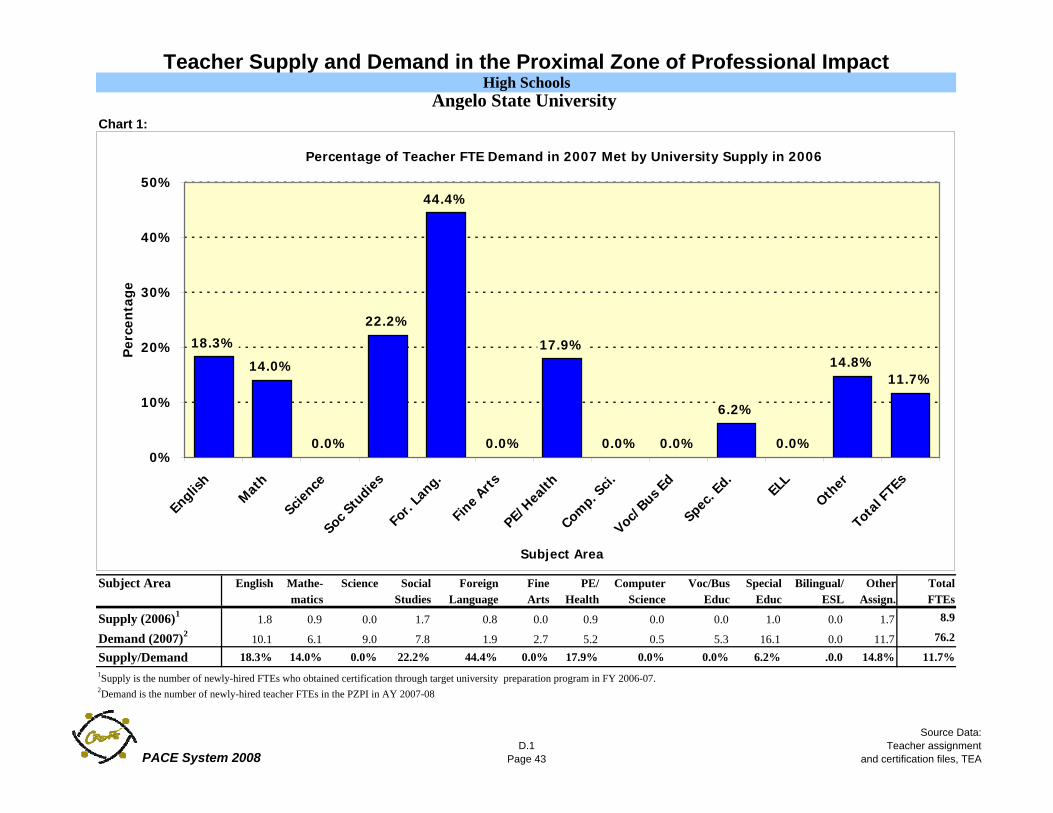
Teacher Supply and Demand in the Proximal Zone of Professional Impact
Chart 1:
English Math Scienceoc StudieFor. Lang.Fine ArtsPE/HealtComp. SciVoc/Bus EdSpec. Ed ELL Other Total FTEsSupply/Demand 18.3% 14.0% 0.0% 22.2% 44.4% 0.0% 17.9% 0.0% 0.0% 6.2% .0.0 14.8% 11.7%
Subject Area English Mathe- Science Social Foreign Fine PE/ Computer Voc/Bus Special Bilingual/ Other Totalmatics Studies Language Arts Health Science Educ Educ ESL Assign. FTEs
Supply (2006)1 1.8 0.9 0.0 1.7 0.8 0.0 0.9 0.0 0.0 1.0 0.0 1.7 8.9
Demand (2007)2 10.1 6.1 9.0 7.8 1.9 2.7 5.2 0.5 5.3 16.1 0.0 11.7 76.2
Supply/Demand 18.3% 14.0% 0.0% 22.2% 44.4% 0.0% 17.9% 0.0% 0.0% 6.2% .0.0 14.8% 11.7%
High SchoolsAngelo State University
1Supply is the number of newly-hired FTEs who obtained certification through target university preparation program in FY 2006-07. 2Demand is the number of newly-hired teacher FTEs in the PZPI in AY 2007-08
18.3%
14.0%
0.0%
22.2%
44.4%
0.0%
17.9%
0.0% 0.0%
6.2%
0.0%
14.8%11.7%
0%
10%
20%
30%
40%
50%
Englis
h
Math
Science
Soc S
tudies
For.
Lang.
Fine A
rtsPE/
Health
Comp. S
ci.Voc
/Bus E
d
Spec. E
d.
ELL
Other
Tota
l FTE
s
Subject Area
Per
cen
tage
Percentage of Teacher FTE Demand in 2007 Met by University Supply in 2006
PACE System 2008D.1
Page 43
Source Data:Teacher assignment
and certification files, TEA
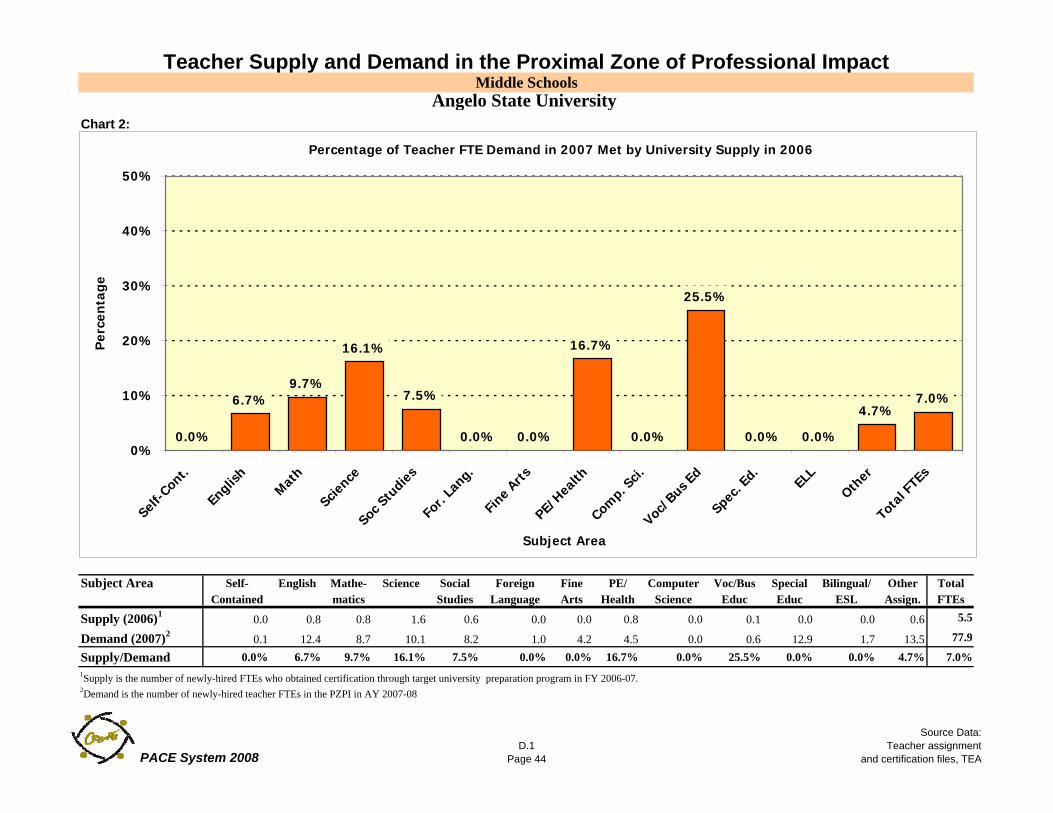
Teacher Supply and Demand in the Proximal Zone of Professional Impact
Chart 2:
Self-Cont. English Math Scienceoc StudieFor. Lang.Fine ArtE/HealtComp. SciVoc/Bus ESpec. Ed ELL Other otal FTESupply/Demand 0.0% 6.7% 9.7% 16.1% 7.5% 0.0% 0.0% 16.7% 0.0% 25.5% 0.0% 0.0% 4.7% 7.0%
Subject Area Self- English Mathe- Science Social Foreign Fine PE/ Computer Voc/Bus Special Bilingual/ Other TotalContained matics Studies Language Arts Health Science Educ Educ ESL Assign. FTEs
Supply (2006)1 0.0 0.8 0.8 1.6 0.6 0.0 0.0 0.8 0.0 0.1 0.0 0.0 0.6 5.5
Demand (2007)2 0.1 12.4 8.7 10.1 8.2 1.0 4.2 4.5 0.0 0.6 12.9 1.7 13.5 77.9
Supply/Demand 0.0% 6.7% 9.7% 16.1% 7.5% 0.0% 0.0% 16.7% 0.0% 25.5% 0.0% 0.0% 4.7% 7.0%
Middle SchoolsAngelo State University
1Supply is the number of newly-hired FTEs who obtained certification through target university preparation program in FY 2006-07. 2Demand is the number of newly-hired teacher FTEs in the PZPI in AY 2007-08
Percentage of Teacher FTE Demand in 2007 Met by University Supply in 2006
0.0%
6.7%9.7%
16.1%
7.5%
0.0% 0.0%
16.7%
0.0%
25.5%
0.0% 0.0%
4.7%7.0%
0%
10%
20%
30%
40%
50%
Self-C
ont.
Englis
h
Math
Science
Soc S
tudies
For.
Lang.
Fine A
rtsPE/
Health
Comp. S
ci.Voc
/Bus E
d
Spec. E
d.
ELL
Other
Tota
l FTE
s
Subject Area
Per
cen
tage
PACE System 2008D.1
Page 44
Source Data:Teacher assignment
and certification files, TEA
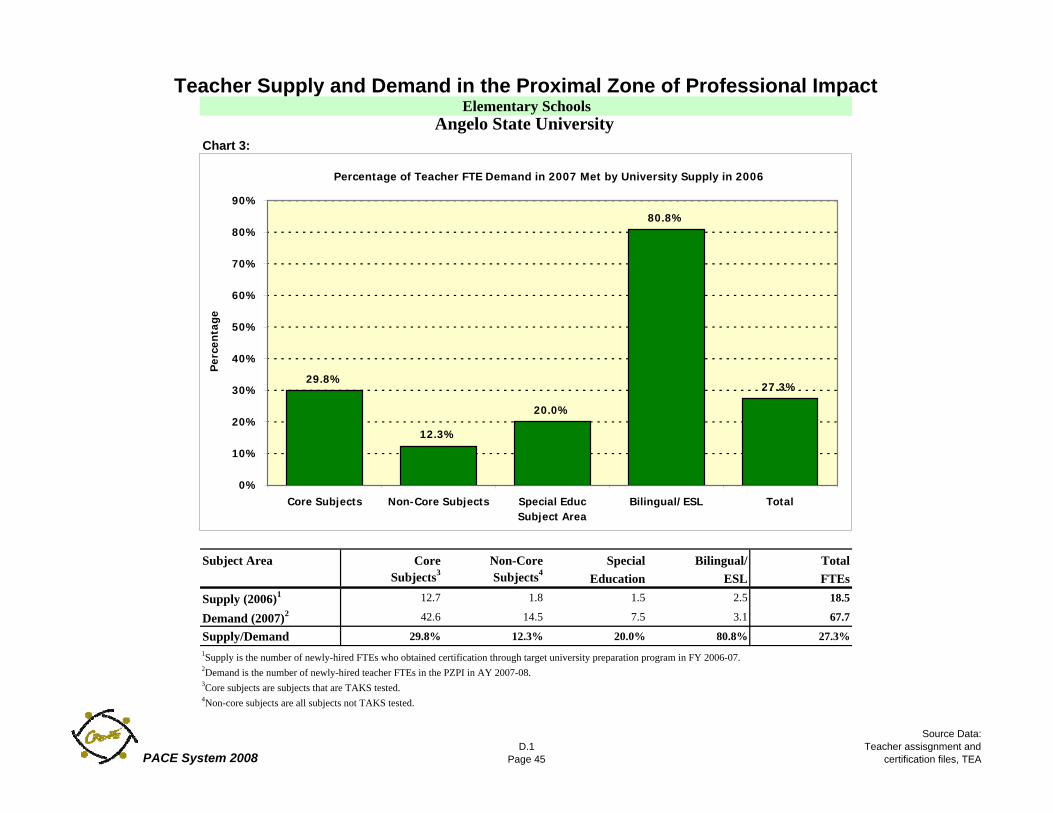
Teacher Supply and Demand in the Proximal Zone of Professional Impact
Chart 3:
Core Subjects Non-Core Subject Special Educ Bilingual/ESL TotalSupply/Demand #VALUE! #VALUE! #VALUE! #VALUE! 27.3%
Subject Area Core Non-Core Special Bilingual/ TotalSubjects3 Subjects4 Education ESL FTEs
Supply (2006)1 12.7 1.8 1.5 2.5 18.5
Demand (2007)2 42.6 14.5 7.5 3.1 67.7
Supply/Demand 29.8% 12.3% 20.0% 80.8% 27.3%
Elementary SchoolsAngelo State University
1Supply is the number of newly-hired FTEs who obtained certification through target university preparation program in FY 2006-07. 2Demand is the number of newly-hired teacher FTEs in the PZPI in AY 2007-08.3Core subjects are subjects that are TAKS tested.4Non-core subjects are all subjects not TAKS tested.
29.8%
12.3%
20.0%
80.8%
27.3%
0%
10%
20%
30%
40%
50%
60%
70%
80%
90%
Core Subjects Non-Core Subjects Special Educ Bilingual/ESL TotalSubject Area
Per
cen
tage
Percentage of Teacher FTE Demand in 2007 Met by University Supply in 2006
PACE System 2008D.1
Page 45
Source Data:Teacher assisgnment and
certification files, TEA
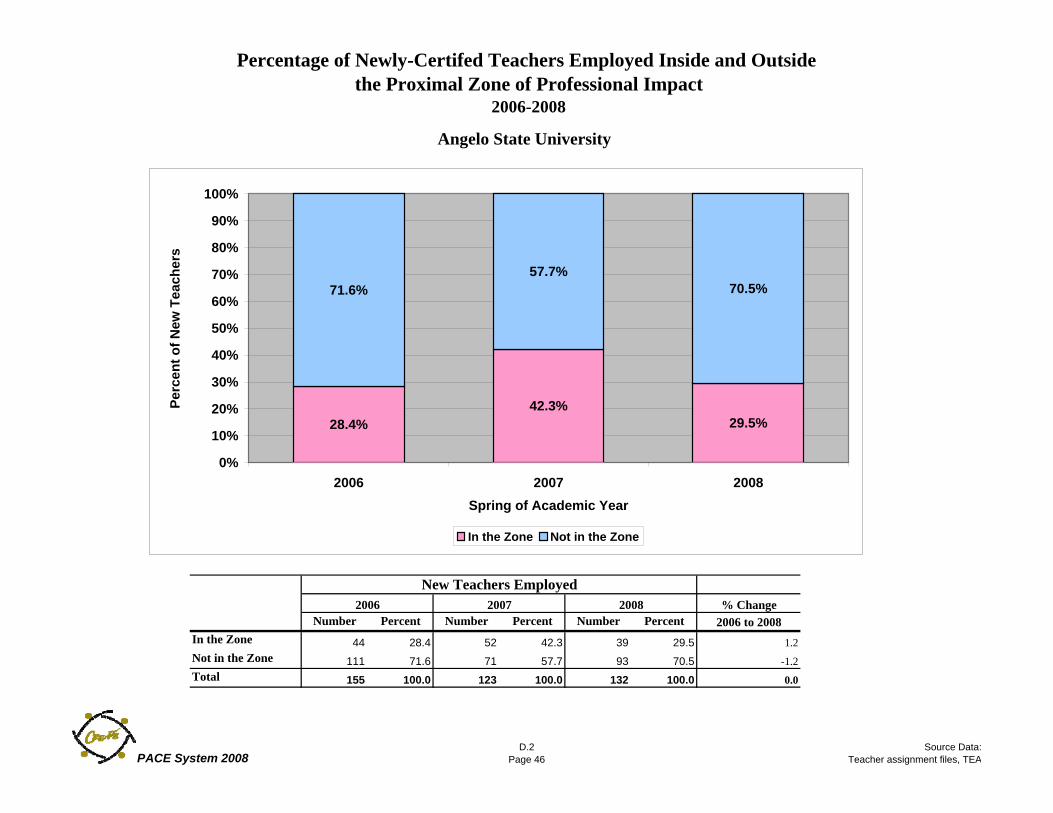
Percentage of Newly-Certifed Teachers Employed Inside and Outside the Proximal Zone of Professional Impact
2006-2008
2006 2007 2008In the Zone 28.4 42.3 29.5Not in the Zone 71.6 57.7 70.5
% ChangeNumber Percent Number Percent Number Percent 2006 to 2008
In the Zone 44 28.4 52 42.3 39 29.5 1.2Not in the Zone 111 71.6 71 57.7 93 70.5 -1.2Total 155 100.0 123 100.0 132 100.0 0.0
New Teachers Employed
Angelo State University
2006 2007 2008
29.5%42.3%
28.4%
70.5%57.7%
71.6%
0%
10%
20%
30%
40%
50%
60%
70%
80%
90%
100%
2006 2007 2008Spring of Academic Year
Perc
ent o
f New
Tea
cher
s
In the Zone Not in the Zone
PACE System 2008D.2
Page 46 Source Data:
Teacher assignment files, TEA
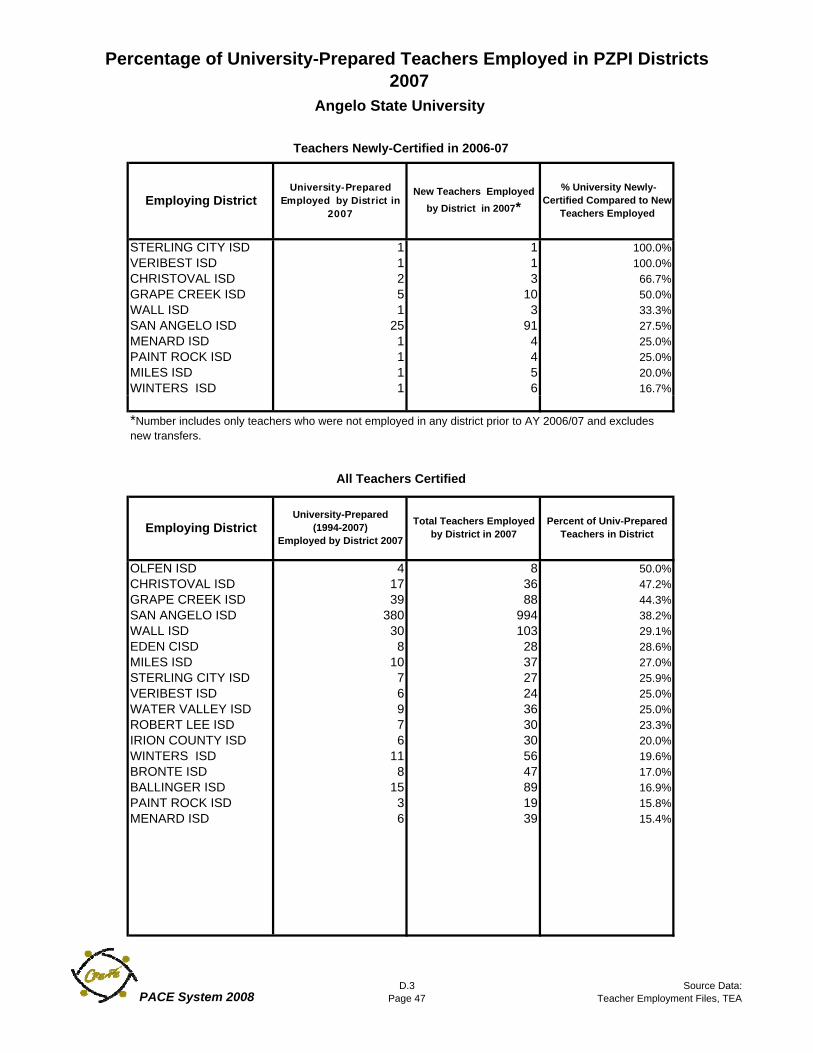
Percentage of University-Prepared Teachers Employed in PZPI Districts 2007
STERLING CITY ISD 1 1 100.0%VERIBEST ISD 1 1 100.0%CHRISTOVAL ISD 2 3 66.7%GRAPE CREEK ISD 5 10 50.0%WALL ISD 1 3 33.3%SAN ANGELO ISD 25 91 27.5%MENARD ISD 1 4 25.0%PAINT ROCK ISD 1 4 25.0%MILES ISD 1 5 20.0%WINTERS ISD 1 6 16.7%
OLFEN ISD 4 8 50.0%CHRISTOVAL ISD 17 36 47.2%GRAPE CREEK ISD 39 88 44.3%SAN ANGELO ISD 380 994 38.2%WALL ISD 30 103 29.1%EDEN CISD 8 28 28.6%MILES ISD 10 37 27.0%STERLING CITY ISD 7 27 25.9%VERIBEST ISD 6 24 25.0%WATER VALLEY ISD 9 36 25.0%ROBERT LEE ISD 7 30 23.3%IRION COUNTY ISD 6 30 20.0%WINTERS ISD 11 56 19.6%BRONTE ISD 8 47 17.0%BALLINGER ISD 15 89 16.9%PAINT ROCK ISD 3 19 15.8%MENARD ISD 6 39 15.4%
% University Newly-Certified Compared to New
Teachers EmployedEmploying District
University-Prepared(1994-2007)
Employed by District 2007
*Number includes only teachers who were not employed in any district prior to AY 2006/07 and excludes new transfers.
Angelo State University
Total Teachers Employed by District in 2007Employing District Percent of Univ-Prepared
Teachers in District
All Teachers Certified
Teachers Newly-Certified in 2006-07
University-Prepared Employed by District in
2007
New Teachers Employed by District in 2007*
PACE System 2008D.3
Page 47Source Data:
Teacher Employment Files, TEA
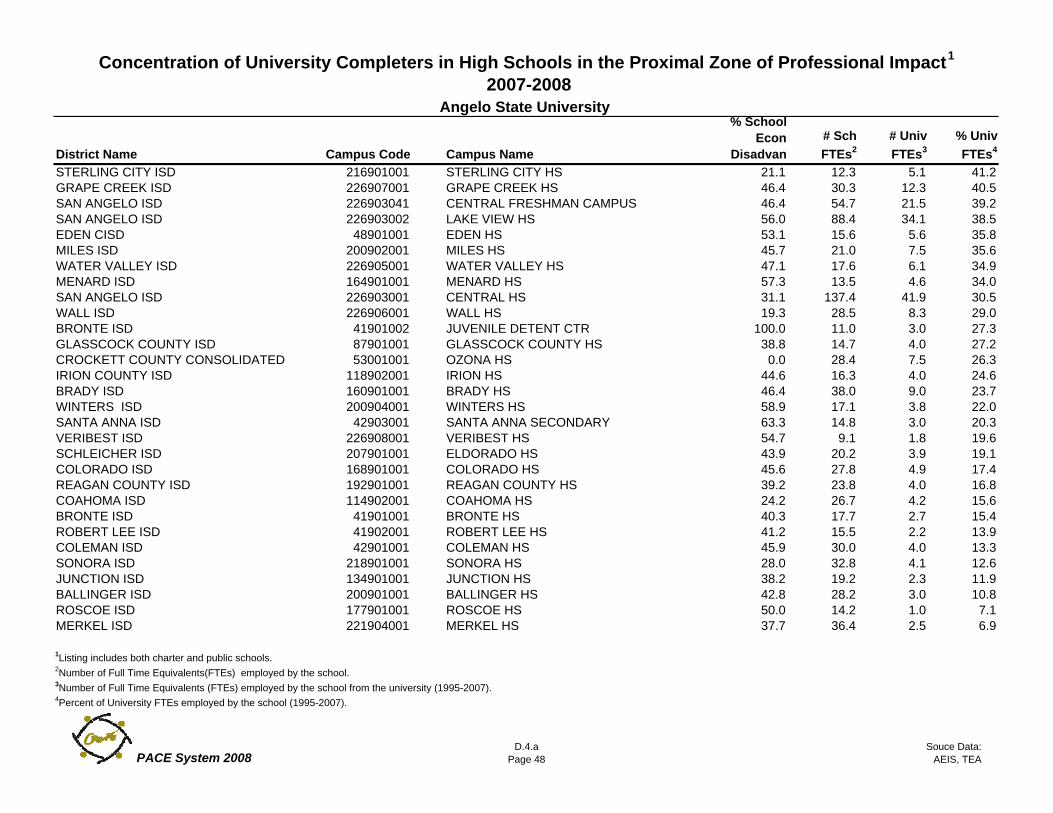
Concentration of University Completers in High Schools in the Proximal Zone of Professional Impact1
2007-2008
District Name Campus Code Campus Name
% School Econ
Disadvan# Sch FTEs2
# Univ FTEs3
% Univ FTEs4
STERLING CITY ISD 216901001 STERLING CITY HS 21.1 12.3 5.1 41.2GRAPE CREEK ISD 226907001 GRAPE CREEK HS 46.4 30.3 12.3 40.5SAN ANGELO ISD 226903041 CENTRAL FRESHMAN CAMPUS 46.4 54.7 21.5 39.2SAN ANGELO ISD 226903002 LAKE VIEW HS 56.0 88.4 34.1 38.5EDEN CISD 48901001 EDEN HS 53.1 15.6 5.6 35.8MILES ISD 200902001 MILES HS 45.7 21.0 7.5 35.6WATER VALLEY ISD 226905001 WATER VALLEY HS 47.1 17.6 6.1 34.9MENARD ISD 164901001 MENARD HS 57.3 13.5 4.6 34.0SAN ANGELO ISD 226903001 CENTRAL HS 31.1 137.4 41.9 30.5WALL ISD 226906001 WALL HS 19.3 28.5 8.3 29.0BRONTE ISD 41901002 JUVENILE DETENT CTR 100.0 11.0 3.0 27.3GLASSCOCK COUNTY ISD 87901001 GLASSCOCK COUNTY HS 38.8 14.7 4.0 27.2CROCKETT COUNTY CONSOLIDATED 53001001 OZONA HS 0.0 28.4 7.5 26.3IRION COUNTY ISD 118902001 IRION HS 44.6 16.3 4.0 24.6BRADY ISD 160901001 BRADY HS 46.4 38.0 9.0 23.7WINTERS ISD 200904001 WINTERS HS 58.9 17.1 3.8 22.0SANTA ANNA ISD 42903001 SANTA ANNA SECONDARY 63.3 14.8 3.0 20.3VERIBEST ISD 226908001 VERIBEST HS 54.7 9.1 1.8 19.6SCHLEICHER ISD 207901001 ELDORADO HS 43.9 20.2 3.9 19.1COLORADO ISD 168901001 COLORADO HS 45.6 27.8 4.9 17.4REAGAN COUNTY ISD 192901001 REAGAN COUNTY HS 39.2 23.8 4.0 16.8COAHOMA ISD 114902001 COAHOMA HS 24.2 26.7 4.2 15.6BRONTE ISD 41901001 BRONTE HS 40.3 17.7 2.7 15.4ROBERT LEE ISD 41902001 ROBERT LEE HS 41.2 15.5 2.2 13.9COLEMAN ISD 42901001 COLEMAN HS 45.9 30.0 4.0 13.3SONORA ISD 218901001 SONORA HS 28.0 32.8 4.1 12.6JUNCTION ISD 134901001 JUNCTION HS 38.2 19.2 2.3 11.9BALLINGER ISD 200901001 BALLINGER HS 42.8 28.2 3.0 10.8ROSCOE ISD 177901001 ROSCOE HS 50.0 14.2 1.0 7.1MERKEL ISD 221904001 MERKEL HS 37.7 36.4 2.5 6.9
1Listing includes both charter and public schools.2Number of Full Time Equivalents(FTEs) employed by the school.3Number of Full Time Equivalents (FTEs) employed by the school from the university (1995-2007). 4Percent of University FTEs employed by the school (1995-2007).
Angelo State University
PACE System 2008D.4.a
Page 48 Souce Data:
AEIS, TEA
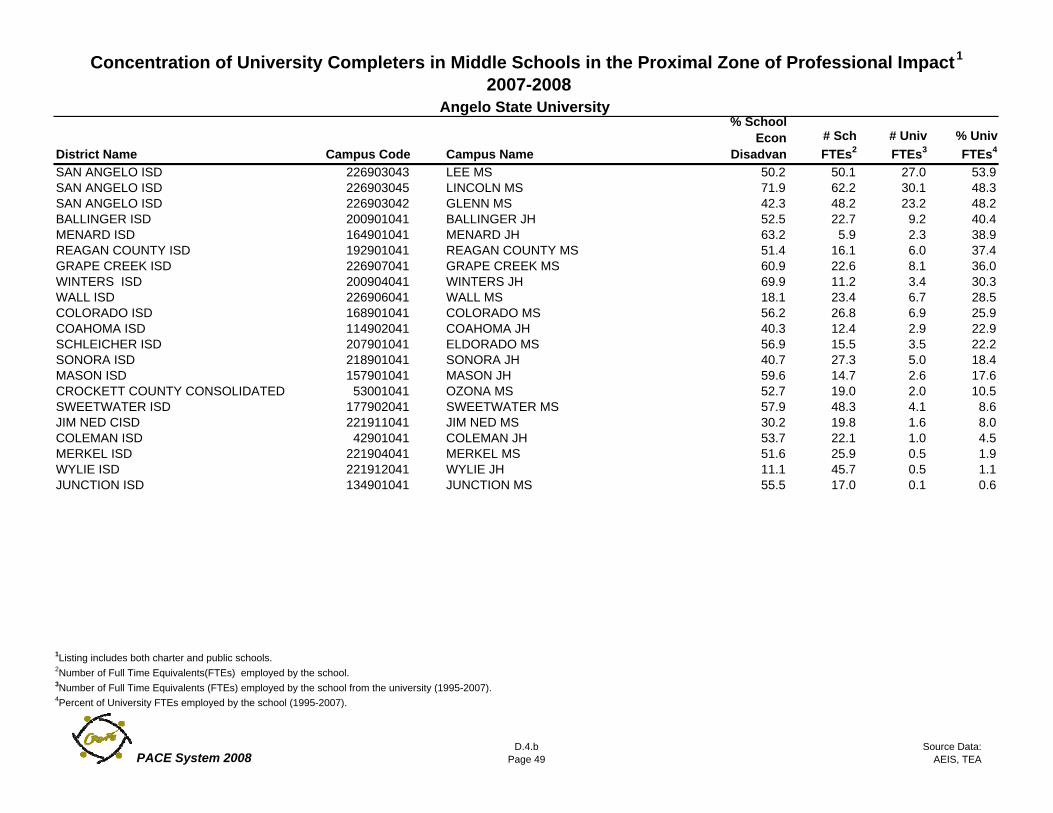
Concentration of University Completers in Middle Schools in the Proximal Zone of Professional Impact1
2007-2008
District Name Campus Code Campus Name
% School Econ
Disadvan# Sch FTEs2
# Univ FTEs3
% Univ FTEs4
SAN ANGELO ISD 226903043 LEE MS 50.2 50.1 27.0 53.9SAN ANGELO ISD 226903045 LINCOLN MS 71.9 62.2 30.1 48.3SAN ANGELO ISD 226903042 GLENN MS 42.3 48.2 23.2 48.2BALLINGER ISD 200901041 BALLINGER JH 52.5 22.7 9.2 40.4MENARD ISD 164901041 MENARD JH 63.2 5.9 2.3 38.9REAGAN COUNTY ISD 192901041 REAGAN COUNTY MS 51.4 16.1 6.0 37.4GRAPE CREEK ISD 226907041 GRAPE CREEK MS 60.9 22.6 8.1 36.0WINTERS ISD 200904041 WINTERS JH 69.9 11.2 3.4 30.3WALL ISD 226906041 WALL MS 18.1 23.4 6.7 28.5COLORADO ISD 168901041 COLORADO MS 56.2 26.8 6.9 25.9COAHOMA ISD 114902041 COAHOMA JH 40.3 12.4 2.9 22.9SCHLEICHER ISD 207901041 ELDORADO MS 56.9 15.5 3.5 22.2SONORA ISD 218901041 SONORA JH 40.7 27.3 5.0 18.4MASON ISD 157901041 MASON JH 59.6 14.7 2.6 17.6CROCKETT COUNTY CONSOLIDATED 53001041 OZONA MS 52.7 19.0 2.0 10.5SWEETWATER ISD 177902041 SWEETWATER MS 57.9 48.3 4.1 8.6JIM NED CISD 221911041 JIM NED MS 30.2 19.8 1.6 8.0COLEMAN ISD 42901041 COLEMAN JH 53.7 22.1 1.0 4.5MERKEL ISD 221904041 MERKEL MS 51.6 25.9 0.5 1.9WYLIE ISD 221912041 WYLIE JH 11.1 45.7 0.5 1.1JUNCTION ISD 134901041 JUNCTION MS 55.5 17.0 0.1 0.6
Angelo State University
1Listing includes both charter and public schools.2Number of Full Time Equivalents(FTEs) employed by the school.3Number of Full Time Equivalents (FTEs) employed by the school from the university (1995-2007). 4Percent of University FTEs employed by the school (1995-2007).
PACE System 2008D.4.b
Page 49Source Data:
AEIS, TEA
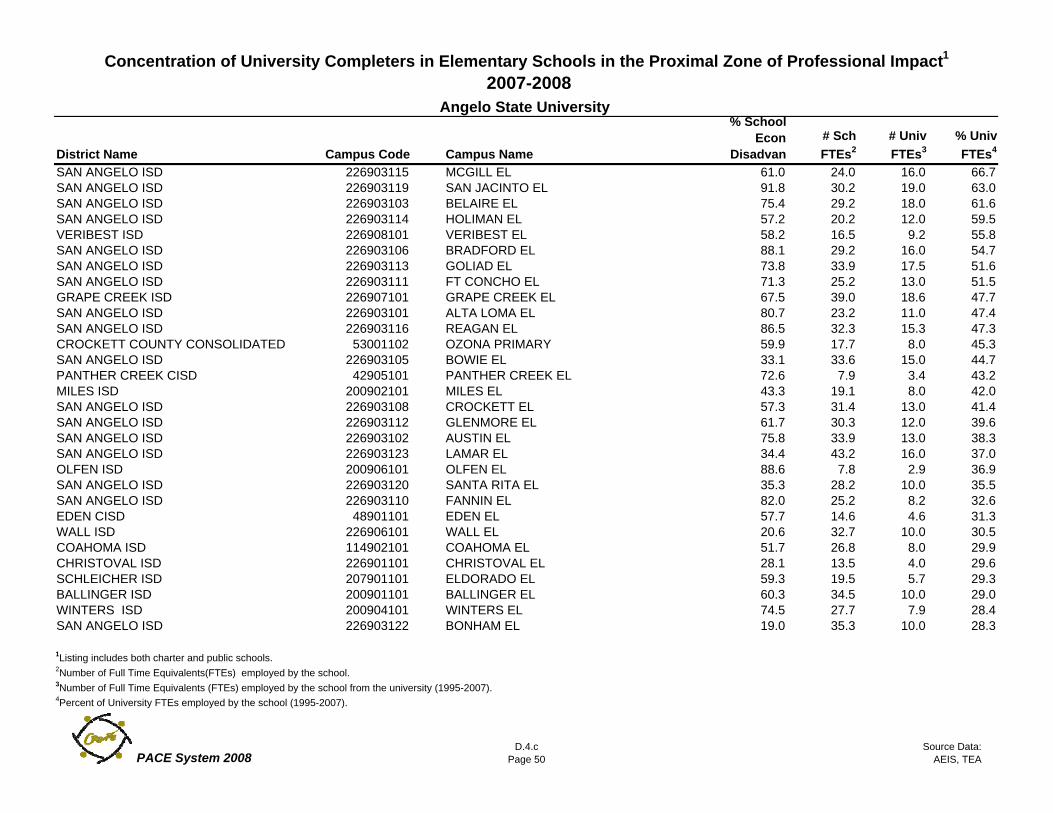
Concentration of University Completers in Elementary Schools in the Proximal Zone of Professional Impact1
2007-2008
District Name Campus Code Campus Name
% School Econ
Disadvan# Sch FTEs2
# Univ FTEs3
% Univ FTEs4
SAN ANGELO ISD 226903115 MCGILL EL 61.0 24.0 16.0 66.7SAN ANGELO ISD 226903119 SAN JACINTO EL 91.8 30.2 19.0 63.0SAN ANGELO ISD 226903103 BELAIRE EL 75.4 29.2 18.0 61.6SAN ANGELO ISD 226903114 HOLIMAN EL 57.2 20.2 12.0 59.5VERIBEST ISD 226908101 VERIBEST EL 58.2 16.5 9.2 55.8SAN ANGELO ISD 226903106 BRADFORD EL 88.1 29.2 16.0 54.7SAN ANGELO ISD 226903113 GOLIAD EL 73.8 33.9 17.5 51.6SAN ANGELO ISD 226903111 FT CONCHO EL 71.3 25.2 13.0 51.5GRAPE CREEK ISD 226907101 GRAPE CREEK EL 67.5 39.0 18.6 47.7SAN ANGELO ISD 226903101 ALTA LOMA EL 80.7 23.2 11.0 47.4SAN ANGELO ISD 226903116 REAGAN EL 86.5 32.3 15.3 47.3CROCKETT COUNTY CONSOLIDATED 53001102 OZONA PRIMARY 59.9 17.7 8.0 45.3SAN ANGELO ISD 226903105 BOWIE EL 33.1 33.6 15.0 44.7PANTHER CREEK CISD 42905101 PANTHER CREEK EL 72.6 7.9 3.4 43.2MILES ISD 200902101 MILES EL 43.3 19.1 8.0 42.0SAN ANGELO ISD 226903108 CROCKETT EL 57.3 31.4 13.0 41.4SAN ANGELO ISD 226903112 GLENMORE EL 61.7 30.3 12.0 39.6SAN ANGELO ISD 226903102 AUSTIN EL 75.8 33.9 13.0 38.3SAN ANGELO ISD 226903123 LAMAR EL 34.4 43.2 16.0 37.0OLFEN ISD 200906101 OLFEN EL 88.6 7.8 2.9 36.9SAN ANGELO ISD 226903120 SANTA RITA EL 35.3 28.2 10.0 35.5SAN ANGELO ISD 226903110 FANNIN EL 82.0 25.2 8.2 32.6EDEN CISD 48901101 EDEN EL 57.7 14.6 4.6 31.3WALL ISD 226906101 WALL EL 20.6 32.7 10.0 30.5COAHOMA ISD 114902101 COAHOMA EL 51.7 26.8 8.0 29.9CHRISTOVAL ISD 226901101 CHRISTOVAL EL 28.1 13.5 4.0 29.6SCHLEICHER ISD 207901101 ELDORADO EL 59.3 19.5 5.7 29.3BALLINGER ISD 200901101 BALLINGER EL 60.3 34.5 10.0 29.0WINTERS ISD 200904101 WINTERS EL 74.5 27.7 7.9 28.4SAN ANGELO ISD 226903122 BONHAM EL 19.0 35.3 10.0 28.3
Angelo State University
1Listing includes both charter and public schools.2Number of Full Time Equivalents(FTEs) employed by the school.3Number of Full Time Equivalents (FTEs) employed by the school from the university (1995-2007). 4Percent of University FTEs employed by the school (1995-2007).
PACE System 2008D.4.c
Page 50Source Data:
AEIS, TEA
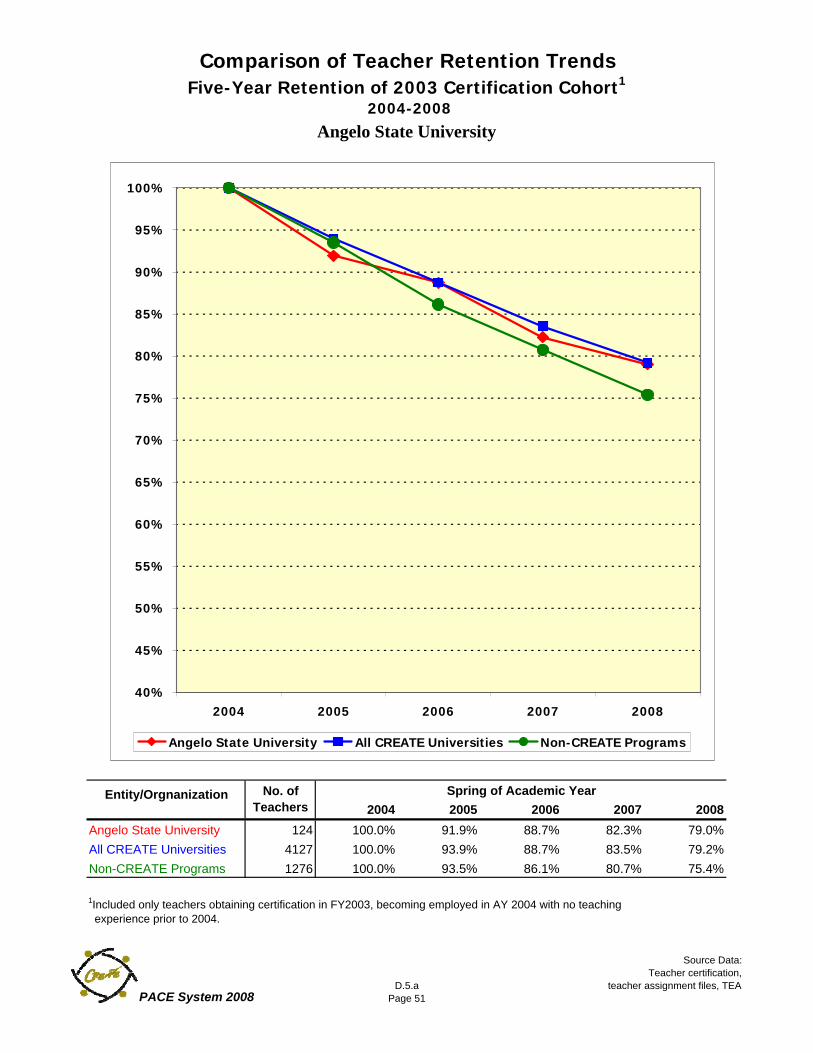
Comparison of Teacher Retention TrendsFive-Year Retention of 2003 Certification Cohort1
2004-2008
2004 2005 2006 2007 2008Angelo State University 124 100.0% 91.9% 88.7% 82.3% 79.0%All CREATE Universities 4127 100.0% 93.9% 88.7% 83.5% 79.2%Non-CREATE Programs 1276 100.0% 93.5% 86.1% 80.7% 75.4%
Angelo State University
1Included only teachers obtaining certification in FY2003, becoming employed in AY 2004 with no teaching experience prior to 2004.
No. of Teachers
Entity/Orgnanization Spring of Academic Year
40%
45%
50%
55%
60%
65%
70%
75%
80%
85%
90%
95%
100%
2004 2005 2006 2007 2008
Angelo State University All CREATE Universities Non-CREATE Programs
PACE System 2008D.5.a
Page 51
Source Data:Teacher certification,
teacher assignment files, TEA
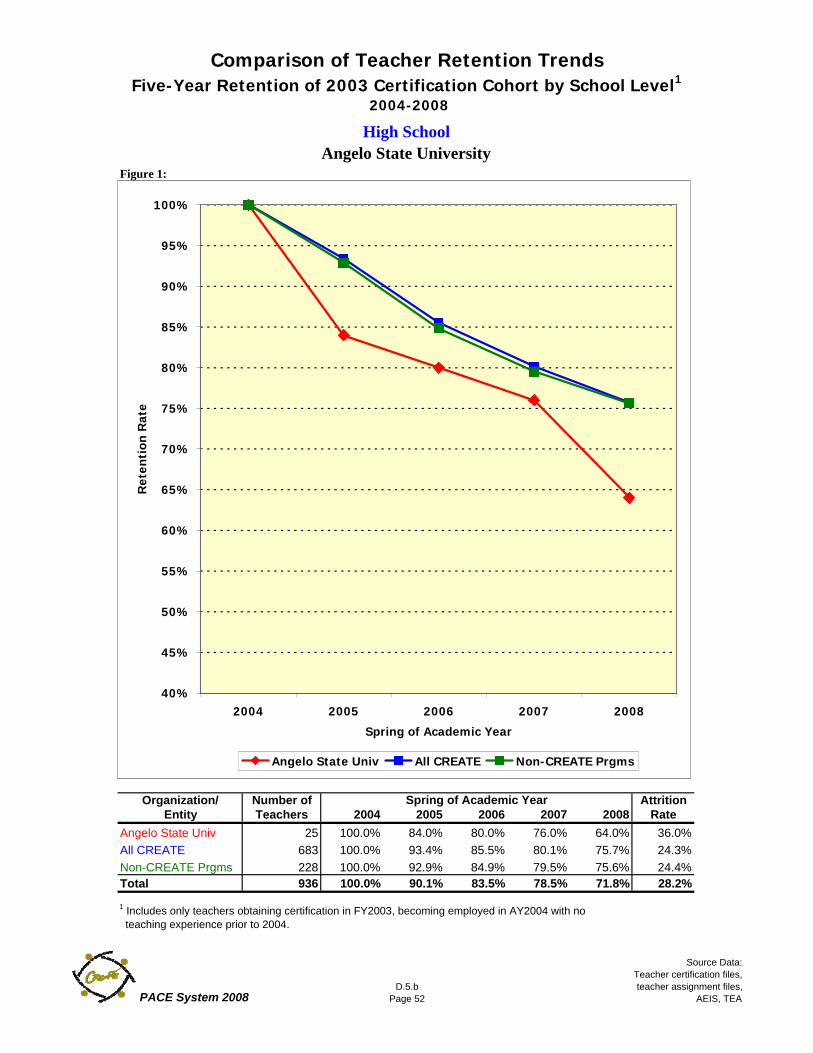
Comparison of Teacher Retention TrendsFive-Year Retention of 2003 Certification Cohort by School Level1
2004-2008
Figure 1:
2004 2005 2006 2007 2008Target Univ
All CREATENon-CREATE
ACPs
Organization/ Number of AttritionEntity Teachers 2004 2005 2006 2007 2008 Rate
Angelo State Univ 25 100.0% 84.0% 80.0% 76.0% 64.0% 36.0%All CREATE 683 100.0% 93.4% 85.5% 80.1% 75.7% 24.3%Non-CREATE Prgms 228 100.0% 92.9% 84.9% 79.5% 75.6% 24.4%Total 936 100.0% 90.1% 83.5% 78.5% 71.8% 28.2%
1 Includes only teachers obtaining certification in FY2003, becoming employed in AY2004 with no teaching experience prior to 2004.
High SchoolAngelo State University
Spring of Academic Year
40%
45%
50%
55%
60%
65%
70%
75%
80%
85%
90%
95%
100%
2004 2005 2006 2007 2008
Spring of Academic Year
Ret
enti
on R
ate
Angelo State Univ All CREATE Non-CREATE Prgms
PACE System 2008D.5.b
Page 52
Source Data:Teacher certification files, teacher assignment files,
AEIS, TEA

Comparison of Teacher Retention TrendsFive-Year Retention of 2003 Certification Cohort by School Level1
2004-2008
Figure 2:
2004 2005 2006 2007 2008Target Univ
All CREATENon-CREATE
ACPs
Organization/ Number of AttritionEntity Teachers 2004 2005 2006 2007 2008 Rate
Angelo State Univ 32 100.0% 96.9% 93.8% 84.4% 81.3% 18.8%All CREATE 780 100.0% 92.4% 87.6% 83.2% 79.4% 20.6%Non-CREATE Prgms 269 100.0% 92.9% 87.0% 82.8% 78.4% 21.6%Total 1081 100.0% 94.1% 89.4% 83.5% 79.7% 20.3%
1 Includes only teachers obtaining certification in FY2003, becoming employed in AY2004 with no teaching experience prior to 2004.
Middle SchoolAngelo State University
Spring of Academic Year
40%
45%
50%
55%
60%
65%
70%
75%
80%
85%
90%
95%
100%
2004 2005 2006 2007 2008
Spring of Academic Year
Ret
enti
on R
ate
Angelo State Univ All CREATE Non-CREATE Prgms
PACE System 2008D.5.b
Page 53
Source Data:Teacher certification files, teacher assignment files,
AEIS, TEA
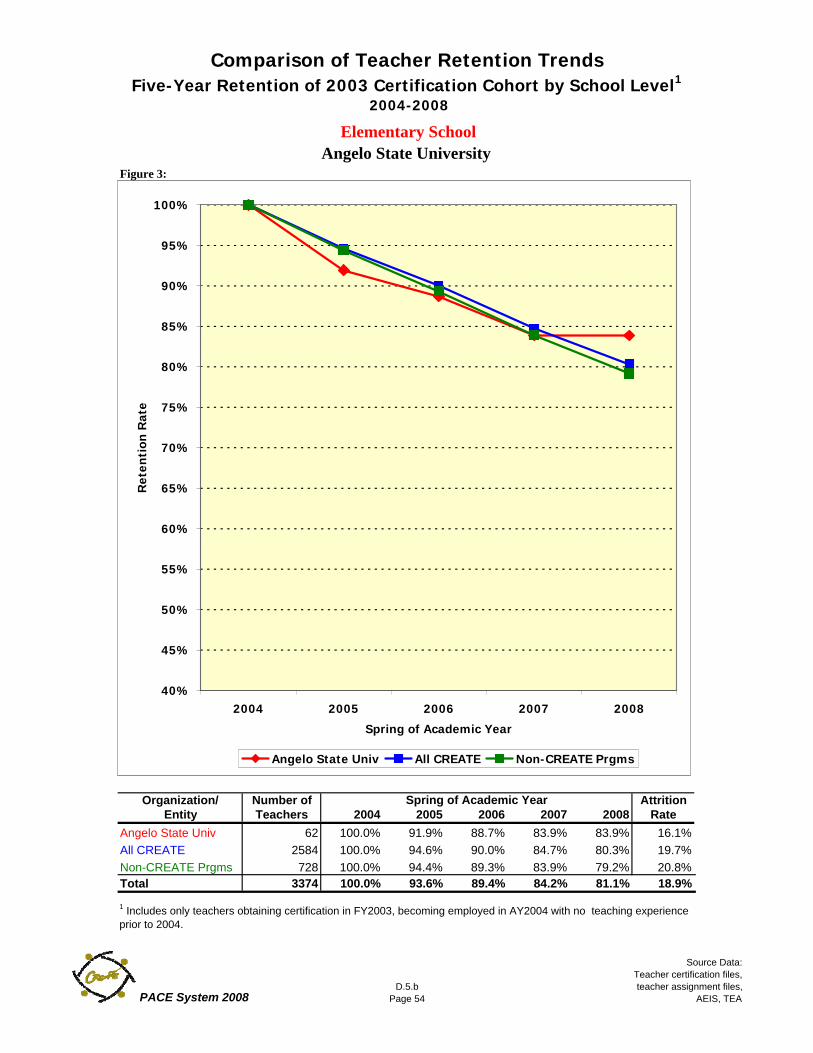
Comparison of Teacher Retention TrendsFive-Year Retention of 2003 Certification Cohort by School Level1
2004-2008
Figure 3:
2004 2005 2006 2007 2008Target Univ
All CREATENon-CREATE
ACPs
Organization/ Number of AttritionEntity Teachers 2004 2005 2006 2007 2008 Rate
Angelo State Univ 62 100.0% 91.9% 88.7% 83.9% 83.9% 16.1%All CREATE 2584 100.0% 94.6% 90.0% 84.7% 80.3% 19.7%Non-CREATE Prgms 728 100.0% 94.4% 89.3% 83.9% 79.2% 20.8%Total 3374 100.0% 93.6% 89.4% 84.2% 81.1% 18.9%
1 Includes only teachers obtaining certification in FY2003, becoming employed in AY2004 with no teaching experience prior to 2004.
Elementary SchoolAngelo State University
Spring of Academic Year
40%
45%
50%
55%
60%
65%
70%
75%
80%
85%
90%
95%
100%
2004 2005 2006 2007 2008
Spring of Academic Year
Ret
enti
on R
ate
Angelo State Univ All CREATE Non-CREATE Prgms
PACE System 2008D.5.b
Page 54
Source Data:Teacher certification files, teacher assignment files,
AEIS, TEA
III. University Benchmarks to Guide Improvement
PACE 2008
E. COMPARISON REPORTS OF TEACHER PRODUCTION
PACE 2008
55
SECTION E: Comparison Reports of Teacher Production
Section E contains comparison information among universities regarding teacher production, certificate production, employment of newly-certified teachers, and teacher retention. Comparison universities were systematically selected for a target university by choosing the two closest universities in proximity to the target university. The data associated with each university represents that university’s Proximal Zone of Professional Impact. If there were more than two universities in the target university’s PZPI, the two having the highest correlation based on student enrollment in the PZPI were chosen as the comparison universities. When there were no universities in the PZPI, the panel of PACE committee members used professional judgment to determine the comparison universities. E.1: Comparison of Teacher Production between Target University and Other Universities
in Nearby Geographic Area This analysis describes teacher production over a 10-year time period between the target university and the comparisons. The 10-year total production data is graphically represented. E.2: Five-Year Production Ratios This report compares the ratio of teacher production to baccalaureate degrees awarded of all CREATE consortium members from 2003-2007 divided into quintiles. E.3 Comparison of Longitudinal Certificate Production Trends between Target
University and Other Universities. The data for this comparison come from individual university data found in C.4. The data associated with each university represent each university’s Proximal Zone of Professional Impact. E.4: Comparison of Newly-Certified Teachers Employed Inside and Outside the Proximal
Zone of Professional Impact in Nearby Geographic Area The data for this comparison come from individual university data found in D.2. The data associated with each university represent that university’s Proximal Zone of Professional Impact. E.5: Teacher Retention Comparison Among Universities in Same Geographic Area The data for this comparison come from individual university data found in D.5.a. The data represent the 5-year teacher retention rates for the individuals in the 2003 certification cohort who became employed in a Texas public school in the 2003-04 academic year and had no teaching experience prior to 2004. The attrition rate is calculated by subtracting the 2008 retention rate from 100%.
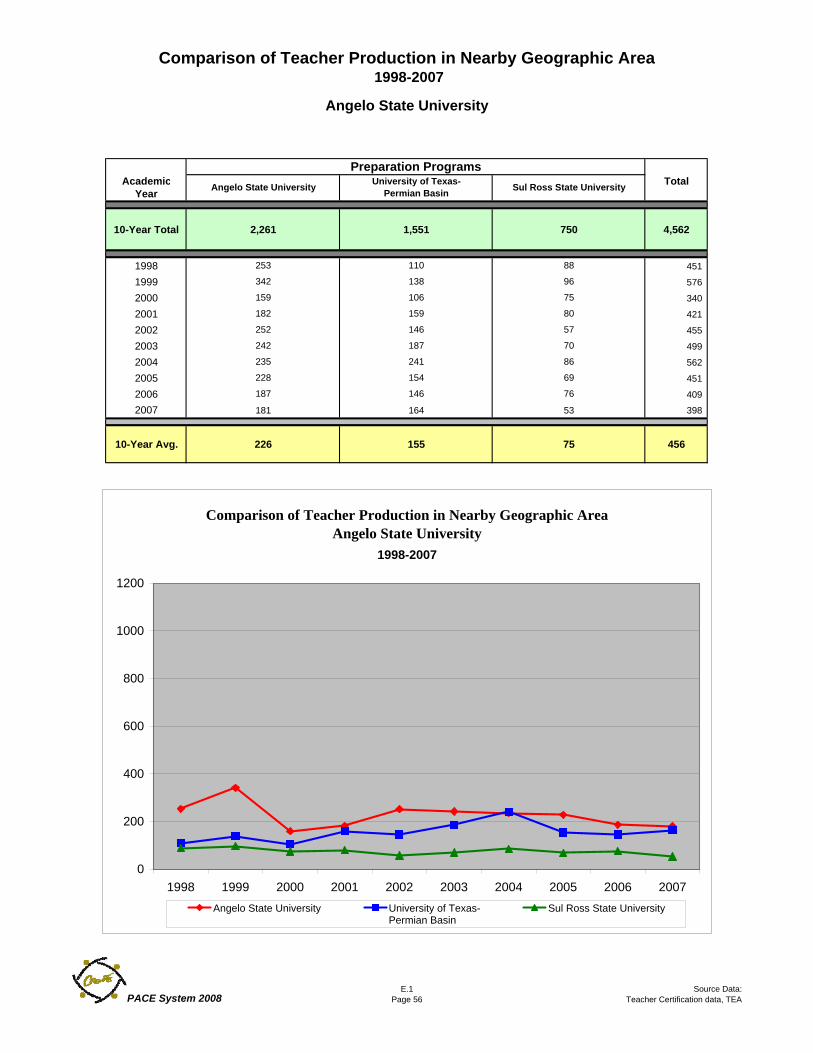
Comparison of Teacher Production in Nearby Geographic Area 1998-2007
Academic TotalYear
10-Year Total 2,261 1,551 750 4,562
1998 253 110 88 451
1999 342 138 96 576
2000 159 106 75 340
2001 182 159 80 421
2002 252 146 57 455
2003 242 187 70 499
2004 235 241 86 562
2005 228 154 69 451
2006 187 146 76 409
2007 181 164 53 398
10-Year Avg. 226 155 75 456
Angelo State University
Preparation ProgramsAngelo State University University of Texas-
Permian Basin Sul Ross State University
Comparison of Teacher Production in Nearby Geographic AreaAngelo State University
1998-2007
0
200
400
600
800
1000
1200
1998 1999 2000 2001 2002 2003 2004 2005 2006 2007Angelo State University University of Texas-
Permian BasinSul Ross State University
PACE System 2008E.1
Page 56Source Data:
Teacher Certification data, TEA
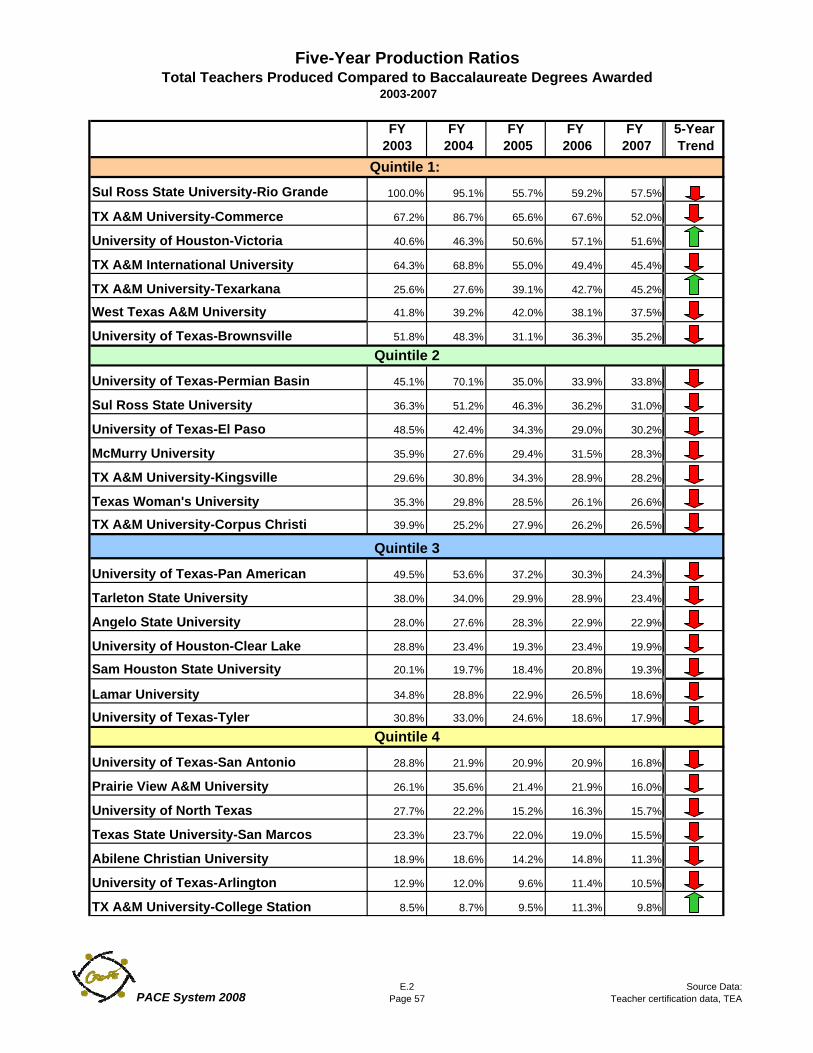
Five-Year Production Ratios Total Teachers Produced Compared to Baccalaureate Degrees Awarded
2003-2007
FY 2003
FY 2004
FY 2005
FY 2006
FY 2007
5-Year Trend
Sul Ross State University-Rio Grande 100.0% 95.1% 55.7% 59.2% 57.5%
TX A&M University-Commerce 67.2% 86.7% 65.6% 67.6% 52.0%
University of Houston-Victoria 40.6% 46.3% 50.6% 57.1% 51.6%
TX A&M International University 64.3% 68.8% 55.0% 49.4% 45.4%
TX A&M University-Texarkana 25.6% 27.6% 39.1% 42.7% 45.2%
West Texas A&M University 41.8% 39.2% 42.0% 38.1% 37.5%
University of Texas-Brownsville 51.8% 48.3% 31.1% 36.3% 35.2%
University of Texas-Permian Basin 45.1% 70.1% 35.0% 33.9% 33.8%
Sul Ross State University 36.3% 51.2% 46.3% 36.2% 31.0%
University of Texas-El Paso 48.5% 42.4% 34.3% 29.0% 30.2%
McMurry University 35.9% 27.6% 29.4% 31.5% 28.3%
TX A&M University-Kingsville 29.6% 30.8% 34.3% 28.9% 28.2%
Texas Woman's University 35.3% 29.8% 28.5% 26.1% 26.6%
TX A&M University-Corpus Christi 39.9% 25.2% 27.9% 26.2% 26.5%
University of Texas-Pan American 49.5% 53.6% 37.2% 30.3% 24.3%
Tarleton State University 38.0% 34.0% 29.9% 28.9% 23.4%
Angelo State University 28.0% 27.6% 28.3% 22.9% 22.9%
University of Houston-Clear Lake 28.8% 23.4% 19.3% 23.4% 19.9%
Sam Houston State University 20.1% 19.7% 18.4% 20.8% 19.3%
Lamar University 34.8% 28.8% 22.9% 26.5% 18.6%
University of Texas-Tyler 30.8% 33.0% 24.6% 18.6% 17.9%
University of Texas-San Antonio 28.8% 21.9% 20.9% 20.9% 16.8%
Prairie View A&M University 26.1% 35.6% 21.4% 21.9% 16.0%
University of North Texas 27.7% 22.2% 15.2% 16.3% 15.7%
Texas State University-San Marcos 23.3% 23.7% 22.0% 19.0% 15.5%
Abilene Christian University 18.9% 18.6% 14.2% 14.8% 11.3%
University of Texas-Arlington 12.9% 12.0% 9.6% 11.4% 10.5%
TX A&M University-College Station 8.5% 8.7% 9.5% 11.3% 9.8%
Quintile 4
Quintile 3
Quintile 2
Quintile 1:
PACE System 2008E.2
Page 57Source Data:
Teacher certification data, TEA
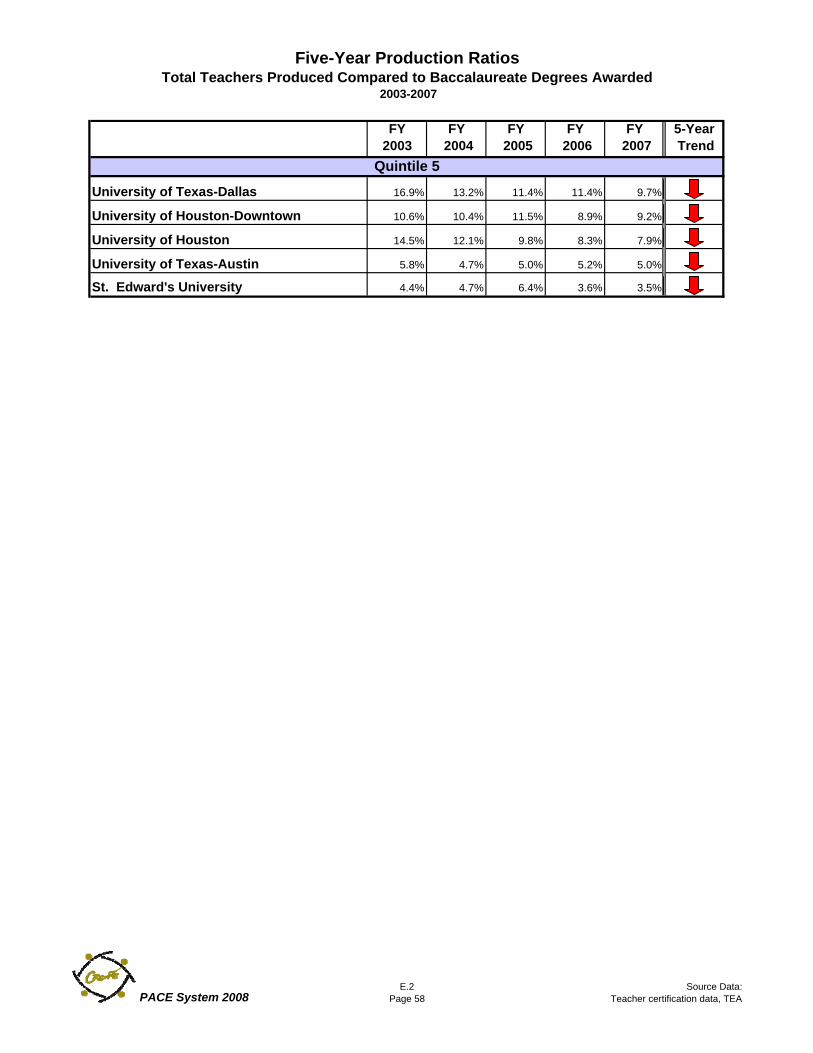
Five-Year Production Ratios Total Teachers Produced Compared to Baccalaureate Degrees Awarded
2003-2007
FY 2003
FY 2004
FY 2005
FY 2006
FY 2007
5-Year Trend
University of Texas-Dallas 16.9% 13.2% 11.4% 11.4% 9.7%
University of Houston-Downtown 10.6% 10.4% 11.5% 8.9% 9.2%
University of Houston 14.5% 12.1% 9.8% 8.3% 7.9%
University of Texas-Austin 5.8% 4.7% 5.0% 5.2% 5.0%
St. Edward's University 4.4% 4.7% 6.4% 3.6% 3.5%
Quintile 5
PACE System 2008E.2
Page 58Source Data:
Teacher certification data, TEA
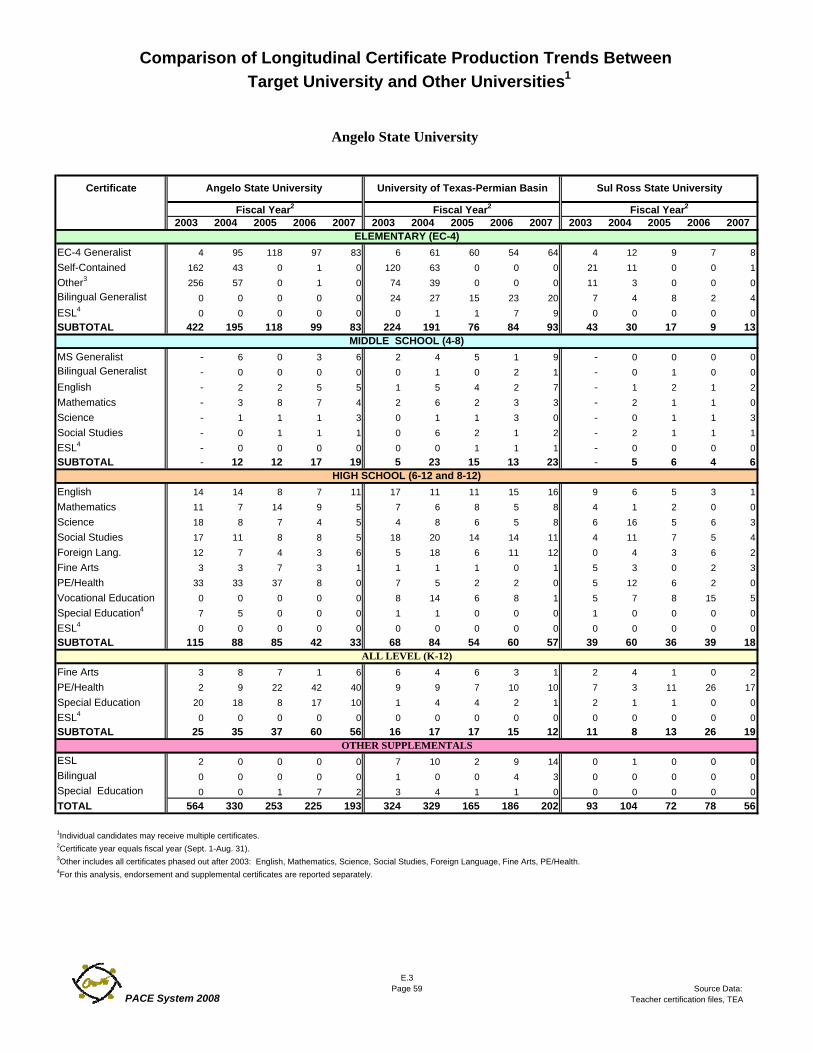
Comparison of Longitudinal Certificate Production Trends Between Target University and Other Universities1
2003 2004 2005 2006 2007 2003 2004 2005 2006 2007 2003 2004 2005 2006 2007
EC-4 Generalist 4 95 118 97 83 6 61 60 54 64 4 12 9 7 8Self-Contained 162 43 0 1 0 120 63 0 0 0 21 11 0 0 1Other3 256 57 0 1 0 74 39 0 0 0 11 3 0 0 0Bilingual Generalist 0 0 0 0 0 24 27 15 23 20 7 4 8 2 4ESL4 0 0 0 0 0 0 1 1 7 9 0 0 0 0 0SUBTOTAL 422 195 118 99 83 224 191 76 84 93 43 30 17 9 13
MS Generalist - 6 0 3 6 2 4 5 1 9 - 0 0 0 0Bilingual Generalist - 0 0 0 0 0 1 0 2 1 - 0 1 0 0English - 2 2 5 5 1 5 4 2 7 - 1 2 1 2Mathematics - 3 8 7 4 2 6 2 3 3 - 2 1 1 0Science - 1 1 1 3 0 1 1 3 0 - 0 1 1 3Social Studies - 0 1 1 1 0 6 2 1 2 - 2 1 1 1ESL4 - 0 0 0 0 0 0 1 1 1 - 0 0 0 0SUBTOTAL - 12 12 17 19 5 23 15 13 23 - 5 6 4 6
English 14 14 8 7 11 17 11 11 15 16 9 6 5 3 1Mathematics 11 7 14 9 5 7 6 8 5 8 4 1 2 0 0Science 18 8 7 4 5 4 8 6 5 8 6 16 5 6 3Social Studies 17 11 8 8 5 18 20 14 14 11 4 11 7 5 4Foreign Lang. 12 7 4 3 6 5 18 6 11 12 0 4 3 6 2Fine Arts 3 3 7 3 1 1 1 1 0 1 5 3 0 2 3PE/Health 33 33 37 8 0 7 5 2 2 0 5 12 6 2 0Vocational Education 0 0 0 0 0 8 14 6 8 1 5 7 8 15 5Special Education4 7 5 0 0 0 1 1 0 0 0 1 0 0 0 0ESL4 0 0 0 0 0 0 0 0 0 0 0 0 0 0 0SUBTOTAL 115 88 85 42 33 68 84 54 60 57 39 60 36 39 18
Fine Arts 3 8 7 1 6 6 4 6 3 1 2 4 1 0 2PE/Health 2 9 22 42 40 9 9 7 10 10 7 3 11 26 17Special Education 20 18 8 17 10 1 4 4 2 1 2 1 1 0 0ESL4 0 0 0 0 0 0 0 0 0 0 0 0 0 0 0SUBTOTAL 25 35 37 60 56 16 17 17 15 12 11 8 13 26 19
ESL 2 0 0 0 0 7 10 2 9 14 0 1 0 0 0Bilingual 0 0 0 0 0 1 0 0 4 3 0 0 0 0 0Special Education 0 0 1 7 2 3 4 1 1 0 0 0 0 0 0TOTAL 564 330 253 225 193 324 329 165 186 202 93 104 72 78 56
Sul Ross State University
2Certificate year equals fiscal year (Sept. 1-Aug. 31). 3Other includes all certificates phased out after 2003: English, Mathematics, Science, Social Studies, Foreign Language, Fine Arts, PE/Health. 4For this analysis, endorsement and supplemental certificates are reported separately.
Fiscal Year2 Fiscal Year2 Fiscal Year2
1Individual candidates may receive multiple certificates.
Angelo State University
ALL LEVEL (K-12)
OTHER SUPPLEMENTALS
MIDDLE SCHOOL (4-8)
HIGH SCHOOL (6-12 and 8-12)
Angelo State University Certificate
ELEMENTARY (EC-4)
University of Texas-Permian Basin
PACE System 2008
E.3Page 59 Source Data:
Teacher certification files, TEA
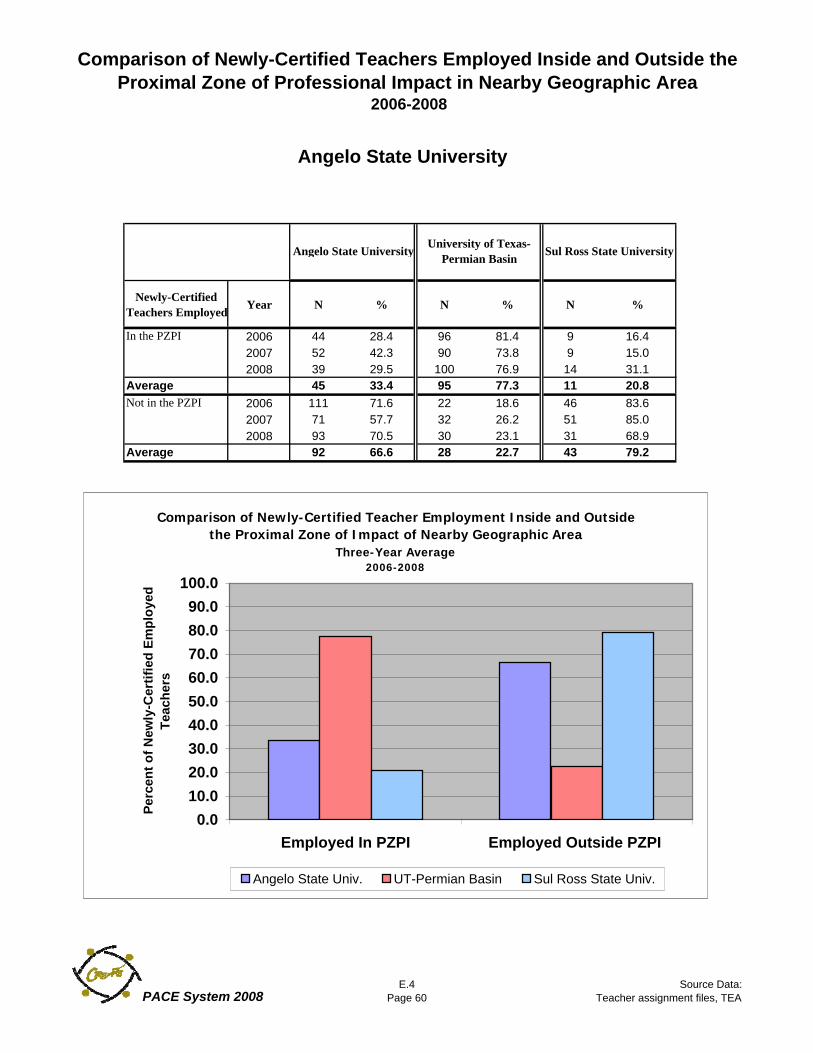
Comparison of Newly-Certified Teachers Employed Inside and Outside the Proximal Zone of Professional Impact in Nearby Geographic Area
2006-2008
Newly-Certified Teachers Employed Year N % N % N %
In the PZPI 2006 44 28.4 96 81.4 9 16.42007 52 42.3 90 73.8 9 15.02008 39 29.5 100 76.9 14 31.1
Average 45 33.4 95 77.3 11 20.8Not in the PZPI 2006 111 71.6 22 18.6 46 83.6
2007 71 57.7 32 26.2 51 85.02008 93 70.5 30 23.1 31 68.9
Average 92 66.6 28 22.7 43 79.2
3-Year AverageEmployed Employed Outside PZPI
Angelo State Univ 33.4 66.6UT-Permian Basi 77.3 22.7Sul Ross State U 20.8 79.2
Angelo State University
Angelo State University University of Texas-Permian Basin Sul Ross State University
Comparison of Newly-Certified Teacher Employment Inside and Outside the Proximal Zone of Impact of Nearby Geographic Area
Three-Year Average2006-2008
0.010.020.030.040.050.060.070.080.090.0
100.0
Employed In PZPI Employed Outside PZPI
Perc
ent o
f New
ly-C
ertif
ied
Empl
oyed
Teac
hers
Angelo State Univ. UT-Permian Basin Sul Ross State Univ.
PACE System 2008E.4
Page 60Source Data:
Teacher assignment files, TEA
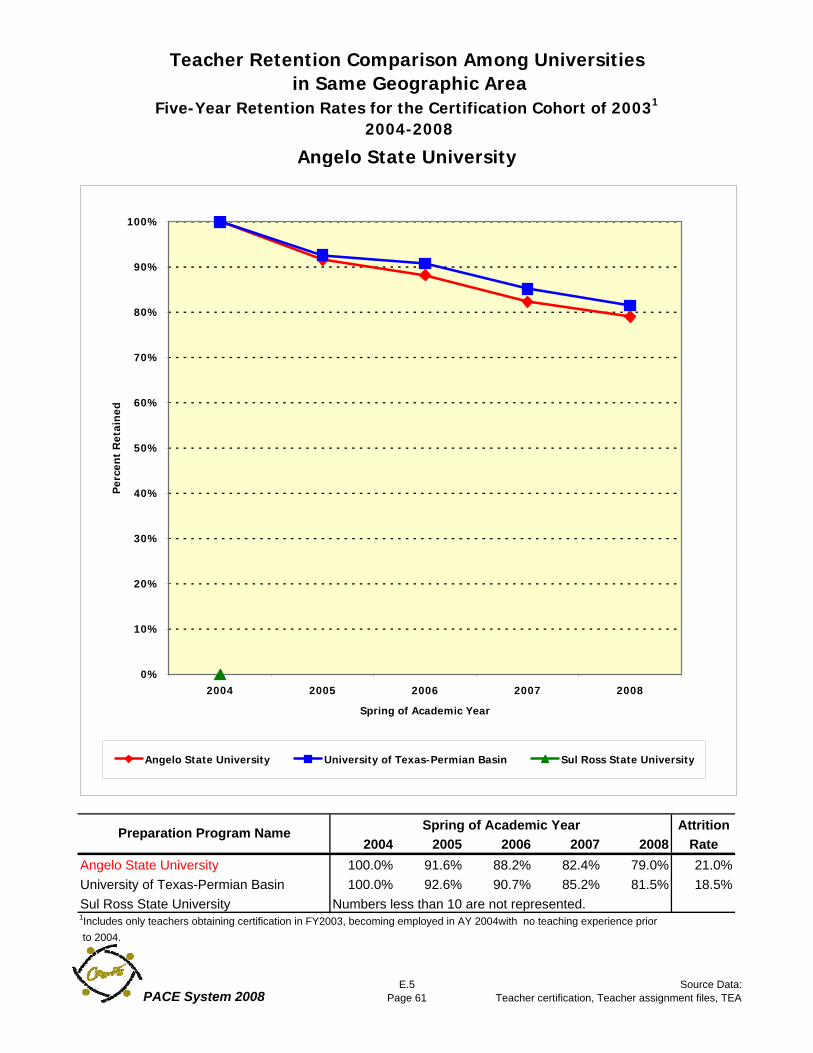
Teacher Retention Comparison Among Universities in Same Geographic Area
Five-Year Retention Rates for the Certification Cohort of 20031
2004-2008
Attrition2004 2005 2006 2007 2008 Rate
Angelo State University 100.0% 91.6% 88.2% 82.4% 79.0% 21.0%University of Texas-Permian Basin 100.0% 92.6% 90.7% 85.2% 81.5% 18.5%Sul Ross State University Numbers less than 10 are not represented.
to 2004.
Spring of Academic Year
Angelo State University
Preparation Program Name
1Includes only teachers obtaining certification in FY2003, becoming employed in AY 2004with no teaching experience prior
0%
10%
20%
30%
40%
50%
60%
70%
80%
90%
100%
2004 2005 2006 2007 2008
Spring of Academic Year
Per
cen
t R
etai
ned
Angelo State University University of Texas-Permian Basin Sul Ross State University
PACE System 2008E.5
Page 61Source Data:
Teacher certification, Teacher assignment files, TEA
62
Performance Analysis System for Colleges of Education (PACE)
Information Regarding Data Correction and Data Requests The Year Two PACE Report is intended for use by various educational stakeholders. The data presented should be validated by each individual university. Depending on each university’s particular need, CREATE offers additional support and technical assistance.
All inquiries regarding PACE should be forwarded to:
CREATE Associate Director of Research
ATTN: Sherri Lowrey [email protected]
936-273-7661
The following forms can be downloaded from the CREATE website at www.createtx.org. Data Correction Form If data in the PACE Report varies substantially from your university’s data, please follow the directions on the Data Correction Form found on the CREATE website. After completion, the Data Correction Form should be submitted to the Associate Director of Research. Contact information is listed above. Request for Custom Reports If further information and reports are needed, please follow the directions on the Request for Custom Report Form found on the CREATE website. After completion, the Data Correction Form should be submitted to the Associate Director of Research. Contact information is listed above. Request for Professional Development Requests for on-site professional development regarding the PACE can be directed to the Associate Director of Research using the contact information cited above.
CREATE’S EXECUTIVE TEAM
MONA S. WINEBURG
EXECUTIVE DIRECTOR [email protected]
JEANETTE NARVAEZ
DIRECTOR OF OPERATIONS & RESEARCH DISSEMINATION [email protected]
SHERRI LOWREY
ASSOCIATE DIRECTOR OF RESEARCH [email protected]
WILLIAM E. REAVES
EXECUTIVE DIRECTOR EMERITUS [email protected]
ROBERT COX
HIGHER EDUCATION RESEARCH LIAISON [email protected]
JOHN BECK
HIGHER EDUCATION RESEARCH LIAISON [email protected]
MELISSA FAUX
RESEARCH ASSOCIATE [email protected]
PAULA HART
ADMINISTRATIVE ASSISTANT [email protected]
NANCY OLSON
ADMINISTRATIVE SECRETARY [email protected]
Center for Research, Evaluation and Advancement of
Teacher Education 3232 College Park Drive, Suite 303
The Woodlands, TX 77384 936.273.7661
936.273.7592 Fax www.createtx.org