Embed Size (px)
Citation preview

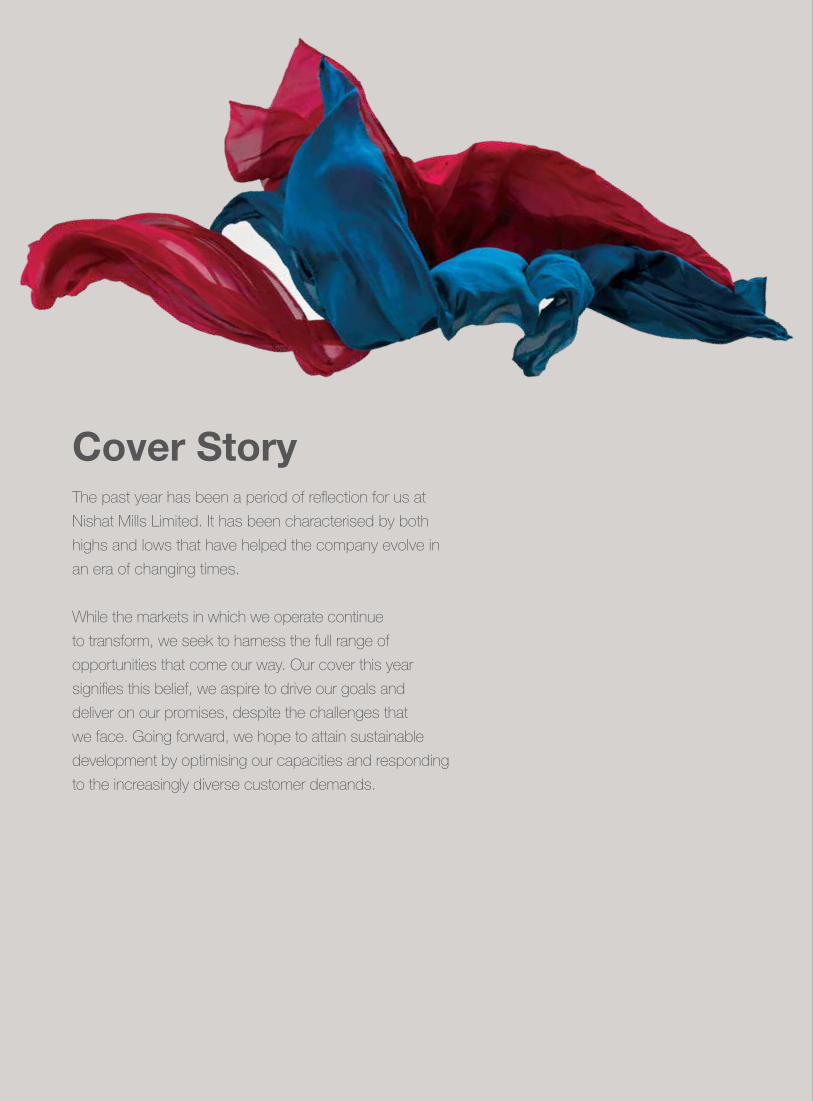
Cover StoryThe past year has been a period of reflection for us at Nishat Mills Limited. It has been characterised by both highs and lows that have helped the company evolve in an era of changing times.
While the markets in which we operate continue to transform, we seek to harness the full range of opportunities that come our way. Our cover this year signifies this belief, we aspire to drive our goals and deliver on our promises, despite the challenges that we face. Going forward, we hope to attain sustainable development by optimising our capacities and responding to the increasingly diverse customer demands.
Contents
CorporateCompany Information 2Directors’ Profile 4Organizational Chart 7Vision, Mission and overall Strategic Objectives 8Company Profile 10Nature of Business 10Group Structure & Geographical Presence of the Company 11Corporate Values and Code of Conduct 12Company Policies 16Year in Review 24Board Committees 25Report of Audit Committee 28Directors’ Report 30Financial Highlights 48Horizontal Analysis 50Vertical Analysis 51Comments on Six Years Performance 52Du Pont Analysis 53Quarterly Analysis 54Share Price Sensitivity Analysis 55Cash Flow Statement based on Direct Method 56Critical Performance Indicators 57Statement of Value Addition and Distribution 58Statement of Compliance with the Code of Corporate Governance 60Review Report to the Members on the Statement of Compliance with the Code of Corporate Governance 62Notice of Annual General Meeting 63Jama Punji Ad 66
Financial Statements of Nishat Mills LimitedAuditors’ Report to the Members 69Balance Sheet 70Profit and Loss Account 72Statement of Comprehensive Income 73Cash Flow Statement 74Statement of Changes in Equity 75Notes to the Financial Statements 76
Consolidated Financial Statements of Nishat Mills Limited and its SubsidiariesDirectors’ Report 119Auditors’ Report to the Members 121Consolidated Balance Sheet 122Consolidated Profit and Loss Account 124Consolidated Statement of Comprehensive Income 125Consolidated Cash Flow Statement 126Consolidated Statement of Changes in Equity 127Notes to the Consolidated Financial Statements 128Pattern of Holding of the Shares 178Form of Proxy
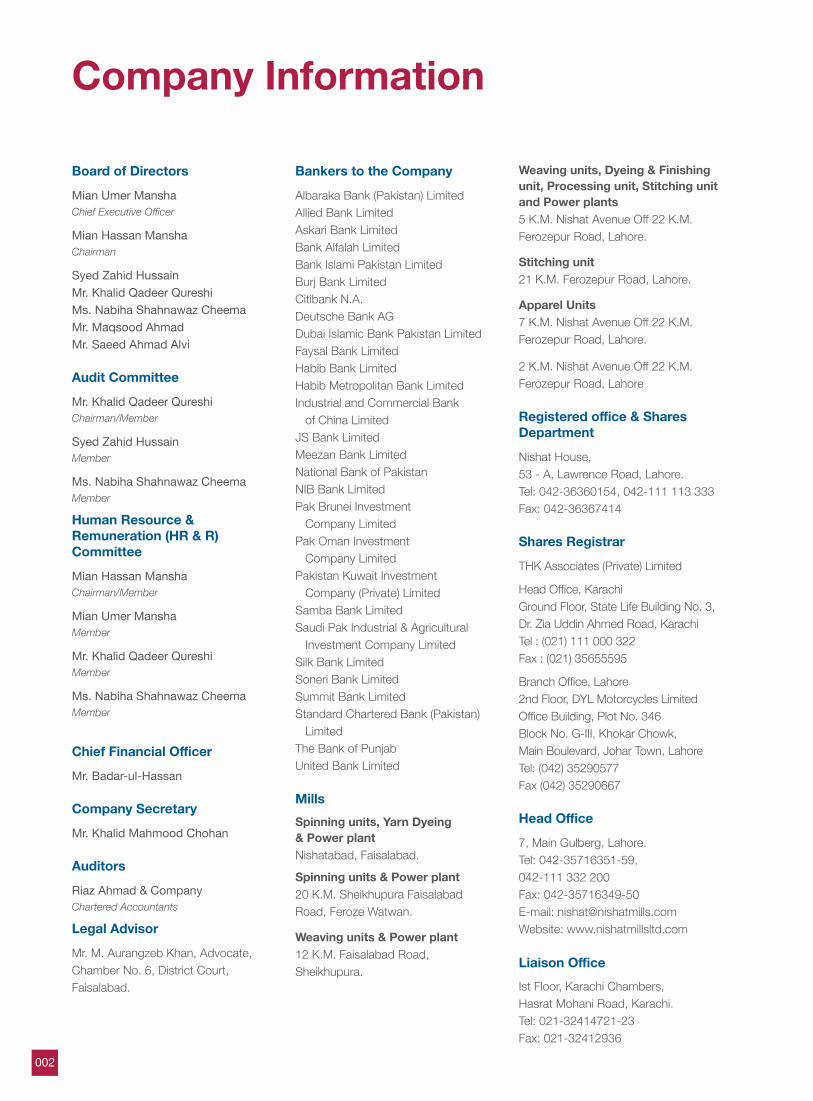
Company Information
Board of Directors
Mian Umer Mansha Chief Executive Officer
Mian Hassan ManshaChairman
Syed Zahid HussainMr. Khalid Qadeer QureshiMs. Nabiha Shahnawaz CheemaMr. Maqsood AhmadMr. Saeed Ahmad Alvi
Audit Committee
Mr. Khalid Qadeer Qureshi Chairman/Member
Syed Zahid HussainMember
Ms. Nabiha Shahnawaz Cheema Member
Human Resource & Remuneration (HR & R) Committee
Mian Hassan Mansha Chairman/Member
Mian Umer Mansha Member
Mr. Khalid Qadeer Qureshi Member
Ms. Nabiha Shahnawaz Cheema Member
Chief Financial Officer
Mr. Badar-ul-Hassan
Company Secretary
Mr. Khalid Mahmood Chohan
Auditors
Riaz Ahmad & CompanyChartered Accountants
Legal Advisor
Mr. M. Aurangzeb Khan, Advocate,Chamber No. 6, District Court,Faisalabad.
Bankers to the Company
Albaraka Bank (Pakistan) LimitedAllied Bank LimitedAskari Bank LimitedBank Alfalah LimitedBank Islami Pakistan LimitedBurj Bank LimitedCitibank N.A.Deutsche Bank AGDubai Islamic Bank Pakistan LimitedFaysal Bank LimitedHabib Bank LimitedHabib Metropolitan Bank LimitedIndustrial and Commercial Bank of China LimitedJS Bank LimitedMeezan Bank LimitedNational Bank of PakistanNIB Bank LimitedPak Brunei Investment Company LimitedPak Oman Investment Company LimitedPakistan Kuwait Investment Company (Private) LimitedSamba Bank LimitedSaudi Pak Industrial & Agricultural Investment Company LimitedSilk Bank LimitedSoneri Bank LimitedSummit Bank LimitedStandard Chartered Bank (Pakistan) LimitedThe Bank of PunjabUnited Bank Limited
MillsSpinning units, Yarn Dyeing & Power plantNishatabad, Faisalabad.
Spinning units & Power plant20 K.M. Sheikhupura Faisalabad Road, Feroze Watwan.
Weaving units & Power plant12 K.M. Faisalabad Road, Sheikhupura.
Weaving units, Dyeing & Finishing unit, Processing unit, Stitching unit and Power plants5 K.M. Nishat Avenue Off 22 K.M. Ferozepur Road, Lahore.
Stitching unit21 K.M. Ferozepur Road, Lahore.
Apparel Units7 K.M. Nishat Avenue Off 22 K.M. Ferozepur Road, Lahore.
2 K.M. Nishat Avenue Off 22 K.M. Ferozepur Road, Lahore
Registered office & Shares Department
Nishat House,53 - A, Lawrence Road, Lahore.Tel: 042-36360154, 042-111 113 333Fax: 042-36367414
Shares Registrar
THK Associates (Private) Limited
Head Office, KarachiGround Floor, State Life Building No. 3, Dr. Zia Uddin Ahmed Road, KarachiTel : (021) 111 000 322Fax : (021) 35655595
Branch Office, Lahore 2nd Floor, DYL Motorcycles LimitedOffice Building, Plot No. 346Block No. G-III, Khokar Chowk,Main Boulevard, Johar Town, LahoreTel: (042) 35290577Fax (042) 35290667
Head Office
7, Main Gulberg, Lahore.Tel: 042-35716351-59,042-111 332 200Fax: 042-35716349-50E-mail: [email protected]: www.nishatmillsltd.com
Liaison OfficeIst Floor, Karachi Chambers,Hasrat Mohani Road, Karachi.Tel: 021-32414721-23Fax: 021-32412936
002
003Annual Report 2015 of Nishat Mills Limited
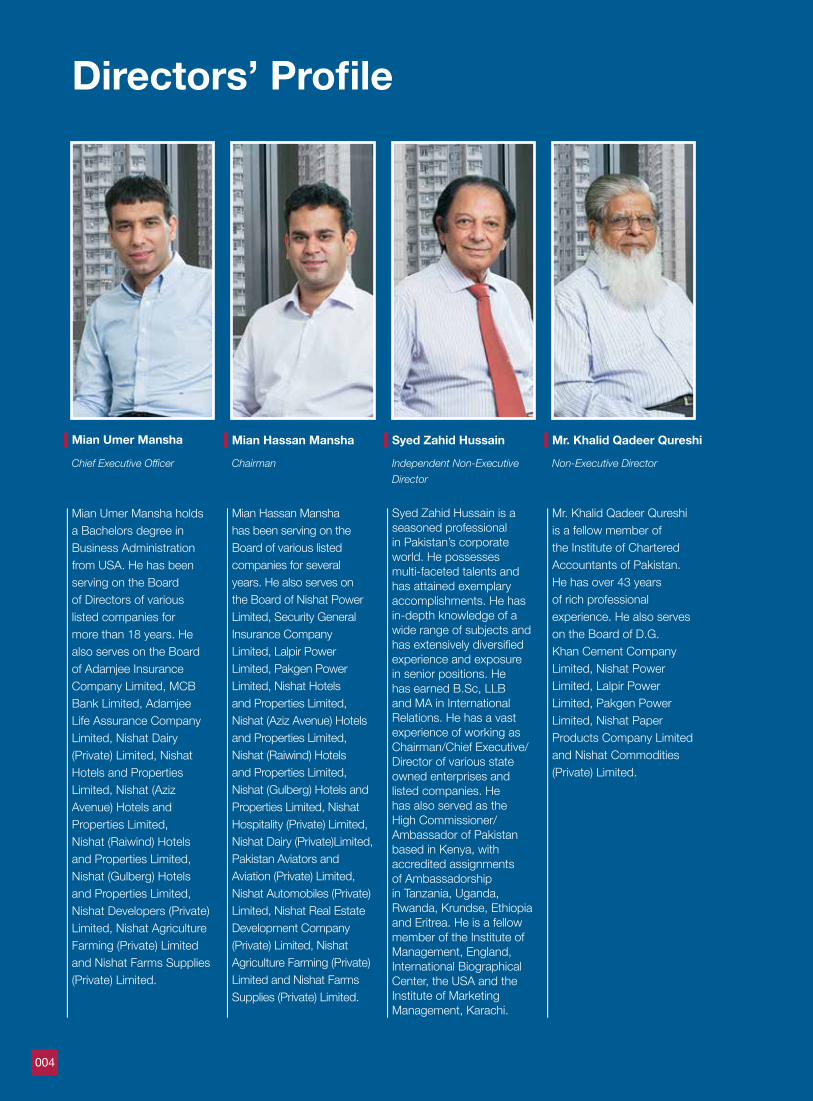
Directors’ Profile
Mian Umer Mansha holds a Bachelors degree in Business Administration from USA. He has been serving on the Board of Directors of various listed companies for more than 18 years. He also serves on the Board of Adamjee Insurance Company Limited, MCB Bank Limited, Adamjee Life Assurance Company Limited, Nishat Dairy (Private) Limited, Nishat Hotels and Properties Limited, Nishat (Aziz Avenue) Hotels and Properties Limited, Nishat (Raiwind) Hotels and Properties Limited, Nishat (Gulberg) Hotels and Properties Limited, Nishat Developers (Private) Limited, Nishat Agriculture Farming (Private) Limited and Nishat Farms Supplies (Private) Limited.
Mian Hassan Mansha has been serving on the Board of various listed companies for several years. He also serves on the Board of Nishat Power Limited, Security General Insurance Company Limited, Lalpir Power Limited, Pakgen Power Limited, Nishat Hotels and Properties Limited, Nishat (Aziz Avenue) Hotels and Properties Limited, Nishat (Raiwind) Hotels and Properties Limited, Nishat (Gulberg) Hotels and Properties Limited, Nishat Hospitality (Private) Limited, Nishat Dairy (Private)Limited, Pakistan Aviators and Aviation (Private) Limited, Nishat Automobiles (Private) Limited, Nishat Real Estate Development Company (Private) Limited, Nishat Agriculture Farming (Private) Limited and Nishat Farms Supplies (Private) Limited.
Mr. Khalid Qadeer Qureshi is a fellow member of the Institute of Chartered Accountants of Pakistan. He has over 43 years of rich professional experience. He also serves on the Board of D.G. Khan Cement Company Limited, Nishat Power Limited, Lalpir Power Limited, Pakgen Power Limited, Nishat Paper Products Company Limited and Nishat Commodities (Private) Limited.
Syed Zahid Hussain is a seasoned professional in Pakistan’s corporate world. He possesses multi-faceted talents and has attained exemplary accomplishments. He has in-depth knowledge of a wide range of subjects and has extensively diversified experience and exposure in senior positions. He has earned B.Sc, LLB and MA in International Relations. He has a vast experience of working as Chairman/Chief Executive/Director of various state owned enterprises and listed companies. He has also served as the High Commissioner/Ambassador of Pakistan based in Kenya, with accredited assignments of Ambassadorship in Tanzania, Uganda, Rwanda, Krundse, Ethiopia and Eritrea. He is a fellow member of the Institute of Management, England, International Biographical Center, the USA and the Institute of Marketing Management, Karachi.
Mian Umer Mansha
Chief Executive Officer
Mian Hassan Mansha
Chairman
Syed Zahid Hussain
Independent Non-Executive Director
Mr. Khalid Qadeer Qureshi
Non-Executive Director
004
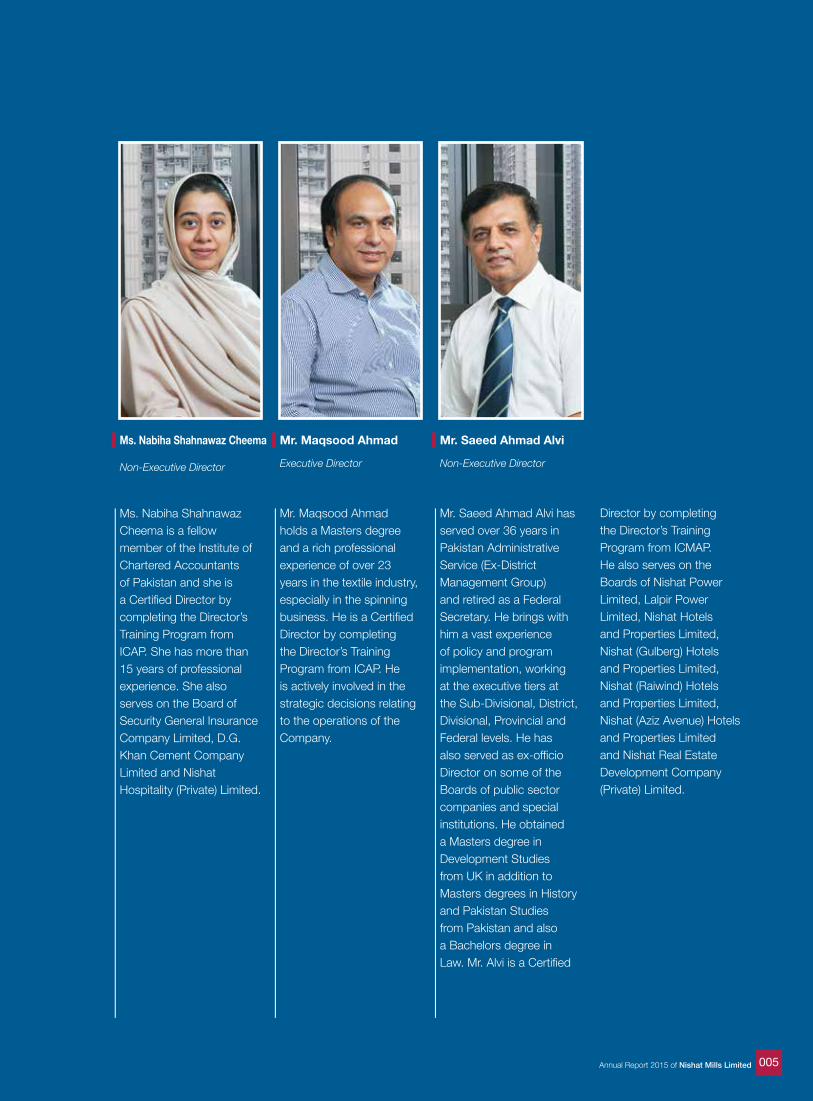
Ms. Nabiha Shahnawaz Cheema is a fellow member of the Institute of Chartered Accountants of Pakistan and she is a Certified Director by completing the Director’s Training Program from ICAP. She has more than 15 years of professional experience. She also serves on the Board of Security General Insurance Company Limited, D.G. Khan Cement Company Limited and Nishat Hospitality (Private) Limited.
Mr. Maqsood Ahmad holds a Masters degree and a rich professional experience of over 23 years in the textile industry, especially in the spinning business. He is a Certified Director by completing the Director’s Training Program from ICAP. He is actively involved in the strategic decisions relating to the operations of the Company.
Mr. Saeed Ahmad Alvi has served over 36 years in Pakistan Administrative Service (Ex-District Management Group) and retired as a Federal Secretary. He brings with him a vast experience of policy and program implementation, working at the executive tiers at the Sub-Divisional, District, Divisional, Provincial and Federal levels. He has also served as ex-officio Director on some of the Boards of public sector companies and special institutions. He obtained a Masters degree in Development Studies from UK in addition to Masters degrees in History and Pakistan Studies from Pakistan and also a Bachelors degree in Law. Mr. Alvi is a Certified
Director by completing the Director’s Training Program from ICMAP. He also serves on the Boards of Nishat Power Limited, Lalpir Power Limited, Nishat Hotels and Properties Limited, Nishat (Gulberg) Hotels and Properties Limited, Nishat (Raiwind) Hotels and Properties Limited, Nishat (Aziz Avenue) Hotels and Properties Limited and Nishat Real Estate Development Company (Private) Limited.
Ms. Nabiha Shahnawaz Cheema
Non-Executive Director
Mr. Maqsood Ahmad
Executive Director
Mr. Saeed Ahmad Alvi
Non-Executive Director
005Annual Report 2015 of Nishat Mills Limited
006
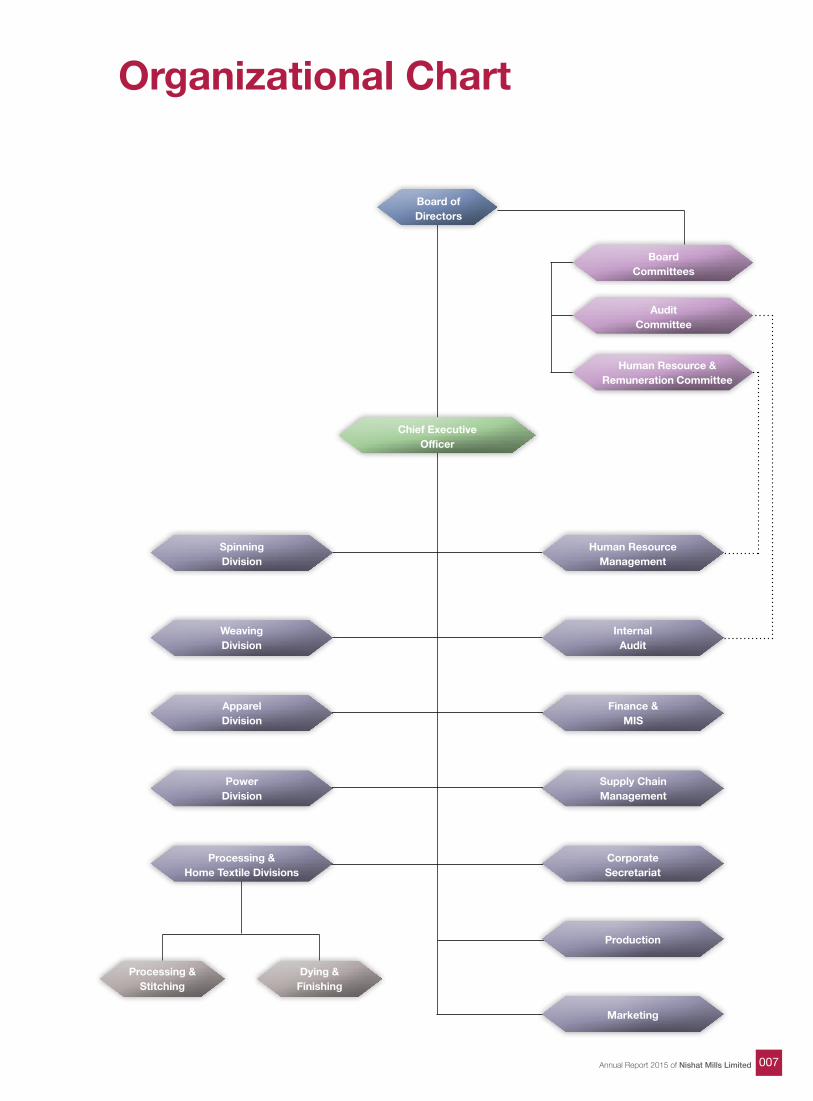
Organizational Chart
Board of Directors
Board Committees
Audit Committee
Human Resource &Remuneration Committee
Processing &Stitching
Dying &Finishing
Chief ExecutiveOfficer
Marketing
Human ResourceManagement
InternalAudit
Finance &MIS
Supply ChainManagement
CorporateSecretariat
Production
WeavingDivision
ApparelDivision
PowerDivision
Processing &Home Textile Divisions
SpinningDivision
007Annual Report 2015 of Nishat Mills Limited
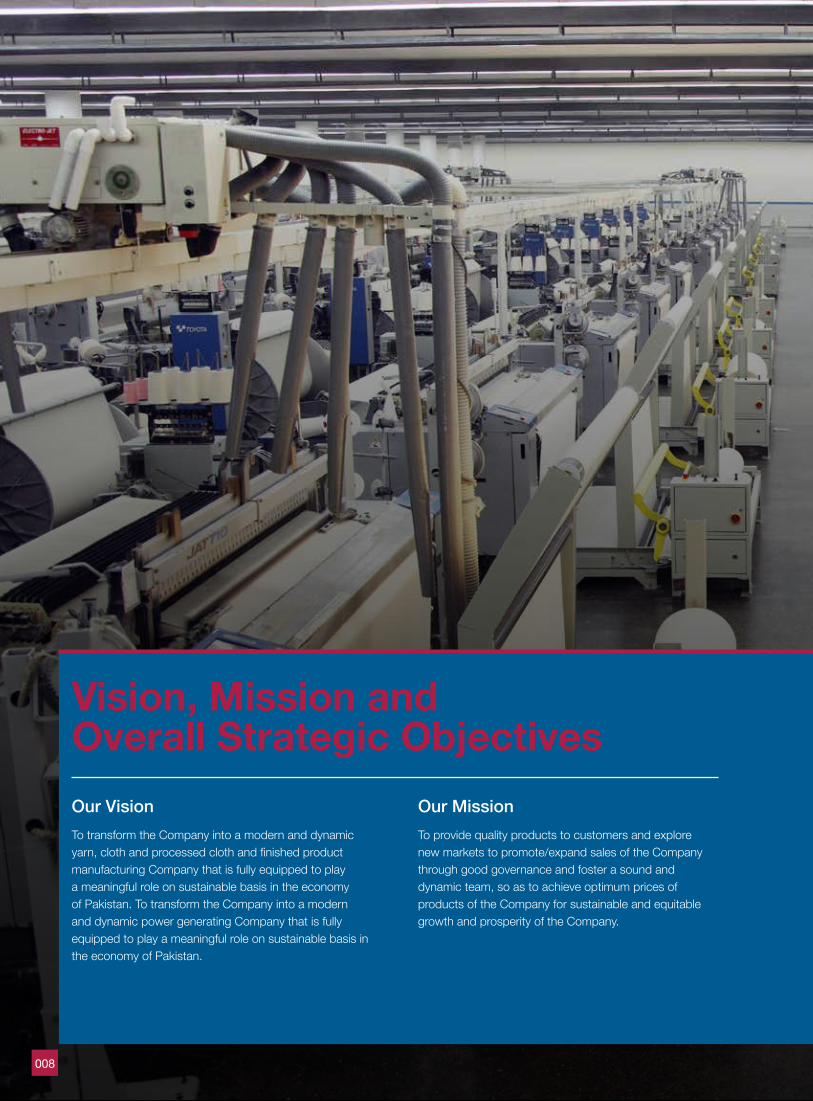
Vision, Mission and Overall Strategic ObjectivesOur VisionTo transform the Company into a modern and dynamic yarn, cloth and processed cloth and finished product manufacturing Company that is fully equipped to play a meaningful role on sustainable basis in the economy of Pakistan. To transform the Company into a modern and dynamic power generating Company that is fully equipped to play a meaningful role on sustainable basis in the economy of Pakistan.
Our MissionTo provide quality products to customers and explore new markets to promote/expand sales of the Company through good governance and foster a sound and dynamic team, so as to achieve optimum prices of products of the Company for sustainable and equitable growth and prosperity of the Company.
008
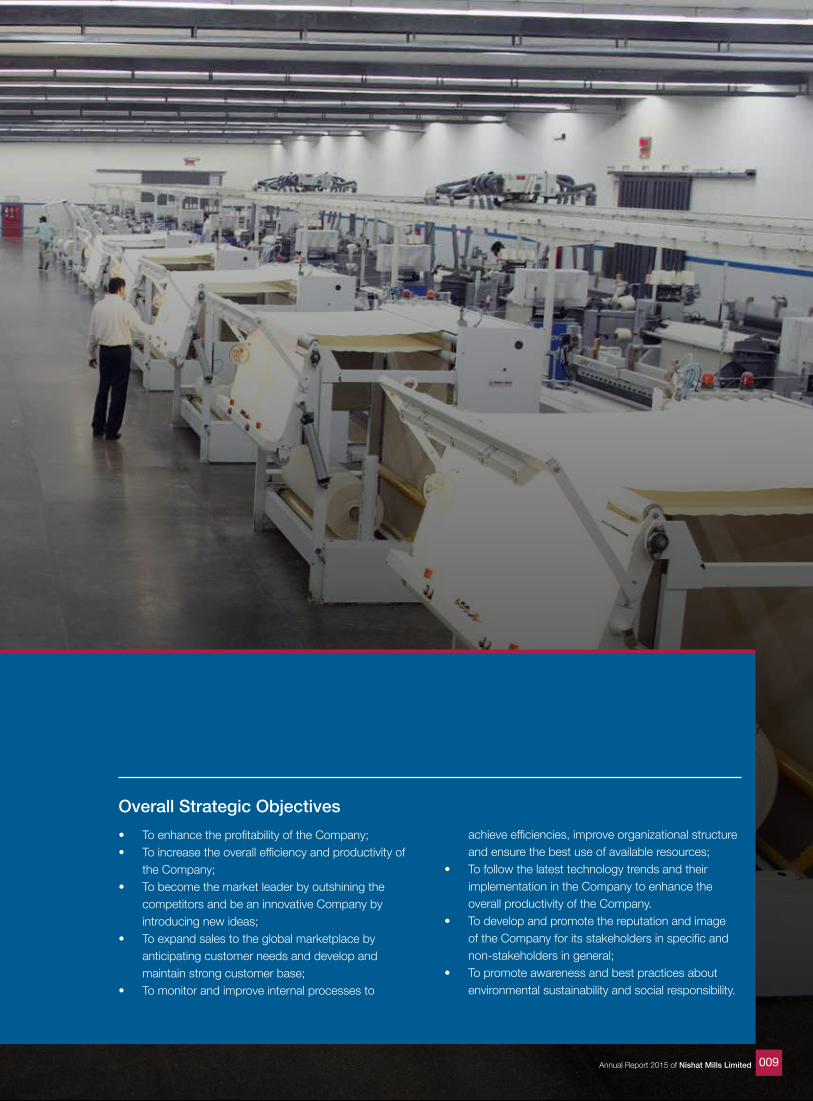
Overall Strategic Objectives• To enhance the profitability of the Company;• To increase the overall efficiency and productivity of
the Company;• To become the market leader by outshining the
competitors and be an innovative Company by introducing new ideas;
• To expand sales to the global marketplace by anticipating customer needs and develop and maintain strong customer base;
• To monitor and improve internal processes to
achieve efficiencies, improve organizational structure and ensure the best use of available resources;
• To follow the latest technology trends and their implementation in the Company to enhance the overall productivity of the Company.
• To develop and promote the reputation and image of the Company for its stakeholders in specific and non-stakeholders in general;
• To promote awareness and best practices about environmental sustainability and social responsibility.
009Annual Report 2015 of Nishat Mills Limited
Company Profile
Nature of Business
Nishat Mills Limited (“the Company”) is the most modern and largest vertically integrated textile Company in Pakistan. The Company commenced its business as a partnership firm in 1951 and was incorporated as a private limited Company in 1959. Later it was listed on the Karachi, Lahore and Islamabad Stock Exchanges on 27 November 1961, 11 March 1989 and 10 August 1992 respectively.
The Company’s production facilities comprise of spinning, weaving, printing, dyeing, home textile and garment stitching and power generation.
Overall, the Company has 32 manufacturing units each specializing in a specific product range located in Faisalabad, Sheikhupura, Ferozewatwan and Lahore.
A major portion of the Company’s earnings is export based. Over the the years, the Company has achieved significant geographical diversification in its export sales mix.
Being a vertically integrated textile unit, Nishat Mills Limited has adopted a business model that helps it cater to the macro and micro level economic issues. The Company is engaged in the business of textile manufacturing and of spinning, combing, weaving, bleaching, dyeing, printing, stitching, apparel, buying, selling and otherwise dealing in yarn, linen, cloth, other goods and fabrics made from raw cotton, synthetic fiber and cloth.
The Company is also committed to generate, accumulate, distribute, supply and sell electricity. It is fully compliant with the requirements of all regulatory authorities of Pakistan. The textiles sector occupies a pivotal position in Pakistan’s economy, accounting for 8 percent of GDP with a significant potential for growth. It has the most intensive backward and forward linkages within the wider economic chain compared to any other sector, linking agriculture from industry to exports.
The textile sector employs 40 percent of the industrial sector’s work force, which provides livelihood to more than 10 million families. According to the International Cotton Advisory Committee, Pakistan is the fourth largest producer of cotton and the third largest consumer of cotton in the world. In addition, Pakistan is the world’s second largest cotton yarn exporter and third largest cotton cloth manufacturer and exporter. Pakistan is unique as it has a self-reliant production chain from cotton growing to ginning, spinning, weaving, processing and finishing and from fabrics to home textiles and apparel; all have links in the textile and clothing value chains which have been developed by Pakistan’s own industry.
The Company has a very broad base of customers for its products outside Pakistan. It has a long working relationship with the top brands of the world such as J.K.N. International, Levis, Next, Pincroft Dyeing, Ocean Garments, Gap, Carreman, Tommy Hilfiger, Tommy Bahamas, Crate & Barrel, Laura Ashley, American Living, Chaps, Hugo Boss, Revman and John Lewis.
Nishat Mills Limited is also called the flagship company of the Nishat Group. Nishat Group (“the Group”) is a leading business entity in South Asia. Its net worth makes it the largest business house of Pakistan. The Group has grown from a cotton export house into the premier business group of the country. Highly diversified, the Group has a presence in all the major sectors including Textiles, Cement, Banking, Insurance, Power Generation, Hotel Business, Agriculture, Dairy, Real Estate, Aviation and Paper Products. Showcasing its varied expertise and acumen in every facet of its operations, the group companies hold the distinction of being among the leading players in each sector.
010
Bela
Karachi
Keti BandarGhora Bari
BadinThatta
Mirpur KhasHyderabad
Dera Murad jamali
Shahi BalaNawshera
Mardan
Swabi
Attock
Mianwali
Isa khel
SohawaChakwal
BhalwalShahpurNarowal
GujranwalaFerozwalaSheikhupura
Lahore
KasurFaisalabad
Jhang
Kot Adu
Muzaffargarh
Lodhran
Rajanpur
Bahawalpur
Rahimyar Khan
DaharkiJacoabadKandhkot
Saleh Pat Rata DeroKhairpur
GambatJohi
Qazi Ahmed
HalaNawabshah
Khanewal
MianchannuBurewala
Vehari
Jaranwala
MansehraMuzaffarabad
Taxila
Rawalakot
Islamabad
Rawalpindi
Quetta
Gwadar
Sahiwal
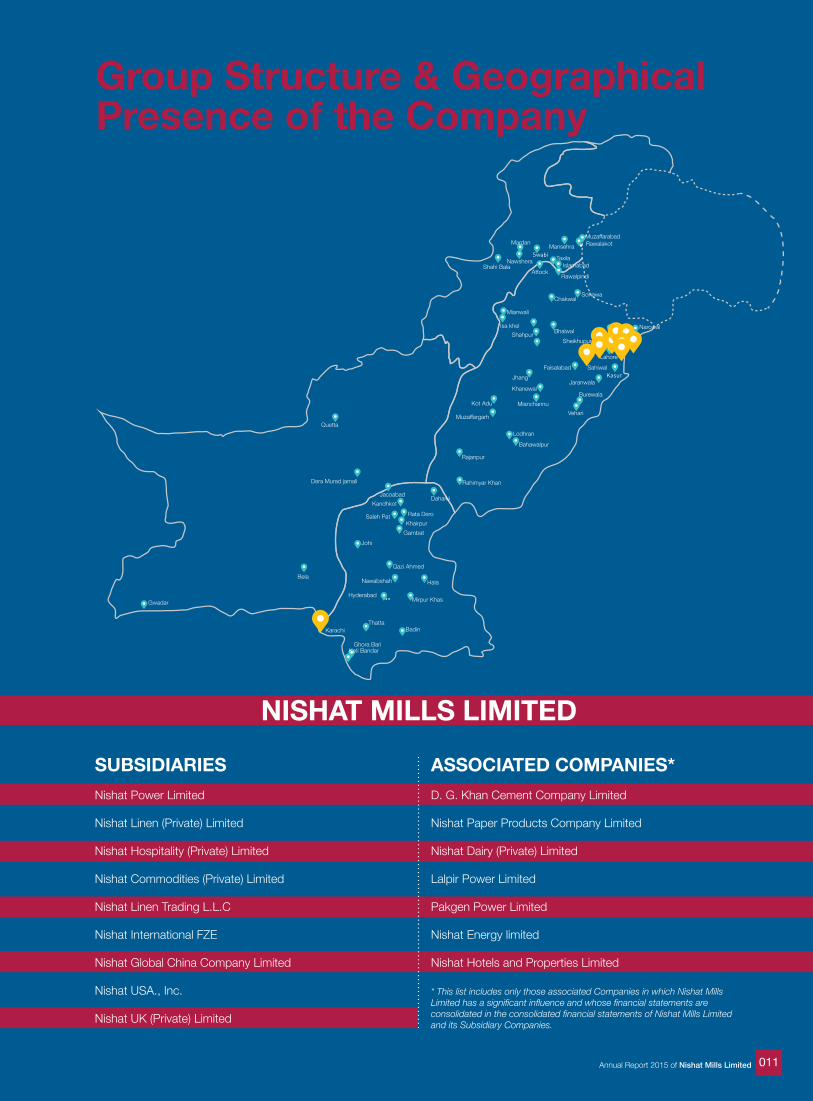
NISHAT MILLS LIMITED
SUBSIDIARIESNishat Power Limited
Nishat Linen (Private) Limited
Nishat Hospitality (Private) Limited
Nishat Commodities (Private) Limited
Nishat Linen Trading L.L.C
Nishat International FZE
Nishat Global China Company Limited
Nishat USA., Inc.
Nishat UK (Private) Limited
ASSOCIATED COMPANIES*D. G. Khan Cement Company Limited
Nishat Paper Products Company Limited
Nishat Dairy (Private) Limited
Lalpir Power Limited
Pakgen Power Limited
Nishat Energy limited
Nishat Hotels and Properties Limited
* This list includes only those associated Companies in which Nishat Mills Limited has a significant influence and whose financial statements are consolidated in the consolidated financial statements of Nishat Mills Limited and its Subsidiary Companies.
Group Structure & Geographical Presence of the Company
011Annual Report 2015 of Nishat Mills Limited
Corporate Values &Code of ConductThe Company has adopted the following corporate values:• To fulfill customer needs by producing quality products;• To act with good governance;• To achieve sustainable and equitable growth;• To promote diversity and ethical behavior; and• To develop a dynamic team of professionals to achieve
excellence and innovation.
The Company is committed to maintain the highest level of ethical conduct among its directors and employees. Therefore, separate codes were framed for directors and employees, which include the acceptable business practices, source of guidance and principles of behavior.
Salient Features for the Code of Conduct for DirectorsCompliance with Laws
Directors must comply with the laws, rules and regulations applicable to business of the Company in and outside of Pakistan.
Conflict of Interest
A conflict of an interest is a situation where a director would be in a position to make personal gains by influencing the decision making process. A conflict of interest might not be easily identifiable. Whenever a director feels that the conflict of interest exists, he / she should inform about it to the Chairman of the Board of Directors.
Corporate Opportunity
A director should not use the Company’s property, information and his / her position for personal benefit. He /she should not establish a competing business and divert the Company’s business opportunities for personal gains.
Confidentiality
A director must always maintain confidentiality of the Company information. He / she should not make public such information which would harm the interests of the Company. He / she should consult with the Chairman of the Board or compliance officer if he / she has to disclose any information due to his / her legal obligation.
Fair Dealing
A director must deal with all the stakeholders of the Company fairly. He / she should not provide unfair advantage to any customer, supplier, banker etc. due to his / her position.
Protection and Proper Use of Company Assets
Directors should ensure that all assets of the Company must be used for the benefit of the Company. They are required to exercise the best of their abilities and judgment to put the assets of the Company to efficient use and benefit of the Company.
Reporting Any Illegal or Unethical Behavior
A director must inform the Compliance Officer or the Chairman of the Board if he / she finds any employee or any other director committing the violation of the Code and any law of the land. He should take all possible measures which could help prevent illegal or unethical behavior of fellow directors or employees.
Public Company Reporting
The directors are responsible for the timely and accurate reporting to the SECP, FBR, stock exchanges and other regulatory bodies. They should make possible that the financial statements of the Company are published and circulated among shareholders in time.
012
Disclosure of Interest
The directors should disclose their interest in the shareholding of other companies. They must inform within four days in writing to the Company Secretary if any director or his / her spouse trades in the shares of the Company.
Insider Trading
No director or his / her spouse will transact in the shares of the Company during the close period. The Company Secretary will inform about the close period that will start when the documents and financial statements are circulated among the directors. The directors should also inform the Company Secretary immediately about transactions performed by them and their spouse in the shares of the Company other than during the close period.
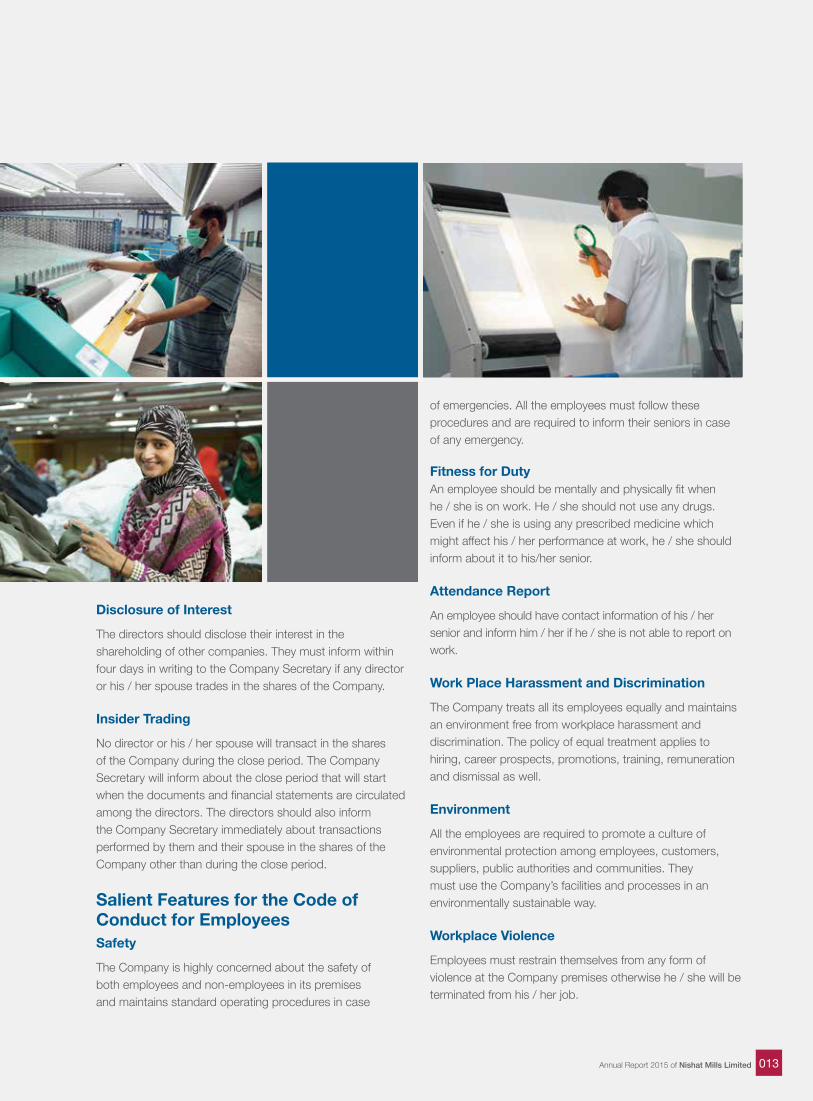
Salient Features for the Code of Conduct for EmployeesSafety
The Company is highly concerned about the safety of both employees and non-employees in its premises and maintains standard operating procedures in case
of emergencies. All the employees must follow these procedures and are required to inform their seniors in case of any emergency.
Fitness for DutyAn employee should be mentally and physically fit when he / she is on work. He / she should not use any drugs. Even if he / she is using any prescribed medicine which might affect his / her performance at work, he / she should inform about it to his/her senior.
Attendance Report
An employee should have contact information of his / her senior and inform him / her if he / she is not able to report on work.
Work Place Harassment and Discrimination
The Company treats all its employees equally and maintains an environment free from workplace harassment and discrimination. The policy of equal treatment applies to hiring, career prospects, promotions, training, remuneration and dismissal as well.
Environment
All the employees are required to promote a culture of environmental protection among employees, customers, suppliers, public authorities and communities. They must use the Company’s facilities and processes in an environmentally sustainable way.
Workplace Violence
Employees must restrain themselves from any form of violence at the Company premises otherwise he / she will be terminated from his / her job.
013Annual Report 2015 of Nishat Mills Limited
Weapons in Workplace
All the employees, other than those who are authorized, cannot carry any weapon whether on or off duty if they are using the premises, vehicle or any other property of the Company.
Protection and Proper Use of Company AssetsEmployees should ensure that all assets of the Company must be used for the benefit of the Company. They are required to exercise the best of their abilities and judgment to put the assets of the Company for efficient use and benefit of the Company.
Computer and System SecurityAll the employees of the Company are required to use the computer and information technology system of the Company according to the Company information technology policy and guidelines.
Fair DealingAll employees must deal with all the stakeholders of the Company fairly. He / she should not provide unfair advantage to any customer, supplier, banker etc. due to his / her position.
BriberyThe payment of bribery and kickbacks in any form is strictly prohibited because the Company does not allow anyone to promote its business by compromising the integrity and ethical practices.
Confidential InformationAll the employees must keep the Company information on its premises and should not make copies of documents, papers, statements and record for an unauthorized use. Employees are not permitted to share the information about Company business outside the Company unless authorized.
Regulatory Compliance and Corporate Governance
The Company maintains an environment of good governance. All the employees are required to follow the country’s policies, rules and regulations.
Financial IntegrityNo employee should indulge himself / herself in any fraudulent activity. If he / she believes and finds anyone engaged in a fraudulent activity, he / she should inform about it to his/her seniors.
Alcohol, Drugs and GamblingThe use of alcohol, drugs (other than for medication) and gambling is prohibited on the location or premises of the Company.
Insider TradingNo employee or his / her spouse will transact in the shares of the Company during the close period prior to the announcement of financial results. Employees categorized as executives according to the requirements of Code of Corporate Governance 2012 should also inform the Company Secretary immediately about transactions performed by them and their spouse in the shares of the Company other than during the close period.
014
015Annual Report 2015 of Nishat Mills Limited
Company PoliciesWhistle Blowing PolicyPurposeNishat Mills Limited is committed to high standards of ethical, moral and legal business conduct and open communication. In line with these commitments, this policy aims to provide an avenue for employees to raise their concerns and get assurance that they will be protected from reprisals or victimization for whistle blowing. This policy is also intended to address the protections available for employees if they raise concerns such as:• unlawful activity;• activities that are not in line with the Company’s policy,
including the Code of Conduct;• activities, which otherwise amount to serious improper
conduct; or• Incorrect financial reporting.
OwnershipHead of Human Resource (HR) Department shall be the owner of the policy and shall be responsible for its maintenance, update and communication to all relevant stakeholders.
SafeguardsConfidentiality - Every effort will be made to treat the complainant’s identity as strictly confidential.
Anonymous Allegations - This policy encourages employees to identify their names while raising allegations because appropriate follow-up questions and investigation may not be possible unless the source of the information is identified. Concerns expressed anonymously will be explored appropriately, but consideration will be given to:• The seriousness of the issue raised;• The credibility of the concern; and• The likelihood of confirming the allegation from
attributable sources.
Bad Faith Allegations - Allegations in bad faith may result in serious disciplinary action.
Harassment or Victimization - Harassment or victimization of reporting persons under this policy will not be tolerated.
Procedure 1: Process for Raising a Concern • The whistle blowing procedure is intended to be used
for raising serious and sensitive issues. Such concerns, including those relating to unethical or illegal conduct may be reported directly to the Head of the HR Department.
• Reports shall be factual rather than speculative, and contain as much specific information as possible to allow for proper investigation. The motivation of a whistle blower in making a report is irrelevant to the consideration of the validity of the allegations. However, the intentional filing of a false report is itself considered an improper activity that the Company has the right to act upon.
• To the extent possible, within the limitations of law and policy and the need to conduct a competent investigation, confidentiality of whistle blowers shall be maintained. Whistle blowers who choose to identify themselves are cautioned that their identity may become known for reasons outside the control of the investigators. Similarly, the identity of the subject(s) of the investigation shall be maintained in confidence with the same limitations. Employment-related concerns should continue to be reported through normal channels (such as Head of Department, Head of HR Department or to the CEO).
• The earlier a concern is expressed, the easier it is to take action.
• Although the employee is not expected to prove the truth of an allegation, the employee should be able to demonstrate to the person contacted that the report is being made in good faith.
Procedure 2: How the Report of Concern will be Handled• Upon receipt of a concern or complaint, the Head of
the HR Department shall:• determine the nature of the concern or complaint • acknowledge receipt of the concern or complaint to
the submitter within ten (10) working days, when such complaint has been lodged on a confidential basis and
• act accordingly, that is,a) if the concern or complaint pertains to
accounting matters, shall refer the matter to Audit Committee; and
016
b) all other concerns or complaints shall be referred to the Disciplinary Committee comprising of the following:i) Chief Financial Officerii) Head of HR Departmentiii) Company Secretary
• Initial inquiries shall be made to determine whether an investigation is appropriate. Some concerns may be resolved by agreed action without the need for investigation.
• If the complaint relates to the accounting matters, the Audit Committee may delegate its power to investigate the matter to any employee(s) of Nishat Mills Limited having the requisite knowledge and experience of accounting and financial matters.
• The amount of contact between the complainant and the team conducting the investigation shall depend on the nature of the issue and the clarity of information provided. Further information may be sought from the complainant.
• In conducting any investigation, the Audit Committee / Disciplinary Committee shall use reasonable efforts to protect the confidentiality or anonymity of the complainant, consistent with the need to conduct an adequate review.
• Prompt and appropriate corrective action shall be taken as warranted in the judgment of the Audit Committee / Disciplinary Committee.
• Where it is possible and determined appropriate by the Audit Committee / Disciplinary Committee, notice of any corrective action taken will be reported back to the person who submitted the concern or complaint, if email or other address is provided by the complainant.
• Subject to legal constraints, the complainant may also receive information regarding the outcome of the investigation.
Procedure 3: Reporting and Retention of Complaints and Investigation• The Head of the HR Department shall maintain a log
of all reported concerns or complaints, tracking their receipt, their investigation and resolution and shall prepare a periodic summary report thereof for review of the Board of Directors, if required by them.
• The Head of HR Department shall retain, as part of its records, any such complaints or concerns in the personal file of the employee raising the concern.
No such incidence was reported to the Audit Committee under whistle blowing policy during the year ended 30 June 2015.I
017Annual Report 2015 of Nishat Mills Limited

Human ResourceManagement Policy
Recruitment and SelectionWe at Nishat Mills Limited believe in hiring and retaining capable, qualified and potentially useful employees who are willing to contribute their best to accomplish the objectives of the Company. Appointments of jobs in the permanent cadre are made by promotions or through direct recruitment by the concerned appointing authority through the HR department.
Development and TrainingEmployees’ development and capability building across functions and levels remained a key focus area to build a strong talent pipeline. The Company is committed to invest in enhancing its human capital through building technical skills and competencies of its employees. With the use of performance management processes, the Company aims to ensure that all employees know what is expected of them and possess the necessary skills, knowledge, values and experience to achieve the highest level of performance to their true potential.
Reward and MotivationIt is our policy to reward the employees with fair and competitive salaries and perks along with an opportunity to share in the success of the business in terms of promotions and personal growth. All the elements of the reward system are designed to support the achievement of the
desired behaviour, values and standards as well as high performance and continuous improvement / development.
Equality, Diversity and Dignity at WorkOur employment policies are based on the principles of equality and diversity. We believe that the elimination of unfair discrimination in the workplace contributes to productivity and performance as it allows employees’ talents to be most effectively realized. We are committed to dignity at work and fair treatment of all colleagues. The Head of Human Resource Department is accountable for ensuring that these principles are followed and for establishing appropriate action plans for their business.
Succession PlanA succession plan is a component of good HR planning and management. Succession planning acknowledges that the staff will not be with an organization indefinitely and it provides a plan and process for addressing the changes that will occur when they leave. Keeping in view the need and importance of succession planning, the Company has formulated a comprehensive succession plan by focusing on all the key positions within the Company. The key positions can be defined as those positions that are crucial for the operations of the organization and which are hard to be replaced because of skill, seniority and / or experience requirements.
The management of Nishat Mills Limited (“the Company”) believes that employees are assets of the Company and have been instrumental in driving the Company’s performance year on year. Their passion, commitment, sense of ownership and team work has enabled the Company to maintain its leadership position in the challenging market scenario. The Company has always striven to offer a positive, supportive, open and high performance work culture where innovation and risk taking is encouraged, performance is recognized and employees are motivated to realize their true potential.
018
This policy defines the commitments that Nishat Mills Limited has taken in its activities promoting respect for people, safety, protection of the environment, ethics and participation in the economic and social development of the places where it operates. The main domains of the Social and Environmental Responsibility Policy are as follows:
Social and EnvironmentalResponsibility Policy
Preserving Life and the EnvironmentThe Company has defined a Health, Safety and Environmental Responsibility Policy that aims at continuous improvement in the approach of management and employees towards environmental sustainability and corporate social responsibility
As for the environment, the focus of the Company is on preserving natural resources and constantly improving their sustainability especially in energy and water consumption, emission control and waste management.
The Company’s objectives are to reduce its environmental impact on natural resources. The Company also realizes the environmental impact of its employees’ daily activities and educates them about environmental sustainability. Constant improvement of our performances in terms of safety and the environment is, in particular, controlled through reporting of key indicators, implemented by each business division.
Ethical behavior in activitiesThe Social and Environmental Responsibility Policy’s ethical dimension covers the values of integrity, transparency and compliance with regulations. This is particularly important in relation to the main stakeholders i.e. employees, customers, suppliers, shareholders, public authorities and local communities. The Company has implemented an Employee Code of Conduct that fits it with local customs and regulations
to help its personnel perform their activities while respecting their ethical values. An employee who needs further help with any of the topics presented in the Code of Conduct should first contact his / her manager who will provide him / her a guideline. Additionally, the employee may also request the assistance of the Human Resource Department.
The Heads of the HR departments of all business divisions provide recommendations and assistance in applying the Company’s Employee Codes of Conduct. They also deal with all the queries submitted by the employees with appropriate confidentiality.
Social InvolvementThe Company’s men and women make up multicultural teams with diverse competencies. All business divisions of the Company promote diversity, facilitate and accelerate knowledge transfer, motivate and involve their employees and encourage their social and human commitment. In particular, the managers of the Company and human resource professionals must, as a priority, focus on respecting the Human Resource Policy.
The Company is committed to encourage and respect social dialogue. It respects human rights and enforces respect for the dignity of their employees, subcontractors, temporary personnel and suppliers. In compliance with this commitment, the Company notably excludes any form of discrimination, harassment, the use of forced labor and child labor.
019Annual Report 2015 of Nishat Mills Limited
Investors’ service is an important imperative for sustained business growth of an organization, therefore, the organization should ensure that investors receive exemplary service across different touch points of the organization. Nishat Mills Limited has developed an effective investor grievance policy to actively address and resolve the issues being faced by the investors and to fulfill the legal requirements. The Chief Financial Officer and Company Secretary of the Company are responsible for implementing the policy. The policy follows the following principles:
Investor Grievance Policy
• Investors are treated fairly at all times;• Complaints raised by investors are dealt with courtesy
and in a timely manner;• Investors are informed of avenues to raise their
complaints within the Company, and their rights if they are not satisfied with the resolution of their complaints;
• Complaints are treated efficiently and fairly;• The Company’s employees work in good faith and
without prejudice, towards the interests of the Investors.
Stakeholders’ EngagementThe need for organizations to behave in a socially responsible manner is becoming a generalized requirement of society which has been further highlighted after the release of ISO 26000 by International Organization for Standardization. At Nishat Mills, we take special steps to ensure that the Stakeholders are engaged by the Company from time to time so that their interests with the Company are duly respected.
To ensure that an effective Stakeholder Engagement Policy is in place, Nishat Mills Limited has established the following methods to fully involve the stakeholders in both the current and developing issues being faced by the Company:• Inform• Consult• Involve• Collaborate
The following stakeholders are being engaged by the Company regularly to add value to the Company and relationship of the Company with the respective stakeholders:
a) Institutional Investors and Banks (other lenders)
We meet with investors regularly through events, conference calls and one-to-one meetings to understand their concerns about sustainability risks and help us identify potential future issues. Formally we interact with the investors at the release of financial statements and as requested by the investors. Through such constant contacts, we are able to align our goals with our principal investors and Banks (other lenders).
b) Customers
We communicate with customers in many ways as part of our normal business, for example through our dynamic marketing team and customer research. Such engagements take place from time to time as required by the company and customers. Such engagements are used to obtain information regarding our perception and reputation in both local and global market.
c) Suppliers
We work closely with suppliers to ensure that they maintain high standards as required by the Company by conducting formal assessments. The Procurement Department is constantly in contact with all our major and potential suppliers. We are able to both understand the concerns of suppliers and communicate our concerns as well.
d) Government and regulators
The Company looks forward to achieve regular dialogue with the relevant regulatory and Government authorities, which includes both responding to inquiries on need basis (daily, weekly and quarterly) and meetings with representative of Government bodies. Through such engagement, we are able to spot emerging developments in policies and ensure compliance with legal and regulatory requirements. Furthermore, we are able to provide input into the legislative development process that will affect our activities and operations.
e) Employees
The Company engages with its employees through regular communication that takes place with managers and team through a range of interactive channels and specific strategy sessions. Such sessions are an ongoing process. Through such sessions, we work towards ensuring that we remain an employer of choice by providing a safe and professional environment, understanding and responding to the needs of the employees and providing the staff information about the general direction of the Company.
020
IT Governance Policy
Safety of Records Policy
Information Technology (IT) Governance is an integral part of enterprise governance and consists of the leadership and organizational structures and processes that ensure the sustenance and extension of the Company’s strategies and objectives.
IT Governance provides a structured decision making process around IT investment decisions and promotes accountability, due diligence, and efficient and economic delivery of IT services to the users in the Company. Head of MIS Department enables and supports the corporate objectives of the Company by playing a crucial role in IT governance by aligning decisions of IT investments with the Company’s mission.
Head of MIS Department’s supportive role in IT governance at the Company includes but is not limited to the following:• To develop effective and appropriate IT governance
framework for investments in IT infrastructures;• To support the strategic planning and administration of IT
infrastructure and resources;• To develop and assess IT capital planning and investment
control activities;• To develop IT management tools and training
methodologies;• To conduct special projects and initiatives to promote new
concepts and techniques relating to IT.
Nishat Mills Limited pursues an effective policy for the safety of its records to affirm its commitment to ensure that authentic, reliable and usable records are created, captured and managed to meet the standard of best practices and to meet the Company’s business and statutory requirements. The policy ensures that:
• A full and accurate record of the transactions of the Company is created, captured and maintained physically and in systems along with proper backup;
• Records are to be maintained in conditions suitable for the length of time to cater for the Company’s needs and statutory requirements;
• Records and archives will be available within the constraints of security, confidentiality, privacy and archival access conditions;
• Records are destroyed or disposed of in accordance with the disposal policies, procedures and guidelines of the Company;
• Ownership of the records and archives is with the Company and not with an individual or any team.
021Annual Report 2015 of Nishat Mills Limited
Roles and responsibilities of theChairman of the Company
Annual Evaluation ofBoard’s PerformanceThe annual evaluation devised for Board’s own performance is based on the emerging and leading trends on the functioning of the Board and is in accordance with the requirements of the Code of Corporate Governance 2012. The primary purpose of this evaluation is to evaluate the performance of the Board and its committees in order to facilitate and enable the Board members to play an effective role as a coordinated team for the ongoing success of Nishat Mills Limited.
The Board developed and approved the criteria for evaluation in their meeting held on April 25, 2014. The Board decided that the performance evaluation will be carried out annually. The Chairman of the Board will request each Board member to fill and submit a Performance Evaluation Questionnaire (PEQ) in the Board meeting held in April each year.
The Board members will discuss the outcome of the evaluation against the benchmarks and decide changes
which are required to be made by the Board to address any lack of performance. The Board will also agree upon the revised Key Performance Indicators (KPIs) for the Board for the next year. The KPIs of the Board and its Committees will always be set keeping in view the framework of vision and mission statements and overall strategy of the Company. Annual evaluation of Board’s performance was carried out in the BOD meeting held on 24 April 2015.
CEO’s Performance ReviewPerformance review of Chief Executive Officer (CEO) was carried out in the Board of Directors meeting held on 27 October 2015. The Board appreciated the CEO for sustained financial results of the Company despite appreciation of Pak Rupee against US Dollar, low demand for textile products in international markets, bearish trend in prices and rise in input costs. CEO and his team was admired for efficient cost management during the financial year 2014-15 when revenues fell due to adverse economic condition. The Board also expressed its satisfaction over the effective implementation of investment policy of the Company.
The Chairman of the Board of Directors is responsible for leadership of the Board of Directors. In particular, he / she will be responsible for the following:
a) to ensure that all Board committees are properly established, composed and operated.
b) to ensure the effective operation of the Board and its committees in conformity with the highest standards of corporate governance.
c) to promote effective relationships and communications between non-executive directors and executive directors.
d) to preside over all meetings of the Board of Directors and General Meetings of the Company, if present.
e) to exercise a second or casting vote in case of
equality of votes of the Board of Directors.f) to declare the result of show of hands at General
Meetings and the declaration on a show of hands shall be evidence of the fact, without proof, of the number or proportion of the votes cast in favor of or against such resolution.
g) to endorse minutes of meetings of the Board of Directors and General Meetings of the Company with his/her signatures.
h) to ensure that minutes of meetings of the Board of Directors and General Meetings of the Company
022
Roles and responsibilities of theChief Executive Officer (CEO) of the CompanyThe CEO is responsible for leadership of the business and managing it within the authorities delegated by the Board of Directors. The CEO shall be responsible for the following:
Annual General Meeting of the Company was held on 31 October 2014. All the following agenda items of the meeting were approved without any specific issues raised by the members:
1. To develop strategy proposals for recommendation to the Board and ensure that agreed strategies are reflected in the business of the Company.
2. To ensure the development of annual business plans, consistent with agreed strategies, for presentation to the Board for approval.
3. To ensure that the Company has the capabilities and adequate professional human resources required to achieve its business plans and targets.
4. To ensure the development of organizational structure, processes and systems for the efficient utilization of the Company’s resources.
5. To be responsible to the Board for the performance of the Company business.
6. To ensure that financial results, business strategies and where appropriate, targets and milestones are communicated to the shareholders.
7. To develop and promote effective communication with shareholders and other relevant constituencies.
8. To ensure that the business performance is consistent with the Business Principles.
9. To ensure that robust management succession and management development plans are in place and are presented to the Board from time to time.
10. To ensure that capital investment proposals are reviewed thoroughly, that associated risks are identified and appropriate steps taken to mitigate the associated risks.
11. To ensure the development and maintenance of an effective framework of internal controls in the Company’s manufacturing and sales activities.
12. To ensure that the flow of information to the Board is accurate, timely and clear.
13. To establish a close relationship of trust with the Chairman.
are appropriately recorded.i) to ensure that all Board members, when taking
up office, are fully briefed on the terms of their appointment and know their duties and responsibilities.
j) to ensure that the Board meets at regular intervals throughout the year.
k) to keep under review the contributions made by Board members to the Company’s work.
l) to review from time to time the activities and effectiveness of the Board.
m) to have a particular responsibility for providing effective strategic leadership on matters such as:
• Formulating the Board’s business strategy. • Encouraging high standards of propriety, and
promoting efficient and effective use of staff and other resources throughout the organization.
Issues raised in the last AGM1. Audited consolidated and unconsolidated financial
statements for the year ended 30 June 2014 together with the Directors’ and Auditors’ report thereon.
2. Final cash dividend @ 40% (i.e. Rs. 4.00/- only per share) for the year ended 30 June 2014.
3. Appointment of Riaz Ahmad & Co as statutory auditors for the year ended 30 June 2015 and fixation of their remuneration.
4. Equity investment up to Rs. 4.875 billion in Nishat Energy Limited, an associated company.
5. Issuance of guarantees up to Rs. 1 Billion from the Bank and financial institutions of the Company to the lenders of Nishat Energy Limited.
023Annual Report 2015 of Nishat Mills Limited
Quarter Quarter Quarter Quarter01 02 03 04
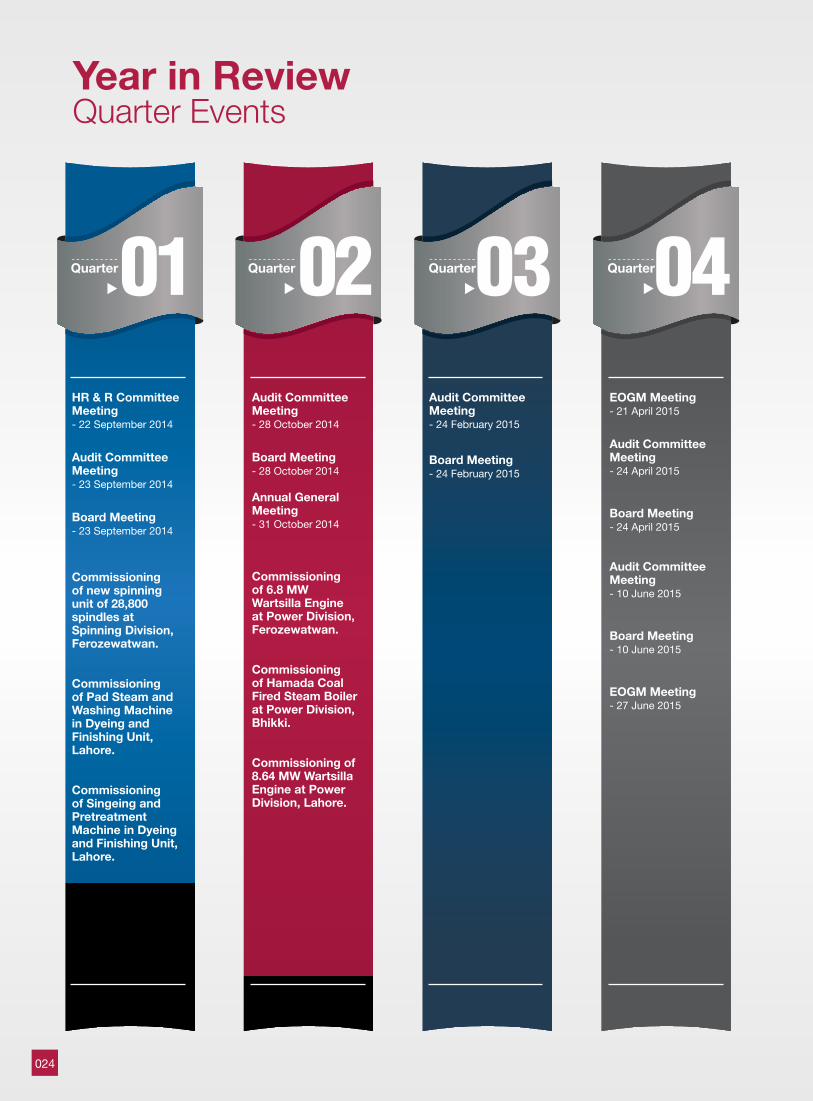
Year in ReviewQuarter Events
HR & R Committee Meeting- 22 September 2014
Audit Committee Meeting- 23 September 2014
Board Meeting- 23 September 2014
Commissioning of new spinning unit of 28,800 spindles at Spinning Division, Ferozewatwan.
Commissioning of Pad Steam and Washing Machine in Dyeing and Finishing Unit, Lahore.
Commissioning of Singeing and Pretreatment Machine in Dyeing and Finishing Unit, Lahore.
Audit Committee Meeting- 28 October 2014
Board Meeting- 28 October 2014
Annual General Meeting- 31 October 2014
Commissioning of 6.8 MW Wartsilla Engine at Power Division, Ferozewatwan.
Commissioning of Hamada Coal Fired Steam Boiler at Power Division, Bhikki.
Commissioning of 8.64 MW Wartsilla Engine at Power Division, Lahore.
Audit Committee Meeting- 24 February 2015
Board Meeting- 24 February 2015
EOGM Meeting- 21 April 2015
Audit Committee Meeting- 24 April 2015
Board Meeting- 24 April 2015
Audit Committee Meeting- 10 June 2015
Board Meeting- 10 June 2015
EOGM Meeting- 27 June 2015
024

Board Committees
025Annual Report 2015 of Nishat Mills Limited
Members
1 Mr. Khalid Qadeer Qureshi Chairman2 Syed Zahid Hussain Member3 Ms. Nabiha Shahnawaz Cheema Member
During the year under review, five meetings of the Audit Committee of the Company were held and the attendance position is as follows:
Sr. No. Name of Members No. of Meetings Attended
1 Mr. Khalid Qadeer Qureshi 52 Syed Zahid Hussain 53 Ms Nabiha Shahnawaz Cheema 1
Terms of Reference
The terms of reference of the Audit Committee shall include the following:a) recommending to the Board of Directors the
appointment of external auditors, their remuneration and audit fees;
b) determination of appropriate measures to safeguard the Company’s assets;
c) review of quarterly, half-yearly and annual financial statements of the Company, prior to their approval by the Board of Directors, focusing on:• major judgmental areas;• significant adjustments resulting from the audit;• the going concern assumption;• any changes in accounting policies and practices;• compliance with applicable accounting standards;• compliance with listing regulations and other
statutory and regulatory requirements; and• significant related party transactions.
d) review of preliminary announcements of results prior to publication;
e) facilitating the external audit and discussion with external auditors of major observations arising from interim and final audits and any matter that the auditors may wish to highlight (in the absence of management, where necessary);
f) review of management letter issued by external auditors and management’s response thereto;
g) ensuring coordination between the internal and external auditors of the Company;
h) review of the scope and extent of internal audit and ensuring that the internal audit function has adequate resources and is appropriately placed within the Company;
i) consideration of major findings of internal investigations of activities characterized by fraud, corruption and abuse of power; and management’s response thereto;
j) ascertaining that the internal control systems including financial and operational controls, accounting systems for timely and appropriate recording of purchases and sales, receipts and payments, assets and liabilities and the reporting structure are adequate and effective;
k) review of the Company’s statement on internal control systems prior to endorsement by the Board of Directors and internal audit reports;
l) instituting special projects, value for money studies or other investigations on any matter specified by the Board of Directors, in consultation with the CEO and to consider remittance of any matter to the external auditors or to any other external body;
m) determination of compliance with relevant statutory requirements;
n) monitoring compliance with the best practices of corporate governance and identification of significant violations thereof; and
o) consideration of any other issue or matter as may be assigned by the Board of Directors.
Board Committees
Audit Committee
026
Members
1 Mian Hassan Mansha Chairman2 Mian Umer Mansha Member3 Mr. Khalid Qadeer Qureshi Member4 Ms Nabiha Shahnawaz Cheema Member
During the year under review, one meeting of the HR & R Committee of the Company was held and the attendance position is as follows:
Sr. No. Name of Members No. of Meetings Attended
1 Mian Hassan Mansha 12 Mian Umer Mansha 13 Mr. Khalid Qadeer Qureshi 14 Ms Nabiha Shahnawaz Cheema 1
Terms of Reference
The terms of reference of the HR & R Committee shall include the following:• recommending human resource management policies
to the Board:• recommending to the Board the selection, evaluation,
compensation (including retirement benefits) and succession planning of the Chief Executive Officer, Chief Operating Officer, Chief Financial Officer, Company Secretary and Head of Internal Audit:
• consideration and approval on recommendation of CEO on selection, evaluation, compensation (including retirement benefits) and succession planning of key management positions who directly report to CEO or COO.
Human Resource & Remuneration (HR & R) Committee
027Annual Report 2015 of Nishat Mills Limited
Report of Audit CommitteeReport of Audit Committee
The Audit Committee of Nishat Mills Limited (“the Company”) is pleased to present its report for the year ended 30 June 2015. The Committee activity performed its functions according to the requirements of the Code of Corporate Governance, 2012 and Term of Reference approved by the Board of Directors. The Committee held five (5) meetings during the year on the following agenda items:
1. Reviewed periodic separate and consolidated financial statements of the Company and recommended to the Board of Directors for approval.
2. Reviewed and recommended to the Board for approval of related party transactions.
3. Reviewed “Statement of Compliance with Code of Corporate Governance” which was also reviewed and certified by the external auditors.
4. Reviewed the compliance with code of conduct and company policies by the Board, the management and employees of the Company.
5. Reviewed the appointment of External Auditors and fixed their fee and recommended to the Board the reappointment of M/S Riaz Ahmed & Co. as external auditors for the year ending 30 June 2016.
6. Reviewed and discussed the Management Letter issued by the external auditors and the management response thereto. The committee discussed the observations with external auditors and recorded required actions.
7. Reviewed and further ensured the coordination between external and internal auditors.
8. Reviewed the matters highlighted in internal audit reports and took appropriate measures wherever necessary.
9. Reviewed and recommended to the Board for approval of the Scheme Of Compromises, Arrangements and Reconstruction under sections 284 to 288 of the Companies Ordinance, 1984 between Nishat Spinning (Private) Limited and its Members and Nishat Linen (Private) Limited and its Members and Nishat Mills Limited and its Members.
10. Reviewed and recommended to the Board for approval the equity investment of Rs. 136.205 million in Nishat (Chunian) Limited through subscription of right shares for the approval of the Board.
11. Reviewed and recommended to the Board for approval the setting up of a new wholly owned subsidiary under the proposed name and style of Nishat Commodities (Private) Limited and also recommended investment up to Rs. 7 million by way of an equity investment and up to Rs. 2 billion in the form of loan and advances in the proposed wholly owned subsidiary on the terms and conditions to be determined by the Board of Directors.
12. Reviewed and recommended to the Board for approval the issuance of bank guarantees up to Rs. 1 billion from the Banks and Financial Institutions of Nishat Mills Limited to the lenders of Nishat Commodities (Private) Limited, on the terms and conditions to be determined by the Board of Directors and also recommended to the Board for approval the issuance of corporate guarantees up to Rs. 1 billion to the lenders of Nishat Commodities (Private) Limited, on the terms and conditions to be determined by the Board of Directors.
13. Reviewed and recommended further investment up to Rs. 2 billion as loan and advances in Nishat Linen (Private) Limited for the approval of the Board.
14. Reviewed and recommended to the Board for approval the business agreement to be executed between Nishat Mills Limited and Nishat Linen (Private) Limited for transfer of freehold land from Nishat Mills Limited to Nishat Linen (Private) Limited with all permissions of leave and license to operate a textile unit.
028
Internal Audit FunctionThe Head of Internal Audit has direct access to the Audit Committee. The Committee has ensured the placement of competent and professional staff in Internal Audit function, and that the function is equipped with the necessary resources and authority to perform their duties independently and objectively. The Committee has ensured that the Internal Audit function has fulfilled its responsibilities according to the framework defined by the Audit Committee. The Committee has reviewed findings of Internal Audit Department, suggested appropriate remedies and brought the matter to the attention of the Board if necessary.
Internal Control SystemInternal Control System has been developed keeping in view the requirements and size of the Company and its effectiveness and adequacy is regularly evaluated. The management of the Company is responsible for establishing and maintaining a system of adequate internal controls and procedures for implementing strategy and policies, as approved by the Board of Directors.
Internal Audit function reviews and assesses the effectiveness and adequacy of internal control system and submits its findings to the Audit Committee. During the financial year 2014-15, the Committee on the basis of the internal audit reports reviewed the adequacy of controls and ensured identified risks were mitigated and corrective actions were taken by the management.
Khalid Qadeer QureshiChairman Audit Committee
27 October 2015Lahore
029Annual Report 2015 of Nishat Mills Limited
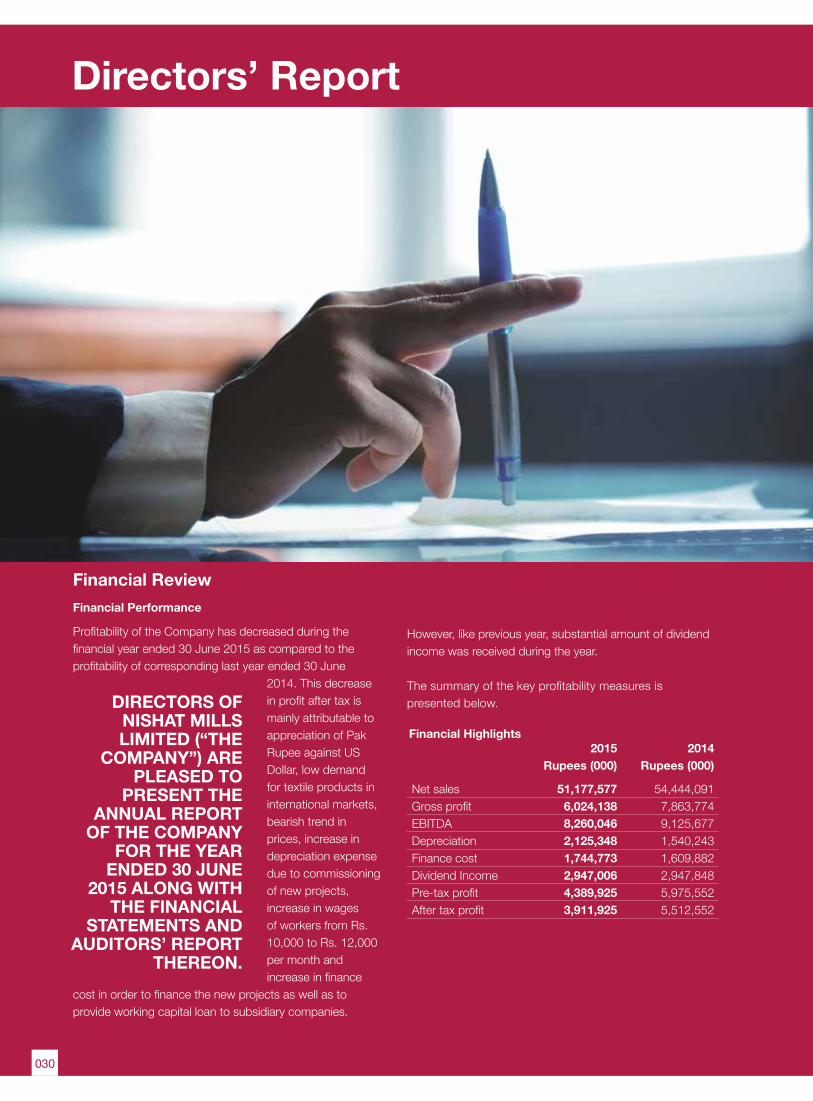
2015 2014 Rupees (000) Rupees (000)
Net sales 51,177,577 54,444,091Gross profit 6,024,138 7,863,774EBITDA 8,260,046 9,125,677Depreciation 2,125,348 1,540,243Finance cost 1,744,773 1,609,882Dividend Income 2,947,006 2,947,848Pre-tax profit 4,389,925 5,975,552After tax profit 3,911,925 5,512,552
Financial Highlights
Directors’ Report
Financial ReviewFinancial Performance
Profitability of the Company has decreased during the financial year ended 30 June 2015 as compared to the profitability of corresponding last year ended 30 June
2014. This decrease in profit after tax is mainly attributable to appreciation of Pak Rupee against US Dollar, low demand for textile products in international markets, bearish trend in prices, increase in depreciation expense due to commissioning of new projects, increase in wages of workers from Rs. 10,000 to Rs. 12,000 per month and increase in finance
cost in order to finance the new projects as well as to provide working capital loan to subsidiary companies.
DIRECTORS OF NISHAT MILLS LIMITED (“THE
COMPANY”) ARE PLEASED TO
PRESENT THE ANNUAL REPORT
OF THE COMPANY FOR THE YEAR
ENDED 30 JUNE 2015 ALONG WITH
THE FINANCIAL STATEMENTS AND
AUDITORS’ REPORT THEREON.
However, like previous year, substantial amount of dividend income was received during the year. The summary of the key profitability measures is presented below.
030
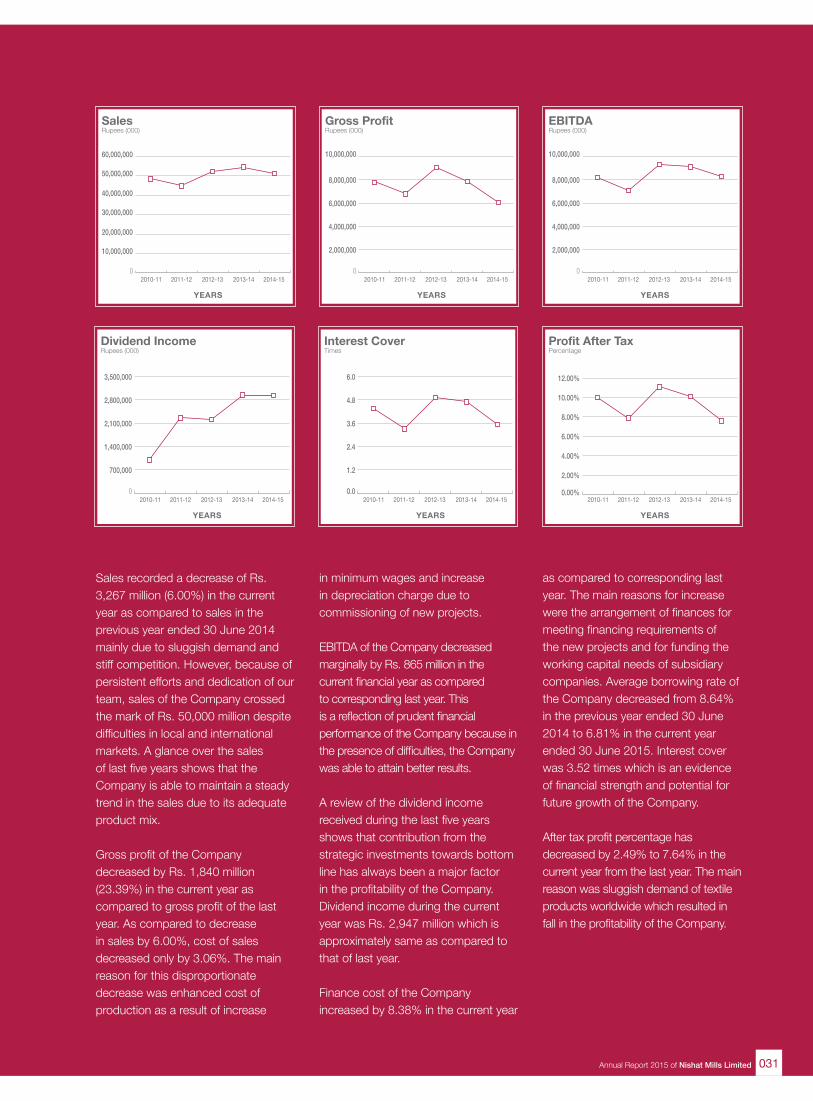
Sales recorded a decrease of Rs. 3,267 million (6.00%) in the current year as compared to sales in the previous year ended 30 June 2014 mainly due to sluggish demand and stiff competition. However, because of persistent efforts and dedication of our team, sales of the Company crossed the mark of Rs. 50,000 million despite difficulties in local and international markets. A glance over the sales of last five years shows that the Company is able to maintain a steady trend in the sales due to its adequate product mix. Gross profit of the Company decreased by Rs. 1,840 million (23.39%) in the current year as compared to gross profit of the last year. As compared to decrease in sales by 6.00%, cost of sales decreased only by 3.06%. The main reason for this disproportionate decrease was enhanced cost of production as a result of increase
in minimum wages and increase in depreciation charge due to commissioning of new projects.
EBITDA of the Company decreased marginally by Rs. 865 million in the current financial year as compared to corresponding last year. This is a reflection of prudent financial performance of the Company because in the presence of difficulties, the Company was able to attain better results.
A review of the dividend income received during the last five years shows that contribution from the strategic investments towards bottom line has always been a major factor in the profitability of the Company. Dividend income during the current year was Rs. 2,947 million which is approximately same as compared to that of last year. Finance cost of the Company increased by 8.38% in the current year
as compared to corresponding last year. The main reasons for increase were the arrangement of finances for meeting financing requirements of the new projects and for funding the working capital needs of subsidiary companies. Average borrowing rate of the Company decreased from 8.64% in the previous year ended 30 June 2014 to 6.81% in the current year ended 30 June 2015. Interest cover was 3.52 times which is an evidence of financial strength and potential for future growth of the Company.
After tax profit percentage has decreased by 2.49% to 7.64% in the current year from the last year. The main reason was sluggish demand of textile products worldwide which resulted in fall in the profitability of the Company.
SalesRupees (000)
2010-11 2011-12 2012-13 2013-14 2014-15
YEARS
0
10,000,000
20,000,000
30,000,000
40,000,000
50,000,000
60,000,000
Interest CoverTimes
YEARS
0.0
1.2
2.4
3.6
4.8
6.0
2010-11 2011-12 2012-13 2013-14 2014-15
Gross ProfitRupees (000)
YEARS
0
2,000,000
4,000,000
6,000,000
8,000,000
10,000,000
2010-11 2011-12 2012-13 2013-14 2014-15
Profit After TaxPercentage
YEARS
0.00%
2.00%
4.00%
6.00%
8.00%
10.00%
12.00%
2010-11 2011-12 2012-13 2013-14 2014-15
EBITDARupees (000)
YEARS
0
2,000,000
4,000,000
6,000,000
8,000,000
10,000,000
2010-11 2011-12 2012-13 2013-14 2014-15
Dividend IncomeRupees (000)
YEARS
0
700,000
1,400,000
2,100,000
2,800,000
3,500,000
2010-11 2011-12 2012-13 2013-14 2014-15
031Annual Report 2015 of Nishat Mills Limited
Fixed Capital Expenditure
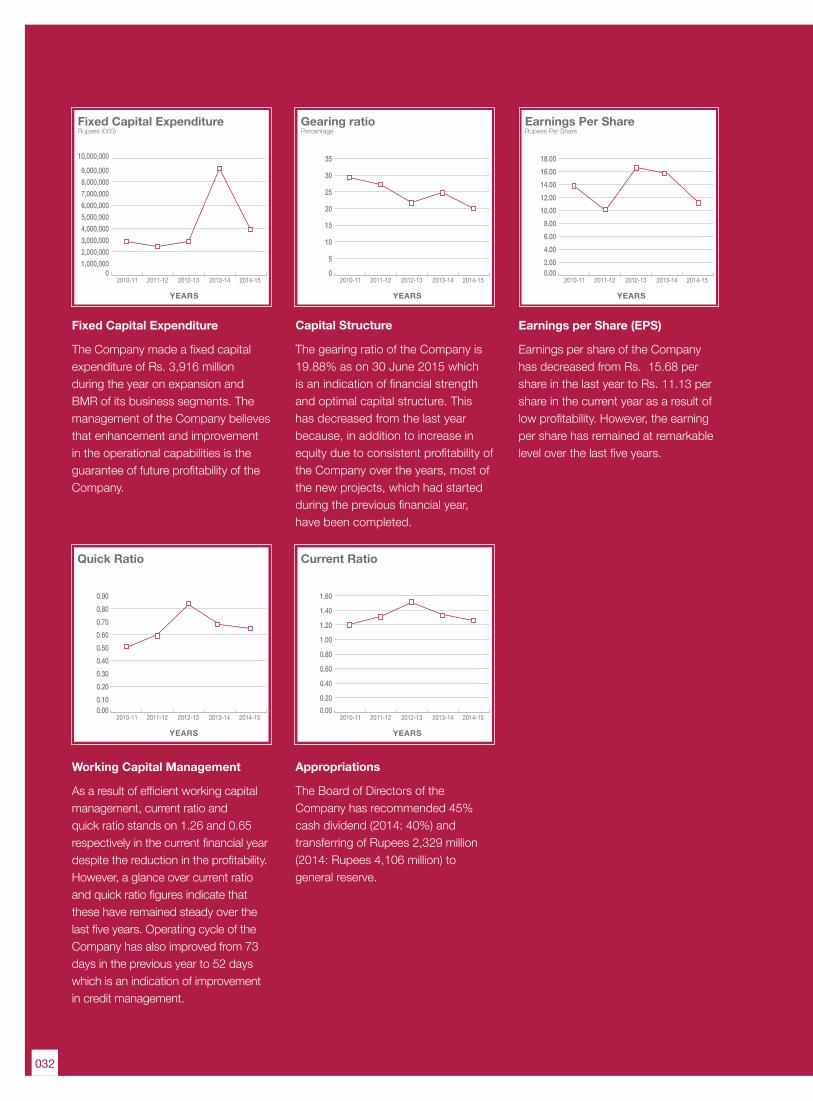
The Company made a fixed capital expenditure of Rs. 3,916 million during the year on expansion and BMR of its business segments. The management of the Company believes that enhancement and improvement in the operational capabilities is the guarantee of future profitability of the Company.
Working Capital Management
As a result of efficient working capital management, current ratio and quick ratio stands on 1.26 and 0.65 respectively in the current financial year despite the reduction in the profitability. However, a glance over current ratio and quick ratio figures indicate that these have remained steady over the last five years. Operating cycle of the Company has also improved from 73 days in the previous year to 52 days which is an indication of improvement in credit management.
Capital Structure
The gearing ratio of the Company is 19.88% as on 30 June 2015 which is an indication of financial strength and optimal capital structure. This has decreased from the last year because, in addition to increase in equity due to consistent profitability of the Company over the years, most of the new projects, which had started during the previous financial year, have been completed.
Appropriations
The Board of Directors of the Company has recommended 45% cash dividend (2014: 40%) and transferring of Rupees 2,329 million (2014: Rupees 4,106 million) to general reserve.
Fixed Capital ExpenditureRupees (000)
YEARS
01,000,0002,000,0003,000,0004,000,0005,000,0006,000,0007,000,0008,000,0009,000,000
10,000,000
2010-11 2011-12 2012-13 2013-14 2014-15
Current Ratio
YEARS
0.000.20
0.40
0.60
0.80
1.00
1.20
1.40
1.60
2010-11 2011-12 2012-13 2013-14 2014-15
Quick Ratio
YEARS
0.000.100.200.300.400.500.600.700.800.90
2010-11 2011-12 2012-13 2013-14 2014-15
Gearing ratioPercentage
2010-11 2011-12 2012-13 2013-14 2014-15
YEARS
0
5
10
15
20
25
30
35
Earnings Per ShareRupees Per Share
YEARS
0.002.004.006.008.00
10.0012.0014.0016.0018.00
2010-11 2011-12 2012-13 2013-14 2014-15
Earnings per Share (EPS)
Earnings per share of the Company has decreased from Rs. 15.68 per share in the last year to Rs. 11.13 per share in the current year as a result of low profitability. However, the earning per share has remained at remarkable level over the last five years.
032
0
5,000
10,000
15,000
20,000
25,000
30,000
35,000
40,000
2010-11 2011-12 2012-13 2013-14 2014-15YEARS
Yarn Sales QuantityKgs (000)
0
3,000,000
6,000,000
9,000,000
12,000,000
15,000,000
2010-11 2011-12 2012-13 2013-14 2014-15YEARS
Yarn Sales ValueRupees (000)
0
50
100
150
200
250
300
350
400
2010-11 2011-12 2012-13 2013-14 2014-15YEARS
Yarn Sales RateRupees per kg
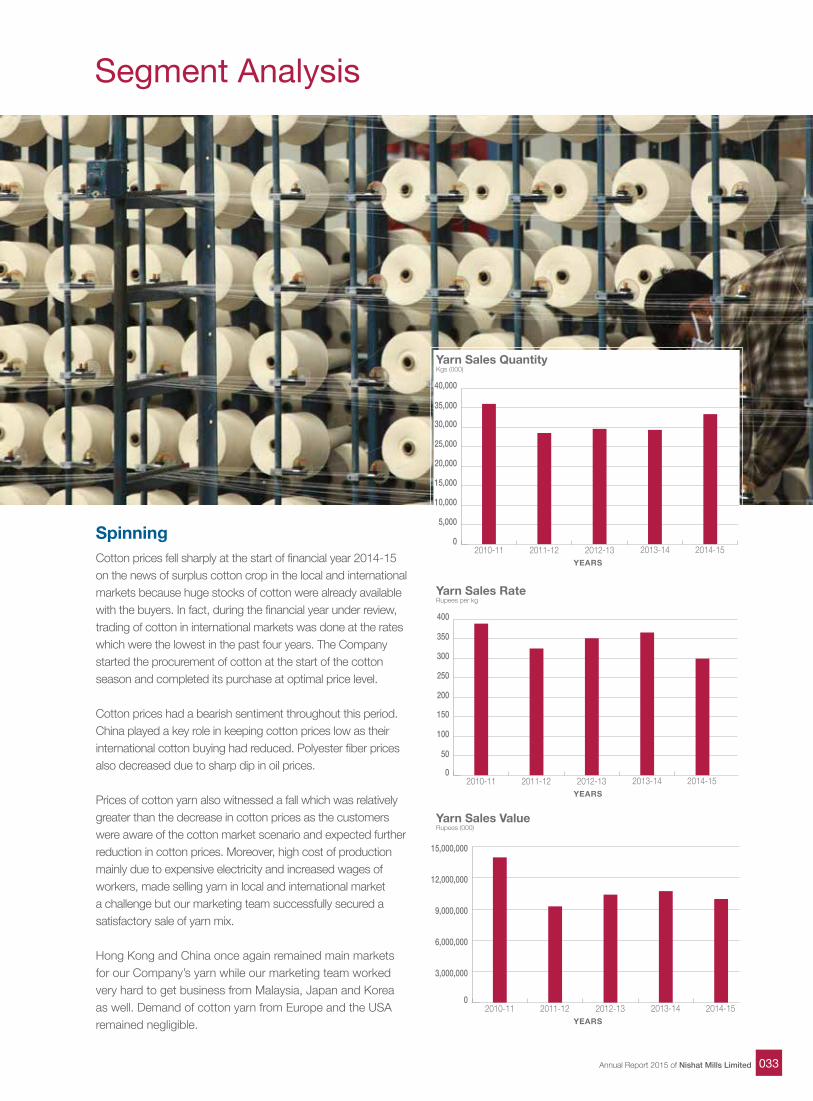
SpinningCotton prices fell sharply at the start of financial year 2014-15 on the news of surplus cotton crop in the local and international markets because huge stocks of cotton were already available with the buyers. In fact, during the financial year under review, trading of cotton in international markets was done at the rates which were the lowest in the past four years. The Company started the procurement of cotton at the start of the cotton season and completed its purchase at optimal price level.
Cotton prices had a bearish sentiment throughout this period. China played a key role in keeping cotton prices low as their international cotton buying had reduced. Polyester fiber prices also decreased due to sharp dip in oil prices.
Prices of cotton yarn also witnessed a fall which was relatively greater than the decrease in cotton prices as the customers were aware of the cotton market scenario and expected further reduction in cotton prices. Moreover, high cost of production mainly due to expensive electricity and increased wages of workers, made selling yarn in local and international market a challenge but our marketing team successfully secured a satisfactory sale of yarn mix.
Hong Kong and China once again remained main markets for our Company’s yarn while our marketing team worked very hard to get business from Malaysia, Japan and Korea as well. Demand of cotton yarn from Europe and the USA remained negligible.
Segment Analysis
033Annual Report 2015 of Nishat Mills Limited
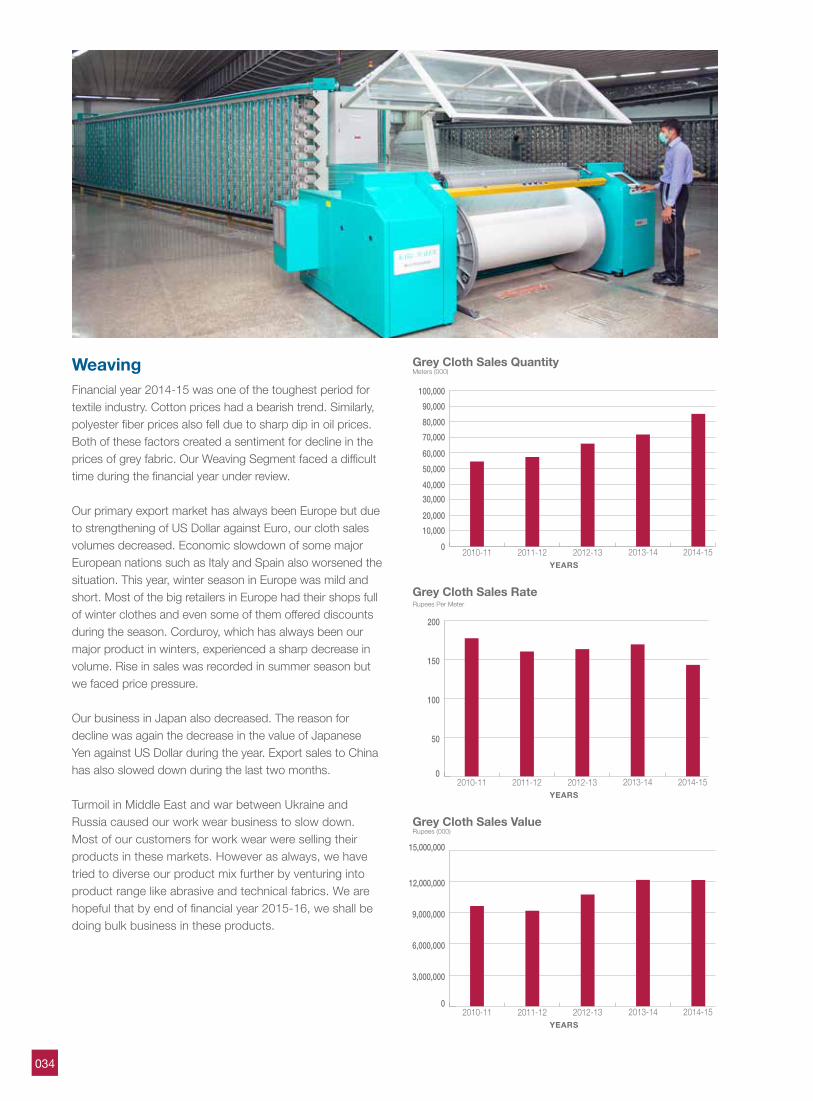
WeavingFinancial year 2014-15 was one of the toughest period for textile industry. Cotton prices had a bearish trend. Similarly, polyester fiber prices also fell due to sharp dip in oil prices. Both of these factors created a sentiment for decline in the prices of grey fabric. Our Weaving Segment faced a difficult time during the financial year under review.
Our primary export market has always been Europe but due to strengthening of US Dollar against Euro, our cloth sales volumes decreased. Economic slowdown of some major European nations such as Italy and Spain also worsened the situation. This year, winter season in Europe was mild and short. Most of the big retailers in Europe had their shops full of winter clothes and even some of them offered discounts during the season. Corduroy, which has always been our major product in winters, experienced a sharp decrease in volume. Rise in sales was recorded in summer season but we faced price pressure.
Our business in Japan also decreased. The reason for decline was again the decrease in the value of Japanese Yen against US Dollar during the year. Export sales to China has also slowed down during the last two months.
Turmoil in Middle East and war between Ukraine and Russia caused our work wear business to slow down. Most of our customers for work wear were selling their products in these markets. However as always, we have tried to diverse our product mix further by venturing into product range like abrasive and technical fabrics. We are hopeful that by end of financial year 2015-16, we shall be doing bulk business in these products.
010,00020,00030,00040,00050,00060,00070,00080,00090,000
100,000
2010-11 2011-12 2012-13 2013-14 2014-15YEARS
Grey Cloth Sales QuantityMeters (000)
0
50
100
150
200
2010-11 2011-12 2012-13 2013-14 2014-15YEARS
Grey Cloth Sales RateRupees Per Meter
0
3,000,000
6,000,000
9,000,000
12,000,000
15,000,000
2010-11 2011-12 2012-13 2013-14 2014-15YEARS
Grey Cloth Sales ValueRupees (000)
034
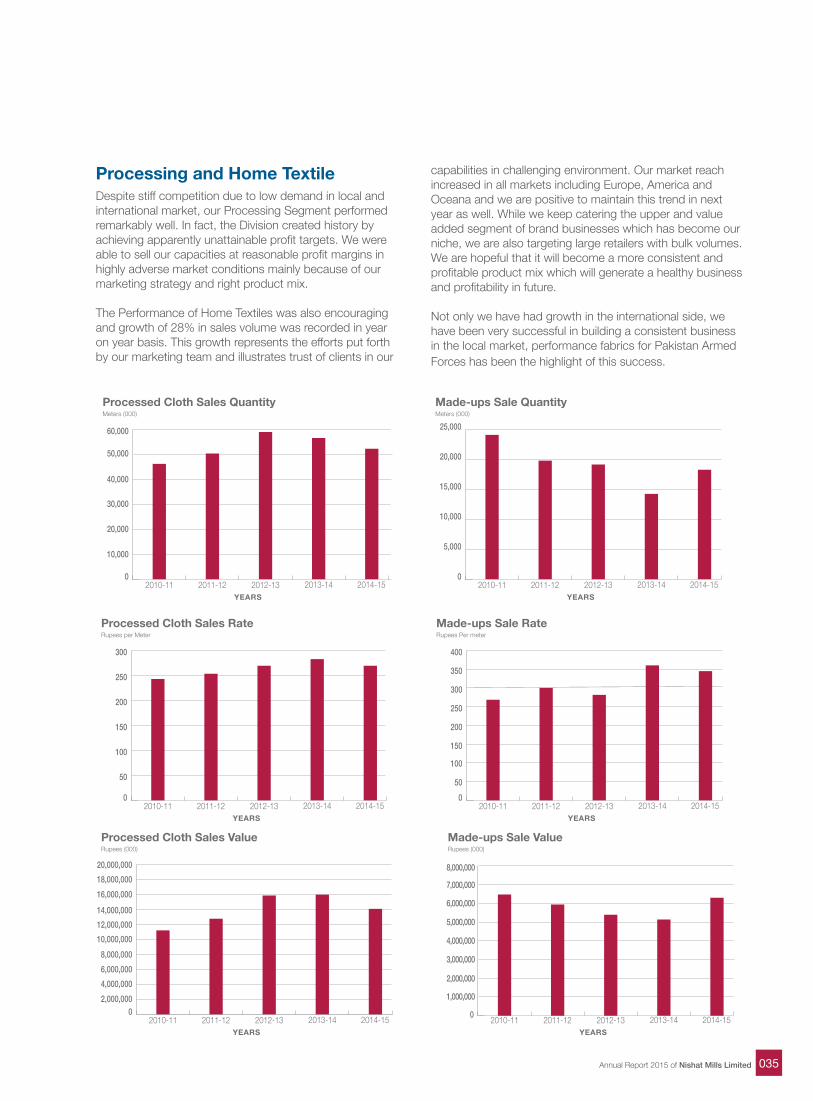
Processing and Home TextileDespite stiff competition due to low demand in local and international market, our Processing Segment performed remarkably well. In fact, the Division created history by achieving apparently unattainable profit targets. We were able to sell our capacities at reasonable profit margins in highly adverse market conditions mainly because of our marketing strategy and right product mix.
The Performance of Home Textiles was also encouraging and growth of 28% in sales volume was recorded in year on year basis. This growth represents the efforts put forth by our marketing team and illustrates trust of clients in our
02,000,0004,000,0006,000,0008,000,000
10,000,00012,000,00014,000,00016,000,00018,000,00020,000,000
2010-11 2011-12 2012-13 2013-14 2014-15YEARS
Processed Cloth Sales ValueRupees (000)
0
50
100
150
200
250
300
2010-11 2011-12 2012-13 2013-14 2014-15YEARS
Processed Cloth Sales RateRupees per Meter
0
10,000
20,000
30,000
40,000
50,000
60,000
2010-11 2011-12 2012-13 2013-14 2014-15YEARS
Processed Cloth Sales QuantityMeters (000)
0
5,000
10,000
15,000
20,000
25,000
2010-11 2011-12 2012-13 2013-14 2014-15YEARS
Made-ups Sale QuantityMeters (000)
050
100
150
200
250
300
350
400
2010-11 2011-12 2012-13 2013-14 2014-15YEARS
Made-ups Sale RateRupees Per meter
0
1,000,000
2,000,000
3,000,000
4,000,000
5,000,000
6,000,000
7,000,000
8,000,000
2010-11 2011-12 2012-13 2013-14 2014-15YEARS
Made-ups Sale ValueRupees (000)
capabilities in challenging environment. Our market reach increased in all markets including Europe, America and Oceana and we are positive to maintain this trend in next year as well. While we keep catering the upper and value added segment of brand businesses which has become our niche, we are also targeting large retailers with bulk volumes. We are hopeful that it will become a more consistent and profitable product mix which will generate a healthy business and profitability in future.
Not only we have had growth in the international side, we have been very successful in building a consistent business in the local market, performance fabrics for Pakistan Armed Forces has been the highlight of this success.
035Annual Report 2015 of Nishat Mills Limited
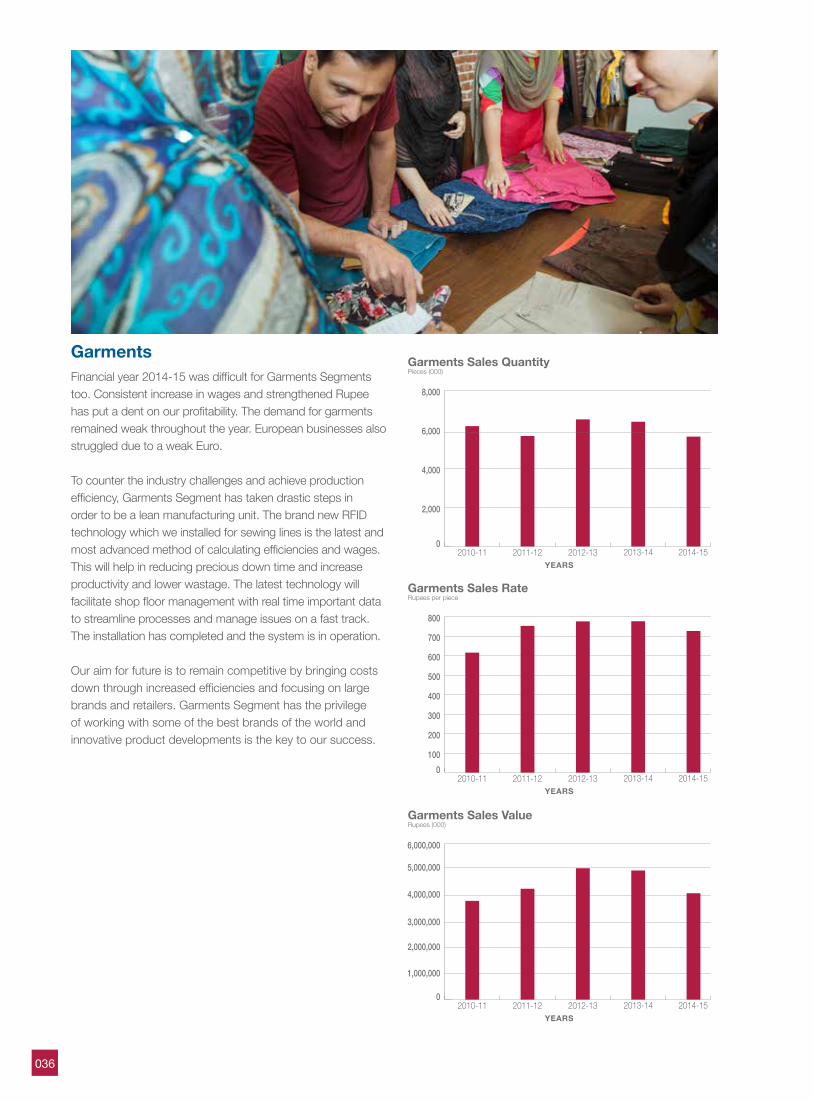
GarmentsFinancial year 2014-15 was difficult for Garments Segments too. Consistent increase in wages and strengthened Rupee has put a dent on our profitability. The demand for garments remained weak throughout the year. European businesses also struggled due to a weak Euro. To counter the industry challenges and achieve production efficiency, Garments Segment has taken drastic steps in order to be a lean manufacturing unit. The brand new RFID technology which we installed for sewing lines is the latest and most advanced method of calculating efficiencies and wages. This will help in reducing precious down time and increase productivity and lower wastage. The latest technology will facilitate shop floor management with real time important data to streamline processes and manage issues on a fast track. The installation has completed and the system is in operation.
Our aim for future is to remain competitive by bringing costs down through increased efficiencies and focusing on large brands and retailers. Garments Segment has the privilege of working with some of the best brands of the world and innovative product developments is the key to our success.
0
2,000
4,000
6,000
8,000
2010-11 2011-12 2012-13 2013-14 2014-15YEARS
Garments Sales QuantityPieces (000)
0
1,000,000
2,000,000
3,000,000
4,000,000
5,000,000
6,000,000
2010-11 2011-12 2012-13 2013-14 2014-15YEARS
Garments Sales ValueRupees (000)
0100
200
300
400
500
600
700
800
2010-11 2011-12 2012-13 2013-14 2014-15YEARS
Garments Sales RateRupees per piece
036

Information TechnologyInformation Technology is the backbone of our business operations and precursor to the growth of our Company. A robust and integrated IT system has enabled us to operate our manufacturing facilities and offices on nine different locations in Pakistan. Our IT Segment not only managed existing IT infrastructure but also carried out many hardware and software projects during the year.
We have successfully implemented a very advanced Radio Frequency Identification (RFID) System in Garments Segment which will help to increase productivity and efficiency of the Segment. Besides installation of physical hardware,in-house developed software programs have been implemented in the newly completed projects of Spinning and Weaving Segments.
Power GenerationThe Company invested in many projects in Power Division during the financial year 2014-15 to achieve key strategic objective of cost efficiency. Three tri fuel and highly efficient Wartsila Generators were commissioned at Bhikki, Ferozewatwan and Lahore.
A 22 ton Coal Fired Steam Boiler to meet the enhanced steam requirements of Weaving Division at Bhikki has been commissioned. This boiler generates low cost steam as compared to the steam generated on furnace oil and rice husk based boilers.
The 9 MW extension of coal fired power plant is in progress and will be completed soon. In addition to electricity, it will also produce 25 tons of steam per hour.
037Annual Report 2015 of Nishat Mills Limited
Risks and Opportunities
Nishat Mills Limited takes risks and creates opportunities in the normal course of business. Taking risk is important to remain competitive and ensure sustainable success. Our risk and opportunity management encompass an effective framework to conduct business in a well-controlled environment where risk is mitigated and opportunities are availed. Each risk and opportunity is properly weighted and considered before making any choice. Decisions are formulated only if opportunities outweigh risks.
Following is the summary of risks and strategies to mitigate those risks:
Strategic Risks We are operating in a competitive environment where innovation, quality and cost matters. This risk is mitigated through continuous research & development and persistent introduction of new technologies under BMR. Strategic risk is considered as the most crucial of all the risks. Head of all business divisions meet at regular basis to form an integrated approach towards tackling risks both at the international and national level.
Business Risks The Company faces a number of following business risks:
Cotton Supply and Price
The supply and prices of cotton is subject to the act of nature and demand dynamics of local and international cotton markets. There is always a risk of non-availability of cotton and upward shift in the cotton prices in local and international markets. The Company mitigates this risk by the procurement of the cotton in bulk at the start of the harvesting season.
Export Demand and Price
The exports are major part of our sales. We face the risk of competition and decline in demand of our products in international markets. We minimize this risk by building strong relations with customers, broadening our customer base, developing innovative products without compromising on quality and providing timely deliveries to customers.
Energy Availability and Cost
The rising cost and un-availability of energy i.e. electricity and gas shortage is a major threat to manufacturing industry. This risk, if unmitigated, can render us misfit to compete in the international markets. The Company has mitigated the risk of rising energy cost by opting for alternative fuels such as bio-mass and coal. The measures to conserve energy have also been taken at all manufacturing facilities of the Company. Likewise, risk of nonavailability of the energy has been minimized by installing power plants for generating electricity at almost all locations of the Company along with securing electricity connections from WAPDA.
Financial Risks The Board of Directors of the Company is responsible to formulate the financial risk management policies which are implemented by the Finance Department of the Company. The Company faces the following financial risks:
Currency risk
The Company is exposed to currency risk arising from various currency exposures, primarily with respect to United States Dollar (USD), Arab Emirates Dirham (AED) and Euro. The Company’s foreign exchange risk exposure is restricted to the bank balances and the amounts receivable / payable from/to the foreign entities.
Interest rate risk
The Company’s interest rate risk arises from long term financing, liabilities against assets subject to finance lease, short term borrowings, loans and advances to subsidiary companies, term deposit receipts and bank balances in saving accounts. Fair value sensitivity analysis and cash flow sensitivity analysis shows that the Company’s profitability is not materially exposed to the interest rate risk.
Credit risk
The Company’s exposure to credit risk and impairment losses relates to its trade debts. This risk is mitigated by the fact that majority of our customers have a strong financial standing and we have a long standing business relationship with all our customers. We do not expect nonperformance by our customers; hence, the credit risk is minimal.
Liquidity risk
It is at the minimum due to the availability of enough funds through committed credit facilities from the Banks and Financial institutions.
Capital risk
When managing capital, it is our objective to safeguard the Company’s ability to continue as a going concern in order to provide returns for shareholders and benefits to other stakeholders and to maintain an optimal capital structure
038
Textile Industry Overview
to reduce the cost of capital. The Company maintains low leveraged capital structure. We monitor the capital structure on the basis of the gearing ratio. Our strategy is to keep the gearing ratio at the maximum of 40% equity and 60% debt.
Opportunities As the leading textile company of the country, the Company is in a position to avail and exploit a number of opportunities. Following is the summary of some exciting opportunities.
• Regionally diversified customer base across the world provides a sustainable growth to export sales;
• Vibrant local and international subsidiary companies create demand for our products;
• Vertical integration makes it possible to exploit operational synergies;
• Abundant supply of cotton in the country; • High population growth of the country is a source of
suitable manpower and a stimulus in creating local demand for textile products.
Textile industry is the most essential manufacturing sector of Pakistan as it serves as the backbone of Pakistan’s economy. It has the longest production chain, with inherent potential for value addition at each stage of processing, from cotton to ginning, spinning, fabric, dyeing and finishing, made-ups and garments. Critical success factors of the textile industry are availability of cheap and subsidized credit facilities, uninterrupted supply of gas and electricity at low rates, consistent and industry friendly tax policies and establishment of new textile units in less developed areas by giving incentives to the investors i.e. tax holiday. Due to unavailability of these factors, negligible growth of 0.5 percent has been recorded in the current financial year 2014-15 as compared to the last year in Pakistan. Government of Pakistan has promulgated Textile Policy 2014-19 to ensure the maintenance of country’s reputation as a reliable source of high quality textile goods. Salient features of the Policy are as follows:• Draw-back for local taxes and levies are given to
exporters of textile products on FOB values of their enhanced exports if increased beyond 10% over last year’s exports at the following rates:o Garments 4%o Made ups 2%; &o Processed fabric 1%.
• Mark up rate for Export Refinance Scheme of State Bank of Pakistan was reduced from 9.40% to 7.50% under the policy. This rate has been subsequently reduced further to 4.50 %.
• Mark up rates for Long Term Financing Facility (LTFF) provided to textile manufacturers in the value added sector was reduced from 10.90% to 9.00 %. This rate has been subsequently reduced further to 6.00 %.
Nishat Mills Limited’s Market ShareThe Company is one of the largest composite textile manufacturing unit of Pakistan. It has attained a reputable and competitive position in textile sector for many years by using latest technology, meeting frequently changing needs of customers, complying with relevant laws and regulations and successfully fulfilling its responsibility towards society. The Company earns valuable foreign exchange by contributing around 3 percent in the textile exports of Pakistan.
039Annual Report 2015 of Nishat Mills Limited
Subsidiary Companies
The company has annexed its consolidated financial statements along with its separate financial statements in accordance with the requirements of International Accounting Standard – 27 (Consolidated and Separate Financial Statements).
Following is a brief description of all subsidiary companies of Nishat Mills Limited:
1. Nishat Power Limited The Company owns and controls 51.01% shares of
this subsidiary. The subsidiary is listed on Karachi Stock Exchange Limited and Lahore Stock Exchange Limited in Pakistan. The principle business of the subsidiary is to build, operate and maintain a fuel powered station having gross capacity of 200 MW in Jamber Kalan, Tehsil Pattoki, District Kasur, Punjab, Pakistan. The subsidiary commenced its commercial production from 09 June 2010.
2. Nishat Linen (Private) Limited This is a wholly owned subsidiary of the Company. The
principal objects of the Subsidiary are to operate retail outlets for sale of textile and other products and to sale the textile products by processing the textile goods in own and outside manufacturing facilities. The subsidiary started its operations in July 2011 and is presently operating 64 retail outlets in Pakistan.
3. Nishat Hospitality (Private) Limited This is a wholly owned subsidiary of the Company.
Subsidiary’s object is to run a chain of hotels across the country. Currently it is operating a four star hotel in Lahore on international standards under the name of “The Nishat St. James’ Hotel”. The subsidiary started its operations on 01 March 2014.
4. Nishat Commodities (Private) Limited This is a wholly owned subsidiary of the Company. The
object of the subsidiary is to carry on the business of trading of commodities including fuels, coals, building material in any form or shape manufactured, semi-manufactured, raw materials and their import and sale in Pakistan. The incorporation date of Nishat Commodities (Private) Limited is 16 July 2015.
5. Nishat Linen Trading LLC This subsidiary is a limited liability company incorporated
in Dubai, UAE. It is a wholly owned subsidiary of the Company. The subsidiary is principally engaged in trading of textile, blankets, towels, linens, ready-made garments, garments accessories and leather products along with ancillaries thereto through retail outlets and warehouses across United Arab Emirates. The subsidiary started its commercial operations in May 2011 is presently operating 9 retail outlets in UAE.
6. Nishat International FZE This is also a wholly owned subsidiary of Nishat Mills
Limited. It has been incorporated as a Free Zone Establishment limited Liability Company in Jebel Ali Free Zone, Dubai according to the laws of United Arab Emirates (UAE). It has been registered in the FZE register on February 7, 2013. The principal activity of the Subsidiary Company is trading in textile products such as blankets, towels & linens, ready-made garments, garments accessories and leather products such as shoes, handbags and all such ancillaries thereto.
7. Nishat Global China Company Limited Nishat Global China Company Limited is incorporated
in Yuexiu District, Guangzhou, China, as Foreign Invested Commercial Enterprises “FICE”, in accordance with the Law of Peoples Republic of China on Foreign-Capital enterprises and other relevant Laws and Regulations. Nishat Global China Company Limited is a wholly owned subsidiary of Nishat International FZE which is a wholly owned subsidiary of Nishat Mills Limited. The principal business of the Subsidiary is wholesale, commission agency (excluding auction), import and export of textile goods and women fashion accessories. The subsidiary started its commercial operations in January 2014.
8. Nishat USA Inc. The subsidiary is a corporation service company
incorporated in the State of New York. It is a wholly owned subsidiary acquired by the Company on 01 October 2008. The corporation is a liaison office of the Company’s marketing department providing access, information and other services relating to US Market.
9. Nishat UK (Private) Limited Nishat UK (Private) Limited is a private limited
company incorporated in England and Wales on 8 June 2015. It is a wholly owned subsidiary of Nishat International FZE which is a wholly owned subsidiary of Nishat Mills Limited. The primary function of Nishat UK (Private) Limited is sale of textile and related products in England and Wales through retail outlets and wholesale operations.
040
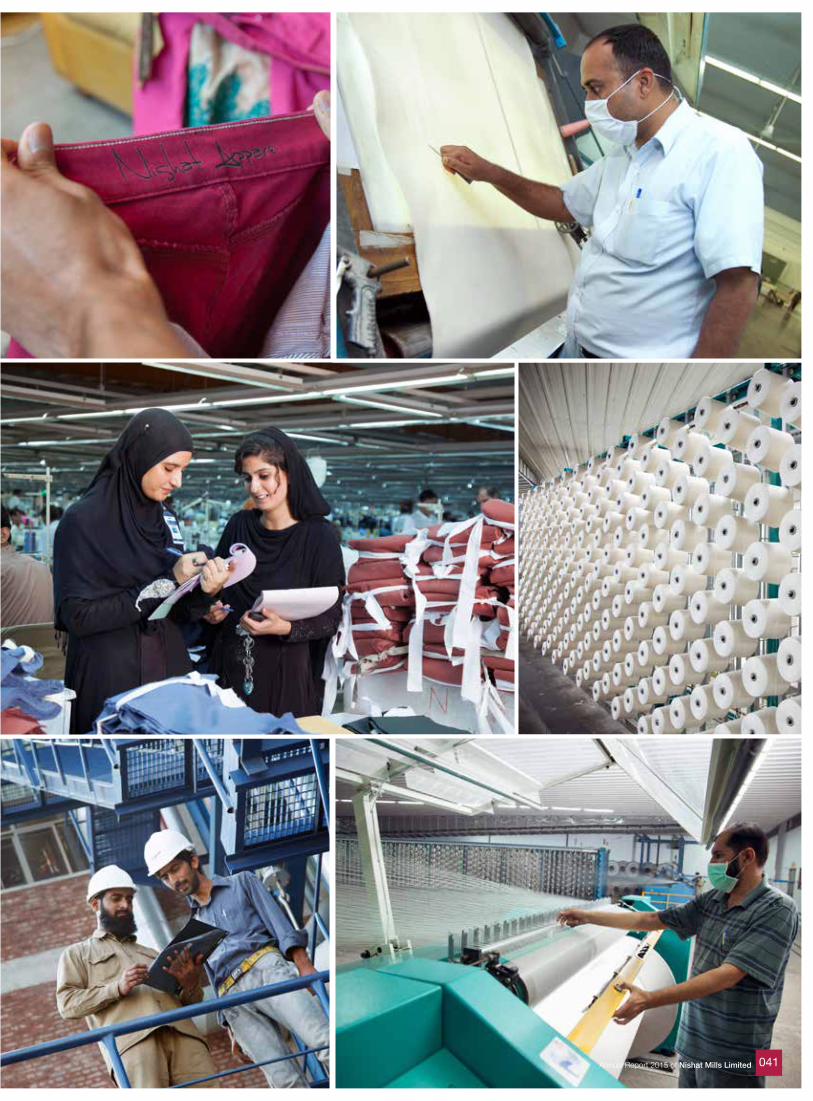
041Annual Report 2015 of Nishat Mills Limited
Corporate Sustainability
The Company believes that corporate social responsibility (CSR) is not only about the smooth management of the business but it assures developing long lasting and strong relationships with all its stakeholders including customers, employees, suppliers and government.
The Company’s management continued its focus on environmental protection, social welfare, provision of equal opportunities, healthcare and ensuring good working environment to its employees.
Energy Conservation Uninterrupted energy supply is essential for effective, smooth and efficient business operations. The Company is not only finding out ways to generate energy from alternative sources but also encouraging energy conservation projects. The Company has made further progress in the replacement of conventional tube lights with LED lights and solar panels at different locations of the Company.
Environment Protection The Company has continued to show its dedication towards environment protection by starting new projects for environment protection and ensuring the continuity of the old projects. Effluent treatment plants are successfully working at all locations of dyeing, printing and garments. Our “Rupee for a Tree Scheme” project, a partnership project among the employees and the management, which has started to create awareness among our employees and society, has successfully achieved this year’s target by planting more trees this year at the Company premises, highways, roads, colleges, schools, hospital and other public places. In the current year the Company has installed forty five powerless ventilators to save the electricity and encourage green environment concept. The focus of the Company is on the implementation of the latest Green Building technologies in our new Garments Unit which is under installation phases.
Waste Recycling The Company is fully concerned about the environment and neighboring communities and showed its commitment by installing water treatment plants, cotton recycling plants and oil recycling machines at different sites to recycle the water, waste cloth and oil for maximum saving of natural resources.
Occupational Safety and Health Employee’s good health and safety has been the top priority of the Company. Periodic awareness sessions are being conducted to promote the preventive measures with the intention of ensuring safety and security of the employees. We have established Fire Fighting Departments which are
equipped with sophisticated firefighting equipment at all our locations. Similarly, we have established facilities of dispensaries and ambulances at all locations. The Company also arranges Malaria and Typhoid vaccination for workers and their families. The Company also arranges fumigation for insecticide in order to prevent dengue and other diseases.
Equal Opportunity Employer The Company is an equal opportunity employer and offers employment without any gender and class discrimination. Employment of women is encouraged especially in the stitching and garments segments.
Community Welfare Schemes Management of the Company takes keen interest in the welfare of the society. The Company holds twice a year free medical camps at its manufacturing facilities where free medical advice is offered to people living near the vicinity of the Company. We have established a blood bank at different sites to deal with emergency situation and any other mishap. The Company arranges the training of thousands of young people before they enter the job. This is the most valuable contribution to the nation by providing a trained work force.
Consumer Protection Measures The products of the Company are manufactured and shipped according to the prevailing and required international safety standards. We have set up systems such as the installation of metal detectors for prevention and detection of any harmful substance in the products. For this, the Company meets the Oeko Tax Standards 100 which is an independent testing and certification system for textile raw materials, intermediate and end products at all stages of production. The Company has also acquired C-TPAT Certification Customs-Trade Partnership against Terrorism at all its production facilities. Further the Company has obtained SA-8000, WRAP and SEDEX.
042

Contribution to National Exchequer and Economy As an export oriented entity, the Company has earned precious foreign exchange of US$ 393.683 million during the current year. In addition to that, the Company contributed Rs. 1,419 million towards national exchequer by way of income taxes, sales taxes, custom duties, export development surcharge, education cess, cotton cess, social security contribution, EOBI contribution etc. The Company is also acting as withholding agent for FBR.
043Annual Report 2015 of Nishat Mills Limited
Corporate Governance
Best Corporate PracticesWe are committed to good corporate governance and do comply with the requirements of Code of Corporate Governance 2012 (CCG 2012) included in the listing regulations of Karachi, Lahore and Islamabad Stock Exchanges. The statement of compliance with the CCG 2012 is enclosed.
Board CommitteesAudit Committee
The audit committee is performing its duties in line with its terms of reference as determined by the Board of Directors. Composition of the committee is as follows:
Mr. Khalid Qadeer Qureshi Chairman / MemberMr. Syed Zahid Hussain MemberMs. Nabiha Shahnawaz Cheema Member
Human Resource & Remuneration (HR&R) Committee
The Human Resource & Remuneration Committee is performing its duties in line with its terms of reference as determined by the Board of Directors. Composition of the Committee is as follows:
Mian Hassan Mansha Chairman / MemberMian Umer Mansha MemberMr. Khalid Qadeer Qureshi MemberMs. Nabiha Shahnawaz Cheema Member
Meetings of the Board of DirectorsDuring the year under review, five meetings of the Board of Directors of the Company were held in Pakistan and the attendance position is as follows:
No. of Sr.# Names Meetings Attended
1. Mian Umer Mansha (Chief Executive Officer) 4
2. Mian Hassan Mansha (Chairman) 3
3. Syed Zahid Hussain 5
4. Mr. Khalid Qadeer Qureshi 5
5. Ms. Nabiha Shahnawaz Cheema 1
6. Mr. Maqsood Ahmad 5
7. Mr. Saeed Ahmad Alvi 4
Directors’ StatementIn compliance of the Code of Corporate Governance, we give below statements on Corporate and Financial Reporting framework:1. The financial statements, prepared by the management
of the Company, present fairly its state of affairs, the result of its operations, cash flows and changes in equity.
2. Proper books of account of the Company have been maintained.
3. Appropriate accounting policies have been consistently applied in preparation of the financial statements and accounting estimates are based on reasonable and prudent judgment.
4. International Financial Reporting Standards, as applicable in Pakistan, have been followed in preparation of financial statements and any departure there from has been adequately disclosed.
5. The system of internal control is sound in design and has been effectively implemented and monitored.
6. There are no significant doubts upon the Company’s ability to continue as a going concern.
7. There has been no material departure from the best practices of corporate governance, as detailed in the listing regulations.
8. Cost of investments in respect of retirement benefits fund:
Provident Fund: 30th June, 2015: Rs. 2,437.102 Million Un-audited (2014: Rs. 2,111.663 Million-Audited).
Transactions with related partiesTransactions with related parties were carried out at arm’s length prices determined in accordance with the comparable uncontrolled prices method. The Company has fully complied with best practices on Transfer Pricing as contained in the Listing Regulations of Stock Exchanges in Pakistan.
AuditorsThe present auditors of the Company M/s Riaz Ahmed & Company Chartered Accountants have completed the annual audit for the year ended 30 June 2015 and have issued an unqualified audit report. The auditors will retire on conclusion of the Annual General Meeting of the Company, and being eligible; have offered themselves for reappointment for the year ending 30 June 2016.
044
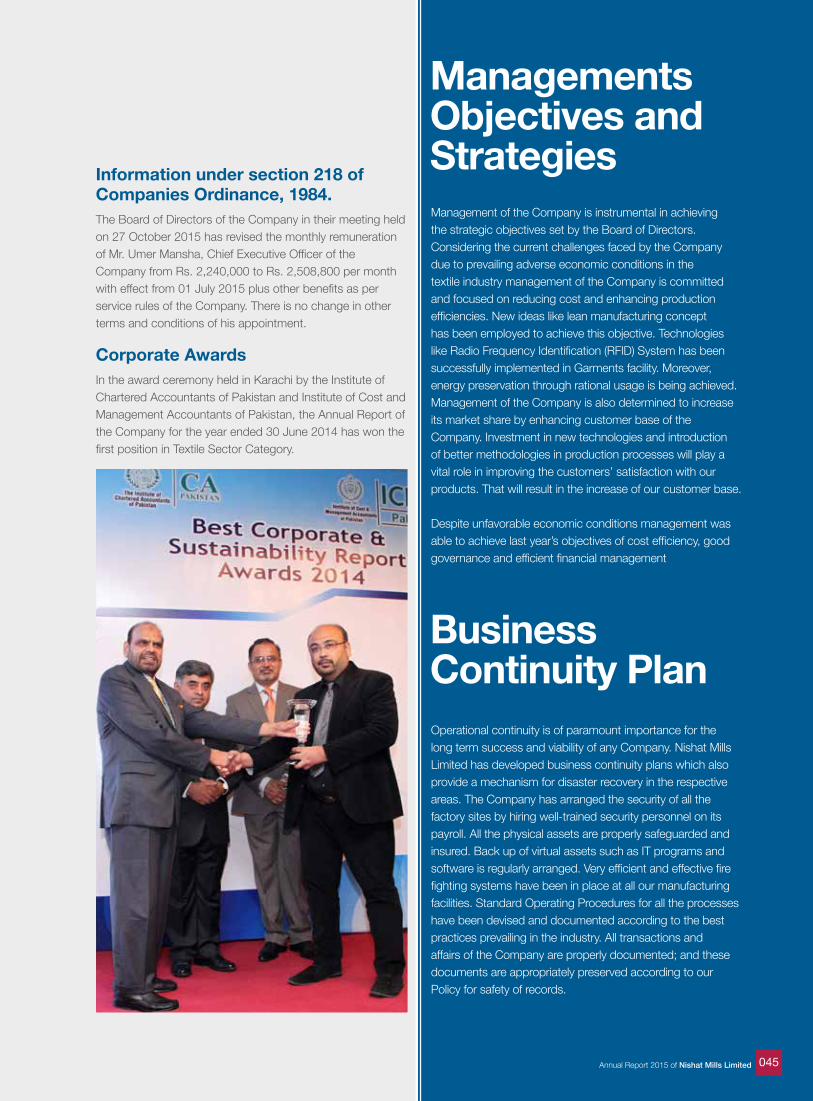
Corporate Awards In the award ceremony held in Karachi by the Institute of Chartered Accountants of Pakistan and Institute of Cost and Management Accountants of Pakistan, the Annual Report of the Company for the year ended 30 June 2014 has won the first position in Textile Sector Category.
Information under section 218 of Companies Ordinance, 1984. The Board of Directors of the Company in their meeting held on 27 October 2015 has revised the monthly remuneration of Mr. Umer Mansha, Chief Executive Officer of the Company from Rs. 2,240,000 to Rs. 2,508,800 per month with effect from 01 July 2015 plus other benefits as per service rules of the Company. There is no change in other terms and conditions of his appointment.
Managements Objectives and Strategies
Business Continuity Plan
Management of the Company is instrumental in achieving the strategic objectives set by the Board of Directors. Considering the current challenges faced by the Company due to prevailing adverse economic conditions in the textile industry management of the Company is committed and focused on reducing cost and enhancing production efficiencies. New ideas like lean manufacturing concept has been employed to achieve this objective. Technologies like Radio Frequency Identification (RFID) System has been successfully implemented in Garments facility. Moreover, energy preservation through rational usage is being achieved.Management of the Company is also determined to increase its market share by enhancing customer base of the Company. Investment in new technologies and introduction of better methodologies in production processes will play a vital role in improving the customers’ satisfaction with our products. That will result in the increase of our customer base. Despite unfavorable economic conditions management was able to achieve last year’s objectives of cost efficiency, good governance and efficient financial management
Operational continuity is of paramount importance for the long term success and viability of any Company. Nishat Mills Limited has developed business continuity plans which also provide a mechanism for disaster recovery in the respective areas. The Company has arranged the security of all the factory sites by hiring well-trained security personnel on its payroll. All the physical assets are properly safeguarded and insured. Back up of virtual assets such as IT programs and software is regularly arranged. Very efficient and effective fire fighting systems have been in place at all our manufacturing facilities. Standard Operating Procedures for all the processes have been devised and documented according to the best practices prevailing in the industry. All transactions and affairs of the Company are properly documented; and these documents are appropriately preserved according to our Policy for safety of records.
045Annual Report 2015 of Nishat Mills Limited
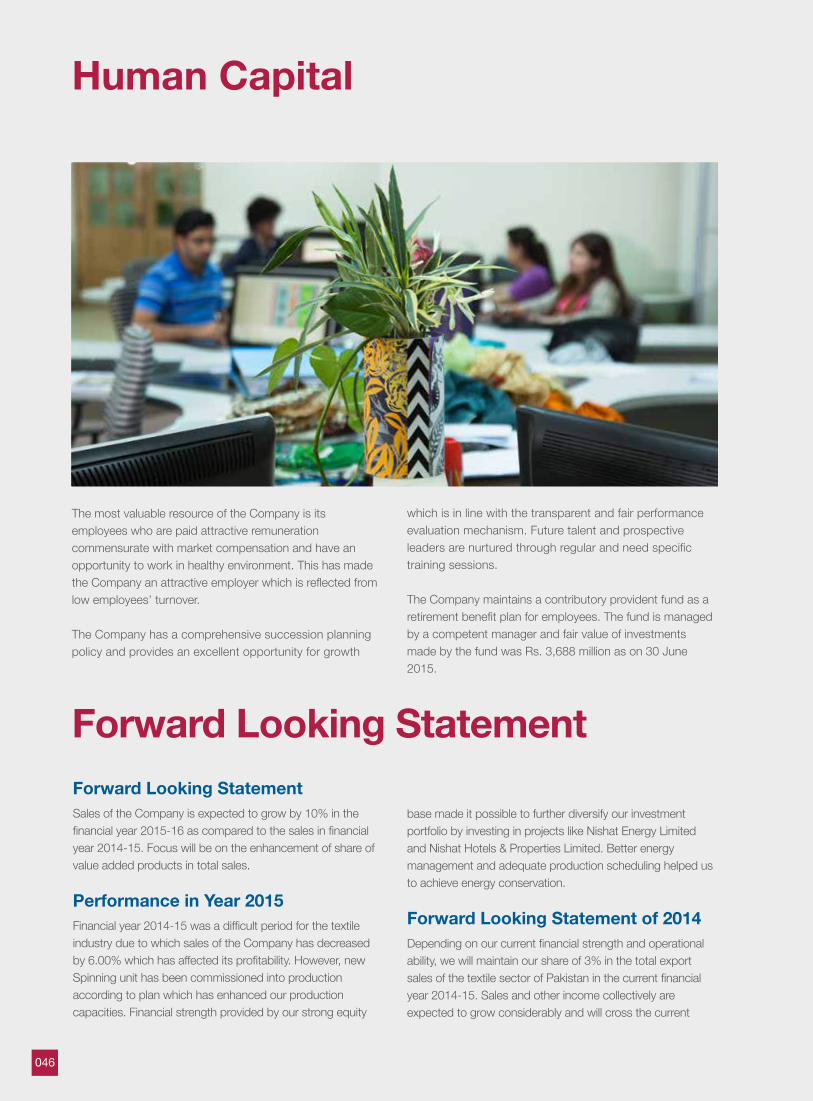
Forward Looking StatementForward Looking StatementSales of the Company is expected to grow by 10% in the financial year 2015-16 as compared to the sales in financial year 2014-15. Focus will be on the enhancement of share of value added products in total sales.
Performance in Year 2015Financial year 2014-15 was a difficult period for the textile industry due to which sales of the Company has decreased by 6.00% which has affected its profitability. However, new Spinning unit has been commissioned into production according to plan which has enhanced our production capacities. Financial strength provided by our strong equity
Human Capital
The most valuable resource of the Company is its employees who are paid attractive remuneration commensurate with market compensation and have an opportunity to work in healthy environment. This has made the Company an attractive employer which is reflected from low employees’ turnover.
The Company has a comprehensive succession planning policy and provides an excellent opportunity for growth
which is in line with the transparent and fair performance evaluation mechanism. Future talent and prospective leaders are nurtured through regular and need specific training sessions.
The Company maintains a contributory provident fund as a retirement benefit plan for employees. The fund is managed by a competent manager and fair value of investments made by the fund was Rs. 3,688 million as on 30 June 2015.
base made it possible to further diversify our investment portfolio by investing in projects like Nishat Energy Limited and Nishat Hotels & Properties Limited. Better energy management and adequate production scheduling helped us to achieve energy conservation.
Forward Looking Statement of 2014Depending on our current financial strength and operational ability, we will maintain our share of 3% in the total export sales of the textile sector of Pakistan in the current financial year 2014-15. Sales and other income collectively are expected to grow considerably and will cross the current
046
Future Prospects
Acknowledgement
Financial year 2014-15 was riddled with difficulties and challenges. This trend may continue in the next year too. We are anticipating that besides domestic problems demand for textile products in international market will also remain low. Global cotton prices are most likely to remain stable at current price level as China, which is a major consumer of cotton, is still holding huge stocks. We expect that it will dispose of excess cotton stocks at current price level without destabilizing the market. Despite these anticipated difficulties, we hope our performance in the Coming year will improve.
The construction of the new Garments unit is underway. This Garments unit will be in operation by the end of third quarter of financial year 2015-16. The unit will focus on the production of Denim Jeans. When it will be fully operational; the existing capacities of Garments Segment will double. This will bring flexibility in both product and delivery management. The machines and designs have been carefully selected to meet the cost challenges. Automation in garments sewing and washing technology is the deciding factor in the project selection, design and implementation. Approximately 10% reduction in cost of doing business is anticipated through automation and intelligent design on the new project.
The Board is pleased with the continued dedication and efforts of the employees of the Company.
For and on behalf of the Board of Directors
Mian Umer ManshaChief Executive Officer
27 October 2015Lahore
figure of Rs. 58 billion as a result of heavy investments made by the Company in enhancement of its production facilities during the financial year ended 30 June 2014. Our substantial equity reserves also provide us great support to invest further in projects which will further enhance the prospects of future earnings of the Company. We will continue our policy of exploring new energy conservation techniques and generating electricity from cheap fuels like coal and biomass. This will help us in substantially reducing our cost of production.
Scheme of Compromises, Arrangements and ReconstructionThe Board of Directors of the Company in their meeting held on 24 February 2015 approved the Scheme of Compromises, Arrangements and Reconstruction under sections 284 to 288 of the Companies Ordinance, 1984 between Nishat Spinning (Private) Limited and its members and Nishat Linen (Private) Limited and its members and Nishat Mills Limited and its members. The scheme was approved by shareholders of the aforesaid companies in their respective Extra Ordinary General Meetings (EOGMs) held on 21 April 2015 and respective EOGMs with Co-Chairpersons appointed by Honourable Lahore High Court, Lahore held on 27 June 2015. The Honourable Lahore High Court, Lahore, has approved the scheme by way of order dated 6 October 2015 with effect from 31 December 2014.
The main objects of the Scheme of Compromises, Arrangements and Reconstruction are: to effect merger of Nishat Spinning (Private) Limited “NSPL” with and into Nishat Linen (Private) Limited “NLPL” and Nishat Mills Limited “NML” through the transfer and vesting in “NLPL” and “NML” of Undertaking of “NSPL”; and to separate the Sewing Undertaking (comprising of building, plant and machinery, related assets and inventory of Sewing Unit of “NML”) from “NML” and transfer and vest the same with and into “NLPL”.
047Annual Report 2015 of Nishat Mills Limited
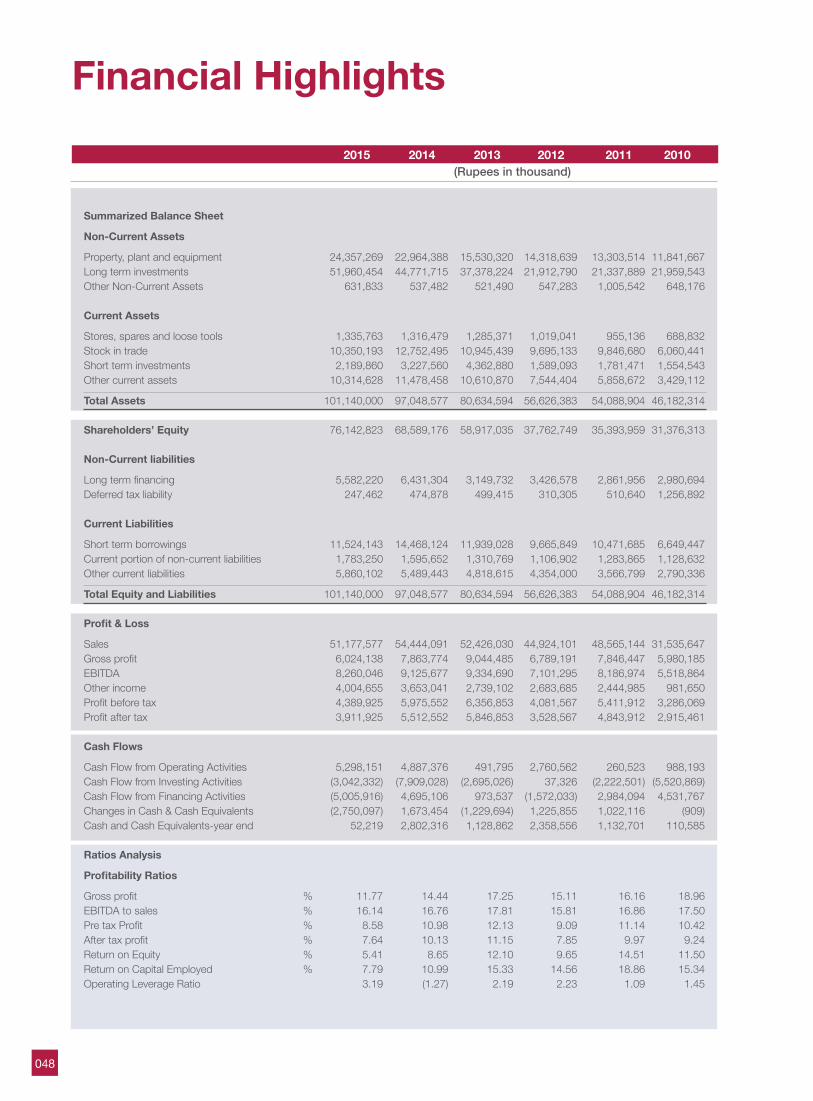
Financial Highlights 2015 2014 2013 2012 2011 2010 (Rupees in thousand)
Summarized Balance Sheet
Non-Current Assets
Property, plant and equipment 24,357,269 22,964,388 15,530,320 14,318,639 13,303,514 11,841,667 Long term investments 51,960,454 44,771,715 37,378,224 21,912,790 21,337,889 21,959,543 Other Non-Current Assets 631,833 537,482 521,490 547,283 1,005,542 648,176 Current Assets
Stores, spares and loose tools 1,335,763 1,316,479 1,285,371 1,019,041 955,136 688,832 Stock in trade 10,350,193 12,752,495 10,945,439 9,695,133 9,846,680 6,060,441 Short term investments 2,189,860 3,227,560 4,362,880 1,589,093 1,781,471 1,554,543 Other current assets 10,314,628 11,478,458 10,610,870 7,544,404 5,858,672 3,429,112
Total Assets 101,140,000 97,048,577 80,634,594 56,626,383 54,088,904 46,182,314 Shareholders’ Equity 76,142,823 68,589,176 58,917,035 37,762,749 35,393,959 31,376,313 Non-Current liabilities
Long term financing 5,582,220 6,431,304 3,149,732 3,426,578 2,861,956 2,980,694 Deferred tax liability 247,462 474,878 499,415 310,305 510,640 1,256,892 Current Liabilities
Short term borrowings 11,524,143 14,468,124 11,939,028 9,665,849 10,471,685 6,649,447 Current portion of non-current liabilities 1,783,250 1,595,652 1,310,769 1,106,902 1,283,865 1,128,632 Other current liabilities 5,860,102 5,489,443 4,818,615 4,354,000 3,566,799 2,790,336
Total Equity and Liabilities 101,140,000 97,048,577 80,634,594 56,626,383 54,088,904 46,182,314
Profit & Loss
Sales 51,177,577 54,444,091 52,426,030 44,924,101 48,565,144 31,535,647 Gross profit 6,024,138 7,863,774 9,044,485 6,789,191 7,846,447 5,980,185 EBITDA 8,260,046 9,125,677 9,334,690 7,101,295 8,186,974 5,518,864 Other income 4,004,655 3,653,041 2,739,102 2,683,685 2,444,985 981,650 Profit before tax 4,389,925 5,975,552 6,356,853 4,081,567 5,411,912 3,286,069 Profit after tax 3,911,925 5,512,552 5,846,853 3,528,567 4,843,912 2,915,461 Cash Flows
Cash Flow from Operating Activities 5,298,151 4,887,376 491,795 2,760,562 260,523 988,193 Cash Flow from Investing Activities (3,042,332) (7,909,028) (2,695,026) 37,326 (2,222,501) (5,520,869)Cash Flow from Financing Activities (5,005,916) 4,695,106 973,537 (1,572,033) 2,984,094 4,531,767 Changes in Cash & Cash Equivalents (2,750,097) 1,673,454 (1,229,694) 1,225,855 1,022,116 (909)Cash and Cash Equivalents-year end 52,219 2,802,316 1,128,862 2,358,556 1,132,701 110,585 Ratios Analysis
Profitability Ratios
Gross profit % 11.77 14.44 17.25 15.11 16.16 18.96 EBITDA to sales % 16.14 16.76 17.81 15.81 16.86 17.50 Pre tax Profit % 8.58 10.98 12.13 9.09 11.14 10.42 After tax profit % 7.64 10.13 11.15 7.85 9.97 9.24 Return on Equity % 5.41 8.65 12.10 9.65 14.51 11.50 Return on Capital Employed % 7.79 10.99 15.33 14.56 18.86 15.34 Operating Leverage Ratio 3.19 (1.27) 2.19 2.23 1.09 1.45
048
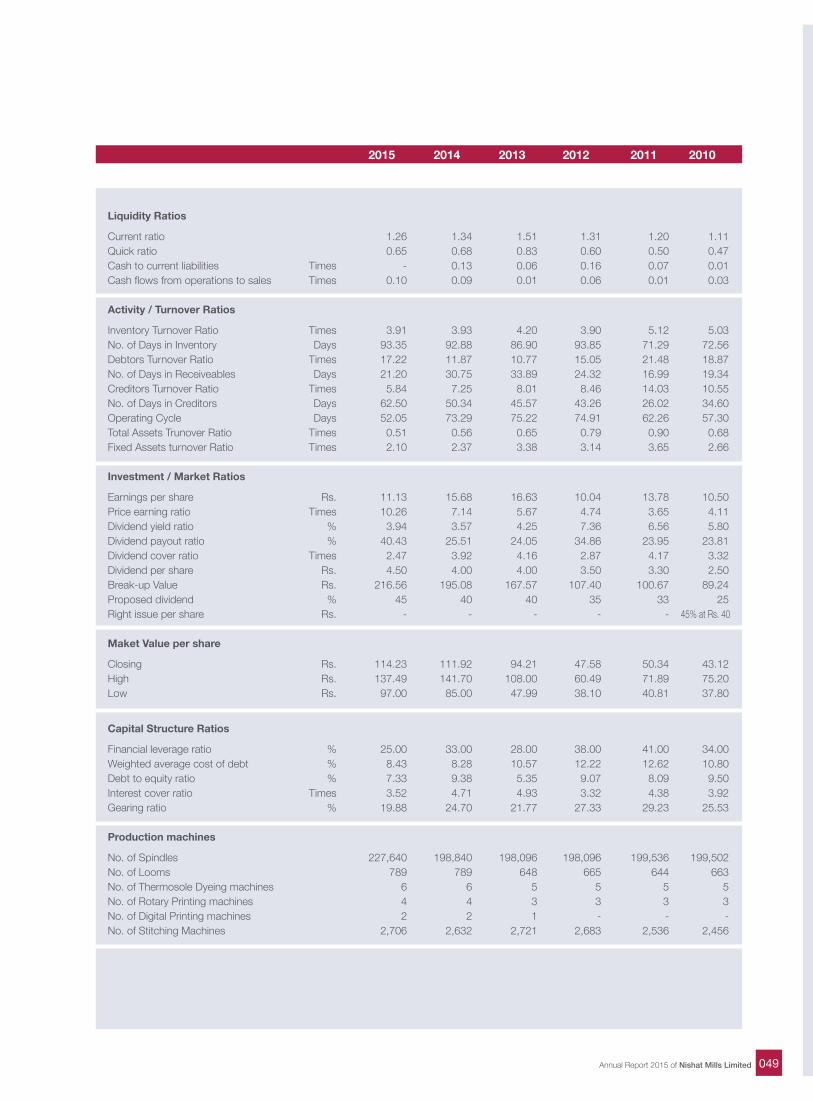
2015 2014 2013 2012 2011 2010
Liquidity Ratios
Current ratio 1.26 1.34 1.51 1.31 1.20 1.11 Quick ratio 0.65 0.68 0.83 0.60 0.50 0.47 Cash to current liabilities Times - 0.13 0.06 0.16 0.07 0.01 Cash flows from operations to sales Times 0.10 0.09 0.01 0.06 0.01 0.03 Activity / Turnover Ratios
Inventory Turnover Ratio Times 3.91 3.93 4.20 3.90 5.12 5.03 No. of Days in Inventory Days 93.35 92.88 86.90 93.85 71.29 72.56 Debtors Turnover Ratio Times 17.22 11.87 10.77 15.05 21.48 18.87 No. of Days in Receiveables Days 21.20 30.75 33.89 24.32 16.99 19.34 Creditors Turnover Ratio Times 5.84 7.25 8.01 8.46 14.03 10.55 No. of Days in Creditors Days 62.50 50.34 45.57 43.26 26.02 34.60 Operating Cycle Days 52.05 73.29 75.22 74.91 62.26 57.30 Total Assets Trunover Ratio Times 0.51 0.56 0.65 0.79 0.90 0.68 Fixed Assets turnover Ratio Times 2.10 2.37 3.38 3.14 3.65 2.66 Investment / Market Ratios
Earnings per share Rs. 11.13 15.68 16.63 10.04 13.78 10.50 Price earning ratio Times 10.26 7.14 5.67 4.74 3.65 4.11 Dividend yield ratio % 3.94 3.57 4.25 7.36 6.56 5.80 Dividend payout ratio % 40.43 25.51 24.05 34.86 23.95 23.81 Dividend cover ratio Times 2.47 3.92 4.16 2.87 4.17 3.32 Dividend per share Rs. 4.50 4.00 4.00 3.50 3.30 2.50 Break-up Value Rs. 216.56 195.08 167.57 107.40 100.67 89.24 Proposed dividend % 45 40 40 35 33 25 Right issue per share Rs. - - - - - 45% at Rs. 40
Maket Value per share
Closing Rs. 114.23 111.92 94.21 47.58 50.34 43.12 High Rs. 137.49 141.70 108.00 60.49 71.89 75.20 Low Rs. 97.00 85.00 47.99 38.10 40.81 37.80
Capital Structure Ratios
Financial leverage ratio % 25.00 33.00 28.00 38.00 41.00 34.00 Weighted average cost of debt % 8.43 8.28 10.57 12.22 12.62 10.80 Debt to equity ratio % 7.33 9.38 5.35 9.07 8.09 9.50 Interest cover ratio Times 3.52 4.71 4.93 3.32 4.38 3.92 Gearing ratio % 19.88 24.70 21.77 27.33 29.23 25.53 Production machines
No. of Spindles 227,640 198,840 198,096 198,096 199,536 199,502No. of Looms 789 789 648 665 644 663No. of Thermosole Dyeing machines 6 6 5 5 5 5No. of Rotary Printing machines 4 4 3 3 3 3No. of Digital Printing machines 2 2 1 - - - No. of Stitching Machines 2,706 2,632 2,721 2,683 2,536 2,456
049Annual Report 2015 of Nishat Mills Limited
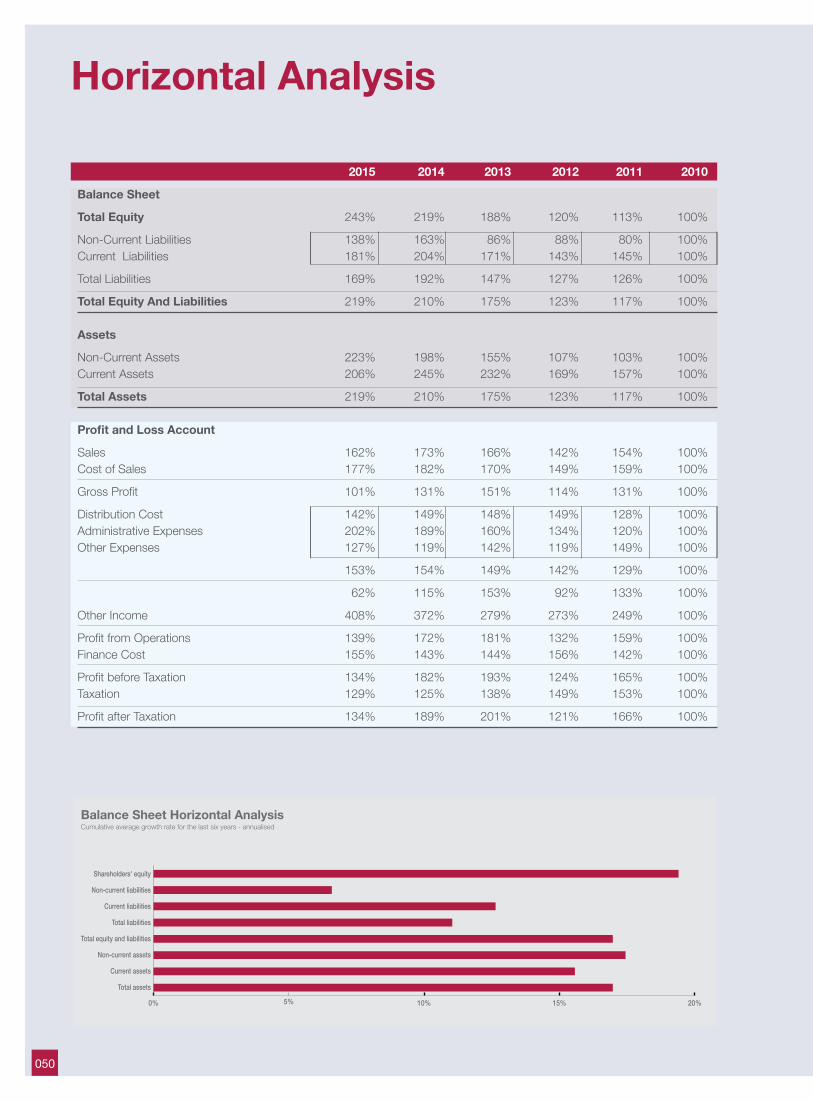
2015 2014 2013 2012 2011 2010
Balance Sheet
Total Equity 243% 219% 188% 120% 113% 100%
Non-Current Liabilities 138% 163% 86% 88% 80% 100%Current Liabilities 181% 204% 171% 143% 145% 100%
Total Liabilities 169% 192% 147% 127% 126% 100%
Total Equity And Liabilities 219% 210% 175% 123% 117% 100% Assets
Non-Current Assets 223% 198% 155% 107% 103% 100%Current Assets 206% 245% 232% 169% 157% 100%
Total Assets 219% 210% 175% 123% 117% 100% Profit and Loss Account
Sales 162% 173% 166% 142% 154% 100%Cost of Sales 177% 182% 170% 149% 159% 100%
Gross Profit 101% 131% 151% 114% 131% 100%
Distribution Cost 142% 149% 148% 149% 128% 100%Administrative Expenses 202% 189% 160% 134% 120% 100%Other Expenses 127% 119% 142% 119% 149% 100%
153% 154% 149% 142% 129% 100%
62% 115% 153% 92% 133% 100%
Other Income 408% 372% 279% 273% 249% 100%
Profit from Operations 139% 172% 181% 132% 159% 100%Finance Cost 155% 143% 144% 156% 142% 100%
Profit before Taxation 134% 182% 193% 124% 165% 100%Taxation 129% 125% 138% 149% 153% 100%
Profit after Taxation 134% 189% 201% 121% 166% 100%
Balance Sheet Horizontal AnalysisCumulative average growth rate for the last six years - annualised
Shareholders' equity
Non-current liabilities
Current liabilities
Total liabilities
Total equity and liabilities
Non-current assets
Current assets
Total assets
0% 5% 10% 15% 20%
Horizontal Analysis
050
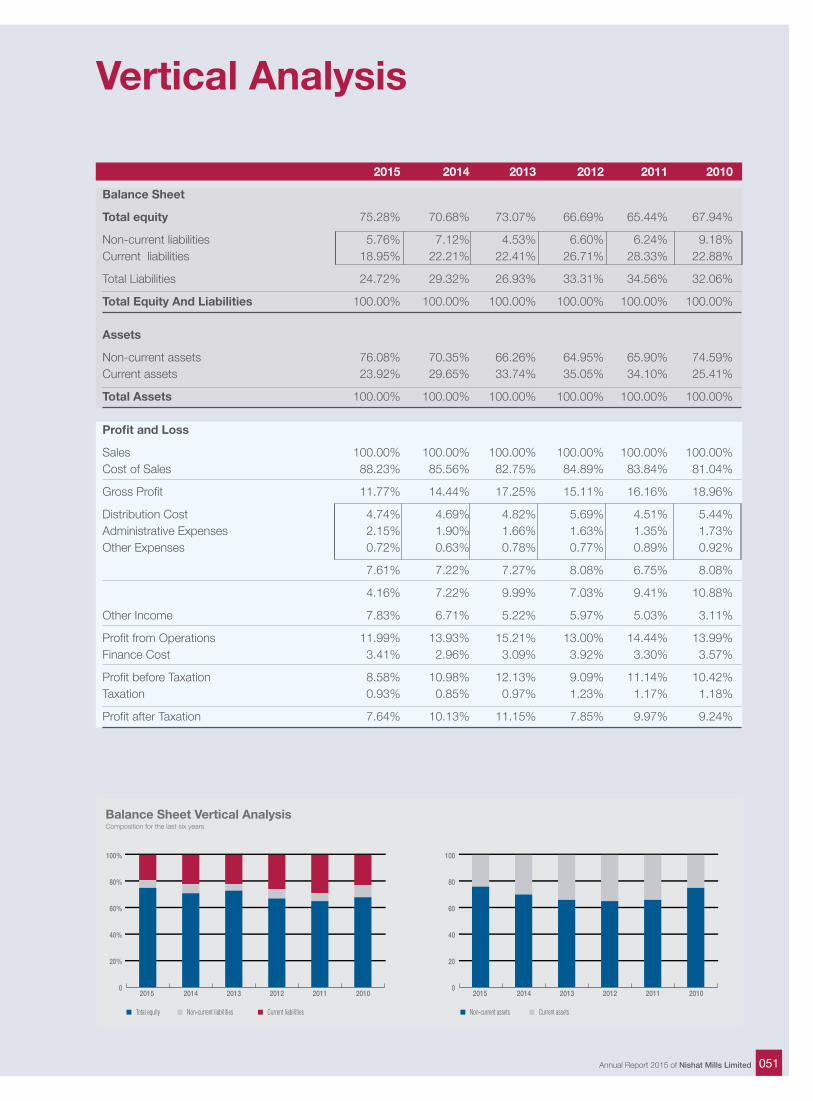
2015 2014 2013 2012 2011 2010
Balance Sheet
Total equity 75.28% 70.68% 73.07% 66.69% 65.44% 67.94%
Non-current liabilities 5.76% 7.12% 4.53% 6.60% 6.24% 9.18%Current liabilities 18.95% 22.21% 22.41% 26.71% 28.33% 22.88%
Total Liabilities 24.72% 29.32% 26.93% 33.31% 34.56% 32.06%
Total Equity And Liabilities 100.00% 100.00% 100.00% 100.00% 100.00% 100.00%
Assets
Non-current assets 76.08% 70.35% 66.26% 64.95% 65.90% 74.59%Current assets 23.92% 29.65% 33.74% 35.05% 34.10% 25.41%
Total Assets 100.00% 100.00% 100.00% 100.00% 100.00% 100.00% Profit and Loss
Sales 100.00% 100.00% 100.00% 100.00% 100.00% 100.00%Cost of Sales 88.23% 85.56% 82.75% 84.89% 83.84% 81.04%
Gross Profit 11.77% 14.44% 17.25% 15.11% 16.16% 18.96%
Distribution Cost 4.74% 4.69% 4.82% 5.69% 4.51% 5.44%Administrative Expenses 2.15% 1.90% 1.66% 1.63% 1.35% 1.73%Other Expenses 0.72% 0.63% 0.78% 0.77% 0.89% 0.92%
7.61% 7.22% 7.27% 8.08% 6.75% 8.08%
4.16% 7.22% 9.99% 7.03% 9.41% 10.88%
Other Income 7.83% 6.71% 5.22% 5.97% 5.03% 3.11%
Profit from Operations 11.99% 13.93% 15.21% 13.00% 14.44% 13.99%Finance Cost 3.41% 2.96% 3.09% 3.92% 3.30% 3.57%
Profit before Taxation 8.58% 10.98% 12.13% 9.09% 11.14% 10.42%Taxation 0.93% 0.85% 0.97% 1.23% 1.17% 1.18%
Profit after Taxation 7.64% 10.13% 11.15% 7.85% 9.97% 9.24%
Total equity
0
20%
40%
60%
80%
100%
2014 2013 2012 2011 201020152014 2013 2012 2011 201020150
20
40
60
80
100
Non-current liabilities Current liabilities Non-current assets Current assets
Balance Sheet Vertical AnalysisComposition for the last six years
Vertical Analysis
051Annual Report 2015 of Nishat Mills Limited
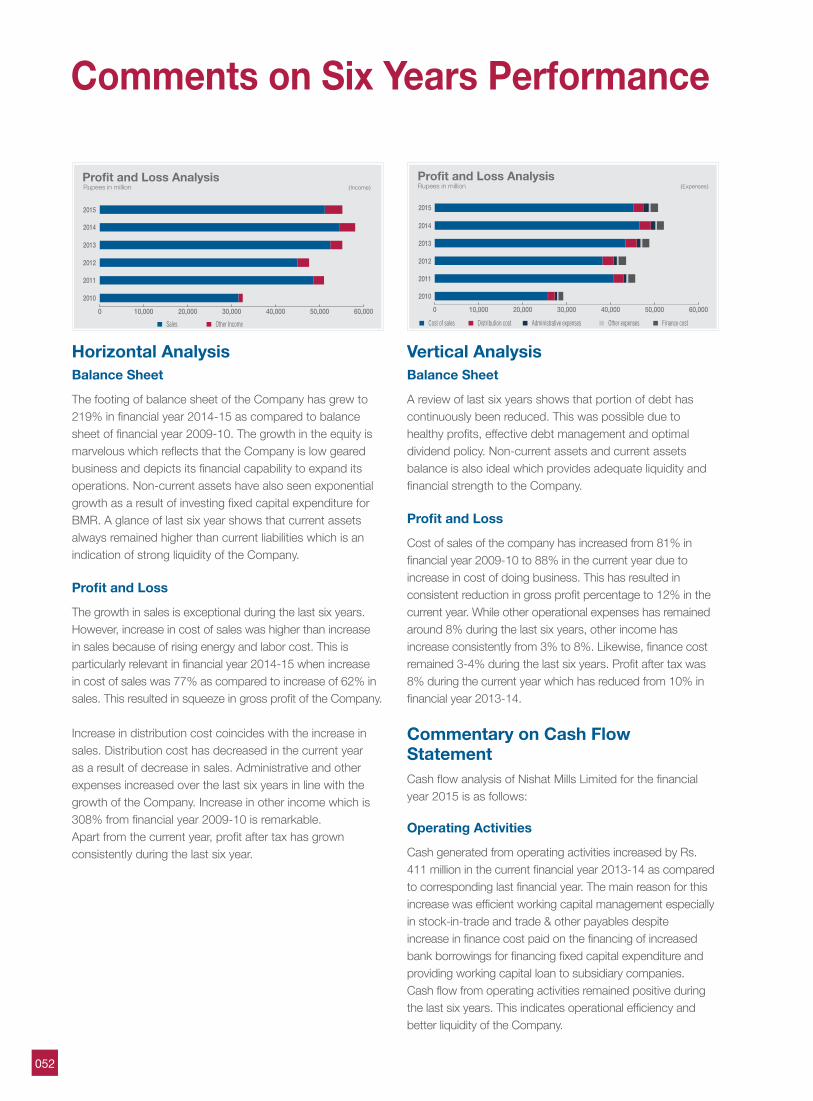
Comments on Six Years Performance
Horizontal AnalysisBalance Sheet
The footing of balance sheet of the Company has grew to 219% in financial year 2014-15 as compared to balance sheet of financial year 2009-10. The growth in the equity is marvelous which reflects that the Company is low geared business and depicts its financial capability to expand its operations. Non-current assets have also seen exponential growth as a result of investing fixed capital expenditure for BMR. A glance of last six year shows that current assets always remained higher than current liabilities which is an indication of strong liquidity of the Company.
Profit and Loss
The growth in sales is exceptional during the last six years. However, increase in cost of sales was higher than increase in sales because of rising energy and labor cost. This is particularly relevant in financial year 2014-15 when increase in cost of sales was 77% as compared to increase of 62% in sales. This resulted in squeeze in gross profit of the Company.
Increase in distribution cost coincides with the increase in sales. Distribution cost has decreased in the current year as a result of decrease in sales. Administrative and other expenses increased over the last six years in line with the growth of the Company. Increase in other income which is 308% from financial year 2009-10 is remarkable. Apart from the current year, profit after tax has grown consistently during the last six year.
Vertical AnalysisBalance Sheet
A review of last six years shows that portion of debt has continuously been reduced. This was possible due to healthy profits, effective debt management and optimal dividend policy. Non-current assets and current assets balance is also ideal which provides adequate liquidity and financial strength to the Company.
Profit and Loss
Cost of sales of the company has increased from 81% in financial year 2009-10 to 88% in the current year due to increase in cost of doing business. This has resulted in consistent reduction in gross profit percentage to 12% in the current year. While other operational expenses has remained around 8% during the last six years, other income has increase consistently from 3% to 8%. Likewise, finance cost remained 3-4% during the last six years. Profit after tax was 8% during the current year which has reduced from 10% in financial year 2013-14.
Commentary on Cash Flow StatementCash flow analysis of Nishat Mills Limited for the financial year 2015 is as follows:
Operating Activities
Cash generated from operating activities increased by Rs. 411 million in the current financial year 2013-14 as compared to corresponding last financial year. The main reason for this increase was efficient working capital management especially in stock-in-trade and trade & other payables despite increase in finance cost paid on the financing of increased bank borrowings for financing fixed capital expenditure and providing working capital loan to subsidiary companies. Cash flow from operating activities remained positive during the last six years. This indicates operational efficiency and better liquidity of the Company.
Profit and Loss AnalysisRupees in million (Expenses)
2014
2015
2013
2012
2011
2010
0 10,000 20,000 30,000 40,000 50,000 60,000
Cost of sales Distribution cost Administrative expenses Other expenses Finance cost
2014
2015
2013
2012
2011
2010
0 10,000 20,000 30,000 40,000 50,000 60,000Sales Other Income
Profit and Loss AnalysisRupees in million (Income)
052
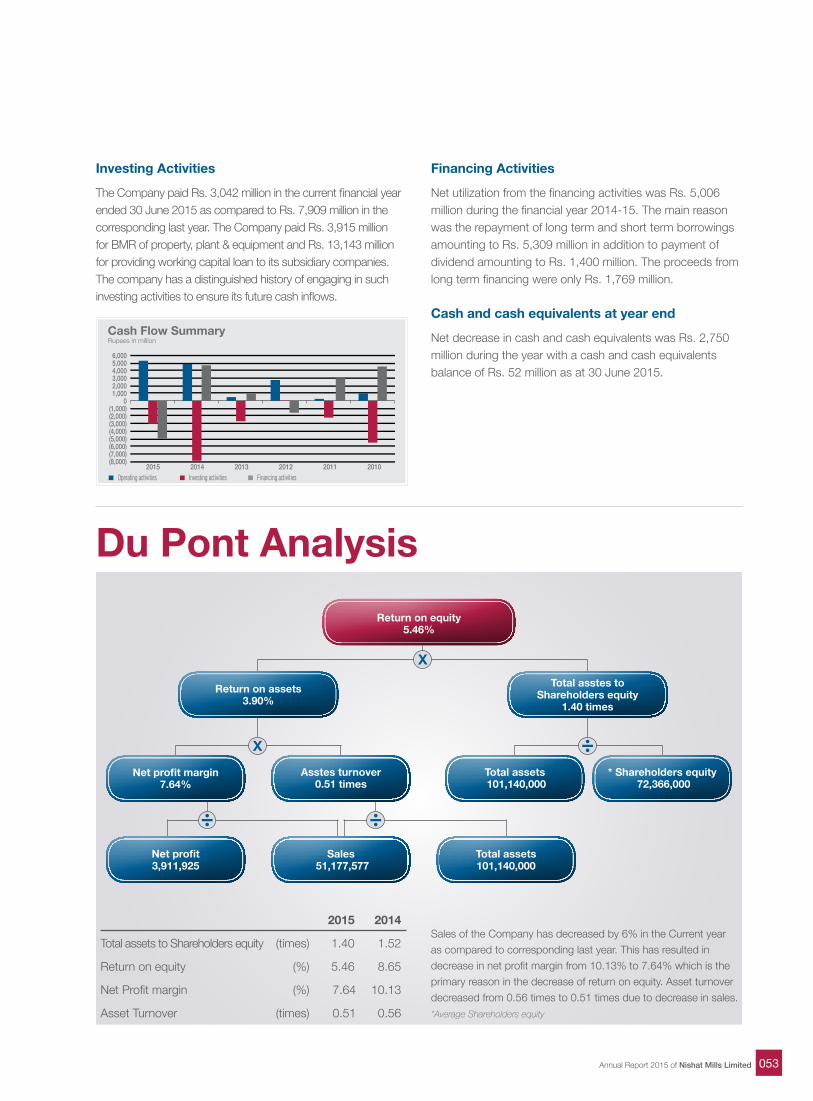
Du Pont Analysis
Cash Flow SummaryRupees in million
2015 2014 2013 2012 2011 2010(8,000)(7,000)(6,000)(5,000)(4,000)(3,000)(2,000)(1,000)
01,0002,0003,0004,0005,0006,000
Operating activities Investing activities Financing activities
Investing Activities
The Company paid Rs. 3,042 million in the current financial year ended 30 June 2015 as compared to Rs. 7,909 million in the corresponding last year. The Company paid Rs. 3,915 million for BMR of property, plant & equipment and Rs. 13,143 million for providing working capital loan to its subsidiary companies. The company has a distinguished history of engaging in such investing activities to ensure its future cash inflows.
Financing Activities
Net utilization from the financing activities was Rs. 5,006 million during the financial year 2014-15. The main reason was the repayment of long term and short term borrowings amounting to Rs. 5,309 million in addition to payment of dividend amounting to Rs. 1,400 million. The proceeds from long term financing were only Rs. 1,769 million.
Cash and cash equivalents at year end
Net decrease in cash and cash equivalents was Rs. 2,750 million during the year with a cash and cash equivalents balance of Rs. 52 million as at 30 June 2015.
Return on equity5.46%
Return on assets3.90%
Total asstes toShareholders equity
1.40 times
* Shareholders equity 72,366,000
Total assets 101,140,000
Asstes turnover0.51 times
Net profit margin7.64%
Net profit3,911,925
Sales 51,177,577
Total assets101,140,000
Sales of the Company has decreased by 6% in the Current year as compared to corresponding last year. This has resulted in decrease in net profit margin from 10.13% to 7.64% which is the primary reason in the decrease of return on equity. Asset turnover decreased from 0.56 times to 0.51 times due to decrease in sales.*Average Shareholders equity
2015 2014
Total assets to Shareholders equity (times) 1.40 1.52
Return on equity (%) 5.46 8.65
Net Profit margin (%) 7.64 10.13
Asset Turnover (times) 0.51 0.56
053Annual Report 2015 of Nishat Mills Limited
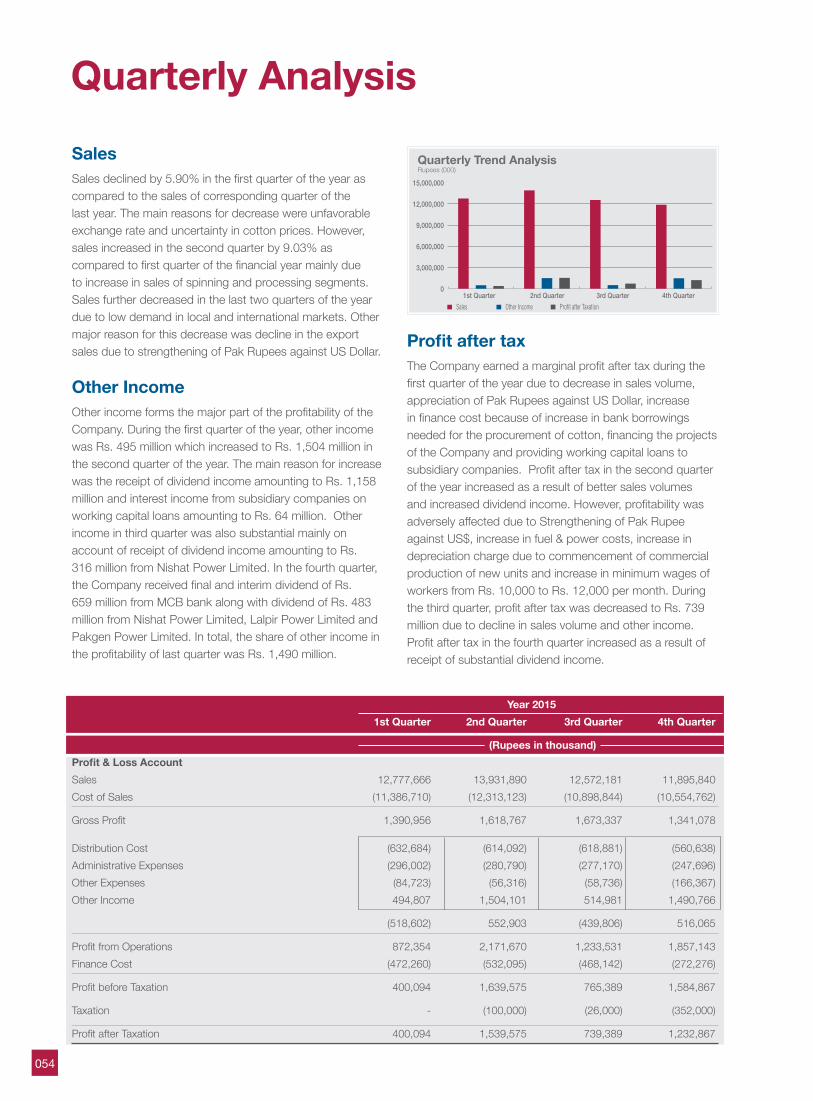
Quarterly AnalysisSalesSales declined by 5.90% in the first quarter of the year as compared to the sales of corresponding quarter of the last year. The main reasons for decrease were unfavorable exchange rate and uncertainty in cotton prices. However, sales increased in the second quarter by 9.03% as compared to first quarter of the financial year mainly due to increase in sales of spinning and processing segments. Sales further decreased in the last two quarters of the year due to low demand in local and international markets. Other major reason for this decrease was decline in the export sales due to strengthening of Pak Rupees against US Dollar. Other IncomeOther income forms the major part of the profitability of the Company. During the first quarter of the year, other income was Rs. 495 million which increased to Rs. 1,504 million in the second quarter of the year. The main reason for increase was the receipt of dividend income amounting to Rs. 1,158 million and interest income from subsidiary companies on working capital loans amounting to Rs. 64 million. Other income in third quarter was also substantial mainly on account of receipt of dividend income amounting to Rs. 316 million from Nishat Power Limited. In the fourth quarter, the Company received final and interim dividend of Rs. 659 million from MCB bank along with dividend of Rs. 483 million from Nishat Power Limited, Lalpir Power Limited and Pakgen Power Limited. In total, the share of other income in the profitability of last quarter was Rs. 1,490 million.
Profit after taxThe Company earned a marginal profit after tax during the first quarter of the year due to decrease in sales volume, appreciation of Pak Rupees against US Dollar, increase in finance cost because of increase in bank borrowings needed for the procurement of cotton, financing the projects of the Company and providing working capital loans to subsidiary companies. Profit after tax in the second quarter of the year increased as a result of better sales volumes and increased dividend income. However, profitability was adversely affected due to Strengthening of Pak Rupee against US$, increase in fuel & power costs, increase in depreciation charge due to commencement of commercial production of new units and increase in minimum wages of workers from Rs. 10,000 to Rs. 12,000 per month. During the third quarter, profit after tax was decreased to Rs. 739 million due to decline in sales volume and other income. Profit after tax in the fourth quarter increased as a result of receipt of substantial dividend income.
Year 2015 1st Quarter 2nd Quarter 3rd Quarter 4th Quarter
(Rupees in thousand)Profit & Loss Account Sales 12,777,666 13,931,890 12,572,181 11,895,840Cost of Sales (11,386,710) (12,313,123) (10,898,844) (10,554,762)
Gross Profit 1,390,956 1,618,767 1,673,337 1,341,078 Distribution Cost (632,684) (614,092) (618,881) (560,638)Administrative Expenses (296,002) (280,790) (277,170) (247,696)Other Expenses (84,723) (56,316) (58,736) (166,367)Other Income 494,807 1,504,101 514,981 1,490,766
(518,602) 552,903 (439,806) 516,065
Profit from Operations 872,354 2,171,670 1,233,531 1,857,143Finance Cost (472,260) (532,095) (468,142) (272,276)
Profit before Taxation 400,094 1,639,575 765,389 1,584,867
Taxation - (100,000) (26,000) (352,000)
Profit after Taxation 400,094 1,539,575 739,389 1,232,867
Quarterly Trend AnalysisRupees (000)
Sales Other Income Profit after Taxation
1st Quarter 2nd Quarter 3rd Quarter 4th Quarter0
3,000,000
6,000,000
9,000,000
12,000,000
15,000,000
054
Share Price Senstivity Analysis
The performance of Nishat Mills Limited (“the Company”) is affected by many internal and external factors which influence the profitability of the Company. As a result of change in the bottom line, the Company’s share price eventually fluctuates. Following are some of the factors that can affect the share price of the Company:
Exchange Rate:Nishat Mills Limited is an export oriented company which makes it vulnerable to currency risk. Fluctuation in exchange rate highly affects the profitability of the company. The Company’s profitability is negatively correlated with PKR, if PKR depreciate/appreciate against USD, company profitability increase/decrease accordingly. So the Company’s share price is highly sensitive with exchange rate.
Cotton Prices:Cotton is the basic raw material of the textile industry. Due to local or international factors, the price of cotton can fluctuate which affects the profitability and share price of the company.
Energy Prices:Power is the second largest manufacturing cost of the textile sector. Change in tariff of electricity and gas has a major effect on the Company’s profitability. If tariff increases substantially, share price can go down.
International and Local Regulations:Nishat Mills limited is biggest textile exporting unit of the country. Export is highly regulated, so international or local regulation can affect company ability to export its products which can eventually affect company profitability. Positive changes in regulations like GSP Plus status, subsidized short term and long term finance interest rates, duty draw back and zero sales tax on exports will have a positive impact on share price.
Political Stability and Law & Order Situation:Political stability and effective law & order situation in the country is essential for economic development. Domestic and foreign investment highly depends on both political and law & order situation. Any instability in both can badly affect economic situation of country as well as of the Company.
Expansion Projects:Expansion in new projects and diversification in the product line of the Company positively impact the share price of the Company.
055Annual Report 2015 of Nishat Mills Limited
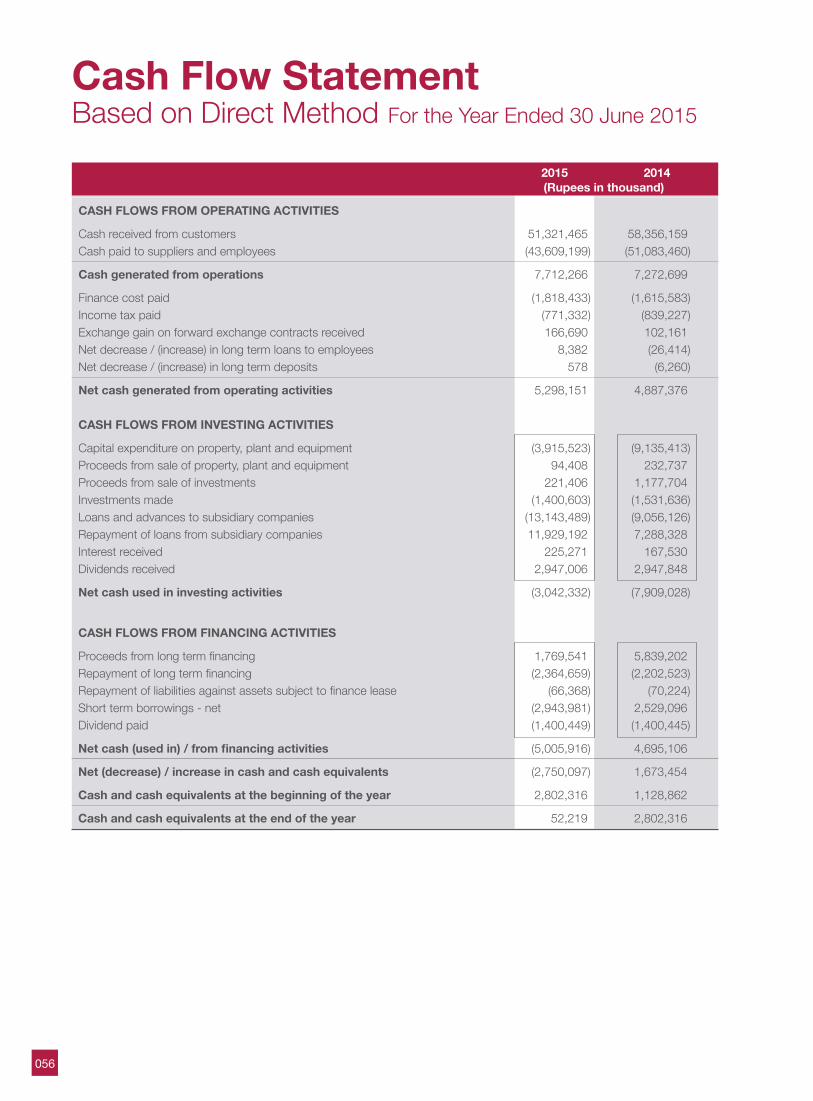
Cash Flow StatementBased on Direct Method For the Year Ended 30 June 2015
2015 2014 (Rupees in thousand)
CASH FLOWS FROM OPERATING ACTIVITIES
Cash received from customers 51,321,465 58,356,159Cash paid to suppliers and employees (43,609,199) (51,083,460)
Cash generated from operations 7,712,266 7,272,699
Finance cost paid (1,818,433) (1,615,583)Income tax paid (771,332) (839,227)Exchange gain on forward exchange contracts received 166,690 102,161 Net decrease / (increase) in long term loans to employees 8,382 (26,414)Net decrease / (increase) in long term deposits 578 (6,260)
Net cash generated from operating activities 5,298,151 4,887,376 CASH FLOWS FROM INVESTING ACTIVITIES
Capital expenditure on property, plant and equipment (3,915,523) (9,135,413)Proceeds from sale of property, plant and equipment 94,408 232,737 Proceeds from sale of investments 221,406 1,177,704 Investments made (1,400,603) (1,531,636)Loans and advances to subsidiary companies (13,143,489) (9,056,126)Repayment of loans from subsidiary companies 11,929,192 7,288,328 Interest received 225,271 167,530 Dividends received 2,947,006 2,947,848
Net cash used in investing activities (3,042,332) (7,909,028)
CASH FLOWS FROM FINANCING ACTIVITIES
Proceeds from long term financing 1,769,541 5,839,202 Repayment of long term financing (2,364,659) (2,202,523)Repayment of liabilities against assets subject to finance lease (66,368) (70,224)Short term borrowings - net (2,943,981) 2,529,096 Dividend paid (1,400,449) (1,400,445)
Net cash (used in) / from financing activities (5,005,916) 4,695,106
Net (decrease) / increase in cash and cash equivalents (2,750,097) 1,673,454
Cash and cash equivalents at the beginning of the year 2,802,316 1,128,862
Cash and cash equivalents at the end of the year 52,219 2,802,316
056
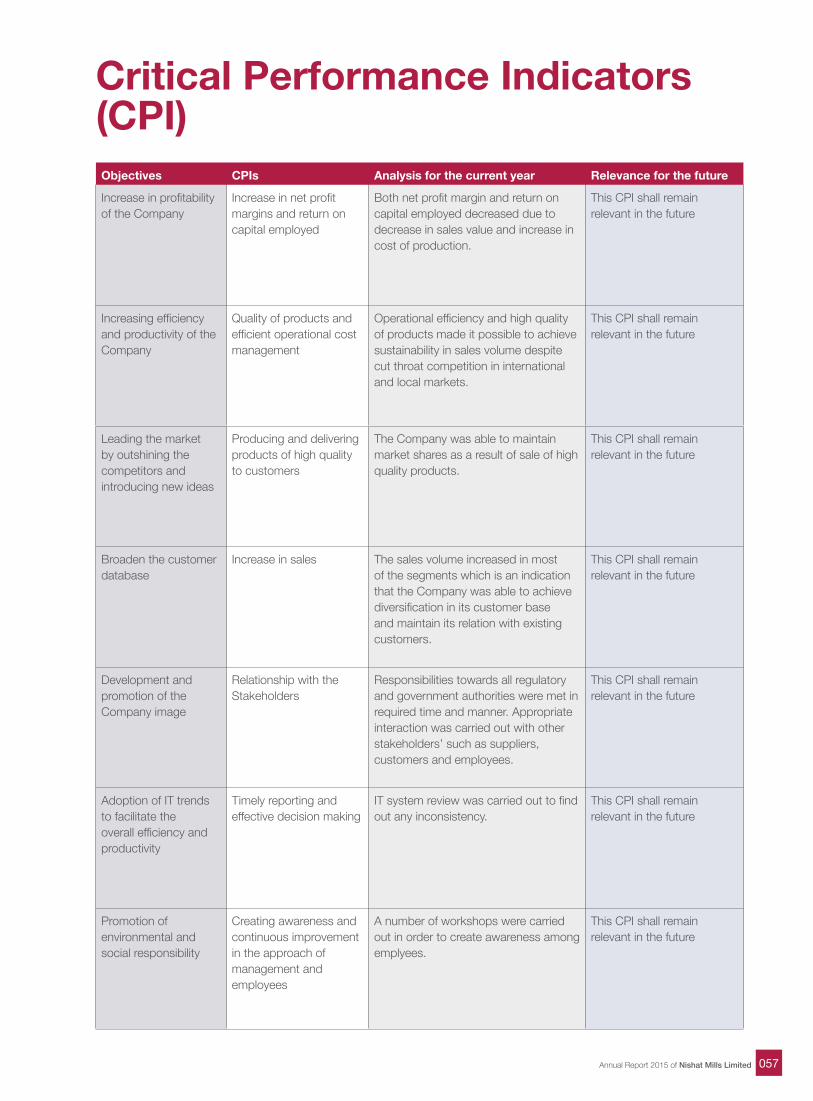
Critical Performance Indicators (CPI)Objectives CPIs Analysis for the current year Relevance for the future
Increase in profitabilityof the Company
Increase in net profit margins and return on capital employed
Both net profit margin and return on capital employed decreased due to decrease in sales value and increase in cost of production.
This CPI shall remain relevant in the future
Increasing efficiencyand productivity of theCompany
Quality of products andefficient operational costmanagement
Operational efficiency and high quality of products made it possible to achieve sustainability in sales volume despite cut throat competition in international and local markets.
This CPI shall remain relevant in the future
Leading the marketby outshining thecompetitors andintroducing new ideas
Producing and delivering products of high quality to customers
The Company was able to maintain market shares as a result of sale of high quality products.
This CPI shall remainrelevant in the future
Broaden the customerdatabase
Increase in sales The sales volume increased in most of the segments which is an indication that the Company was able to achieve diversification in its customer base and maintain its relation with existing customers.
This CPI shall remainrelevant in the future
Development andpromotion of theCompany image
Relationship with theStakeholders
Responsibilities towards all regulatory and government authorities were met in required time and manner. Appropriate interaction was carried out with other stakeholders’ such as suppliers, customers and employees.
This CPI shall remainrelevant in the future
Adoption of IT trendsto facilitate theoverall efficiency andproductivity
Timely reporting andeffective decision making
IT system review was carried out to find out any inconsistency.
This CPI shall remainrelevant in the future
Promotion ofenvironmental andsocial responsibility
Creating awareness andcontinuous improvementin the approach ofmanagement andemployees
A number of workshops were carried out in order to create awareness among emplyees.
This CPI shall remainrelevant in the future
057Annual Report 2015 of Nishat Mills Limited
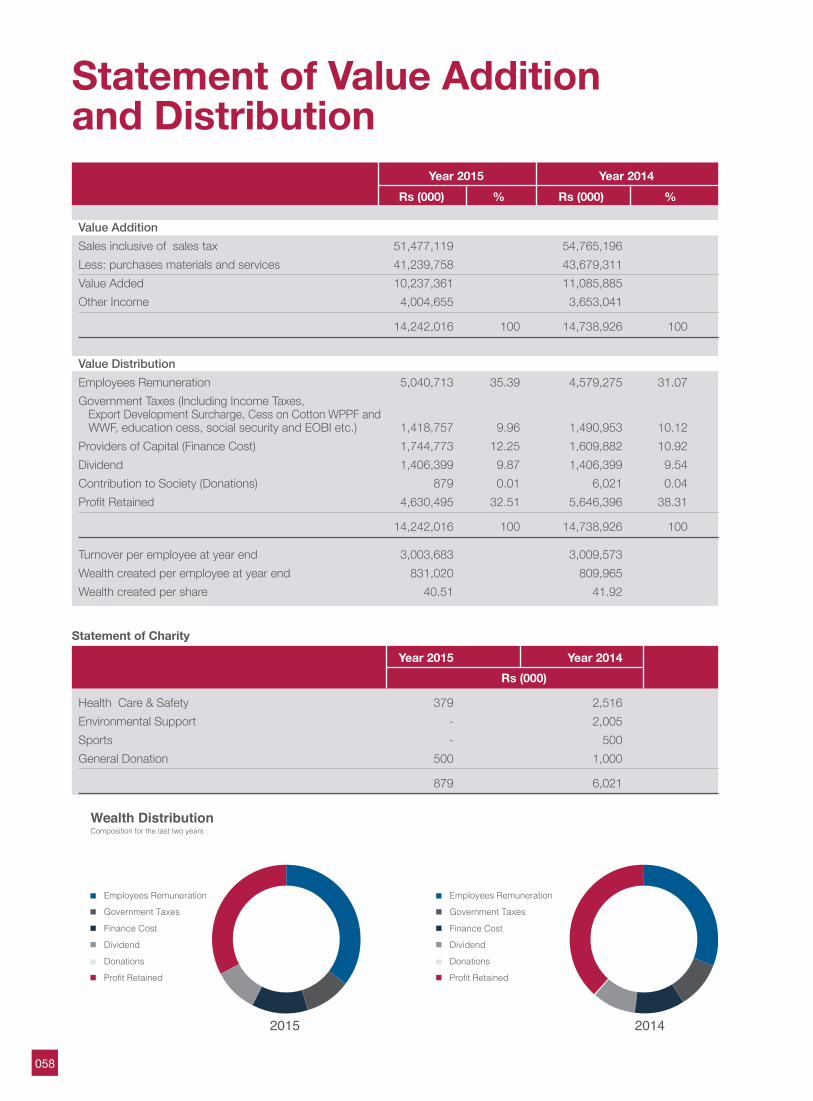
Statement of Value Additionand Distribution Year 2015 Year 2014 Rs (000) % Rs (000) %
Value Addition Sales inclusive of sales tax 51,477,119 54,765,196 Less: purchases materials and services 41,239,758 43,679,311 Value Added 10,237,361 11,085,885 Other Income 4,004,655 3,653,041
14,242,016 100 14,738,926 100 Value Distribution Employees Remuneration 5,040,713 35.39 4,579,275 31.07 Government Taxes (Including Income Taxes, Export Development Surcharge, Cess on Cotton WPPF and WWF, education cess, social security and EOBI etc.) 1,418,757 9.96 1,490,953 10.12 Providers of Capital (Finance Cost) 1,744,773 12.25 1,609,882 10.92 Dividend 1,406,399 9.87 1,406,399 9.54 Contribution to Society (Donations) 879 0.01 6,021 0.04 Profit Retained 4,630,495 32.51 5,646,396 38.31
14,242,016 100 14,738,926 100
Turnover per employee at year end 3,003,683 3,009,573 Wealth created per employee at year end 831,020 809,965 Wealth created per share 40.51 41.92
2014
Employees Remuneration
Government Taxes
Finance Cost
Dividend
Donations
Profit Retained
Employees Remuneration
Government Taxes
Finance Cost
Dividend
Donations
Profit Retained
2015
Wealth DistributionComposition for the last two years
Year 2015 Year 2014 Rs (000)
Health Care & Safety 379 2,516 Environmental Support - 2,005 Sports - 500 General Donation 500 1,000
879 6,021
Statement of Charity
058
059Annual Report 2015 of Nishat Mills Limited
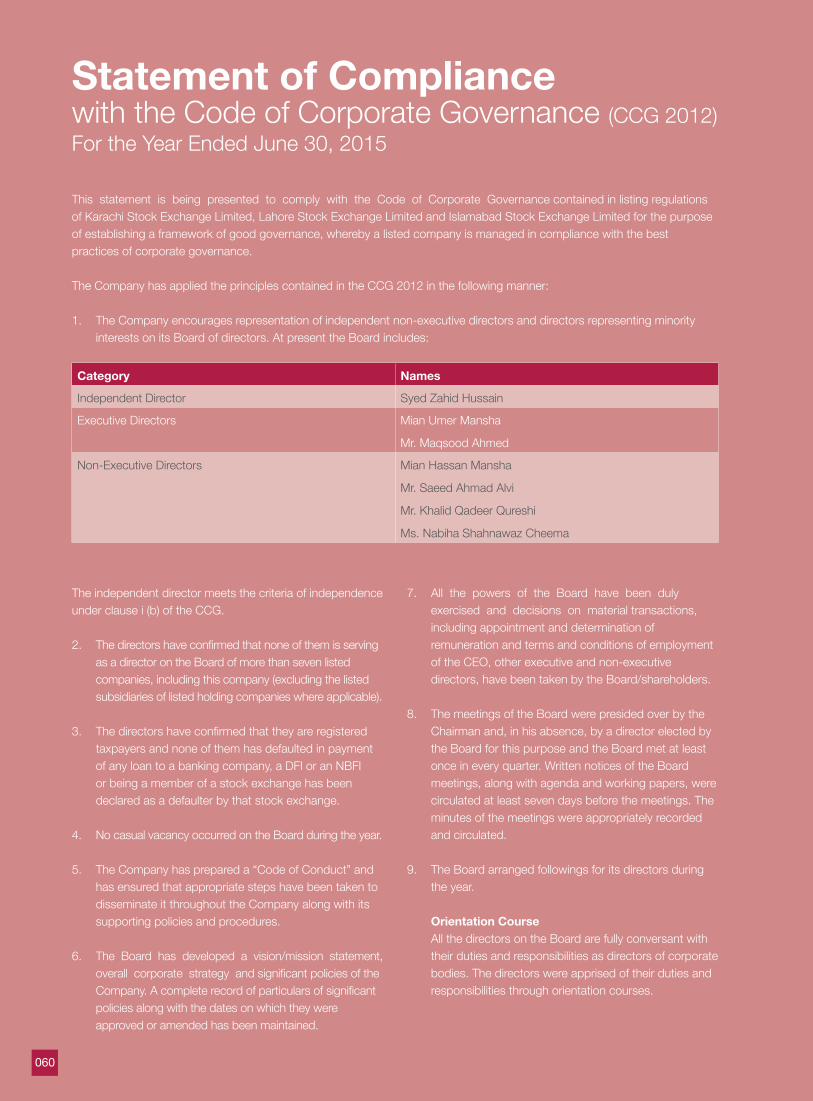
Statement of Compliancewith the Code of Corporate Governance (CCG 2012)For the Year Ended June 30, 2015
This statement is being presented to comply with the Code of Corporate Governance contained in listing regulations of Karachi Stock Exchange Limited, Lahore Stock Exchange Limited and Islamabad Stock Exchange Limited for the purpose of establishing a framework of good governance, whereby a listed company is managed in compliance with the best practices of corporate governance.
The Company has applied the principles contained in the CCG 2012 in the following manner:
1. The Company encourages representation of independent non-executive directors and directors representing minority interests on its Board of directors. At present the Board includes:
Category Names
Independent Director Syed Zahid Hussain
Executive Directors Mian Umer Mansha
Mr. Maqsood Ahmed
Non-Executive Directors Mian Hassan Mansha
Mr. Saeed Ahmad Alvi
Mr. Khalid Qadeer Qureshi
Ms. Nabiha Shahnawaz Cheema
The independent director meets the criteria of independence under clause i (b) of the CCG.
2. The directors have confirmed that none of them is serving as a director on the Board of more than seven listed companies, including this company (excluding the listed subsidiaries of listed holding companies where applicable).
3. The directors have confirmed that they are registered taxpayers and none of them has defaulted in payment of any loan to a banking company, a DFI or an NBFI or being a member of a stock exchange has been declared as a defaulter by that stock exchange.
4. No casual vacancy occurred on the Board during the year.
5. The Company has prepared a “Code of Conduct” and has ensured that appropriate steps have been taken to disseminate it throughout the Company along with its supporting policies and procedures.
6. The Board has developed a vision/mission statement, overall corporate strategy and significant policies of the Company. A complete record of particulars of significant policies along with the dates on which they were approved or amended has been maintained.
7. All the powers of the Board have been duly exercised and decisions on material transactions, including appointment and determination of remuneration and terms and conditions of employment of the CEO, other executive and non-executive directors, have been taken by the Board/shareholders.
8. The meetings of the Board were presided over by the Chairman and, in his absence, by a director elected by the Board for this purpose and the Board met at least once in every quarter. Written notices of the Board meetings, along with agenda and working papers, were circulated at least seven days before the meetings. The minutes of the meetings were appropriately recorded and circulated.
9. The Board arranged followings for its directors during the year.
Orientation CourseAll the directors on the Board are fully conversant with their duties and responsibilities as directors of corporate bodies. The directors were apprised of their duties and responsibilities through orientation courses.
060
Directors’ Training Program(i) Three (3) Directors of the Company are exempt due to
14 years of education and 15 years of experience on the Board of a listed company.
(ii) Three directors Mr. Saeed Ahmad Alvi, Ms. Nabiha Shahnawaz Cheema and Mr. Maqsood Ahmad have completed the directors training program.
10. No new appointments of CFO, Company Secretary and Head of Internal Audit, has been approved by the Board. The remuneration of CFO and Head of Internal Audit was revised during the year after due approval of the Board.
11. The directors’ report for this year has been prepared in compliance with the requirements of the CCG and fully describes the salient matters required to be disclosed.
12. The financial statements of the Company were duly endorsed by CEO and CFO before approval of the Board.
13. The directors, CEO and executives do not hold any interest in the shares of the Company other than that disclosed in the pattern of shareholding.
14. The Company has complied with all the corporate and financial reporting requirements of the CCG.
15. The Board has formed an Audit Committee. It comprises 3 members, of whom 2 are non-executive directors and one is independent director.
16. The meetings of the Audit Committee were held at least once every quarter prior to approval of interim and final results of the company and as required by the CCG. The terms of reference of the committee have been formed and advised to the committee for compliance.
17. The Board has formed an HR and Remuneration Committee. It comprises 4 members, of whom 3 are non-executive directors and the chairman of the committee is also a non-executive director.
18. The Board has set up an effective internal audit function and the members of internal audit function are considered suitably qualified and experienced for the purpose and are conversant with the policies and procedures of the Company.
19. The statutory auditors of the Company have confirmed that they have been given a satisfactory rating under the quality control review program of the ICAP, that they or any of the partners of the firm, their spouses and minor children do not hold shares of the Company and that the firm and all its partners are in compliance with International Federation of Accountants (IFAC) guidelines on code of ethics as adopted by the ICAP.
20. The statutory auditors or the persons associated with them have not been appointed to provide other services except in accordance with the listing regulations and the auditors have confirmed that they have observed IFAC guidelines in this regard.
21. The ‘closed period’, prior to the announcement of interim/final results, and business decisions, which may materially affect the market price of the Company’s securities, was determined and intimated to directors, employees and stock exchange(s).
22. Material/price sensitive information has been disseminated among all market participants at once through stock exchange(s).
23. We confirm that all other material requirements of the CCG 2012 have been complied with.
Mian Umer ManshaChief Executive OfficerNIC Number: 35202-0842523-5
27 October 2015Lahore
061Annual Report 2015 of Nishat Mills Limited
Review Report to the Memberson the Statement of Compliance withThe Code of Corporate Governance
We have reviewed the enclosed Statement of Compliance with the best practices contained in the Code of Corporate Governance (“the Code”) prepared by the Board of Directors of NISHAT MILLS LIMITED (“the Company”) for the year ended 30 June 2015 to comply with the requirements of Listing Regulation No. 35 of the Karachi, Lahore and Islamabad Stock Exchanges where the Company is listed.
The responsibility for compliance with the Code is that of the Board of Directors of the Company. Our responsibility is to review, to the extent where such compliance can be objectively verified, whether the Statement of Compliance reflects the status of the Company’s compliance with the provisions of the Code and report if it does not and to highlight any non-compliance with the requirements of the Code. A review is limited primarily to inquiries of the Company’s personnel and review of various documents prepared by the Company to comply with the Code.
As a part of our audit of the financial statements we are required to obtain an understanding of the accounting and internal control systems sufficient to plan the audit and develop an effective audit approach. We are not required to consider whether the Board of Directors’ statement on internal control covers all risks and controls or to form an opinion on the effectiveness of such internal controls, the Company’s corporate governance procedures and risks.
The Code requires the Company to place before the Audit Committee, and upon recommendation of the Audit Committee, place before the Board of Directors for their review and approval its related party transactions distinguishing between transactions carried out on terms equivalent to those that prevail in arm’s length transactions and transactions which are not executed at arm’s length price and recording proper justification for using such
alternate pricing mechanism. We are only required and have ensured compliance of this requirement to the extent of the approval of the related party transactions by the Board of Directors upon recommendation of the Audit Committee. We have not carried out any procedures to determine whether the related party transactions were undertaken at arm’s length price or not.
Based on our review, nothing has come to our attention which causes us to believe that the Statement of Compliance does not appropriately reflect the Company’s compliance, in all material respects, with the best practices contained in the Code as applicable to the Company for the year ended 30 June 2015.
Riaz Ahmad & Company Chartered Accountants
Name of engagement partner: Muhammad Atif Mirza
27 October 2015 Lahore
062
Notice of Annual General Meeting
Notice is hereby given that Annual General Meeting of the Shareholders of Nishat Mills Limited (“the Company”) will be held on November 30, 2015 (Monday) at 11:00 A.M. at Nishat Hotel, 9-A, Gulberg III, Mian Mahmood Ali Kasuri Road, Lahore to transact the following business:
1. To receive, consider and adopt the Audited Unconsolidated and Consolidated Financial Statements of the Company for the year ended June 30, 2015 together with the Directors’ and Auditors’ reports thereon.
2. To approve Final Cash Dividend @ 45% (i.e. Rs. 4.50/- Only Per Share) for the year ended 30 June 2015, as recommended by the Board of Directors.
3. To appoint statutory Auditors for the year ending June 30, 2016 and fix their remuneration.
By Order of the BoardKhalid Mahmood Chohan Company Secretary
27 October 2015 Lahore
Notes:1. Book Closure Notice The Ordinary Shares Transfer Books of the Company
will remain closed from 24-11-2015 to 30-11-2015 (both days inclusive) for entitlement of 45% Final Cash Dividend ( i.e. Rs. 4.50/- Per Share) and attending and voting at Annual General Meeting. Physical transfers / CDS Transactions IDs received in order in all respect up to 1:00 p.m. on 23-11-2015 at Company’s Share Registrar, M/s THK Associates (Private) Limited, Karachi Office, Ground Floor, State Life Building No. 3, Dr. Zia Uddin Ahmed Road, Karachi, Lahore Office, THK Associates (Private) Ltd. 2nd Floor, DYL Motorcycles Limited Office Building, Plot No. 346 Block No. G-III, Khokar Chowk, Main Boulevard, Johar Town, Lahore, will be considered in time for entitlement of 45% Final Cash Dividend and attending of meeting.
2. A member eligible to attend and vote at this meeting may appoint another member his / her proxy to attend and vote instead of him / her. Proxies in order to be effective must reach the Company’s registered office not less than 48 hours before the time for holding the meeting. Proxies of the Members through CDC shall be accompanied with attested copies of their Computerized National Identity Card (CNIC). In case of corporate entity, the Board’s Resolution / power of attorney with specimen signature shall be furnished along with proxy form to the Company. The shareholders through CDC are requested to bring original CNIC, Account Number
and Participant Account Number to produce at the time of attending the meeting.
3. Shareholders are requested to immediately notify the change in address, if any.
4. Submission of copy of CNIC (Mandatory) The Securities and Exchange Commission of Pakistan
(SECP) vide their S.R.O. 779 (I) 2011 dated August 18, 2011 has directed the company to print your Computerized National Identity Card (CNIC) number on your dividend warrants and if your CNIC number is not available in our records, your dividend warrant will not be issued / dispatched to you. In order to comply with this regulatory requirement, you are requested to kindly send photocopy of your CNIC to your Participant / Investor Account Services or to us (in case of physical shareholding) immediately to Company’s Share Registrar, M/s THK Associates (Private) Limited.
5. Revision of Withholding Tax on dividend income under Section 150 of Finance Act 2014
It is further being informed that pursuant to the provisions of Finance Act 2014, effective from July 1, 2015 a new criteria for withholding of tax on dividend income has been introduced by Federal Board of Revenue (FBR), as per this criteria, ‘Filer’ and ‘Non-Filer’ shareholders will pay tax on dividend income @ 12.50% and 17.50% respectively.
063Annual Report 2015 of Nishat Mills Limited
You are therefore advised to check and ensure your Filer status from Active Tax Payer List (ATL) available at FBR website http://www.fbr.gov.pk/ as well as ensure that your CNIC / Passport number has been recorded by your Participant / Investor Account Services (in case your shareholding is in book entry form) or by Company’s Share Registrar M/s THK Associates (Pvt) Limited (in case of physical shareholding). Corporate bodies (non-Individual shareholders) should ensure that their names and National Tax Numbers (NTN) are available in Active Tax Payer List at FBR website and recorded by Participant / Investor Account Services or by Company’s Share Registrar (in case of physical shareholding).
6. Dividend Mandate (Optional) Under Section 250 of the Companies Ordinance, 1984
a shareholder may, if so desires, direct the Company to pay dividend through his / her / its bank account. In pursuance of the directions given by the Securities and Exchange Commission of Pakistan (SECP) vide Circular Number 18 of 2012 dated June 05, 2012, kindly authorize the company for direct credit of your cash dividend in your bank account (please note that giving bank mandate for dividend payments is optional, in case you do not wish to avail this facility please ignore this notice, dividend will be paid to you through dividend warrant at your registered address). If you want to avail the facility of direct credit of dividend amount in your bank account, please provide following information to Company’s Share Registrar, M/s THK Associates (Pvt) Limited.
Notice of Annual General Meeting (cont.)
Bank Account Details of Shareholder
Title of Bank Account
Bank Account Number
Bank’s name
Branch name and address
Cell number of shareholder
Landline number of shareholder, if any
It is stated that the above-mentioned information is correct and in case of any change therein, I / we will immediately intimate to the company and the concerned share registrar. _______________________________________________________________________________________________________________________
Name, signature, folio # and CNIC number of shareholder
Notes: (1) Those shareholders, who hold shares in book entry form in their CDS accounts, will provide the above dividend mandate information
directly to their respective Participant / CDC Investor Account Services Department.
(2) If dividend mandate information has already been provided by you, ignore this request.
7. Transmission of Annual Financial Statements Through Email
In pursuance of the directions given by the Securities and Exchange Commission of Pakistan (SECP) vide SRO 787 (I)/2014 dated September 8, 2014, those shareholders who desire to receive Annual Financial Statements in future through email instead of receiving the same by Post are advised to give their formal consent along with their valid email address on a standard request form which is available at the Company’s website i.e. www.nishatmillsltd.com and send the said form duly signed by the shareholder along with copy of his CNIC to the Company’s Share Registrar M/s THK Associates (Pvt) Limited. Please note that giving email address for receiving of Annual Financial Statements instead of receiving the same by post is optional, in case you do not wish to avail this facility please ignore this notice, Financial Statements will be sent to you at your registered address.
064
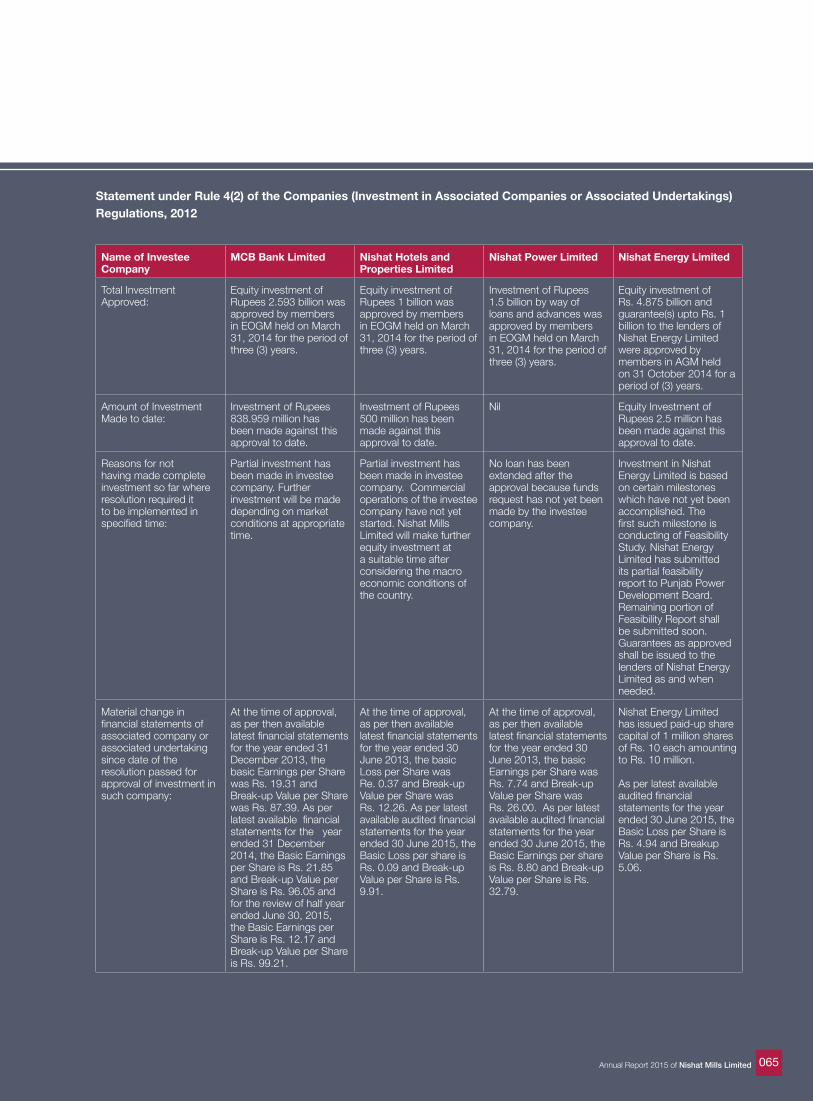
Statement under Rule 4(2) of the Companies (Investment in Associated Companies or Associated Undertakings) Regulations, 2012
Name of Investee Company
MCB Bank Limited Nishat Hotels and Properties Limited
Nishat Power Limited Nishat Energy Limited
Total Investment Approved:
Equity investment of Rupees 2.593 billion was approved by members in EOGM held on March 31, 2014 for the period of three (3) years.
Equity investment of Rupees 1 billion was approved by members in EOGM held on March 31, 2014 for the period of three (3) years.
Investment of Rupees 1.5 billion by way of loans and advances was approved by members in EOGM held on March 31, 2014 for the period of three (3) years.
Equity investment of Rs. 4.875 billion and guarantee(s) upto Rs. 1 billion to the lenders of Nishat Energy Limited were approved by members in AGM held on 31 October 2014 for a period of (3) years.
Amount of Investment Made to date:
Investment of Rupees 838.959 million has been made against this approval to date.
Investment of Rupees 500 million has been made against this approval to date.
Nil Equity Investment of Rupees 2.5 million has been made against this approval to date.
Reasons for not having made complete investment so far where resolution required it to be implemented in specified time:
Partial investment has been made in investee company. Further investment will be made depending on market conditions at appropriate time.
Partial investment has been made in investee company. Commercial operations of the investee company have not yet started. Nishat Mills Limited will make further equity investment at a suitable time after considering the macro economic conditions of the country.
No loan has been extended after the approval because funds request has not yet been made by the investee company.
Investment in Nishat Energy Limited is based on certain milestones which have not yet been accomplished. The first such milestone is conducting of Feasibility Study. Nishat Energy Limited has submitted its partial feasibility report to Punjab Power Development Board. Remaining portion of Feasibility Report shall be submitted soon. Guarantees as approved shall be issued to the lenders of Nishat Energy Limited as and when needed.
Material change in financial statements of associated company or associated undertaking since date of the resolution passed for approval of investment in such company:
At the time of approval, as per then available latest financial statements for the year ended 31 December 2013, the basic Earnings per Share was Rs. 19.31 and Break-up Value per Share was Rs. 87.39. As per latest available financial statements for the year ended 31 December 2014, the Basic Earnings per Share is Rs. 21.85 and Break-up Value per Share is Rs. 96.05 and for the review of half year ended June 30, 2015, the Basic Earnings per Share is Rs. 12.17 and Break-up Value per Share is Rs. 99.21.
At the time of approval, as per then available latest financial statements for the year ended 30 June 2013, the basic Loss per Share was Re. 0.37 and Break-up Value per Share was Rs. 12.26. As per latest available audited financial statements for the year ended 30 June 2015, the Basic Loss per share is Rs. 0.09 and Break-up Value per Share is Rs. 9.91.
At the time of approval, as per then available latest financial statements for the year ended 30 June 2013, the basic Earnings per Share was Rs. 7.74 and Break-up Value per Share was Rs. 26.00. As per latest available audited financial statements for the year ended 30 June 2015, the Basic Earnings per share is Rs. 8.80 and Break-up Value per Share is Rs. 32.79.
Nishat Energy Limited has issued paid-up share capital of 1 million shares of Rs. 10 each amounting to Rs. 10 million.
As per latest available audited financial statements for the year ended 30 June 2015, the Basic Loss per Share is Rs. 4.94 and Breakup Value per Share is Rs. 5.06.
065Annual Report 2015 of Nishat Mills Limited

066
67Annual Report 2015 of Nishat Mills Limited
Financial Statements ofNishat Mills Limitedfor the year ended June 30, 2015

68
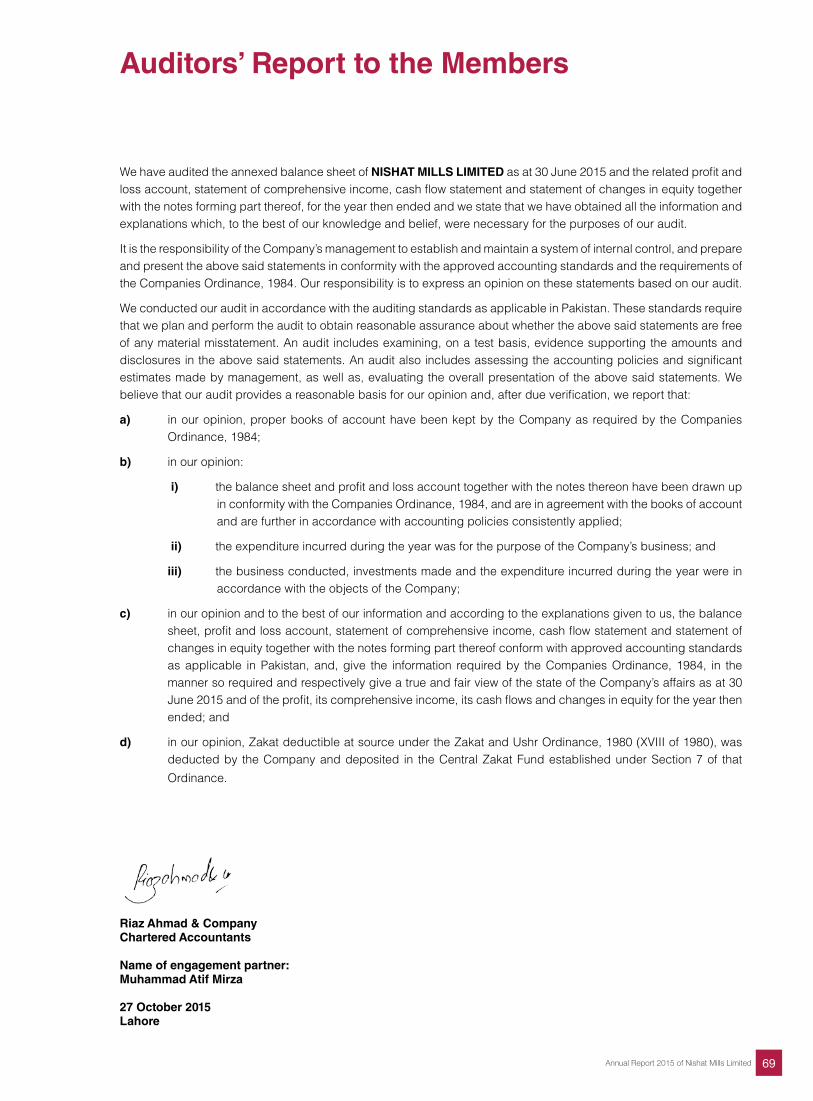
69Annual Report 2015 of Nishat Mills Limited
Auditors’ Report to the Members
We have audited the annexed balance sheet of NISHAT MILLS LIMITED as at 30 June 2015 and the related profit and loss account, statement of comprehensive income, cash flow statement and statement of changes in equity together with the notes forming part thereof, for the year then ended and we state that we have obtained all the information and explanations which, to the best of our knowledge and belief, were necessary for the purposes of our audit.
It is the responsibility of the Company’s management to establish and maintain a system of internal control, and prepare and present the above said statements in conformity with the approved accounting standards and the requirements of the Companies Ordinance, 1984. Our responsibility is to express an opinion on these statements based on our audit.
We conducted our audit in accordance with the auditing standards as applicable in Pakistan. These standards require that we plan and perform the audit to obtain reasonable assurance about whether the above said statements are free of any material misstatement. An audit includes examining, on a test basis, evidence supporting the amounts and disclosures in the above said statements. An audit also includes assessing the accounting policies and significant estimates made by management, as well as, evaluating the overall presentation of the above said statements. We believe that our audit provides a reasonable basis for our opinion and, after due verification, we report that:
a) in our opinion, proper books of account have been kept by the Company as required by the Companies Ordinance, 1984;
b) in our opinion:
i) the balance sheet and profit and loss account together with the notes thereon have been drawn up in conformity with the Companies Ordinance, 1984, and are in agreement with the books of account and are further in accordance with accounting policies consistently applied;
ii) the expenditure incurred during the year was for the purpose of the Company’s business; and
iii) the business conducted, investments made and the expenditure incurred during the year were in accordance with the objects of the Company;
c) in our opinion and to the best of our information and according to the explanations given to us, the balance sheet, profit and loss account, statement of comprehensive income, cash flow statement and statement of changes in equity together with the notes forming part thereof conform with approved accounting standards as applicable in Pakistan, and, give the information required by the Companies Ordinance, 1984, in the manner so required and respectively give a true and fair view of the state of the Company’s affairs as at 30 June 2015 and of the profit, its comprehensive income, its cash flows and changes in equity for the year then ended; and
d) in our opinion, Zakat deductible at source under the Zakat and Ushr Ordinance, 1980 (XVIII of 1980), was deducted by the Company and deposited in the Central Zakat Fund established under Section 7 of that
Ordinance.
Riaz Ahmad & CompanyChartered Accountants
Name of engagement partner:Muhammad Atif Mirza
27 October 2015Lahore
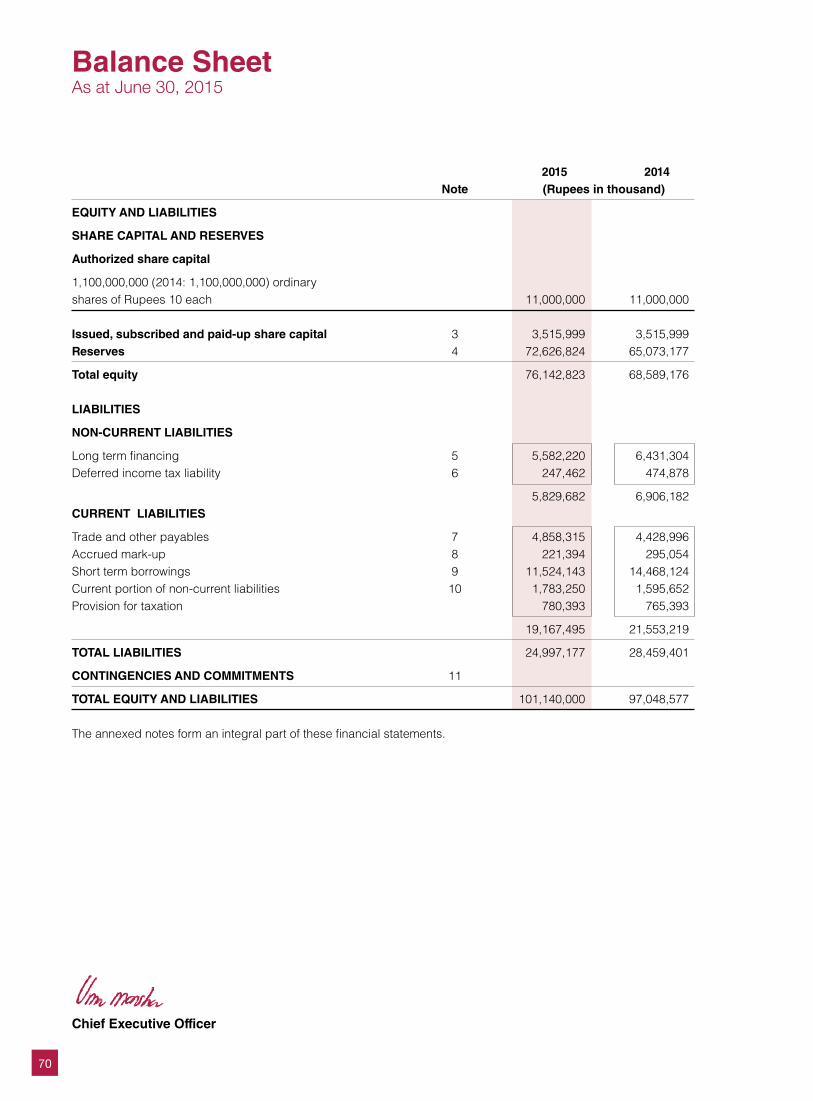
70
Balance SheetAs at June 30, 2015
2015 2014 Note (Rupees in thousand)
EQUITY AND LIABILITIES
SHARE CAPITAL AND RESERVES
Authorized share capital
1,100,000,000 (2014: 1,100,000,000) ordinary shares of Rupees 10 each 11,000,000 11,000,000 Issued, subscribed and paid-up share capital 3 3,515,999 3,515,999 Reserves 4 72,626,824 65,073,177
Total equity 76,142,823 68,589,176
LIABILITIES
NON-CURRENT LIABILITIES
Long term financing 5 5,582,220 6,431,304 Deferred income tax liability 6 247,462 474,878
5,829,682 6,906,182 CURRENT LIABILITIES
Trade and other payables 7 4,858,315 4,428,996 Accrued mark-up 8 221,394 295,054 Short term borrowings 9 11,524,143 14,468,124 Current portion of non-current liabilities 10 1,783,250 1,595,652 Provision for taxation 780,393 765,393
19,167,495 21,553,219
TOTAL LIABILITIES 24,997,177 28,459,401
CONTINGENCIES AND COMMITMENTS 11
TOTAL EQUITY AND LIABILITIES 101,140,000 97,048,577 The annexed notes form an integral part of these financial statements.
Chief Executive Officer

71Annual Report 2015 of Nishat Mills Limited
Director
2015 2014 Note (Rupees in thousand)
ASSETS
NON-CURRENT ASSETS Property, plant and equipment 12 24,357,269 22,964,388 Investment properties 13 479,242 386,748 Long term investments 14 51,960,454 44,771,715 Long term loans 15 94,284 102,726 Long term deposits 16 58,307 48,008
76,949,556 68,273,585 CURRENT ASSETS
Stores, spare parts and loose tools 17 1,335,763 1,316,479 Stock in trade 18 10,350,193 12,752,495 Trade debts 19 3,014,466 2,929,054 Loans and advances 20 5,575,273 4,184,485 Short term deposits and prepayments 21 44,849 42,893 Other receivables 22 1,625,281 1,504,538 Accrued interest 23 2,540 15,172 Short term investments 24 2,189,860 3,227,560 Cash and bank balances 25 52,219 2,802,316
24,190,444 28,774,992
TOTAL ASSETS 101,140,000 97,048,577
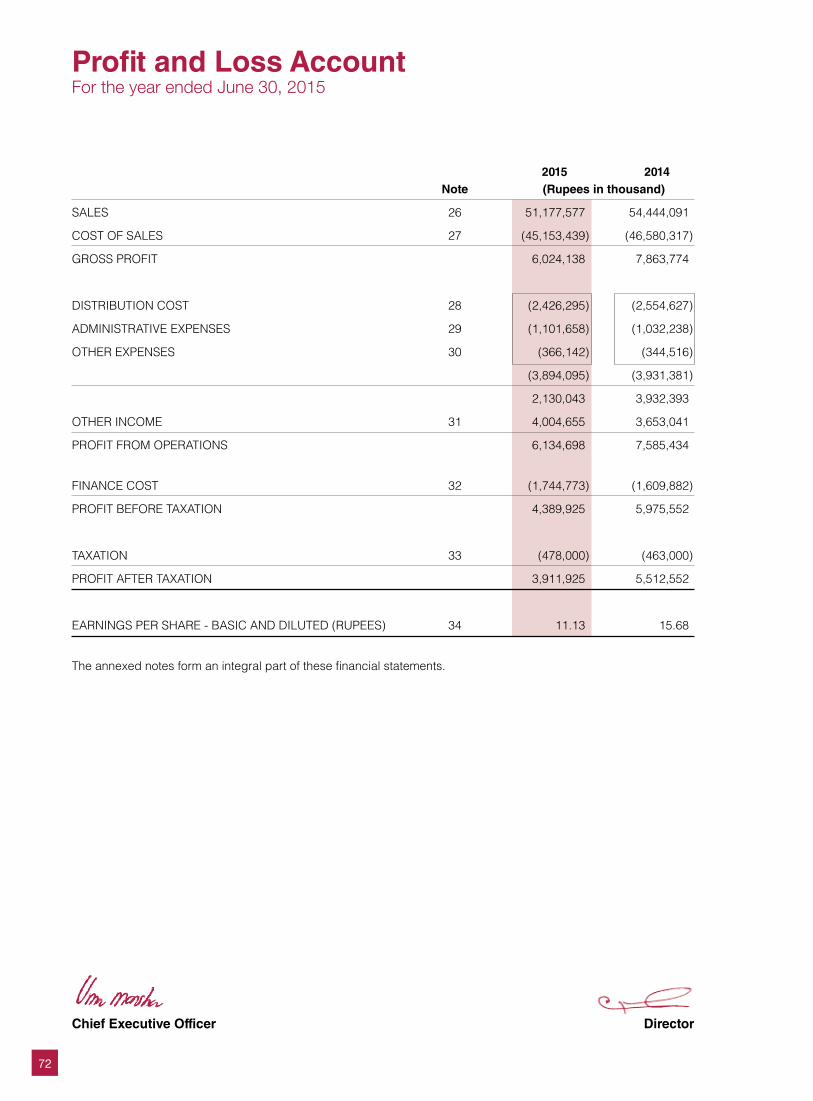
72
Profit and Loss AccountFor the year ended June 30, 2015
2015 2014 Note (Rupees in thousand)
SALES 26 51,177,577 54,444,091
COST OF SALES 27 (45,153,439) (46,580,317)
GROSS PROFIT 6,024,138 7,863,774
DISTRIBUTION COST 28 (2,426,295) (2,554,627)
ADMINISTRATIVE EXPENSES 29 (1,101,658) (1,032,238)
OTHER EXPENSES 30 (366,142) (344,516)
(3,894,095) (3,931,381)
2,130,043 3,932,393
OTHER INCOME 31 4,004,655 3,653,041
PROFIT FROM OPERATIONS 6,134,698 7,585,434
FINANCE COST 32 (1,744,773) (1,609,882)
PROFIT BEFORE TAXATION 4,389,925 5,975,552
TAXATION 33 (478,000) (463,000)
PROFIT AFTER TAXATION 3,911,925 5,512,552
EARNINGS PER SHARE - BASIC AND DILUTED (RUPEES) 34 11.13 15.68
The annexed notes form an integral part of these financial statements.
Chief Executive Officer Director
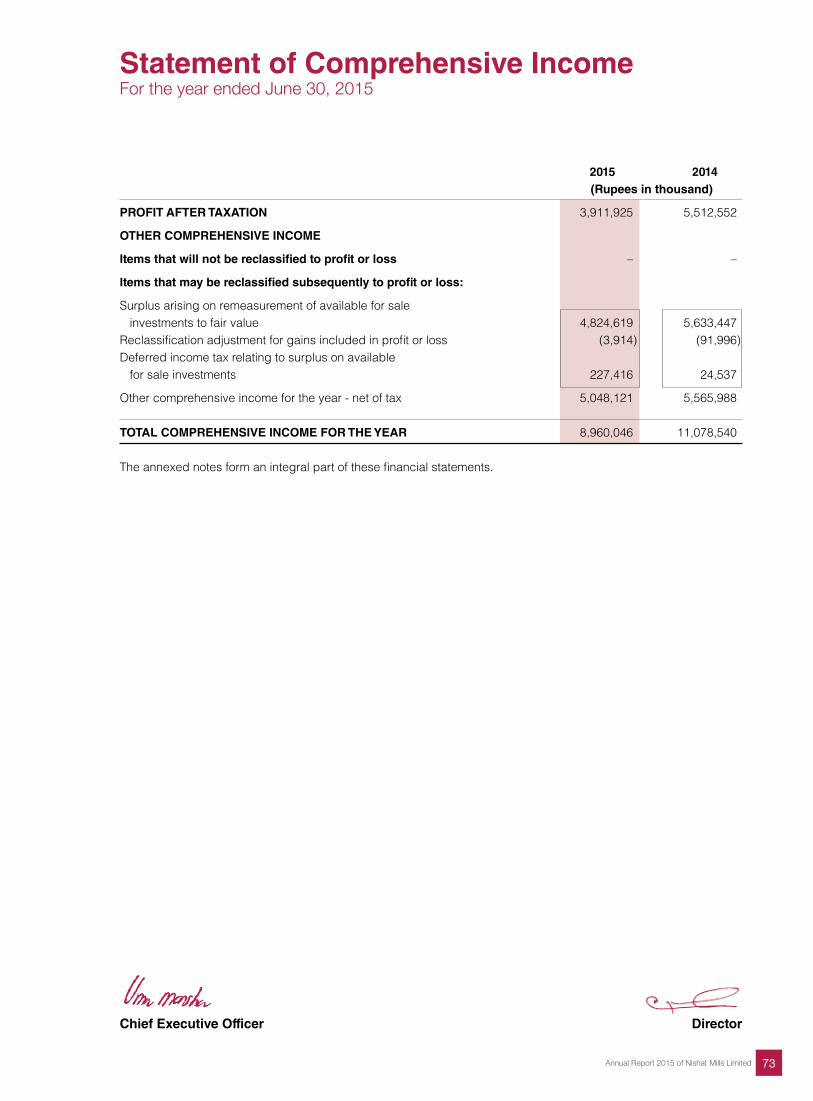
73Annual Report 2015 of Nishat Mills Limited
Statement of Comprehensive IncomeFor the year ended June 30, 2015
2015 2014 (Rupees in thousand)
PROFIT AFTER TAXATION 3,911,925 5,512,552
OTHER COMPREHENSIVE INCOME
Items that will not be reclassified to profit or loss – –
Items that may be reclassified subsequently to profit or loss:
Surplus arising on remeasurement of available for sale investments to fair value 4,824,619 5,633,447 Reclassification adjustment for gains included in profit or loss (3,914) (91,996)Deferred income tax relating to surplus on available for sale investments 227,416 24,537
Other comprehensive income for the year - net of tax 5,048,121 5,565,988 TOTAL COMPREHENSIVE INCOME FOR THE YEAR 8,960,046 11,078,540 The annexed notes form an integral part of these financial statements.
Chief Executive Officer Director
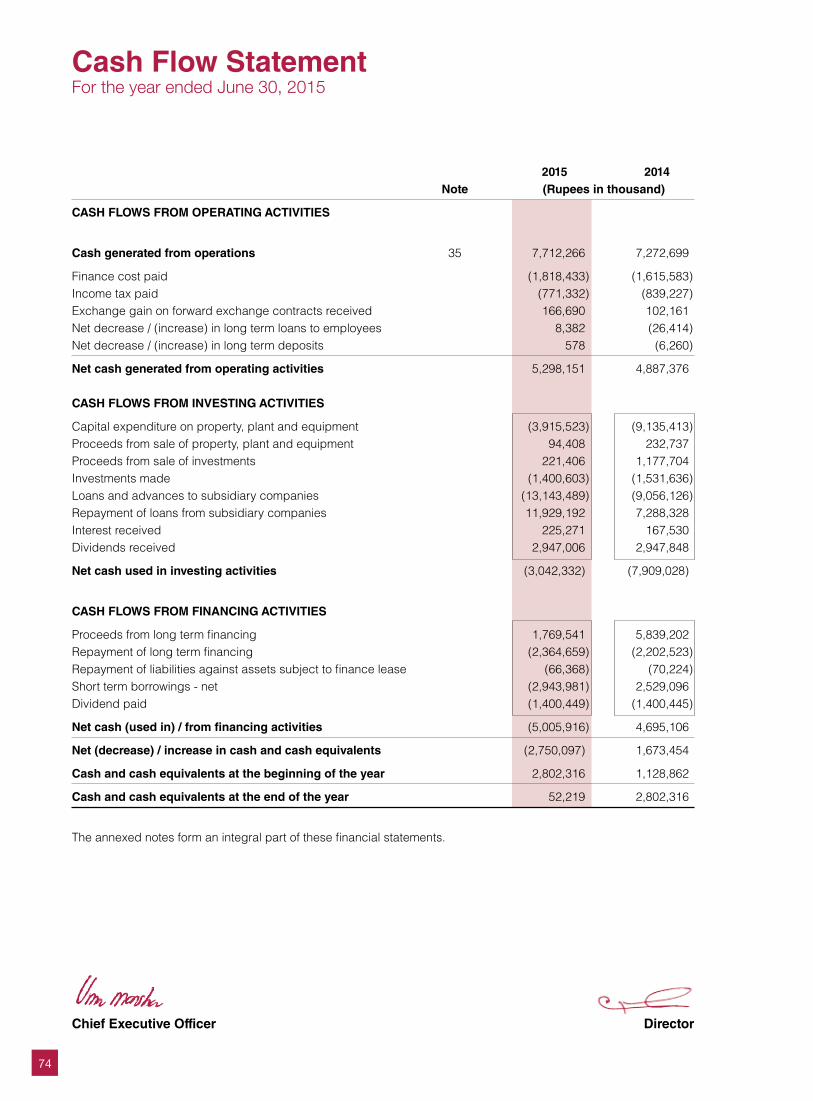
74
Cash Flow StatementFor the year ended June 30, 2015
2015 2014 Note (Rupees in thousand)
CASH FLOWS FROM OPERATING ACTIVITIES
Cash generated from operations 35 7,712,266 7,272,699
Finance cost paid (1,818,433) (1,615,583)Income tax paid (771,332) (839,227)Exchange gain on forward exchange contracts received 166,690 102,161 Net decrease / (increase) in long term loans to employees 8,382 (26,414)Net decrease / (increase) in long term deposits 578 (6,260)
Net cash generated from operating activities 5,298,151 4,887,376 CASH FLOWS FROM INVESTING ACTIVITIES
Capital expenditure on property, plant and equipment (3,915,523) (9,135,413)Proceeds from sale of property, plant and equipment 94,408 232,737 Proceeds from sale of investments 221,406 1,177,704 Investments made (1,400,603) (1,531,636)Loans and advances to subsidiary companies (13,143,489) (9,056,126)Repayment of loans from subsidiary companies 11,929,192 7,288,328 Interest received 225,271 167,530 Dividends received 2,947,006 2,947,848
Net cash used in investing activities (3,042,332) (7,909,028)
CASH FLOWS FROM FINANCING ACTIVITIES
Proceeds from long term financing 1,769,541 5,839,202 Repayment of long term financing (2,364,659) (2,202,523)Repayment of liabilities against assets subject to finance lease (66,368) (70,224)Short term borrowings - net (2,943,981) 2,529,096 Dividend paid (1,400,449) (1,400,445)
Net cash (used in) / from financing activities (5,005,916) 4,695,106
Net (decrease) / increase in cash and cash equivalents (2,750,097) 1,673,454
Cash and cash equivalents at the beginning of the year 2,802,316 1,128,862
Cash and cash equivalents at the end of the year 52,219 2,802,316
The annexed notes form an integral part of these financial statements.
Chief Executive Officer Director
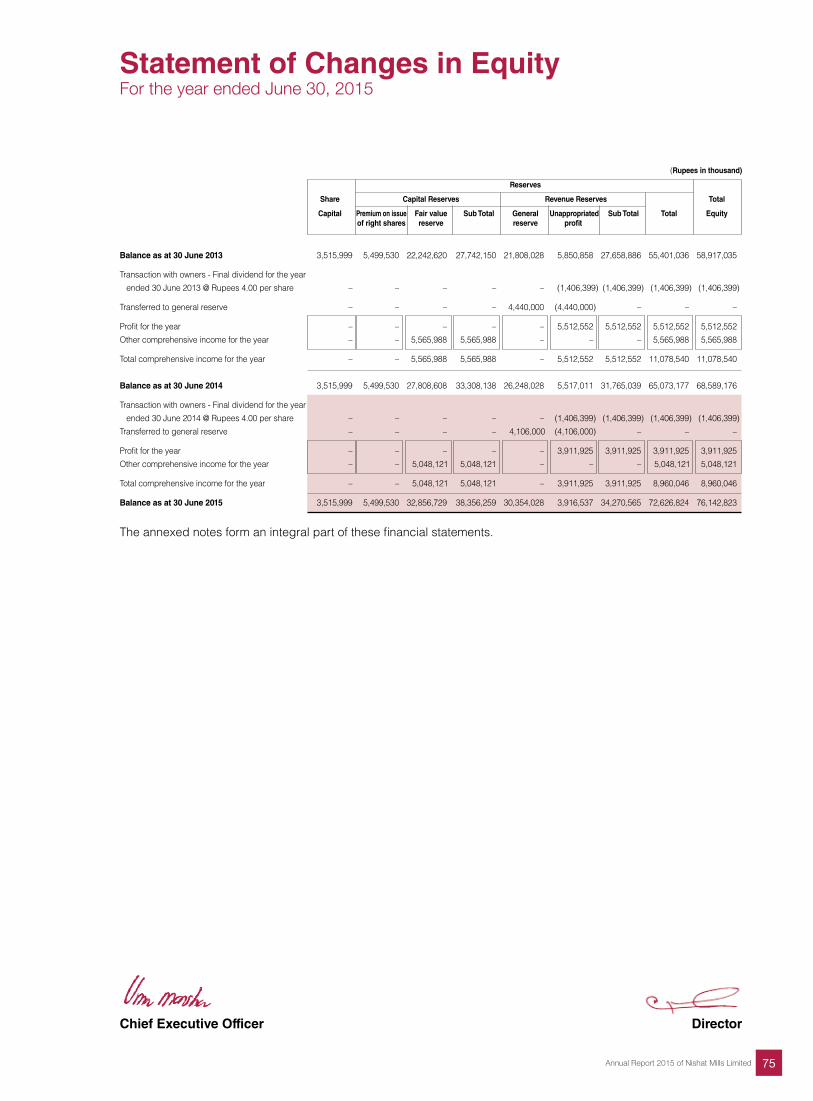
75Annual Report 2015 of Nishat Mills Limited
Statement of Changes in EquityFor the year ended June 30, 2015
(Rupees in thousand)
Reserves
Share Capital Reserves Revenue Reserves Total
Capital Premium on issue Fair value Sub Total General Unappropriated Sub Total Total Equity of right shares reserve reserve profit
Balance as at 30 June 2013 3,515,999 5,499,530 22,242,620 27,742,150 21,808,028 5,850,858 27,658,886 55,401,036 58,917,035
Transaction with owners - Final dividend for the year
ended 30 June 2013 @ Rupees 4.00 per share – – – – – (1,406,399) (1,406,399) (1,406,399) (1,406,399)
Transferred to general reserve – – – – 4,440,000 (4,440,000) – – –
Profit for the year – – – – – 5,512,552 5,512,552 5,512,552 5,512,552
Other comprehensive income for the year – – 5,565,988 5,565,988 – – – 5,565,988 5,565,988
Total comprehensive income for the year – – 5,565,988 5,565,988 – 5,512,552 5,512,552 11,078,540 11,078,540
Balance as at 30 June 2014 3,515,999 5,499,530 27,808,608 33,308,138 26,248,028 5,517,011 31,765,039 65,073,177 68,589,176
Transaction with owners - Final dividend for the year
ended 30 June 2014 @ Rupees 4.00 per share – – – – – (1,406,399) (1,406,399) (1,406,399) (1,406,399)
Transferred to general reserve – – – – 4,106,000 (4,106,000) – – –
Profit for the year – – – – – 3,911,925 3,911,925 3,911,925 3,911,925
Other comprehensive income for the year – – 5,048,121 5,048,121 – – – 5,048,121 5,048,121
Total comprehensive income for the year – – 5,048,121 5,048,121 – 3,911,925 3,911,925 8,960,046 8,960,046
Balance as at 30 June 2015 3,515,999 5,499,530 32,856,729 38,356,259 30,354,028 3,916,537 34,270,565 72,626,824 76,142,823
The annexed notes form an integral part of these financial statements.
Chief Executive Officer Director
76
1 THE COMPANY AND ITS OPERATIONS
Nishat Mills Limited is a public limited Company incorporated in Pakistan under the Companies Act, 1913 (Now Companies Ordinance, 1984) and listed on all Stock Exchanges in Pakistan. Its registered office is situated at 53-A, Lawrence Road, Lahore. The Company is engaged in the business of textile manufacturing and of spinning, combing, weaving, bleaching, dyeing, printing, stitching, apparel, buying, selling and otherwise dealing in yarn, linen, cloth and other goods and fabrics made from raw cotton, synthetic fibre and cloth and to generate, accumulate, distribute, supply and sell electricity.
The Board of Directors of the Company in their meeting held on 24 February 2015 approved the Scheme of Compromises, Arrangements and Reconstruction under sections 284 to 288 of the Companies Ordinance, 1984 between Nishat Spinning (Private) Limited and its members and Nishat Linen (Private) Limited and its members and Nishat Mills Limited and its members. The scheme was approved by shareholders of the aforesaid companies in their respective Extra Ordinary General Meetings (EOGMs) held on 21 April 2015 and respective EOGMs with Co-Chairpersons appointed by Honourable Lahore High Court, Lahore held on 27 June 2015. The Honourable Lahore High Court, Lahore, has approved the scheme by way of order dated 6 October 2015 with effect from 31 December 2014.
The main objects of the scheme are: to effect merger of Nishat Spinning (Private) Limited (NSPL) with and into Nishat Linen (Private) Limited (NLPL) and the Company; and to separate the Sewing Undertaking (comprising of building, plant and machinery, related assets and inventory of Sewing Unit of the Company) from the Company and transfer and vest the same with and into NLPL.
As per the aforesaid scheme, the issued, subscribed and paid-up share capital appearing in the books of account of NSPL has been set off against the respective investment appearing in the books of account of the Company. NLPL has issued 367,913 ordinary shares of Rupees 10 each to the Company based on break-up value per ordinary share of NLPL of Rupees 692.02 as at 31 December 2014. Capital work-in-progress amounting to Rupees 9.799 million, long term security deposit amounting to Rupees 10.877 million and advances amounting to Rupees 9.677 million have been transferred from NSPL to the Company. Moreover, operating fixed assets having book value of Rupees 162.232 million, capital work-in-progress amounting to Rupees 78.028 million, stores, spare parts and loose tools amounting to Rupees 24.866 million and stock in trade amounting to Rupees 19.820 million relating to the Sewing Undertaking of the Company have been transferred to NLPL.
2 SUMMARY OF SIGNIFICANT ACCOUNTING POLICIES
The significant accounting policies applied in the preparation of these financial statements are set out below. These policies have been consistently applied to all years presented, unless otherwise stated:
2.1 Basis of preparation
a) Statement of compliance
These financial statements have been prepared in accordance with approved accounting standards as applicable in Pakistan. Approved accounting standards comprise of such International Financial Reporting Standards (IFRS) issued by the International Accounting Standards Board as are notified under the Companies Ordinance, 1984, provisions of and directives issued under the Companies Ordinance, 1984. In case requirements differ, the provisions or directives of the Companies Ordinance, 1984 shall prevail.
b) Accounting convention
These financial statements have been prepared under the historical cost convention except for the certain financial instruments carried at fair value.
c) Critical accounting estimates and judgments
The preparation of financial statements in conformity with the approved accounting standards requires the use of certain critical accounting estimates. It also requires the management to exercise its judgment in the process of applying the Company’s accounting policies. Estimates and judgments are continually evaluated and are based on historical experience and other factors, including expectations of future events that are believed to be reasonable under the circumstances. The areas where various assumptions and estimates are significant to the Company’s financial statements or where judgments were exercised in application of accounting policies are as follows:
Notes to the Financial StatementsFor the year ended June 30, 2015
77Annual Report 2015 of Nishat Mills Limited
Financial instruments
The fair value of financial instruments that are not traded in an active market is determined by using valuation techniques based on assumptions that are dependent on conditions existing at balance sheet date.
Useful lives, patterns of economic benefits and impairments
Estimates with respect to residual values and useful lives and pattern of flow of economic benefits are based on the analysis of the management of the Company. Further, the Company reviews the value of assets for possible impairment on an annual basis. Any change in the estimates in the future might affect the carrying amount of respective item of property, plant and equipment, with a corresponding effect on the depreciation charge and impairment.
Inventories
Net realizable value of inventories is determined with reference to currently prevailing selling prices less estimated expenditure to make sales.
Taxation
In making the estimates for income tax currently payable by the Company, the management takes into account the current income tax law and the decisions of appellate authorities on certain issues in the past.
Provision for doubtful debts
The Company reviews its receivable against any provision required for any doubtful balances on an ongoing basis. The provision is made while taking into consideration expected recoveries, if any.
Impairment of investments in subsidiaries and equity method accounted for associated companies
In making an estimate of recoverable amount of the Company’s investments in subsidiaries and equity method accounted for associated companies, the management considers future cash flows.
d) Amendments to published approved standards and interpretation that are effective in current year and are relevant to the Company
The following amendments to published approved standards and interpretation are mandatory for the Company’s accounting periods beginning on or after 01 July 2014:
IAS 32 (Amendments) ‘Financial Instruments: Presentation’ (effective for annual periods beginning on or after 01 January 2014). Amendments have been made to clarify certain aspects because of diversity in application of the requirements on offsetting, focused on four main areas: the meaning of ‘currently has a legally enforceable right of set-off’; the application of simultaneous realization and settlement; the offsetting of collateral amounts and the unit of account for applying the offsetting requirements.
IAS 36 (Amendments) ‘Impairment of Assets’ (effective for annual periods beginning on or after 01 January 2014). Amendments have been made in IAS 36 to reduce the circumstances in which the recoverable amount of assets or cash-generating units is required to be disclosed, clarify the disclosures required and to introduce an explicit requirement to disclose the discount rate used in determining impairment (or reversals) where recoverable amount (based on fair value less costs of disposal) is determined using a present value technique.
IFRIC 21 ‘Levies’ (effective for annual periods beginning on or after 01 January 2014). The interpretation provides guidance on when to recognize a liability for a levy imposed by a government, both for levies that are accounted for in accordance with IAS 37 ‘Provisions, Contingent Liabilities and Contingent Assets’ and those where the timing and amount of the levy is certain. The Interpretation identifies the obligating event for the recognition of a liability as the activity that triggers the payment of the levy in accordance with the relevant legislation.
78
On 12 December 2013, IASB issued Annual Improvements to IFRSs: 2010 – 2012 Cycle, incorporating amendments to seven IFRSs more specifically in IFRS 8 ‘Operating Segments’ and IAS 24 ‘Related Party Disclosures’, which are considered relevant to the Company’s financial statements. These amendments are effective for annual periods beginning on or after 01 July 2014. The amendments to IFRS 8 require an entity to disclose the judgments made by the management in applying the aggregation criteria to operating segments, including a description of the operating segments aggregated and the economic indicators assessed in determining whether the operating segments have ‘similar economic characteristics’. Further, the amendment to IFRS 8 clarifies that a reconciliation of the total of the reportable segments’ assets to the entity’s assets should only be provided if the segment assets are regularly provided to the chief operating decision-maker. The amendments to IAS 24 clarify that a management entity providing key management personnel services to a reporting entity is a related party of the reporting entity. Consequently, the reporting entity must disclose as related party transactions the amounts incurred for the service paid or payable to the management entity for the provision of key management personnel services. However, disclosure of the components of such compensation is not required.
The application of the above amendments and interpretation does not result in any impact on profit or loss, other comprehensive income and total comprehensive income.
e) Amendments to published standards that are effective in current year but not relevant to the Company
There are other amendments to published standards that are mandatory for accounting periods beginning on or after 01 July 2014 but are considered not to be relevant or do not have any significant impact on the Company’s financial statements and are therefore not detailed in these financial statements.
f) Standards and amendments to published standards that are not yet effective but relevant to the Company
Following standards and amendments to existing standards have been published and are mandatory for the Company’s accounting periods beginning on or after 01 July 2015 or later periods:
IFRS 9 ‘Financial Instruments’ (effective for annual periods beginning on or after 01 January 2018). A finalized version of IFRS 9 which contains accounting requirements for financial instruments, replacing IAS 39 ‘Financial Instruments: Recognition and Measurement’. Financial assets are classified by reference to the business model within which they are held and their contractual cash flow characteristics. The 2014 version of IFRS 9 introduces a ‘fair value through other comprehensive income’ category for certain debt instruments. Financial liabilities are classified in a similar manner to under IAS 39, however there are differences in the requirements applying to the measurement of an entity’s own credit risk. The 2014 version of IFRS 9 introduces an ‘expected credit loss’ model for the measurement of the impairment of financial assets, so it is no longer necessary for a credit event to have occurred before a credit loss is recognized. It introduces a new hedge accounting model that is designed to be more closely aligned with how entities undertake risk management activities when hedging financial and non-financial risk exposures. The requirements for the derecognition of financial assets and liabilities are carried forward from IAS 39. The management of the Company is in the process of evaluating the impacts of the aforesaid standard on the Company’s financial statements.
IFRS 10 ‘Consolidated Financial Statements’ (effective for annual periods beginning on or after 01 January 2015). Concurrent with the issuance of IFRS 10, the IASB has also issued IFRS 11 ‘Joint Arrangements’, IFRS 12 ‘Disclosure of Interests in Other Entities’, IAS 27 (revised 2011) ‘Separate Financial Statements’ and IAS 28 (revised 2011) ‘Investments in Associates and Joint Ventures’. The objective of IFRS 10 is to have a single basis for consolidation for all entities, regardless of the nature of the investee, and that basis is control. The definition of control includes three elements: power over an investee, exposure or rights to variable returns of the investee and the ability to use power over the investee to affect the investor’s returns. IFRS 10 replaces those parts of IAS 27 that address when and how an investor should prepare consolidated financial statements and replaces Standing Interpretations Committee (SIC) 12 ‘Consolidation – Special Purpose Entities’ in its entirety. The management of the Company is in the process of evaluating the impacts of the aforesaid standard on the Company’s financial statements.
Notes to the Financial StatementsFor the year ended June 30, 2015
79Annual Report 2015 of Nishat Mills Limited
IFRS 12 ‘Disclosures of Interests in Other Entities’ (effective for annual periods beginning on or after 01 January 2015). This standard includes the disclosure requirements for all forms of interests in other entities, including joint arrangements, associates, special purpose vehicles and other off-balance sheet vehicles. This standard is not expected to have a material impact on the Company’s financial statements.
IFRS 13 ‘Fair Value Measurement’ (effective for annual periods beginning on or after 01 January 2015). This standard aims to improve consistency and reduce complexity by providing a precise definition of fair value and a single source of fair value measurement and disclosure requirements for use across IFRSs. The requirements, which are largely aligned between IFRSs and US GAAP, do not extend the use of fair value accounting but provide guidance on how it should be applied where its use is already required or permitted by other standards within IFRSs or US GAAP. This standard is not expected to have a material impact on the Company’s financial statements.
Amendments to IFRS 10, IFRS 11 and IFRS 12 (effective for annual periods beginning on or after 01 January 2015) provide additional transition relief in by limiting the requirement to provide adjusted comparative information to only the preceding comparative period. Also, amendments to IFRS 12 eliminate the requirement to provide comparative information for periods prior to the immediately preceding period.
Amendments to IFRS 10 and IAS 28 (effective for annual periods beginning on or after 01 January 2016) to clarify the treatment of the sale or contribution of assets from an investor to its associates or joint venture, as follows: require full recognition in the investor’s financial statements of gains and losses arising on the sale or contribution of assets that constitute a business (as defined in IFRS 3 ‘Business Combinations’); require the partial recognition of gains and losses where the assets do not constitute a business, i.e. a gain or loss is recognized only to the extent of the unrelated investors’ interests in that associate or joint venture. These requirements apply regardless of the legal form of the transaction, e.g. whether the sale or contribution of assets occur by an investor transferring shares in a subsidiary that holds the assets (resulting in loss of control of the subsidiary), or by the direct sale of the assets themselves. The management of the Company is in the process of evaluating the impacts of the aforesaid amendments on the Company’s financial statements.
Amendments to IFRS 10, IFRS 12 and IAS 27 (effective for annual periods beginning on or after
01 January 2015) provide ‘investment entities’ an exemption from the consolidation of particular subsidiaries and instead require that: an investment entity measure the investment in each eligible subsidiary at fair value through profit or loss; requires additional disclosures; and require an investment entity to account for its investment in a relevant subsidiary in the same way in its consolidated and separate financial statements. The management of the Company is in the process of evaluating the impacts of the aforesaid amendments on the Company’s financial statements.
Amendments to IFRS 10, IFRS 12 and IAS 28 (effective for annual periods beginning on or after 01 January 2016) to address issues that have arisen in the context of applying the consolidation exception for investment entities by clarifying the following points: the exemption from preparing consolidated financial statements for an intermediate parent entity is available to a parent entity that is a subsidiary of an investment entity, even if the investment entity measures all of its subsidiaries at fair value; a subsidiary that provides services related to the parent’s investment activities should not be consolidated if the subsidiary itself is an investment entity; when applying the equity method to an associate or a joint venture, a non-investment entity investor in an investment entity may retain the fair value measurement applied by the associate or joint venture to its interests in subsidiaries; and an investment entity measuring all of its subsidiaries at fair value provides the disclosures relating to investment entities required by IFRS 12. The management of the Company is in the process of evaluating the impacts of the aforesaid amendments on the Company’s financial statements.
IFRS 15 ‘Revenue from Contracts with Customers’ (effective for annual periods beginning on or after 01 January 2017). IFRS 15 provides a single, principles based five-step model to be applied to all contracts with customers. The five steps in the model are: identify the contract with the customer; identify the performance obligations in the contract; determine the transaction price; allocate the transaction price to the performance obligations in the contracts; and recognise revenue when (or as) the entity satisfies a performance obligation. Guidance is provided on topics such as the point in
80
which revenue is recognised, accounting for variable consideration, costs of fulfilling and obtaining a contract and various related matters. New disclosures about revenue are also introduced. The management of the Company is in the process of evaluating the impacts of the aforesaid standard on the Company’s financial statements.
IAS 1 (Amendments) ‘Presentation of Financial Statements’ (effective for annual periods beginning on or after 01 January 2016). Amendments have been made to address perceived impediments to preparers exercising their judgement in presenting their financial reports by making the following changes: clarification that information should not be obscured by aggregating or by providing immaterial information, materiality consideration apply to the all parts of the financial statements, and even when a standard requires a specific disclosure, materiality consideration do apply; clarification that the list of the line items to be presented in these statements can be disaggregated and aggregated as relevant and additional guidance on subtotals in these statements and clarification that an entity’s share of other comprehensive income of equity-accounted associates and joint ventures should be presented in aggregate as single line items based on whether or not it will subsequently be reclassified to profit or loss; and additional examples of possible ways of ordering the notes to clarify that understandability and comparability should be considered when determining the order of the notes and to demonstrate that the notes need not be presented in the order so far listed in IAS 1. However, the amendments are not expected to have a material impact on the Company’s financial statements.
IAS 16 (Amendments) ‘Property, Plant and Equipment’ (effective for annual periods beginning on or after 01 January 2016). The amendments clarify that a depreciation method that is based on revenue that is generated by an activity that includes the use of an asset is not appropriate for property, plant and equipment; and add guidance that expected future reductions in the selling price of an item that was produced using an asset could indicate the expectation of technological or commercial obsolescence of the asset, which, in turn, might reflect a reduction of the future economic benefits embodied in the asset. However, the amendments are not expected to have a material impact on the Company’s financial statements.
IAS 27 (Amendments) ‘Separate Financial Statements’ (effective for annual periods beginning on or after 01 January 2016). The amendments have been made to permit investments in subsidiaries, joint ventures and associates to be optionally accounted for using the equity method in separate financial statements. The management of the Company is in the process of evaluating the impacts of the aforesaid amendments on the Company’s financial statements.
g) Standard and amendments to published standards that are not yet effective and not considered relevant to the Company
There are other standards and amendments to published standards that are mandatory for accounting periods beginning on or after 01 July 2015 but are considered not to be relevant or do not have any significant impact on the Company’s financial statements and are therefore not detailed in these financial statements.
2.2 Employee benefit
The Company operates an approved funded provident fund scheme covering all permanent employees. Equal monthly contributions are made both by the Company and employees at the rate of 9.5 percent of the basic salary to the fund. The Company’s contributions to the fund are charged to profit and loss account.
2.3 Taxation
Current
Provision for current tax is based on the taxable income for the year determined in accordance with the prevailing law for taxation of income. The charge for current tax is calculated using prevailing tax rates or tax rates expected to apply to the profit for the year, if enacted. The charge for current tax also includes adjustments, where considered necessary, to provision for tax made in previous years arising from assessments framed during the year for such years.
Notes to the Financial StatementsFor the year ended June 30, 2015
81Annual Report 2015 of Nishat Mills Limited
Deferred
Deferred tax is accounted for using the balance sheet liability method in respect of all temporary differences arising from differences between the carrying amount of assets and liabilities in the financial statements and the corresponding tax bases used in the computation of the taxable profit. Deferred tax liabilities are generally recognized for all taxable temporary differences and deferred tax assets to the extent that it is probable that taxable profits will be available against which the deductible temporary differences, unused tax losses and tax credits can be utilized.
Deferred tax is calculated at the rates that are expected to apply to the period when the differences reverse based on tax rates that have been enacted or substantively enacted by the balance sheet date. Deferred tax is charged or credited in the profit and loss account, except to the extent that it relates to items recognized in other comprehensive income or directly in equity. In this case, the tax is also recognized in other comprehensive income or directly in equity, respectively.
2.4 Foreign currencies
These financial statements are presented in Pak Rupees, which is the Company’s functional currency. All monetary assets and liabilities denominated in foreign currencies are translated into Pak Rupees at the rates of exchange prevailing at the balance sheet date, while the transactions in foreign currencies during the year are initially recorded in functional currency at the rates of exchange prevailing at the transaction date. All non-monetary items are translated into Pak Rupees at exchange rates prevailing on the date of transaction or on the date when fair values are determined. Exchange gains and losses are recorded in the profit and loss account.
2.5 Property, plant, equipment and depreciation
Owned
Property, plant and equipment except freehold land and capital work-in-progress are stated at cost less accumulated depreciation and accumulated impairment losses (if any). Cost of property, plant and equipment consists of historical cost, borrowing cost pertaining to erection / construction period of qualifying assets and other directly attributable costs of bringing the asset to working condition. Freehold land and capital work-in- progress are stated at cost less any recognized impairment loss.
Subsequent costs are included in the asset’s carrying amount or recognized as a separate asset, as appropriate, only when it is probable that future economic benefits associated with the item will flow to the Company and the cost of the item can be measured reliably. All other repair and maintenance costs are charged to profit and loss account during the period in which they are incurred.
Leased
Leases where the Company has substantially all the risk and rewards of ownership are classified as finance lease. Assets subject to finance lease are capitalized at the commencement of the lease term at the lower of present value of minimum lease payments under the lease agreements and the fair value of the leased assets, each determined at the inception of the lease.
The related rental obligation net of finance cost is included in liabilities against assets subject to finance lease. The liabilities are classified as current and long term depending upon the timing of payments.
Each lease payment is allocated between the liability and finance cost so as to achieve a constant rate on the balance outstanding. The finance cost is charged to profit and loss account over the lease term.
Depreciation of assets subject to finance lease is recognized in the same manner as for owned assets. Depreciation of the leased assets is charged to profit and loss account.
Depreciation
Depreciation on property, plant and equipment is charged to profit and loss account applying the reducing balance method so as to write off the cost / depreciable amount of the assets over their estimated useful lives at the rates given in Note 12.1. The Company charges the depreciation on
82
additions from the date when the asset is available for use and on deletions upto the date when the asset is de-recognized. The residual values and useful lives are reviewed by the management, at each financial year-end and adjusted if impact on depreciation is significant.
De-recognition
An item of property, plant and equipment is de-recognized upon disposal or when no future economic benefits are expected from its use or disposal. Any gain or loss arising on de-recognition of the asset is included in the profit and loss account in the year the asset is de-recognized.
2.6 Investment properties
Land and buildings held for capital appreciation or to earn rental income are classified as investment properties. Investment properties except land, are stated at cost less accumulated depreciation and any recognized impairment loss. Land is stated at cost less any recognized impairment loss. Depreciation on buildings is charged to profit and loss account applying the reducing balance method so as to write off the cost of buildings over their estimated useful lives at a rate of 10% per annum.
2.7 Operating leases
Assets leased out under operating leases are included in investment properties. They are depreciated over their expected useful lives on a basis consistent with similar owned property, plant and equipment.
2.8 Investments
Classification of an investment is made on the basis of intended purpose for holding such investment. Management determines the appropriate classification of its investments at the time of purchase and re-evaluates such designation on regular basis.
Investments are initially measured at fair value plus transaction costs directly attributable to acquisition, except for “Investment at fair value through profit or loss” which is initially measured at fair value.
The Company assesses at the end of each reporting period whether there is any objective evidence that investments are impaired. If any such evidence exists, the Company applies the provisions of IAS 39 ‘Financial Instruments: Recognition and Measurement’ to all investments, except investments in subsidiaries and equity method accounted for associates, which are tested for impairment in accordance with the provisions of IAS 36 ‘Impairment of Assets’.
a) Investment at fair value through profit or loss
Investments classified as held-for-trading and those designated as such are included in this category. Investments are classified as held-for-trading if these are acquired for the purpose of selling in the short term. Gains or losses on investments held-for-trading are recognized in profit and loss account.
b) Held-to-maturity
Investments with fixed or determinable payments and fixed maturity are classified as held-to-maturity when the Company has the positive intention and ability to hold to maturity. Investments intended to be held for an undefined period are not included in this classification. Other long-term investments that are intended to be held to maturity are subsequently measured at amortized cost. This cost is computed as the amount initially recognized minus principal repayments, plus or minus the cumulative amortization, using the effective interest method, of any difference between the initially recognized amount and the maturity amount. For investments carried at amortized cost, gains and losses are recognized in profit and loss account when the investments are de-recognized or impaired, as well as through the amortization process.
c) Investment in subsidiaries
Investments in subsidiaries are stated at cost less impairment loss, if any, in accordance with the provisions of IAS 27 ‘Consolidated and Separate Financial Statements’.
Notes to the Financial StatementsFor the year ended June 30, 2015
83Annual Report 2015 of Nishat Mills Limited
d) Investment in associates - (with significant influence)
The Company is required to prepare separate financial statements, hence, in accordance with the requirements of IAS 27 ‘Consolidated and Separate Financial Statements’, the investments in associated undertakings are accounted for in accordance with IAS 39 ‘Financial Instruments: Recognition and Measurement’ and are classified as available for sale.
e) Available-for-sale
Investments intended to be held for an indefinite period of time, which may be sold in response to need for liquidity, or changes to interest rates or equity prices are classified as available-for-sale. After initial recognition, investments which are classified as available-for-sale are measured at fair value. Gains or losses on available-for-sale investments are recognized directly in statement of other comprehensive income until the investment is sold, de-recognized or is determined to be impaired, at which time the cumulative gain or loss previously reported in statement of other comprehensive income is included in profit and loss account. These are sub-categorized as under:
Quoted
For investments that are actively traded in organized capital markets, fair value is determined by reference to stock exchange quoted market bids at the close of business on the balance sheet date. Fair value of investments in open-end mutual funds is determined using redemption price.
Unquoted
Fair value of unquoted investments is determined on the basis of appropriate valuation techniques as allowed by IAS 39 ‘Financial Instruments: Recognition and Measurement’.
2.9 Inventories
Inventories, except for stock in transit and waste stock / rags, are stated at lower of cost and net realizable value. Cost is determined as follows:
Stores, spare parts and loose tools
Useable stores, spare parts and loose tools are valued principally at moving average cost, while items considered obsolete are carried at nil value. Items in transit are valued at cost comprising invoice value plus other charges paid thereon.
Stock-in-trade
Cost of raw material, work-in-process and finished goods is determined as follows:
i) For raw materials: Annual average basis.
ii) For work-in-process and finished goods: Average manufacturing cost including a portion of production overheads.
Materials in transit are valued at cost comprising invoice value plus other charges paid thereon. Waste stock / rags are valued at net realizable value.
Net realizable value signifies the estimated selling price in the ordinary course of business less the estimated costs of completion and the estimated costs necessary to make a sale.
2.10 Trade and other receivables
Trade debts and other receivables are carried at original invoice value less an estimate made for doubtful debts based on a review of all outstanding amounts at the year end. Bad debts are written off when identified.
2.11 Non–current assets (or disposal groups) held for sale
Non-current assets (or disposal groups) are classified as assets held for sale when their carrying amount is to be recovered principally through a sale transaction and a sale is considered highly probable. They are stated at the lower of carrying amount and fair value less costs to sell.
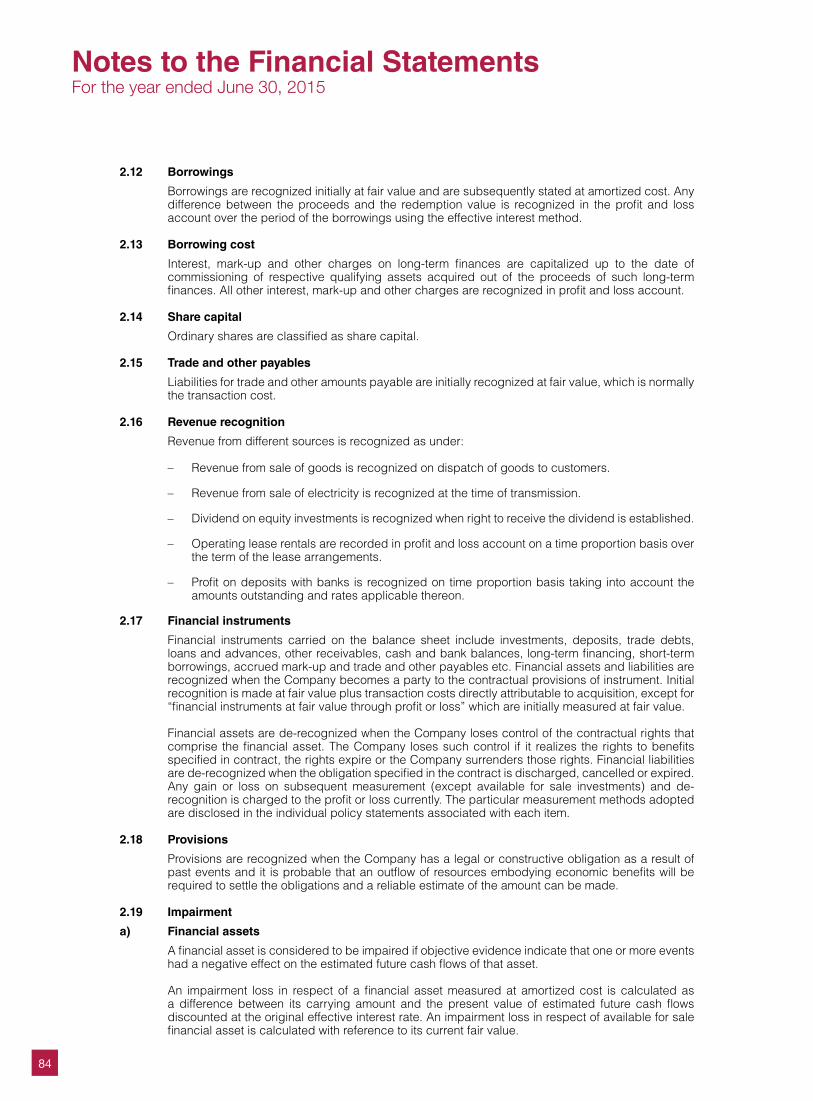
84
2.12 Borrowings
Borrowings are recognized initially at fair value and are subsequently stated at amortized cost. Any difference between the proceeds and the redemption value is recognized in the profit and loss account over the period of the borrowings using the effective interest method.
2.13 Borrowing cost
Interest, mark-up and other charges on long-term finances are capitalized up to the date of commissioning of respective qualifying assets acquired out of the proceeds of such long-term finances. All other interest, mark-up and other charges are recognized in profit and loss account.
2.14 Share capital
Ordinary shares are classified as share capital.
2.15 Trade and other payables
Liabilities for trade and other amounts payable are initially recognized at fair value, which is normally the transaction cost.
2.16 Revenue recognition
Revenue from different sources is recognized as under:
– Revenue from sale of goods is recognized on dispatch of goods to customers.
– Revenue from sale of electricity is recognized at the time of transmission.
– Dividend on equity investments is recognized when right to receive the dividend is established.
– Operating lease rentals are recorded in profit and loss account on a time proportion basis over the term of the lease arrangements.
– Profit on deposits with banks is recognized on time proportion basis taking into account the amounts outstanding and rates applicable thereon.
2.17 Financial instruments
Financial instruments carried on the balance sheet include investments, deposits, trade debts, loans and advances, other receivables, cash and bank balances, long-term financing, short-term borrowings, accrued mark-up and trade and other payables etc. Financial assets and liabilities are recognized when the Company becomes a party to the contractual provisions of instrument. Initial recognition is made at fair value plus transaction costs directly attributable to acquisition, except for “financial instruments at fair value through profit or loss” which are initially measured at fair value.
Financial assets are de-recognized when the Company loses control of the contractual rights that comprise the financial asset. The Company loses such control if it realizes the rights to benefits specified in contract, the rights expire or the Company surrenders those rights. Financial liabilities are de-recognized when the obligation specified in the contract is discharged, cancelled or expired. Any gain or loss on subsequent measurement (except available for sale investments) and de-recognition is charged to the profit or loss currently. The particular measurement methods adopted are disclosed in the individual policy statements associated with each item.
2.18 Provisions
Provisions are recognized when the Company has a legal or constructive obligation as a result of past events and it is probable that an outflow of resources embodying economic benefits will be required to settle the obligations and a reliable estimate of the amount can be made.
2.19 Impairment
a) Financial assets
A financial asset is considered to be impaired if objective evidence indicate that one or more events had a negative effect on the estimated future cash flows of that asset.
An impairment loss in respect of a financial asset measured at amortized cost is calculated as a difference between its carrying amount and the present value of estimated future cash flows discounted at the original effective interest rate. An impairment loss in respect of available for sale financial asset is calculated with reference to its current fair value.
Notes to the Financial StatementsFor the year ended June 30, 2015
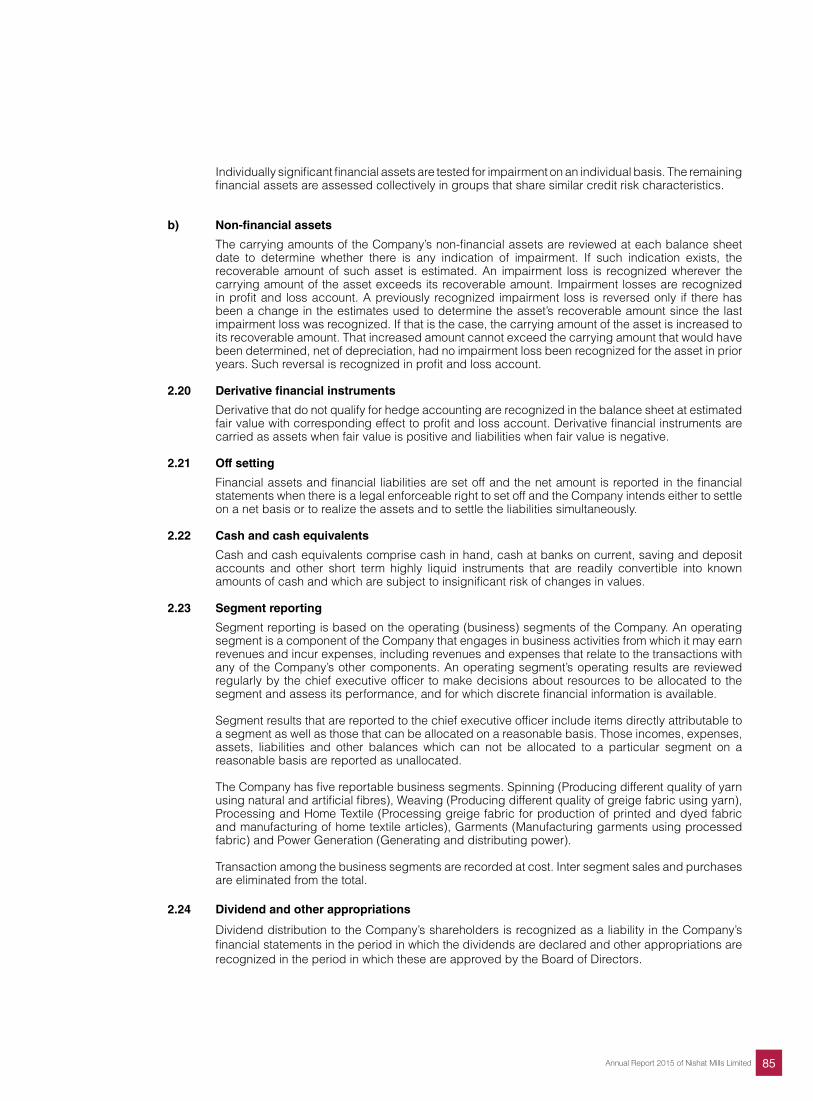
85Annual Report 2015 of Nishat Mills Limited
Individually significant financial assets are tested for impairment on an individual basis. The remaining financial assets are assessed collectively in groups that share similar credit risk characteristics.
b) Non-financial assets
The carrying amounts of the Company’s non-financial assets are reviewed at each balance sheet date to determine whether there is any indication of impairment. If such indication exists, the recoverable amount of such asset is estimated. An impairment loss is recognized wherever the carrying amount of the asset exceeds its recoverable amount. Impairment losses are recognized in profit and loss account. A previously recognized impairment loss is reversed only if there has been a change in the estimates used to determine the asset’s recoverable amount since the last impairment loss was recognized. If that is the case, the carrying amount of the asset is increased to its recoverable amount. That increased amount cannot exceed the carrying amount that would have been determined, net of depreciation, had no impairment loss been recognized for the asset in prior years. Such reversal is recognized in profit and loss account.
2.20 Derivative financial instruments
Derivative that do not qualify for hedge accounting are recognized in the balance sheet at estimated fair value with corresponding effect to profit and loss account. Derivative financial instruments are carried as assets when fair value is positive and liabilities when fair value is negative.
2.21 Off setting
Financial assets and financial liabilities are set off and the net amount is reported in the financial statements when there is a legal enforceable right to set off and the Company intends either to settle on a net basis or to realize the assets and to settle the liabilities simultaneously.
2.22 Cash and cash equivalents
Cash and cash equivalents comprise cash in hand, cash at banks on current, saving and deposit accounts and other short term highly liquid instruments that are readily convertible into known amounts of cash and which are subject to insignificant risk of changes in values.
2.23 Segment reporting
Segment reporting is based on the operating (business) segments of the Company. An operating segment is a component of the Company that engages in business activities from which it may earn revenues and incur expenses, including revenues and expenses that relate to the transactions with any of the Company’s other components. An operating segment’s operating results are reviewed regularly by the chief executive officer to make decisions about resources to be allocated to the segment and assess its performance, and for which discrete financial information is available.
Segment results that are reported to the chief executive officer include items directly attributable to a segment as well as those that can be allocated on a reasonable basis. Those incomes, expenses, assets, liabilities and other balances which can not be allocated to a particular segment on a reasonable basis are reported as unallocated.
The Company has five reportable business segments. Spinning (Producing different quality of yarn
using natural and artificial fibres), Weaving (Producing different quality of greige fabric using yarn), Processing and Home Textile (Processing greige fabric for production of printed and dyed fabric and manufacturing of home textile articles), Garments (Manufacturing garments using processed fabric) and Power Generation (Generating and distributing power).
Transaction among the business segments are recorded at cost. Inter segment sales and purchases are eliminated from the total.
2.24 Dividend and other appropriations
Dividend distribution to the Company’s shareholders is recognized as a liability in the Company’s financial statements in the period in which the dividends are declared and other appropriations are recognized in the period in which these are approved by the Board of Directors.
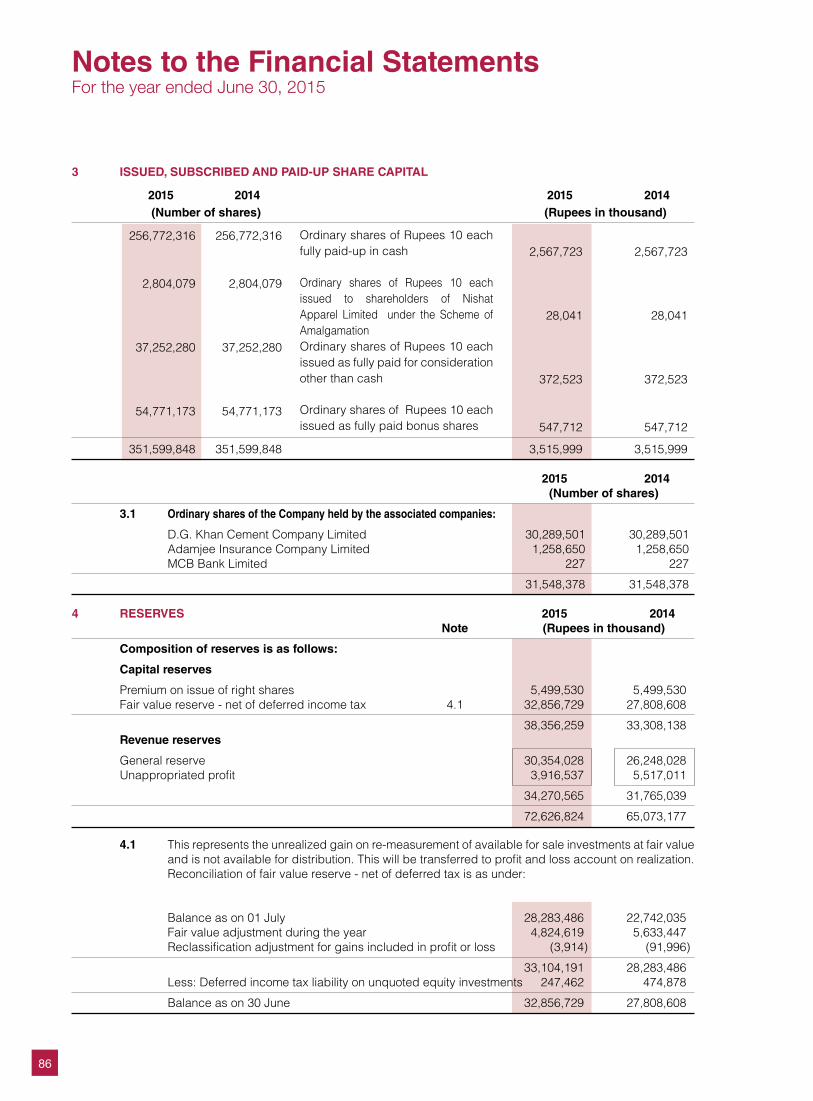
86
3 ISSUED, SUBSCRIBED AND PAID-UP SHARE CAPITAL
2015 2014 2015 2014 (Number of shares) (Rupees in thousand)
256,772,316 256,772,316 2,567,723 2,567,723 2,804,079 2,804,079 28,041 28,041
37,252,280 37,252,280 372,523 372,523
54,771,173 54,771,173 547,712 547,712
351,599,848 351,599,848 3,515,999 3,515,999
Ordinary shares of Rupees 10 each fully paid-up in cash
Ordinary shares of Rupees 10 each issued to shareholders of Nishat Apparel Limited under the Scheme of AmalgamationOrdinary shares of Rupees 10 each issued as fully paid for consideration other than cash
Ordinary shares of Rupees 10 each issued as fully paid bonus shares
2015 2014 (Number of shares)
3.1 Ordinary shares of the Company held by the associated companies:
D.G. Khan Cement Company Limited 30,289,501 30,289,501 Adamjee Insurance Company Limited 1,258,650 1,258,650 MCB Bank Limited 227 227
31,548,378 31,548,378
4 RESERVES 2015 2014 Note (Rupees in thousand)
Composition of reserves is as follows:
Capital reserves
Premium on issue of right shares 5,499,530 5,499,530 Fair value reserve - net of deferred income tax 4.1 32,856,729 27,808,608
38,356,259 33,308,138 Revenue reserves
General reserve 30,354,028 26,248,028 Unappropriated profit 3,916,537 5,517,011
34,270,565 31,765,039
72,626,824 65,073,177
4.1 This represents the unrealized gain on re-measurement of available for sale investments at fair value and is not available for distribution. This will be transferred to profit and loss account on realization. Reconciliation of fair value reserve - net of deferred tax is as under:
Balance as on 01 July 28,283,486 22,742,035 Fair value adjustment during the year 4,824,619 5,633,447 Reclassification adjustment for gains included in profit or loss (3,914) (91,996)
33,104,191 28,283,486 Less: Deferred income tax liability on unquoted equity investments 247,462 474,878
Balance as on 30 June 32,856,729 27,808,608
Notes to the Financial StatementsFor the year ended June 30, 2015
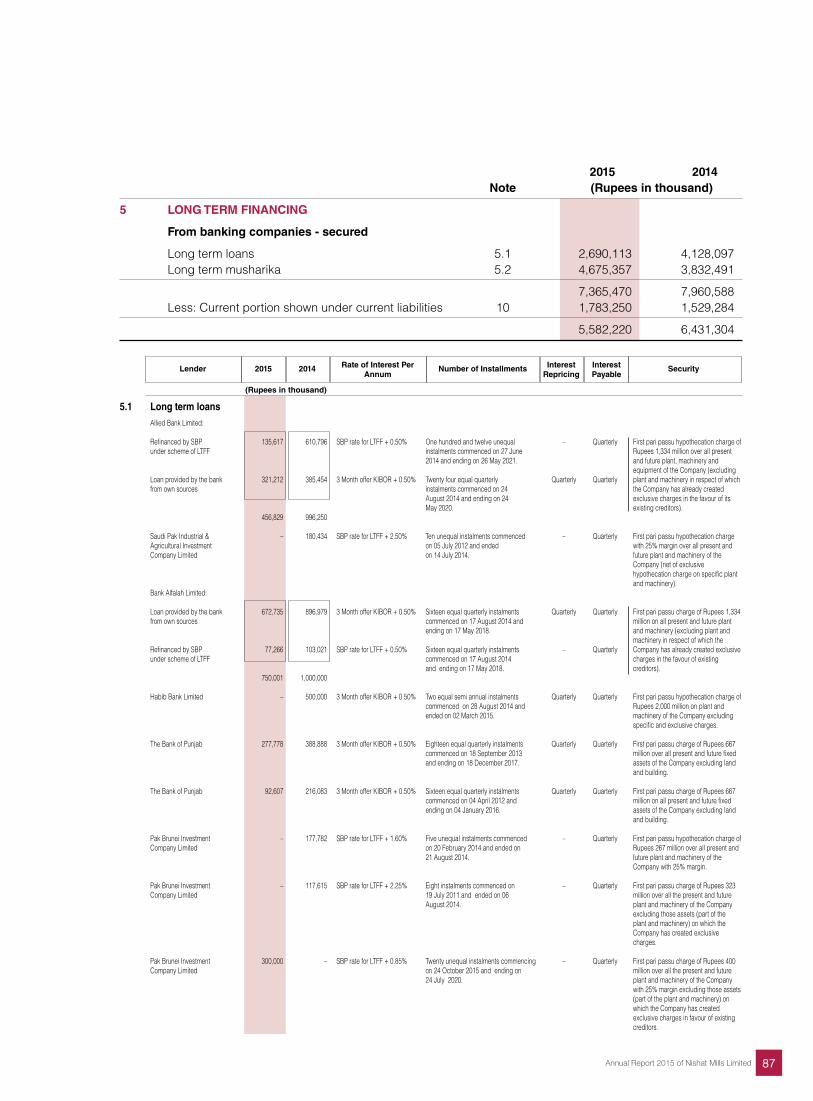
87Annual Report 2015 of Nishat Mills Limited
2015 2014 Note (Rupees in thousand)
5 LONG TERM FINANCING
From banking companies - secured
Long term loans 5.1 2,690,113 4,128,097 Long term musharika 5.2 4,675,357 3,832,491
7,365,470 7,960,588 Less: Current portion shown under current liabilities 10 1,783,250 1,529,284
5,582,220 6,431,304
Lender 2015 2014 Rate of Interest Per Number of Installments Interest Interest Security Annum Repricing Payable
(Rupees in thousand)
5.1 Long term loans
Allied Bank Limited: Refinanced by SBP 135,617 610,796 SBP rate for LTFF + 0.50% One hundred and twelve unequal – Quarterly First pari passu hypothecation charge of under scheme of LTFF instalments commenced on 27 June Rupees 1,334 million over all present 2014 and ending on 26 May 2021. and future plant, machinery and equipment of the Company (excluding Loan provided by the bank 321,212 385,454 3 Month offer KIBOR + 0.50% Twenty four equal quarterly Quarterly Quarterly plant and machinery in respect of which from own sources instalments commenced on 24 the Company has already created August 2014 and ending on 24 exclusive charges in the favour of its May 2020. existing creditors). 456,829 996,250 Saudi Pak Industrial & – 180,434 SBP rate for LTFF + 2.50% Ten unequal instalments commenced – Quarterly First pari passu hypothecation charge Agricultural Investment on 05 July 2012 and ended with 25% margin over all present and Company Limited on 14 July 2014. future plant and machinery of the Company (net of exclusive hypothecation charge on specific plant and machinery). Bank Alfalah Limited: Loan provided by the bank 672,735 896,979 3 Month offer KIBOR + 0.50% Sixteen equal quarterly instalments Quarterly Quarterly First pari passu charge of Rupees 1,334 from own sources commenced on 17 August 2014 and million on all present and future plant ending on 17 May 2018. and machinery (excluding plant and machinery in respect of which the Refinanced by SBP 77,266 103,021 SBP rate for LTFF + 0.50% Sixteen equal quarterly instalments – Quarterly Company has already created exclusive under scheme of LTFF commenced on 17 August 2014 charges in the favour of existing and ending on 17 May 2018. creditors). 750,001 1,000,000
Habib Bank Limited – 500,000 3 Month offer KIBOR + 0.50% Two equal semi annual instalments Quarterly Quarterly First pari passu hypothecation charge of commenced on 28 August 2014 and Rupees 2,000 million on plant and ended on 02 March 2015. machinery of the Company excluding specific and exclusive charges. The Bank of Punjab 277,778 388,888 3 Month offer KIBOR + 0.50% Eighteen equal quarterly instalments Quarterly Quarterly First pari passu charge of Rupees 667 commenced on 18 September 2013 million over all present and future fixed and ending on 18 December 2017. assets of the Company excluding land and building.
The Bank of Punjab 92,607 216,083 3 Month offer KIBOR + 0.50% Sixteen equal quarterly instalments Quarterly Quarterly First pari passu charge of Rupees 667 commenced on 04 April 2012 and million on all present and future fixed ending on 04 January 2016. assets of the Company excluding land and building.
Pak Brunei Investment – 177,782 SBP rate for LTFF + 1.60% Five unequal instalments commenced – Quarterly First pari passu hypothecation charge of Company Limited on 20 February 2014 and ended on Rupees 267 million over all present and 21 August 2014. future plant and machinery of the Company with 25% margin. Pak Brunei Investment – 117,615 SBP rate for LTFF + 2.25% Eight instalments commenced on – Quarterly First pari passu charge of Rupees 323 Company Limited 19 July 2011 and ended on 06 million over all the present and future August 2014. plant and machinery of the Company excluding those assets (part of the plant and machinery) on which the Company has created exclusive charges. Pak Brunei Investment 300,000 – SBP rate for LTFF + 0.85% Twenty unequal instalments commencing – Quarterly First pari passu charge of Rupees 400 Company Limited on 24 October 2015 and ending on million over all the present and future 24 July 2020. plant and machinery of the Company with 25% margin excluding those assets (part of the plant and machinery) on which the Company has created exclusive charges in favour of existing creditors.
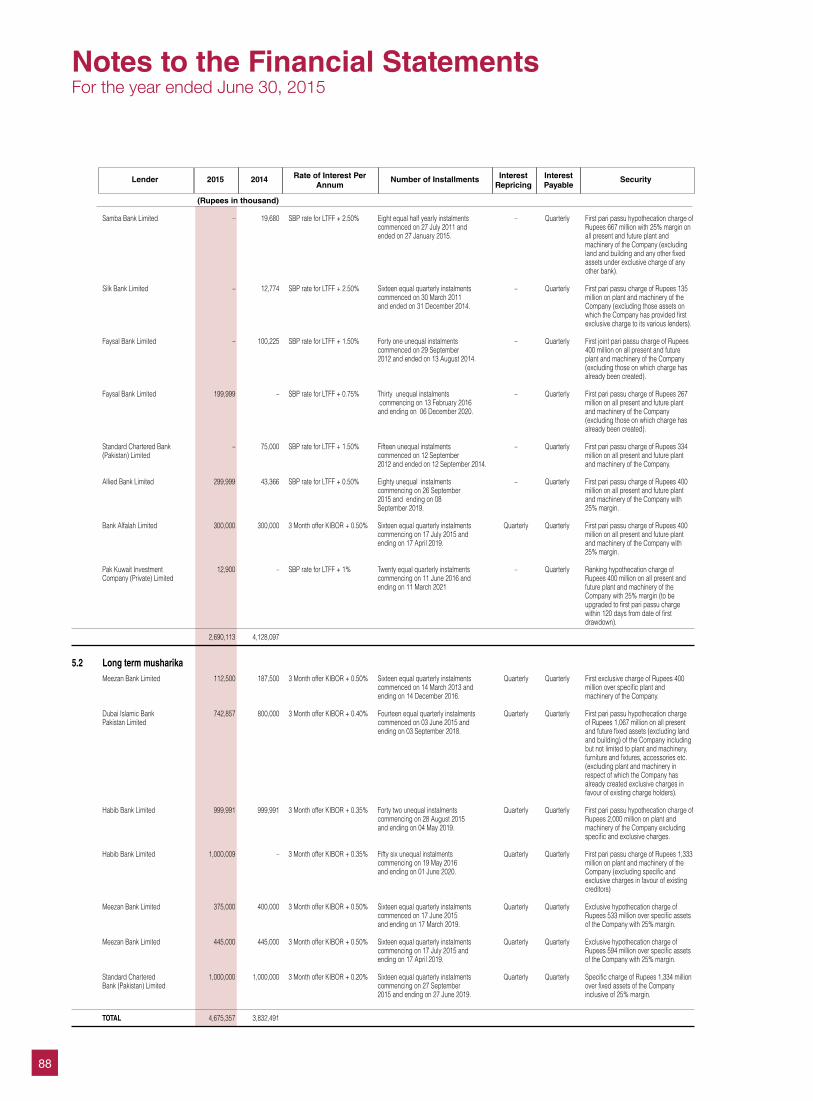
88
Lender 2015 2014 Rate of Interest Per Number of Installments Interest Interest Security Annum Repricing Payable
(Rupees in thousand)
Samba Bank Limited – 19,680 SBP rate for LTFF + 2.50% Eight equal half yearly instalments – Quarterly First pari passu hypothecation charge of commenced on 27 July 2011 and Rupees 667 million with 25% margin on ended on 27 January 2015. all present and future plant and machinery of the Company (excluding land and building and any other fixed assets under exclusive charge of any other bank). Silk Bank Limited – 12,774 SBP rate for LTFF + 2.50% Sixteen equal quarterly instalments – Quarterly First pari passu charge of Rupees 135 commenced on 30 March 2011 million on plant and machinery of the and ended on 31 December 2014. Company (excluding those assets on which the Company has provided first exclusive charge to its various lenders).
Faysal Bank Limited – 100,225 SBP rate for LTFF + 1.50% Forty one unequal instalments – Quarterly First joint pari passu charge of Rupees commenced on 29 September 400 million on all present and future 2012 and ended on 13 August 2014. plant and machinery of the Company (excluding those on which charge has already been created).
Faysal Bank Limited 199,999 – SBP rate for LTFF + 0.75% Thirty unequal instalments – Quarterly First pari passu charge of Rupees 267 commencing on 13 February 2016 million on all present and future plant and ending on 06 December 2020. and machinery of the Company (excluding those on which charge has already been created). Standard Chartered Bank – 75,000 SBP rate for LTFF + 1.50% Fifteen unequal instalments – Quarterly First pari passu charge of Rupees 334 (Pakistan) Limited commenced on 12 September million on all present and future plant 2012 and ended on 12 September 2014. and machinery of the Company. Allied Bank Limited 299,999 43,366 SBP rate for LTFF + 0.50% Eighty unequal instalments – Quarterly First pari passu charge of Rupees 400 commencing on 26 September million on all present and future plant 2015 and ending on 08 and machinery of the Company with September 2019. 25% margin.
Bank Alfalah Limited 300,000 300,000 3 Month offer KIBOR + 0.50% Sixteen equal quarterly instalments Quarterly Quarterly First pari passu charge of Rupees 400 commencing on 17 July 2015 and million on all present and future plant ending on 17 April 2019. and machinery of the Company with 25% margin. Pak Kuwait Investment 12,900 – SBP rate for LTFF + 1% Twenty equal quarterly instalments – Quarterly Ranking hypothecation charge of Company (Private) Limited commencing on 11 June 2016 and Rupees 400 million on all present and ending on 11 March 2021 future plant and machinery of the Company with 25% margin (to be upgraded to first pari passu charge within 120 days from date of first drawdown).
2,690,113 4,128,097
5.2 Long term musharika Meezan Bank Limited 112,500 187,500 3 Month offer KIBOR + 0.50% Sixteen equal quarterly instalments Quarterly Quarterly First exclusive charge of Rupees 400 commenced on 14 March 2013 and million over specific plant and ending on 14 December 2016. machinery of the Company. Dubai Islamic Bank 742,857 800,000 3 Month offer KIBOR + 0.40% Fourteen equal quarterly instalments Quarterly Quarterly First pari passu hypothecation charge Pakistan Limited commenced on 03 June 2015 and of Rupees 1,067 million on all present ending on 03 September 2018. and future fixed assets (excluding land and building) of the Company including but not limited to plant and machinery, furniture and fixtures, accessories etc. (excluding plant and machinery in respect of which the Company has already created exclusive charges in favour of existing charge holders). Habib Bank Limited 999,991 999,991 3 Month offer KIBOR + 0.35% Forty two unequal instalments Quarterly Quarterly First pari passu hypothecation charge of commencing on 28 August 2015 Rupees 2,000 million on plant and and ending on 04 May 2019. machinery of the Company excluding specific and exclusive charges. Habib Bank Limited 1,000,009 – 3 Month offer KIBOR + 0.35% Fifty six unequal instalments Quarterly Quarterly First pari passu charge of Rupees 1,333 commencing on 19 May 2016 million on plant and machinery of the and ending on 01 June 2020. Company (excluding specific and exclusive charges in favour of existing creditors) Meezan Bank Limited 375,000 400,000 3 Month offer KIBOR + 0.50% Sixteen equal quarterly instalments Quarterly Quarterly Exclusive hypothecation charge of commenced on 17 June 2015 Rupees 533 million over specific assets and ending on 17 March 2019. of the Company with 25% margin.
Meezan Bank Limited 445,000 445,000 3 Month offer KIBOR + 0.50% Sixteen equal quarterly instalments Quarterly Quarterly Exclusive hypothecation charge of commencing on 17 July 2015 and Rupees 594 million over specific assets ending on 17 April 2019. of the Company with 25% margin. Standard Chartered 1,000,000 1,000,000 3 Month offer KIBOR + 0.20% Sixteen equal quarterly instalments Quarterly Quarterly Specific charge of Rupees 1,334 million Bank (Pakistan) Limited commencing on 27 September over fixed assets of the Company 2015 and ending on 27 June 2019. inclusive of 25% margin.
TOTAL 4,675,357 3,832,491
Notes to the Financial StatementsFor the year ended June 30, 2015
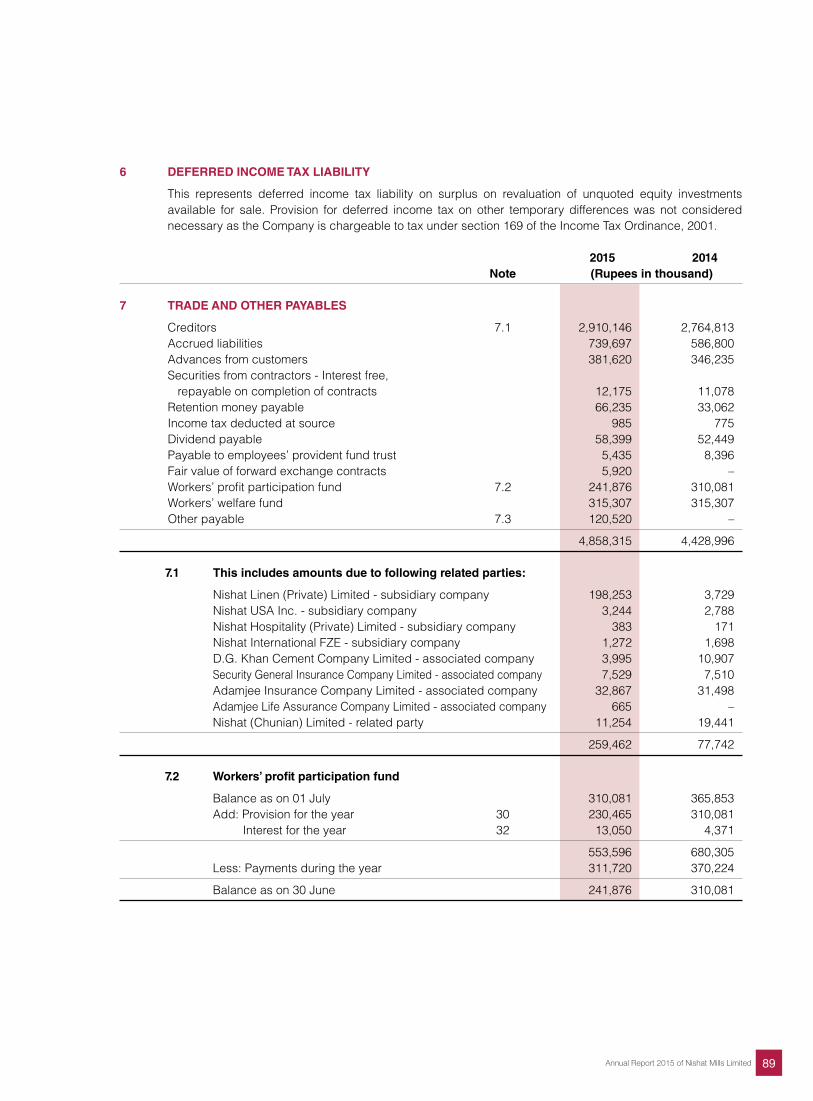
89Annual Report 2015 of Nishat Mills Limited
6 DEFERRED INCOME TAX LIABILITY
This represents deferred income tax liability on surplus on revaluation of unquoted equity investments available for sale. Provision for deferred income tax on other temporary differences was not considered necessary as the Company is chargeable to tax under section 169 of the Income Tax Ordinance, 2001.
2015 2014 Note (Rupees in thousand) 7 TRADE AND OTHER PAYABLES
Creditors 7.1 2,910,146 2,764,813 Accrued liabilities 739,697 586,800 Advances from customers 381,620 346,235 Securities from contractors - Interest free, repayable on completion of contracts 12,175 11,078 Retention money payable 66,235 33,062 Income tax deducted at source 985 775 Dividend payable 58,399 52,449 Payable to employees’ provident fund trust 5,435 8,396 Fair value of forward exchange contracts 5,920 – Workers’ profit participation fund 7.2 241,876 310,081 Workers’ welfare fund 315,307 315,307 Other payable 7.3 120,520 –
4,858,315 4,428,996
7.1 This includes amounts due to following related parties:
Nishat Linen (Private) Limited - subsidiary company 198,253 3,729 Nishat USA Inc. - subsidiary company 3,244 2,788 Nishat Hospitality (Private) Limited - subsidiary company 383 171 Nishat International FZE - subsidiary company 1,272 1,698 D.G. Khan Cement Company Limited - associated company 3,995 10,907 Security General Insurance Company Limited - associated company 7,529 7,510 Adamjee Insurance Company Limited - associated company 32,867 31,498 Adamjee Life Assurance Company Limited - associated company 665 – Nishat (Chunian) Limited - related party 11,254 19,441
259,462 77,742 7.2 Workers’ profit participation fund
Balance as on 01 July 310,081 365,853 Add: Provision for the year 30 230,465 310,081 Interest for the year 32 13,050 4,371
553,596 680,305 Less: Payments during the year 311,720 370,224
Balance as on 30 June 241,876 310,081
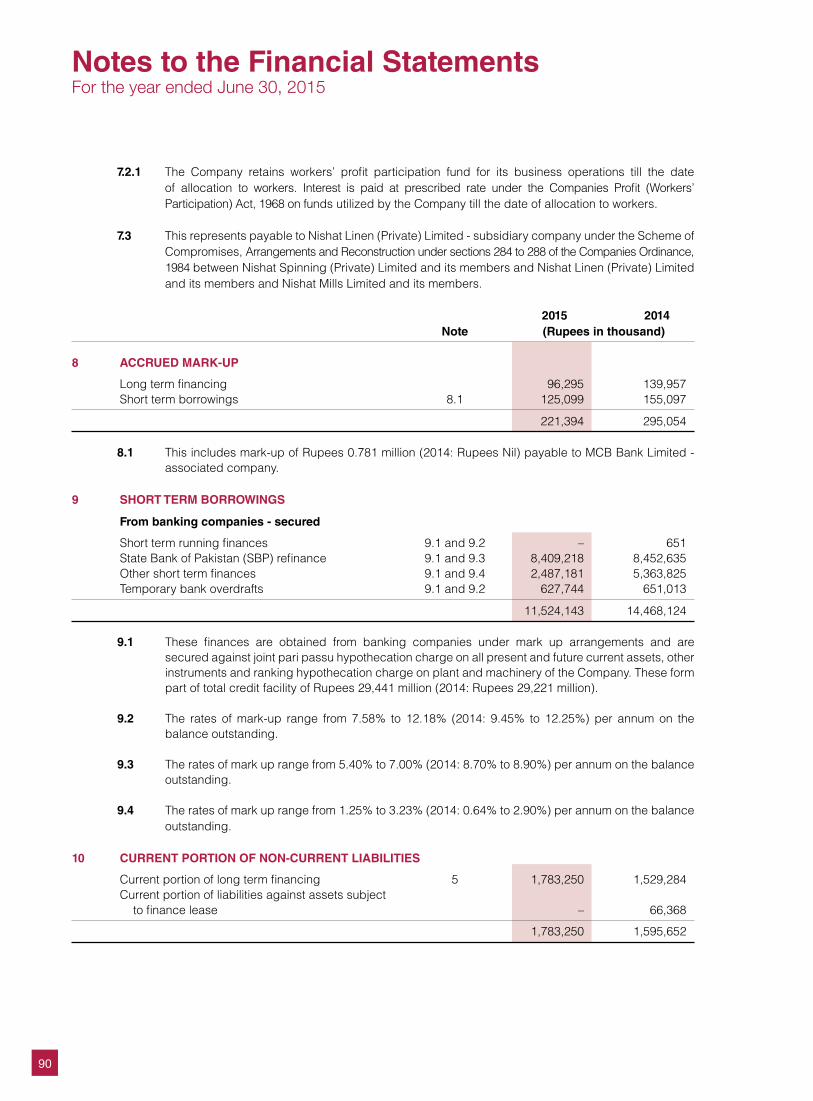
90
7.2.1 The Company retains workers’ profit participation fund for its business operations till the date of allocation to workers. Interest is paid at prescribed rate under the Companies Profit (Workers’ Participation) Act, 1968 on funds utilized by the Company till the date of allocation to workers.
7.3 This represents payable to Nishat Linen (Private) Limited - subsidiary company under the Scheme of
Compromises, Arrangements and Reconstruction under sections 284 to 288 of the Companies Ordinance, 1984 between Nishat Spinning (Private) Limited and its members and Nishat Linen (Private) Limited and its members and Nishat Mills Limited and its members.
2015 2014 Note (Rupees in thousand)
8 ACCRUED MARK-UP
Long term financing 96,295 139,957 Short term borrowings 8.1 125,099 155,097
221,394 295,054
8.1 This includes mark-up of Rupees 0.781 million (2014: Rupees Nil) payable to MCB Bank Limited - associated company.
9 SHORT TERM BORROWINGS
From banking companies - secured
Short term running finances 9.1 and 9.2 – 651 State Bank of Pakistan (SBP) refinance 9.1 and 9.3 8,409,218 8,452,635 Other short term finances 9.1 and 9.4 2,487,181 5,363,825 Temporary bank overdrafts 9.1 and 9.2 627,744 651,013
11,524,143 14,468,124
9.1 These finances are obtained from banking companies under mark up arrangements and are secured against joint pari passu hypothecation charge on all present and future current assets, other instruments and ranking hypothecation charge on plant and machinery of the Company. These form part of total credit facility of Rupees 29,441 million (2014: Rupees 29,221 million).
9.2 The rates of mark-up range from 7.58% to 12.18% (2014: 9.45% to 12.25%) per annum on the
balance outstanding. 9.3 The rates of mark up range from 5.40% to 7.00% (2014: 8.70% to 8.90%) per annum on the balance
outstanding. 9.4 The rates of mark up range from 1.25% to 3.23% (2014: 0.64% to 2.90%) per annum on the balance
outstanding.
10 CURRENT PORTION OF NON-CURRENT LIABILITIES
Current portion of long term financing 5 1,783,250 1,529,284 Current portion of liabilities against assets subject to finance lease – 66,368
1,783,250 1,595,652
Notes to the Financial StatementsFor the year ended June 30, 2015
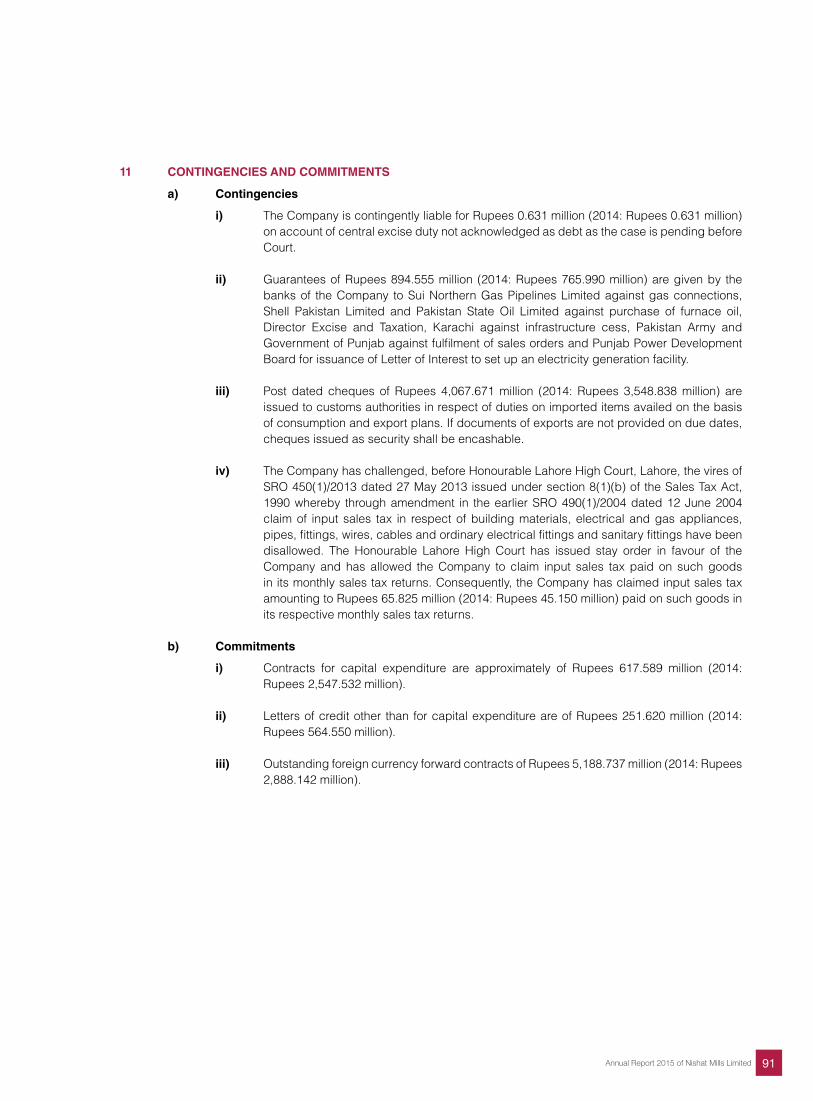
91Annual Report 2015 of Nishat Mills Limited
11 CONTINGENCIES AND COMMITMENTS
a) Contingencies
i) The Company is contingently liable for Rupees 0.631 million (2014: Rupees 0.631 million) on account of central excise duty not acknowledged as debt as the case is pending before Court.
ii) Guarantees of Rupees 894.555 million (2014: Rupees 765.990 million) are given by the
banks of the Company to Sui Northern Gas Pipelines Limited against gas connections, Shell Pakistan Limited and Pakistan State Oil Limited against purchase of furnace oil, Director Excise and Taxation, Karachi against infrastructure cess, Pakistan Army and Government of Punjab against fulfilment of sales orders and Punjab Power Development Board for issuance of Letter of Interest to set up an electricity generation facility.
iii) Post dated cheques of Rupees 4,067.671 million (2014: Rupees 3,548.838 million) are
issued to customs authorities in respect of duties on imported items availed on the basis of consumption and export plans. If documents of exports are not provided on due dates, cheques issued as security shall be encashable.
iv) The Company has challenged, before Honourable Lahore High Court, Lahore, the vires of
SRO 450(1)/2013 dated 27 May 2013 issued under section 8(1)(b) of the Sales Tax Act, 1990 whereby through amendment in the earlier SRO 490(1)/2004 dated 12 June 2004 claim of input sales tax in respect of building materials, electrical and gas appliances, pipes, fittings, wires, cables and ordinary electrical fittings and sanitary fittings have been disallowed. The Honourable Lahore High Court has issued stay order in favour of the Company and has allowed the Company to claim input sales tax paid on such goods in its monthly sales tax returns. Consequently, the Company has claimed input sales tax amounting to Rupees 65.825 million (2014: Rupees 45.150 million) paid on such goods in its respective monthly sales tax returns.
b) Commitments
i) Contracts for capital expenditure are approximately of Rupees 617.589 million (2014: Rupees 2,547.532 million).
ii) Letters of credit other than for capital expenditure are of Rupees 251.620 million (2014:
Rupees 564.550 million). iii) Outstanding foreign currency forward contracts of Rupees 5,188.737 million (2014: Rupees
2,888.142 million).
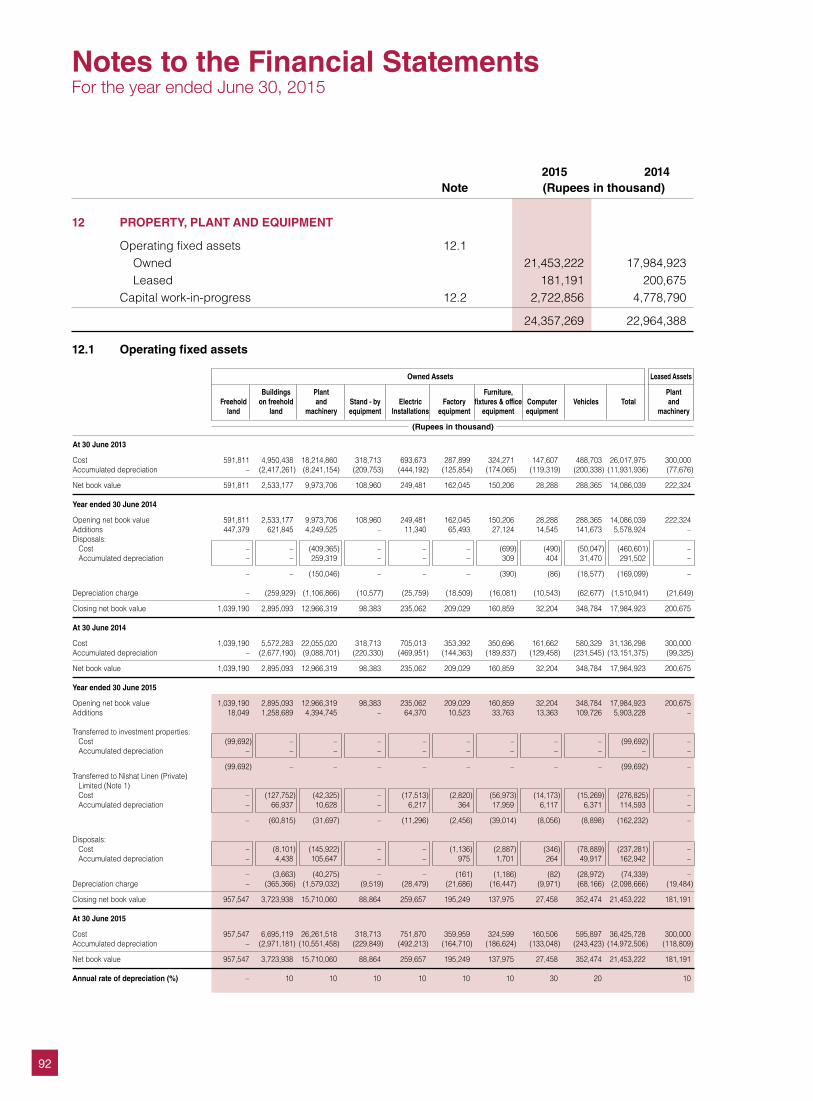
92
2015 2014 Note (Rupees in thousand)
12 PROPERTY, PLANT AND EQUIPMENT
Operating fixed assets 12.1 Owned 21,453,222 17,984,923 Leased 181,191 200,675 Capital work-in-progress 12.2 2,722,856 4,778,790
24,357,269 22,964,388
12.1 Operating fixed assets
At 30 June 2013
Cost 591,811 4,950,438 18,214,860 318,713 693,673 287,899 324,271 147,607 488,703 26,017,975 300,000 Accumulated depreciation – (2,417,261) (8,241,154) (209,753) (444,192) (125,854) (174,065) (119,319) (200,338) (11,931,936) (77,676)
Net book value 591,811 2,533,177 9,973,706 108,960 249,481 162,045 150,206 28,288 288,365 14,086,039 222,324 Year ended 30 June 2014
Opening net book value 591,811 2,533,177 9,973,706 108,960 249,481 162,045 150,206 28,288 288,365 14,086,039 222,324 Additions 447,379 621,845 4,249,525 – 11,340 65,493 27,124 14,545 141,673 5,578,924 – Disposals: Cost – – (409,365) – – – (699) (490) (50,047) (460,601) – Accumulated depreciation – – 259,319 – – – 309 404 31,470 291,502 –
– – (150,046) – – – (390) (86) (18,577) (169,099) –
Depreciation charge – (259,929) (1,106,866) (10,577) (25,759) (18,509) (16,081) (10,543) (62,677) (1,510,941) (21,649)
Closing net book value 1,039,190 2,895,093 12,966,319 98,383 235,062 209,029 160,859 32,204 348,784 17,984,923 200,675 At 30 June 2014
Cost 1,039,190 5,572,283 22,055,020 318,713 705,013 353,392 350,696 161,662 580,329 31,136,298 300,000 Accumulated depreciation – (2,677,190) (9,088,701) (220,330) (469,951) (144,363) (189,837) (129,458) (231,545) (13,151,375) (99,325)
Net book value 1,039,190 2,895,093 12,966,319 98,383 235,062 209,029 160,859 32,204 348,784 17,984,923 200,675 Year ended 30 June 2015
Opening net book value 1,039,190 2,895,093 12,966,319 98,383 235,062 209,029 160,859 32,204 348,784 17,984,923 200,675 Additions 18,049 1,258,689 4,394,745 – 64,370 10,523 33,763 13,363 109,726 5,903,228 – Transferred to investment properties: Cost (99,692) – – – – – – – – (99,692) – Accumulated depreciation – – – – – – – – – – –
(99,692) – – – – – – – – (99,692) –Transferred to Nishat Linen (Private) Limited (Note 1) Cost – (127,752) (42,325) – (17,513) (2,820) (56,973) (14,173) (15,269) (276,825) – Accumulated depreciation – 66,937 10,628 – 6,217 364 17,959 6,117 6,371 114,593 –
– (60,815) (31,697) – (11,296) (2,456) (39,014) (8,056) (8,898) (162,232) – Disposals: Cost – (8,101) (145,922) – – (1,136) (2,887) (346) (78,889) (237,281) – Accumulated depreciation – 4,438 105,647 – – 975 1,701 264 49,917 162,942 –
– (3,663) (40,275) – – (161) (1,186) (82) (28,972) (74,339) –Depreciation charge – (365,366) (1,579,032) (9,519) (28,479) (21,686) (16,447) (9,971) (68,166) (2,098,666) (19,484)
Closing net book value 957,547 3,723,938 15,710,060 88,864 259,657 195,249 137,975 27,458 352,474 21,453,222 181,191 At 30 June 2015
Cost 957,547 6,695,119 26,261,518 318,713 751,870 359,959 324,599 160,506 595,897 36,425,728 300,000 Accumulated depreciation – (2,971,181) (10,551,458) (229,849) (492,213) (164,710) (186,624) (133,048) (243,423) (14,972,506) (118,809)
Net book value 957,547 3,723,938 15,710,060 88,864 259,657 195,249 137,975 27,458 352,474 21,453,222 181,191 Annual rate of depreciation (%) – 10 10 10 10 10 10 30 20 10
Owned Assets Leased Assets
Buildings Plant Furniture, Plant Freehold on freehold and Stand - by Electric Factory fixtures & office Computer Vehicles Total and land land machinery equipment Installations equipment equipment equipment machinery
(Rupees in thousand)
Notes to the Financial StatementsFor the year ended June 30, 2015
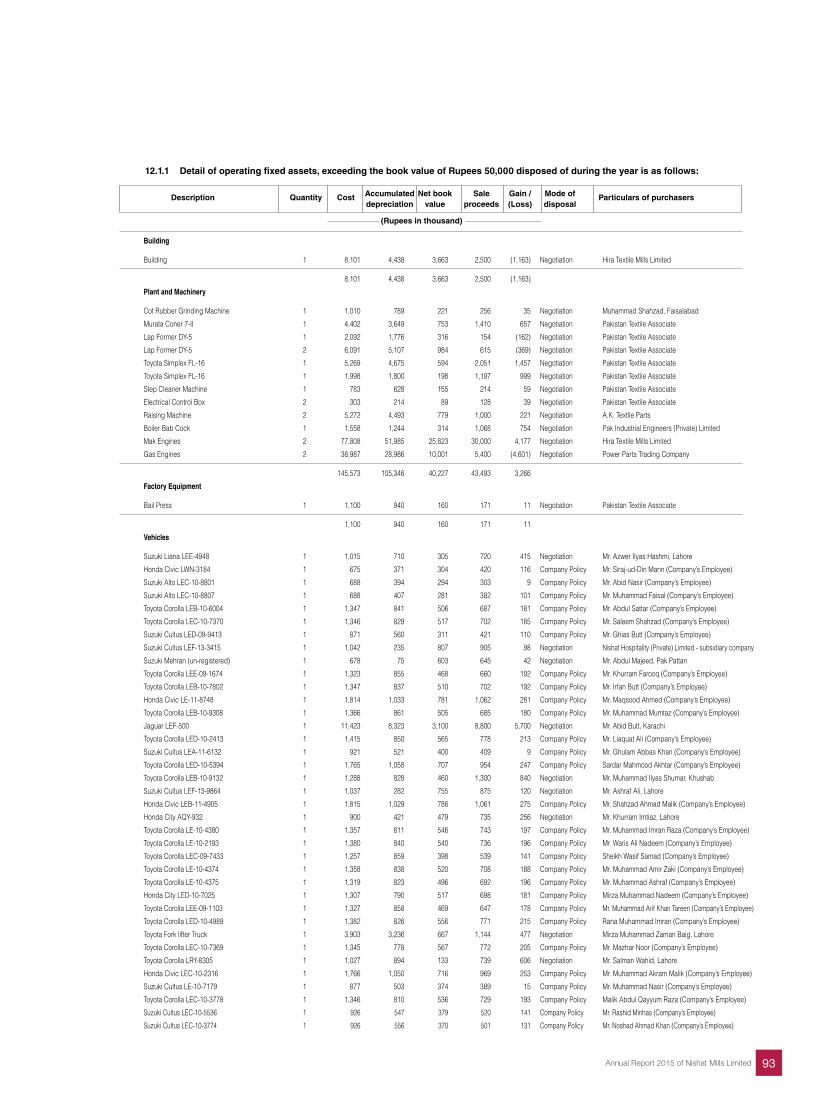
93Annual Report 2015 of Nishat Mills Limited
Building
Building 1 8,101 4,438 3,663 2,500 (1,163) Negotiation Hira Textile Mills Limited
8,101 4,438 3,663 2,500 (1,163)
Plant and Machinery
Cot Rubber Grinding Machine 1 1,010 789 221 256 35 Negotiation Muhammad Shahzad, Faisalabad
Murata Coner 7-II 1 4,402 3,649 753 1,410 657 Negotiation Pakistan Textile Associate
Lap Former DY-5 1 2,092 1,776 316 154 (162) Negotiation Pakistan Textile Associate
Lap Former DY-5 2 6,091 5,107 984 615 (369) Negotiation Pakistan Textile Associate
Toyota Simplex FL-16 1 5,269 4,675 594 2,051 1,457 Negotiation Pakistan Textile Associate
Toyota Simplex FL-16 1 1,998 1,800 198 1,197 999 Negotiation Pakistan Textile Associate
Step Cleaner Machine 1 783 628 155 214 59 Negotiation Pakistan Textile Associate
Electrical Control Box 2 303 214 89 128 39 Negotiation Pakistan Textile Associate
Raising Machine 2 5,272 4,493 779 1,000 221 Negotiation A.K. Textile Parts
Boiler Bab Cock 1 1,558 1,244 314 1,068 754 Negotiation Pak Industrial Engineers (Private) Limited
Mak Engines 2 77,808 51,985 25,823 30,000 4,177 Negotiation Hira Textile Mills Limited
Gas Engines 2 38,987 28,986 10,001 5,400 (4,601) Negotiation Power Parts Trading Company
145,573 105,346 40,227 43,493 3,266
Factory Equipment
Bail Press 1 1,100 940 160 171 11 Negotiation Pakistan Textile Associate
1,100 940 160 171 11
Vehicles
Suzuki Liana LEE-4948 1 1,015 710 305 720 415 Negotiation Mr. Azwer Ilyas Hashmi, Lahore
Honda Civic LWN-3184 1 675 371 304 420 116 Company Policy Mr. Siraj-ud-Din Mann (Company’s Employee)
Suzuki Alto LEC-10-8801 1 688 394 294 303 9 Company Policy Mr. Abid Nasir (Company’s Employee)
Suzuki Alto LEC-10-8807 1 688 407 281 382 101 Company Policy Mr. Muhammad Faisal (Company’s Employee)
Toyota Corolla LEB-10-6004 1 1,347 841 506 687 181 Company Policy Mr. Abdul Sattar (Company’s Employee)
Toyota Corolla LEC-10-7370 1 1,346 829 517 702 185 Company Policy Mr. Saleem Shahzad (Company’s Employee)
Suzuki Cultus LED-09-9413 1 871 560 311 421 110 Company Policy Mr. Ghias Butt (Company’s Employee)
Suzuki Cultus LEF-13-3415 1 1,042 235 807 905 98 Negotiation Nishat Hospitality (Private) Limited - subsidiary company
Suzuki Mehran (un-registered) 1 678 75 603 645 42 Negotiation Mr. Abdul Majeed, Pak Pattan
Toyota Corolla LEE-09-1674 1 1,323 855 468 660 192 Company Policy Mr. Khurram Farooq (Company’s Employee)
Toyota Corolla LEB-10-7802 1 1,347 837 510 702 192 Company Policy Mr. Irfan Butt (Company’s Employee)
Honda Civic LE-11-8748 1 1,814 1,033 781 1,062 281 Company Policy Mr. Maqsood Ahmed (Company’s Employee)
Toyota Corolla LEB-10-9308 1 1,366 861 505 685 180 Company Policy Mr. Muhammad Mumtaz (Company’s Employee)
Jaguar LEF-500 1 11,423 8,323 3,100 8,800 5,700 Negotiation Mr. Abid Butt, Karachi
Toyota Corolla LED-10-2413 1 1,415 850 565 778 213 Company Policy Mr. Liaquat Ali (Company’s Employee)
Suzuki Cultus LEA-11-6132 1 921 521 400 409 9 Company Policy Mr. Ghulam Abbas Khan (Company’s Employee)
Toyota Corolla LED-10-5394 1 1,765 1,058 707 954 247 Company Policy Sardar Mahmood Akhtar (Company’s Employee)
Toyota Corolla LEB-10-9132 1 1,288 828 460 1,300 840 Negotiation Mr. Muhammad Ilyas Shumar, Khushab
Suzuki Cultus LEF-13-9864 1 1,037 282 755 875 120 Negotiation Mr. Ashraf Ali, Lahore
Honda Civic LEB-11-4905 1 1,815 1,029 786 1,061 275 Company Policy Mr. Shahzad Ahmad Malik (Company’s Employee)
Honda City AQY-932 1 900 421 479 735 256 Negotiation Mr. Khurram Imtiaz, Lahore
Toyota Corolla LE-10-4380 1 1,357 811 546 743 197 Company Policy Mr. Muhammad Imran Raza (Company’s Employee)
Toyota Corolla LE-10-2193 1 1,380 840 540 736 196 Company Policy Mr. Waris Ali Nadeem (Company’s Employee)
Toyota Corolla LEC-09-7433 1 1,257 859 398 539 141 Company Policy Sheikh Wasif Samad (Company’s Employee)
Toyota Corolla LE-10-4374 1 1,358 838 520 708 188 Company Policy Mr. Muhammad Amir Zaki (Company’s Employee)
Toyota Corolla LE-10-4375 1 1,319 823 496 692 196 Company Policy Mr. Muhammad Ashraf (Company’s Employee)
Honda City LED-10-7025 1 1,307 790 517 698 181 Company Policy Mirza Muhammad Nadeem (Company’s Employee)
Toyota Corolla LEE-09-1103 1 1,327 858 469 647 178 Company Policy Mr. Muhammad Arif Khan Tareen (Company’s Employee)
Toyota Corolla LED-10-4989 1 1,382 826 556 771 215 Company Policy Rana Muhammad Imran (Company’s Employee)
Toyota Fork lifter Truck 1 3,903 3,236 667 1,144 477 Negotiation Mirza Muhammad Zaman Baig, Lahore
Toyota Corolla LEC-10-7369 1 1,345 778 567 772 205 Company Policy Mr. Mazhar Noor (Company’s Employee)
Toyota Corolla LRY-8305 1 1,027 894 133 739 606 Negotiation Mr. Salman Wahid, Lahore
Honda Civic LEC-10-2316 1 1,766 1,050 716 969 253 Company Policy Mr. Muhammad Akram Malik (Company’s Employee)
Suzuki Cultus LE-10-7179 1 877 503 374 389 15 Company Policy Mr. Muhammad Nasir (Company’s Employee)
Toyota Corolla LEC-10-3778 1 1,346 810 536 729 193 Company Policy Malik Abdul Qayyum Raza (Company’s Employee)
Suzuki Cultus LEC-10-5536 1 926 547 379 520 141 Company Policy Mr. Rashid Minhas (Company’s Employee)
Suzuki Cultus LEC-10-3774 1 926 556 370 501 131 Company Policy Mr. Noshad Ahmad Khan (Company’s Employee)
12.1.1 Detail of operating fixed assets, exceeding the book value of Rupees 50,000 disposed of during the year is as follows:
Description Quantity Cost Accumulated Net book Sale Gain / Mode of Particulars of purchasers depreciation value proceeds (Loss) disposal
(Rupees in thousand)
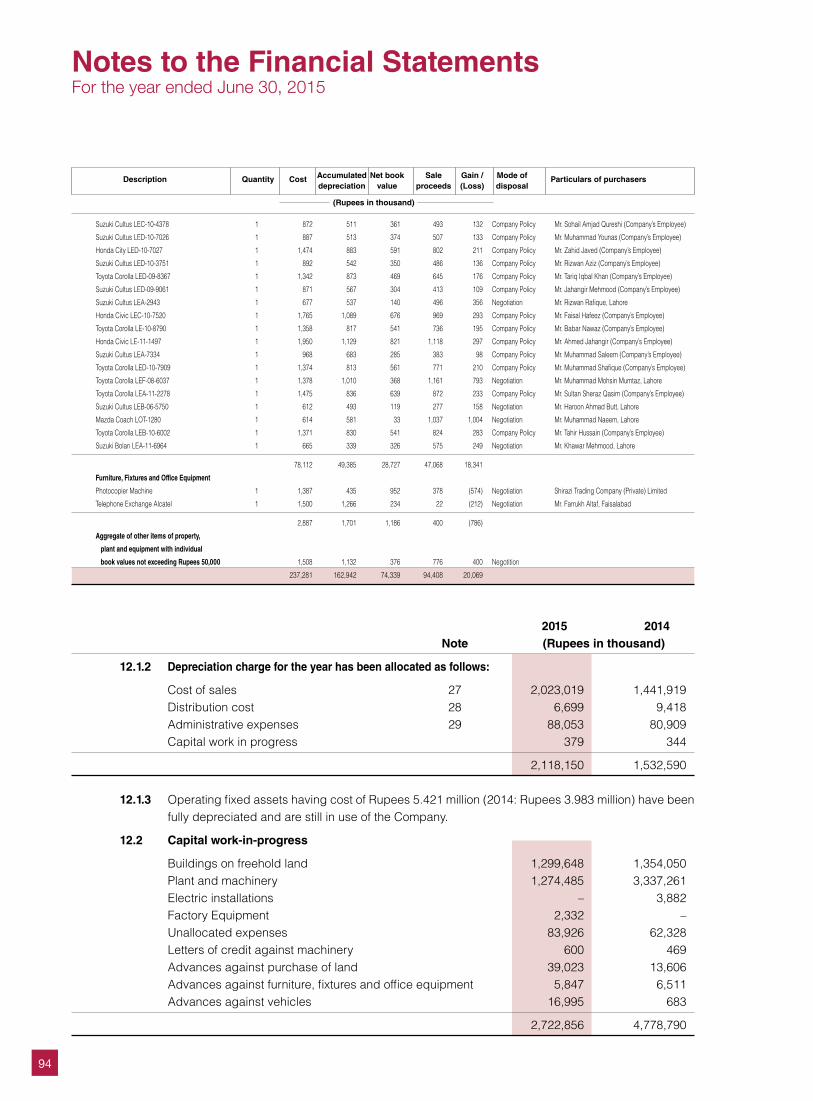
94
Description Quantity Cost Accumulated Net book Sale Gain / Mode of Particulars of purchasers depreciation value proceeds (Loss) disposal
(Rupees in thousand)
Suzuki Cultus LEC-10-4378 1 872 511 361 493 132 Company Policy Mr. Sohail Amjad Qureshi (Company’s Employee)
Suzuki Cultus LED-10-7026 1 887 513 374 507 133 Company Policy Mr. Muhammad Younas (Company’s Employee)
Honda City LED-10-7027 1 1,474 883 591 802 211 Company Policy Mr. Zahid Javed (Company’s Employee)
Suzuki Cultus LED-10-3751 1 892 542 350 486 136 Company Policy Mr. Rizwan Aziz (Company’s Employee)
Toyota Corolla LED-09-8367 1 1,342 873 469 645 176 Company Policy Mr. Tariq Iqbal Khan (Company’s Employee)
Suzuki Cultus LED-09-9061 1 871 567 304 413 109 Company Policy Mr. Jahangir Mehmood (Company’s Employee)
Suzuki Cultus LEA-2943 1 677 537 140 496 356 Negotiation Mr. Rizwan Rafique, Lahore
Honda Civic LEC-10-7520 1 1,765 1,089 676 969 293 Company Policy Mr. Faisal Hafeez (Company’s Employee)
Toyota Corolla LE-10-8790 1 1,358 817 541 736 195 Company Policy Mr. Babar Nawaz (Company’s Employee)
Honda Civic LE-11-1497 1 1,950 1,129 821 1,118 297 Company Policy Mr. Ahmed Jahangir (Company’s Employee)
Suzuki Cultus LEA-7334 1 968 683 285 383 98 Company Policy Mr. Muhammad Saleem (Company’s Employee)
Toyota Corolla LED-10-7909 1 1,374 813 561 771 210 Company Policy Mr. Muhammad Shafique (Company’s Employee)
Toyota Corolla LEF-08-6037 1 1,378 1,010 368 1,161 793 Negotiation Mr. Muhammad Mohsin Mumtaz, Lahore
Toyota Corolla LEA-11-2278 1 1,475 836 639 872 233 Company Policy Mr. Sultan Sheraz Qasim (Company’s Employee)
Suzuki Cultus LEB-06-5750 1 612 493 119 277 158 Negotiation Mr. Haroon Ahmad Butt, Lahore
Mazda Coach LOT-1280 1 614 581 33 1,037 1,004 Negotiation Mr. Muhammad Naeem, Lahore
Toyota Corolla LEB-10-6002 1 1,371 830 541 824 283 Company Policy Mr. Tahir Hussain (Company’s Employee)
Suzuki Bolan LEA-11-6964 1 665 339 326 575 249 Negotiation Mr. Khawar Mehmood, Lahore
78,112 49,385 28,727 47,068 18,341
Furniture, Fixtures and Office Equipment
Photocopier Machine 1 1,387 435 952 378 (574) Negotiation Shirazi Trading Company (Private) Limited
Telephone Exchange Alcatel 1 1,500 1,266 234 22 (212) Negotiation Mr. Farrukh Altaf, Faisalabad
2,887 1,701 1,186 400 (786)
Aggregate of other items of property,
plant and equipment with individual
book values not exceeding Rupees 50,000 1,508 1,132 376 776 400 Negotition
237,281 162,942 74,339 94,408 20,069
2015 2014 Note (Rupees in thousand)
12.1.2 Depreciation charge for the year has been allocated as follows:
Cost of sales 27 2,023,019 1,441,919 Distribution cost 28 6,699 9,418 Administrative expenses 29 88,053 80,909 Capital work in progress 379 344
2,118,150 1,532,590 12.1.3 Operating fixed assets having cost of Rupees 5.421 million (2014: Rupees 3.983 million) have been
fully depreciated and are still in use of the Company.
12.2 Capital work-in-progress
Buildings on freehold land 1,299,648 1,354,050 Plant and machinery 1,274,485 3,337,261 Electric installations – 3,882 Factory Equipment 2,332 – Unallocated expenses 83,926 62,328 Letters of credit against machinery 600 469 Advances against purchase of land 39,023 13,606 Advances against furniture, fixtures and office equipment 5,847 6,511 Advances against vehicles 16,995 683
2,722,856 4,778,790
Notes to the Financial StatementsFor the year ended June 30, 2015
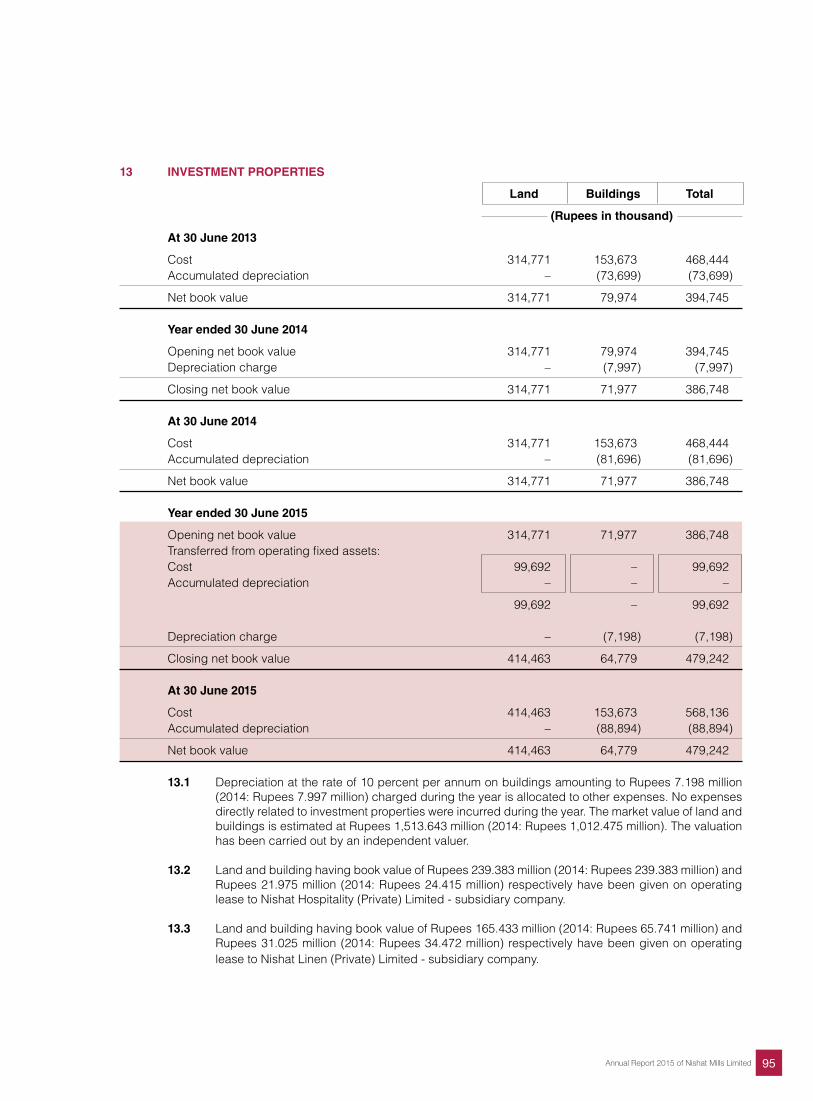
95Annual Report 2015 of Nishat Mills Limited
13 INVESTMENT PROPERTIES
Land Buildings Total
(Rupees in thousand)
At 30 June 2013
Cost 314,771 153,673 468,444 Accumulated depreciation – (73,699) (73,699)
Net book value 314,771 79,974 394,745 Year ended 30 June 2014
Opening net book value 314,771 79,974 394,745 Depreciation charge – (7,997) (7,997)
Closing net book value 314,771 71,977 386,748 At 30 June 2014
Cost 314,771 153,673 468,444 Accumulated depreciation – (81,696) (81,696)
Net book value 314,771 71,977 386,748 Year ended 30 June 2015
Opening net book value 314,771 71,977 386,748 Transferred from operating fixed assets: Cost 99,692 – 99,692 Accumulated depreciation – – –
99,692 – 99,692 Depreciation charge – (7,198) (7,198)
Closing net book value 414,463 64,779 479,242 At 30 June 2015
Cost 414,463 153,673 568,136 Accumulated depreciation – (88,894) (88,894)
Net book value 414,463 64,779 479,242
13.1 Depreciation at the rate of 10 percent per annum on buildings amounting to Rupees 7.198 million (2014: Rupees 7.997 million) charged during the year is allocated to other expenses. No expenses directly related to investment properties were incurred during the year. The market value of land and buildings is estimated at Rupees 1,513.643 million (2014: Rupees 1,012.475 million). The valuation has been carried out by an independent valuer.
13.2 Land and building having book value of Rupees 239.383 million (2014: Rupees 239.383 million) and
Rupees 21.975 million (2014: Rupees 24.415 million) respectively have been given on operating lease to Nishat Hospitality (Private) Limited - subsidiary company.
13.3 Land and building having book value of Rupees 165.433 million (2014: Rupees 65.741 million) and
Rupees 31.025 million (2014: Rupees 34.472 million) respectively have been given on operating lease to Nishat Linen (Private) Limited - subsidiary company.
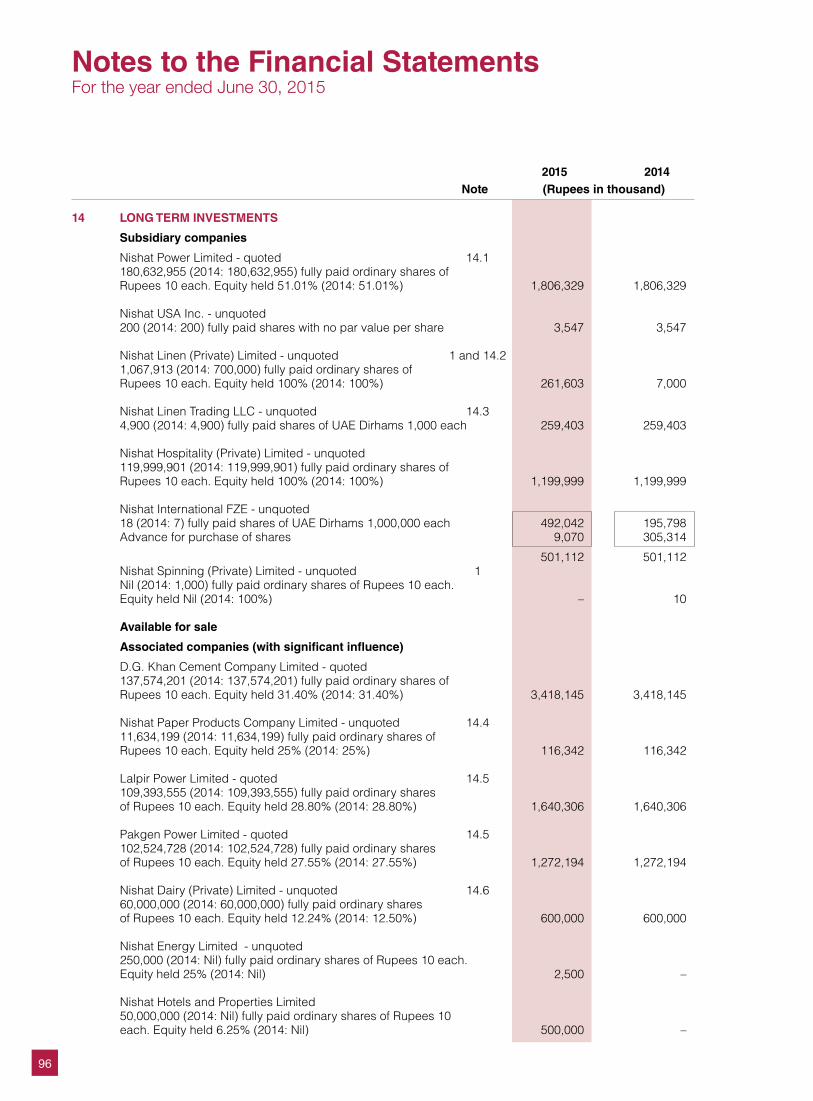
96
2015 2014 Note (Rupees in thousand)
14 LONG TERM INVESTMENTS
Subsidiary companies
Nishat Power Limited - quoted 14.1 180,632,955 (2014: 180,632,955) fully paid ordinary shares of Rupees 10 each. Equity held 51.01% (2014: 51.01%) 1,806,329 1,806,329 Nishat USA Inc. - unquoted 200 (2014: 200) fully paid shares with no par value per share 3,547 3,547 Nishat Linen (Private) Limited - unquoted 1 and 14.2 1,067,913 (2014: 700,000) fully paid ordinary shares of Rupees 10 each. Equity held 100% (2014: 100%) 261,603 7,000 Nishat Linen Trading LLC - unquoted 14.3 4,900 (2014: 4,900) fully paid shares of UAE Dirhams 1,000 each 259,403 259,403 Nishat Hospitality (Private) Limited - unquoted 119,999,901 (2014: 119,999,901) fully paid ordinary shares of Rupees 10 each. Equity held 100% (2014: 100%) 1,199,999 1,199,999 Nishat International FZE - unquoted 18 (2014: 7) fully paid shares of UAE Dirhams 1,000,000 each 492,042 195,798 Advance for purchase of shares 9,070 305,314
501,112 501,112 Nishat Spinning (Private) Limited - unquoted 1 Nil (2014: 1,000) fully paid ordinary shares of Rupees 10 each. Equity held Nil (2014: 100%) – 10 Available for sale
Associated companies (with significant influence)
D.G. Khan Cement Company Limited - quoted 137,574,201 (2014: 137,574,201) fully paid ordinary shares of Rupees 10 each. Equity held 31.40% (2014: 31.40%) 3,418,145 3,418,145 Nishat Paper Products Company Limited - unquoted 14.4 11,634,199 (2014: 11,634,199) fully paid ordinary shares of Rupees 10 each. Equity held 25% (2014: 25%) 116,342 116,342 Lalpir Power Limited - quoted 14.5 109,393,555 (2014: 109,393,555) fully paid ordinary shares of Rupees 10 each. Equity held 28.80% (2014: 28.80%) 1,640,306 1,640,306 Pakgen Power Limited - quoted 14.5 102,524,728 (2014: 102,524,728) fully paid ordinary shares of Rupees 10 each. Equity held 27.55% (2014: 27.55%) 1,272,194 1,272,194 Nishat Dairy (Private) Limited - unquoted 14.6 60,000,000 (2014: 60,000,000) fully paid ordinary shares of Rupees 10 each. Equity held 12.24% (2014: 12.50%) 600,000 600,000 Nishat Energy Limited - unquoted 250,000 (2014: Nil) fully paid ordinary shares of Rupees 10 each. Equity held 25% (2014: Nil) 2,500 –
Nishat Hotels and Properties Limited 50,000,000 (2014: Nil) fully paid ordinary shares of Rupees 10 each. Equity held 6.25% (2014: Nil) 500,000 –
Notes to the Financial StatementsFor the year ended June 30, 2015
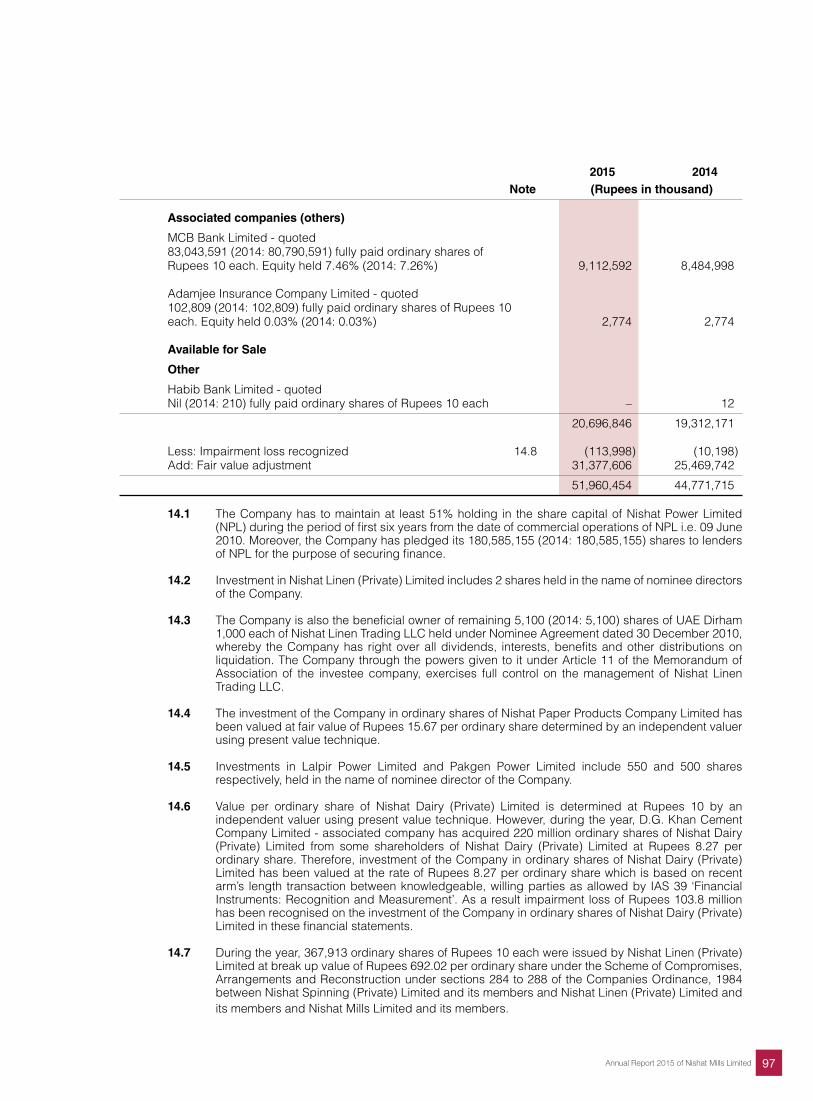
97Annual Report 2015 of Nishat Mills Limited
2015 2014 Note (Rupees in thousand) Associated companies (others)
MCB Bank Limited - quoted 83,043,591 (2014: 80,790,591) fully paid ordinary shares of Rupees 10 each. Equity held 7.46% (2014: 7.26%) 9,112,592 8,484,998 Adamjee Insurance Company Limited - quoted 102,809 (2014: 102,809) fully paid ordinary shares of Rupees 10 each. Equity held 0.03% (2014: 0.03%) 2,774 2,774 Available for Sale
Other
Habib Bank Limited - quoted Nil (2014: 210) fully paid ordinary shares of Rupees 10 each – 12
20,696,846 19,312,171 Less: Impairment loss recognized 14.8 (113,998) (10,198) Add: Fair value adjustment 31,377,606 25,469,742
51,960,454 44,771,715
14.1 The Company has to maintain at least 51% holding in the share capital of Nishat Power Limited (NPL) during the period of first six years from the date of commercial operations of NPL i.e. 09 June 2010. Moreover, the Company has pledged its 180,585,155 (2014: 180,585,155) shares to lenders of NPL for the purpose of securing finance.
14.2 Investment in Nishat Linen (Private) Limited includes 2 shares held in the name of nominee directors
of the Company. 14.3 The Company is also the beneficial owner of remaining 5,100 (2014: 5,100) shares of UAE Dirham
1,000 each of Nishat Linen Trading LLC held under Nominee Agreement dated 30 December 2010, whereby the Company has right over all dividends, interests, benefits and other distributions on liquidation. The Company through the powers given to it under Article 11 of the Memorandum of Association of the investee company, exercises full control on the management of Nishat Linen Trading LLC.
14.4 The investment of the Company in ordinary shares of Nishat Paper Products Company Limited has
been valued at fair value of Rupees 15.67 per ordinary share determined by an independent valuer using present value technique.
14.5 Investments in Lalpir Power Limited and Pakgen Power Limited include 550 and 500 shares
respectively, held in the name of nominee director of the Company. 14.6 Value per ordinary share of Nishat Dairy (Private) Limited is determined at Rupees 10 by an
independent valuer using present value technique. However, during the year, D.G. Khan Cement Company Limited - associated company has acquired 220 million ordinary shares of Nishat Dairy (Private) Limited from some shareholders of Nishat Dairy (Private) Limited at Rupees 8.27 per ordinary share. Therefore, investment of the Company in ordinary shares of Nishat Dairy (Private) Limited has been valued at the rate of Rupees 8.27 per ordinary share which is based on recent arm’s length transaction between knowledgeable, willing parties as allowed by IAS 39 ‘Financial Instruments: Recognition and Measurement’. As a result impairment loss of Rupees 103.8 million has been recognised on the investment of the Company in ordinary shares of Nishat Dairy (Private) Limited in these financial statements.
14.7 During the year, 367,913 ordinary shares of Rupees 10 each were issued by Nishat Linen (Private)
Limited at break up value of Rupees 692.02 per ordinary share under the Scheme of Compromises, Arrangements and Reconstruction under sections 284 to 288 of the Companies Ordinance, 1984 between Nishat Spinning (Private) Limited and its members and Nishat Linen (Private) Limited and its members and Nishat Mills Limited and its members.
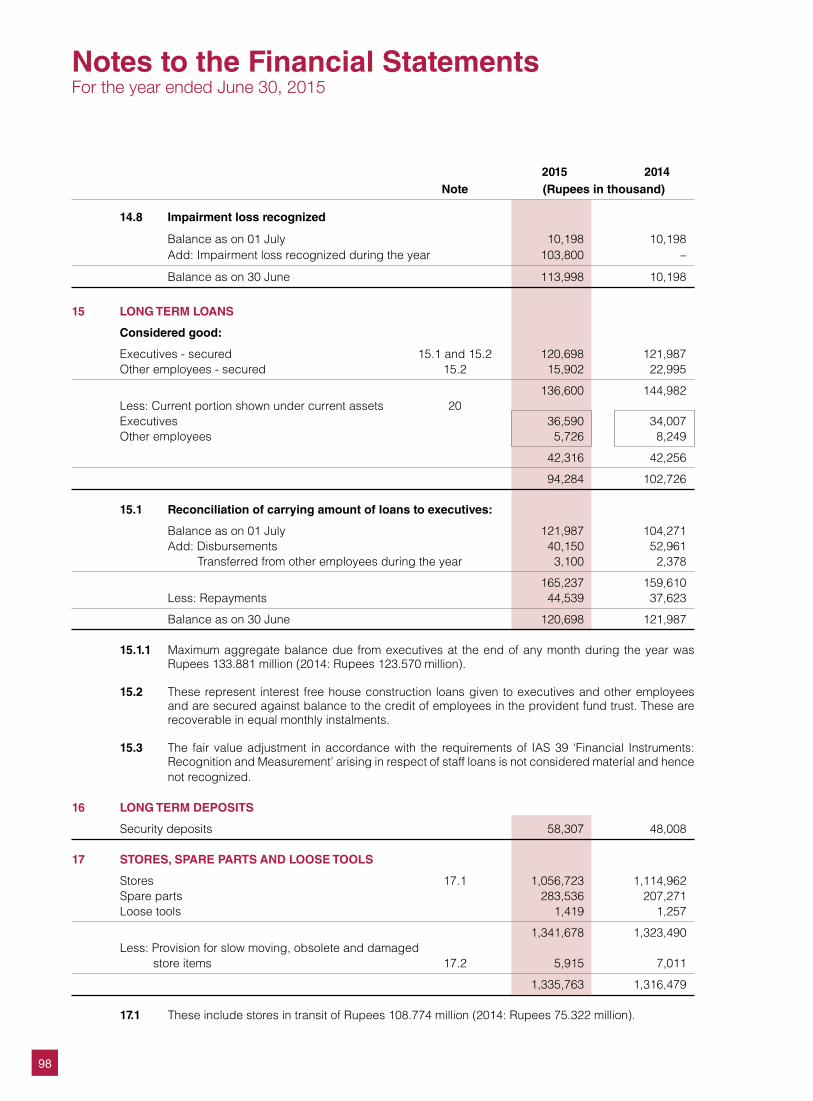
98
2015 2014 Note (Rupees in thousand)
14.8 Impairment loss recognized
Balance as on 01 July 10,198 10,198 Add: Impairment loss recognized during the year 103,800 –
Balance as on 30 June 113,998 10,198
15 LONG TERM LOANS
Considered good:
Executives - secured 15.1 and 15.2 120,698 121,987 Other employees - secured 15.2 15,902 22,995
136,600 144,982 Less: Current portion shown under current assets 20 Executives 36,590 34,007 Other employees 5,726 8,249
42,316 42,256
94,284 102,726 15.1 Reconciliation of carrying amount of loans to executives:
Balance as on 01 July 121,987 104,271 Add: Disbursements 40,150 52,961 Transferred from other employees during the year 3,100 2,378
165,237 159,610 Less: Repayments 44,539 37,623
Balance as on 30 June 120,698 121,987 15.1.1 Maximum aggregate balance due from executives at the end of any month during the year was
Rupees 133.881 million (2014: Rupees 123.570 million). 15.2 These represent interest free house construction loans given to executives and other employees
and are secured against balance to the credit of employees in the provident fund trust. These are recoverable in equal monthly instalments.
15.3 The fair value adjustment in accordance with the requirements of IAS 39 ‘Financial Instruments:
Recognition and Measurement’ arising in respect of staff loans is not considered material and hence not recognized.
16 LONG TERM DEPOSITS
Security deposits 58,307 48,008
17 STORES, SPARE PARTS AND LOOSE TOOLS
Stores 17.1 1,056,723 1,114,962 Spare parts 283,536 207,271 Loose tools 1,419 1,257
1,341,678 1,323,490 Less: Provision for slow moving, obsolete and damaged store items 17.2 5,915 7,011
1,335,763 1,316,479
17.1 These include stores in transit of Rupees 108.774 million (2014: Rupees 75.322 million).
Notes to the Financial StatementsFor the year ended June 30, 2015
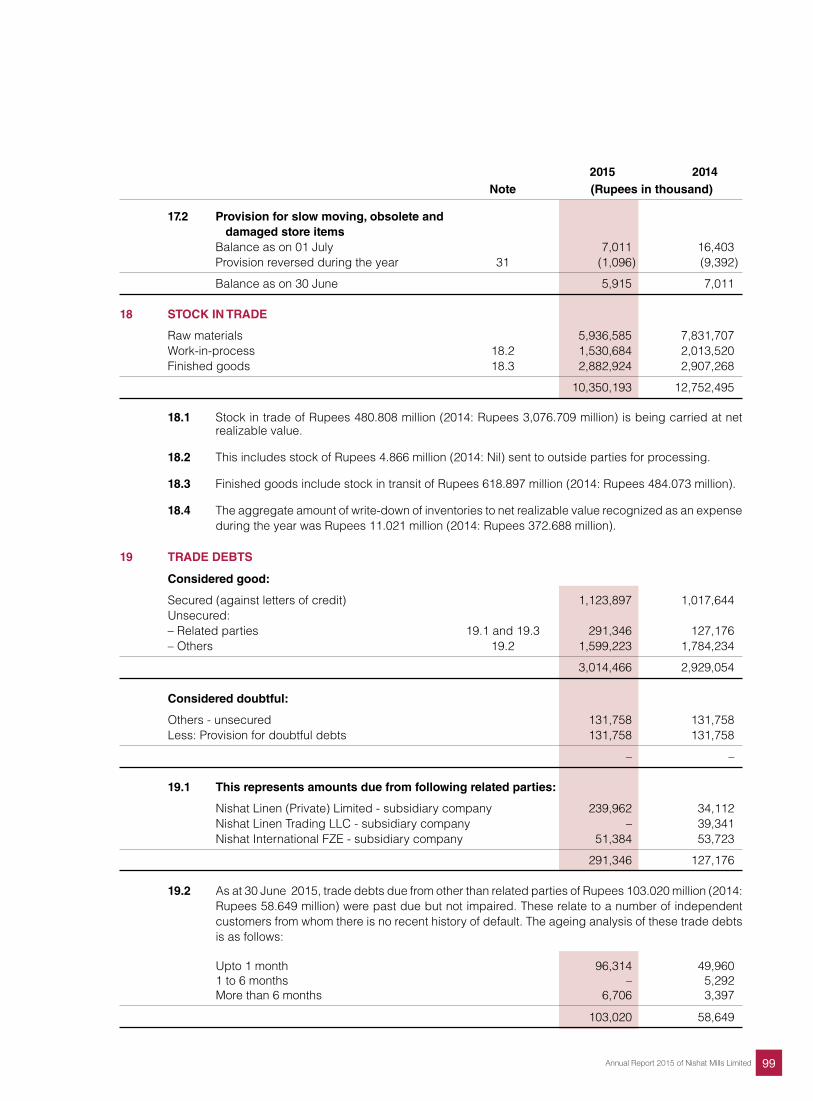
99Annual Report 2015 of Nishat Mills Limited
2015 2014 Note (Rupees in thousand)
17.2 Provision for slow moving, obsolete and damaged store items Balance as on 01 July 7,011 16,403 Provision reversed during the year 31 (1,096) (9,392)
Balance as on 30 June 5,915 7,011 18 STOCK IN TRADE
Raw materials 5,936,585 7,831,707 Work-in-process 18.2 1,530,684 2,013,520 Finished goods 18.3 2,882,924 2,907,268
10,350,193 12,752,495 18.1 Stock in trade of Rupees 480.808 million (2014: Rupees 3,076.709 million) is being carried at net
realizable value. 18.2 This includes stock of Rupees 4.866 million (2014: Nil) sent to outside parties for processing. 18.3 Finished goods include stock in transit of Rupees 618.897 million (2014: Rupees 484.073 million). 18.4 The aggregate amount of write-down of inventories to net realizable value recognized as an expense
during the year was Rupees 11.021 million (2014: Rupees 372.688 million).
19 TRADE DEBTS
Considered good:
Secured (against letters of credit) 1,123,897 1,017,644 Unsecured: – Related parties 19.1 and 19.3 291,346 127,176 – Others 19.2 1,599,223 1,784,234
3,014,466 2,929,054 Considered doubtful:
Others - unsecured 131,758 131,758 Less: Provision for doubtful debts 131,758 131,758
– – 19.1 This represents amounts due from following related parties:
Nishat Linen (Private) Limited - subsidiary company 239,962 34,112 Nishat Linen Trading LLC - subsidiary company – 39,341 Nishat International FZE - subsidiary company 51,384 53,723
291,346 127,176 19.2 As at 30 June 2015, trade debts due from other than related parties of Rupees 103.020 million (2014:
Rupees 58.649 million) were past due but not impaired. These relate to a number of independent customers from whom there is no recent history of default. The ageing analysis of these trade debts is as follows:
Upto 1 month 96,314 49,960 1 to 6 months – 5,292 More than 6 months 6,706 3,397
103,020 58,649
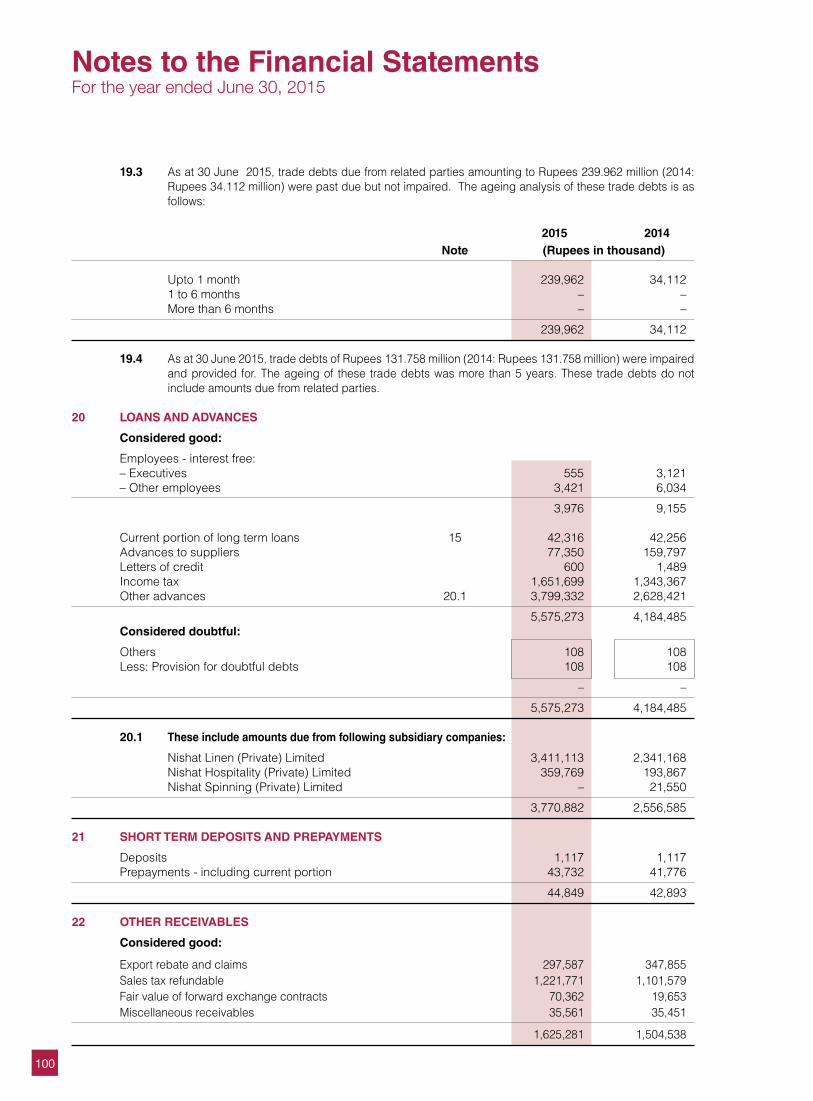
100
19.3 As at 30 June 2015, trade debts due from related parties amounting to Rupees 239.962 million (2014: Rupees 34.112 million) were past due but not impaired. The ageing analysis of these trade debts is as follows:
2015 2014 Note (Rupees in thousand) Upto 1 month 239,962 34,112 1 to 6 months – – More than 6 months – –
239,962 34,112 19.4 As at 30 June 2015, trade debts of Rupees 131.758 million (2014: Rupees 131.758 million) were impaired
and provided for. The ageing of these trade debts was more than 5 years. These trade debts do not include amounts due from related parties.
20 LOANS AND ADVANCES
Considered good:
Employees - interest free: – Executives 555 3,121 – Other employees 3,421 6,034
3,976 9,155
Current portion of long term loans 15 42,316 42,256 Advances to suppliers 77,350 159,797 Letters of credit 600 1,489 Income tax 1,651,699 1,343,367 Other advances 20.1 3,799,332 2,628,421
5,575,273 4,184,485 Considered doubtful:
Others 108 108 Less: Provision for doubtful debts 108 108
– –
5,575,273 4,184,485 20.1 These include amounts due from following subsidiary companies:
Nishat Linen (Private) Limited 3,411,113 2,341,168 Nishat Hospitality (Private) Limited 359,769 193,867 Nishat Spinning (Private) Limited – 21,550
3,770,882 2,556,585 21 SHORT TERM DEPOSITS AND PREPAYMENTS
Deposits 1,117 1,117 Prepayments - including current portion 43,732 41,776
44,849 42,893
22 OTHER RECEIVABLES
Considered good:
Export rebate and claims 297,587 347,855 Sales tax refundable 1,221,771 1,101,579 Fair value of forward exchange contracts 70,362 19,653 Miscellaneous receivables 35,561 35,451
1,625,281 1,504,538
Notes to the Financial StatementsFor the year ended June 30, 2015
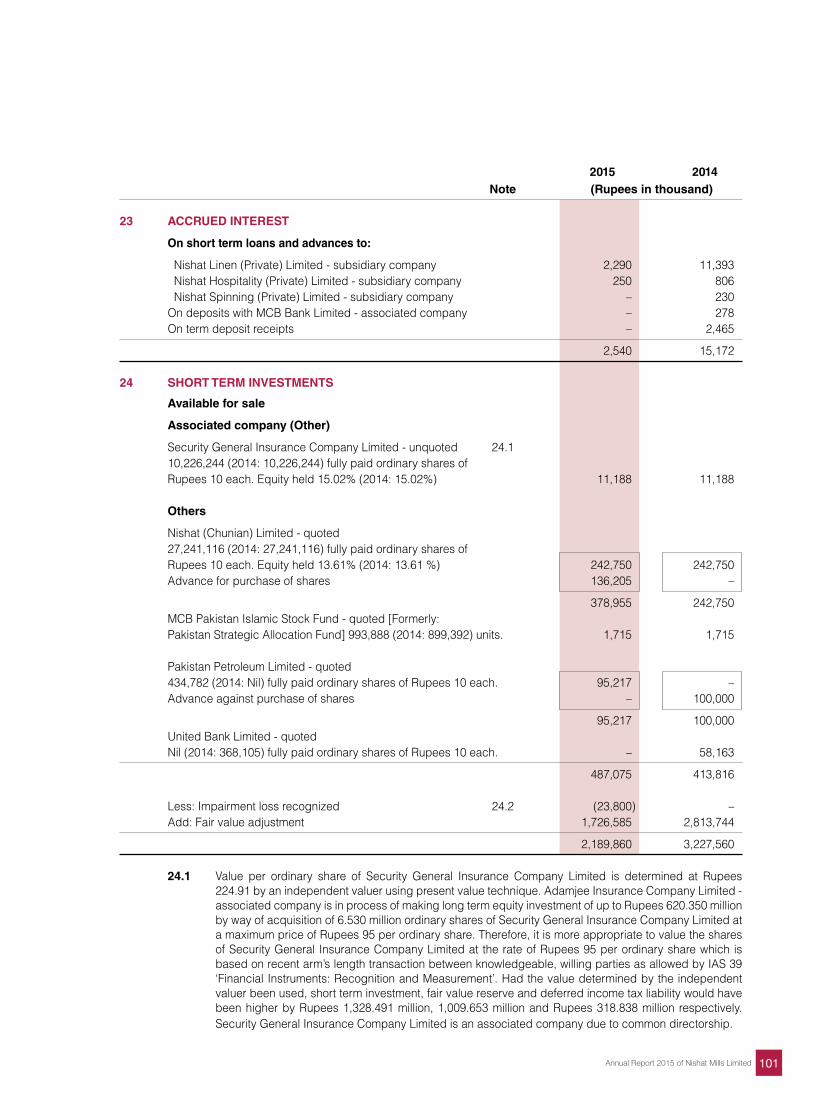
101Annual Report 2015 of Nishat Mills Limited
2015 2014 Note (Rupees in thousand) 23 ACCRUED INTEREST
On short term loans and advances to:
Nishat Linen (Private) Limited - subsidiary company 2,290 11,393 Nishat Hospitality (Private) Limited - subsidiary company 250 806 Nishat Spinning (Private) Limited - subsidiary company – 230 On deposits with MCB Bank Limited - associated company – 278 On term deposit receipts – 2,465
2,540 15,172 24 SHORT TERM INVESTMENTS
Available for sale
Associated company (Other)
Security General Insurance Company Limited - unquoted 24.1 10,226,244 (2014: 10,226,244) fully paid ordinary shares of Rupees 10 each. Equity held 15.02% (2014: 15.02%) 11,188 11,188 Others
Nishat (Chunian) Limited - quoted 27,241,116 (2014: 27,241,116) fully paid ordinary shares of Rupees 10 each. Equity held 13.61% (2014: 13.61 %) 242,750 242,750 Advance for purchase of shares 136,205 –
378,955 242,750 MCB Pakistan Islamic Stock Fund - quoted [Formerly: Pakistan Strategic Allocation Fund] 993,888 (2014: 899,392) units. 1,715 1,715 Pakistan Petroleum Limited - quoted 434,782 (2014: Nil) fully paid ordinary shares of Rupees 10 each. 95,217 – Advance against purchase of shares – 100,000
95,217 100,000 United Bank Limited - quoted Nil (2014: 368,105) fully paid ordinary shares of Rupees 10 each. – 58,163
487,075 413,816
Less: Impairment loss recognized 24.2 (23,800) – Add: Fair value adjustment 1,726,585 2,813,744
2,189,860 3,227,560 24.1 Value per ordinary share of Security General Insurance Company Limited is determined at Rupees
224.91 by an independent valuer using present value technique. Adamjee Insurance Company Limited - associated company is in process of making long term equity investment of up to Rupees 620.350 million by way of acquisition of 6.530 million ordinary shares of Security General Insurance Company Limited at a maximum price of Rupees 95 per ordinary share. Therefore, it is more appropriate to value the shares of Security General Insurance Company Limited at the rate of Rupees 95 per ordinary share which is based on recent arm’s length transaction between knowledgeable, willing parties as allowed by IAS 39 ‘Financial Instruments: Recognition and Measurement’. Had the value determined by the independent valuer been used, short term investment, fair value reserve and deferred income tax liability would have been higher by Rupees 1,328.491 million, 1,009.653 million and Rupees 318.838 million respectively. Security General Insurance Company Limited is an associated company due to common directorship.
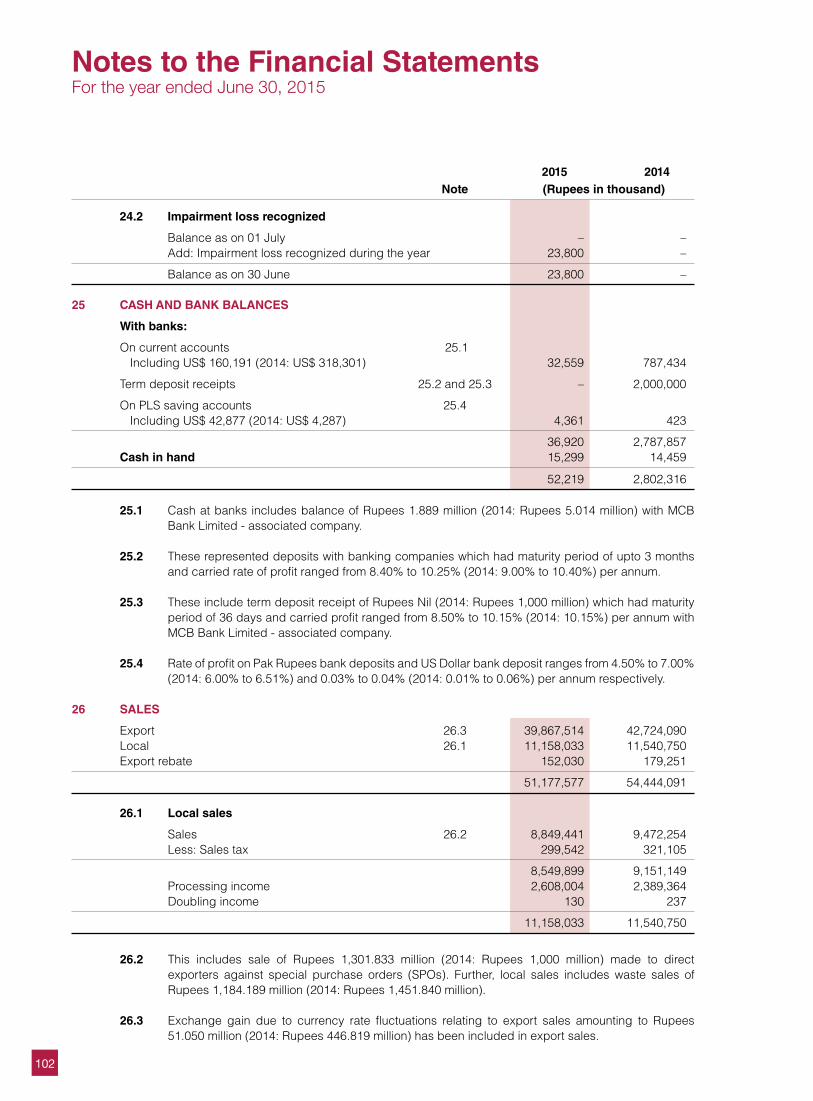
102
2015 2014 Note (Rupees in thousand)
24.2 Impairment loss recognized
Balance as on 01 July – – Add: Impairment loss recognized during the year 23,800 –
Balance as on 30 June 23,800 – 25 CASH AND BANK BALANCES
With banks:
On current accounts 25.1 Including US$ 160,191 (2014: US$ 318,301) 32,559 787,434
Term deposit receipts 25.2 and 25.3 – 2,000,000
On PLS saving accounts 25.4 Including US$ 42,877 (2014: US$ 4,287) 4,361 423
36,920 2,787,857 Cash in hand 15,299 14,459
52,219 2,802,316 25.1 Cash at banks includes balance of Rupees 1.889 million (2014: Rupees 5.014 million) with MCB
Bank Limited - associated company. 25.2 These represented deposits with banking companies which had maturity period of upto 3 months
and carried rate of profit ranged from 8.40% to 10.25% (2014: 9.00% to 10.40%) per annum. 25.3 These include term deposit receipt of Rupees Nil (2014: Rupees 1,000 million) which had maturity
period of 36 days and carried profit ranged from 8.50% to 10.15% (2014: 10.15%) per annum with MCB Bank Limited - associated company.
25.4 Rate of profit on Pak Rupees bank deposits and US Dollar bank deposit ranges from 4.50% to 7.00%
(2014: 6.00% to 6.51%) and 0.03% to 0.04% (2014: 0.01% to 0.06%) per annum respectively. 26 SALES
Export 26.3 39,867,514 42,724,090 Local 26.1 11,158,033 11,540,750 Export rebate 152,030 179,251
51,177,577 54,444,091 26.1 Local sales
Sales 26.2 8,849,441 9,472,254 Less: Sales tax 299,542 321,105
8,549,899 9,151,149 Processing income 2,608,004 2,389,364 Doubling income 130 237
11,158,033 11,540,750
26.2 This includes sale of Rupees 1,301.833 million (2014: Rupees 1,000 million) made to direct exporters against special purchase orders (SPOs). Further, local sales includes waste sales of Rupees 1,184.189 million (2014: Rupees 1,451.840 million).
26.3 Exchange gain due to currency rate fluctuations relating to export sales amounting to Rupees 51.050 million (2014: Rupees 446.819 million) has been included in export sales.
Notes to the Financial StatementsFor the year ended June 30, 2015
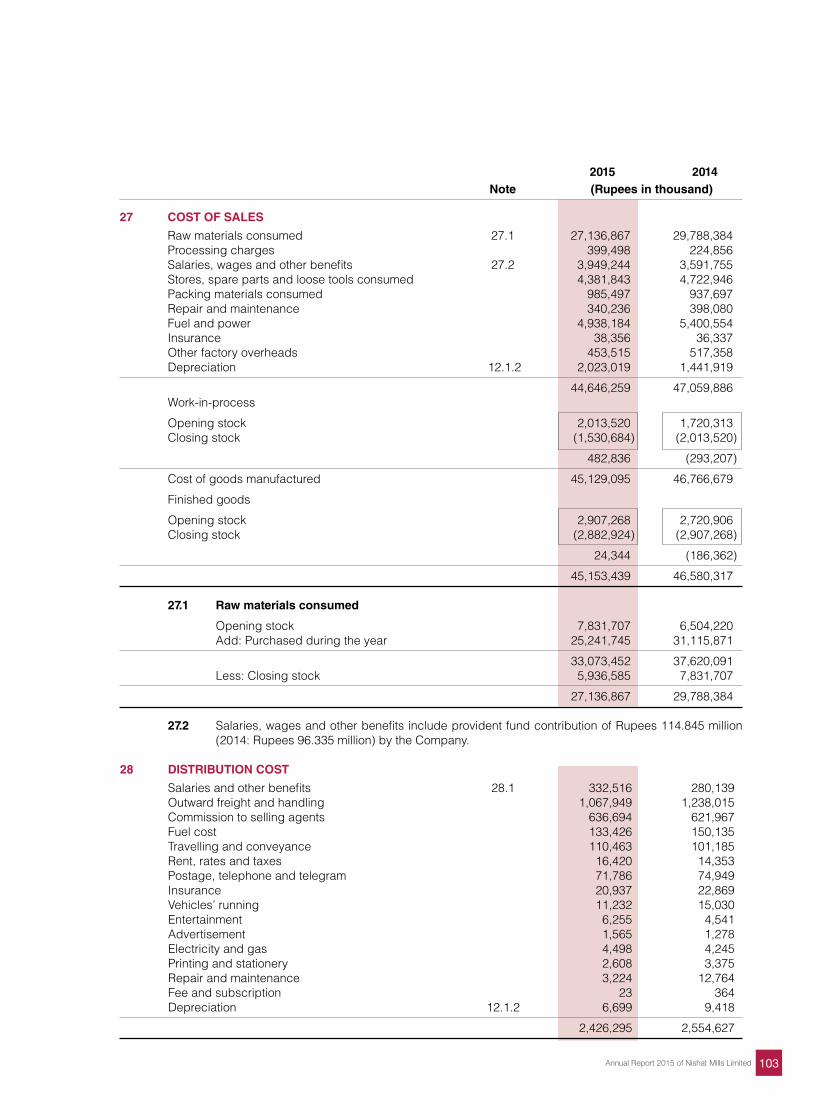
103Annual Report 2015 of Nishat Mills Limited
2015 2014 Note (Rupees in thousand)
27 COST OF SALES
Raw materials consumed 27.1 27,136,867 29,788,384 Processing charges 399,498 224,856 Salaries, wages and other benefits 27.2 3,949,244 3,591,755 Stores, spare parts and loose tools consumed 4,381,843 4,722,946 Packing materials consumed 985,497 937,697 Repair and maintenance 340,236 398,080 Fuel and power 4,938,184 5,400,554 Insurance 38,356 36,337 Other factory overheads 453,515 517,358 Depreciation 12.1.2 2,023,019 1,441,919
44,646,259 47,059,886 Work-in-process
Opening stock 2,013,520 1,720,313 Closing stock (1,530,684) (2,013,520)
482,836 (293,207)
Cost of goods manufactured 45,129,095 46,766,679
Finished goods
Opening stock 2,907,268 2,720,906 Closing stock (2,882,924) (2,907,268)
24,344 (186,362)
45,153,439 46,580,317 27.1 Raw materials consumed
Opening stock 7,831,707 6,504,220 Add: Purchased during the year 25,241,745 31,115,871
33,073,452 37,620,091 Less: Closing stock 5,936,585 7,831,707
27,136,867 29,788,384 27.2 Salaries, wages and other benefits include provident fund contribution of Rupees 114.845 million
(2014: Rupees 96.335 million) by the Company.
28 DISTRIBUTION COST
Salaries and other benefits 28.1 332,516 280,139 Outward freight and handling 1,067,949 1,238,015 Commission to selling agents 636,694 621,967 Fuel cost 133,426 150,135 Travelling and conveyance 110,463 101,185 Rent, rates and taxes 16,420 14,353 Postage, telephone and telegram 71,786 74,949 Insurance 20,937 22,869 Vehicles’ running 11,232 15,030 Entertainment 6,255 4,541 Advertisement 1,565 1,278 Electricity and gas 4,498 4,245 Printing and stationery 2,608 3,375 Repair and maintenance 3,224 12,764 Fee and subscription 23 364 Depreciation 12.1.2 6,699 9,418
2,426,295 2,554,627
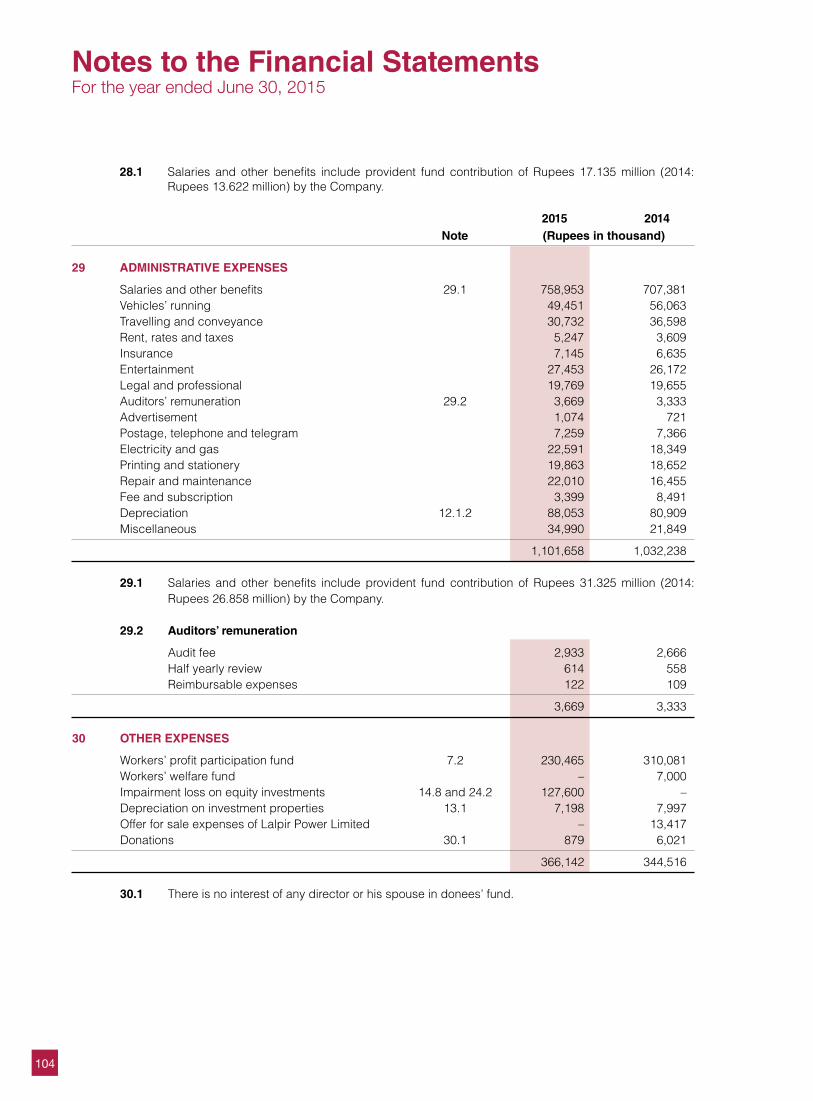
104
28.1 Salaries and other benefits include provident fund contribution of Rupees 17.135 million (2014: Rupees 13.622 million) by the Company.
2015 2014 Note (Rupees in thousand)
29 ADMINISTRATIVE EXPENSES
Salaries and other benefits 29.1 758,953 707,381 Vehicles’ running 49,451 56,063 Travelling and conveyance 30,732 36,598 Rent, rates and taxes 5,247 3,609 Insurance 7,145 6,635 Entertainment 27,453 26,172 Legal and professional 19,769 19,655 Auditors’ remuneration 29.2 3,669 3,333 Advertisement 1,074 721 Postage, telephone and telegram 7,259 7,366 Electricity and gas 22,591 18,349 Printing and stationery 19,863 18,652 Repair and maintenance 22,010 16,455 Fee and subscription 3,399 8,491 Depreciation 12.1.2 88,053 80,909 Miscellaneous 34,990 21,849
1,101,658 1,032,238 29.1 Salaries and other benefits include provident fund contribution of Rupees 31.325 million (2014:
Rupees 26.858 million) by the Company. 29.2 Auditors’ remuneration
Audit fee 2,933 2,666 Half yearly review 614 558 Reimbursable expenses 122 109
3,669 3,333 30 OTHER EXPENSES
Workers’ profit participation fund 7.2 230,465 310,081 Workers’ welfare fund – 7,000 Impairment loss on equity investments 14.8 and 24.2 127,600 – Depreciation on investment properties 13.1 7,198 7,997 Offer for sale expenses of Lalpir Power Limited – 13,417 Donations 30.1 879 6,021
366,142 344,516 30.1 There is no interest of any director or his spouse in donees’ fund.
Notes to the Financial StatementsFor the year ended June 30, 2015
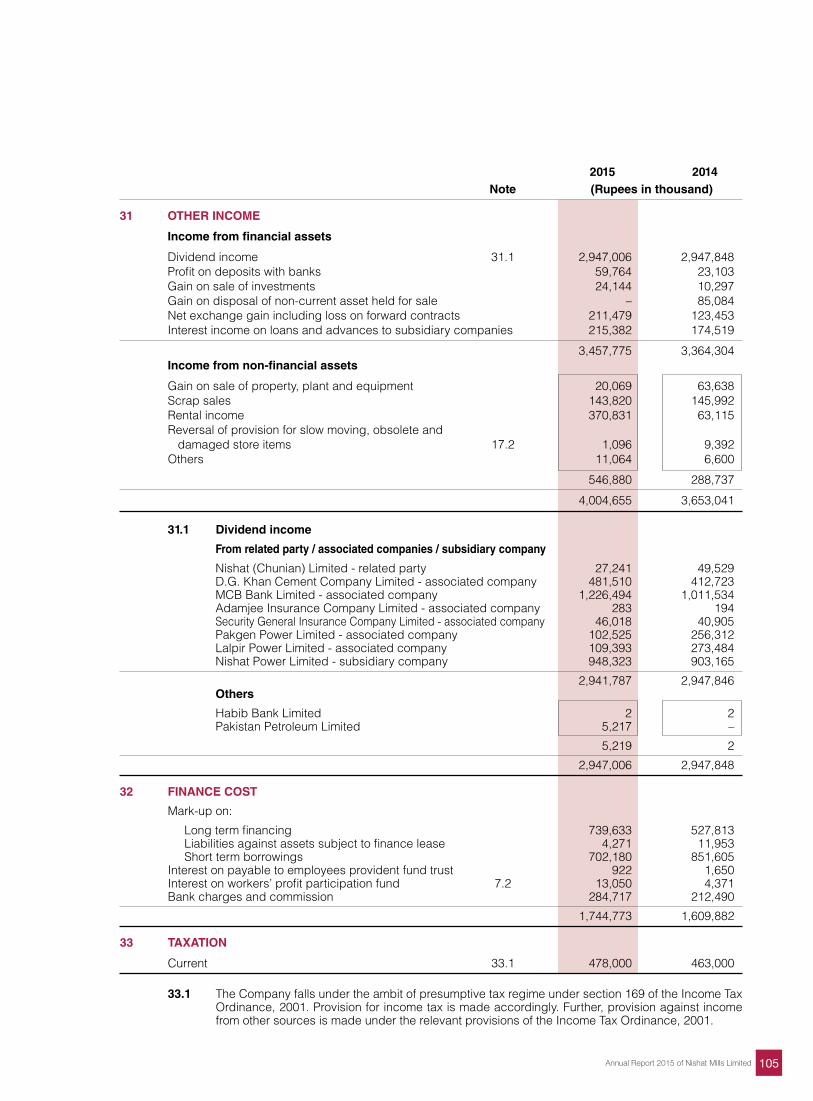
105Annual Report 2015 of Nishat Mills Limited
2015 2014 Note (Rupees in thousand)
31 OTHER INCOME
Income from financial assets
Dividend income 31.1 2,947,006 2,947,848 Profit on deposits with banks 59,764 23,103 Gain on sale of investments 24,144 10,297 Gain on disposal of non-current asset held for sale – 85,084 Net exchange gain including loss on forward contracts 211,479 123,453 Interest income on loans and advances to subsidiary companies 215,382 174,519
3,457,775 3,364,304 Income from non-financial assets
Gain on sale of property, plant and equipment 20,069 63,638 Scrap sales 143,820 145,992 Rental income 370,831 63,115 Reversal of provision for slow moving, obsolete and damaged store items 17.2 1,096 9,392 Others 11,064 6,600
546,880 288,737
4,004,655 3,653,041 31.1 Dividend income
From related party / associated companies / subsidiary company
Nishat (Chunian) Limited - related party 27,241 49,529 D.G. Khan Cement Company Limited - associated company 481,510 412,723 MCB Bank Limited - associated company 1,226,494 1,011,534 Adamjee Insurance Company Limited - associated company 283 194 Security General Insurance Company Limited - associated company 46,018 40,905 Pakgen Power Limited - associated company 102,525 256,312 Lalpir Power Limited - associated company 109,393 273,484 Nishat Power Limited - subsidiary company 948,323 903,165
2,941,787 2,947,846 Others
Habib Bank Limited 2 2 Pakistan Petroleum Limited 5,217 –
5,219 2
2,947,006 2,947,848
32 FINANCE COST
Mark-up on:
Long term financing 739,633 527,813 Liabilities against assets subject to finance lease 4,271 11,953 Short term borrowings 702,180 851,605 Interest on payable to employees provident fund trust 922 1,650 Interest on workers’ profit participation fund 7.2 13,050 4,371 Bank charges and commission 284,717 212,490
1,744,773 1,609,882 33 TAXATION
Current 33.1 478,000 463,000 33.1 The Company falls under the ambit of presumptive tax regime under section 169 of the Income Tax
Ordinance, 2001. Provision for income tax is made accordingly. Further, provision against income from other sources is made under the relevant provisions of the Income Tax Ordinance, 2001.
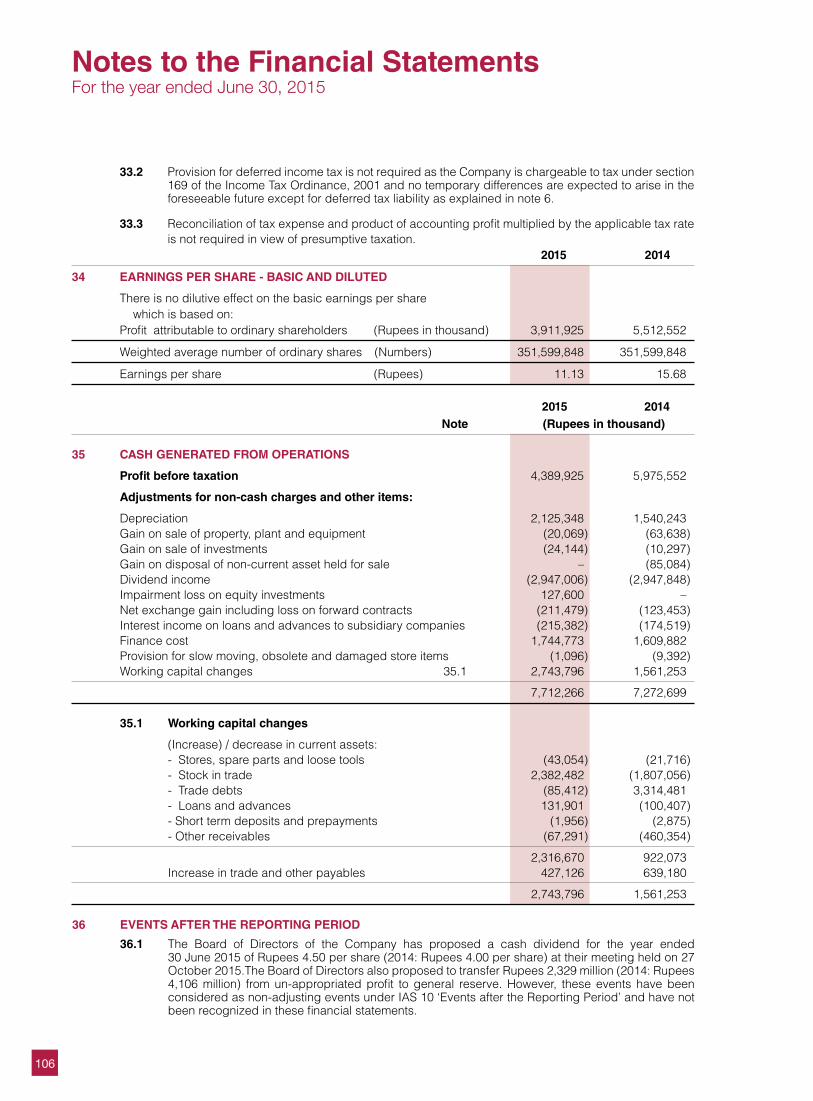
106
33.2 Provision for deferred income tax is not required as the Company is chargeable to tax under section 169 of the Income Tax Ordinance, 2001 and no temporary differences are expected to arise in the foreseeable future except for deferred tax liability as explained in note 6.
33.3 Reconciliation of tax expense and product of accounting profit multiplied by the applicable tax rate is not required in view of presumptive taxation.
2015 2014
34 EARNINGS PER SHARE - BASIC AND DILUTED
There is no dilutive effect on the basic earnings per share which is based on: Profit attributable to ordinary shareholders (Rupees in thousand) 3,911,925 5,512,552
Weighted average number of ordinary shares (Numbers) 351,599,848 351,599,848
Earnings per share (Rupees) 11.13 15.68 2015 2014 Note (Rupees in thousand) 35 CASH GENERATED FROM OPERATIONS
Profit before taxation 4,389,925 5,975,552
Adjustments for non-cash charges and other items:
Depreciation 2,125,348 1,540,243 Gain on sale of property, plant and equipment (20,069) (63,638) Gain on sale of investments (24,144) (10,297) Gain on disposal of non-current asset held for sale – (85,084) Dividend income (2,947,006) (2,947,848) Impairment loss on equity investments 127,600 – Net exchange gain including loss on forward contracts (211,479) (123,453) Interest income on loans and advances to subsidiary companies (215,382) (174,519) Finance cost 1,744,773 1,609,882 Provision for slow moving, obsolete and damaged store items (1,096) (9,392) Working capital changes 35.1 2,743,796 1,561,253
7,712,266 7,272,699 35.1 Working capital changes
(Increase) / decrease in current assets: - Stores, spare parts and loose tools (43,054) (21,716) - Stock in trade 2,382,482 (1,807,056) - Trade debts (85,412) 3,314,481 - Loans and advances 131,901 (100,407) - Short term deposits and prepayments (1,956) (2,875) - Other receivables (67,291) (460,354)
2,316,670 922,073 Increase in trade and other payables 427,126 639,180
2,743,796 1,561,253
36 EVENTS AFTER THE REPORTING PERIOD
36.1 The Board of Directors of the Company has proposed a cash dividend for the year ended 30 June 2015 of Rupees 4.50 per share (2014: Rupees 4.00 per share) at their meeting held on 27 October 2015.The Board of Directors also proposed to transfer Rupees 2,329 million (2014: Rupees 4,106 million) from un-appropriated profit to general reserve. However, these events have been considered as non-adjusting events under IAS 10 ‘Events after the Reporting Period’ and have not been recognized in these financial statements.
Notes to the Financial StatementsFor the year ended June 30, 2015
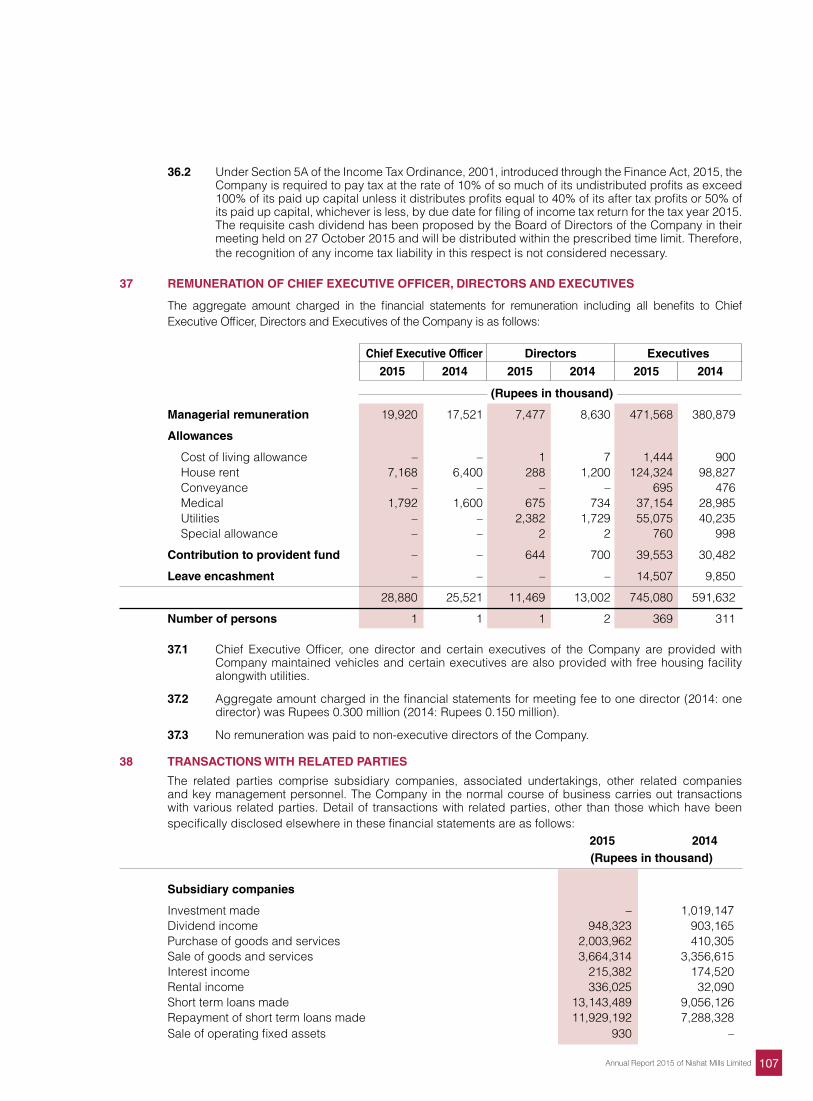
107Annual Report 2015 of Nishat Mills Limited
36.2 Under Section 5A of the Income Tax Ordinance, 2001, introduced through the Finance Act, 2015, the Company is required to pay tax at the rate of 10% of so much of its undistributed profits as exceed 100% of its paid up capital unless it distributes profits equal to 40% of its after tax profits or 50% of its paid up capital, whichever is less, by due date for filing of income tax return for the tax year 2015. The requisite cash dividend has been proposed by the Board of Directors of the Company in their meeting held on 27 October 2015 and will be distributed within the prescribed time limit. Therefore, the recognition of any income tax liability in this respect is not considered necessary.
37 REMUNERATION OF CHIEF EXECUTIVE OFFICER, DIRECTORS AND EXECUTIVES
The aggregate amount charged in the financial statements for remuneration including all benefits to Chief Executive Officer, Directors and Executives of the Company is as follows:
Chief Executive Officer Directors Executives
2015 2014 2015 2014 2015 2014
(Rupees in thousand)
Managerial remuneration 19,920 17,521 7,477 8,630 471,568 380,879
Allowances
Cost of living allowance – – 1 7 1,444 900 House rent 7,168 6,400 288 1,200 124,324 98,827 Conveyance – – – – 695 476 Medical 1,792 1,600 675 734 37,154 28,985 Utilities – – 2,382 1,729 55,075 40,235 Special allowance – – 2 2 760 998
Contribution to provident fund – – 644 700 39,553 30,482
Leave encashment – – – – 14,507 9,850
28,880 25,521 11,469 13,002 745,080 591,632
Number of persons 1 1 1 2 369 311 37.1 Chief Executive Officer, one director and certain executives of the Company are provided with
Company maintained vehicles and certain executives are also provided with free housing facility alongwith utilities.
37.2 Aggregate amount charged in the financial statements for meeting fee to one director (2014: one director) was Rupees 0.300 million (2014: Rupees 0.150 million).
37.3 No remuneration was paid to non-executive directors of the Company.
38 TRANSACTIONS WITH RELATED PARTIES
The related parties comprise subsidiary companies, associated undertakings, other related companies and key management personnel. The Company in the normal course of business carries out transactions with various related parties. Detail of transactions with related parties, other than those which have been specifically disclosed elsewhere in these financial statements are as follows:
2015 2014 (Rupees in thousand) Subsidiary companies
Investment made – 1,019,147 Dividend income 948,323 903,165 Purchase of goods and services 2,003,962 410,305 Sale of goods and services 3,664,314 3,356,615 Interest income 215,382 174,520 Rental income 336,025 32,090 Short term loans made 13,143,489 9,056,126 Repayment of short term loans made 11,929,192 7,288,328 Sale of operating fixed assets 930 –
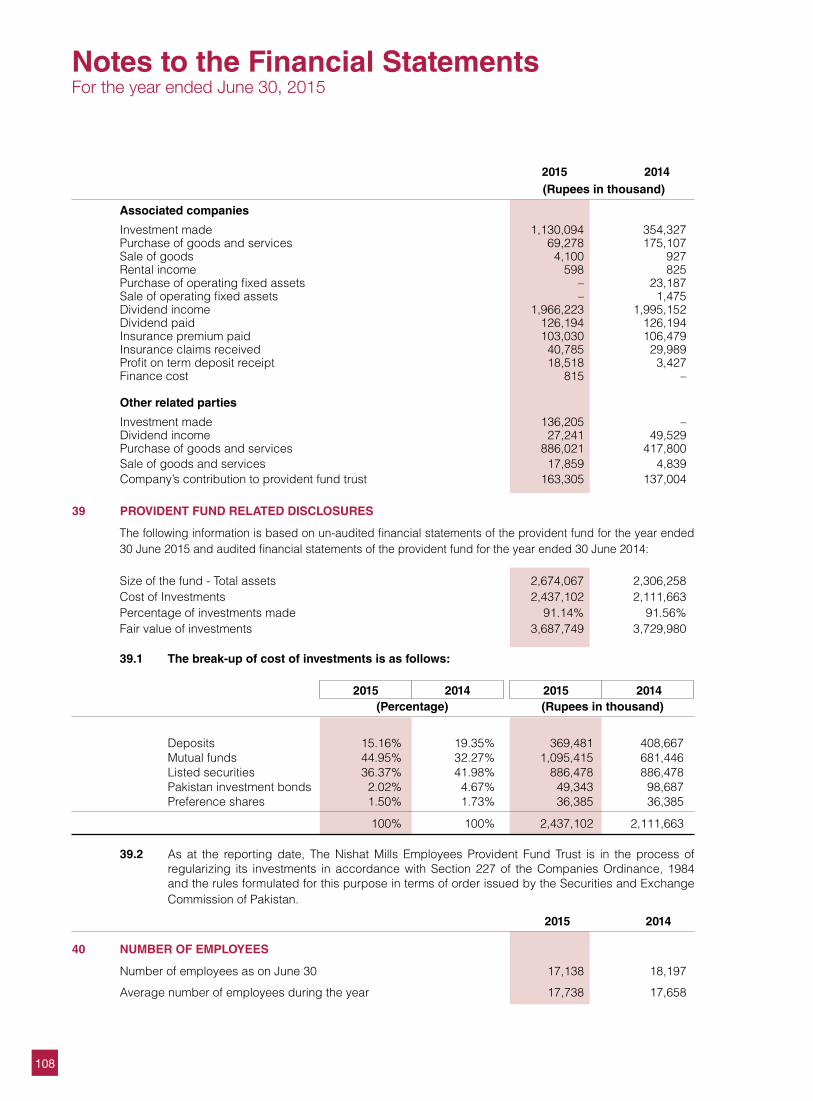
108
2015 2014 (Rupees in thousand)
Associated companies
Investment made 1,130,094 354,327 Purchase of goods and services 69,278 175,107 Sale of goods 4,100 927 Rental income 598 825 Purchase of operating fixed assets – 23,187 Sale of operating fixed assets – 1,475 Dividend income 1,966,223 1,995,152 Dividend paid 126,194 126,194 Insurance premium paid 103,030 106,479 Insurance claims received 40,785 29,989 Profit on term deposit receipt 18,518 3,427 Finance cost 815 – Other related parties
Investment made 136,205 – Dividend income 27,241 49,529 Purchase of goods and services 886,021 417,800 Sale of goods and services 17,859 4,839 Company’s contribution to provident fund trust 163,305 137,004
39 PROVIDENT FUND RELATED DISCLOSURES
The following information is based on un-audited financial statements of the provident fund for the year ended 30 June 2015 and audited financial statements of the provident fund for the year ended 30 June 2014:
Size of the fund - Total assets 2,674,067 2,306,258 Cost of Investments 2,437,102 2,111,663 Percentage of investments made 91.14% 91.56% Fair value of investments 3,687,749 3,729,980
39.1 The break-up of cost of investments is as follows: 2015 2014 2015 2014 (Percentage) (Rupees in thousand)
Deposits 15.16% 19.35% 369,481 408,667 Mutual funds 44.95% 32.27% 1,095,415 681,446 Listed securities 36.37% 41.98% 886,478 886,478 Pakistan investment bonds 2.02% 4.67% 49,343 98,687 Preference shares 1.50% 1.73% 36,385 36,385
100% 100% 2,437,102 2,111,663 39.2 As at the reporting date, The Nishat Mills Employees Provident Fund Trust is in the process of
regularizing its investments in accordance with Section 227 of the Companies Ordinance, 1984 and the rules formulated for this purpose in terms of order issued by the Securities and Exchange Commission of Pakistan.
2015 2014
40 NUMBER OF EMPLOYEES
Number of employees as on June 30 17,138 18,197
Average number of employees during the year 17,738 17,658
Notes to the Financial StatementsFor the year ended June 30, 2015
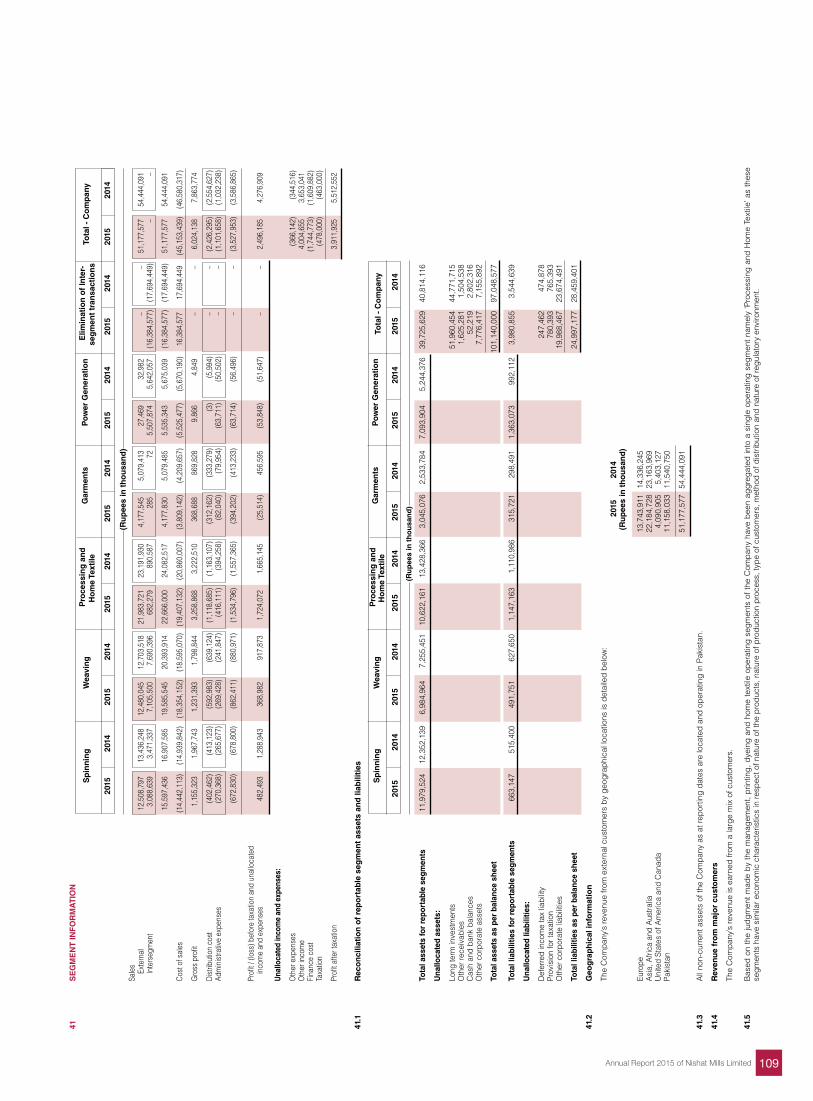
109Annual Report 2015 of Nishat Mills Limited
41
SE
GM
EN
T IN
FO
RM
AT
ION
Sp
inn
ing
W
eavi
ng
P
roce
ssin
g a
nd
G
arm
ents
P
ow
er G
ener
atio
n
Elim
inat
ion
of
Inte
r-
Tota
l - C
om
pan
y
Ho
me
Text
ile
seg
men
t tr
ansa
ctio
ns
201
5 2
014
2
015
201
4
201
5 2
014
2
015
201
4
201
5 2
014
201
5 2
014
2
015
201
4
(
Ru
pee
s in
th
ou
san
d)
Sa
les
Ext
erna
l 1
2,50
8,79
7
13,
436,
248
1
2,48
0,04
5
12,
703,
518
2
1,98
3,72
1
23,
191,
930
4
,177
,545
5
,079
,413
2
7,46
9
32,
982
–
–
51,
177,
577
5
4,44
4,09
1
Inte
rseg
men
t 3
,088
,639
3
,471
,337
7
,105
,500
7
,690
,396
6
82,2
79
890
,587
2
85
72
5
,507
,874
5
,642
,057
(1
6,38
4,57
7)
(17,
694,
449)
–
–
15,
597,
436
1
6,90
7,58
5
19,
585,
545
2
0,39
3,91
4
22,
666,
000
2
4,08
2,51
7
4,1
77,8
30
5,0
79,4
85
5,5
35,3
43
5,6
75,0
39
(16,
384,
577)
(1
7,69
4,44
9)
51,
177,
577
5
4,44
4,09
1
Co
st o
f sal
es
(14,
442,
113)
(1
4,93
9,84
2)
(18,
354,
152)
(1
8,59
5,07
0)
(19,
407,
132)
(2
0,86
0,00
7)
(3,8
09,1
42)
(4,2
09,6
57)
(5,5
25,4
77)
(5,6
70,1
90)
16,
384,
577
1
7,69
4,44
9
(45,
153,
439)
(4
6,58
0,31
7)
G
ross
pro
fit
1,1
55,3
23
1,9
67,7
43
1,2
31,3
93
1,7
98,8
44
3,2
58,8
68
3,2
22,5
10
368
,688
8
69,8
28
9,8
66
4,8
49
–
– 6
,024
,138
7
,863
,774
Di
strib
utio
n co
st
(402
,462
) (4
13,1
23)
(592
,983
) (6
39,1
24)
(1,1
18,6
85)
(1,1
63,1
07)
(312
,162
) (3
33,2
79)
(3)
(5,9
94)
–
– (2
,426
,295
) (2
,554
,627
)
Adm
inist
rativ
e ex
pens
es
(270
,368
) (2
65,6
77)
(269
,428
) (2
41,8
47)
(416
,111
) (3
94,2
58)
(82,
040)
(7
9,95
4)
(63,
711)
(5
0,50
2)
–
– (1
,101
,658
) (1
,032
,238
)
(672
,830
) (6
78,8
00)
(862
,411
) (8
80,9
71)
(1,5
34,7
96)
(1,5
57,3
65)
(394
,202
) (4
13,2
33)
(63,
714)
(5
6,49
6)
–
– (3
,527
,953
) (3
,586
,865
)
Profi
t / (l
oss)
bef
ore
taxa
tion
and
unal
loca
ted
inco
me
and
expe
nses
4
82,4
93
1,2
88,9
43
368
,982
9
17,8
73
1,7
24,0
72
1,6
65,1
45
(25,
514)
4
56,5
95
(53,
848)
(5
1,64
7)
–
– 2
,496
,185
4
,276
,909
Una
lloca
ted
inco
me
and
expe
nses
:
O
ther
exp
ense
s
(3
66,1
42)
(344
,516
)
Oth
er in
com
e
4
,004
,655
3
,653
,041
Fina
nce
cost
(1
,744
,773
) (1
,609
,882
)
Taxa
tion
(478
,000
) (4
63,0
00)
Pr
ofit a
fter t
axat
ion
3,9
11,9
25
5,5
12,5
52
41.1
R
eco
nci
liati
on
of
rep
ort
able
seg
men
t as
sets
an
d li
abili
ties
S
pin
nin
g
Wea
vin
g
Pro
cess
ing
an
d
Gar
men
ts
Po
wer
Gen
erat
ion
T
ota
l - C
om
pan
y
Ho
me
Text
ile
201
5 2
014
2
015
201
4
20
15
201
4
201
5 2
014
2
015
201
4
201
5 2
014
(R
up
ees
in t
ho
usa
nd
)
To
tal a
sset
s fo
r re
port
able
seg
men
ts
11,
979,
524
1
2,35
2,13
9
6,9
84,9
64
7,2
55,4
51
10,
622,
161
1
3,42
8,36
6
3,0
45,0
76
2,5
33,7
84
7,0
93,9
04
5,2
44,3
76
39,
725,
629
40
,814
,116
U
nallo
cate
d as
sets
:
Lo
ng te
rm in
vest
men
ts
51,
960,
454
44
,771
,715
Oth
er re
ceiv
able
s
1
,625
,281
1
,504
,538
Cas
h an
d ba
nk b
alan
ces
52,
219
2
,802
,316
Oth
er c
orpo
rate
ass
ets
7,7
76,4
17
7,1
55,8
92
To
tal a
sset
s as
per
bal
ance
she
et
1
01,1
40,0
00
97,
048,
577
To
tal l
iabi
litie
s fo
r re
port
able
seg
men
ts
663
,147
5
15,4
00
491
,751
6
27,6
50
1,1
47,1
63
1,1
10,9
86
315
,721
2
98,4
91
1,3
63,0
73
992
,112
3
,980
,855
3
,544
,639
U
nallo
cate
d lia
bilit
ies:
D
efer
red
inco
me
tax
liabi
lity
247
,462
4
74,8
78
Pr
ovis
ion
for t
axat
ion
780
,393
7
65,3
93
O
ther
cor
pora
te li
abili
ties
19,
988,
467
23
,674
,491
To
tal l
iabi
litie
s as
per
bal
ance
she
et
24,
997,
177
28
,459
,401
41.2
G
eog
rap
hic
al in
form
atio
n
Th
e C
ompa
ny’s
reve
nue
from
ext
erna
l cus
tom
ers
by g
eogr
aphi
cal l
ocat
ions
is d
etai
led
belo
w:
201
5 2
014
(R
up
ees
in t
ho
usa
nd
)
Euro
pe
13,
743,
911
14,
336,
245
A
sia,
Afri
ca a
nd A
ustra
lia
22,
184,
728
23,
163,
969
U
nite
d St
ates
of A
mer
ica
and
Can
ada
4,0
90,9
05
5,4
03,1
27
Pa
kist
an
11,
158,
033
11,
540,
750
51,
177,
577
54,
444,
091
41
.3
All
non-
curr
ent a
sset
s of
the
Com
pany
as
at re
port
ing
date
s ar
e lo
cate
d an
d op
erat
ing
in P
akis
tan.
41.4
R
even
ue
fro
m m
ajo
r cu
sto
mer
s
Th
e C
ompa
ny’s
reve
nue
is e
arne
d fro
m a
larg
e m
ix o
f cus
tom
ers.
41.5
B
ased
on
the
judg
men
t mad
e by
the
man
agem
ent,
prin
ting,
dye
ing
and
hom
e te
xtile
ope
ratin
g se
gmen
ts o
f the
Com
pany
hav
e be
en a
ggre
gate
d in
to a
sin
gle
oper
atin
g se
gmen
t nam
ely
‘Pro
cess
ing
and
Hom
e Te
xtile
’ as
thes
e se
gmen
ts h
ave
sim
ilar e
cono
mic
cha
ract
eris
tics
in re
spec
t of n
atur
e of
the
prod
ucts
, nat
ure
of p
rodu
ctio
n pr
oces
s, ty
pe o
f cus
tom
ers,
met
hod
of d
istri
butio
n an
d na
ture
of r
egul
ator
y en
viro
nmen
t.
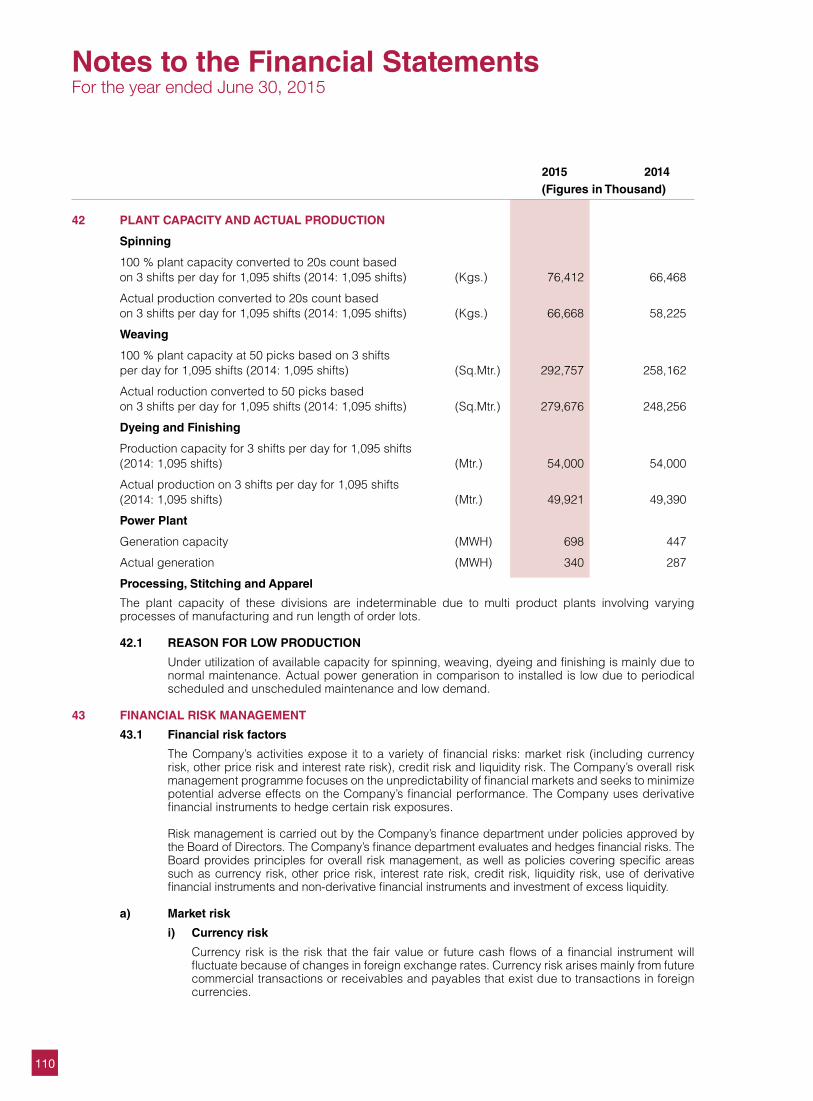
110
2015 2014 (Figures in Thousand)
42 PLANT CAPACITY AND ACTUAL PRODUCTION
Spinning
100 % plant capacity converted to 20s count based on 3 shifts per day for 1,095 shifts (2014: 1,095 shifts) (Kgs.) 76,412 66,468
Actual production converted to 20s count based on 3 shifts per day for 1,095 shifts (2014: 1,095 shifts) (Kgs.) 66,668 58,225
Weaving
100 % plant capacity at 50 picks based on 3 shifts per day for 1,095 shifts (2014: 1,095 shifts) (Sq.Mtr.) 292,757 258,162
Actual roduction converted to 50 picks based on 3 shifts per day for 1,095 shifts (2014: 1,095 shifts) (Sq.Mtr.) 279,676 248,256
Dyeing and Finishing
Production capacity for 3 shifts per day for 1,095 shifts (2014: 1,095 shifts) (Mtr.) 54,000 54,000
Actual production on 3 shifts per day for 1,095 shifts (2014: 1,095 shifts) (Mtr.) 49,921 49,390
Power Plant
Generation capacity (MWH) 698 447
Actual generation (MWH) 340 287
Processing, Stitching and Apparel
The plant capacity of these divisions are indeterminable due to multi product plants involving varying processes of manufacturing and run length of order lots.
42.1 REASON FOR LOW PRODUCTION
Under utilization of available capacity for spinning, weaving, dyeing and finishing is mainly due to normal maintenance. Actual power generation in comparison to installed is low due to periodical scheduled and unscheduled maintenance and low demand.
43 FINANCIAL RISK MANAGEMENT
43.1 Financial risk factors
The Company’s activities expose it to a variety of financial risks: market risk (including currency risk, other price risk and interest rate risk), credit risk and liquidity risk. The Company’s overall risk management programme focuses on the unpredictability of financial markets and seeks to minimize potential adverse effects on the Company’s financial performance. The Company uses derivative financial instruments to hedge certain risk exposures.
Risk management is carried out by the Company’s finance department under policies approved by
the Board of Directors. The Company’s finance department evaluates and hedges financial risks. The Board provides principles for overall risk management, as well as policies covering specific areas such as currency risk, other price risk, interest rate risk, credit risk, liquidity risk, use of derivative financial instruments and non-derivative financial instruments and investment of excess liquidity.
a) Market risk
i) Currency risk
Currency risk is the risk that the fair value or future cash flows of a financial instrument will fluctuate because of changes in foreign exchange rates. Currency risk arises mainly from future commercial transactions or receivables and payables that exist due to transactions in foreign currencies.
Notes to the Financial StatementsFor the year ended June 30, 2015
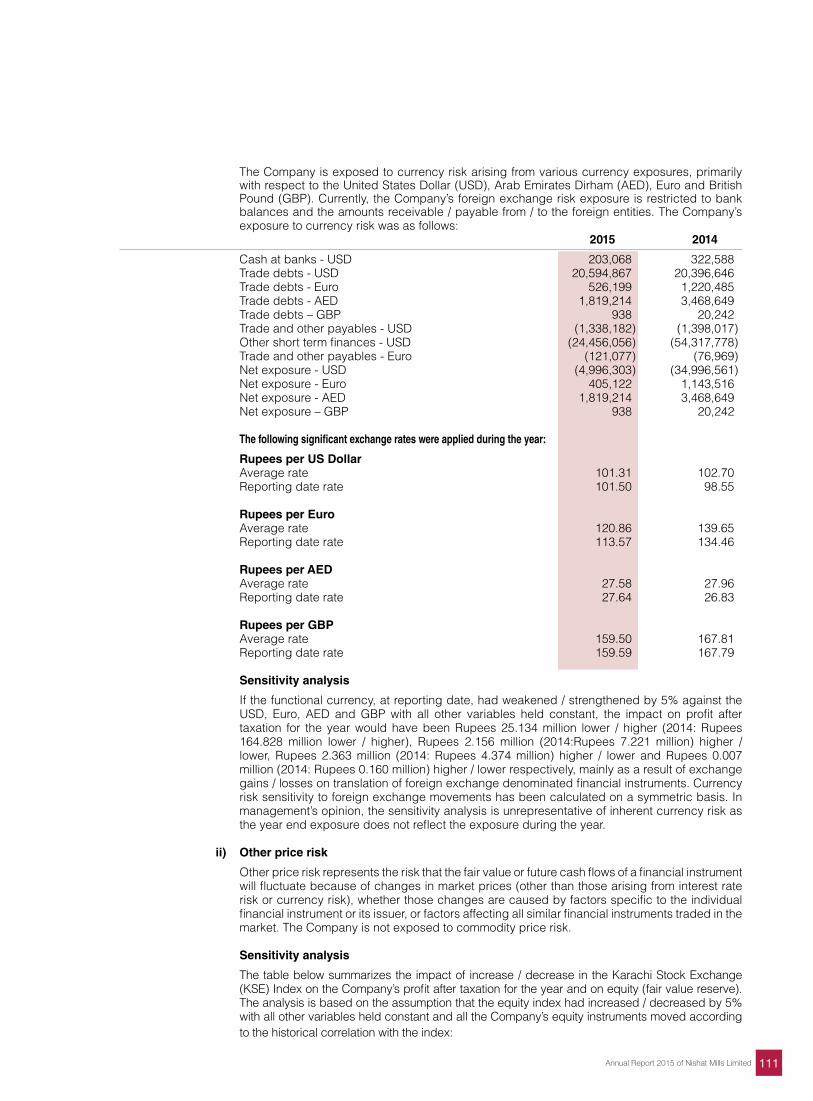
111Annual Report 2015 of Nishat Mills Limited
The Company is exposed to currency risk arising from various currency exposures, primarily with respect to the United States Dollar (USD), Arab Emirates Dirham (AED), Euro and British Pound (GBP). Currently, the Company’s foreign exchange risk exposure is restricted to bank balances and the amounts receivable / payable from / to the foreign entities. The Company’s exposure to currency risk was as follows:
2015 2014
Cash at banks - USD 203,068 322,588 Trade debts - USD 20,594,867 20,396,646 Trade debts - Euro 526,199 1,220,485 Trade debts - AED 1,819,214 3,468,649 Trade debts – GBP 938 20,242 Trade and other payables - USD (1,338,182) (1,398,017) Other short term finances - USD (24,456,056) (54,317,778) Trade and other payables - Euro (121,077) (76,969) Net exposure - USD (4,996,303) (34,996,561) Net exposure - Euro 405,122 1,143,516 Net exposure - AED 1,819,214 3,468,649 Net exposure – GBP 938 20,242 The following significant exchange rates were applied during the year:
Rupees per US Dollar Average rate 101.31 102.70 Reporting date rate 101.50 98.55 Rupees per Euro Average rate 120.86 139.65 Reporting date rate 113.57 134.46 Rupees per AED Average rate 27.58 27.96 Reporting date rate 27.64 26.83 Rupees per GBP Average rate 159.50 167.81 Reporting date rate 159.59 167.79 Sensitivity analysis
If the functional currency, at reporting date, had weakened / strengthened by 5% against the USD, Euro, AED and GBP with all other variables held constant, the impact on profit after taxation for the year would have been Rupees 25.134 million lower / higher (2014: Rupees 164.828 million lower / higher), Rupees 2.156 million (2014:Rupees 7.221 million) higher / lower, Rupees 2.363 million (2014: Rupees 4.374 million) higher / lower and Rupees 0.007 million (2014: Rupees 0.160 million) higher / lower respectively, mainly as a result of exchange gains / losses on translation of foreign exchange denominated financial instruments. Currency risk sensitivity to foreign exchange movements has been calculated on a symmetric basis. In management’s opinion, the sensitivity analysis is unrepresentative of inherent currency risk as the year end exposure does not reflect the exposure during the year.
ii) Other price risk
Other price risk represents the risk that the fair value or future cash flows of a financial instrument will fluctuate because of changes in market prices (other than those arising from interest rate risk or currency risk), whether those changes are caused by factors specific to the individual financial instrument or its issuer, or factors affecting all similar financial instruments traded in the market. The Company is not exposed to commodity price risk.
Sensitivity analysis
The table below summarizes the impact of increase / decrease in the Karachi Stock Exchange (KSE) Index on the Company’s profit after taxation for the year and on equity (fair value reserve). The analysis is based on the assumption that the equity index had increased / decreased by 5% with all other variables held constant and all the Company’s equity instruments moved according to the historical correlation with the index:
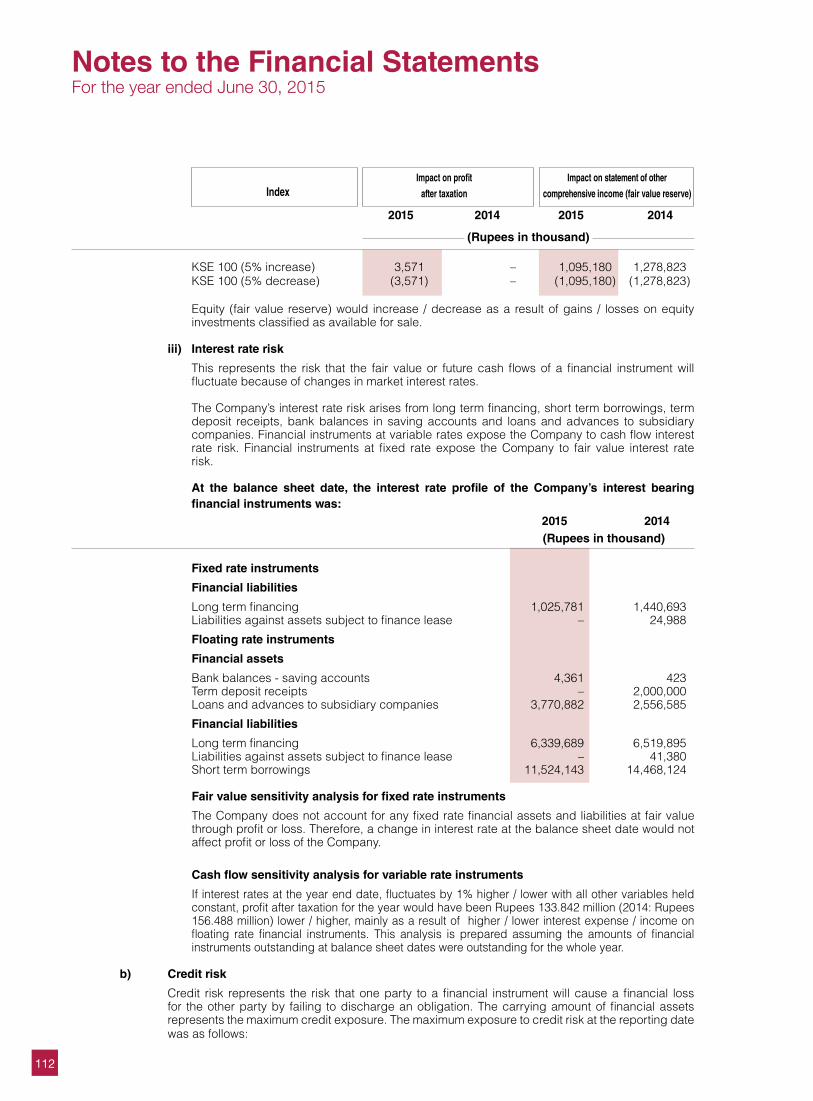
112
Index
Impact on profit Impact on statement of other
after taxation comprehensive income (fair value reserve)
2015 2014 2015 2014
(Rupees in thousand) KSE 100 (5% increase) 3,571 – 1,095,180 1,278,823 KSE 100 (5% decrease) (3,571) – (1,095,180) (1,278,823) Equity (fair value reserve) would increase / decrease as a result of gains / losses on equity
investments classified as available for sale. iii) Interest rate risk
This represents the risk that the fair value or future cash flows of a financial instrument will fluctuate because of changes in market interest rates.
The Company’s interest rate risk arises from long term financing, short term borrowings, term
deposit receipts, bank balances in saving accounts and loans and advances to subsidiary companies. Financial instruments at variable rates expose the Company to cash flow interest rate risk. Financial instruments at fixed rate expose the Company to fair value interest rate risk.
At the balance sheet date, the interest rate profile of the Company’s interest bearing
financial instruments was: 2015 2014 (Rupees in thousand) Fixed rate instruments
Financial liabilities
Long term financing 1,025,781 1,440,693 Liabilities against assets subject to finance lease – 24,988
Floating rate instruments
Financial assets
Bank balances - saving accounts 4,361 423 Term deposit receipts – 2,000,000 Loans and advances to subsidiary companies 3,770,882 2,556,585
Financial liabilities
Long term financing 6,339,689 6,519,895 Liabilities against assets subject to finance lease – 41,380 Short term borrowings 11,524,143 14,468,124 Fair value sensitivity analysis for fixed rate instruments
The Company does not account for any fixed rate financial assets and liabilities at fair value through profit or loss. Therefore, a change in interest rate at the balance sheet date would not affect profit or loss of the Company.
Cash flow sensitivity analysis for variable rate instruments
If interest rates at the year end date, fluctuates by 1% higher / lower with all other variables held constant, profit after taxation for the year would have been Rupees 133.842 million (2014: Rupees 156.488 million) lower / higher, mainly as a result of higher / lower interest expense / income on floating rate financial instruments. This analysis is prepared assuming the amounts of financial instruments outstanding at balance sheet dates were outstanding for the whole year.
b) Credit risk
Credit risk represents the risk that one party to a financial instrument will cause a financial loss for the other party by failing to discharge an obligation. The carrying amount of financial assets represents the maximum credit exposure. The maximum exposure to credit risk at the reporting date was as follows:
Notes to the Financial StatementsFor the year ended June 30, 2015
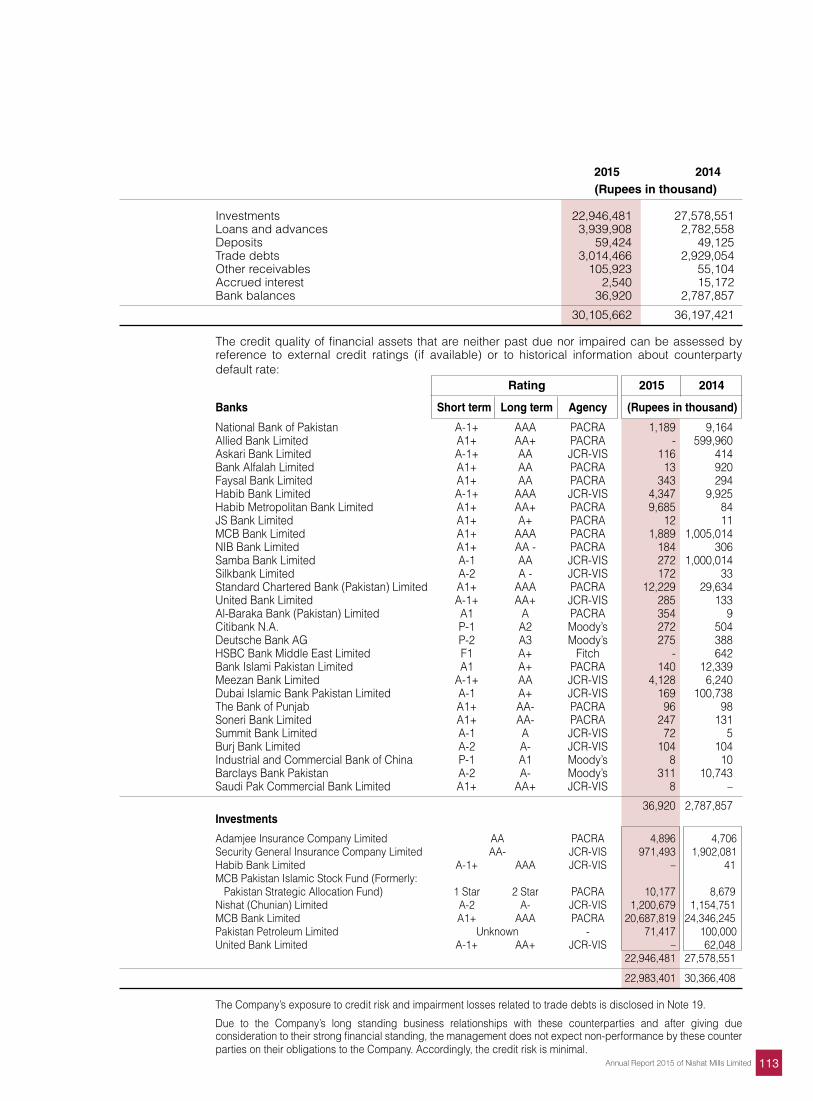
113Annual Report 2015 of Nishat Mills Limited
2015 2014 (Rupees in thousand) Investments 22,946,481 27,578,551 Loans and advances 3,939,908 2,782,558 Deposits 59,424 49,125 Trade debts 3,014,466 2,929,054 Other receivables 105,923 55,104 Accrued interest 2,540 15,172 Bank balances 36,920 2,787,857
30,105,662 36,197,421
The credit quality of financial assets that are neither past due nor impaired can be assessed by reference to external credit ratings (if available) or to historical information about counterparty default rate:
Rating 2015 2014
Banks Short term Long term Agency (Rupees in thousand)
National Bank of Pakistan A-1+ AAA PACRA 1,189 9,164 Allied Bank Limited A1+ AA+ PACRA - 599,960 Askari Bank Limited A-1+ AA JCR-VIS 116 414 Bank Alfalah Limited A1+ AA PACRA 13 920 Faysal Bank Limited A1+ AA PACRA 343 294 Habib Bank Limited A-1+ AAA JCR-VIS 4,347 9,925 Habib Metropolitan Bank Limited A1+ AA+ PACRA 9,685 84 JS Bank Limited A1+ A+ PACRA 12 11 MCB Bank Limited A1+ AAA PACRA 1,889 1,005,014 NIB Bank Limited A1+ AA - PACRA 184 306 Samba Bank Limited A-1 AA JCR-VIS 272 1,000,014 Silkbank Limited A-2 A - JCR-VIS 172 33 Standard Chartered Bank (Pakistan) Limited A1+ AAA PACRA 12,229 29,634 United Bank Limited A-1+ AA+ JCR-VIS 285 133 Al-Baraka Bank (Pakistan) Limited A1 A PACRA 354 9 Citibank N.A. P-1 A2 Moody’s 272 504 Deutsche Bank AG P-2 A3 Moody’s 275 388 HSBC Bank Middle East Limited F1 A+ Fitch - 642 Bank Islami Pakistan Limited A1 A+ PACRA 140 12,339 Meezan Bank Limited A-1+ AA JCR-VIS 4,128 6,240 Dubai Islamic Bank Pakistan Limited A-1 A+ JCR-VIS 169 100,738 The Bank of Punjab A1+ AA- PACRA 96 98 Soneri Bank Limited A1+ AA- PACRA 247 131 Summit Bank Limited A-1 A JCR-VIS 72 5 Burj Bank Limited A-2 A- JCR-VIS 104 104 Industrial and Commercial Bank of China P-1 A1 Moody’s 8 10 Barclays Bank Pakistan A-2 A- Moody’s 311 10,743 Saudi Pak Commercial Bank Limited A1+ AA+ JCR-VIS 8 –
36,920 2,787,857 Investments
Adamjee Insurance Company Limited AA PACRA 4,896 4,706 Security General Insurance Company Limited AA- JCR-VIS 971,493 1,902,081 Habib Bank Limited A-1+ AAA JCR-VIS – 41 MCB Pakistan Islamic Stock Fund (Formerly: Pakistan Strategic Allocation Fund) 1 Star 2 Star PACRA 10,177 8,679 Nishat (Chunian) Limited A-2 A- JCR-VIS 1,200,679 1,154,751 MCB Bank Limited A1+ AAA PACRA 20,687,819 24,346,245 Pakistan Petroleum Limited Unknown - 71,417 100,000 United Bank Limited A-1+ AA+ JCR-VIS – 62,048 22,946,481 27,578,551
22,983,401 30,366,408 The Company’s exposure to credit risk and impairment losses related to trade debts is disclosed in Note 19.
Due to the Company’s long standing business relationships with these counterparties and after giving due consideration to their strong financial standing, the management does not expect non-performance by these counter parties on their obligations to the Company. Accordingly, the credit risk is minimal.
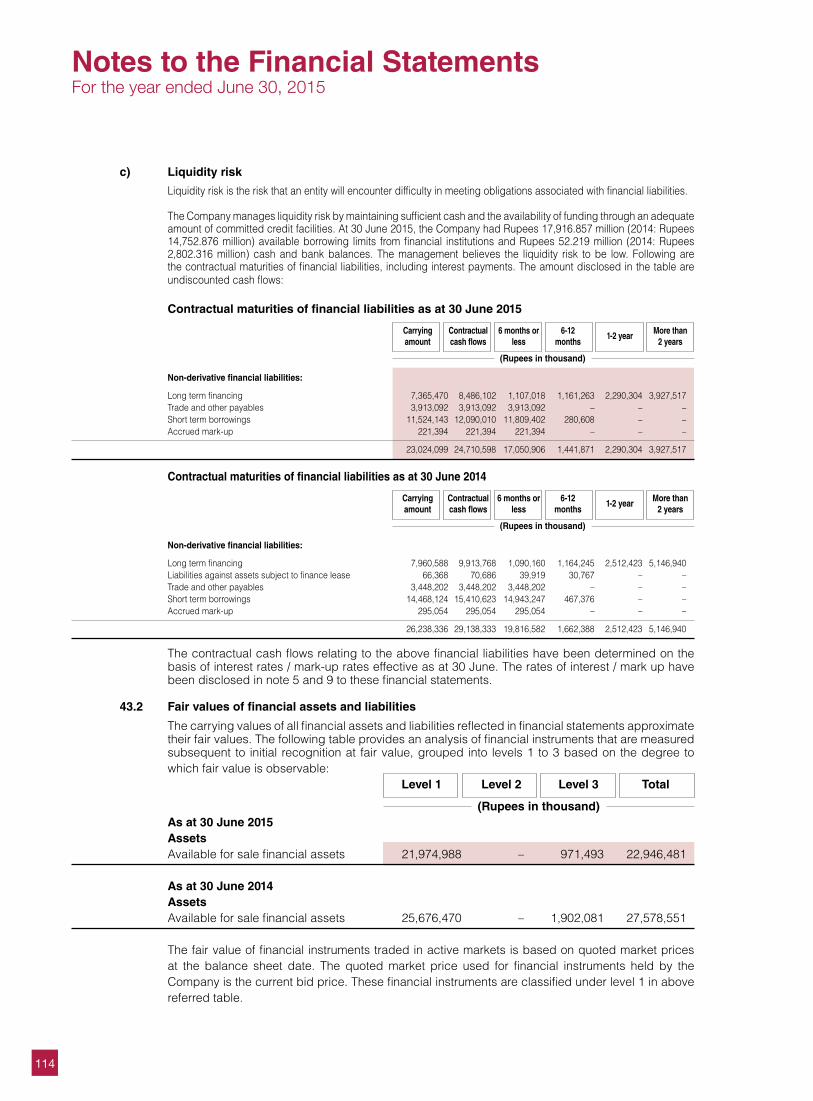
114
c) Liquidity risk
Liquidity risk is the risk that an entity will encounter difficulty in meeting obligations associated with financial liabilities. The Company manages liquidity risk by maintaining sufficient cash and the availability of funding through an adequate
amount of committed credit facilities. At 30 June 2015, the Company had Rupees 17,916.857 million (2014: Rupees 14,752.876 million) available borrowing limits from financial institutions and Rupees 52.219 million (2014: Rupees 2,802.316 million) cash and bank balances. The management believes the liquidity risk to be low. Following are the contractual maturities of financial liabilities, including interest payments. The amount disclosed in the table are undiscounted cash flows:
Contractual maturities of financial liabilities as at 30 June 2015
Carrying Contractual 6 months or 6-12 1-2 year More than amount cash flows less months 2 years
(Rupees in thousand)
Non-derivative financial liabilities:
Long term financing 7,365,470 8,486,102 1,107,018 1,161,263 2,290,304 3,927,517 Trade and other payables 3,913,092 3,913,092 3,913,092 – – – Short term borrowings 11,524,143 12,090,010 11,809,402 280,608 – – Accrued mark-up 221,394 221,394 221,394 – – –
23,024,099 24,710,598 17,050,906 1,441,871 2,290,304 3,927,517
Contractual maturities of financial liabilities as at 30 June 2014
Carrying Contractual 6 months or 6-12 1-2 year More than amount cash flows less months 2 years
(Rupees in thousand)
Non-derivative financial liabilities:
Long term financing 7,960,588 9,913,768 1,090,160 1,164,245 2,512,423 5,146,940 Liabilities against assets subject to finance lease 66,368 70,686 39,919 30,767 – – Trade and other payables 3,448,202 3,448,202 3,448,202 – – – Short term borrowings 14,468,124 15,410,623 14,943,247 467,376 – – Accrued mark-up 295,054 295,054 295,054 – – –
26,238,336 29,138,333 19,816,582 1,662,388 2,512,423 5,146,940 The contractual cash flows relating to the above financial liabilities have been determined on the
basis of interest rates / mark-up rates effective as at 30 June. The rates of interest / mark up have been disclosed in note 5 and 9 to these financial statements.
43.2 Fair values of financial assets and liabilities
The carrying values of all financial assets and liabilities reflected in financial statements approximate their fair values. The following table provides an analysis of financial instruments that are measured subsequent to initial recognition at fair value, grouped into levels 1 to 3 based on the degree to which fair value is observable:
Level 1 Level 2 Level 3 Total
(Rupees in thousand) As at 30 June 2015 Assets Available for sale financial assets 21,974,988 – 971,493 22,946,481 As at 30 June 2014 Assets Available for sale financial assets 25,676,470 – 1,902,081 27,578,551
The fair value of financial instruments traded in active markets is based on quoted market prices at the balance sheet date. The quoted market price used for financial instruments held by the Company is the current bid price. These financial instruments are classified under level 1 in above referred table.
Notes to the Financial StatementsFor the year ended June 30, 2015
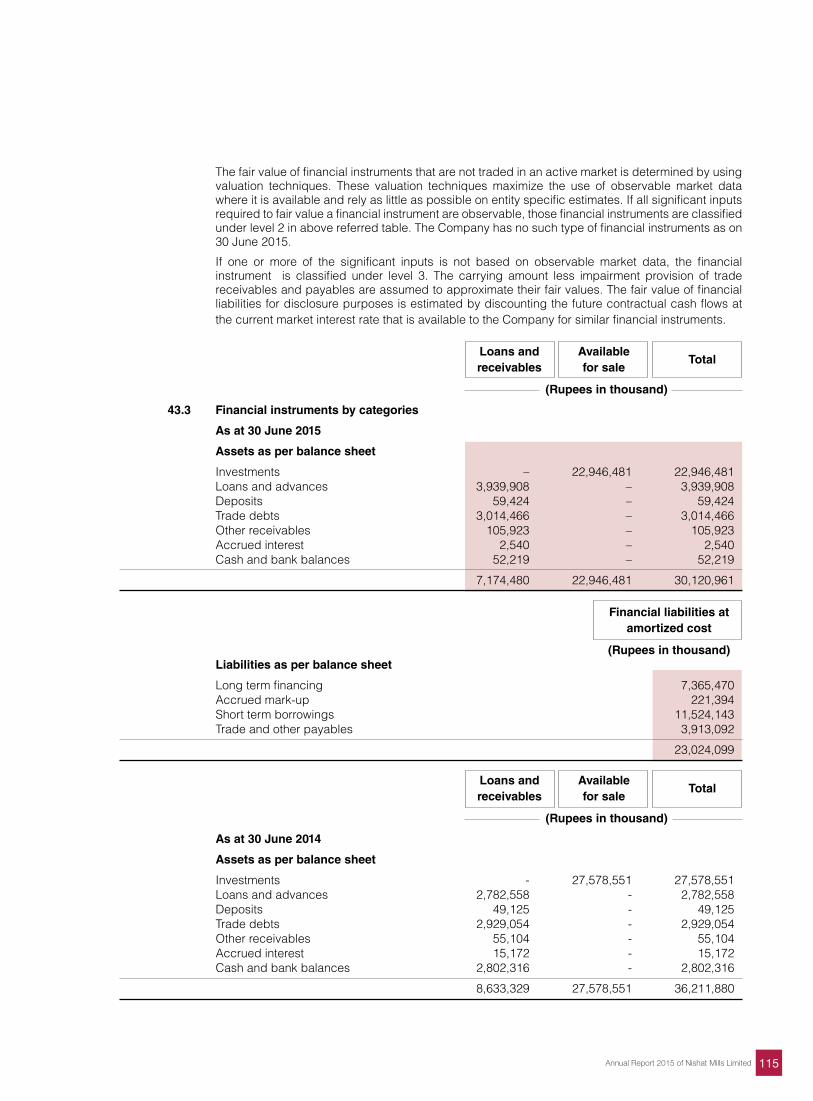
115Annual Report 2015 of Nishat Mills Limited
The fair value of financial instruments that are not traded in an active market is determined by using valuation techniques. These valuation techniques maximize the use of observable market data where it is available and rely as little as possible on entity specific estimates. If all significant inputs required to fair value a financial instrument are observable, those financial instruments are classified under level 2 in above referred table. The Company has no such type of financial instruments as on 30 June 2015.
If one or more of the significant inputs is not based on observable market data, the financial instrument is classified under level 3. The carrying amount less impairment provision of trade receivables and payables are assumed to approximate their fair values. The fair value of financial liabilities for disclosure purposes is estimated by discounting the future contractual cash flows at the current market interest rate that is available to the Company for similar financial instruments.
Loans and Available Total
receivables for sale
(Rupees in thousand)
43.3 Financial instruments by categories
As at 30 June 2015
Assets as per balance sheet
Investments – 22,946,481 22,946,481 Loans and advances 3,939,908 – 3,939,908 Deposits 59,424 – 59,424 Trade debts 3,014,466 – 3,014,466 Other receivables 105,923 – 105,923 Accrued interest 2,540 – 2,540 Cash and bank balances 52,219 – 52,219
7,174,480 22,946,481 30,120,961
Financial liabilities at amortized cost
(Rupees in thousand) Liabilities as per balance sheet
Long term financing 7,365,470 Accrued mark-up 221,394 Short term borrowings 11,524,143 Trade and other payables 3,913,092
23,024,099
Loans and Available Total
receivables for sale
(Rupees in thousand)
As at 30 June 2014
Assets as per balance sheet
Investments - 27,578,551 27,578,551 Loans and advances 2,782,558 - 2,782,558 Deposits 49,125 - 49,125 Trade debts 2,929,054 - 2,929,054 Other receivables 55,104 - 55,104 Accrued interest 15,172 - 15,172 Cash and bank balances 2,802,316 - 2,802,316
8,633,329 27,578,551 36,211,880
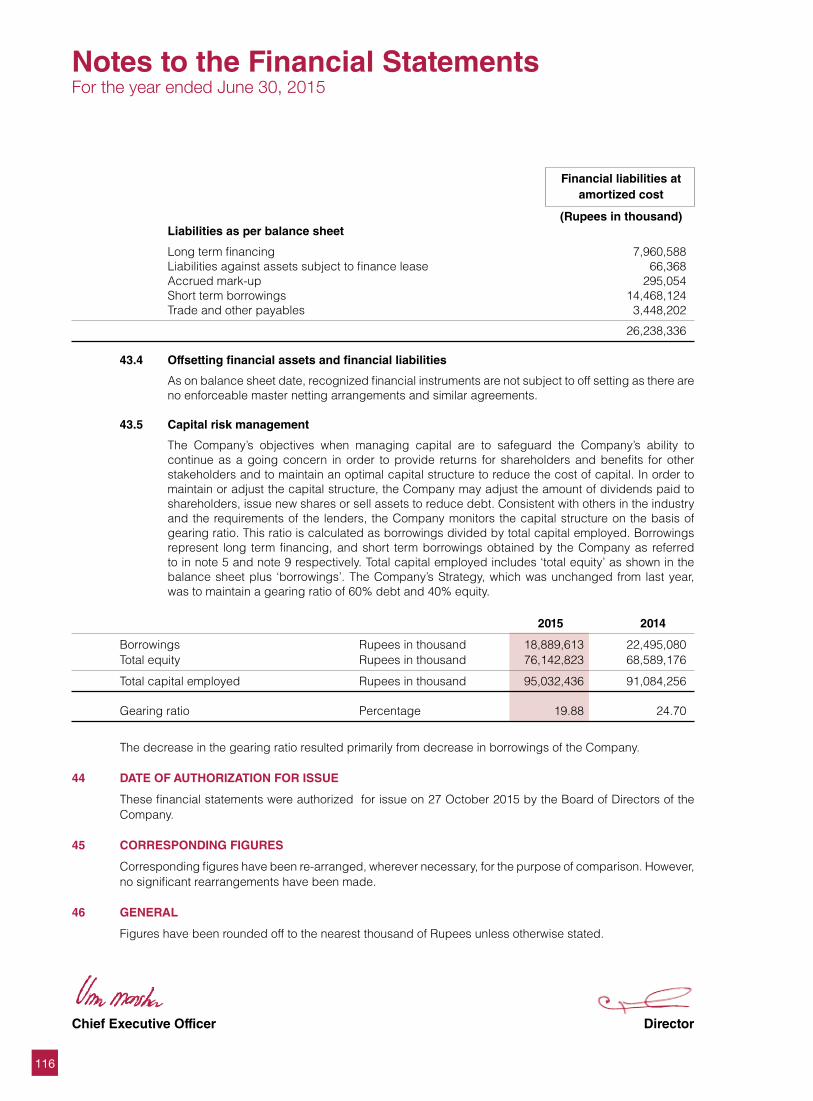
116
Financial liabilities at amortized cost
(Rupees in thousand) Liabilities as per balance sheet
Long term financing 7,960,588 Liabilities against assets subject to finance lease 66,368 Accrued mark-up 295,054 Short term borrowings 14,468,124 Trade and other payables 3,448,202
26,238,336
43.4 Offsetting financial assets and financial liabilities
As on balance sheet date, recognized financial instruments are not subject to off setting as there are no enforceable master netting arrangements and similar agreements.
43.5 Capital risk management
The Company’s objectives when managing capital are to safeguard the Company’s ability to continue as a going concern in order to provide returns for shareholders and benefits for other stakeholders and to maintain an optimal capital structure to reduce the cost of capital. In order to maintain or adjust the capital structure, the Company may adjust the amount of dividends paid to shareholders, issue new shares or sell assets to reduce debt. Consistent with others in the industry and the requirements of the lenders, the Company monitors the capital structure on the basis of gearing ratio. This ratio is calculated as borrowings divided by total capital employed. Borrowings represent long term financing, and short term borrowings obtained by the Company as referred to in note 5 and note 9 respectively. Total capital employed includes ‘total equity’ as shown in the balance sheet plus ‘borrowings’. The Company’s Strategy, which was unchanged from last year, was to maintain a gearing ratio of 60% debt and 40% equity.
2015 2014
Borrowings Rupees in thousand 18,889,613 22,495,080 Total equity Rupees in thousand 76,142,823 68,589,176
Total capital employed Rupees in thousand 95,032,436 91,084,256
Gearing ratio Percentage 19.88 24.70
The decrease in the gearing ratio resulted primarily from decrease in borrowings of the Company. 44 DATE OF AUTHORIZATION FOR ISSUE
These financial statements were authorized for issue on 27 October 2015 by the Board of Directors of the Company.
45 CORRESPONDING FIGURES
Corresponding figures have been re-arranged, wherever necessary, for the purpose of comparison. However, no significant rearrangements have been made.
46 GENERAL
Figures have been rounded off to the nearest thousand of Rupees unless otherwise stated.
Chief Executive Officer Director
Notes to the Financial StatementsFor the year ended June 30, 2015
117Consolidated Annual Report 2015 of Nishat Mills Limitedand its Subsidiaries
ConsolidatedFinancial Statements ofNishat Mills Limitedandits Subsidiariesfor the year ended June 30, 2015

118
119Consolidated Annual Report 2015 of Nishat Mills Limitedand its Subsidiaries
Directors’ Report
The Directors are pleased to present their report together with the consolidated financial statements of Nishat Mills
Limited (“the Holding Company”) and its Subsidiary Companies (together referred to as Group) for the year ended 30
June 2015. The consolidated results comprise of financial statements of Nishat Mills Limited, Nishat Power Limited,
Nishat Linen (Private) Limited, Nishat Hospitality (Private) Limited, Nishat USA Inc., Nishat Linen Trading L.L.C, Nishat
International FZE, Nishat Global China Company Limited and Nishat UK (Private) Limited. The Holding Company has
annexed its consolidated financial statements along with its separate financial statements, in accordance with the
requirements of International Financial Reporting Standards and Companies Ordinance 1984. The Directors’ Report,
giving a commentary on the performance of Nishat Mills Limited for the year ended 30 June 2015 has been presented
separately. It includes a brief description of all the subsidiary companies of the Holding Company.
Clarification to Qualifications in Audit Report
In their Report to the Members, Auditors have stated that consolidated financial statements include un-audited figures
pertaining to a subsidiary company, Nishat USA Incorporation (“the Subsidiary Company”). The Subsidiary Company
is incorporated under the Business Corporation Law of The State of New York. The governing law does not require
audit of financial statements of the Subsidiary Company. Hence, we have used un-audited financial statements of the
Subsidiary Company to prepare Consolidated Financial Statements.
Auditors have also informed to the members in their report that un-audited financial statements of Nishat Global China
Company Limited (“the Chinese subsidiary”), a wholly owned subsidiary of Nishat International FZE which is a wholly
owned subsidiary of Nishat Mills Limited, were included in the consolidated financial statements of the Company. As
per the laws of China, the financial year of companies ends on 31 December, hence, the financial statements of the
Chinese Subsidiary will be audited after the end of its financial year on 31 December 2015. Therefore, we have used
un-audited financial statements to prepare consolidated financial statements of Nishat Mills Limited and its subsidiary
companies for the year ended June 30, 2015.
The auditors’ report to the members draws attention to Note 21.6 to the consolidated financial statement which refers
to an amount of Rs. 816.033 million (2014: Rs. 816.041 million) relating to capacity purchase price, included in trade
debts of Nishat Power Limited (subsidiary of Nishat Mills Limited), not acknowledged by National Transmission and
Dispatch Company Limited (NTDCL) on the grounds that the plant was not fully available for power generation.
However, the sole reason of this under-utilization of plant capacity was non-availability of fuel owing to nonpayment by
NTDCL, therefore, management believes that Company cannot be penalized in the form of payment deductions due
to NTDCL’s default of making timely payments under the Power Purchase Agreement (PPA). Hence, the Company had
taken up this issue at appropriate forums i.e. referring this matter to the expert as per dispute resolution mechanism
envisaged in PPA and proceedings are underway. Based on the advice of the Company’s legal counsel, management
feels that there are meritorious grounds to support the Company’s stance and such amounts are likely to be recovered.
Consequently, no provision for the above mentioned amount has been made in these consolidated financial statements.
For and on behalf of the Board of Directors
Mian Umer ManshaChief Executive Officer
27 October 2015Lahore

120
121Consolidated Annual Report 2015 of Nishat Mills Limitedand its Subsidiaries
Auditors’ Report to the Members
We have audited the annexed consolidated financial statements comprising consolidated balance sheet of Nishat
Mills Limited (the Holding Company) and its Subsidiary Companies (together referred to as Group) as at 30 June 2015
and the related consolidated profit and loss account, consolidated statement of comprehensive income, consolidated
cash flow statement and consolidated statement of changes in equity together with the notes forming part thereof, for
the year then ended. We have also expressed separate opinions on the financial statements of Nishat Mills Limited
and Nishat Linen (Private) Limited. The financial statements of the Subsidiary Companies, Nishat Power Limited,
Nishat Hospitality (Private) Limited, Nishat Linen Trading LLC and Nishat International FZE were audited by other
firms of auditors, whose reports have been furnished to us and our opinion, in so far as it relates to the amounts
included for such Companies, is based solely on the reports of such other auditors. These financial statements are the
responsibility of the Holding Company’s management. Our responsibility is to express an opinion on these financial
statements based on our audit.
Our audit was conducted in accordance with the International Standards on Auditing and accordingly included such
tests of accounting records and such other auditing procedures as we considered necessary in the circumstances.
The financial statements of Nishat USA, Inc. (Subsidiary Company) and Nishat Global China Company Limited [wholly
owned subsidiary of Nishat International FZE (Subsidiary Company)] for the year ended 30 June 2015 were unaudited.
Hence, total assets and total liabilities of Rupees 71,096,526 and Rupees 70,200,014 respectively as at 30 June 2015
and net loss of Rupees 3,363,467 for the year ended 30 June 2015 pertaining to the aforesaid Companies have been
incorporated in these consolidated financial statements by the management using un-audited financial statements.
In our opinion, except for any adjustments that may have been required due to the un-audited figures in respect
of Nishat USA, Inc. and Nishat Global China Company Limited as referred to in above paragraph of the report,
the consolidated financial statements present fairly the financial position of Nishat Mills Limited and its Subsidiary
Companies as at 30 June 2015 and the results of their operations for the year then ended.
The auditors of Nishat Power Limited (Subsidiary Company) have drawn attention to Note 21.6 to the consolidated
financial statements, which describe the matter regarding recoverability of certain trade debts. Their opinion is not
qualified in respect of this matter.
Riaz Ahmad & CompanyChartered Accountants
Name of engagement partner:Muhammad Atif Mirza
27 October 2015Lahore
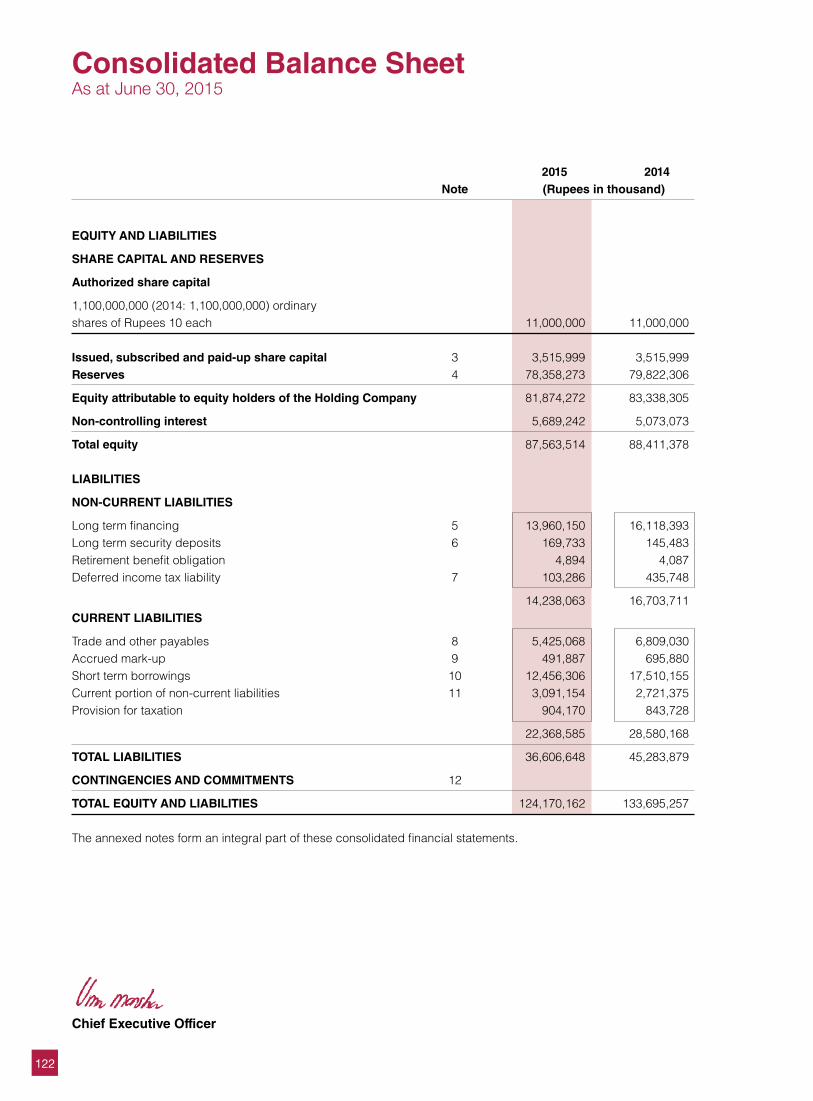
122
Consolidated Balance SheetAs at June 30, 2015
2015 2014 Note (Rupees in thousand)
EQUITY AND LIABILITIES
SHARE CAPITAL AND RESERVES
Authorized share capital
1,100,000,000 (2014: 1,100,000,000) ordinary shares of Rupees 10 each 11,000,000 11,000,000 Issued, subscribed and paid-up share capital 3 3,515,999 3,515,999 Reserves 4 78,358,273 79,822,306
Equity attributable to equity holders of the Holding Company 81,874,272 83,338,305
Non-controlling interest 5,689,242 5,073,073
Total equity 87,563,514 88,411,378 LIABILITIES
NON-CURRENT LIABILITIES
Long term financing 5 13,960,150 16,118,393 Long term security deposits 6 169,733 145,483 Retirement benefit obligation 4,894 4,087 Deferred income tax liability 7 103,286 435,748
14,238,063 16,703,711 CURRENT LIABILITIES
Trade and other payables 8 5,425,068 6,809,030 Accrued mark-up 9 491,887 695,880 Short term borrowings 10 12,456,306 17,510,155 Current portion of non-current liabilities 11 3,091,154 2,721,375 Provision for taxation 904,170 843,728
22,368,585 28,580,168
TOTAL LIABILITIES 36,606,648 45,283,879
CONTINGENCIES AND COMMITMENTS 12
TOTAL EQUITY AND LIABILITIES 124,170,162 133,695,257 The annexed notes form an integral part of these consolidated financial statements.
Chief Executive Officer
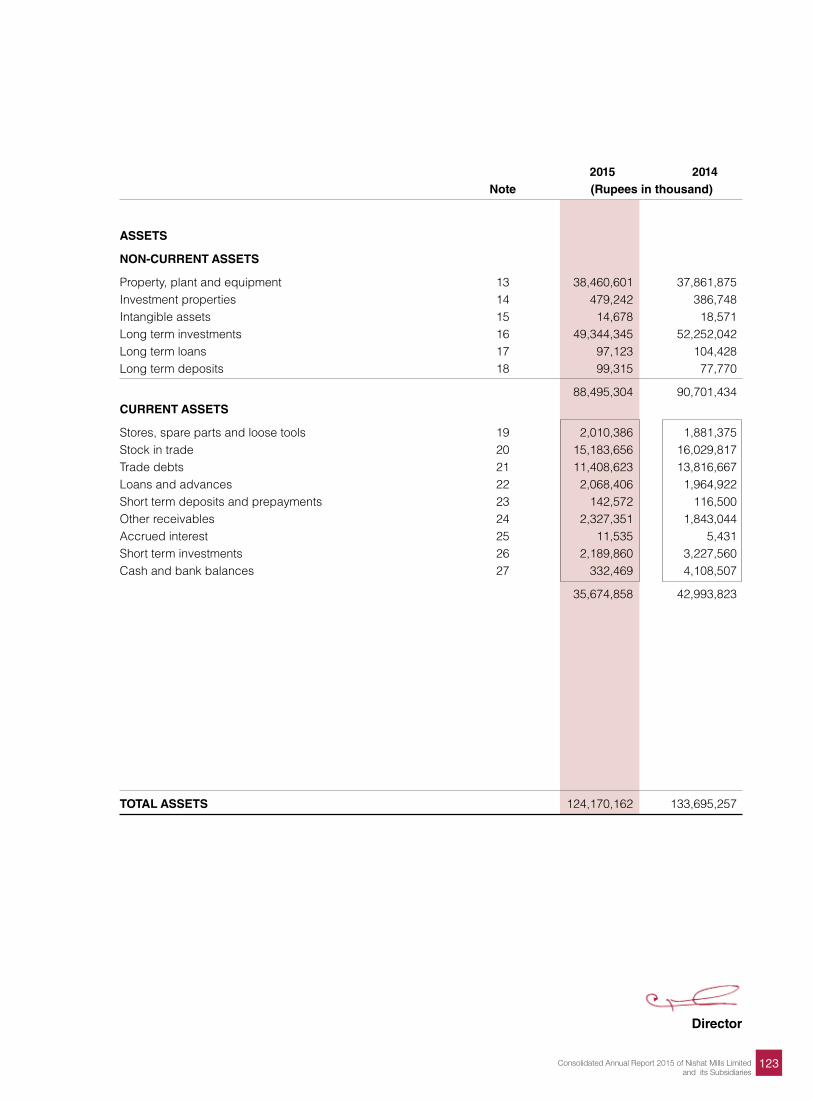
123Consolidated Annual Report 2015 of Nishat Mills Limitedand its Subsidiaries
2015 2014 Note (Rupees in thousand)
ASSETS
NON-CURRENT ASSETS
Property, plant and equipment 13 38,460,601 37,861,875 Investment properties 14 479,242 386,748 Intangible assets 15 14,678 18,571 Long term investments 16 49,344,345 52,252,042 Long term loans 17 97,123 104,428 Long term deposits 18 99,315 77,770
88,495,304 90,701,434 CURRENT ASSETS
Stores, spare parts and loose tools 19 2,010,386 1,881,375 Stock in trade 20 15,183,656 16,029,817 Trade debts 21 11,408,623 13,816,667 Loans and advances 22 2,068,406 1,964,922 Short term deposits and prepayments 23 142,572 116,500 Other receivables 24 2,327,351 1,843,044 Accrued interest 25 11,535 5,431 Short term investments 26 2,189,860 3,227,560 Cash and bank balances 27 332,469 4,108,507
35,674,858 42,993,823
TOTAL ASSETS 124,170,162 133,695,257
Director
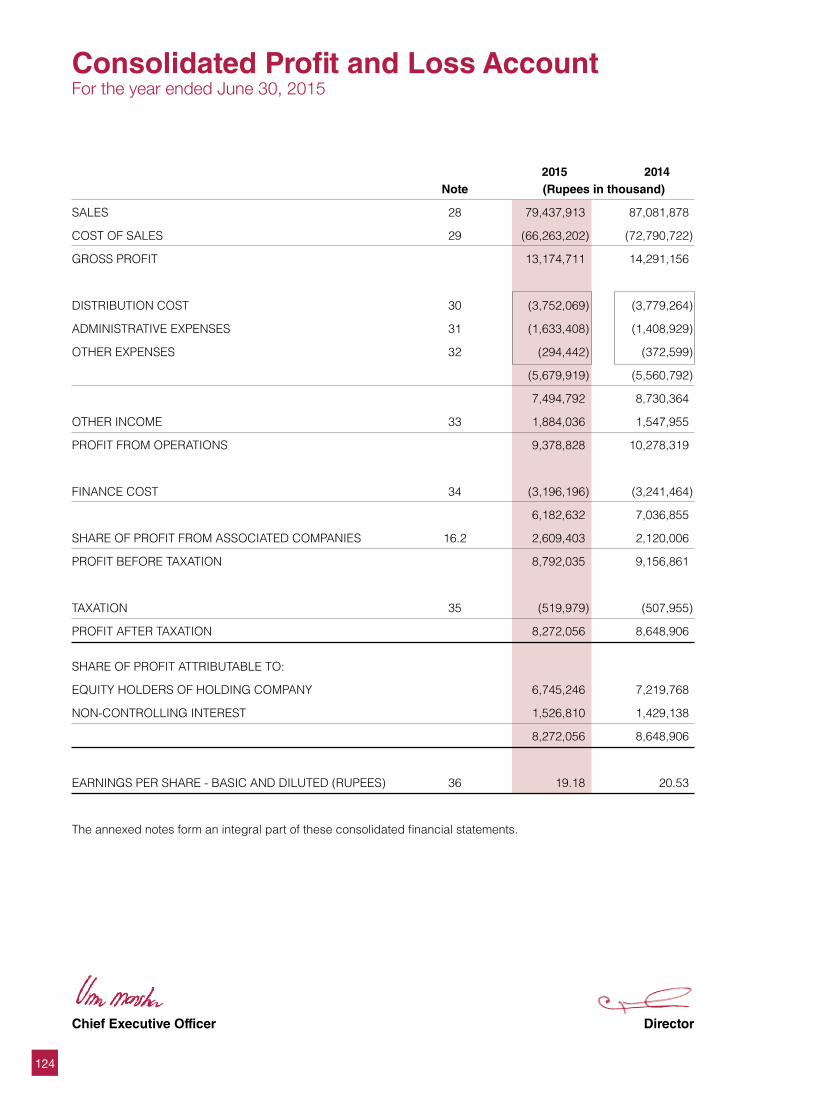
124
Consolidated Profit and Loss AccountFor the year ended June 30, 2015
2015 2014 Note (Rupees in thousand)
SALES 28 79,437,913 87,081,878
COST OF SALES 29 (66,263,202) (72,790,722)
GROSS PROFIT 13,174,711 14,291,156
DISTRIBUTION COST 30 (3,752,069) (3,779,264)
ADMINISTRATIVE EXPENSES 31 (1,633,408) (1,408,929)
OTHER EXPENSES 32 (294,442) (372,599)
(5,679,919) (5,560,792)
7,494,792 8,730,364
OTHER INCOME 33 1,884,036 1,547,955
PROFIT FROM OPERATIONS 9,378,828 10,278,319
FINANCE COST 34 (3,196,196) (3,241,464)
6,182,632 7,036,855
SHARE OF PROFIT FROM ASSOCIATED COMPANIES 16.2 2,609,403 2,120,006
PROFIT BEFORE TAXATION 8,792,035 9,156,861
TAXATION 35 (519,979) (507,955)
PROFIT AFTER TAXATION 8,272,056 8,648,906
SHARE OF PROFIT ATTRIBUTABLE TO:
EQUITY HOLDERS OF HOLDING COMPANY 6,745,246 7,219,768
NON-CONTROLLING INTEREST 1,526,810 1,429,138
8,272,056 8,648,906
EARNINGS PER SHARE - BASIC AND DILUTED (RUPEES) 36 19.18 20.53
The annexed notes form an integral part of these consolidated financial statements.
Chief Executive Officer Director
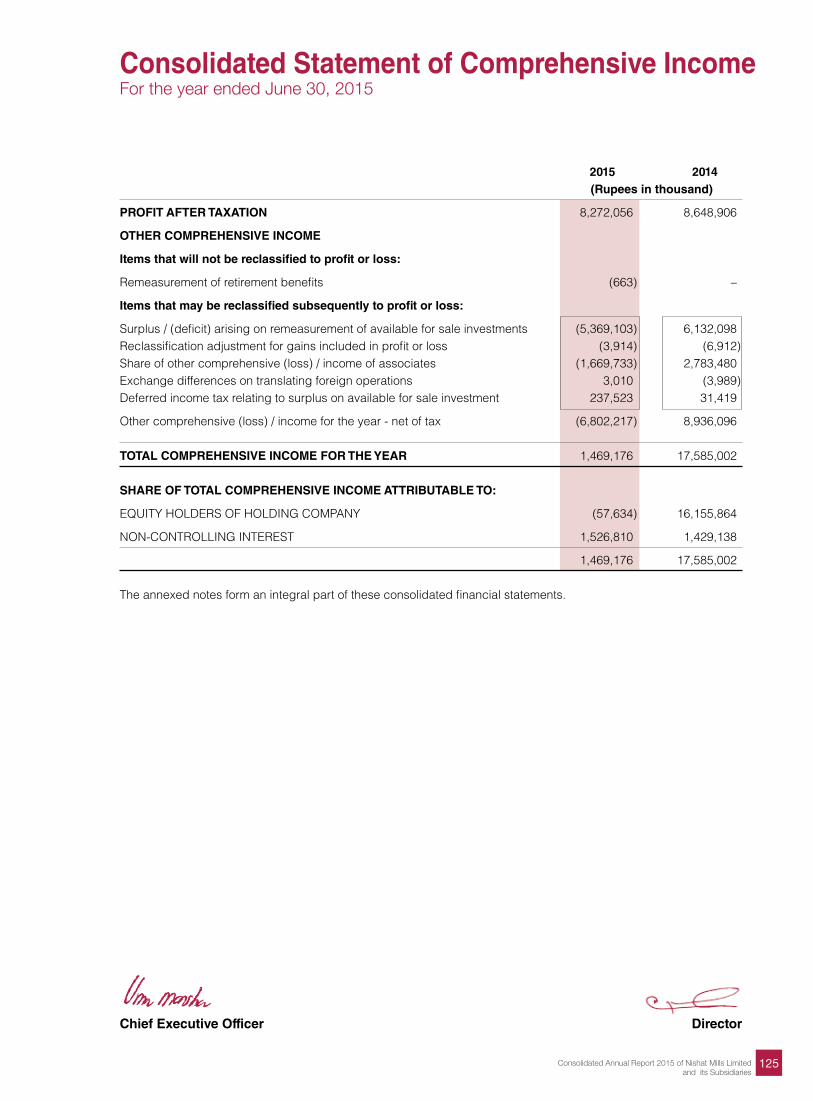
125Consolidated Annual Report 2015 of Nishat Mills Limitedand its Subsidiaries
Consolidated Statement of Comprehensive IncomeFor the year ended June 30, 2015
2015 2014 (Rupees in thousand)
PROFIT AFTER TAXATION 8,272,056 8,648,906
OTHER COMPREHENSIVE INCOME
Items that will not be reclassified to profit or loss:
Remeasurement of retirement benefits (663) –
Items that may be reclassified subsequently to profit or loss:
Surplus / (deficit) arising on remeasurement of available for sale investments (5,369,103) 6,132,098 Reclassification adjustment for gains included in profit or loss (3,914) (6,912)Share of other comprehensive (loss) / income of associates (1,669,733) 2,783,480 Exchange differences on translating foreign operations 3,010 (3,989)Deferred income tax relating to surplus on available for sale investment 237,523 31,419
Other comprehensive (loss) / income for the year - net of tax (6,802,217) 8,936,096
TOTAL COMPREHENSIVE INCOME FOR THE YEAR 1,469,176 17,585,002 SHARE OF TOTAL COMPREHENSIVE INCOME ATTRIBUTABLE TO:
EQUITY HOLDERS OF HOLDING COMPANY (57,634) 16,155,864
NON-CONTROLLING INTEREST 1,526,810 1,429,138
1,469,176 17,585,002 The annexed notes form an integral part of these consolidated financial statements.
Chief Executive Officer Director
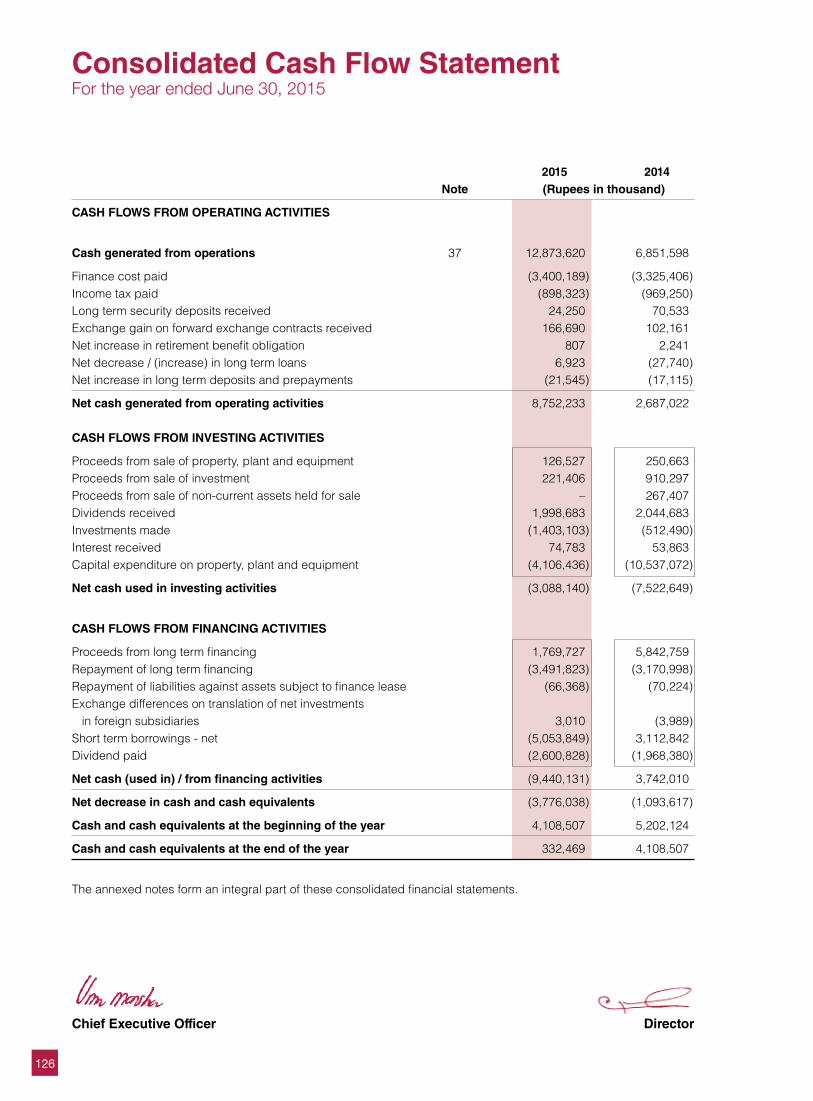
126
Consolidated Cash Flow StatementFor the year ended June 30, 2015
2015 2014 Note (Rupees in thousand)
CASH FLOWS FROM OPERATING ACTIVITIES
Cash generated from operations 37 12,873,620 6,851,598
Finance cost paid (3,400,189) (3,325,406)Income tax paid (898,323) (969,250)Long term security deposits received 24,250 70,533 Exchange gain on forward exchange contracts received 166,690 102,161 Net increase in retirement benefit obligation 807 2,241 Net decrease / (increase) in long term loans 6,923 (27,740)Net increase in long term deposits and prepayments (21,545) (17,115)
Net cash generated from operating activities 8,752,233 2,687,022 CASH FLOWS FROM INVESTING ACTIVITIES
Proceeds from sale of property, plant and equipment 126,527 250,663 Proceeds from sale of investment 221,406 910,297 Proceeds from sale of non-current assets held for sale – 267,407 Dividends received 1,998,683 2,044,683 Investments made (1,403,103) (512,490)Interest received 74,783 53,863 Capital expenditure on property, plant and equipment (4,106,436) (10,537,072)
Net cash used in investing activities (3,088,140) (7,522,649)
CASH FLOWS FROM FINANCING ACTIVITIES
Proceeds from long term financing 1,769,727 5,842,759 Repayment of long term financing (3,491,823) (3,170,998)Repayment of liabilities against assets subject to finance lease (66,368) (70,224)Exchange differences on translation of net investments in foreign subsidiaries 3,010 (3,989)Short term borrowings - net (5,053,849) 3,112,842 Dividend paid (2,600,828) (1,968,380)
Net cash (used in) / from financing activities (9,440,131) 3,742,010
Net decrease in cash and cash equivalents (3,776,038) (1,093,617)
Cash and cash equivalents at the beginning of the year 4,108,507 5,202,124
Cash and cash equivalents at the end of the year 332,469 4,108,507
The annexed notes form an integral part of these consolidated financial statements.
Chief Executive Officer Director
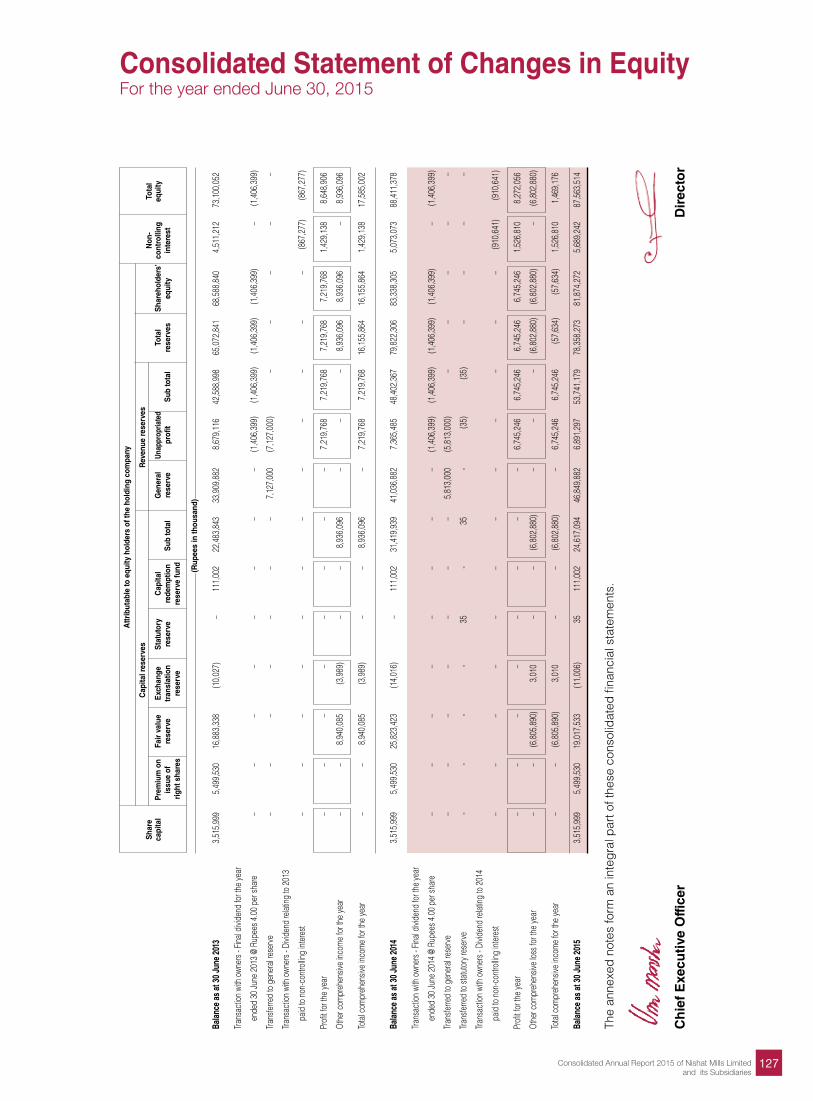
127Consolidated Annual Report 2015 of Nishat Mills Limitedand its Subsidiaries
Consolidated Statement of Changes in EquityFor the year ended June 30, 2015
A
ttrib
utab
le to
equ
ity h
olde
rs o
f the
hol
ding
com
pany
S
hare
C
apita
l res
erve
s R
even
ue re
serv
es
Non
- To
tal
ca
pita
l P
rem
ium
on
Fair
val
ue
Exc
hang
e S
tatu
tory
C
apita
l
Gen
eral
U
napp
ropr
iate
d
To
tal
Sha
reho
lder
s’
cont
rolli
ng
equi
ty
iss
ue o
f re
serv
e tr
ansl
atio
n re
serv
e re
dem
ptio
n S
ub to
tal
rese
rve
pro
fit
Sub
tota
l re
serv
es
equi
ty
inte
rest
right
sha
res
rese
rve
re
serv
e fu
nd
(R
upee
s in
thou
sand
)
Bala
nce
as a
t 30
June
201
3 3
,515
,999
5
,499
,530
1
6,88
3,33
8
(10,
027)
–
1
11,0
02
22,
483,
843
3
3,90
9,88
2
8,6
79,1
16
42,
588,
998
6
5,07
2,84
1
68,
588,
840
4
,511
,212
7
3,10
0,05
2
Trans
actio
n wi
th o
wner
s - F
inal d
ivide
nd fo
r the
year
e
nded
30
June
201
3 @
Rupe
es 4
.00
per s
hare
–
–
–
–
– –
– –
(1
,406
,399
) (1
,406
,399
) (1
,406
,399
) (1
,406
,399
) –
(1,4
06,3
99)
Trans
ferre
d to
gen
eral
rese
rve
– –
–
–
–
– –
7,1
27,0
00
(7,1
27,0
00)
–
– –
– –
Trans
actio
n wi
th o
wner
s - D
ivide
nd re
lating
to 2
013
p
aid to
non
-con
trollin
g int
eres
t –
–
–
–
– –
–
– –
– –
– (8
67,2
77)
(867
,277
)
Profi
t for
the
year
–
–
–
–
– –
–
–
7,2
19,7
68
7,2
19,7
68
7,2
19,7
68
7,2
19,7
68
1,4
29,1
38
8,6
48,9
06
Othe
r com
preh
ensiv
e inc
ome
for t
he ye
ar
– –
8
,940
,085
(3
,989
) –
–
8,9
36,0
96
–
– –
8
,936
,096
8
,936
,096
–
8,9
36,0
96
Tota
l com
preh
ensiv
e inc
ome
for t
he ye
ar
– –
8
,940
,085
(3
,989
) –
–
8
,936
,096
–
7
,219
,768
7
,219
,768
1
6,15
5,86
4
16,
155,
864
1
,429
,138
1
7,58
5,00
2
Bala
nce
as a
t 30
June
201
4 3
,515
,999
5
,499
,530
2
5,82
3,42
3
(14,
016)
–
1
11,0
02
31,
419,
939
4
1,03
6,88
2
7,3
65,4
85
48,
402,
367
7
9,82
2,30
6
83,
338,
305
5
,073
,073
8
8,41
1,37
8
Trans
actio
n wi
th o
wner
s - F
inal d
ivide
nd fo
r the
year
e
nded
30
June
201
4 @
Rupe
es 4
.00
per s
hare
–
–
–
–
– –
–
– (1
,406
,399
) (1
,406
,399
) (1
,406
,399
) (1
,406
,399
) –
(1,4
06,3
99)
Trans
ferre
d to
gen
eral
rese
rve
– –
–
–
–
– –
5,8
13,0
00
(5,8
13,0
00)
–
– –
–
–
Trans
ferre
d to
stat
utor
y res
erve
-
-
-
-
3
5
-
35
-
(3
5)
(35)
–
–
– –
Trans
actio
n wi
th o
wner
s - D
ivide
nd re
lating
to 2
014
p
aid to
non
-con
trollin
g int
eres
t –
–
–
–
– –
–
–
–
– –
–
(910
,641
) (9
10,6
41)
Profi
t for
the
year
–
–
–
–
– –
–
– 6
,745
,246
6
,745
,246
6
,745
,246
6
,745
,246
1
,526
,810
8
,272
,056
Othe
r com
preh
ensiv
e los
s for
the
year
–
–
(6
,805
,890
) 3
,010
–
–
(6
,802
,880
) –
–
– (6
,802
,880
) (6
,802
,880
) –
(6,8
02,8
80)
Tota
l com
preh
ensiv
e inc
ome
for t
he ye
ar
–
–
(6,8
05,8
90)
3,0
10
–
– (6
,802
,880
) –
6,7
45,2
46
6,7
45,2
46
(57,
634)
(5
7,63
4)
1,5
26,8
10
1,4
69,1
76
Bala
nce
as a
t 30
June
201
5 3
,515
,999
5
,499
,530
1
9,01
7,53
3
(11,
006)
3
5
111
,002
2
4,61
7,09
4
46,
849,
882
6
,891
,297
5
3,74
1,17
9
78,
358,
273
8
1,87
4,27
2
5,6
89,2
42
87,
563,
514
The
anne
xed
note
s fo
rm a
n in
tegr
al p
art o
f the
se c
onso
lidat
ed fi
nanc
ial s
tate
men
ts.
Ch
ief
Exe
cuti
ve O
ffice
r
D
irec
tor
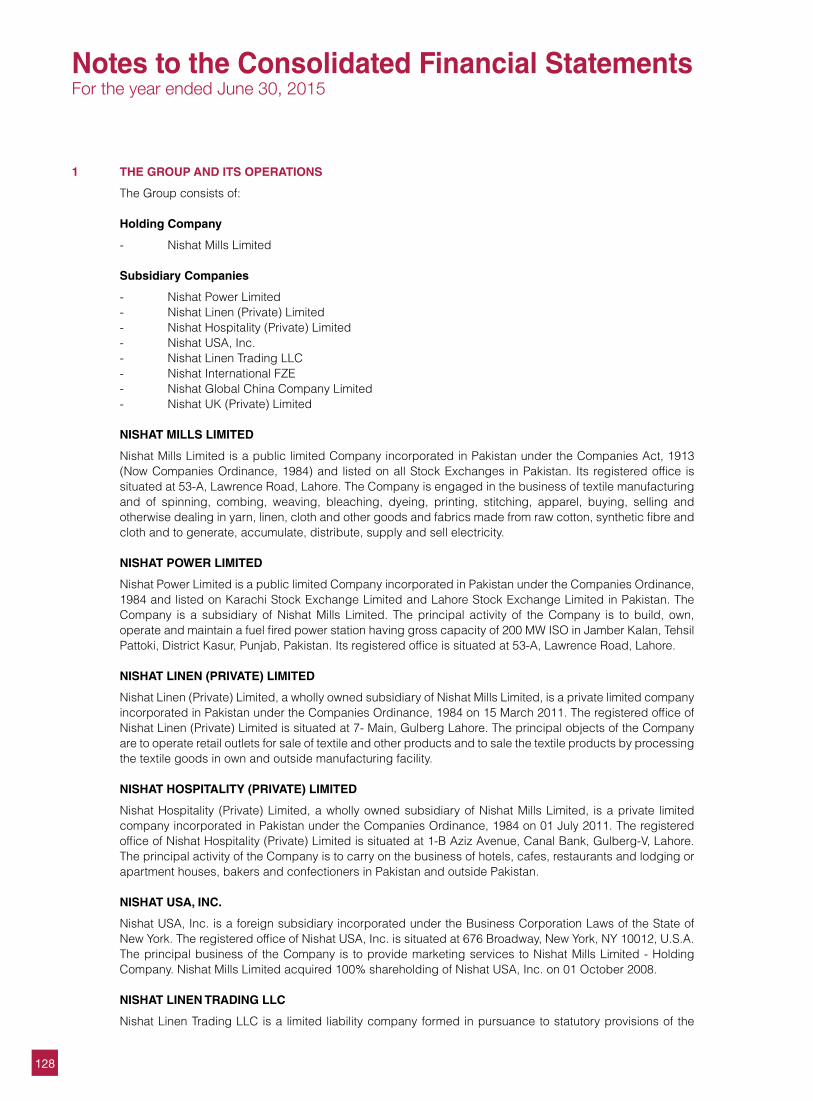
128
1 THE GROUP AND ITS OPERATIONS
The Group consists of:
Holding Company
- Nishat Mills Limited
Subsidiary Companies
- Nishat Power Limited - Nishat Linen (Private) Limited - Nishat Hospitality (Private) Limited - Nishat USA, Inc. - Nishat Linen Trading LLC - Nishat International FZE - Nishat Global China Company Limited - Nishat UK (Private) Limited
NISHAT MILLS LIMITED
Nishat Mills Limited is a public limited Company incorporated in Pakistan under the Companies Act, 1913 (Now Companies Ordinance, 1984) and listed on all Stock Exchanges in Pakistan. Its registered office is situated at 53-A, Lawrence Road, Lahore. The Company is engaged in the business of textile manufacturing and of spinning, combing, weaving, bleaching, dyeing, printing, stitching, apparel, buying, selling and otherwise dealing in yarn, linen, cloth and other goods and fabrics made from raw cotton, synthetic fibre and cloth and to generate, accumulate, distribute, supply and sell electricity.
NISHAT POWER LIMITED
Nishat Power Limited is a public limited Company incorporated in Pakistan under the Companies Ordinance, 1984 and listed on Karachi Stock Exchange Limited and Lahore Stock Exchange Limited in Pakistan. The Company is a subsidiary of Nishat Mills Limited. The principal activity of the Company is to build, own, operate and maintain a fuel fired power station having gross capacity of 200 MW ISO in Jamber Kalan, Tehsil Pattoki, District Kasur, Punjab, Pakistan. Its registered office is situated at 53-A, Lawrence Road, Lahore.
NISHAT LINEN (PRIVATE) LIMITED
Nishat Linen (Private) Limited, a wholly owned subsidiary of Nishat Mills Limited, is a private limited company incorporated in Pakistan under the Companies Ordinance, 1984 on 15 March 2011. The registered office of Nishat Linen (Private) Limited is situated at 7- Main, Gulberg Lahore. The principal objects of the Company are to operate retail outlets for sale of textile and other products and to sale the textile products by processing the textile goods in own and outside manufacturing facility.
NISHAT HOSPITALITY (PRIVATE) LIMITED
Nishat Hospitality (Private) Limited, a wholly owned subsidiary of Nishat Mills Limited, is a private limited company incorporated in Pakistan under the Companies Ordinance, 1984 on 01 July 2011. The registered office of Nishat Hospitality (Private) Limited is situated at 1-B Aziz Avenue, Canal Bank, Gulberg-V, Lahore. The principal activity of the Company is to carry on the business of hotels, cafes, restaurants and lodging or apartment houses, bakers and confectioners in Pakistan and outside Pakistan.
NISHAT USA, INC.
Nishat USA, Inc. is a foreign subsidiary incorporated under the Business Corporation Laws of the State of New York. The registered office of Nishat USA, Inc. is situated at 676 Broadway, New York, NY 10012, U.S.A. The principal business of the Company is to provide marketing services to Nishat Mills Limited - Holding Company. Nishat Mills Limited acquired 100% shareholding of Nishat USA, Inc. on 01 October 2008.
NISHAT LINEN TRADING LLC
Nishat Linen Trading LLC is a limited liability company formed in pursuance to statutory provisions of the
Notes to the Consolidated Financial StatementsFor the year ended June 30, 2015
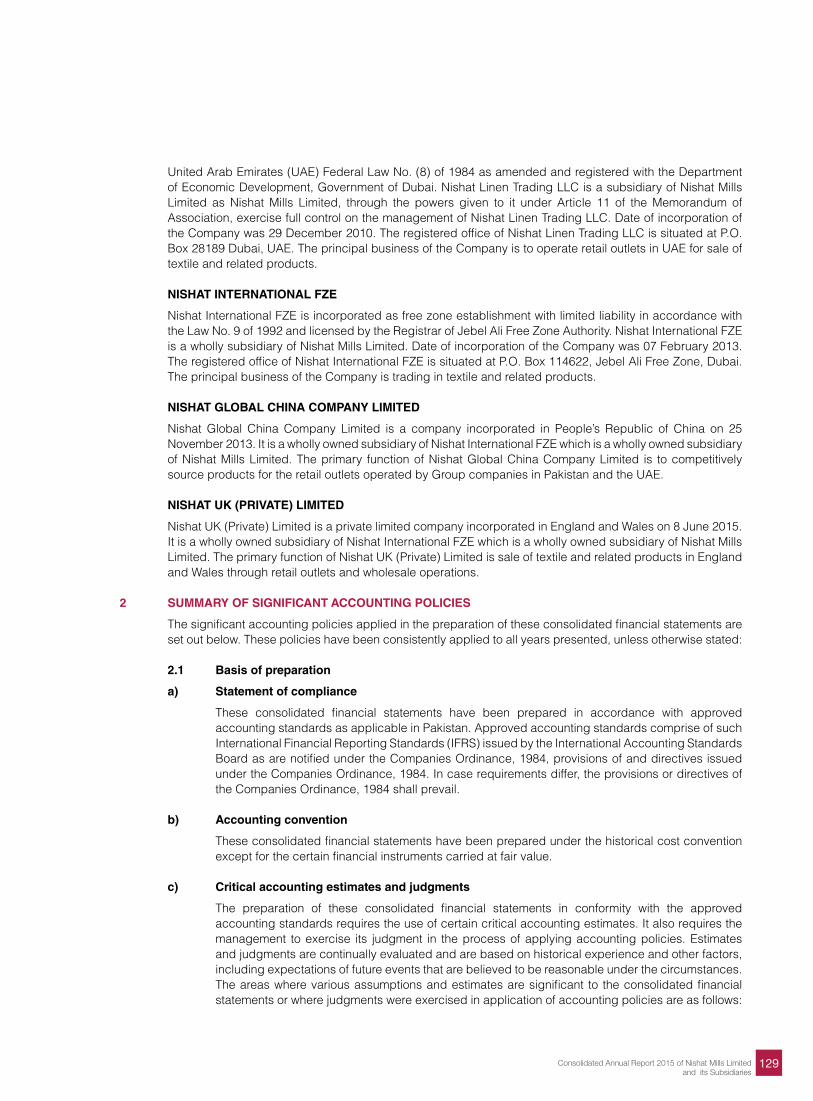
129Consolidated Annual Report 2015 of Nishat Mills Limitedand its Subsidiaries
United Arab Emirates (UAE) Federal Law No. (8) of 1984 as amended and registered with the Department of Economic Development, Government of Dubai. Nishat Linen Trading LLC is a subsidiary of Nishat Mills Limited as Nishat Mills Limited, through the powers given to it under Article 11 of the Memorandum of Association, exercise full control on the management of Nishat Linen Trading LLC. Date of incorporation of the Company was 29 December 2010. The registered office of Nishat Linen Trading LLC is situated at P.O. Box 28189 Dubai, UAE. The principal business of the Company is to operate retail outlets in UAE for sale of textile and related products.
NISHAT INTERNATIONAL FZE
Nishat International FZE is incorporated as free zone establishment with limited liability in accordance with the Law No. 9 of 1992 and licensed by the Registrar of Jebel Ali Free Zone Authority. Nishat International FZE is a wholly subsidiary of Nishat Mills Limited. Date of incorporation of the Company was 07 February 2013. The registered office of Nishat International FZE is situated at P.O. Box 114622, Jebel Ali Free Zone, Dubai. The principal business of the Company is trading in textile and related products.
NISHAT GLOBAL CHINA COMPANY LIMITED
Nishat Global China Company Limited is a company incorporated in People’s Republic of China on 25 November 2013. It is a wholly owned subsidiary of Nishat International FZE which is a wholly owned subsidiary of Nishat Mills Limited. The primary function of Nishat Global China Company Limited is to competitively source products for the retail outlets operated by Group companies in Pakistan and the UAE.
NISHAT UK (PRIVATE) LIMITED
Nishat UK (Private) Limited is a private limited company incorporated in England and Wales on 8 June 2015. It is a wholly owned subsidiary of Nishat International FZE which is a wholly owned subsidiary of Nishat Mills Limited. The primary function of Nishat UK (Private) Limited is sale of textile and related products in England and Wales through retail outlets and wholesale operations.
2 SUMMARY OF SIGNIFICANT ACCOUNTING POLICIES
The significant accounting policies applied in the preparation of these consolidated financial statements are set out below. These policies have been consistently applied to all years presented, unless otherwise stated:
2.1 Basis of preparation
a) Statement of compliance
These consolidated financial statements have been prepared in accordance with approved accounting standards as applicable in Pakistan. Approved accounting standards comprise of such International Financial Reporting Standards (IFRS) issued by the International Accounting Standards Board as are notified under the Companies Ordinance, 1984, provisions of and directives issued under the Companies Ordinance, 1984. In case requirements differ, the provisions or directives of the Companies Ordinance, 1984 shall prevail.
b) Accounting convention
These consolidated financial statements have been prepared under the historical cost convention except for the certain financial instruments carried at fair value.
c) Critical accounting estimates and judgments
The preparation of these consolidated financial statements in conformity with the approved accounting standards requires the use of certain critical accounting estimates. It also requires the management to exercise its judgment in the process of applying accounting policies. Estimates and judgments are continually evaluated and are based on historical experience and other factors, including expectations of future events that are believed to be reasonable under the circumstances. The areas where various assumptions and estimates are significant to the consolidated financial statements or where judgments were exercised in application of accounting policies are as follows:
130
Financial instruments
The fair value of financial instruments that are not traded in an active market is determined by using valuation techniques based on assumptions that are dependent on conditions existing at balance sheet date.
Useful lives, patterns of economic benefits and impairments
Estimates with respect to residual values and useful lives and pattern of flow of economic benefits are based on the analysis of the management. Further, the Group reviews the value of assets for possible impairment on an annual basis. Any change in the estimates in the future might affect the carrying amount of respective item of property, plant and equipment, with a corresponding effect on the depreciation charge and impairment.
Inventories
Net realizable value of inventories is determined with reference to currently prevailing selling prices less estimated expenditure to make sales.
Taxation
In making the estimates for income tax currently payable, the management takes into account the current income tax law and the decisions of appellate authorities on certain issues in the past.
Provision for doubtful debts
The Group reviews its receivable against any provision required for any doubtful balances on an ongoing basis. The provision is made while taking into consideration expected recoveries, if any.
Impairment of investments in equity method accounted for associated companies
In making an estimate of recoverable amount of the Group’s investments in equity method accounted associated companies, the management considers future cash flows.
d) Amendments to published approved standards and interpretation that are effective in current year and are relevant to the Group
The following amendments to published approved standards are mandatory for the Group’s accounting periods beginning on or after 01 July 2014:
IAS 32 (Amendments) ‘Financial Instruments: Presentation’ (effective for annual periods beginning on or after 01 January 2014). Amendments have been made to clarify certain aspects because of diversity in application of the requirements on offsetting, focused on four main areas: the meaning of ‘currently has a legally enforceable right of set-off’; the application of simultaneous realization and settlement; the offsetting of collateral amounts and the unit of account for applying the offsetting requirements.
IAS 36 (Amendments) ‘Impairment of Assets’ (effective for annual periods beginning on or after 01 January 2014). Amendments have been made in IAS 36 to reduce the circumstances in which the recoverable amount of assets or cash-generating units is required to be disclosed, clarify the disclosures required and to introduce an explicit requirement to disclose the discount rate used in determining impairment (or reversals) where recoverable amount (based on fair value less costs of disposal) is determined using a present value technique.
IFRIC 21 ‘Levies’ (effective for annual periods beginning on or after 01 January 2014). The interpretation provides guidance on when to recognize a liability for a levy imposed by a government, both for levies that are accounted for in accordance with IAS 37 ‘Provisions, Contingent Liabilities and Contingent Assets’ and those where the timing and amount of the levy is certain. The Interpretation identifies the obligating event for the recognition of a liability as the activity that triggers the payment of the levy in accordance with the relevant legislation.
Notes to the Consolidated Financial StatementsFor the year ended June 30, 2015
131Consolidated Annual Report 2015 of Nishat Mills Limitedand its Subsidiaries
On 12 December 2013, IASB issued Annual Improvements to IFRSs: 2010 – 2012 Cycle, incorporating amendments to seven IFRSs more specifically in IFRS 8 ‘Operating Segments’ and IAS 24 ‘Related Party Disclosures’, which are considered relevant to the Group’s financial statements. These amendments are effective for annual periods beginning on or after 01 July 2014. The amendments to IFRS 8 require an entity to disclose the judgments made by the management in applying the aggregation criteria to operating segments, including a description of the operating segments aggregated and the economic indicators assessed in determining whether the operating segments have ‘similar economic characteristics’. Further, the amendment to IFRS 8 clarifies that a reconciliation of the total of the reportable segments’ assets to the entity’s assets should only be provided if the segment assets are regularly provided to the chief operating decision-maker. The amendments to IAS 24 clarify that a management entity providing key management personnel services to a reporting entity is a related party of the reporting entity. Consequently, the reporting entity must disclose as related party transactions the amounts incurred for the service paid or payable to the management entity for the provision of key management personnel services. However, disclosure of the components of such compensation is not required.
e) Amendments to published approved standards that are effective in current year but not relevant to the Group
There are other amendments to the published approved standards that are mandatory for accounting periods beginning on or after 01 July 2014 but are considered not to be relevant or do not have any significant impact on the Group’s consolidated financial statements and are therefore not detailed in these consolidated financial statements.
f) Standards and amendments to published standards that are not yet effective but relevant to the Group
Following standards and amendments to existing standards have been published and are mandatory for the Group’s accounting periods beginning on or after 01 July 2015 or later periods:
IFRS 9 ‘Financial Instruments’ (effective for annual periods beginning on or after 01 January 2018).
A finalized version of IFRS 9 which contains accounting requirements for financial instruments, replacing IAS 39 ‘Financial Instruments: Recognition and Measurement’. Financial assets are classified by reference to the business model within which they are held and their contractual cash flow characteristics. The 2014 version of IFRS 9 introduces a ‘fair value through other comprehensive income’ category for certain debt instruments. Financial liabilities are classified in a similar manner to under IAS 39, however there are differences in the requirements applying to the measurement of an entity’s own credit risk. The 2014 version of IFRS 9 introduces an ‘expected credit loss’ model for the measurement of the impairment of financial assets, so it is no longer necessary for a credit event to have occurred before a credit loss is recognized. It introduces a new hedge accounting model that is designed to be more closely aligned with how entities undertake risk management activities when hedging financial and non-financial risk exposures. The requirements for the derecognition of financial assets and liabilities are carried forward from IAS 39. The management of the Group is in the process of evaluating the impacts of the aforesaid standard on the Group’s consolidated financial statements.
IFRS 10 ‘Consolidated Financial Statements’ (effective for annual periods beginning on or after 01 January 2015). Concurrent with the issuance of IFRS 10, the IASB has also issued IFRS 11 ‘Joint Arrangements’, IFRS 12 ‘Disclosure of Interests in Other Entities’, IAS 27 (revised 2011) ‘Consolidated and Separate Financial Statements’ and IAS 28 (revised 2011) ‘Investments in Associates’. The objective of IFRS 10 is to have a single basis for consolidation for all entities, regardless of the nature of the investee, and that basis is control. The definition of control includes three elements: power over an investee, exposure or rights to variable returns of the investee and the ability to use power over the investee to affect the investor’s returns. IFRS 10 replaces those parts of IAS 27 ‘Consolidated and Separate Financial Statements’ that address when and how an investor should prepare consolidated financial statements and replaces Standing Interpretations Committee (SIC) 12 ‘Consolidation – Special Purpose Entities’ in its entirety. The management of the Group is in the process of evaluating the impacts of the aforesaid standard on the Group’s consolidated financial statements.
132
IFRS 12 ‘Disclosures of Interests in Other Entities’ (effective for annual periods beginning on or after 01 January 2015). This standard includes the disclosure requirements for all forms of interests in other entities, including joint arrangements, associates, special purpose vehicles and other
off-balance sheet vehicles. This standard is not expected to have a material impact on the Group’s consolidated financial statements.
IFRS 13 ‘Fair Value Measurement’ (effective for annual periods beginning on or after 01 January 2015). This standard aims to improve consistency and reduce complexity by providing a precise definition of fair value and a single source of fair value measurement and disclosure requirements for use across IFRSs. The requirements, which are largely aligned between IFRSs and US GAAP, do not extend the use of fair value accounting but provide guidance on how it should be applied where its use is already required or permitted by other standards within IFRSs or US GAAP. This standard is not expected to have a material impact on the Group’s consolidated financial statements.
Amendments to IFRS 10, IFRS 11 and IFRS 12 (effective for annual periods beginning on or after 01 January 2015) provide additional transition relief in by limiting the requirement to provide adjusted comparative information to only the preceding comparative period. Also, amendments to IFRS 12 eliminate the requirement to provide comparative information for periods prior to the immediately preceding period.
Amendments to IFRS 10 and IAS 28 (effective for annual periods beginning on or after 01 January 2016) to clarify the treatment of the sale or contribution of assets from an investor to its associates or joint venture, as follows: require full recognition in the investor’s financial statements of gains and losses arising on the sale or contribution of assets that constitute a business (as defined in IFRS 3 ‘Business Combinations’); require the partial recognition of gains and losses where the assets do not constitute a business, i.e. a gain or loss is recognized only to the extent of the unrelated investors’ interests in that associate or joint venture. These requirements apply regardless of the legal form of the transaction, e.g. whether the sale or contribution of assets occur by an investor transferring shares in a subsidiary that holds the assets (resulting in loss of control of the subsidiary), or by the direct sale of the assets themselves. The management of the Group is in the process of evaluating the impacts of the aforesaid amendments on the Group’s consolidated financial statements.
Amendments to IFRS 10, IFRS 12 and IAS 27 (effective for annual periods beginning on or after 01 January 2015) provide ‘investment entities’ an exemption from the consolidation of particular subsidiaries and instead require that: an investment entity measure the investment in each eligible subsidiary at fair value through profit or loss; requires additional disclosures; and require an investment entity to account for its investment in a relevant subsidiary in the same way in its consolidated and separate financial statements. The management of the Group is in the process of evaluating the impacts of the aforesaid amendments on the Group’s consolidated financial statements.
Amendments to IFRS 10, IFRS 12 and IAS 28 (effective for annual periods beginning on or after 01 January 2016) to address issues that have arisen in the context of applying the consolidation exception for investment entities by clarifying the following points: the exemption from preparing consolidated financial statements for an intermediate parent entity is available to a parent entity that is a subsidiary of an investment entity, even if the investment entity measures all of its subsidiaries at fair value; a subsidiary that provides services related to the parent’s investment activities should not be consolidated if the subsidiary itself is an investment entity; when applying the equity method to an associate or a joint venture, a non-investment entity investor in an investment entity may retain the fair value measurement applied by the associate or joint venture to its interests in subsidiaries; and an investment entity measuring all of its subsidiaries at fair value provides the disclosures relating to investment entities required by IFRS 12. The management of the Group is in the process of evaluating the impacts of the aforesaid amendments on the Group’s consolidated financial statements.
IFRS 15 ‘Revenue from Contracts with Customers’ (effective for annual periods beginning on or after 01 January 2017). IFRS 15 provides a single, principles based five-step model to be applied to all
Notes to the Consolidated Financial StatementsFor the year ended June 30, 2015
133Consolidated Annual Report 2015 of Nishat Mills Limitedand its Subsidiaries
contracts with customers. The five steps in the model are: identify the contract with the customer; identify the performance obligations in the contract; determine the transaction price; allocate the transaction price to the performance obligations in the contracts; and recognise revenue when (or as) the entity satisfies a performance obligation. Guidance is provided on topics such as the point in which revenue is recognised, accounting for variable consideration, costs of fulfilling and obtaining a contract and various related matters. New disclosures about revenue are also introduced. The management of the Group is in the process of evaluating the impacts of the aforesaid standard on the Group’s consolidated financial statements.
IAS 1 (Amendments) ‘Presentation of Financial Statements’ (effective for annual periods beginning on or after 01 January 2016). Amendments have been made to address perceived impediments to preparers exercising their judgement in presenting their financial reports by making the following changes: clarification that information should not be obscured by aggregating or by providing immaterial information, materiality consideration apply to the all parts of the financial statements, and even when a standard requires a specific disclosure, materiality consideration do apply; clarification that the list of the line items to be presented in these statements can be disaggregated and aggregated as relevant and additional guidance on subtotals in these statements and clarification that an entity’s share of other comprehensive income of equity-accounted associates and joint ventures should be presented in aggregate as single line items based on whether or not it will subsequently be reclassified to profit or loss; and additional examples of possible ways of ordering the notes to clarify that understandability and comparability should be considered when determining the order of the notes and to demonstrate that the notes need not be presented in the order so far listed in IAS 1. However, the amendments are not expected to have a material impact on the Group’s consolidated financial statements.
IAS 16 (Amendments) ‘Property, Plant and Equipment’ (effective for annual periods beginning on or after 01 January 2016). The amendments clarify that a depreciation method that is based on revenue that is generated by an activity that includes the use of an asset is not appropriate for property, plant and equipment; and add guidance that expected future reductions in the selling price of an item that was produced using an asset could indicate the expectation of technological or commercial obsolescence of the asset, which, in turn, might reflect a reduction of the future economic benefits embodied in the asset. However, the amendments are not expected to have a material impact on the Group’s consolidated financial statements.
IAS 27 (Amendments) ‘Separate Financial Statements’ (effective for annual periods beginning on or after 01 January 2016). The amendments have been made to permit investments in subsidiaries, joint ventures and associates to be optionally accounted for using the equity method in separate financial statements. The management of the Group is in the process of evaluating the impacts of the aforesaid amendments on the Group’s consolidated financial statements.
g) Standard and amendments to published standards that are not yet effective and not considered
relevant to the Group
There are other standard and amendments to published standards that are mandatory for accounting periods beginning on or after 01 July 2015 but are considered not to be relevant or do not have any significant impact on the Group’s consolidated financial statements and are therefore not detailed in these consolidated financial statements.
h) Exemption from applicability of IFRIC 4 ‘Determining whether an Arrangement contains a Lease’
SECP through SRO 24(I)/2012 dated 16 January 2012, has exempted the application of International Financial Reporting Interpretations Committee (IFRIC) 4 ‘Determining whether an Arrangement contains a Lease’ to all companies. However, the SECP made it mandatory to disclose the impact of the application of IFRIC 4 on the results of the companies. This interpretation provides guidance on determining whether arrangements that do not take the legal form of a lease should, nonetheless, be accounted for as a lease in accordance with IAS 17 ‘Leases’.
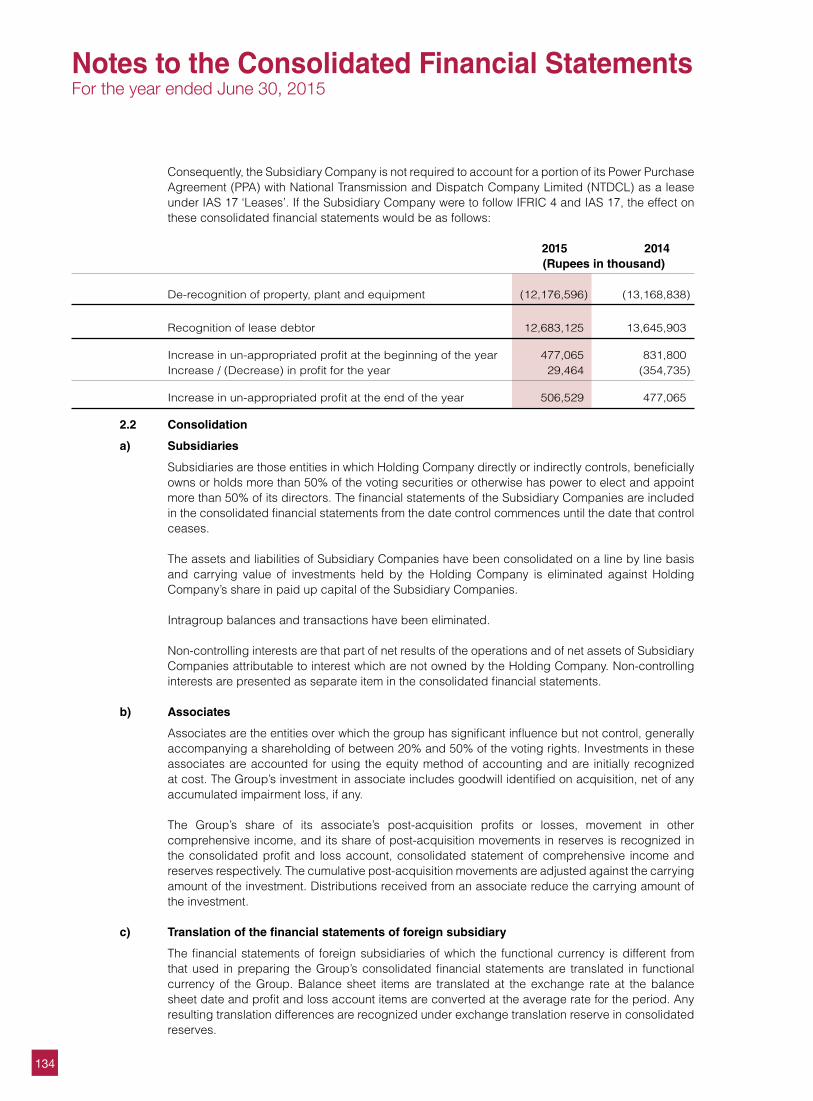
134
Consequently, the Subsidiary Company is not required to account for a portion of its Power Purchase Agreement (PPA) with National Transmission and Dispatch Company Limited (NTDCL) as a lease under IAS 17 ‘Leases’. If the Subsidiary Company were to follow IFRIC 4 and IAS 17, the effect on these consolidated financial statements would be as follows:
2015 2014 (Rupees in thousand)
De-recognition of property, plant and equipment (12,176,596) (13,168,838)
Recognition of lease debtor 12,683,125 13,645,903
Increase in un-appropriated profit at the beginning of the year 477,065 831,800 Increase / (Decrease) in profit for the year 29,464 (354,735)
Increase in un-appropriated profit at the end of the year 506,529 477,065
2.2 Consolidation
a) Subsidiaries
Subsidiaries are those entities in which Holding Company directly or indirectly controls, beneficially owns or holds more than 50% of the voting securities or otherwise has power to elect and appoint more than 50% of its directors. The financial statements of the Subsidiary Companies are included in the consolidated financial statements from the date control commences until the date that control ceases.
The assets and liabilities of Subsidiary Companies have been consolidated on a line by line basis and carrying value of investments held by the Holding Company is eliminated against Holding Company’s share in paid up capital of the Subsidiary Companies.
Intragroup balances and transactions have been eliminated.
Non-controlling interests are that part of net results of the operations and of net assets of Subsidiary Companies attributable to interest which are not owned by the Holding Company. Non-controlling interests are presented as separate item in the consolidated financial statements.
b) Associates
Associates are the entities over which the group has significant influence but not control, generally accompanying a shareholding of between 20% and 50% of the voting rights. Investments in these associates are accounted for using the equity method of accounting and are initially recognized at cost. The Group’s investment in associate includes goodwill identified on acquisition, net of any accumulated impairment loss, if any.
The Group’s share of its associate’s post-acquisition profits or losses, movement in other comprehensive income, and its share of post-acquisition movements in reserves is recognized in the consolidated profit and loss account, consolidated statement of comprehensive income and reserves respectively. The cumulative post-acquisition movements are adjusted against the carrying amount of the investment. Distributions received from an associate reduce the carrying amount of the investment.
c) Translation of the financial statements of foreign subsidiary
The financial statements of foreign subsidiaries of which the functional currency is different from that used in preparing the Group’s consolidated financial statements are translated in functional currency of the Group. Balance sheet items are translated at the exchange rate at the balance sheet date and profit and loss account items are converted at the average rate for the period. Any resulting translation differences are recognized under exchange translation reserve in consolidated reserves.
Notes to the Consolidated Financial StatementsFor the year ended June 30, 2015
135Consolidated Annual Report 2015 of Nishat Mills Limitedand its Subsidiaries
2.3 Employee benefit
The Group operates an approved funded provident fund scheme covering all permanent employees. Equal monthly contributions are made both by the employer and employees to the fund. The employer’s contributions to the fund are charged to consolidated profit and loss account.
2.4 Taxation
Current
Holding Company
Provision for current tax is based on the taxable income for the year determined in accordance with the prevailing law for taxation of income. The charge for current tax is calculated using prevailing tax rates or tax rates expected to apply to the profit for the year if enacted. The charge for current tax also includes adjustments, where considered necessary, to provision for tax made in previous years arising from assessments framed during the year for such years.
Subsidiary Companies
The profits and gains of Nishat Power Limited - Subsidiary Company derived from electric power generation are exempt from tax in terms of Clause (132) of Part I of the Second Schedule to the Income Tax Ordinance, 2001, subject to the conditions and limitations provided therein. Under Clause 11(v) of Part IV of the Second Schedule to the Income Tax Ordinance, 2001, the Subsidiary Company is also exempt from levy of minimum tax on ‘turnover’ under section 113 of the Income Tax Ordinance, 2001. However, full provision is made in the profit and loss account on income from sources not covered under the above clauses at current rates of taxation after taking into account, tax credits and rebates available, if any.
Provision for current tax of Nishat Linen (Private) Limited – Subsidiary Company and Nishat Hospitality (Private) Limited – Subsidiary Company is based on the taxable income for the year determined in accordance with the prevailing law for taxation of income. The charge for current tax is calculated using prevailing tax rates or tax rates expected to apply to the profit for the year if enacted.
Provision for income tax on the income of foreign subsidiary - Nishat USA, Inc. is computed in accordance with the tax legislation in force in the country where the income is taxable.
Deferred
Deferred tax is accounted for using the balance sheet liability method in respect of all temporary differences arising from differences between the carrying amount of assets and liabilities in the consolidated financial statements and the corresponding tax bases used in the computation of the taxable profit. Deferred tax liabilities are generally recognized for all taxable temporary differences and deferred tax assets to the extent that it is probable that taxable profits will be available against which the deductible temporary differences, unused tax losses and tax credits can be utilized.
Deferred tax is calculated at the rates that are expected to apply to the period when the differences reverse based on tax rates that have been enacted or substantively enacted by the balance sheet date. Deferred tax is charged or credited in the consolidated profit and loss account, except to the extent that it relates to items recognized in other comprehensive income or directly in equity. In this case the tax is also recognized in other comprehensive income or directly in equity, respectively.
Nishat Power Limited - Subsidiary Company has not made provision for deferred tax as the Subsidiary Company’s management believes that the temporary differences will not reverse in the foreseeable future due to the fact that the profits and gains of the Company derived from electric power generation are exempt from tax subject to the conditions and limitations provided for in terms of Clause 132 of Part I of the Second Schedule to the Income Tax Ordinance, 2001.
136
2.5 Goodwill
Goodwill represents the excess of the cost of an acquisition over the fair value of the Group’s share of the identifiable net assets acquired. Goodwill is tested annually for impairment and carried at cost less accumulated impairment losses. Any impairment is recognized immediately through the consolidated profit and loss account and is not subsequently reversed.
Negative goodwill is recognized directly in consolidated profit and loss account in the year of acquisition.
2.6 Foreign currencies
These consolidated financial statements are presented in Pak Rupees, which is the Group’s functional currency. All monetary assets and liabilities denominated in foreign currencies are translated into Pak Rupees at the rates of exchange prevailing at the balance sheet date, while the transactions in foreign currencies (except the results of foreign operation which are translated to Pak Rupees at the average rate of exchange for the year) during the year are initially recorded in functional currency at the rates of exchange prevailing at the transaction date. All non-monetary items are translated into Pak Rupees at exchange rates prevailing on the date of transaction or on the date when fair values are determined. Exchange gains and losses are recorded in the consolidated profit and loss account.
2.7 Property, plant, equipment and depreciation
Property, plant and equipment except freehold land and capital work-in-progress are stated at cost less accumulated depreciation and accumulated impairment losses (if any). Cost of property, plant and equipment consists of historical cost, borrowing cost pertaining to erection / construction period of qualifying assets and other directly attributable costs of bringing the asset to working condition. Freehold land and capital work-in-progress are stated at cost less any recognized impairment loss.
Subsequent costs are included in the asset’s carrying amount or recognized as a separate asset, as appropriate, only when it is probable that future economic benefits associated with the item will flow to the Group and the cost of the item can be measured reliably. All other repair and maintenance costs are charged to consolidated profit and loss account during the period in which they are incurred. Major spare parts and stand-by equipment qualify as property, plant and equipment when an entity expects to use them for more than one year. Transfers are made to relevant operating fixed assets category as and when such items are available for use.
Leased
Leases where the Group has substantially all the risk and rewards of ownership are classified as finance lease. Assets subject to finance lease are capitalized at the commencement of the lease term at the lower of present value of minimum lease payments under the lease agreements and the fair value of the leased assets, each determined at the inception of the lease.
The related rental obligation net of finance cost is included in liabilities against assets subject to finance lease. The liabilities are classified as current and long term depending upon the timing of payments.
Each lease payment is allocated between the liability and finance cost so as to achieve a constant rate on the balance outstanding. The finance cost is charged to consolidated profit and loss account over the lease term.
Depreciation of assets subject to finance lease is recognized in the same manner as for owned assets. Depreciation of the leased assets is charged to consolidated profit and loss account.
Notes to the Consolidated Financial StatementsFor the year ended June 30, 2015
137Consolidated Annual Report 2015 of Nishat Mills Limitedand its Subsidiaries
Depreciation
Depreciation on property, plant and equipment is charged to consolidated profit and loss account applying the reducing balance method, except in case of Nishat Power Limited and Nishat Linen Trading LLC (Subsidiary Companies), where this accounting estimate is based on straight line method, so as to write off the cost / depreciable amount of the assets over their estimated useful lives at the rates given in Note 13.1. The depreciation is charged on additions from the date when the asset is available for use and on deletions upto the date when the asset is de-recognized. The residual values and useful lives are reviewed by the management, at each financial year end and adjusted if impact on depreciation is significant.
De-recognition
An item of property, plant and equipment is de-recognized upon disposal or when no future economic benefits are expected from its use or disposal. Any gain or loss arising on de-recognition of the asset is included in the consolidated profit and loss account in the year the asset is de-recognized.
2.8 Investment properties
Land and buildings held for capital appreciation or to earn rental income are classified as investment properties. Investment properties except land, are stated at cost less accumulated depreciation and any recognized impairment loss. Land is stated at cost less any recognized impairment loss (if any). Depreciation is charged to consolidated profit and loss account applying the reducing balance method so as to write off the cost of buildings over its estimated useful lives at a rate of 10% per annum.
2.9 Intangible assets
Amortization on additions to intangible assets is charged from the date when the asset is acquired or capitalized upto the date when the asset is de-recognized.
2.10 Leases
The Group Companies are the lessee:
a) Operating leases
Leases where a significant portion of the risks and rewards of ownership are retained by the lessor are classified as operating leases. Payments made under operating leases (net of any incentives received from the lessor) are charged to consolidated profit and loss account on a straight line basis over the lease term.
2.11 Investments
Classification of an investment is made on the basis of intended purpose for holding such investment. Management determines the appropriate classification of its investments at the time of purchase and re-evaluates such designation on regular basis.
Investments are initially measured at fair value plus transaction costs directly attributable to acquisition, except for “Investment at fair value through profit or loss” which is measured initially at fair value.
The Group assesses at the end of each reporting period whether there is any objective evidence that investments are impaired. If any such evidence exists, the provisions of IAS 39 ‘Financial Instruments: Recognition and Measurement’ are applicable to all investments.
a) Investment at fair value through profit or loss
Investments classified as held-for-trading and those designated as such are included in this category. Investments are classified as held-for-trading if these are acquired for the purpose of selling in the short term. Gains or losses on investments held-for-trading are recognized in consolidated profit and loss account.
138
b) Held-to-maturity
Investments with fixed or determinable payments and fixed maturity are classified as held-to-maturity when there is positive intention and ability to hold to maturity. Investments intended to be held for an undefined period are not included in this classification. Other long-term investments that are intended to be held to maturity are subsequently measured at amortized cost. This cost is computed as the amount initially recognized minus principal repayments, plus or minus the cumulative amortization, using the effective interest method, of any difference between the initially recognized amount and the maturity amount. For investments carried at amortized cost, gains and losses are recognized in consolidated profit and loss account when the investments are de-recognized or impaired, as well as through the amortization process.
c) Available-for-sale
Investments intended to be held for an indefinite period of time, which may be sold in response to need for liquidity, or changes to interest rates or equity prices are classified as available-for-sale. After initial recognition, investments which are classified as available-for-sale are measured at fair value. Gains or losses on available-for-sale investments are recognized directly in consolidated statement of other comprehensive income until the investment is sold, de-recognized or is determined to be impaired, at which time the cumulative gain or loss previously reported in consolidated statement of other comprehensive income is included in consolidated profit and loss account. These are sub-categorized as under:
Quoted
For investments that are actively traded in organized capital markets, fair value is determined with reference to stock exchange quoted market bids at the close of business on the balance sheet date.
Unquoted
Fair value of unquoted investments is determined on the basis of appropriate valuation techniques as allowed by IAS 39 ‘Financial Instruments: Recognition and Measurement’.
2.12 Inventories
Inventories, except for stock in transit and waste stock / rags are stated at lower of cost and net realizable value. Cost is determined as follows:
Stores, spare parts and loose tools
Useable stores, spare parts and loose tools are valued principally at moving average cost, while items considered obsolete are carried at nil value. Items in transit are valued at cost comprising invoice value plus other charges paid thereon.
Stock-in-trade
Cost of raw material, work-in-process and finished goods is determined as follows:
i) For raw materials: Annual average basis. ii) For work-in-process and finished goods: Average manufacturing cost including a portion of production overheads.
Materials in transit are valued at cost comprising invoice value plus other charges paid thereon. Waste stock / rags are valued at net realizable value.
Net realizable value signifies the estimated selling price in the ordinary course of business less the estimated costs of completion and the estimated costs necessary to make a sale.
Notes to the Consolidated Financial StatementsFor the year ended June 30, 2015
139Consolidated Annual Report 2015 of Nishat Mills Limitedand its Subsidiaries
2.13 Trade and other receivables
Trade debts and other receivables are carried at original invoice value less an estimate made for doubtful debts based on a review of all outstanding amounts at the year end. Bad debts are written off when identified.
2.14 Non–current assets (or disposal groups) held for sale
Non-current assets (or disposal groups) are classified as assets held for sale when their carrying amount is to be recovered principally through a sale transaction and a sale is considered highly probable. They are stated at the lower of carrying amount and fair value less costs to sell.
2.15 Borrowings
Borrowings are recognized initially at fair value and are subsequently stated at amortized cost. Any difference between the proceeds and the redemption value is recognized in the consolidated profit and loss account over the period of the borrowings using the effective interest method.
2.16 Borrowing cost
Interest, mark-up and other charges on finances are capitalized up to the date of commissioning of respective qualifying assets acquired out of the proceeds of such finances. All other interest, mark-up and other charges are recognized in consolidated profit and loss account.
2.17 Share capital
Ordinary shares are classified as equity and recognized at their face value. Incremental costs directly attributable to the issuance of new shares are shown in equity as a deduction, net of tax, if any.
2.18 Trade and other payables
Liabilities for trade and other amounts payable are initially recognized at fair value, which is normally the transaction cost.
2.19 Revenue recognition
Revenue from different sources is recognized as under:
– Revenue from sale of goods is recognized on dispatch of goods to customers.
– Revenue on account of energy is recognized at the time of transmission whereas on account of capacity is recognized when due.
– The share of profits or losses of the associated companies after tax is included in the consolidated profit and loss account to recognize the post acquisition changes in the share of the net assets of the investees. Dividend from associated companies is recognized as reduction in cost of investments as prescribed by International Accounting Standard (IAS) 28 ‘Investments in Associates’.
– Dividend on other equity investments is recognized when right to receive the dividend is established.
– Operating lease rentals are recorded in profit and loss account on a time proportion basis over the term of the lease arrangements.
140
– Profit on deposits with banks is recognized on time proportion basis taking into account the amounts outstanding and rates applicable thereon.
– Revenue from hotel business is generally recognized as services are performed. Hotel revenue primarily represents room rentals and other minor hotel revenues.
2.20 Financial instruments
Financial instruments carried on the balance sheet include investments, deposits, trade debts, loans and advances, other receivables, cash and bank balances, long-term financing, short-term borrowings, accrued mark-up and trade and other payables etc. Financial assets and liabilities are recognized when the Group becomes a party to the contractual provisions of instrument. Initial recognition is made at fair value plus transaction costs directly attributable to acquisition, except for “financial instruments at fair value through profit or loss” which is initially measured at fair value.
Financial assets are de-recognized when the Group loses control of the contractual rights that comprise the financial asset. The Group loses such control if it realizes the rights to benefits specified in contract, the rights expire or the Group surrenders those rights. Financial liabilities are de-recognized when the obligation specified in the contract is discharged, cancelled or expired. Any gain or loss on subsequent measurement (except available for sale investments) and de-recognition is charged to the consolidated profit or loss currently. The particular measurement methods adopted are disclosed in the individual policy statements associated with each item and in the accounting policy of investments.
2.21 Provisions
Provisions are recognized when the Group has a legal or constructive obligation as a result of past events and it is probable that an outflow of resources embodying economic benefits will be required to settle the obligations and a reliable estimate of the amount can be made.
2.22 Impairment
a) Financial assets
A financial asset is considered to be impaired if objective evidence indicate that one or more events had a negative effect on the estimated future cash flows of that asset.
An impairment loss in respect of a financial asset measured at amortized cost is calculated as a difference between its carrying amount and the present value of estimated future cash flows discounted at the original effective interest rate. An impairment loss in respect of available for sale financial asset is calculated with reference to its current fair value.
Individually significant financial assets are tested for impairment on an individual basis. The remaining financial assets are assessed collectively in groups that share similar credit risk characteristics.
b) Non-financial assets
The carrying amounts of the non-financial assets are reviewed at each balance sheet date to determine whether there is any indication of impairment. If such indication exists, the recoverable amount of such asset is estimated. An impairment loss is recognized wherever the carrying amount of the asset exceeds its recoverable amount. Impairment losses are recognized in consolidated profit and loss account. A previously recognized impairment loss is reversed only if there has been a change in the estimates used to determine the asset’s recoverable amount since the last impairment loss was recognized. If that is the case, the carrying amount of the asset is increased to its recoverable amount. That increased amount cannot exceed the carrying amount that would have been determined, net of depreciation, had no impairment loss been recognized for the asset in prior years. Such reversal is recognized in consolidated profit and loss account.
Notes to the Consolidated Financial StatementsFor the year ended June 30, 2015
141Consolidated Annual Report 2015 of Nishat Mills Limitedand its Subsidiaries
2.23 Derivative financial instruments
Derivative that do not qualify for hedge accounting are recognized in the consolidated balance sheet at estimated fair value with corresponding effect to consolidated profit and loss account. Derivative financial instruments are carried as assets when fair value is positive and liabilities when fair value is negative.
2.24 Off setting
Financial assets and financial liabilities are set off and the net amount is reported in the consolidated financial statements when there is a legal enforceable right to set off and the management intends either to settle on a net basis or to realize the assets and to settle the liabilities simultaneously.
2.25 Cash and cash equivalents
Cash and cash equivalents comprise cash in hand, cash at banks on current, saving and deposit accounts and other short term highly liquid instruments that are readily convertible into known amounts of cash and which are subject to insignificant risk of changes in values.
2.26 Segment reporting
Segment reporting is based on the operating (business) segments of the Group. An operating segment is a component of the Group that engages in business activities from which it may earn revenues and incur expenses, including revenues and expenses that relate to the transactions with any of the Group’s other components. An operating segment’s operating results are reviewed regularly by the Group’s chief operating decision makers to make decisions about resources to be allocated to the segment and assess its performance, and for which discrete financial information is available.
Segment results that are reported to the chief operating decision makers include items directly attributable to a segment as well as those that can be allocated on a reasonable basis. Those incomes, expenses, assets, liabilities and other balances which can not be allocated to a particular segment on a reasonable basis are reported as unallocated.
The Group has six reportable business segments. Spinning (Producing different quality of yarn using natural and artificial fibres), Weaving (Producing different quality of greige fabric using yarn), Processing and Home Textile (Processing greige fabric for production of printed and dyed fabric and manufacturing of home textile articles), Garments (Manufacturing garments using processed fabric), Power Generation (Generating, transmitting and distributing power) and Hotel (Business of hotel and allied services).
Transaction among the business segments are recorded at cost. Inter segment sales and purchases are eliminated from the total.
2.27 Dividend and other appropriations
Dividend distribution to the shareholders is recognized as a liability in the consolidated financial statements in the periods in which the dividends are declared and other appropriations are recognized in the period in which these are approved by the Board of Directors.
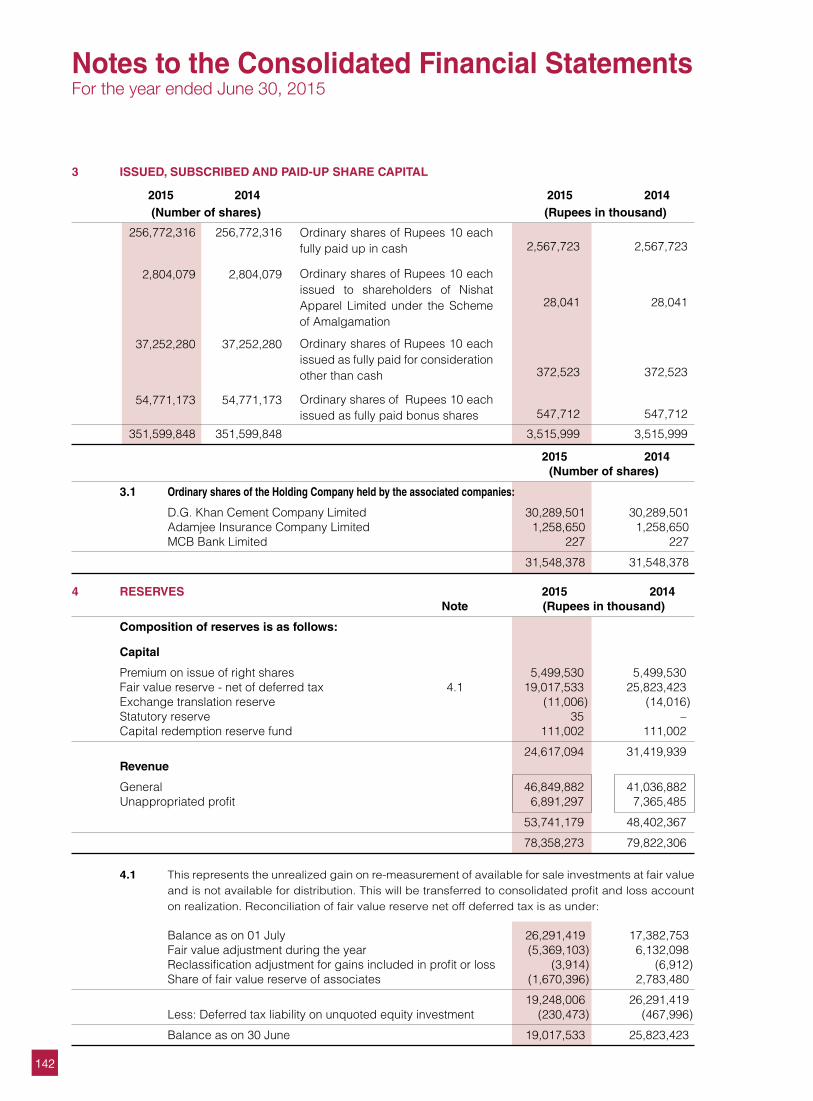
142
3 ISSUED, SUBSCRIBED AND PAID-UP SHARE CAPITAL
2015 2014 2015 2014 (Number of shares) (Rupees in thousand)
256,772,316 256,772,316 2,567,723 2,567,723 2,804,079 2,804,079 28,041 28,041
37,252,280 37,252,280 372,523 372,523
54,771,173 54,771,173 547,712 547,712
351,599,848 351,599,848 3,515,999 3,515,999
Ordinary shares of Rupees 10 each fully paid up in cash
Ordinary shares of Rupees 10 each issued to shareholders of Nishat Apparel Limited under the Scheme of Amalgamation
Ordinary shares of Rupees 10 each issued as fully paid for consideration other than cash
Ordinary shares of Rupees 10 each issued as fully paid bonus shares
2015 2014 (Number of shares)
3.1 Ordinary shares of the Holding Company held by the associated companies:
D.G. Khan Cement Company Limited 30,289,501 30,289,501 Adamjee Insurance Company Limited 1,258,650 1,258,650 MCB Bank Limited 227 227
31,548,378 31,548,378
4 RESERVES 2015 2014 Note (Rupees in thousand)
Composition of reserves is as follows:
Capital
Premium on issue of right shares 5,499,530 5,499,530 Fair value reserve - net of deferred tax 4.1 19,017,533 25,823,423 Exchange translation reserve (11,006) (14,016) Statutory reserve 35 – Capital redemption reserve fund 111,002 111,002
24,617,094 31,419,939 Revenue
General 46,849,882 41,036,882 Unappropriated profit 6,891,297 7,365,485
53,741,179 48,402,367
78,358,273 79,822,306
4.1 This represents the unrealized gain on re-measurement of available for sale investments at fair value and is not available for distribution. This will be transferred to consolidated profit and loss account on realization. Reconciliation of fair value reserve net off deferred tax is as under:
Balance as on 01 July 26,291,419 17,382,753 Fair value adjustment during the year (5,369,103) 6,132,098 Reclassification adjustment for gains included in profit or loss (3,914) (6,912) Share of fair value reserve of associates (1,670,396) 2,783,480
19,248,006 26,291,419 Less: Deferred tax liability on unquoted equity investment (230,473) (467,996)
Balance as on 30 June 19,017,533 25,823,423
Notes to the Consolidated Financial StatementsFor the year ended June 30, 2015
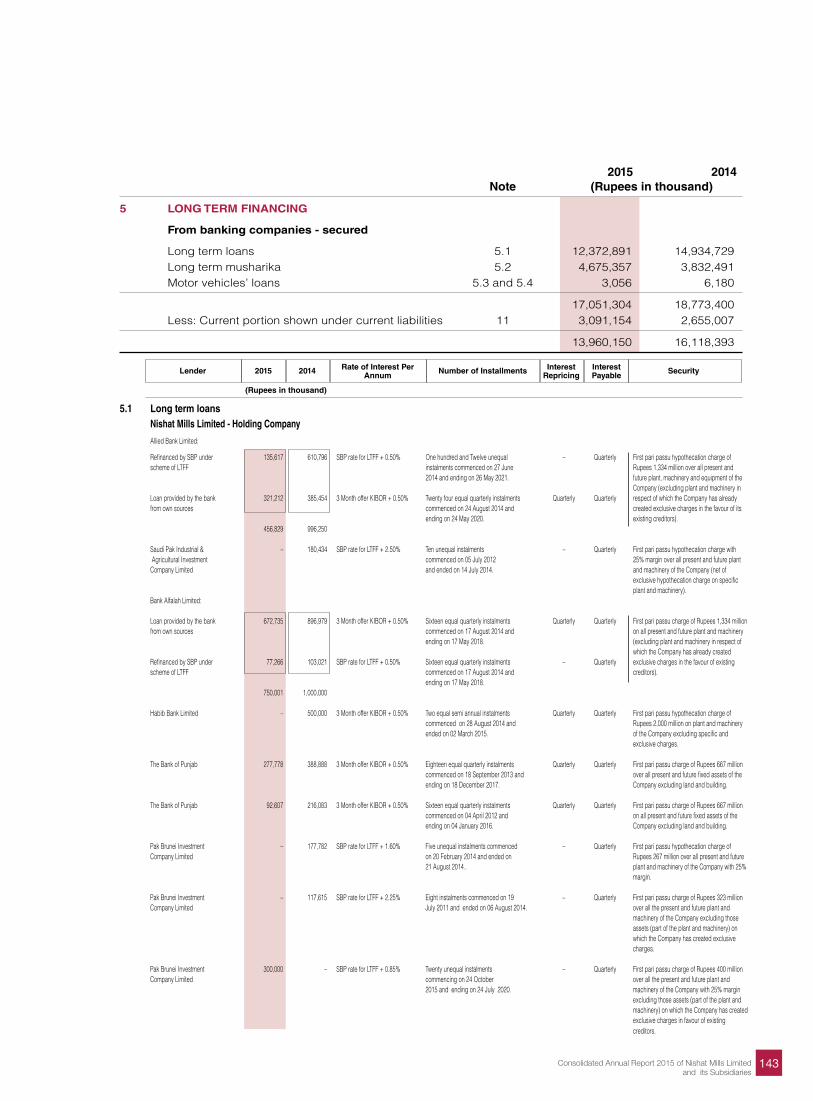
143Consolidated Annual Report 2015 of Nishat Mills Limitedand its Subsidiaries
Lender 2015 2014 Rate of Interest Per Number of Installments Interest Interest Security Annum Repricing Payable
(Rupees in thousand)
5.1 Long term loans Nishat Mills Limited - Holding Company
Allied Bank Limited:
Refinanced by SBP under 135,617 610,796 SBP rate for LTFF + 0.50% One hundred and Twelve unequal – Quarterly First pari passu hypothecation charge of scheme of LTFF instalments commenced on 27 June Rupees 1,334 million over all present and 2014 and ending on 26 May 2021. future plant, machinery and equipment of the Company (excluding plant and machinery in Loan provided by the bank 321,212 385,454 3 Month offer KIBOR + 0.50% Twenty four equal quarterly instalments Quarterly Quarterly respect of which the Company has already from own sources commenced on 24 August 2014 and created exclusive charges in the favour of its ending on 24 May 2020. existing creditors). 456,829 996,250
Saudi Pak Industrial & – 180,434 SBP rate for LTFF + 2.50% Ten unequal instalments – Quarterly First pari passu hypothecation charge with Agricultural Investment commenced on 05 July 2012 25% margin over all present and future plant Company Limited and ended on 14 July 2014. and machinery of the Company (net of exclusive hypothecation charge on specific plant and machinery). Bank Alfalah Limited: Loan provided by the bank 672,735 896,979 3 Month offer KIBOR + 0.50% Sixteen equal quarterly instalments Quarterly Quarterly First pari passu charge of Rupees 1,334 million from own sources commenced on 17 August 2014 and on all present and future plant and machinery ending on 17 May 2018. (excluding plant and machinery in respect of which the Company has already created Refinanced by SBP under 77,266 103,021 SBP rate for LTFF + 0.50% Sixteen equal quarterly instalments – Quarterly exclusive charges in the favour of existing scheme of LTFF commenced on 17 August 2014 and creditors). ending on 17 May 2018. 750,001 1,000,000 Habib Bank Limited – 500,000 3 Month offer KIBOR + 0.50% Two equal semi annual instalments Quarterly Quarterly First pari passu hypothecation charge of commenced on 28 August 2014 and Rupees 2,000 million on plant and machinery ended on 02 March 2015. of the Company excluding specific and exclusive charges.
The Bank of Punjab 277,778 388,888 3 Month offer KIBOR + 0.50% Eighteen equal quarterly instalments Quarterly Quarterly First pari passu charge of Rupees 667 million commenced on 18 September 2013 and over all present and future fixed assets of the ending on 18 December 2017. Company excluding land and building.
The Bank of Punjab 92,607 216,083 3 Month offer KIBOR + 0.50% Sixteen equal quarterly instalments Quarterly Quarterly First pari passu charge of Rupees 667 million commenced on 04 April 2012 and on all present and future fixed assets of the ending on 04 January 2016. Company excluding land and building. Pak Brunei Investment – 177,782 SBP rate for LTFF + 1.60% Five unequal instalments commenced – Quarterly First pari passu hypothecation charge of Company Limited on 20 February 2014 and ended on Rupees 267 million over all present and future 21 August 2014.. plant and machinery of the Company with 25% margin. Pak Brunei Investment – 117,615 SBP rate for LTFF + 2.25% Eight instalments commenced on 19 – Quarterly First pari passu charge of Rupees 323 million Company Limited July 2011 and ended on 06 August 2014. over all the present and future plant and machinery of the Company excluding those assets (part of the plant and machinery) on which the Company has created exclusive charges.
Pak Brunei Investment 300,000 – SBP rate for LTFF + 0.85% Twenty unequal instalments – Quarterly First pari passu charge of Rupees 400 million Company Limited commencing on 24 October over all the present and future plant and 2015 and ending on 24 July 2020. machinery of the Company with 25% margin excluding those assets (part of the plant and machinery) on which the Company has created exclusive charges in favour of existing creditors.
2015 2014 Note (Rupees in thousand)
5 LONG TERM FINANCING
From banking companies - secured
Long term loans 5.1 12,372,891 14,934,729 Long term musharika 5.2 4,675,357 3,832,491 Motor vehicles’ loans 5.3 and 5.4 3,056 6,180
17,051,304 18,773,400 Less: Current portion shown under current liabilities 11 3,091,154 2,655,007
13,960,150 16,118,393
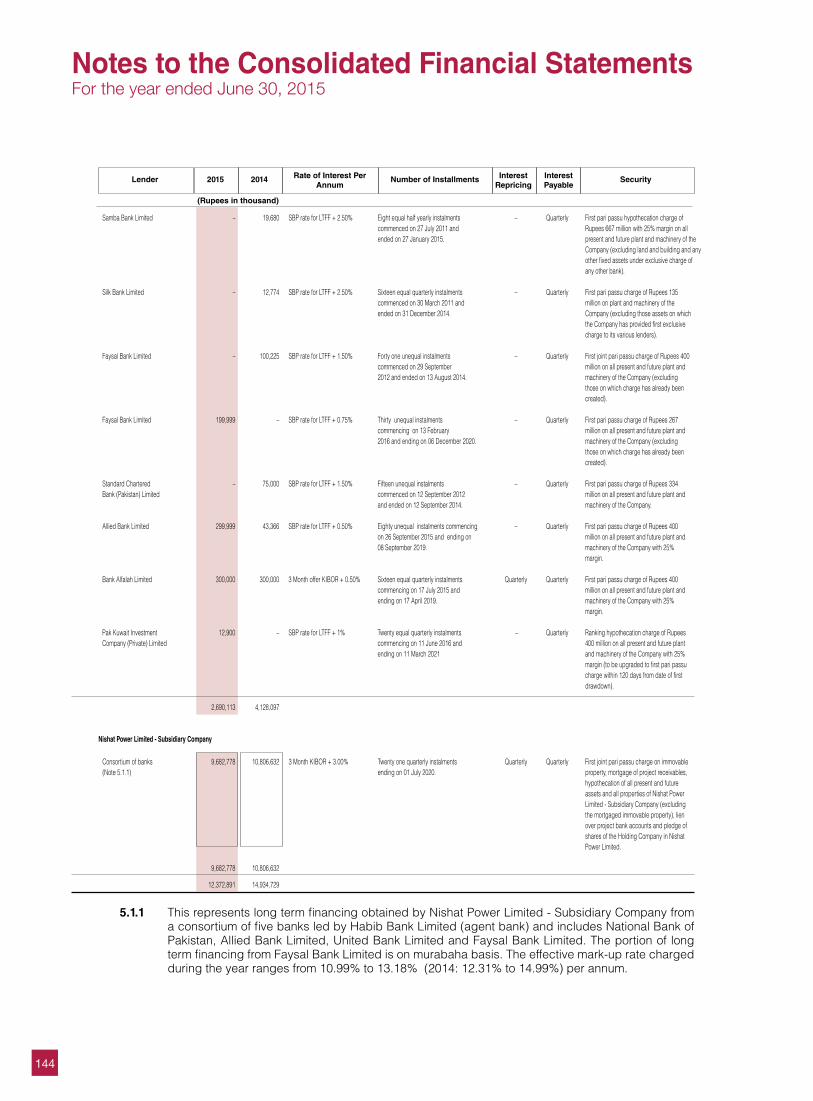
144
Samba Bank Limited – 19,680 SBP rate for LTFF + 2.50% Eight equal half yearly instalments – Quarterly First pari passu hypothecation charge of commenced on 27 July 2011 and Rupees 667 million with 25% margin on all ended on 27 January 2015. present and future plant and machinery of the Company (excluding land and building and any other fixed assets under exclusive charge of any other bank). Silk Bank Limited – 12,774 SBP rate for LTFF + 2.50% Sixteen equal quarterly instalments – Quarterly First pari passu charge of Rupees 135 commenced on 30 March 2011 and million on plant and machinery of the ended on 31 December 2014. Company (excluding those assets on which the Company has provided first exclusive charge to its various lenders). Faysal Bank Limited – 100,225 SBP rate for LTFF + 1.50% Forty one unequal instalments – Quarterly First joint pari passu charge of Rupees 400 commenced on 29 September million on all present and future plant and 2012 and ended on 13 August 2014. machinery of the Company (excluding those on which charge has already been created). Faysal Bank Limited 199,999 – SBP rate for LTFF + 0.75% Thirty unequal instalments – Quarterly First pari passu charge of Rupees 267 commencing on 13 February million on all present and future plant and 2016 and ending on 06 December 2020. machinery of the Company (excluding those on which charge has already been created). Standard Chartered – 75,000 SBP rate for LTFF + 1.50% Fifteen unequal instalments – Quarterly First pari passu charge of Rupees 334 Bank (Pakistan) Limited commenced on 12 September 2012 million on all present and future plant and and ended on 12 September 2014. machinery of the Company. Allied Bank Limited 299,999 43,366 SBP rate for LTFF + 0.50% Eighty unequal instalments commencing – Quarterly First pari passu charge of Rupees 400 on 26 September 2015 and ending on million on all present and future plant and 08 September 2019. machinery of the Company with 25% margin. Bank Alfalah Limited 300,000 300,000 3 Month offer KIBOR + 0.50% Sixteen equal quarterly instalments Quarterly Quarterly First pari passu charge of Rupees 400 commencing on 17 July 2015 and million on all present and future plant and ending on 17 April 2019. machinery of the Company with 25% margin. Pak Kuwait Investment 12,900 – SBP rate for LTFF + 1% Twenty equal quarterly instalments – Quarterly Ranking hypothecation charge of Rupees Company (Private) Limited commencing on 11 June 2016 and 400 million on all present and future plant ending on 11 March 2021 and machinery of the Company with 25% margin (to be upgraded to first pari passu charge within 120 days from date of first drawdown). 2,690,113 4,128,097 Nishat Power Limited - Subsidiary Company
Consortium of banks 9,682,778 10,806,632 3 Month KIBOR + 3.00% Twenty one quarterly instalments Quarterly Quarterly First joint pari passu charge on immovable (Note 5.1.1) ending on 01 July 2020. property, mortgage of project receivables, hypothecation of all present and future assets and all properties of Nishat Power Limited - Subsidiary Company (excluding the mortgaged immovable property), lien over project bank accounts and pledge of shares of the Holding Company in Nishat Power Limited.
9,682,778 10,806,632
12,372,891 14,934,729
Lender 2015 2014 Rate of Interest Per Number of Installments Interest Interest Security Annum Repricing Payable
(Rupees in thousand)
5.1.1 This represents long term financing obtained by Nishat Power Limited - Subsidiary Company from a consortium of five banks led by Habib Bank Limited (agent bank) and includes National Bank of Pakistan, Allied Bank Limited, United Bank Limited and Faysal Bank Limited. The portion of long term financing from Faysal Bank Limited is on murabaha basis. The effective mark-up rate charged during the year ranges from 10.99% to 13.18% (2014: 12.31% to 14.99%) per annum.
Notes to the Consolidated Financial StatementsFor the year ended June 30, 2015
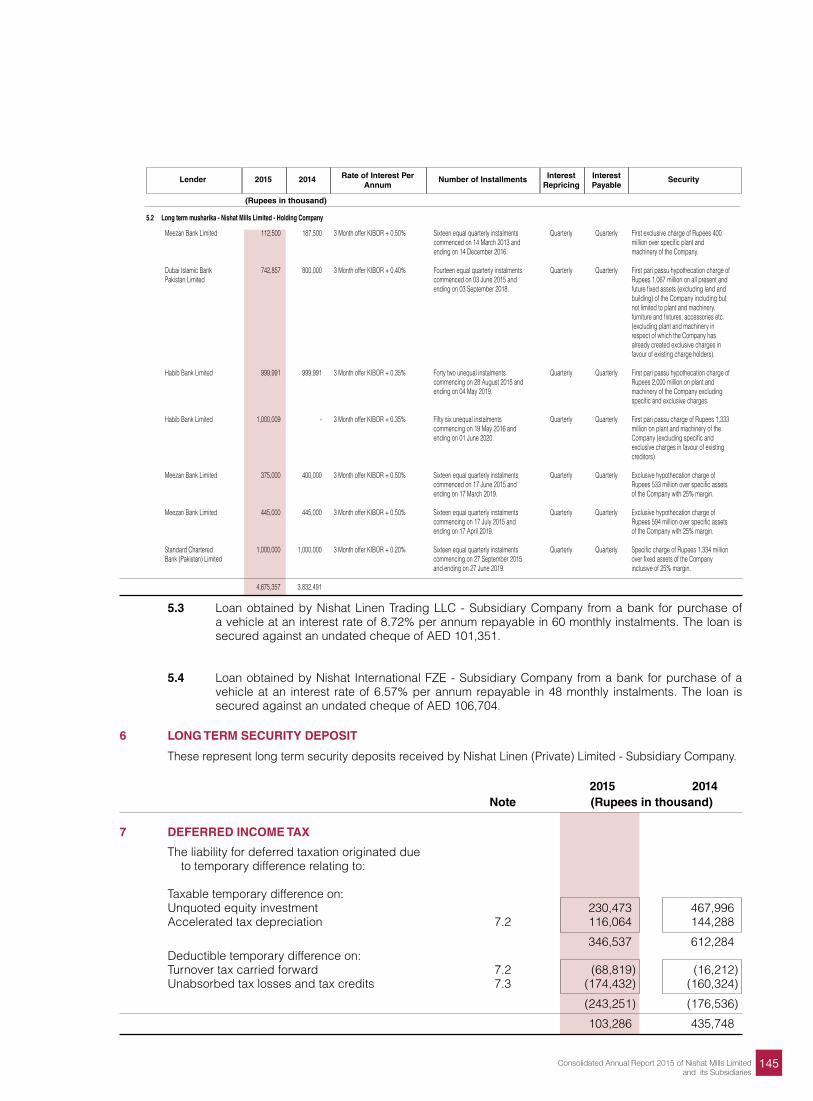
145Consolidated Annual Report 2015 of Nishat Mills Limitedand its Subsidiaries
Lender 2015 2014 Rate of Interest Per Number of Installments Interest Interest Security Annum Repricing Payable
(Rupees in thousand)
5.2 Long term musharika - Nishat Mills Limited - Holding Company
Meezan Bank Limited 112,500 187,500 3 Month offer KIBOR + 0.50% Sixteen equal quarterly instalments Quarterly Quarterly First exclusive charge of Rupees 400 commenced on 14 March 2013 and million over specific plant and ending on 14 December 2016. machinery of the Company. Dubai Islamic Bank 742,857 800,000 3 Month offer KIBOR + 0.40% Fourteen equal quarterly instalments Quarterly Quarterly First pari passu hypothecation charge of Pakistan Limited commenced on 03 June 2015 and Rupees 1,067 million on all present and ending on 03 September 2018. future fixed assets (excluding land and building) of the Company including but not limited to plant and machinery, furniture and fixtures, accessories etc. (excluding plant and machinery in respect of which the Company has already created exclusive charges in favour of existing charge holders). Habib Bank Limited 999,991 999,991 3 Month offer KIBOR + 0.35% Forty two unequal instalments Quarterly Quarterly First pari passu hypothecation charge of commencing on 28 August 2015 and Rupees 2,000 million on plant and ending on 04 May 2019. machinery of the Company excluding specific and exclusive charges.
Habib Bank Limited 1,000,009 - 3 Month offer KIBOR + 0.35% Fifty six unequal instalments Quarterly Quarterly First pari passu charge of Rupees 1,333 commencing on 19 May 2016 and million on plant and machinery of the ending on 01 June 2020. Company (excluding specific and exclusive charges in favour of existing creditors)
Meezan Bank Limited 375,000 400,000 3 Month offer KIBOR + 0.50% Sixteen equal quarterly instalments Quarterly Quarterly Exclusive hypothecation charge of commenced on 17 June 2015 and Rupees 533 million over specific assets ending on 17 March 2019. of the Company with 25% margin.
Meezan Bank Limited 445,000 445,000 3 Month offer KIBOR + 0.50% Sixteen equal quarterly instalments Quarterly Quarterly Exclusive hypothecation charge of commencing on 17 July 2015 and Rupees 594 million over specific assets ending on 17 April 2019. of the Company with 25% margin.
Standard Chartered 1,000,000 1,000,000 3 Month offer KIBOR + 0.20% Sixteen equal quarterly instalments Quarterly Quarterly Specific charge of Rupees 1,334 million Bank (Pakistan) Limited commencing on 27 September 2015 over fixed assets of the Company and ending on 27 June 2019. inclusive of 25% margin.
4,675,357 3,832,491
5.3 Loan obtained by Nishat Linen Trading LLC - Subsidiary Company from a bank for purchase of a vehicle at an interest rate of 8.72% per annum repayable in 60 monthly instalments. The loan is secured against an undated cheque of AED 101,351.
5.4 Loan obtained by Nishat International FZE - Subsidiary Company from a bank for purchase of a vehicle at an interest rate of 6.57% per annum repayable in 48 monthly instalments. The loan is secured against an undated cheque of AED 106,704.
6 LONG TERM SECURITY DEPOSIT
These represent long term security deposits received by Nishat Linen (Private) Limited - Subsidiary Company.
2015 2014 Note (Rupees in thousand)
7 DEFERRED INCOME TAX
The liability for deferred taxation originated due to temporary difference relating to: Taxable temporary difference on: Unquoted equity investment 230,473 467,996 Accelerated tax depreciation 7.2 116,064 144,288
346,537 612,284 Deductible temporary difference on: Turnover tax carried forward 7.2 (68,819) (16,212) Unabsorbed tax losses and tax credits 7.3 (174,432) (160,324)
(243,251) (176,536)
103,286 435,748
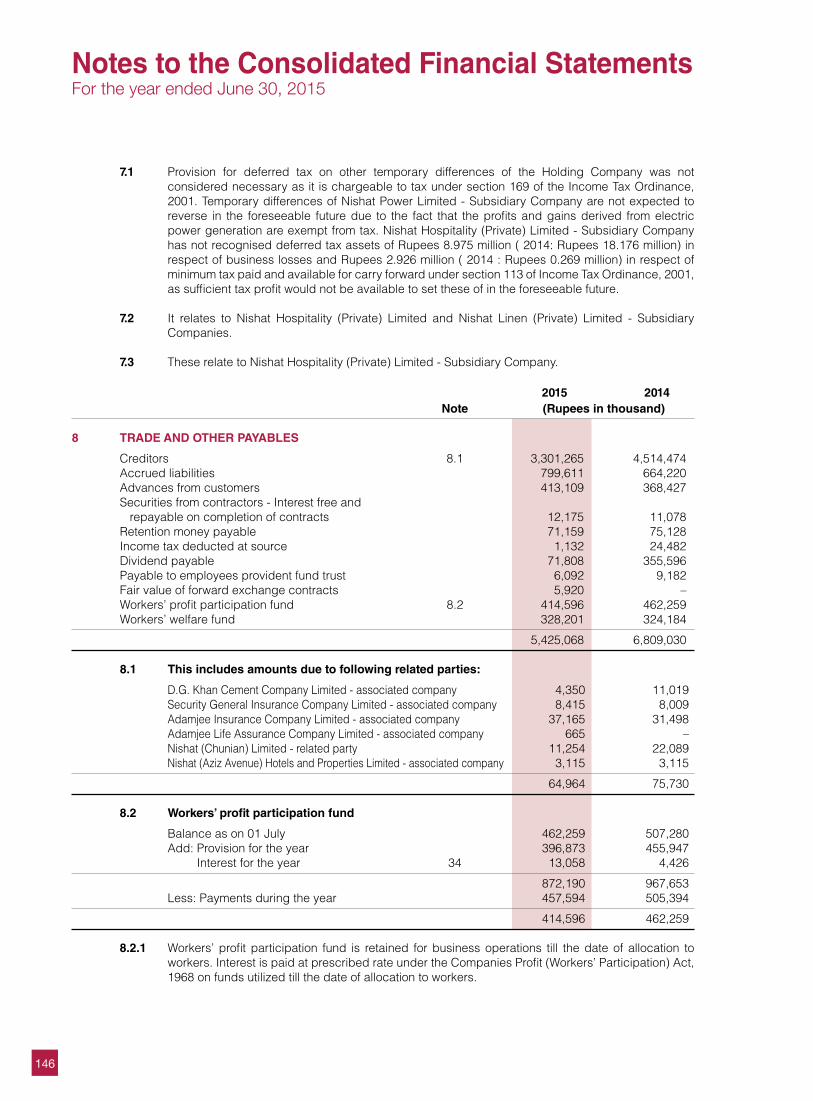
146
7.1 Provision for deferred tax on other temporary differences of the Holding Company was not considered necessary as it is chargeable to tax under section 169 of the Income Tax Ordinance, 2001. Temporary differences of Nishat Power Limited - Subsidiary Company are not expected to reverse in the foreseeable future due to the fact that the profits and gains derived from electric power generation are exempt from tax. Nishat Hospitality (Private) Limited - Subsidiary Company has not recognised deferred tax assets of Rupees 8.975 million ( 2014: Rupees 18.176 million) in respect of business losses and Rupees 2.926 million ( 2014 : Rupees 0.269 million) in respect of minimum tax paid and available for carry forward under section 113 of Income Tax Ordinance, 2001, as sufficient tax profit would not be available to set these of in the foreseeable future.
7.2 It relates to Nishat Hospitality (Private) Limited and Nishat Linen (Private) Limited - Subsidiary
Companies. 7.3 These relate to Nishat Hospitality (Private) Limited - Subsidiary Company.
2015 2014 Note (Rupees in thousand)
8 TRADE AND OTHER PAYABLES
Creditors 8.1 3,301,265 4,514,474 Accrued liabilities 799,611 664,220 Advances from customers 413,109 368,427 Securities from contractors - Interest free and repayable on completion of contracts 12,175 11,078 Retention money payable 71,159 75,128 Income tax deducted at source 1,132 24,482 Dividend payable 71,808 355,596 Payable to employees provident fund trust 6,092 9,182 Fair value of forward exchange contracts 5,920 – Workers’ profit participation fund 8.2 414,596 462,259 Workers’ welfare fund 328,201 324,184
5,425,068 6,809,030 8.1 This includes amounts due to following related parties:
D.G. Khan Cement Company Limited - associated company 4,350 11,019 Security General Insurance Company Limited - associated company 8,415 8,009 Adamjee Insurance Company Limited - associated company 37,165 31,498 Adamjee Life Assurance Company Limited - associated company 665 – Nishat (Chunian) Limited - related party 11,254 22,089 Nishat (Aziz Avenue) Hotels and Properties Limited - associated company 3,115 3,115
64,964 75,730
8.2 Workers’ profit participation fund
Balance as on 01 July 462,259 507,280 Add: Provision for the year 396,873 455,947 Interest for the year 34 13,058 4,426
872,190 967,653 Less: Payments during the year 457,594 505,394
414,596 462,259 8.2.1 Workers’ profit participation fund is retained for business operations till the date of allocation to
workers. Interest is paid at prescribed rate under the Companies Profit (Workers’ Participation) Act, 1968 on funds utilized till the date of allocation to workers.
Notes to the Consolidated Financial StatementsFor the year ended June 30, 2015
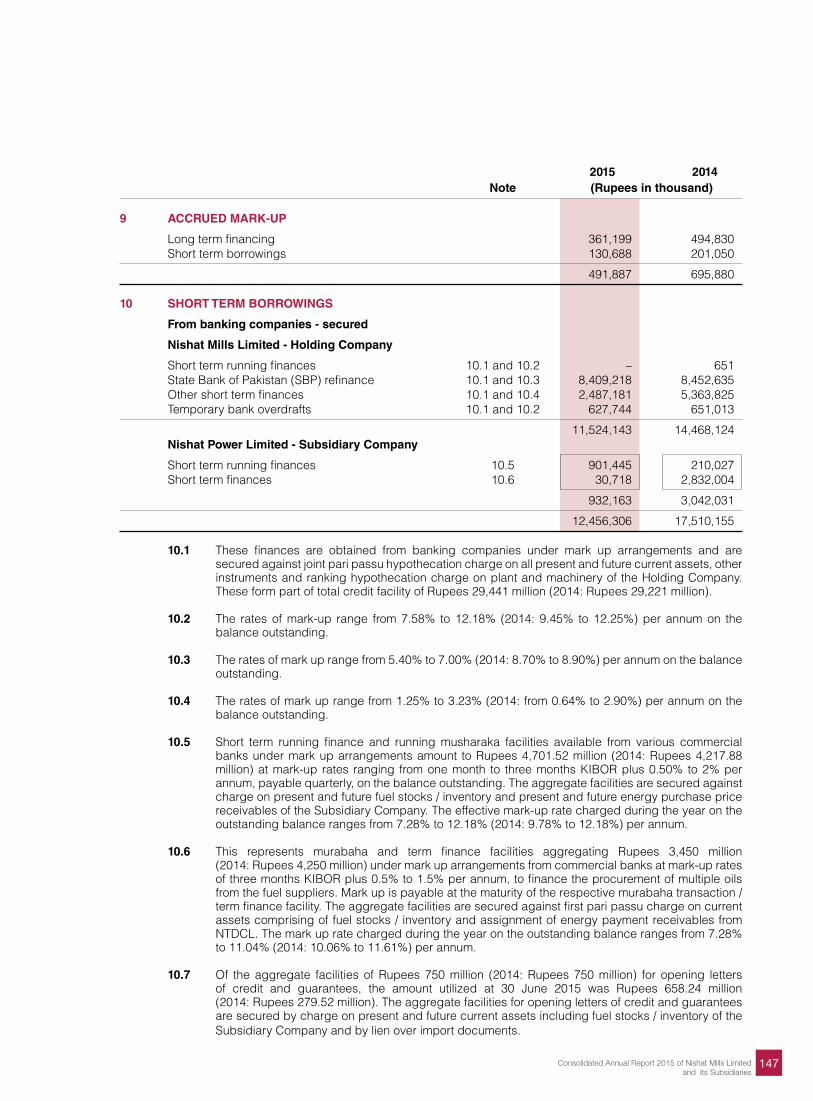
147Consolidated Annual Report 2015 of Nishat Mills Limitedand its Subsidiaries
2015 2014 Note (Rupees in thousand)
9 ACCRUED MARK-UP
Long term financing 361,199 494,830 Short term borrowings 130,688 201,050
491,887 695,880
10 SHORT TERM BORROWINGS
From banking companies - secured
Nishat Mills Limited - Holding Company
Short term running finances 10.1 and 10.2 – 651 State Bank of Pakistan (SBP) refinance 10.1 and 10.3 8,409,218 8,452,635 Other short term finances 10.1 and 10.4 2,487,181 5,363,825 Temporary bank overdrafts 10.1 and 10.2 627,744 651,013
11,524,143 14,468,124 Nishat Power Limited - Subsidiary Company
Short term running finances 10.5 901,445 210,027 Short term finances 10.6 30,718 2,832,004
932,163 3,042,031
12,456,306 17,510,155 10.1 These finances are obtained from banking companies under mark up arrangements and are
secured against joint pari passu hypothecation charge on all present and future current assets, other instruments and ranking hypothecation charge on plant and machinery of the Holding Company. These form part of total credit facility of Rupees 29,441 million (2014: Rupees 29,221 million).
10.2 The rates of mark-up range from 7.58% to 12.18% (2014: 9.45% to 12.25%) per annum on the
balance outstanding. 10.3 The rates of mark up range from 5.40% to 7.00% (2014: 8.70% to 8.90%) per annum on the balance
outstanding. 10.4 The rates of mark up range from 1.25% to 3.23% (2014: from 0.64% to 2.90%) per annum on the
balance outstanding. 10.5 Short term running finance and running musharaka facilities available from various commercial
banks under mark up arrangements amount to Rupees 4,701.52 million (2014: Rupees 4,217.88 million) at mark-up rates ranging from one month to three months KIBOR plus 0.50% to 2% per annum, payable quarterly, on the balance outstanding. The aggregate facilities are secured against charge on present and future fuel stocks / inventory and present and future energy purchase price receivables of the Subsidiary Company. The effective mark-up rate charged during the year on the outstanding balance ranges from 7.28% to 12.18% (2014: 9.78% to 12.18%) per annum.
10.6 This represents murabaha and term finance facilities aggregating Rupees 3,450 million
(2014: Rupees 4,250 million) under mark up arrangements from commercial banks at mark-up rates of three months KIBOR plus 0.5% to 1.5% per annum, to finance the procurement of multiple oils from the fuel suppliers. Mark up is payable at the maturity of the respective murabaha transaction / term finance facility. The aggregate facilities are secured against first pari passu charge on current assets comprising of fuel stocks / inventory and assignment of energy payment receivables from NTDCL. The mark up rate charged during the year on the outstanding balance ranges from 7.28% to 11.04% (2014: 10.06% to 11.61%) per annum.
10.7 Of the aggregate facilities of Rupees 750 million (2014: Rupees 750 million) for opening letters
of credit and guarantees, the amount utilized at 30 June 2015 was Rupees 658.24 million (2014: Rupees 279.52 million). The aggregate facilities for opening letters of credit and guarantees are secured by charge on present and future current assets including fuel stocks / inventory of the Subsidiary Company and by lien over import documents.
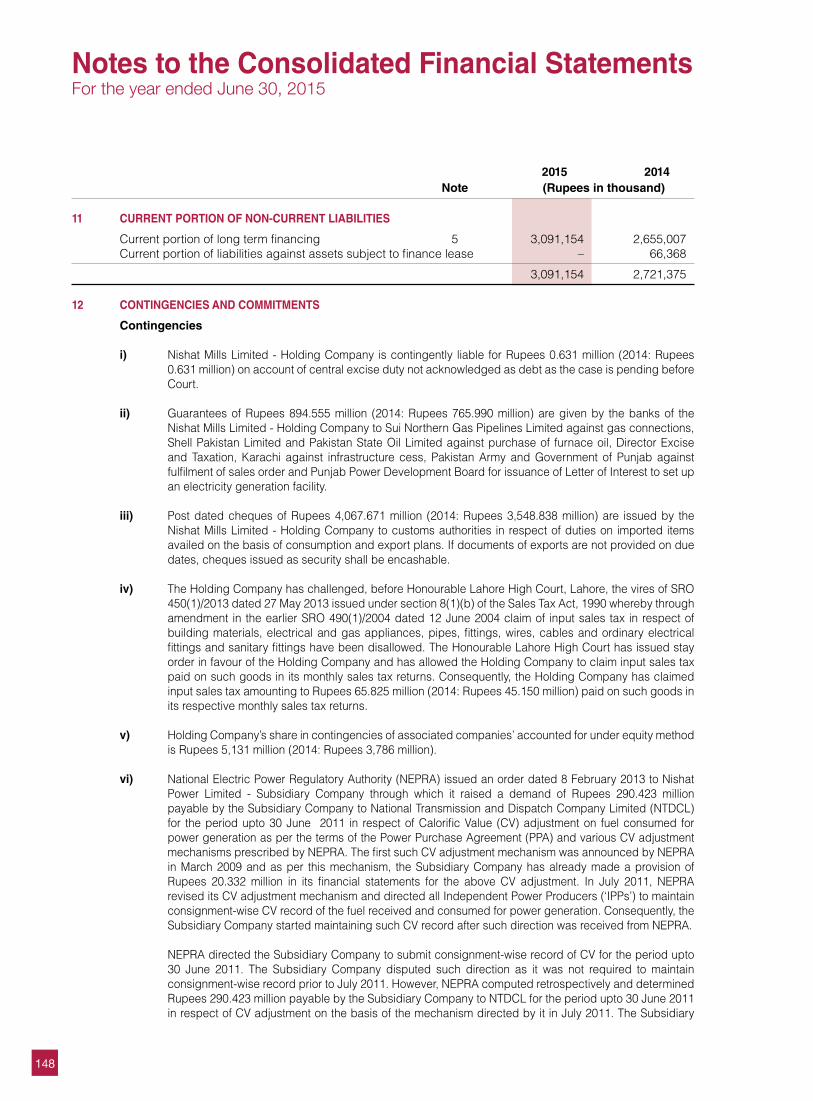
148
2015 2014 Note (Rupees in thousand)
11 CURRENT PORTION OF NON-CURRENT LIABILITIES
Current portion of long term financing 5 3,091,154 2,655,007 Current portion of liabilities against assets subject to finance lease – 66,368
3,091,154 2,721,375
12 CONTINGENCIES AND COMMITMENTS
Contingencies i) Nishat Mills Limited - Holding Company is contingently liable for Rupees 0.631 million (2014: Rupees
0.631 million) on account of central excise duty not acknowledged as debt as the case is pending before Court.
ii) Guarantees of Rupees 894.555 million (2014: Rupees 765.990 million) are given by the banks of the
Nishat Mills Limited - Holding Company to Sui Northern Gas Pipelines Limited against gas connections, Shell Pakistan Limited and Pakistan State Oil Limited against purchase of furnace oil, Director Excise and Taxation, Karachi against infrastructure cess, Pakistan Army and Government of Punjab against fulfilment of sales order and Punjab Power Development Board for issuance of Letter of Interest to set up an electricity generation facility.
iii) Post dated cheques of Rupees 4,067.671 million (2014: Rupees 3,548.838 million) are issued by the
Nishat Mills Limited - Holding Company to customs authorities in respect of duties on imported items availed on the basis of consumption and export plans. If documents of exports are not provided on due dates, cheques issued as security shall be encashable.
iv) The Holding Company has challenged, before Honourable Lahore High Court, Lahore, the vires of SRO
450(1)/2013 dated 27 May 2013 issued under section 8(1)(b) of the Sales Tax Act, 1990 whereby through amendment in the earlier SRO 490(1)/2004 dated 12 June 2004 claim of input sales tax in respect of building materials, electrical and gas appliances, pipes, fittings, wires, cables and ordinary electrical fittings and sanitary fittings have been disallowed. The Honourable Lahore High Court has issued stay order in favour of the Holding Company and has allowed the Holding Company to claim input sales tax paid on such goods in its monthly sales tax returns. Consequently, the Holding Company has claimed input sales tax amounting to Rupees 65.825 million (2014: Rupees 45.150 million) paid on such goods in its respective monthly sales tax returns.
v) Holding Company’s share in contingencies of associated companies’ accounted for under equity method
is Rupees 5,131 million (2014: Rupees 3,786 million). vi) National Electric Power Regulatory Authority (NEPRA) issued an order dated 8 February 2013 to Nishat
Power Limited - Subsidiary Company through which it raised a demand of Rupees 290.423 million payable by the Subsidiary Company to National Transmission and Dispatch Company Limited (NTDCL) for the period upto 30 June 2011 in respect of Calorific Value (CV) adjustment on fuel consumed for power generation as per the terms of the Power Purchase Agreement (PPA) and various CV adjustment mechanisms prescribed by NEPRA. The first such CV adjustment mechanism was announced by NEPRA in March 2009 and as per this mechanism, the Subsidiary Company has already made a provision of Rupees 20.332 million in its financial statements for the above CV adjustment. In July 2011, NEPRA revised its CV adjustment mechanism and directed all Independent Power Producers (‘IPPs’) to maintain consignment-wise CV record of the fuel received and consumed for power generation. Consequently, the Subsidiary Company started maintaining such CV record after such direction was received from NEPRA.
NEPRA directed the Subsidiary Company to submit consignment-wise record of CV for the period upto
30 June 2011. The Subsidiary Company disputed such direction as it was not required to maintain consignment-wise record prior to July 2011. However, NEPRA computed retrospectively and determined Rupees 290.423 million payable by the Subsidiary Company to NTDCL for the period upto 30 June 2011 in respect of CV adjustment on the basis of the mechanism directed by it in July 2011. The Subsidiary
Notes to the Consolidated Financial StatementsFor the year ended June 30, 2015
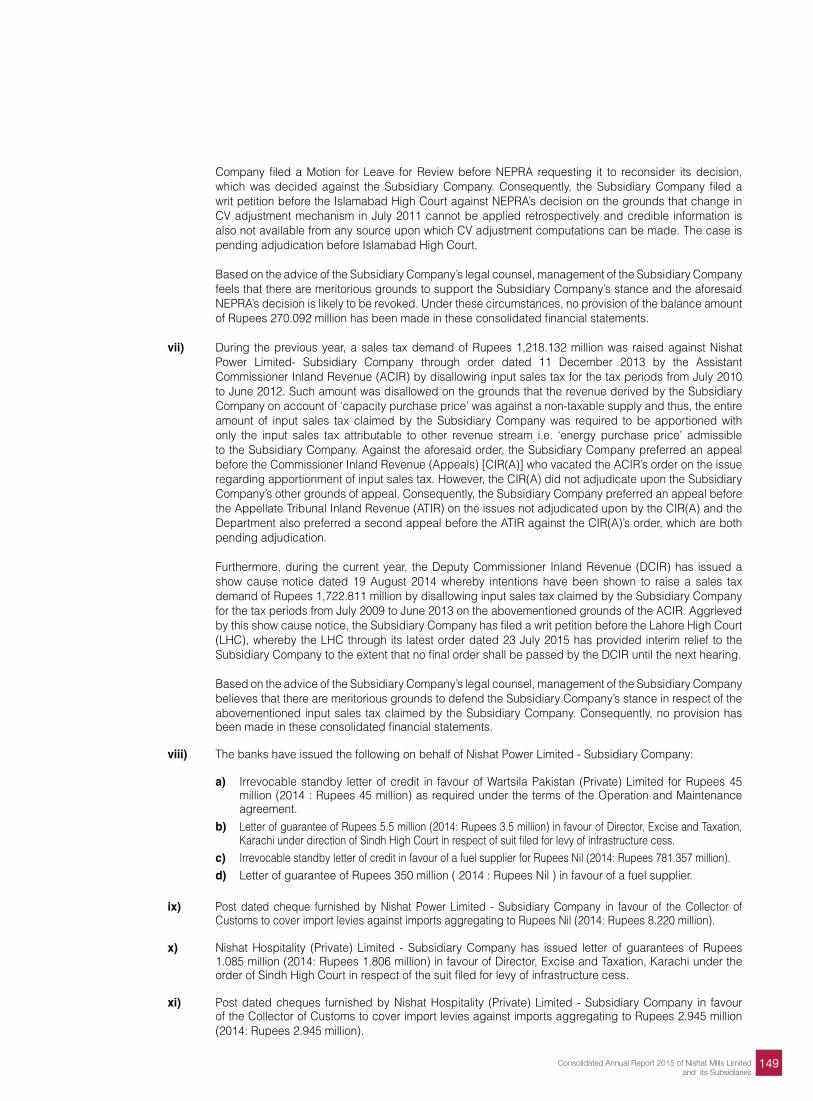
149Consolidated Annual Report 2015 of Nishat Mills Limitedand its Subsidiaries
Company filed a Motion for Leave for Review before NEPRA requesting it to reconsider its decision, which was decided against the Subsidiary Company. Consequently, the Subsidiary Company filed a writ petition before the Islamabad High Court against NEPRA’s decision on the grounds that change in CV adjustment mechanism in July 2011 cannot be applied retrospectively and credible information is also not available from any source upon which CV adjustment computations can be made. The case is pending adjudication before Islamabad High Court.
Based on the advice of the Subsidiary Company’s legal counsel, management of the Subsidiary Company
feels that there are meritorious grounds to support the Subsidiary Company’s stance and the aforesaid NEPRA’s decision is likely to be revoked. Under these circumstances, no provision of the balance amount of Rupees 270.092 million has been made in these consolidated financial statements.
vii) During the previous year, a sales tax demand of Rupees 1,218.132 million was raised against Nishat
Power Limited- Subsidiary Company through order dated 11 December 2013 by the Assistant Commissioner Inland Revenue (ACIR) by disallowing input sales tax for the tax periods from July 2010 to June 2012. Such amount was disallowed on the grounds that the revenue derived by the Subsidiary Company on account of ‘capacity purchase price’ was against a non-taxable supply and thus, the entire amount of input sales tax claimed by the Subsidiary Company was required to be apportioned with only the input sales tax attributable to other revenue stream i.e. ‘energy purchase price’ admissible to the Subsidiary Company. Against the aforesaid order, the Subsidiary Company preferred an appeal before the Commissioner Inland Revenue (Appeals) [CIR(A)] who vacated the ACIR’s order on the issue regarding apportionment of input sales tax. However, the CIR(A) did not adjudicate upon the Subsidiary Company’s other grounds of appeal. Consequently, the Subsidiary Company preferred an appeal before the Appellate Tribunal Inland Revenue (ATIR) on the issues not adjudicated upon by the CIR(A) and the Department also preferred a second appeal before the ATIR against the CIR(A)’s order, which are both pending adjudication.
Furthermore, during the current year, the Deputy Commissioner Inland Revenue (DCIR) has issued a
show cause notice dated 19 August 2014 whereby intentions have been shown to raise a sales tax demand of Rupees 1,722.811 million by disallowing input sales tax claimed by the Subsidiary Company for the tax periods from July 2009 to June 2013 on the abovementioned grounds of the ACIR. Aggrieved by this show cause notice, the Subsidiary Company has filed a writ petition before the Lahore High Court (LHC), whereby the LHC through its latest order dated 23 July 2015 has provided interim relief to the Subsidiary Company to the extent that no final order shall be passed by the DCIR until the next hearing.
Based on the advice of the Subsidiary Company’s legal counsel, management of the Subsidiary Company
believes that there are meritorious grounds to defend the Subsidiary Company’s stance in respect of the abovementioned input sales tax claimed by the Subsidiary Company. Consequently, no provision has been made in these consolidated financial statements.
viii) The banks have issued the following on behalf of Nishat Power Limited - Subsidiary Company: a) Irrevocable standby letter of credit in favour of Wartsila Pakistan (Private) Limited for Rupees 45
million (2014 : Rupees 45 million) as required under the terms of the Operation and Maintenance agreement.
b) Letter of guarantee of Rupees 5.5 million (2014: Rupees 3.5 million) in favour of Director, Excise and Taxation, Karachi under direction of Sindh High Court in respect of suit filed for levy of infrastructure cess.
c) Irrevocable standby letter of credit in favour of a fuel supplier for Rupees Nil (2014: Rupees 781.357 million). d) Letter of guarantee of Rupees 350 million ( 2014 : Rupees Nil ) in favour of a fuel supplier. ix) Post dated cheque furnished by Nishat Power Limited - Subsidiary Company in favour of the Collector of
Customs to cover import levies against imports aggregating to Rupees Nil (2014: Rupees 8.220 million). x) Nishat Hospitality (Private) Limited - Subsidiary Company has issued letter of guarantees of Rupees
1.085 million (2014: Rupees 1.806 million) in favour of Director, Excise and Taxation, Karachi under the order of Sindh High Court in respect of the suit filed for levy of infrastructure cess.
xi) Post dated cheques furnished by Nishat Hospitality (Private) Limited - Subsidiary Company in favour
of the Collector of Customs to cover import levies against imports aggregating to Rupees 2.945 million (2014: Rupees 2.945 million).
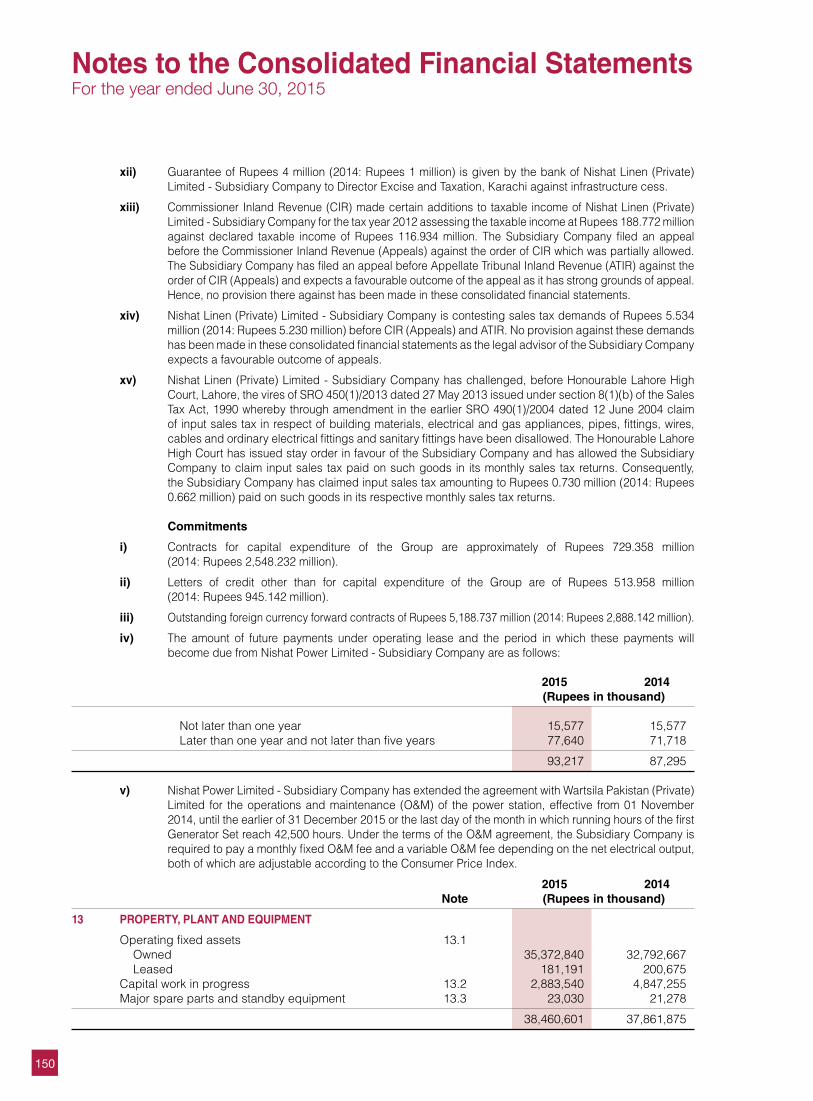
150
xii) Guarantee of Rupees 4 million (2014: Rupees 1 million) is given by the bank of Nishat Linen (Private) Limited - Subsidiary Company to Director Excise and Taxation, Karachi against infrastructure cess.
xiii) Commissioner Inland Revenue (CIR) made certain additions to taxable income of Nishat Linen (Private) Limited - Subsidiary Company for the tax year 2012 assessing the taxable income at Rupees 188.772 million against declared taxable income of Rupees 116.934 million. The Subsidiary Company filed an appeal before the Commissioner Inland Revenue (Appeals) against the order of CIR which was partially allowed. The Subsidiary Company has filed an appeal before Appellate Tribunal Inland Revenue (ATIR) against the order of CIR (Appeals) and expects a favourable outcome of the appeal as it has strong grounds of appeal. Hence, no provision there against has been made in these consolidated financial statements.
xiv) Nishat Linen (Private) Limited - Subsidiary Company is contesting sales tax demands of Rupees 5.534 million (2014: Rupees 5.230 million) before CIR (Appeals) and ATIR. No provision against these demands has been made in these consolidated financial statements as the legal advisor of the Subsidiary Company expects a favourable outcome of appeals.
xv) Nishat Linen (Private) Limited - Subsidiary Company has challenged, before Honourable Lahore High Court, Lahore, the vires of SRO 450(1)/2013 dated 27 May 2013 issued under section 8(1)(b) of the Sales Tax Act, 1990 whereby through amendment in the earlier SRO 490(1)/2004 dated 12 June 2004 claim of input sales tax in respect of building materials, electrical and gas appliances, pipes, fittings, wires, cables and ordinary electrical fittings and sanitary fittings have been disallowed. The Honourable Lahore High Court has issued stay order in favour of the Subsidiary Company and has allowed the Subsidiary Company to claim input sales tax paid on such goods in its monthly sales tax returns. Consequently, the Subsidiary Company has claimed input sales tax amounting to Rupees 0.730 million (2014: Rupees 0.662 million) paid on such goods in its respective monthly sales tax returns.
Commitments
i) Contracts for capital expenditure of the Group are approximately of Rupees 729.358 million (2014: Rupees 2,548.232 million).
ii) Letters of credit other than for capital expenditure of the Group are of Rupees 513.958 million (2014: Rupees 945.142 million).
iii) Outstanding foreign currency forward contracts of Rupees 5,188.737 million (2014: Rupees 2,888.142 million).
iv) The amount of future payments under operating lease and the period in which these payments will become due from Nishat Power Limited - Subsidiary Company are as follows:
2015 2014 (Rupees in thousand)
Not later than one year 15,577 15,577 Later than one year and not later than five years 77,640 71,718
93,217 87,295 v) Nishat Power Limited - Subsidiary Company has extended the agreement with Wartsila Pakistan (Private)
Limited for the operations and maintenance (O&M) of the power station, effective from 01 November 2014, until the earlier of 31 December 2015 or the last day of the month in which running hours of the first Generator Set reach 42,500 hours. Under the terms of the O&M agreement, the Subsidiary Company is required to pay a monthly fixed O&M fee and a variable O&M fee depending on the net electrical output, both of which are adjustable according to the Consumer Price Index.
2015 2014 Note (Rupees in thousand)
13 PROPERTY, PLANT AND EQUIPMENT
Operating fixed assets 13.1 Owned 35,372,840 32,792,667 Leased 181,191 200,675 Capital work in progress 13.2 2,883,540 4,847,255 Major spare parts and standby equipment 13.3 23,030 21,278
38,460,601 37,861,875
Notes to the Consolidated Financial StatementsFor the year ended June 30, 2015
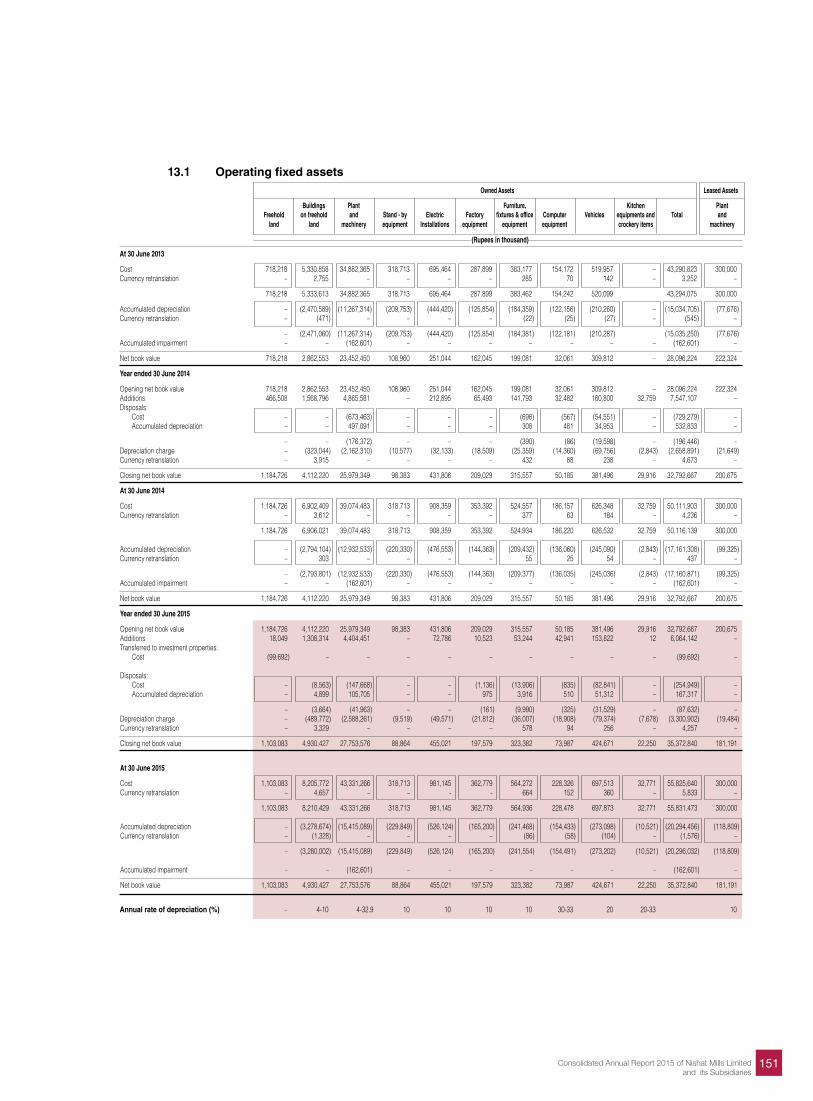
151Consolidated Annual Report 2015 of Nishat Mills Limitedand its Subsidiaries
At 30 June 2013
Cost 718,218 5,330,858 34,882,365 318,713 695,464 287,899 383,177 154,172 519,957 – 43,290,823 300,000 Currency retranslation – 2,755 – – – – 285 70 142 – 3,252 –
718,218 5,333,613 34,882,365 318,713 695,464 287,899 383,462 154,242 520,099 43,294,075 300,000
Accumulated depreciation – (2,470,589) (11,267,314) (209,753) (444,420) (125,854) (184,359) (122,156) (210,260) – (15,034,705) (77,676)Currency retranslation – (471) – – – – (22) (25) (27) – (545) –
– (2,471,060) (11,267,314) (209,753) (444,420) (125,854) (184,381) (122,181) (210,287) (15,035,250) (77,676)Accumulated impairment – – (162,601) – – – – – – – (162,601) –
Net book value 718,218 2,862,553 23,452,450 108,960 251,044 162,045 199,081 32,061 309,812 – 28,096,224 222,324
Year ended 30 June 2014
Opening net book value 718,218 2,862,553 23,452,450 108,960 251,044 162,045 199,081 32,061 309,812 – 28,096,224 222,324 Additions 466,508 1,568,796 4,865,581 – 212,895 65,493 141,793 32,482 160,800 32,759 7,547,107 – Disposals: Cost – – (673,463) – – – (698) (567) (54,551) – (729,279) – Accumulated depreciation – – 497,091 – – – 308 481 34,953 – 532,833 –
– – (176,372) – – – (390) (86) (19,598) – (196,446) – Depreciation charge – (323,044) (2,162,310) (10,577) (32,133) (18,509) (25,359) (14,360) (69,756) (2,843) (2,658,891) (21,649)Currency retranslation – 3,915 – – – – 432 88 238 – 4,673 –
Closing net book value 1,184,726 4,112,220 25,979,349 98,383 431,806 209,029 315,557 50,185 381,496 29,916 32,792,667 200,675
At 30 June 2014
Cost 1,184,726 6,902,409 39,074,483 318,713 908,359 353,392 524,557 186,157 626,348 32,759 50,111,903 300,000 Currency retranslation – 3,612 – – – – 377 63 184 – 4,236 –
1,184,726 6,906,021 39,074,483 318,713 908,359 353,392 524,934 186,220 626,532 32,759 50,116,139 300,000 Accumulated depreciation – (2,794,104) (12,932,533) (220,330) (476,553) (144,363) (209,432) (136,060) (245,090) (2,843) (17,161,308) (99,325)Currency retranslation – 303 – – – – 55 25 54 – 437 –
– (2,793,801) (12,932,533) (220,330) (476,553) (144,363) (209,377) (136,035) (245,036) (2,843) (17,160,871) (99,325)Accumulated impairment – – (162,601) – – – – – – – (162,601) –
Net book value 1,184,726 4,112,220 25,979,349 98,383 431,806 209,029 315,557 50,185 381,496 29,916 32,792,667 200,675
Year ended 30 June 2015
Opening net book value 1,184,726 4,112,220 25,979,349 98,383 431,806 209,029 315,557 50,185 381,496 29,916 32,792,667 200,675 Additions 18,049 1,308,314 4,404,451 – 72,786 10,523 53,244 42,941 153,822 12 6,064,142 – Transferred to investment properties: Cost (99,692) – – – – – – – – – (99,692) – Disposals: Cost – (8,563) (147,668) – – (1,136) (13,906) (835) (82,841) – (254,949) – Accumulated depreciation – 4,899 105,705 – – 975 3,916 510 51,312 – 167,317 –
– (3,664) (41,963) – – (161) (9,990) (325) (31,529) – (87,632) – Depreciation charge – (489,772) (2,588,261) (9,519) (49,571) (21,812) (36,007) (18,908) (79,374) (7,678) (3,300,902) (19,484)Currency retranslation – 3,329 – – – – 578 94 256 – 4,257 –
Closing net book value 1,103,083 4,930,427 27,753,576 88,864 455,021 197,579 323,382 73,987 424,671 22,250 35,372,840 181,191
At 30 June 2015
Cost 1,103,083 8,205,772 43,331,266 318,713 981,145 362,779 564,272 228,326 697,513 32,771 55,825,640 300,000 Currency retranslation – 4,657 – – - - 664 152 360 – 5,833 –
1,103,083 8,210,429 43,331,266 318,713 981,145 362,779 564,936 228,478 697,873 32,771 55,831,473 300,000 Accumulated depreciation – (3,278,674) (15,415,089) (229,849) (526,124) (165,200) (241,468) (154,433) (273,098) (10,521) (20,294,456) (118,809)Currency retranslation – (1,328) – – – – (86) (58) (104) – (1,576) –
– (3,280,002) (15,415,089) (229,849) (526,124) (165,200) (241,554) (154,491) (273,202) (10,521) (20,296,032) (118,809) Accumulated impairment – – (162,601) – – – – – – – (162,601) –
Net book value 1,103,083 4,930,427 27,753,576 88,864 455,021 197,579 323,382 73,987 424,671 22,250 35,372,840 181,191
Annual rate of depreciation (%) – 4-10 4-32.9 10 10 10 10 30-33 20 20-33 10
Owned Assets Leased Assets
Buildings Plant Furniture, Kitchen Plant Freehold on freehold and Stand - by Electric Factory fixtures & office Computer Vehicles equipments and Total and land land machinery equipment Installations equipment equipment equipment crockery items machinery
(Rupees in thousand)
13.1 Operating fixed assets
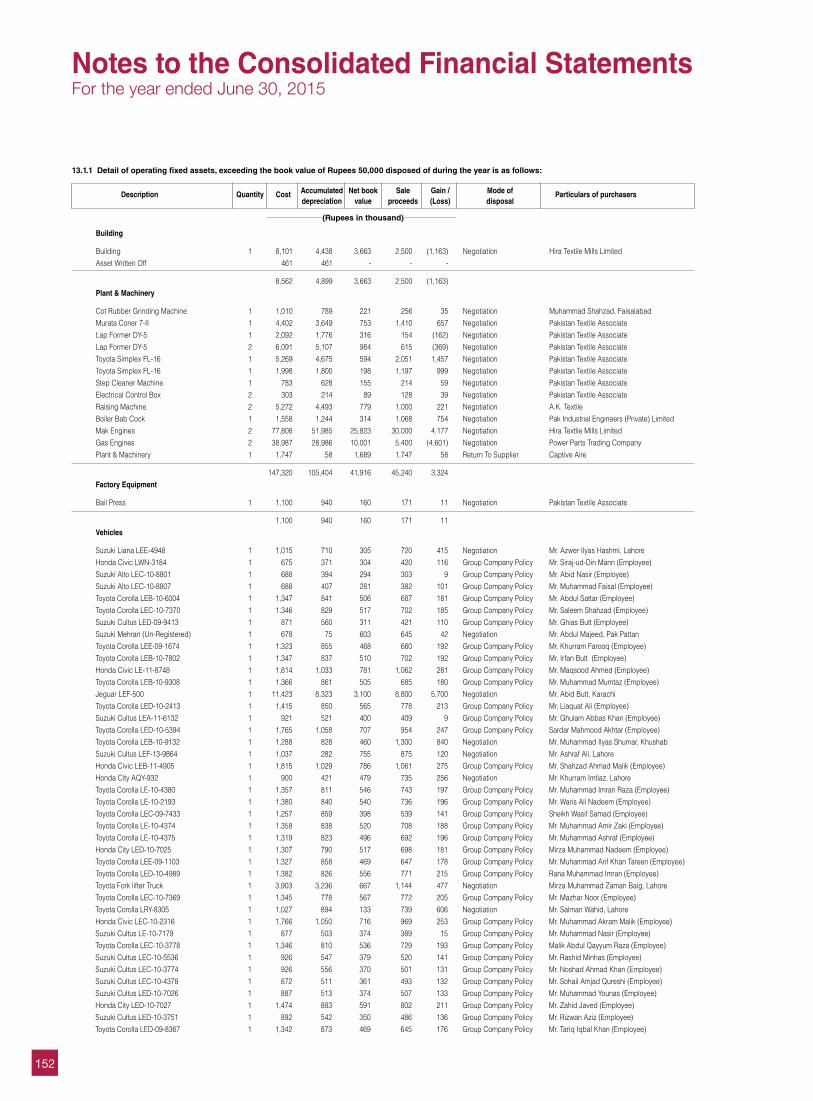
152
13.1.1 Detail of operating fixed assets, exceeding the book value of Rupees 50,000 disposed of during the year is as follows:
Building
Building 1 8,101 4,438 3,663 2,500 (1,163) Negotiation Hira Textile Mills LimitedAsset Written Off 461 461 - - -
8,562 4,899 3,663 2,500 (1,163) Plant & Machinery
Cot Rubber Grinding Machine 1 1,010 789 221 256 35 Negotiation Muhammad Shahzad, FaisalabadMurata Coner 7-II 1 4,402 3,649 753 1,410 657 Negotiation Pakistan Textile Associate Lap Former DY-5 1 2,092 1,776 316 154 (162) Negotiation Pakistan Textile Associate Lap Former DY-5 2 6,091 5,107 984 615 (369) Negotiation Pakistan Textile Associate Toyota Simplex FL-16 1 5,269 4,675 594 2,051 1,457 Negotiation Pakistan Textile Associate Toyota Simplex FL-16 1 1,998 1,800 198 1,197 999 Negotiation Pakistan Textile Associate Step Cleaner Machine 1 783 628 155 214 59 Negotiation Pakistan Textile Associate Electrical Control Box 2 303 214 89 128 39 Negotiation Pakistan Textile Associate Raising Machine 2 5,272 4,493 779 1,000 221 Negotiation A.K. TextileBoiler Bab Cock 1 1,558 1,244 314 1,068 754 Negotiation Pak Industrial Engineers (Private) LimitedMak Engines 2 77,808 51,985 25,823 30,000 4,177 Negotiation Hira Textile Mills Limited Gas Engines 2 38,987 28,986 10,001 5,400 (4,601) Negotiation Power Parts Trading CompanyPlant & Machinery 1 1,747 58 1,689 1,747 58 Return To Supplier Captive Aire
147,320 105,404 41,916 45,240 3,324 Factory Equipment
Bail Press 1 1,100 940 160 171 11 Negotiation Pakistan Textile Associate
1,100 940 160 171 11 Vehicles
Suzuki Liana LEE-4948 1 1,015 710 305 720 415 Negotiation Mr. Azwer Ilyas Hashmi, LahoreHonda Civic LWN-3184 1 675 371 304 420 116 Group Company Policy Mr. Siraj-ud-Din Mann (Employee)Suzuki Alto LEC-10-8801 1 688 394 294 303 9 Group Company Policy Mr. Abid Nasir (Employee)Suzuki Alto LEC-10-8807 1 688 407 281 382 101 Group Company Policy Mr. Muhammad Faisal (Employee)Toyota Corolla LEB-10-6004 1 1,347 841 506 687 181 Group Company Policy Mr. Abdul Sattar (Employee)Toyota Corolla LEC-10-7370 1 1,346 829 517 702 185 Group Company Policy Mr. Saleem Shahzad (Employee)Suzuki Cultus LED-09-9413 1 871 560 311 421 110 Group Company Policy Mr. Ghias Butt (Employee)Suzuki Mehran (Un-Registered) 1 678 75 603 645 42 Negotiation Mr. Abdul Majeed, Pak PattanToyota Corolla LEE-09-1674 1 1,323 855 468 660 192 Group Company Policy Mr. Khurram Farooq (Employee)Toyota Corolla LEB-10-7802 1 1,347 837 510 702 192 Group Company Policy Mr. Irfan Butt (Employee) Honda Civic LE-11-8748 1 1,814 1,033 781 1,062 281 Group Company Policy Mr. Maqsood Ahmed (Employee) Toyota Corolla LEB-10-9308 1 1,366 861 505 685 180 Group Company Policy Mr. Muhammad Mumtaz (Employee) Jeguar LEF-500 1 11,423 8,323 3,100 8,800 5,700 Negotiation Mr. Abid Butt, KarachiToyota Corolla LED-10-2413 1 1,415 850 565 778 213 Group Company Policy Mr. Liaquat Ali (Employee)Suzuki Cultus LEA-11-6132 1 921 521 400 409 9 Group Company Policy Mr. Ghulam Abbas Khan (Employee)Toyota Corolla LED-10-5394 1 1,765 1,058 707 954 247 Group Company Policy Sardar Mahmood Akhtar (Employee)Toyota Corolla LEB-10-9132 1 1,288 828 460 1,300 840 Negotiation Mr. Muhammad Ilyas Shumar, KhushabSuzuki Cultus LEF-13-9864 1 1,037 282 755 875 120 Negotiation Mr. Ashraf Ali, LahoreHonda Civic LEB-11-4905 1 1,815 1,029 786 1,061 275 Group Company Policy Mr. Shahzad Ahmad Malik (Employee)Honda City AQY-932 1 900 421 479 735 256 Negotiation Mr. Khurram Imtiaz, LahoreToyota Corolla LE-10-4380 1 1,357 811 546 743 197 Group Company Policy Mr. Muhammad Imran Raza (Employee) Toyota Corolla LE-10-2193 1 1,380 840 540 736 196 Group Company Policy Mr. Waris Ali Nadeem (Employee) Toyota Corolla LEC-09-7433 1 1,257 859 398 539 141 Group Company Policy Sheikh Wasif Samad (Employee) Toyota Corolla LE-10-4374 1 1,358 838 520 708 188 Group Company Policy Mr. Muhammad Amir Zaki (Employee) Toyota Corolla LE-10-4375 1 1,319 823 496 692 196 Group Company Policy Mr. Muhammad Ashraf (Employee) Honda City LED-10-7025 1 1,307 790 517 698 181 Group Company Policy Mirza Muhammad Nadeem (Employee) Toyota Corolla LEE-09-1103 1 1,327 858 469 647 178 Group Company Policy Mr. Muhammad Arif Khan Tareen (Employee) Toyota Corolla LED-10-4989 1 1,382 826 556 771 215 Group Company Policy Rana Muhammad Imran (Employee) Toyota Fork lifter Truck 1 3,903 3,236 667 1,144 477 Negotiation Mirza Muhammad Zaman Baig, LahoreToyota Corolla LEC-10-7369 1 1,345 778 567 772 205 Group Company Policy Mr. Mazhar Noor (Employee) Toyota Corolla LRY-8305 1 1,027 894 133 739 606 Negotiation Mr. Salman Wahid, LahoreHonda Civic LEC-10-2316 1 1,766 1,050 716 969 253 Group Company Policy Mr. Muhammad Akram Malik (Employee) Suzuki Cultus LE-10-7179 1 877 503 374 389 15 Group Company Policy Mr. Muhammad Nasir (Employee) Toyota Corolla LEC-10-3778 1 1,346 810 536 729 193 Group Company Policy Malik Abdul Qayyum Raza (Employee)Suzuki Cultus LEC-10-5536 1 926 547 379 520 141 Group Company Policy Mr. Rashid Minhas (Employee)Suzuki Cultus LEC-10-3774 1 926 556 370 501 131 Group Company Policy Mr. Noshad Ahmad Khan (Employee)Suzuki Cultus LEC-10-4378 1 872 511 361 493 132 Group Company Policy Mr. Sohail Amjad Qureshi (Employee) Suzuki Cultus LED-10-7026 1 887 513 374 507 133 Group Company Policy Mr. Muhammad Younas (Employee) Honda City LED-10-7027 1 1,474 883 591 802 211 Group Company Policy Mr. Zahid Javed (Employee) Suzuki Cultus LED-10-3751 1 892 542 350 486 136 Group Company Policy Mr. Rizwan Aziz (Employee) Toyota Corolla LED-09-8367 1 1,342 873 469 645 176 Group Company Policy Mr. Tariq Iqbal Khan (Employee)
Description Quantity Cost Accumulated Net book Sale Gain / Mode of Particulars of purchasers depreciation value proceeds (Loss) disposal
(Rupees in thousand)
Notes to the Consolidated Financial StatementsFor the year ended June 30, 2015
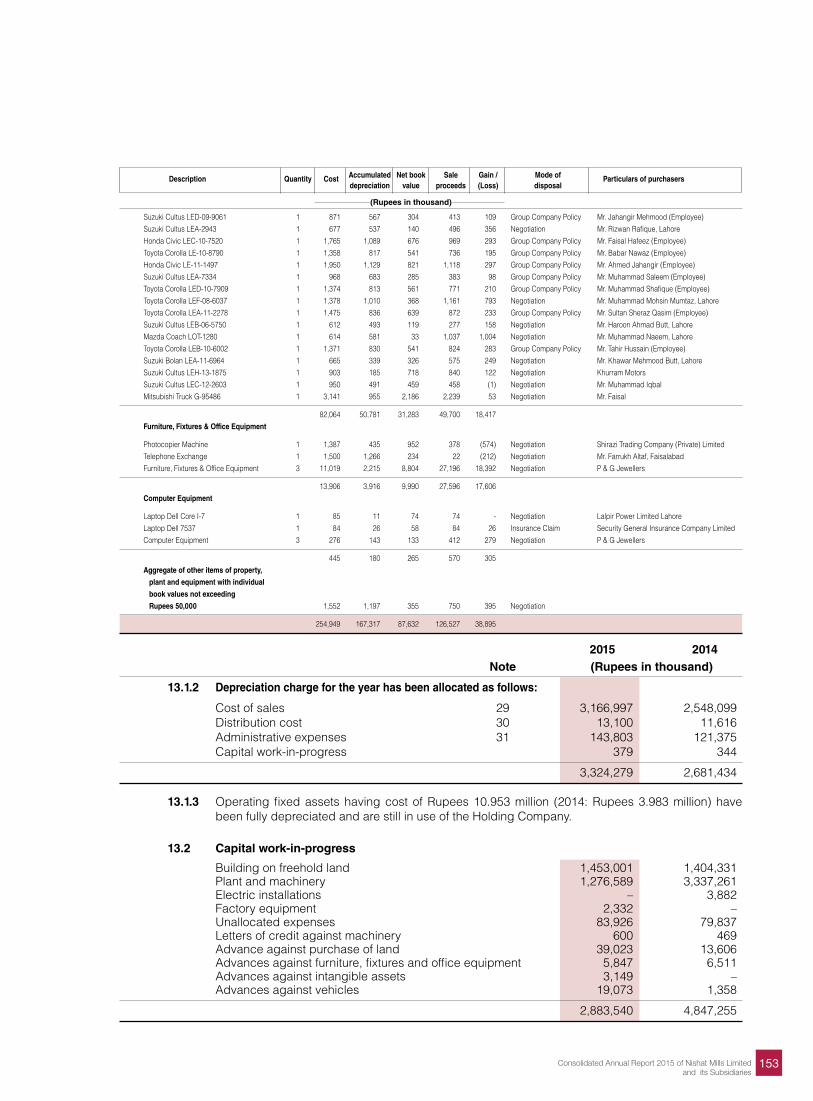
153Consolidated Annual Report 2015 of Nishat Mills Limitedand its Subsidiaries
Description Quantity Cost Accumulated Net book Sale Gain / Mode of Particulars of purchasers depreciation value proceeds (Loss) disposal
(Rupees in thousand)
Suzuki Cultus LED-09-9061 1 871 567 304 413 109 Group Company Policy Mr. Jahangir Mehmood (Employee) Suzuki Cultus LEA-2943 1 677 537 140 496 356 Negotiation Mr. Rizwan Rafique, LahoreHonda Civic LEC-10-7520 1 1,765 1,089 676 969 293 Group Company Policy Mr. Faisal Hafeez (Employee)Toyota Corolla LE-10-8790 1 1,358 817 541 736 195 Group Company Policy Mr. Babar Nawaz (Employee) Honda Civic LE-11-1497 1 1,950 1,129 821 1,118 297 Group Company Policy Mr. Ahmed Jahangir (Employee) Suzuki Cultus LEA-7334 1 968 683 285 383 98 Group Company Policy Mr. Muhammad Saleem (Employee) Toyota Corolla LED-10-7909 1 1,374 813 561 771 210 Group Company Policy Mr. Muhammad Shafique (Employee) Toyota Corolla LEF-08-6037 1 1,378 1,010 368 1,161 793 Negotiation Mr. Muhammad Mohsin Mumtaz, LahoreToyota Corolla LEA-11-2278 1 1,475 836 639 872 233 Group Company Policy Mr. Sultan Sheraz Qasim (Employee) Suzuki Cultus LEB-06-5750 1 612 493 119 277 158 Negotiation Mr. Haroon Ahmad Butt, LahoreMazda Coach LOT-1280 1 614 581 33 1,037 1,004 Negotiation Mr. Muhammad Naeem, LahoreToyota Corolla LEB-10-6002 1 1,371 830 541 824 283 Group Company Policy Mr. Tahir Hussain (Employee) Suzuki Bolan LEA-11-6964 1 665 339 326 575 249 Negotiation Mr. Khawar Mehmood Butt, LahoreSuzuki Cultus LEH-13-1875 1 903 185 718 840 122 Negotiation Khurram MotorsSuzuki Cultus LEC-12-2603 1 950 491 459 458 (1) Negotiation Mr. Muhammad IqbalMitsubishi Truck G-95486 1 3,141 955 2,186 2,239 53 Negotiation Mr. Faisal
82,064 50,781 31,283 49,700 18,417 Furniture, Fixtures & Office Equipment
Photocopier Machine 1 1,387 435 952 378 (574) Negotiation Shirazi Trading Company (Private) LimitedTelephone Exchange 1 1,500 1,266 234 22 (212) Negotiation Mr. Farrukh Altaf, FaisalabadFurniture, Fixtures & Office Equipment 3 11,019 2,215 8,804 27,196 18,392 Negotiation P & G Jewellers
13,906 3,916 9,990 27,596 17,606 Computer Equipment
Laptop Dell Core I-7 1 85 11 74 74 - Negotiation Lalpir Power Limited LahoreLaptop Dell 7537 1 84 26 58 84 26 Insurance Claim Security General Insurance Company LimitedComputer Equipment 3 276 143 133 412 279 Negotiation P & G Jewellers
445 180 265 570 305 Aggregate of other items of property,
plant and equipment with individual
book values not exceeding
Rupees 50,000 1,552 1,197 355 750 395 Negotiation
254,949 167,317 87,632 126,527 38,895
2015 2014 Note (Rupees in thousand)
13.1.2 Depreciation charge for the year has been allocated as follows:
Cost of sales 29 3,166,997 2,548,099 Distribution cost 30 13,100 11,616 Administrative expenses 31 143,803 121,375 Capital work-in-progress 379 344
3,324,279 2,681,434
13.1.3 Operating fixed assets having cost of Rupees 10.953 million (2014: Rupees 3.983 million) have been fully depreciated and are still in use of the Holding Company.
13.2 Capital work-in-progress
Building on freehold land 1,453,001 1,404,331 Plant and machinery 1,276,589 3,337,261 Electric installations – 3,882 Factory equipment 2,332 – Unallocated expenses 83,926 79,837 Letters of credit against machinery 600 469 Advance against purchase of land 39,023 13,606 Advances against furniture, fixtures and office equipment 5,847 6,511 Advances against intangible assets 3,149 – Advances against vehicles 19,073 1,358
2,883,540 4,847,255
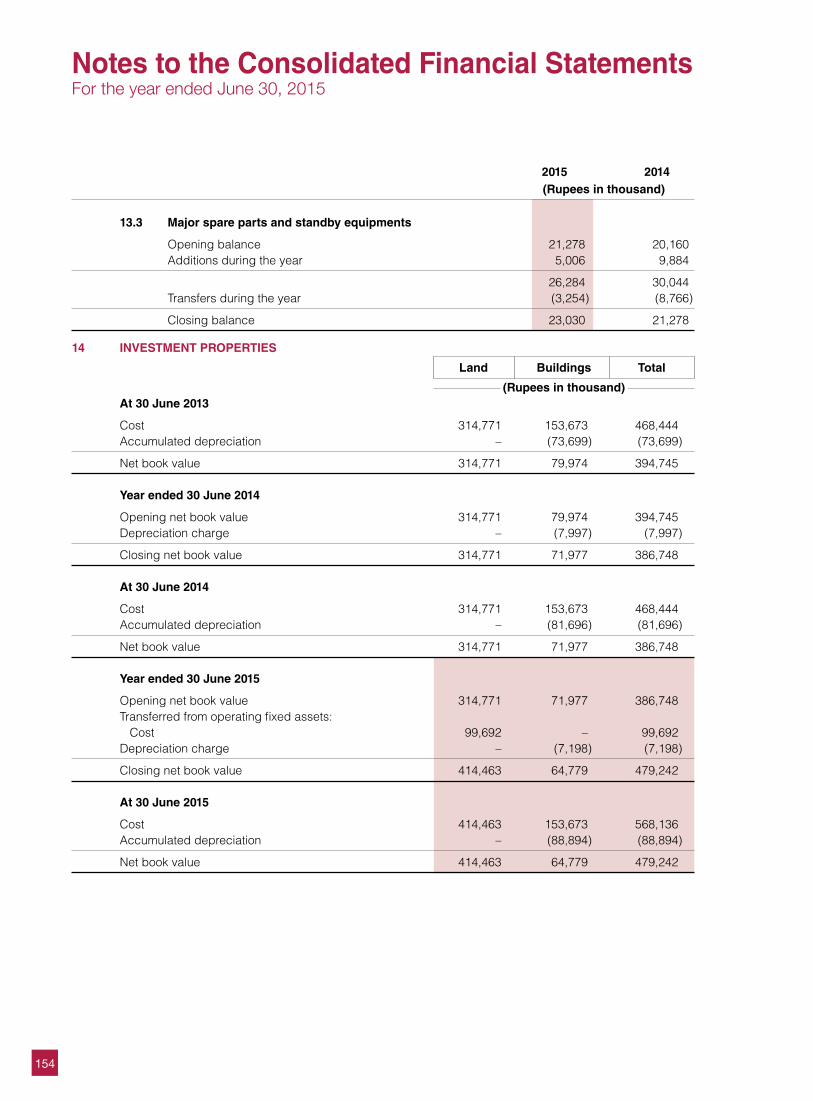
154
2015 2014 (Rupees in thousand)
13.3 Major spare parts and standby equipments
Opening balance 21,278 20,160 Additions during the year 5,006 9,884
26,284 30,044 Transfers during the year (3,254) (8,766)
Closing balance 23,030 21,278
14 INVESTMENT PROPERTIES
Land Buildings Total
(Rupees in thousand) At 30 June 2013
Cost 314,771 153,673 468,444 Accumulated depreciation – (73,699) (73,699)
Net book value 314,771 79,974 394,745 Year ended 30 June 2014
Opening net book value 314,771 79,974 394,745 Depreciation charge – (7,997) (7,997)
Closing net book value 314,771 71,977 386,748 At 30 June 2014
Cost 314,771 153,673 468,444 Accumulated depreciation – (81,696) (81,696)
Net book value 314,771 71,977 386,748 Year ended 30 June 2015
Opening net book value 314,771 71,977 386,748 Transferred from operating fixed assets: Cost 99,692 – 99,692 Depreciation charge – (7,198) (7,198)
Closing net book value 414,463 64,779 479,242 At 30 June 2015
Cost 414,463 153,673 568,136 Accumulated depreciation – (88,894) (88,894)
Net book value 414,463 64,779 479,242
Notes to the Consolidated Financial StatementsFor the year ended June 30, 2015
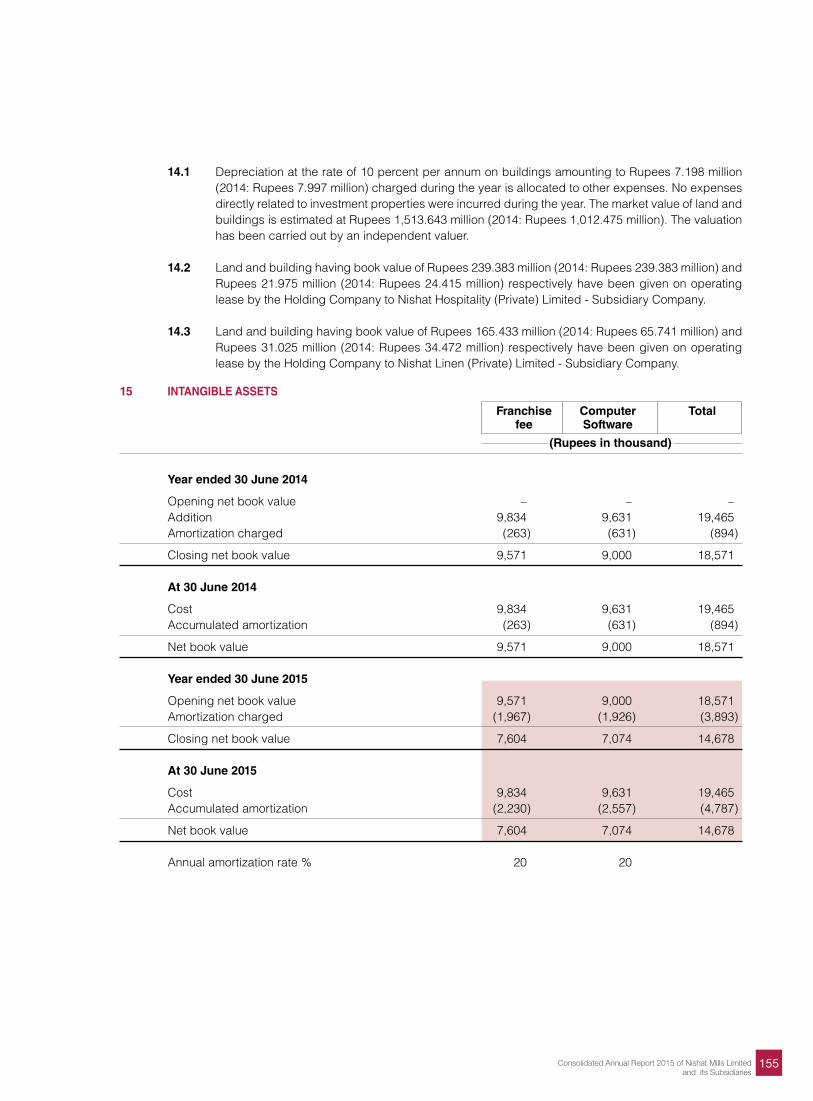
155Consolidated Annual Report 2015 of Nishat Mills Limitedand its Subsidiaries
14.1 Depreciation at the rate of 10 percent per annum on buildings amounting to Rupees 7.198 million (2014: Rupees 7.997 million) charged during the year is allocated to other expenses. No expenses directly related to investment properties were incurred during the year. The market value of land and buildings is estimated at Rupees 1,513.643 million (2014: Rupees 1,012.475 million). The valuation has been carried out by an independent valuer.
14.2 Land and building having book value of Rupees 239.383 million (2014: Rupees 239.383 million) and
Rupees 21.975 million (2014: Rupees 24.415 million) respectively have been given on operating lease by the Holding Company to Nishat Hospitality (Private) Limited - Subsidiary Company.
14.3 Land and building having book value of Rupees 165.433 million (2014: Rupees 65.741 million) and Rupees 31.025 million (2014: Rupees 34.472 million) respectively have been given on operating lease by the Holding Company to Nishat Linen (Private) Limited - Subsidiary Company.
15 INTANGIBLE ASSETS
Franchise Computer Total fee Software
(Rupees in thousand)
Year ended 30 June 2014
Opening net book value – – –Addition 9,834 9,631 19,465 Amortization charged (263) (631) (894)
Closing net book value 9,571 9,000 18,571 At 30 June 2014
Cost 9,834 9,631 19,465 Accumulated amortization (263) (631) (894)
Net book value 9,571 9,000 18,571
Year ended 30 June 2015
Opening net book value 9,571 9,000 18,571 Amortization charged (1,967) (1,926) (3,893)
Closing net book value 7,604 7,074 14,678 At 30 June 2015
Cost 9,834 9,631 19,465 Accumulated amortization (2,230) (2,557) (4,787)
Net book value 7,604 7,074 14,678 Annual amortization rate % 20 20
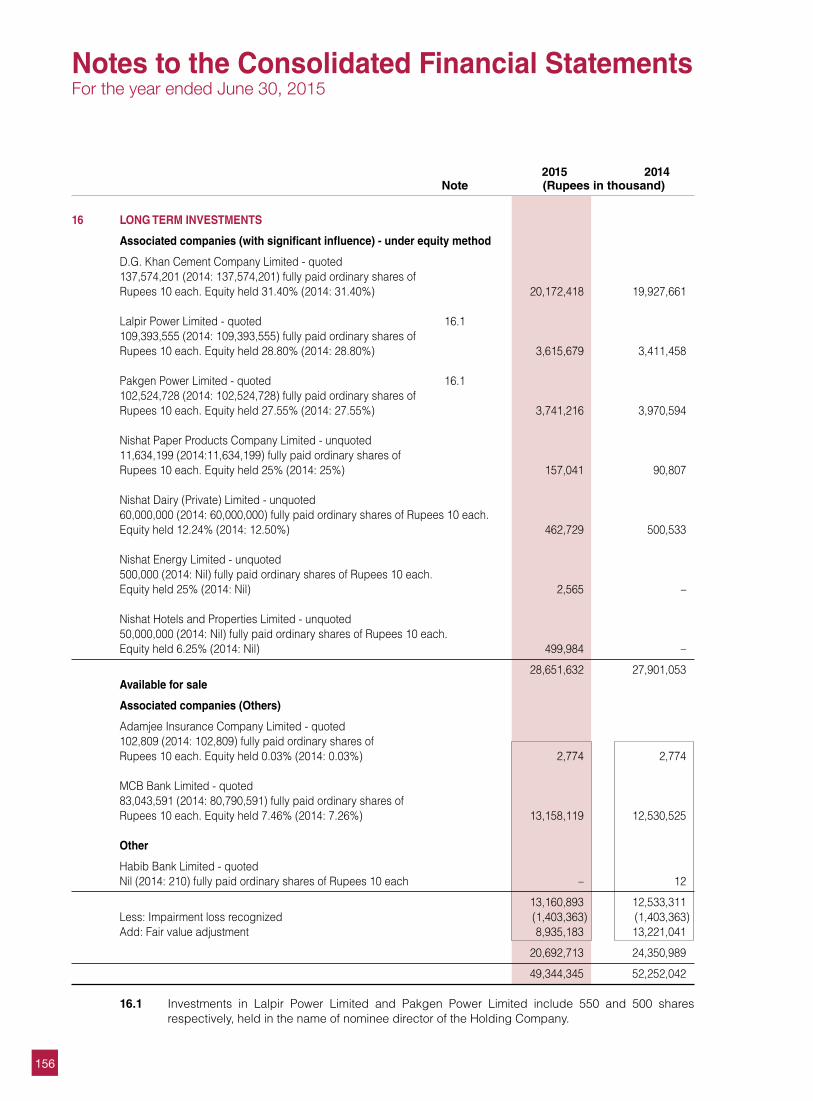
156
2015 2014 Note (Rupees in thousand)
16 LONG TERM INVESTMENTS
Associated companies (with significant influence) - under equity method
D.G. Khan Cement Company Limited - quoted 137,574,201 (2014: 137,574,201) fully paid ordinary shares of Rupees 10 each. Equity held 31.40% (2014: 31.40%) 20,172,418 19,927,661 Lalpir Power Limited - quoted 16.1 109,393,555 (2014: 109,393,555) fully paid ordinary shares of Rupees 10 each. Equity held 28.80% (2014: 28.80%) 3,615,679 3,411,458 Pakgen Power Limited - quoted 16.1 102,524,728 (2014: 102,524,728) fully paid ordinary shares of Rupees 10 each. Equity held 27.55% (2014: 27.55%) 3,741,216 3,970,594 Nishat Paper Products Company Limited - unquoted 11,634,199 (2014:11,634,199) fully paid ordinary shares of Rupees 10 each. Equity held 25% (2014: 25%) 157,041 90,807 Nishat Dairy (Private) Limited - unquoted 60,000,000 (2014: 60,000,000) fully paid ordinary shares of Rupees 10 each. Equity held 12.24% (2014: 12.50%) 462,729 500,533 Nishat Energy Limited - unquoted 500,000 (2014: Nil) fully paid ordinary shares of Rupees 10 each. Equity held 25% (2014: Nil) 2,565 – Nishat Hotels and Properties Limited - unquoted 50,000,000 (2014: Nil) fully paid ordinary shares of Rupees 10 each. Equity held 6.25% (2014: Nil) 499,984 –
28,651,632 27,901,053 Available for sale
Associated companies (Others)
Adamjee Insurance Company Limited - quoted 102,809 (2014: 102,809) fully paid ordinary shares of Rupees 10 each. Equity held 0.03% (2014: 0.03%) 2,774 2,774 MCB Bank Limited - quoted 83,043,591 (2014: 80,790,591) fully paid ordinary shares of Rupees 10 each. Equity held 7.46% (2014: 7.26%) 13,158,119 12,530,525 Other
Habib Bank Limited - quoted Nil (2014: 210) fully paid ordinary shares of Rupees 10 each – 12
13,160,893 12,533,311 Less: Impairment loss recognized (1,403,363) (1,403,363) Add: Fair value adjustment 8,935,183 13,221,041
20,692,713 24,350,989
49,344,345 52,252,042
16.1 Investments in Lalpir Power Limited and Pakgen Power Limited include 550 and 500 shares respectively, held in the name of nominee director of the Holding Company.
Notes to the Consolidated Financial StatementsFor the year ended June 30, 2015
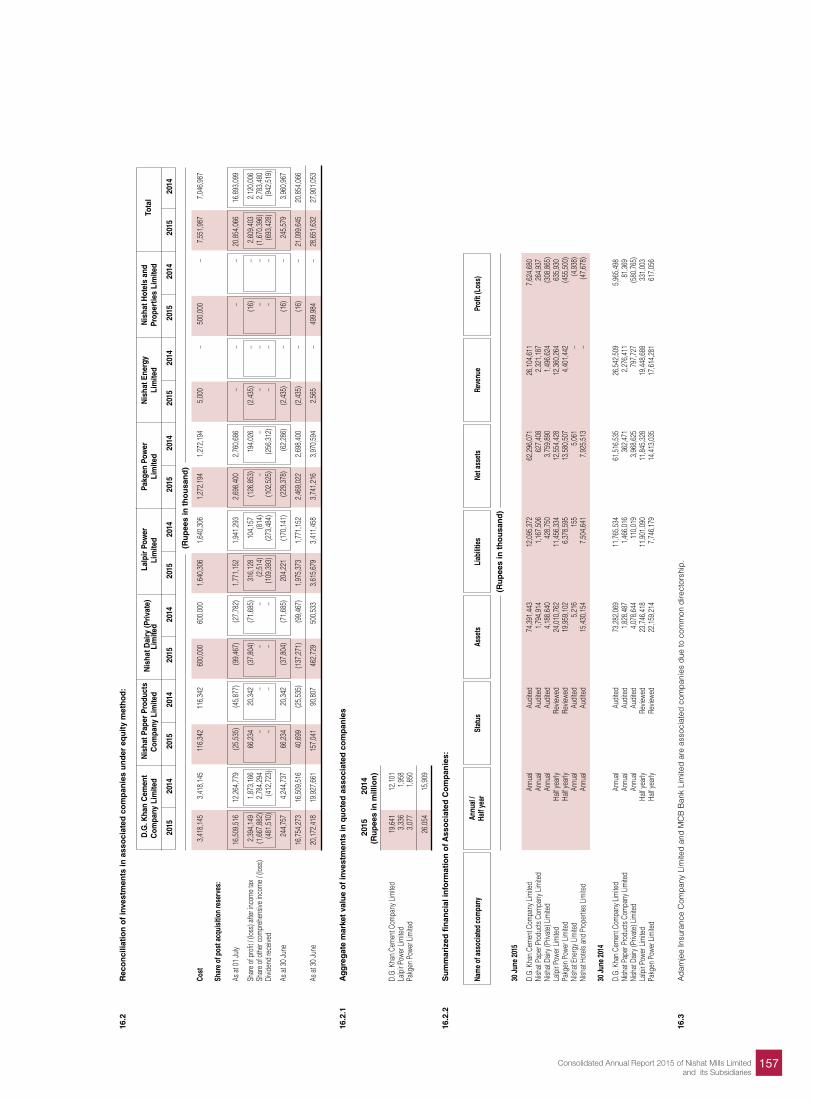
157Consolidated Annual Report 2015 of Nishat Mills Limitedand its Subsidiaries
16.2
R
eco
nci
liati
on
of
inve
stm
ents
in a
sso
ciat
ed c
om
pan
ies
un
der
eq
uit
y m
eth
od
:
D
.G. K
han
Cem
ent
Nis
hat P
aper
Pro
duct
s
Nis
hat D
airy
(Priv
ate)
L
alpi
r Po
wer
Pakg
en P
ower
N
isha
t Ene
rgy
Nis
hat H
otel
s an
d To
tal
C
ompa
ny L
imite
d C
ompa
ny L
imite
d Li
mite
d Li
mite
d Li
mite
d Li
mite
d Pr
oper
ties
Lim
ited
2
015
201
4 2
015
201
4
20
15
201
4 2
015
201
4 2
015
201
4
201
5 2
014
2
015
201
4 2
015
201
4
(
Ru
pee
s in
th
ou
san
d)
Co
st
3,4
18,1
45
3,4
18,1
45
116
,342
1
16,3
42
600
,000
6
00,0
00
1,6
40,3
06
1,6
40,3
06
1,2
72,1
94
1,2
72,1
94
5,0
00
– 5
00,0
00
–
7,5
51,9
87
7,0
46,9
87
Sh
are
of p
ost a
cqui
sitio
n re
serv
es:
As a
t 01
July
16,5
09,5
16
12,
264,
779
(2
5,53
5)
(45,
877)
(9
9,46
7)
(27,
782)
1
,771
,152
1
,941
,293
2
,698
,400
2
,760
,686
–
–
–
–
20,
854,
066
1
6,89
3,09
9
Sh
are
of p
rofit
/ (los
s) a
fter i
ncom
e ta
x 2
,394
,149
1
,873
,166
6
6,23
4
20,
342
(3
7,80
4)
(71,
685)
3
16,1
28
104
,157
(1
26,8
53)
194
,026
(2
,435
) –
(1
6)
–
2,6
09,4
03
2,1
20,0
06
Sh
are
of o
ther
com
preh
ensiv
e inc
ome
/ (los
s)
(1,6
67,8
82)
2,7
84,2
94
–
–
–
– (2
,514
) (8
14)
–
– –
–
–
–
(1
,670
,396
) 2
,783
,480
Divid
end
rece
ived
(481
,510
) (4
12,7
23)
–
–
–
–
(109
,393
) (2
73,4
84)
(102
,525
) (2
56,3
12)
–
– –
–
(6
93,4
28)
(942
,519
)
As
at 3
0 Ju
ne
244
,757
4
,244
,737
6
6,23
4
20,
342
(3
7,80
4)
(71,
685)
2
04,2
21
(170
,141
) (2
29,3
78)
(62,
286)
(2
,435
) –
(16)
–
2
45,5
79
3,9
60,9
67
16,
754,
273
1
6,50
9,51
6
40,
699
(2
5,53
5)
(137
,271
) (9
9,46
7)
1,9
75,3
73
1,7
71,1
52
2,4
69,0
22
2,6
98,4
00
(2,4
35)
–
(16)
–
2
1,09
9,64
5
20,
854,
066
As
at 3
0 Ju
ne
20,
172,
418
1
9,92
7,66
1
157
,041
9
0,80
7
462
,729
5
00,5
33
3,6
15,6
79
3,4
11,4
58
3,7
41,2
16
3,9
70,5
94
2,5
65
– 4
99,9
84
–
28,
651,
632
2
7,90
1,05
3
16.2
.1
Ag
gre
gat
e m
arke
t va
lue
of
inve
stm
ents
in q
uo
ted
ass
oci
ated
co
mp
anie
s
2
015
201
4
(Ru
pee
s in
mill
ion
)
D.
G. K
han
Cem
ent C
ompa
ny L
imite
d 1
9,64
1
12,
101
La
lpir
Powe
r Lim
ited
3,3
36
1,9
58
Pa
kgen
Pow
er L
imite
d 3
,077
1
,850
26,
054
1
5,90
9
16.2
.2
Su
mm
ariz
ed fi
nan
cial
info
rmat
ion
of A
sso
ciat
ed C
om
pan
ies:
Na
me
of a
ssoc
iate
d co
mpa
ny
Annu
al /
Stat
us
Asse
ts
Liab
ilitie
s Ne
t ass
ets
Reve
nue
Pr
ofit (
Loss
)
Ha
lf ye
ar
(Ru
pee
s in
th
ou
san
d)
30
Jun
e 20
15
D.
G. K
han
Cem
ent C
ompa
ny L
imite
d
Annu
al
Audi
ted
7
4,39
1,44
3
1
2,09
5,37
2
6
2,29
6,07
1
2
6,10
4,61
1
7
,624
,680
Nish
at P
aper
Pro
duct
s Com
pany
Lim
ited
An
nual
Au
dite
d
1
,794
,914
1,1
67,5
06
6
27,4
08
2
,321
,187
264
,937
Nish
at D
airy (
Priva
te) L
imite
d
Annu
al
Audi
ted
4,1
88,6
40
4
28,7
50
3
,759
,890
1,4
96,6
24
(3
08,8
65)
La
lpir
Powe
r Lim
ited
Ha
lf yea
rly
Re
viewe
d
24,
010,
762
11,4
56,3
34
1
2,55
4,42
8
1
2,36
0,26
4
6
35,9
30
Pa
kgen
Pow
er L
imite
d
Half y
early
Revie
wed
1
9,95
9,10
2
6
,378
,595
13,
580,
507
4,4
01,4
42
(4
55,5
00)
Ni
shat
Ene
rgy L
imite
d
Annu
al
Audi
ted
5,2
16
1
55
5
,061
–
(4,9
38)
Ni
shat
Hot
els a
nd P
rope
rties
Lim
ited
An
nual
Au
dite
d
1
5,43
0,15
4
7
,504
,641
7,9
25,5
13
–
(4
7,67
8)
30 J
une
2014
D.
G. K
han
Cem
ent C
ompa
ny L
imite
d
Annu
al
Audi
ted
7
3,28
2,06
9
1
1,76
5,53
4
6
1,51
6,53
5
2
6,54
2,50
9
5
,965
,498
Nish
at P
aper
Pro
duct
s Com
pany
Lim
ited
An
nual
Au
dite
d
1
,828
,487
1,4
66,0
16
3
62,4
71
2
,276
,411
81,
369
Ni
shat
Dair
y (Pr
ivate
) Lim
ited
An
nual
Au
dite
d
4
,078
,644
110
,019
3,9
68,6
25
7
97,7
27
(5
80,7
65)
La
lpir
Powe
r Lim
ited
Ha
lf yea
rly
Re
viewe
d
23,7
46,4
18
1
1,90
1,09
0
1
1,84
5,32
8
1
9,44
8,68
8
3
31,0
03
Pa
kgen
Pow
er L
imite
d
Half y
early
Revie
wed
2
2,15
9,21
4
7
,746
,179
14,
413,
035
17,
614,
281
617
,056
16.3
A
dam
jee
Insu
ranc
e C
ompa
ny L
imite
d an
d M
CB
Ban
k Li
mite
d ar
e as
soci
ated
com
pani
es d
ue to
com
mon
dire
ctor
ship
.
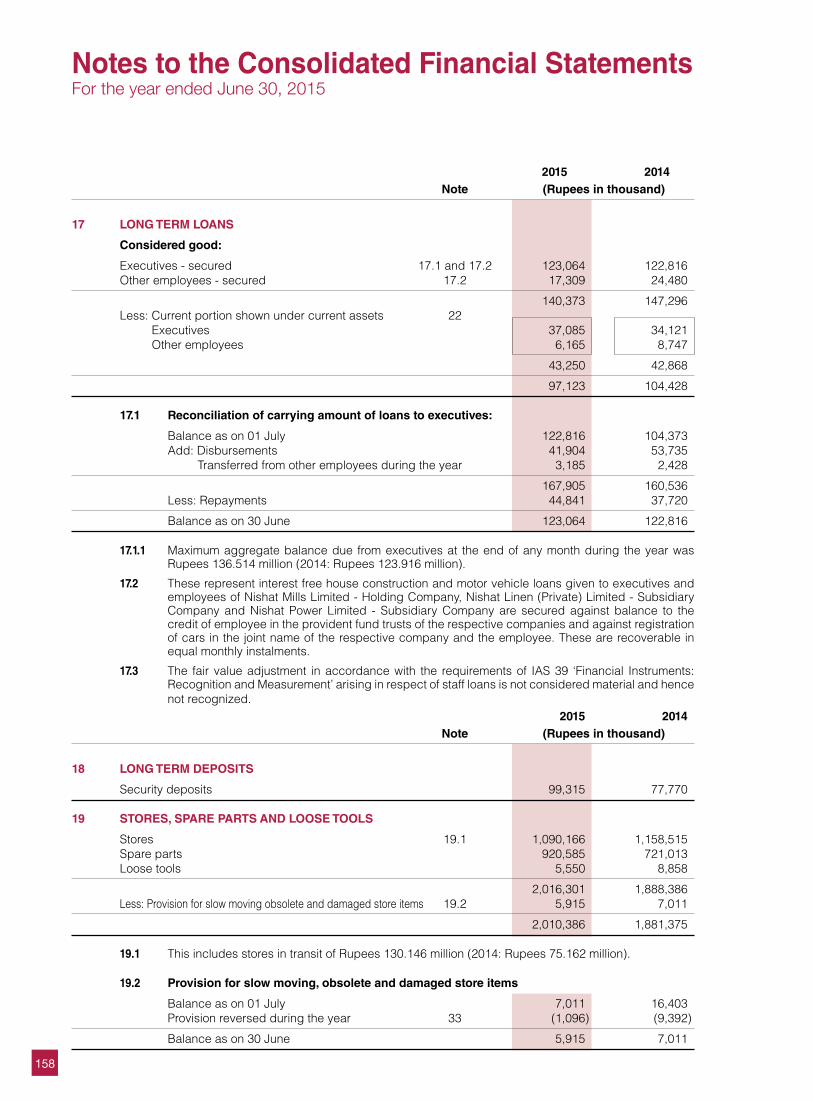
158
2015 2014 Note (Rupees in thousand)
17 LONG TERM LOANS
Considered good:
Executives - secured 17.1 and 17.2 123,064 122,816 Other employees - secured 17.2 17,309 24,480
140,373 147,296 Less: Current portion shown under current assets 22
Executives 37,085 34,121 Other employees 6,165 8,747
43,250 42,868
97,123 104,428 17.1 Reconciliation of carrying amount of loans to executives:
Balance as on 01 July 122,816 104,373 Add: Disbursements 41,904 53,735 Transferred from other employees during the year 3,185 2,428
167,905 160,536 Less: Repayments 44,841 37,720
Balance as on 30 June 123,064 122,816 17.1.1 Maximum aggregate balance due from executives at the end of any month during the year was
Rupees 136.514 million (2014: Rupees 123.916 million).
17.2 These represent interest free house construction and motor vehicle loans given to executives and employees of Nishat Mills Limited - Holding Company, Nishat Linen (Private) Limited - Subsidiary Company and Nishat Power Limited - Subsidiary Company are secured against balance to the credit of employee in the provident fund trusts of the respective companies and against registration of cars in the joint name of the respective company and the employee. These are recoverable in equal monthly instalments.
17.3 The fair value adjustment in accordance with the requirements of IAS 39 ‘Financial Instruments: Recognition and Measurement’ arising in respect of staff loans is not considered material and hence not recognized.
2015 2014 Note (Rupees in thousand)
18 LONG TERM DEPOSITS
Security deposits 99,315 77,770
19 STORES, SPARE PARTS AND LOOSE TOOLS
Stores 19.1 1,090,166 1,158,515 Spare parts 920,585 721,013 Loose tools 5,550 8,858
2,016,301 1,888,386 Less: Provision for slow moving obsolete and damaged store items 19.2 5,915 7,011
2,010,386 1,881,375
19.1 This includes stores in transit of Rupees 130.146 million (2014: Rupees 75.162 million). 19.2 Provision for slow moving, obsolete and damaged store items
Balance as on 01 July 7,011 16,403 Provision reversed during the year 33 (1,096) (9,392)
Balance as on 30 June 5,915 7,011
Notes to the Consolidated Financial StatementsFor the year ended June 30, 2015
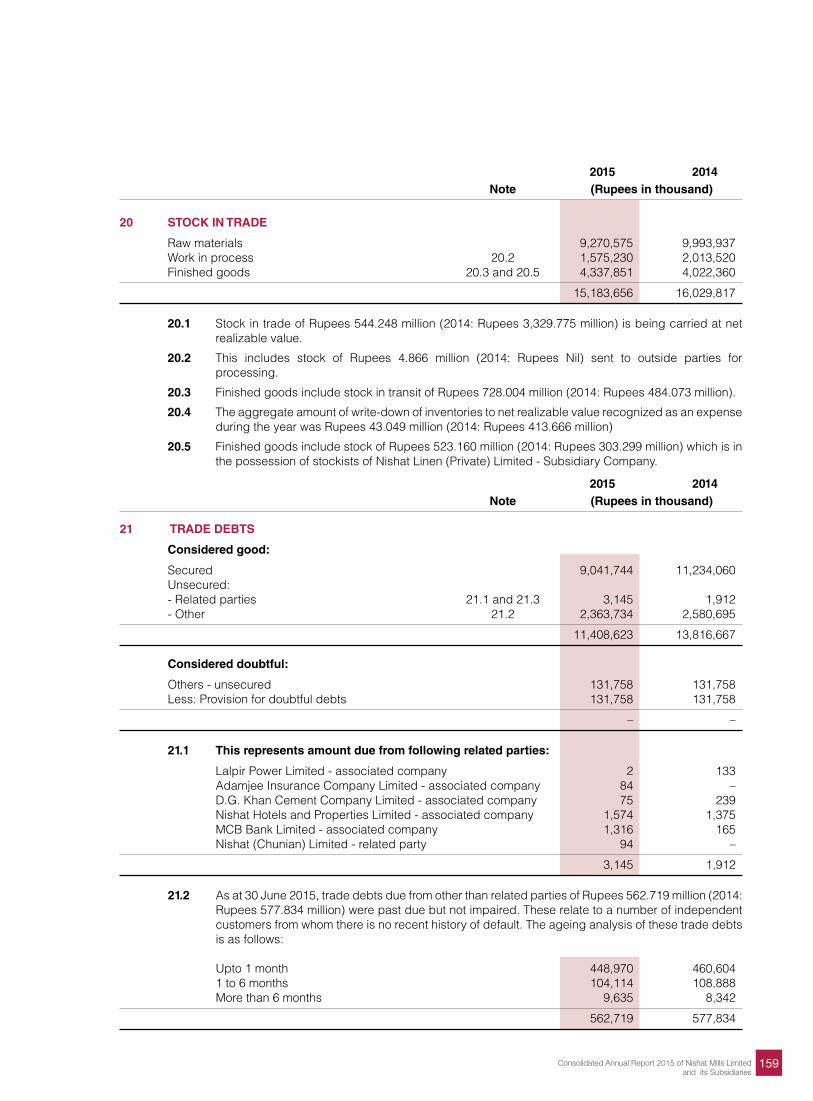
159Consolidated Annual Report 2015 of Nishat Mills Limitedand its Subsidiaries
2015 2014 Note (Rupees in thousand)
20 STOCK IN TRADE
Raw materials 9,270,575 9,993,937 Work in process 20.2 1,575,230 2,013,520 Finished goods 20.3 and 20.5 4,337,851 4,022,360
15,183,656 16,029,817 20.1 Stock in trade of Rupees 544.248 million (2014: Rupees 3,329.775 million) is being carried at net
realizable value.
20.2 This includes stock of Rupees 4.866 million (2014: Rupees Nil) sent to outside parties for processing.
20.3 Finished goods include stock in transit of Rupees 728.004 million (2014: Rupees 484.073 million).
20.4 The aggregate amount of write-down of inventories to net realizable value recognized as an expense during the year was Rupees 43.049 million (2014: Rupees 413.666 million)
20.5 Finished goods include stock of Rupees 523.160 million (2014: Rupees 303.299 million) which is in the possession of stockists of Nishat Linen (Private) Limited - Subsidiary Company.
2015 2014 Note (Rupees in thousand)
21 TRADE DEBTS
Considered good:
Secured 9,041,744 11,234,060 Unsecured: - Related parties 21.1 and 21.3 3,145 1,912 - Other 21.2 2,363,734 2,580,695
11,408,623 13,816,667
Considered doubtful:
Others - unsecured 131,758 131,758 Less: Provision for doubtful debts 131,758 131,758
– – 21.1 This represents amount due from following related parties:
Lalpir Power Limited - associated company 2 133 Adamjee Insurance Company Limited - associated company 84 – D.G. Khan Cement Company Limited - associated company 75 239 Nishat Hotels and Properties Limited - associated company 1,574 1,375 MCB Bank Limited - associated company 1,316 165 Nishat (Chunian) Limited - related party 94 –
3,145 1,912 21.2 As at 30 June 2015, trade debts due from other than related parties of Rupees 562.719 million (2014:
Rupees 577.834 million) were past due but not impaired. These relate to a number of independent customers from whom there is no recent history of default. The ageing analysis of these trade debts is as follows:
Upto 1 month 448,970 460,604 1 to 6 months 104,114 108,888 More than 6 months 9,635 8,342
562,719 577,834
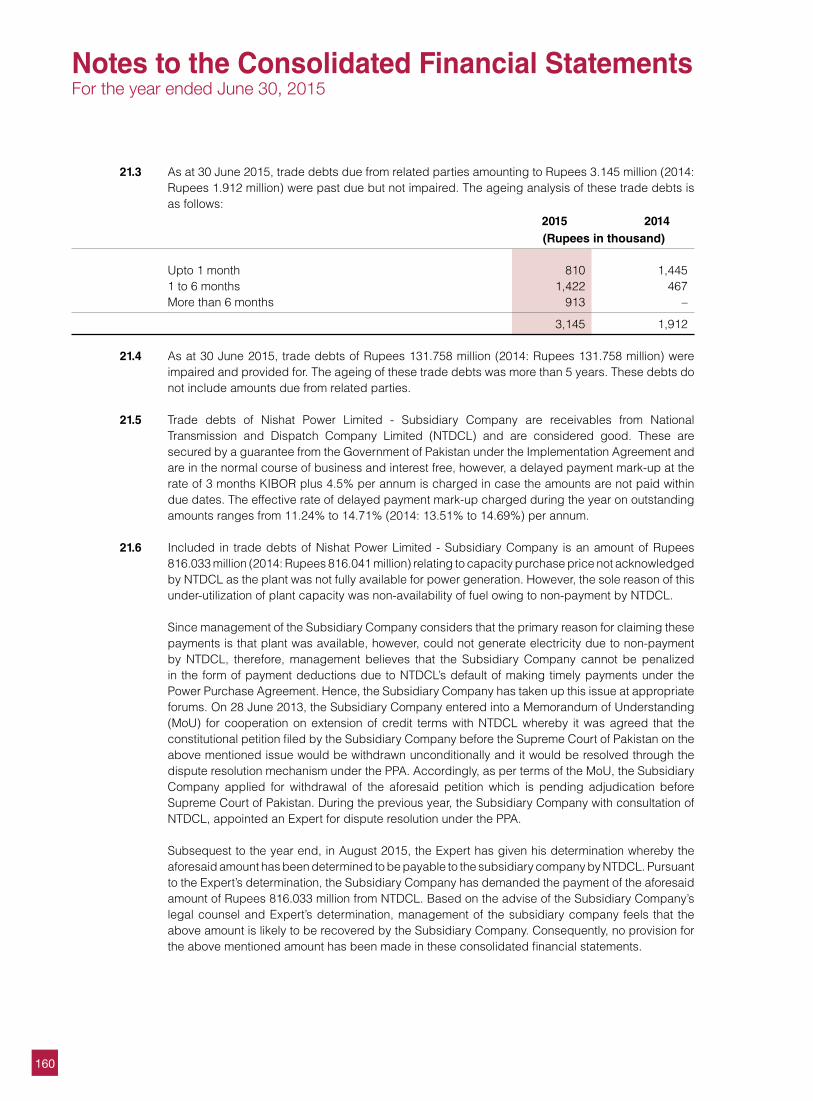
160
21.3 As at 30 June 2015, trade debts due from related parties amounting to Rupees 3.145 million (2014: Rupees 1.912 million) were past due but not impaired. The ageing analysis of these trade debts is as follows:
2015 2014 (Rupees in thousand)
Upto 1 month 810 1,445 1 to 6 months 1,422 467 More than 6 months 913 –
3,145 1,912 21.4 As at 30 June 2015, trade debts of Rupees 131.758 million (2014: Rupees 131.758 million) were
impaired and provided for. The ageing of these trade debts was more than 5 years. These debts do not include amounts due from related parties.
21.5 Trade debts of Nishat Power Limited - Subsidiary Company are receivables from National
Transmission and Dispatch Company Limited (NTDCL) and are considered good. These are secured by a guarantee from the Government of Pakistan under the Implementation Agreement and are in the normal course of business and interest free, however, a delayed payment mark-up at the rate of 3 months KIBOR plus 4.5% per annum is charged in case the amounts are not paid within due dates. The effective rate of delayed payment mark-up charged during the year on outstanding amounts ranges from 11.24% to 14.71% (2014: 13.51% to 14.69%) per annum.
21.6 Included in trade debts of Nishat Power Limited - Subsidiary Company is an amount of Rupees
816.033 million (2014: Rupees 816.041 million) relating to capacity purchase price not acknowledged by NTDCL as the plant was not fully available for power generation. However, the sole reason of this under-utilization of plant capacity was non-availability of fuel owing to non-payment by NTDCL.
Since management of the Subsidiary Company considers that the primary reason for claiming these
payments is that plant was available, however, could not generate electricity due to non-payment by NTDCL, therefore, management believes that the Subsidiary Company cannot be penalized in the form of payment deductions due to NTDCL’s default of making timely payments under the Power Purchase Agreement. Hence, the Subsidiary Company has taken up this issue at appropriate forums. On 28 June 2013, the Subsidiary Company entered into a Memorandum of Understanding (MoU) for cooperation on extension of credit terms with NTDCL whereby it was agreed that the constitutional petition filed by the Subsidiary Company before the Supreme Court of Pakistan on the above mentioned issue would be withdrawn unconditionally and it would be resolved through the dispute resolution mechanism under the PPA. Accordingly, as per terms of the MoU, the Subsidiary Company applied for withdrawal of the aforesaid petition which is pending adjudication before Supreme Court of Pakistan. During the previous year, the Subsidiary Company with consultation of NTDCL, appointed an Expert for dispute resolution under the PPA.
Subsequest to the year end, in August 2015, the Expert has given his determination whereby the
aforesaid amount has been determined to be payable to the subsidiary company by NTDCL. Pursuant to the Expert’s determination, the Subsidiary Company has demanded the payment of the aforesaid amount of Rupees 816.033 million from NTDCL. Based on the advise of the Subsidiary Company’s legal counsel and Expert’s determination, management of the subsidiary company feels that the above amount is likely to be recovered by the Subsidiary Company. Consequently, no provision for the above mentioned amount has been made in these consolidated financial statements.
Notes to the Consolidated Financial StatementsFor the year ended June 30, 2015
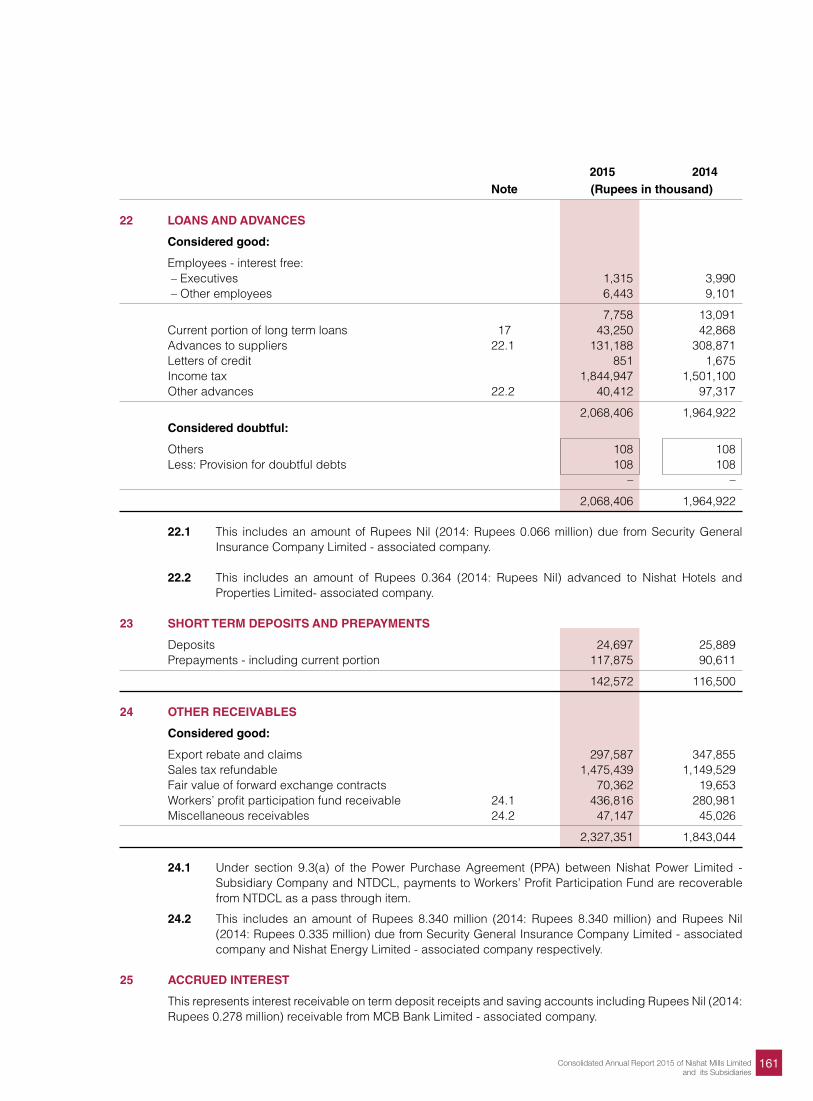
161Consolidated Annual Report 2015 of Nishat Mills Limitedand its Subsidiaries
2015 2014 Note (Rupees in thousand)
22 LOANS AND ADVANCES
Considered good:
Employees - interest free: – Executives 1,315 3,990 – Other employees 6,443 9,101
7,758 13,091 Current portion of long term loans 17 43,250 42,868 Advances to suppliers 22.1 131,188 308,871 Letters of credit 851 1,675 Income tax 1,844,947 1,501,100 Other advances 22.2 40,412 97,317
2,068,406 1,964,922 Considered doubtful:
Others 108 108 Less: Provision for doubtful debts 108 108 – –
2,068,406 1,964,922 22.1 This includes an amount of Rupees Nil (2014: Rupees 0.066 million) due from Security General
Insurance Company Limited - associated company. 22.2 This includes an amount of Rupees 0.364 (2014: Rupees Nil) advanced to Nishat Hotels and
Properties Limited- associated company.
23 SHORT TERM DEPOSITS AND PREPAYMENTS
Deposits 24,697 25,889 Prepayments - including current portion 117,875 90,611
142,572 116,500
24 OTHER RECEIVABLES
Considered good:
Export rebate and claims 297,587 347,855 Sales tax refundable 1,475,439 1,149,529 Fair value of forward exchange contracts 70,362 19,653 Workers’ profit participation fund receivable 24.1 436,816 280,981 Miscellaneous receivables 24.2 47,147 45,026
2,327,351 1,843,044 24.1 Under section 9.3(a) of the Power Purchase Agreement (PPA) between Nishat Power Limited -
Subsidiary Company and NTDCL, payments to Workers’ Profit Participation Fund are recoverable from NTDCL as a pass through item.
24.2 This includes an amount of Rupees 8.340 million (2014: Rupees 8.340 million) and Rupees Nil (2014: Rupees 0.335 million) due from Security General Insurance Company Limited - associated company and Nishat Energy Limited - associated company respectively.
25 ACCRUED INTEREST
This represents interest receivable on term deposit receipts and saving accounts including Rupees Nil (2014: Rupees 0.278 million) receivable from MCB Bank Limited - associated company.
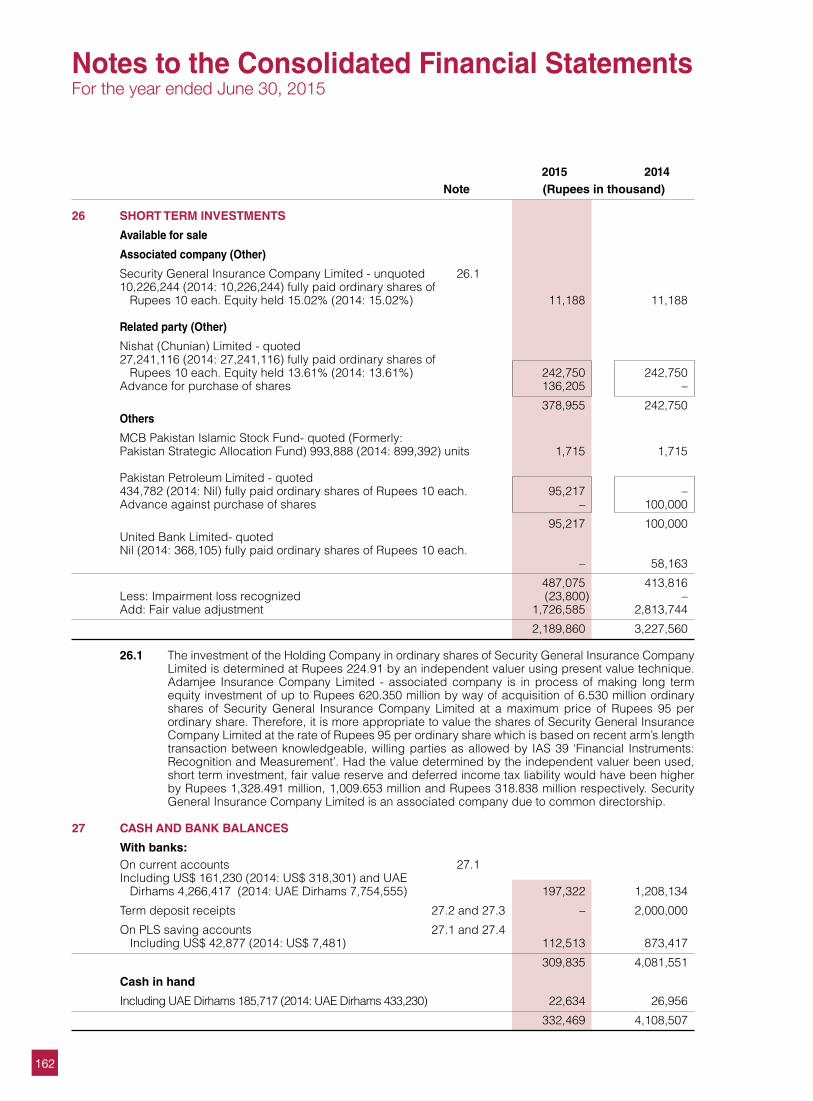
162
2015 2014 Note (Rupees in thousand)
26 SHORT TERM INVESTMENTS
Available for sale
Associated company (Other)
Security General Insurance Company Limited - unquoted 26.1 10,226,244 (2014: 10,226,244) fully paid ordinary shares of Rupees 10 each. Equity held 15.02% (2014: 15.02%) 11,188 11,188
Related party (Other)
Nishat (Chunian) Limited - quoted 27,241,116 (2014: 27,241,116) fully paid ordinary shares of Rupees 10 each. Equity held 13.61% (2014: 13.61%) 242,750 242,750 Advance for purchase of shares 136,205 –
378,955 242,750 Others
MCB Pakistan Islamic Stock Fund- quoted (Formerly: Pakistan Strategic Allocation Fund) 993,888 (2014: 899,392) units 1,715 1,715 Pakistan Petroleum Limited - quoted 434,782 (2014: Nil) fully paid ordinary shares of Rupees 10 each. 95,217 –Advance against purchase of shares – 100,000
95,217 100,000 United Bank Limited- quoted Nil (2014: 368,105) fully paid ordinary shares of Rupees 10 each. – 58,163
487,075 413,816 Less: Impairment loss recognized (23,800) –Add: Fair value adjustment 1,726,585 2,813,744
2,189,860 3,227,560 26.1 The investment of the Holding Company in ordinary shares of Security General Insurance Company
Limited is determined at Rupees 224.91 by an independent valuer using present value technique. Adamjee Insurance Company Limited - associated company is in process of making long term equity investment of up to Rupees 620.350 million by way of acquisition of 6.530 million ordinary shares of Security General Insurance Company Limited at a maximum price of Rupees 95 per ordinary share. Therefore, it is more appropriate to value the shares of Security General Insurance Company Limited at the rate of Rupees 95 per ordinary share which is based on recent arm’s length transaction between knowledgeable, willing parties as allowed by IAS 39 ‘Financial Instruments: Recognition and Measurement’. Had the value determined by the independent valuer been used, short term investment, fair value reserve and deferred income tax liability would have been higher by Rupees 1,328.491 million, 1,009.653 million and Rupees 318.838 million respectively. Security General Insurance Company Limited is an associated company due to common directorship.
27 CASH AND BANK BALANCES
With banks:On current accounts 27.1 Including US$ 161,230 (2014: US$ 318,301) and UAE Dirhams 4,266,417 (2014: UAE Dirhams 7,754,555) 197,322 1,208,134
Term deposit receipts 27.2 and 27.3 – 2,000,000
On PLS saving accounts 27.1 and 27.4 Including US$ 42,877 (2014: US$ 7,481) 112,513 873,417
309,835 4,081,551
Cash in hand
Including UAE Dirhams 185,717 (2014: UAE Dirhams 433,230) 22,634 26,956
332,469 4,108,507
Notes to the Consolidated Financial StatementsFor the year ended June 30, 2015
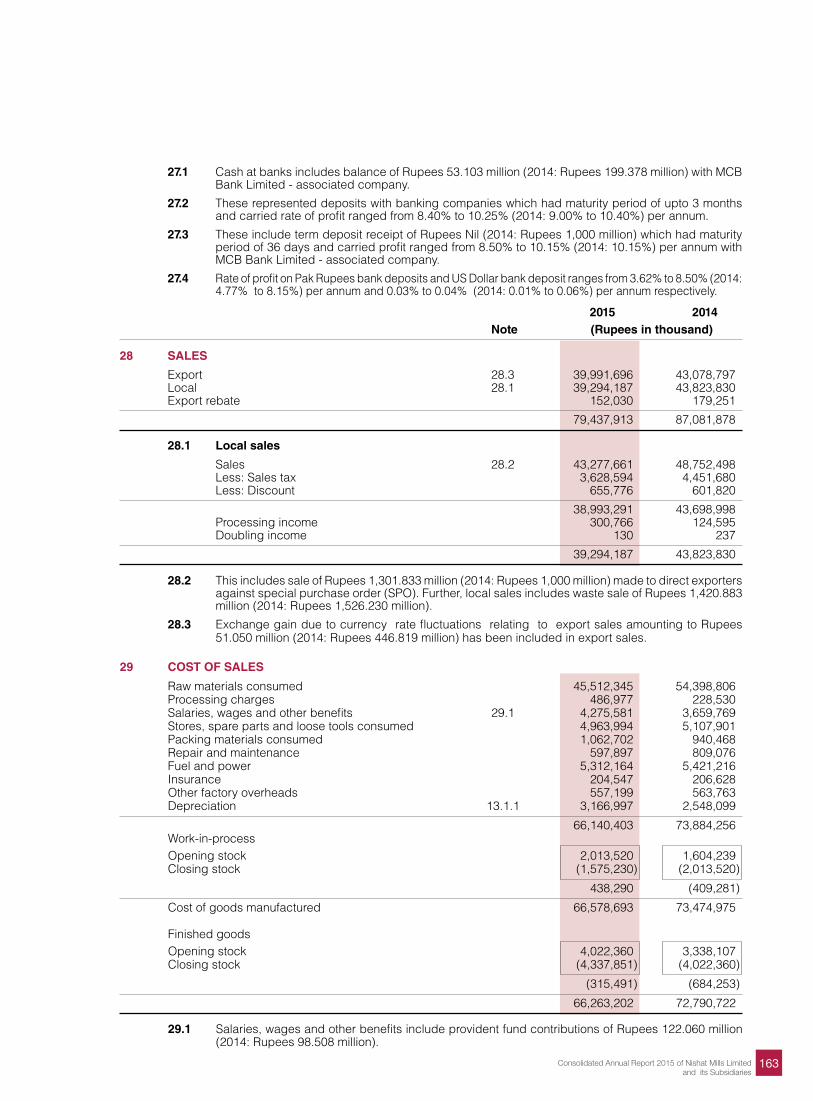
163Consolidated Annual Report 2015 of Nishat Mills Limitedand its Subsidiaries
27.1 Cash at banks includes balance of Rupees 53.103 million (2014: Rupees 199.378 million) with MCB Bank Limited - associated company.
27.2 These represented deposits with banking companies which had maturity period of upto 3 months and carried rate of profit ranged from 8.40% to 10.25% (2014: 9.00% to 10.40%) per annum.
27.3 These include term deposit receipt of Rupees Nil (2014: Rupees 1,000 million) which had maturity period of 36 days and carried profit ranged from 8.50% to 10.15% (2014: 10.15%) per annum with MCB Bank Limited - associated company.
27.4 Rate of profit on Pak Rupees bank deposits and US Dollar bank deposit ranges from 3.62% to 8.50% (2014: 4.77% to 8.15%) per annum and 0.03% to 0.04% (2014: 0.01% to 0.06%) per annum respectively.
2015 2014 Note (Rupees in thousand)
28 SALES
Export 28.3 39,991,696 43,078,797 Local 28.1 39,294,187 43,823,830 Export rebate 152,030 179,251
79,437,913 87,081,878 28.1 Local sales
Sales 28.2 43,277,661 48,752,498 Less: Sales tax 3,628,594 4,451,680 Less: Discount 655,776 601,820
38,993,291 43,698,998 Processing income 300,766 124,595 Doubling income 130 237
39,294,187 43,823,830 28.2 This includes sale of Rupees 1,301.833 million (2014: Rupees 1,000 million) made to direct exporters
against special purchase order (SPO). Further, local sales includes waste sale of Rupees 1,420.883 million (2014: Rupees 1,526.230 million).
28.3 Exchange gain due to currency rate fluctuations relating to export sales amounting to Rupees 51.050 million (2014: Rupees 446.819 million) has been included in export sales.
29 COST OF SALES
Raw materials consumed 45,512,345 54,398,806 Processing charges 486,977 228,530 Salaries, wages and other benefits 29.1 4,275,581 3,659,769 Stores, spare parts and loose tools consumed 4,963,994 5,107,901 Packing materials consumed 1,062,702 940,468 Repair and maintenance 597,897 809,076 Fuel and power 5,312,164 5,421,216 Insurance 204,547 206,628 Other factory overheads 557,199 563,763 Depreciation 13.1.1 3,166,997 2,548,099
66,140,403 73,884,256 Work-in-process Opening stock 2,013,520 1,604,239 Closing stock (1,575,230) (2,013,520)
438,290 (409,281)
Cost of goods manufactured 66,578,693 73,474,975
Finished goods Opening stock 4,022,360 3,338,107 Closing stock (4,337,851) (4,022,360)
(315,491) (684,253)
66,263,202 72,790,722 29.1 Salaries, wages and other benefits include provident fund contributions of Rupees 122.060 million
(2014: Rupees 98.508 million).
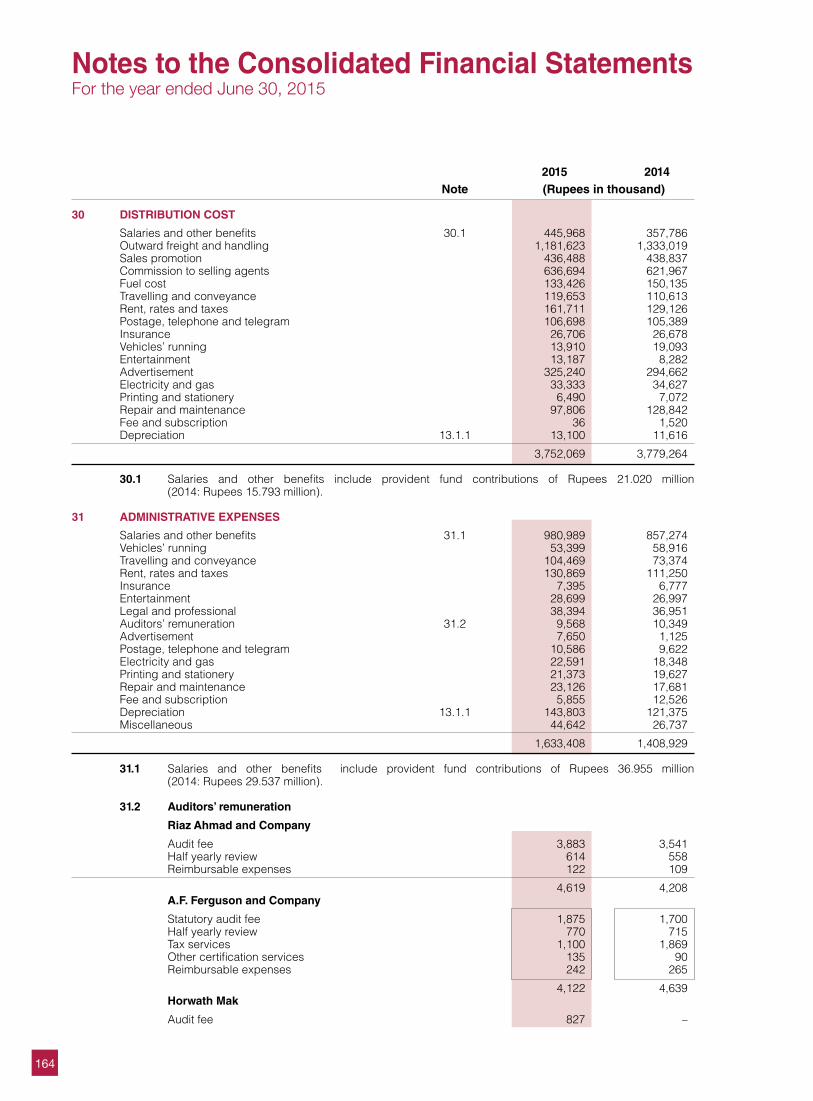
164
2015 2014 Note (Rupees in thousand)
30 DISTRIBUTION COST
Salaries and other benefits 30.1 445,968 357,786 Outward freight and handling 1,181,623 1,333,019 Sales promotion 436,488 438,837 Commission to selling agents 636,694 621,967 Fuel cost 133,426 150,135 Travelling and conveyance 119,653 110,613 Rent, rates and taxes 161,711 129,126 Postage, telephone and telegram 106,698 105,389 Insurance 26,706 26,678 Vehicles’ running 13,910 19,093 Entertainment 13,187 8,282 Advertisement 325,240 294,662 Electricity and gas 33,333 34,627 Printing and stationery 6,490 7,072 Repair and maintenance 97,806 128,842 Fee and subscription 36 1,520 Depreciation 13.1.1 13,100 11,616
3,752,069 3,779,264
30.1 Salaries and other benefits include provident fund contributions of Rupees 21.020 million (2014: Rupees 15.793 million).
31 ADMINISTRATIVE EXPENSES
Salaries and other benefits 31.1 980,989 857,274 Vehicles’ running 53,399 58,916 Travelling and conveyance 104,469 73,374 Rent, rates and taxes 130,869 111,250 Insurance 7,395 6,777 Entertainment 28,699 26,997 Legal and professional 38,394 36,951 Auditors’ remuneration 31.2 9,568 10,349 Advertisement 7,650 1,125 Postage, telephone and telegram 10,586 9,622 Electricity and gas 22,591 18,348 Printing and stationery 21,373 19,627 Repair and maintenance 23,126 17,681 Fee and subscription 5,855 12,526 Depreciation 13.1.1 143,803 121,375 Miscellaneous 44,642 26,737
1,633,408 1,408,929 31.1 Salaries and other benefits include provident fund contributions of Rupees 36.955 million
(2014: Rupees 29.537 million).
31.2 Auditors’ remuneration
Riaz Ahmad and Company
Audit fee 3,883 3,541 Half yearly review 614 558 Reimbursable expenses 122 109
4,619 4,208 A.F. Ferguson and Company
Statutory audit fee 1,875 1,700 Half yearly review 770 715 Tax services 1,100 1,869 Other certification services 135 90 Reimbursable expenses 242 265
4,122 4,639 Horwath Mak
Audit fee 827 –
Notes to the Consolidated Financial StatementsFor the year ended June 30, 2015
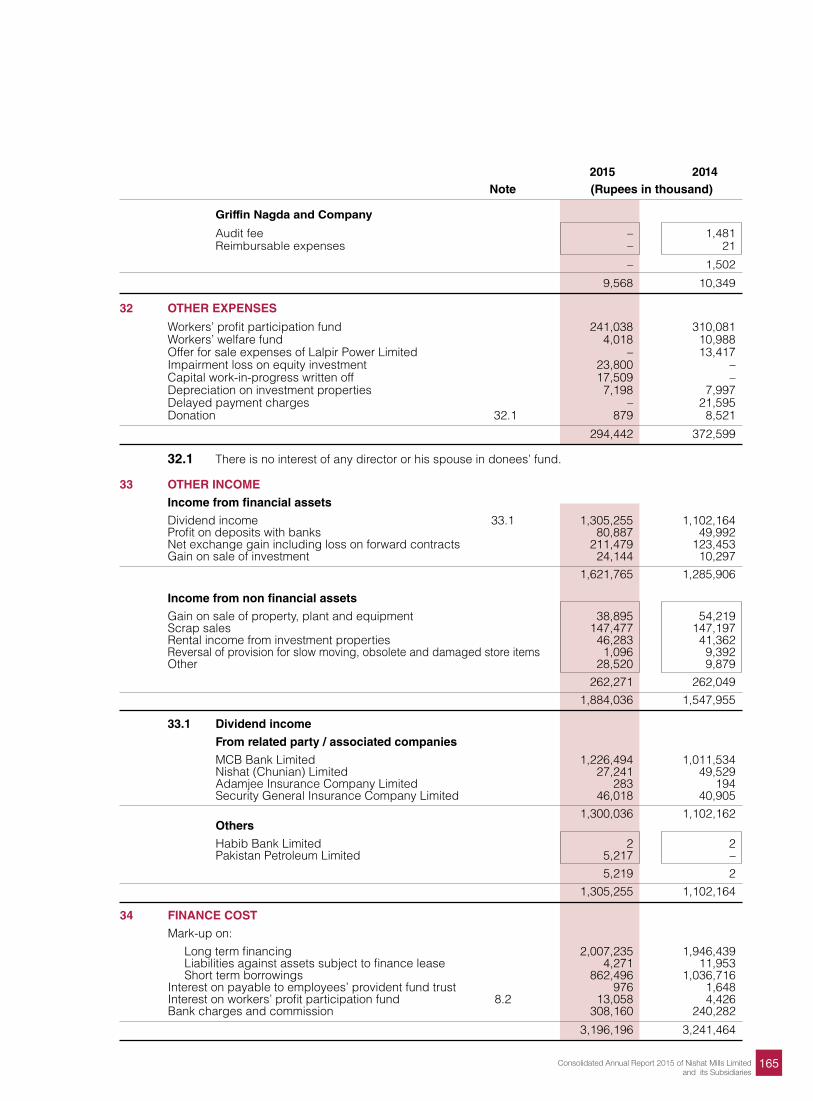
165Consolidated Annual Report 2015 of Nishat Mills Limitedand its Subsidiaries
2015 2014 Note (Rupees in thousand)
Griffin Nagda and Company
Audit fee – 1,481 Reimbursable expenses – 21
– 1,502
9,568 10,349
32 OTHER EXPENSES
Workers’ profit participation fund 241,038 310,081 Workers’ welfare fund 4,018 10,988 Offer for sale expenses of Lalpir Power Limited – 13,417 Impairment loss on equity investment 23,800 –Capital work-in-progress written off 17,509 – Depreciation on investment properties 7,198 7,997 Delayed payment charges – 21,595 Donation 32.1 879 8,521
294,442 372,599
32.1 There is no interest of any director or his spouse in donees’ fund.
33 OTHER INCOME
Income from financial assets
Dividend income 33.1 1,305,255 1,102,164 Profit on deposits with banks 80,887 49,992 Net exchange gain including loss on forward contracts 211,479 123,453 Gain on sale of investment 24,144 10,297 1,621,765 1,285,906
Income from non financial assets Gain on sale of property, plant and equipment 38,895 54,219 Scrap sales 147,477 147,197 Rental income from investment properties 46,283 41,362 Reversal of provision for slow moving, obsolete and damaged store items 1,096 9,392 Other 28,520 9,879 262,271 262,049 1,884,036 1,547,955 33.1 Dividend income
From related party / associated companies
MCB Bank Limited 1,226,494 1,011,534 Nishat (Chunian) Limited 27,241 49,529 Adamjee Insurance Company Limited 283 194 Security General Insurance Company Limited 46,018 40,905 1,300,036 1,102,162 Others Habib Bank Limited 2 2 Pakistan Petroleum Limited 5,217 – 5,219 2 1,305,255 1,102,164
34 FINANCE COST
Mark-up on: Long term financing 2,007,235 1,946,439 Liabilities against assets subject to finance lease 4,271 11,953 Short term borrowings 862,496 1,036,716 Interest on payable to employees’ provident fund trust 976 1,648Interest on workers’ profit participation fund 8.2 13,058 4,426 Bank charges and commission 308,160 240,282
3,196,196 3,241,464
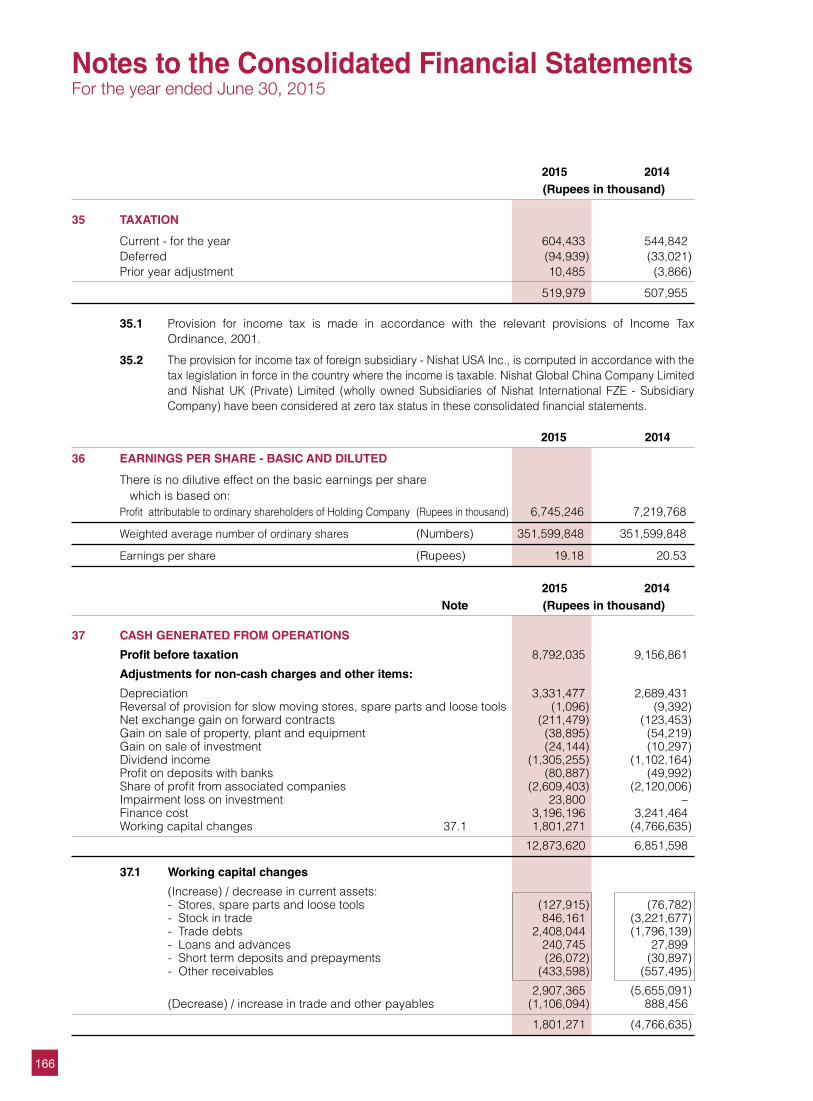
166
2015 2014 (Rupees in thousand)
35 TAXATION
Current - for the year 604,433 544,842 Deferred (94,939) (33,021)Prior year adjustment 10,485 (3,866)
519,979 507,955 35.1 Provision for income tax is made in accordance with the relevant provisions of Income Tax
Ordinance, 2001.
35.2 The provision for income tax of foreign subsidiary - Nishat USA Inc., is computed in accordance with the tax legislation in force in the country where the income is taxable. Nishat Global China Company Limited and Nishat UK (Private) Limited (wholly owned Subsidiaries of Nishat International FZE - Subsidiary Company) have been considered at zero tax status in these consolidated financial statements.
2015 2014
36 EARNINGS PER SHARE - BASIC AND DILUTED
There is no dilutive effect on the basic earnings per share which is based on:
Profit attributable to ordinary shareholders of Holding Company (Rupees in thousand) 6,745,246 7,219,768
Weighted average number of ordinary shares (Numbers) 351,599,848 351,599,848
Earnings per share (Rupees) 19.18 20.53 2015 2014 Note (Rupees in thousand)
37 CASH GENERATED FROM OPERATIONS
Profit before taxation 8,792,035 9,156,861
Adjustments for non-cash charges and other items:
Depreciation 3,331,477 2,689,431 Reversal of provision for slow moving stores, spare parts and loose tools (1,096) (9,392)Net exchange gain on forward contracts (211,479) (123,453)Gain on sale of property, plant and equipment (38,895) (54,219)Gain on sale of investment (24,144) (10,297)Dividend income (1,305,255) (1,102,164)Profit on deposits with banks (80,887) (49,992)Share of profit from associated companies (2,609,403) (2,120,006)Impairment loss on investment 23,800 –Finance cost 3,196,196 3,241,464 Working capital changes 37.1 1,801,271 (4,766,635)
12,873,620 6,851,598
37.1 Working capital changes
(Increase) / decrease in current assets: - Stores, spare parts and loose tools (127,915) (76,782) - Stock in trade 846,161 (3,221,677) - Trade debts 2,408,044 (1,796,139) - Loans and advances 240,745 27,899 - Short term deposits and prepayments (26,072) (30,897) - Other receivables (433,598) (557,495)
2,907,365 (5,655,091) (Decrease) / increase in trade and other payables (1,106,094) 888,456
1,801,271 (4,766,635)
Notes to the Consolidated Financial StatementsFor the year ended June 30, 2015

167Consolidated Annual Report 2015 of Nishat Mills Limitedand its Subsidiaries
38 EVENTS AFTER THE REPORTING PERIOD
38.1 The Board of Directors of the Nishat Mills Limited - Holding Company has proposed a cash dividend for the year ended 30 June 2015 of Rupees 4.50 per share (2014: Rupees 4.00 per share) at their meeting held on 27 October 2015. The Board of Directors also proposed to transfer Rupees 5,163 million (2014: Rupees 5,813 million) from un-appropriated profit to general reserve. However, these events have been considered as non-adjusting events under IAS 10 ‘Events after the Reporting Period’ and have not been recognized in these consolidated financial statements.
38.2 Under Section 5A of the Income Tax Ordinance, 2001, introduced through the Finance Act, 2015, the Holding Company is required to pay tax at the rate of 10% of so much of its undistributed profits as exceed 100% of its paid up capital unless it distributes profits equal to 40% of its after tax profits or 50% of its paid up capital, whichever is less, by due date for filling of income tax return for the tax year 2015. The requisite cash dividend has been proposed by the Boad of Directors of the Holding Company in their meeting held on 27 October 2015 and will be distributed within the prescribed time limit. Therefore, the recognition of any income tax liability in this respect is not considered necessary.
39 REMUNERATION OF CHIEF EXECUTIVE OFFICER, DIRECTORS AND EXECUTIVES The aggregate amount charged in these consolidated financial statements for remuneration including all benefits to Chief Executive Officer, Directors and Executives of the Holding Company is as follows:
Chief Executive Officer Directors Executives
2015 2014 2015 2014 2015 2014
(Rupees in thousand)
Managerial remuneration 19,920 17,521 7,477 8,630 471,568 380,879
Allowances
Cost of living allowance – – 1 7 1,444 900 House rent 7,168 6,400 288 1,200 124,324 98,827 Conveyance – – – – 695 476 Medical 1,792 1,600 675 734 37,154 28,985 Utilities – – 2,382 1,729 55,075 40,235 Special allowance – – 2 2 760 998
Contribution to provident fund – – 644 700 39,553 30,482
Leave encashment – – – – 14,507 9,850
28,880 25,521 11,469 13,002 745,080 591,632
Number of persons 1 1 1 2 369 311
39.1 Chief Executive Officer, one director and certain executives of the Holding Company are provided with Company maintained vehicles and certain executives are also provided with free housing facility alongwith utilities.
39.2 Aggregate amount charged in these consolidated financial statements for meeting fee to one director (2014: one director) of the Holding Company was Rupees 0.300 million (2014: Rupees 0.150 million).
39.3 No remuneration was paid to non-executive directors of the Holding Company.
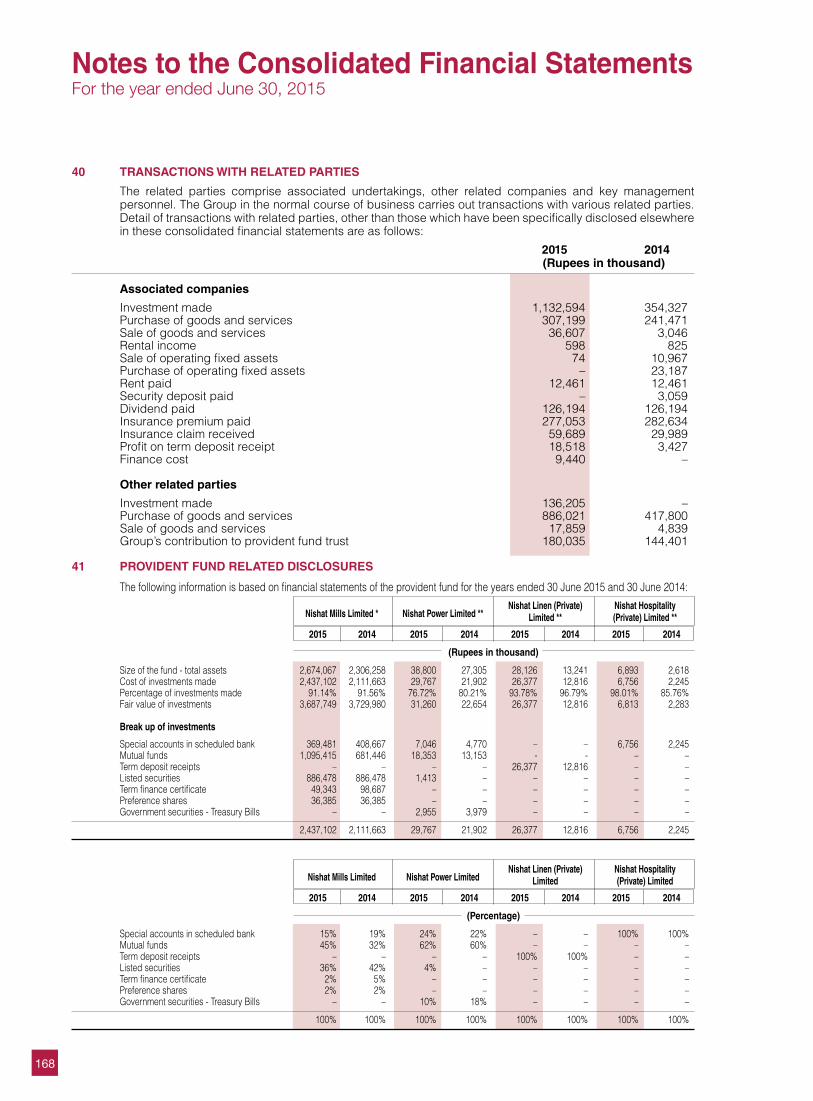
168
40 TRANSACTIONS WITH RELATED PARTIES
The related parties comprise associated undertakings, other related companies and key management personnel. The Group in the normal course of business carries out transactions with various related parties. Detail of transactions with related parties, other than those which have been specifically disclosed elsewhere in these consolidated financial statements are as follows:
2015 2014 (Rupees in thousand)
Associated companies
Investment made 1,132,594 354,327 Purchase of goods and services 307,199 241,471 Sale of goods and services 36,607 3,046 Rental income 598 825 Sale of operating fixed assets 74 10,967 Purchase of operating fixed assets – 23,187 Rent paid 12,461 12,461 Security deposit paid – 3,059 Dividend paid 126,194 126,194 Insurance premium paid 277,053 282,634 Insurance claim received 59,689 29,989 Profit on term deposit receipt 18,518 3,427 Finance cost 9,440 – Other related parties
Investment made 136,205 –Purchase of goods and services 886,021 417,800 Sale of goods and services 17,859 4,839 Group’s contribution to provident fund trust 180,035 144,401
41 PROVIDENT FUND RELATED DISCLOSURES
The following information is based on financial statements of the provident fund for the years ended 30 June 2015 and 30 June 2014:
Nishat Mills Limited * Nishat Power Limited ** Nishat Linen (Private) Nishat Hospitality
Limited ** (Private) Limited **
2015 2014 2015 2014 2015 2014 2015 2014
(Rupees in thousand)
Size of the fund - total assets 2,674,067 2,306,258 38,800 27,305 28,126 13,241 6,893 2,618 Cost of investments made 2,437,102 2,111,663 29,767 21,902 26,377 12,816 6,756 2,245 Percentage of investments made 91.14% 91.56% 76.72% 80.21% 93.78% 96.79% 98.01% 85.76%Fair value of investments 3,687,749 3,729,980 31,260 22,654 26,377 12,816 6,813 2,283 Break up of investments
Special accounts in scheduled bank 369,481 408,667 7,046 4,770 – – 6,756 2,245 Mutual funds 1,095,415 681,446 18,353 13,153 - - – – Term deposit receipts – – – – 26,377 12,816 – – Listed securities 886,478 886,478 1,413 – – – – – Term finance certificate 49,343 98,687 – – – – – – Preference shares 36,385 36,385 – – – – – –Government securities - Treasury Bills – – 2,955 3,979 – – – –
2,437,102 2,111,663 29,767 21,902 26,377 12,816 6,756 2,245
Nishat Mills Limited Nishat Power Limited
Nishat Linen (Private) Nishat Hospitality Limited (Private) Limited
2015 2014 2015 2014 2015 2014 2015 2014
(Percentage)
Special accounts in scheduled bank 15% 19% 24% 22% – – 100% 100%Mutual funds 45% 32% 62% 60% – – – – Term deposit receipts – – – – 100% 100% – –Listed securities 36% 42% 4% – – – – – Term finance certificate 2% 5% – – – – – – Preference shares 2% 2% – – – – – – Government securities - Treasury Bills – – 10% 18% – – – –
100% 100% 100% 100% 100% 100% 100% 100%
Notes to the Consolidated Financial StatementsFor the year ended June 30, 2015
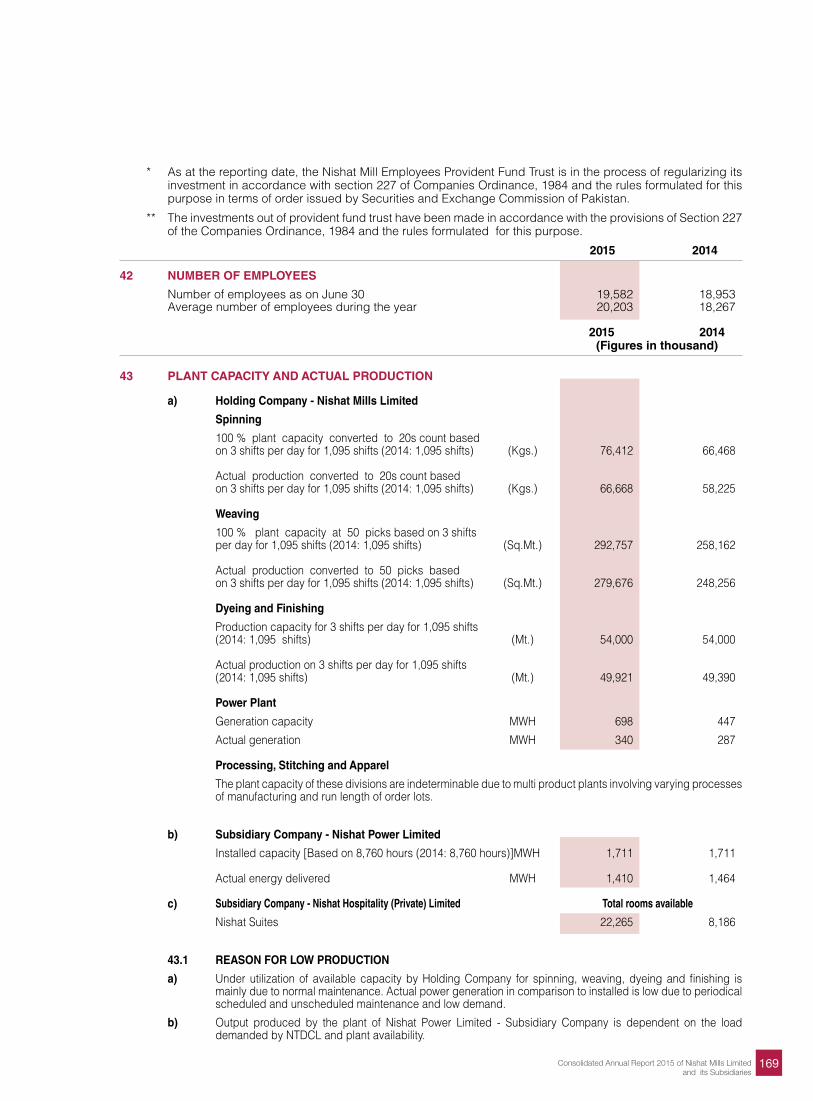
169Consolidated Annual Report 2015 of Nishat Mills Limitedand its Subsidiaries
* As at the reporting date, the Nishat Mill Employees Provident Fund Trust is in the process of regularizing its investment in accordance with section 227 of Companies Ordinance, 1984 and the rules formulated for this purpose in terms of order issued by Securities and Exchange Commission of Pakistan.
** The investments out of provident fund trust have been made in accordance with the provisions of Section 227 of the Companies Ordinance, 1984 and the rules formulated for this purpose.
2015 2014
42 NUMBER OF EMPLOYEES
Number of employees as on June 30 19,582 18,953 Average number of employees during the year 20,203 18,267
2015 2014 (Figures in thousand)
43 PLANT CAPACITY AND ACTUAL PRODUCTION
a) Holding Company - Nishat Mills Limited
Spinning
100 % plant capacity converted to 20s count based on 3 shifts per day for 1,095 shifts (2014: 1,095 shifts) (Kgs.) 76,412 66,468 Actual production converted to 20s count based on 3 shifts per day for 1,095 shifts (2014: 1,095 shifts) (Kgs.) 66,668 58,225 Weaving
100 % plant capacity at 50 picks based on 3 shifts per day for 1,095 shifts (2014: 1,095 shifts) (Sq.Mt.) 292,757 258,162 Actual production converted to 50 picks based on 3 shifts per day for 1,095 shifts (2014: 1,095 shifts) (Sq.Mt.) 279,676 248,256 Dyeing and Finishing
Production capacity for 3 shifts per day for 1,095 shifts (2014: 1,095 shifts) (Mt.) 54,000 54,000 Actual production on 3 shifts per day for 1,095 shifts (2014: 1,095 shifts) (Mt.) 49,921 49,390 Power Plant
Generation capacity MWH 698 447
Actual generation MWH 340 287 Processing, Stitching and Apparel
The plant capacity of these divisions are indeterminable due to multi product plants involving varying processes of manufacturing and run length of order lots.
b) Subsidiary Company - Nishat Power Limited
Installed capacity [Based on 8,760 hours (2014: 8,760 hours)] MWH 1,711 1,711 Actual energy delivered MWH 1,410 1,464 c) Subsidiary Company - Nishat Hospitality (Private) Limited Total rooms available
Nishat Suites 22,265 8,186 43.1 REASON FOR LOW PRODUCTION
a) Under utilization of available capacity by Holding Company for spinning, weaving, dyeing and finishing is mainly due to normal maintenance. Actual power generation in comparison to installed is low due to periodical scheduled and unscheduled maintenance and low demand.
b) Output produced by the plant of Nishat Power Limited - Subsidiary Company is dependent on the load demanded by NTDCL and plant availability.
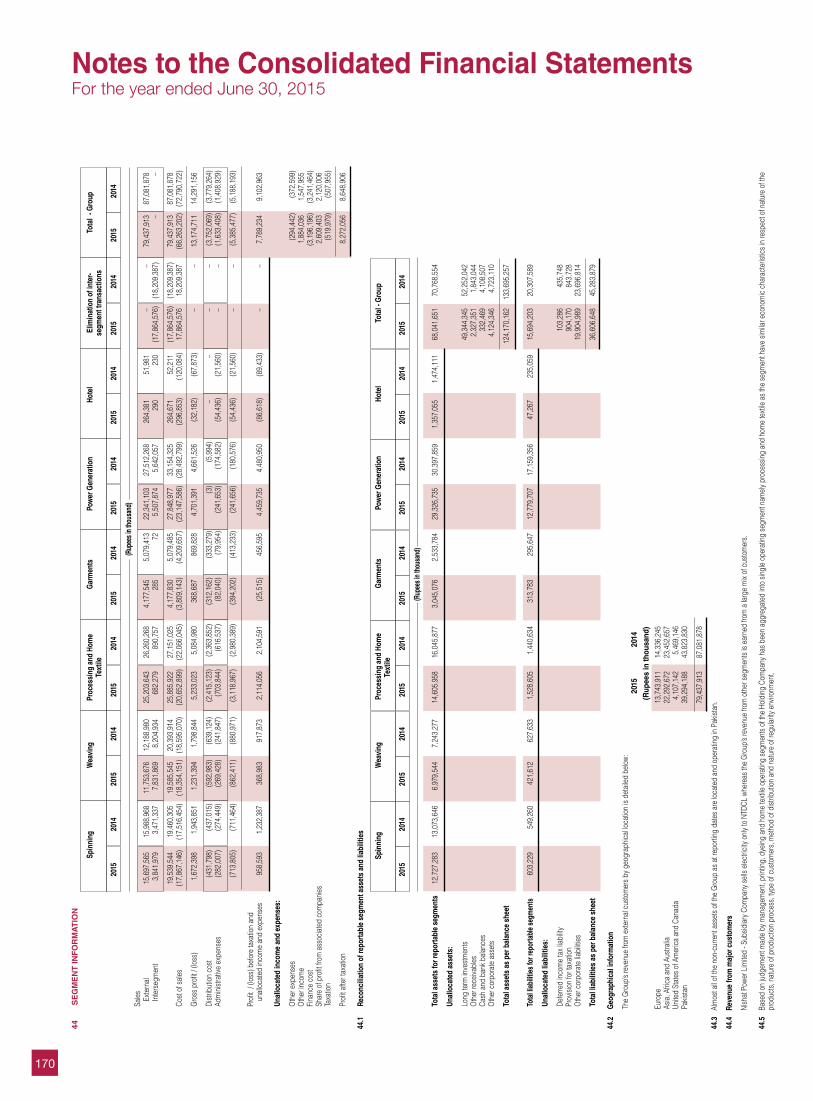
170
44
SE
GM
EN
T IN
FO
RM
AT
ION
S
pinn
ing
W
eavi
ng
Proc
essi
ng a
nd H
ome
Gar
men
ts
Pow
er G
ener
atio
n Ho
tel
Elim
inat
ion
of in
ter-
Tota
l - G
roup
Te
xtile
segm
ent t
rans
actio
ns
20
15
2014
20
15
2014
20
15
2014
20
15
2014
20
15
2014
20
15
2014
20
15
2014
20
15
2014
(R
upee
s in t
hous
and)
Sa
les
Exte
rnal
1
5,69
7,56
5
15,
988,
968
1
1,75
3,67
6
12,
188,
980
2
5,20
3,64
3
26,
260,
268
4
,177
,545
5
,079
,413
2
2,34
1,10
3
27,
512,
268
2
64,3
81
51,
981
–
– 7
9,43
7,91
3
87,
081,
878
Inte
rseg
men
t 3
,841
,979
3
,471
,337
7
,831
,869
8
,204
,934
6
82,2
79
890
,757
2
85
72
5
,507
,874
5
,642
,057
2
90
230
(1
7,86
4,57
6)
(18,
209,
387)
–
–
19,
539,
544
1
9,46
0,30
5
19,
585,
545
2
0,39
3,91
4
25,
885,
922
2
7,15
1,02
5
4,1
77,8
30
5,0
79,4
85
27,
848,
977
3
3,15
4,32
5
264
,671
5
2,21
1
(17,
864,
576)
(1
8,20
9,38
7)
79,
437,
913
8
7,08
1,87
8
Cost
of s
ales
(1
7,86
7,14
6)
(17,
516,
454)
(1
8,35
4,15
1)
(18,
595,
070)
(2
0,65
2,89
9)
(22,
066,
045)
(3
,809
,143
) (4
,209
,657
) (2
3,14
7,58
6)
(28,
492,
799)
(2
96,8
53)
(120
,084
) 1
7,86
4,57
6
18,
209,
387
(6
6,26
3,20
2)
(72,
790,
722)
G
ross
pro
fit /
(loss
) 1
,672
,398
1
,943
,851
1
,231
,394
1
,798
,844
5
,233
,023
5
,084
,980
3
68,6
87
869
,828
4
,701
,391
4
,661
,526
(3
2,18
2)
(67,
873)
–
– 1
3,17
4,71
1
14,
291,
156
Di
strib
utio
n co
st
(431
,798
) (4
37,0
15)
(592
,983
) (6
39,1
24)
(2,4
15,1
23)
(2,3
63,8
52)
(312
,162
) (3
33,2
79)
(3)
(5,9
94)
– –
– –
(3,7
52,0
69)
(3,7
79,2
64)
Ad
min
istra
tive
expe
nses
(2
82,0
07)
(274
,449
) (2
69,4
28)
(241
,847
) (7
03,8
44)
(616
,537
) (8
2,04
0)
(79,
954)
(2
41,6
53)
(174
,582
) (5
4,43
6)
(21,
560)
–
– (1
,633
,408
) (1
,408
,929
)
(713
,805
) (7
11,4
64)
(862
,411
) (8
80,9
71)
(3,1
18,9
67)
(2,9
80,3
89)
(394
,202
) (4
13,2
33)
(241
,656
) (1
80,5
76)
(54,
436)
(2
1,56
0)
– –
(5,3
85,4
77)
(5,1
88,1
93)
Pr
ofit
/ (lo
ss) b
efor
e ta
xatio
n an
d
un
allo
cate
d in
com
e an
d ex
pens
es
958
,593
1
,232
,387
3
68,9
83
917
,873
2
,114
,056
2
,104
,591
(2
5,51
5)
456
,595
4
,459
,735
4
,480
,950
(8
6,61
8)
(89,
433)
–
– 7
,789
,234
9
,102
,963
Unal
loca
ted
inco
me
and
expe
nses
:
O
ther
exp
ense
s
(2
94,4
42)
(372
,599
)
Oth
er in
com
e
1
,884
,036
1
,547
,955
Fina
nce
cost
(3
,196
,196
) (3
,241
,464
)
Shar
e of
pro
fit fr
om a
ssoc
iate
d co
mpa
nies
2
,609
,403
2
,120
,006
Taxa
tion
(519
,979
) (5
07,9
55)
Pr
ofit a
fter t
axat
ion
8,2
72,0
56
8,6
48,9
06
44.1
Re
conc
iliat
ion
of re
porta
ble
segm
ent a
sset
s an
d lia
bilit
ies
Sp
inni
ng
Wea
ving
P
roce
ssin
g an
d Ho
me
G
arm
ents
P
ower
Gen
erat
ion
H
otel
To
tal -
Gro
up
Te
xtile
20
15
2014
20
15
2014
20
15
2014
20
15
2014
20
15
2014
20
15
2014
20
15
2014
(R
upee
s in t
hous
and)
To
tal a
sset
s fo
r rep
orta
ble
segm
ents
1
2,72
7,28
3
13,
073,
646
6
,979
,544
7
,243
,277
1
4,60
5,95
8
16,
045,
877
3
,045
,076
2
,533
,784
2
9,32
6,73
5
30,
397,
859
1
,357
,055
1
,474
,111
6
8,04
1,65
1
70,
768,
554
Un
allo
cate
d as
sets
:
Lo
ng te
rm in
vest
men
ts
49,
344,
345
5
2,25
2,04
2
Oth
er re
ceiva
bles
2
,327
,351
1
,843
,044
Cash
and
ban
k ba
lanc
es
332
,469
4
,108
,507
Oth
er c
orpo
rate
ass
ets
4,1
24,3
46
4,7
23,1
10
To
tal a
sset
s as
per
bal
ance
she
et
124
,170
,162
1
33,6
95,2
57
To
tal l
iabi
litie
s fo
r rep
orta
ble
segm
ents
6
03,2
29
549
,260
4
21,6
12
627
,633
1
,528
,605
1
,440
,634
3
13,7
83
295
,647
1
2,77
9,70
7
17,
159,
356
4
7,26
7
235
,059
1
5,69
4,20
3
20,
307,
589
Un
allo
cate
d lia
bilit
ies:
De
ferre
d in
com
e ta
x lia
bility
1
03,2
86
435
,748
Prov
ision
for t
axat
ion
904
,170
8
43,7
28
O
ther
cor
pora
te lia
biliti
es
19,
904,
989
2
3,69
6,81
4
To
tal l
iabi
litie
s as
per
bal
ance
she
et
36,
606,
648
4
5,28
3,87
9
44.2
G
eogr
aphi
cal i
nfor
mat
ion
Th
e G
roup
’s re
venu
e fro
m e
xter
nal c
usto
mer
s by
geo
grap
hica
l loca
tion
is de
taile
d be
low:
2015
20
14
(Rup
ees
in th
ousa
nd)
Eu
rope
1
3,74
3,91
1
14,
336,
245
Asia
, Afri
ca a
nd A
ustra
lia
22,
292,
672
2
3,45
2,65
7
Un
ited
Stat
es o
f Am
eric
a an
d Ca
nada
4
,107
,142
5
,469
,146
Pakis
tan
39,
294,
188
4
3,82
3,83
0
79,
437,
913
8
7,08
1,87
8
44.3
Al
mos
t all o
f the
non
-cur
rent
ass
ets
of th
e G
roup
as
at re
porti
ng d
ates
are
loca
ted
and
oper
atin
g in
Pak
istan
.
44.4
Re
venu
e fro
m m
ajor
cus
tom
ers
Ni
shat
Pow
er L
imite
d - S
ubsid
iary
Com
pany
sel
ls el
ectri
city
onl
y to
NTD
CL w
here
as th
e G
roup
’s re
venu
e fro
m o
ther
seg
men
ts is
ear
ned
from
a la
rge
mix
of c
usto
mer
s.
44.5
Ba
sed
on ju
dgem
ent m
ade
by m
anag
emen
t, pr
intin
g, d
yein
g an
d ho
me
text
ile o
pera
ting
segm
ents
of t
he H
oldi
ng C
ompa
ny h
as b
een
aggr
egat
ed in
to s
ingl
e op
erat
ing
segm
ent n
amel
y pr
oces
sing
and
hom
e te
xtile
as
the
segm
ent h
ave
simila
r eco
nom
ic c
hara
cter
istic
s in
resp
ect o
f nat
ure
of th
e
pr
oduc
ts, n
atur
e of
pro
duct
ion
proc
ess,
type
of c
usto
mer
s, m
etho
d of
dist
ribut
ion
and
natu
re o
f reg
ular
ity e
nviro
nmen
t.
Notes to the Consolidated Financial StatementsFor the year ended June 30, 2015
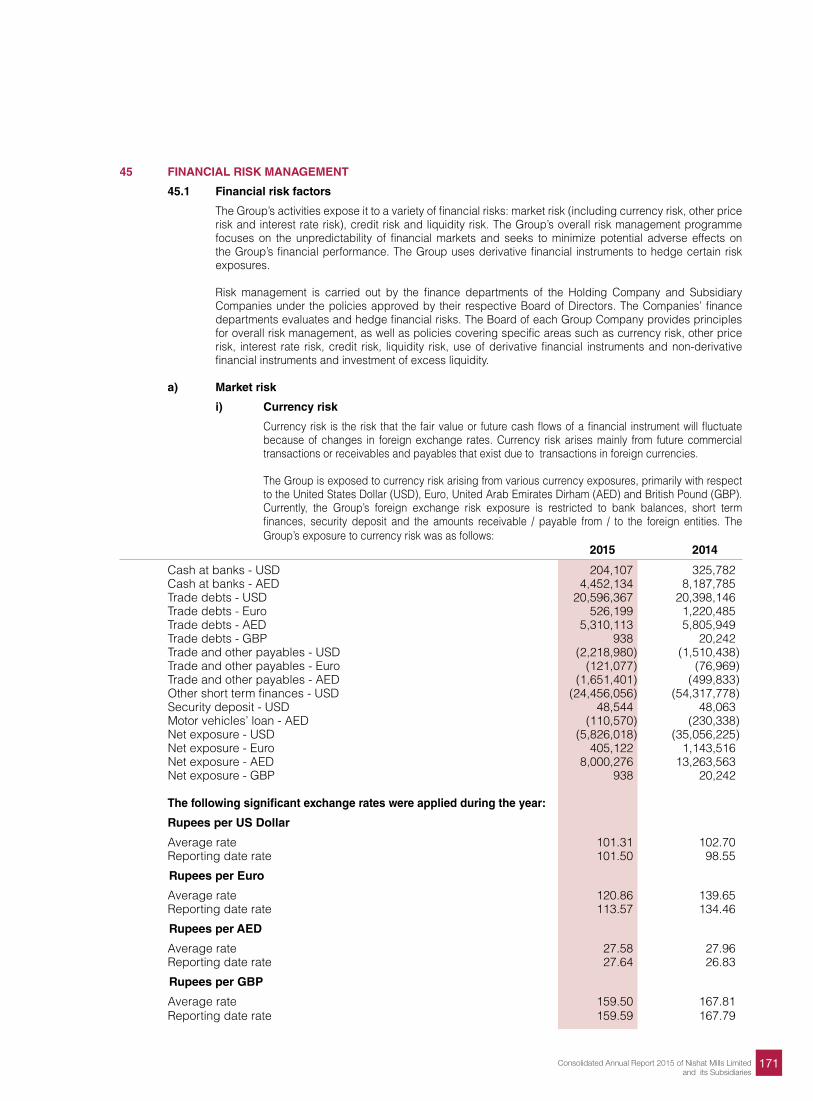
171Consolidated Annual Report 2015 of Nishat Mills Limitedand its Subsidiaries
45 FINANCIAL RISK MANAGEMENT
45.1 Financial risk factors
The Group’s activities expose it to a variety of financial risks: market risk (including currency risk, other price risk and interest rate risk), credit risk and liquidity risk. The Group’s overall risk management programme focuses on the unpredictability of financial markets and seeks to minimize potential adverse effects on the Group’s financial performance. The Group uses derivative financial instruments to hedge certain risk exposures.
Risk management is carried out by the finance departments of the Holding Company and Subsidiary
Companies under the policies approved by their respective Board of Directors. The Companies’ finance departments evaluates and hedge financial risks. The Board of each Group Company provides principles for overall risk management, as well as policies covering specific areas such as currency risk, other price risk, interest rate risk, credit risk, liquidity risk, use of derivative financial instruments and non-derivative financial instruments and investment of excess liquidity.
a) Market risk
i) Currency risk
Currency risk is the risk that the fair value or future cash flows of a financial instrument will fluctuate because of changes in foreign exchange rates. Currency risk arises mainly from future commercial transactions or receivables and payables that exist due to transactions in foreign currencies.
The Group is exposed to currency risk arising from various currency exposures, primarily with respect
to the United States Dollar (USD), Euro, United Arab Emirates Dirham (AED) and British Pound (GBP). Currently, the Group’s foreign exchange risk exposure is restricted to bank balances, short term finances, security deposit and the amounts receivable / payable from / to the foreign entities. The Group’s exposure to currency risk was as follows:
2015 2014
Cash at banks - USD 204,107 325,782 Cash at banks - AED 4,452,134 8,187,785 Trade debts - USD 20,596,367 20,398,146 Trade debts - Euro 526,199 1,220,485 Trade debts - AED 5,310,113 5,805,949 Trade debts - GBP 938 20,242 Trade and other payables - USD (2,218,980) (1,510,438)Trade and other payables - Euro (121,077) (76,969)Trade and other payables - AED (1,651,401) (499,833)Other short term finances - USD (24,456,056) (54,317,778)Security deposit - USD 48,544 48,063 Motor vehicles’ loan - AED (110,570) (230,338)Net exposure - USD (5,826,018) (35,056,225)Net exposure - Euro 405,122 1,143,516 Net exposure - AED 8,000,276 13,263,563 Net exposure - GBP 938 20,242 The following significant exchange rates were applied during the year:
Rupees per US Dollar
Average rate 101.31 102.70 Reporting date rate 101.50 98.55
Rupees per Euro
Average rate 120.86 139.65 Reporting date rate 113.57 134.46
Rupees per AED
Average rate 27.58 27.96Reporting date rate 27.64 26.83
Rupees per GBP
Average rate 159.50 167.81 Reporting date rate 159.59 167.79
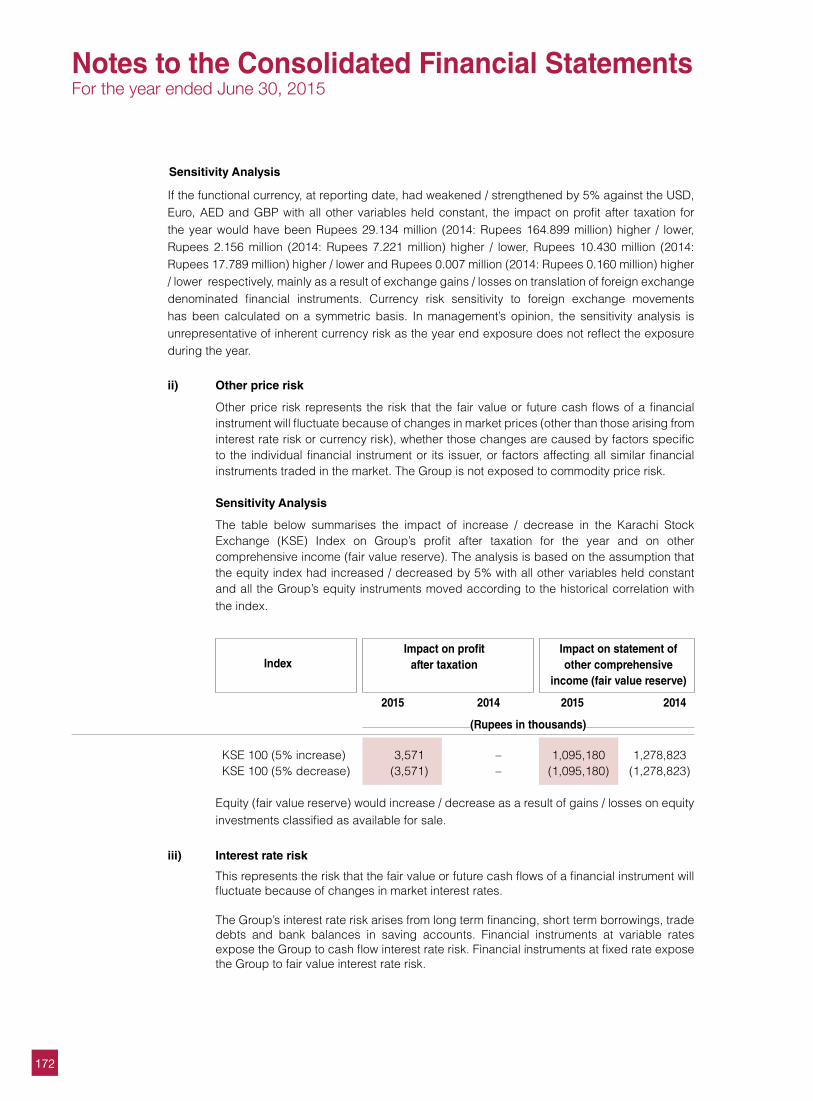
172
Sensitivity Analysis
If the functional currency, at reporting date, had weakened / strengthened by 5% against the USD, Euro, AED and GBP with all other variables held constant, the impact on profit after taxation for the year would have been Rupees 29.134 million (2014: Rupees 164.899 million) higher / lower, Rupees 2.156 million (2014: Rupees 7.221 million) higher / lower, Rupees 10.430 million (2014: Rupees 17.789 million) higher / lower and Rupees 0.007 million (2014: Rupees 0.160 million) higher / lower respectively, mainly as a result of exchange gains / losses on translation of foreign exchange denominated financial instruments. Currency risk sensitivity to foreign exchange movements has been calculated on a symmetric basis. In management’s opinion, the sensitivity analysis is unrepresentative of inherent currency risk as the year end exposure does not reflect the exposure during the year.
ii) Other price risk
Other price risk represents the risk that the fair value or future cash flows of a financial instrument will fluctuate because of changes in market prices (other than those arising from interest rate risk or currency risk), whether those changes are caused by factors specific to the individual financial instrument or its issuer, or factors affecting all similar financial instruments traded in the market. The Group is not exposed to commodity price risk.
Sensitivity Analysis
The table below summarises the impact of increase / decrease in the Karachi Stock Exchange (KSE) Index on Group’s profit after taxation for the year and on other comprehensive income (fair value reserve). The analysis is based on the assumption that the equity index had increased / decreased by 5% with all other variables held constant and all the Group’s equity instruments moved according to the historical correlation with the index.
Index
Impact on profit Impact on statement of after taxation other comprehensive income (fair value reserve)
2015 2014 2015 2014
(Rupees in thousands)
KSE 100 (5% increase) 3,571 – 1,095,180 1,278,823 KSE 100 (5% decrease) (3,571) – (1,095,180) (1,278,823)
Equity (fair value reserve) would increase / decrease as a result of gains / losses on equity
investments classified as available for sale.
iii) Interest rate risk
This represents the risk that the fair value or future cash flows of a financial instrument will fluctuate because of changes in market interest rates.
The Group’s interest rate risk arises from long term financing, short term borrowings, trade debts and bank balances in saving accounts. Financial instruments at variable rates expose the Group to cash flow interest rate risk. Financial instruments at fixed rate expose the Group to fair value interest rate risk.
Notes to the Consolidated Financial StatementsFor the year ended June 30, 2015
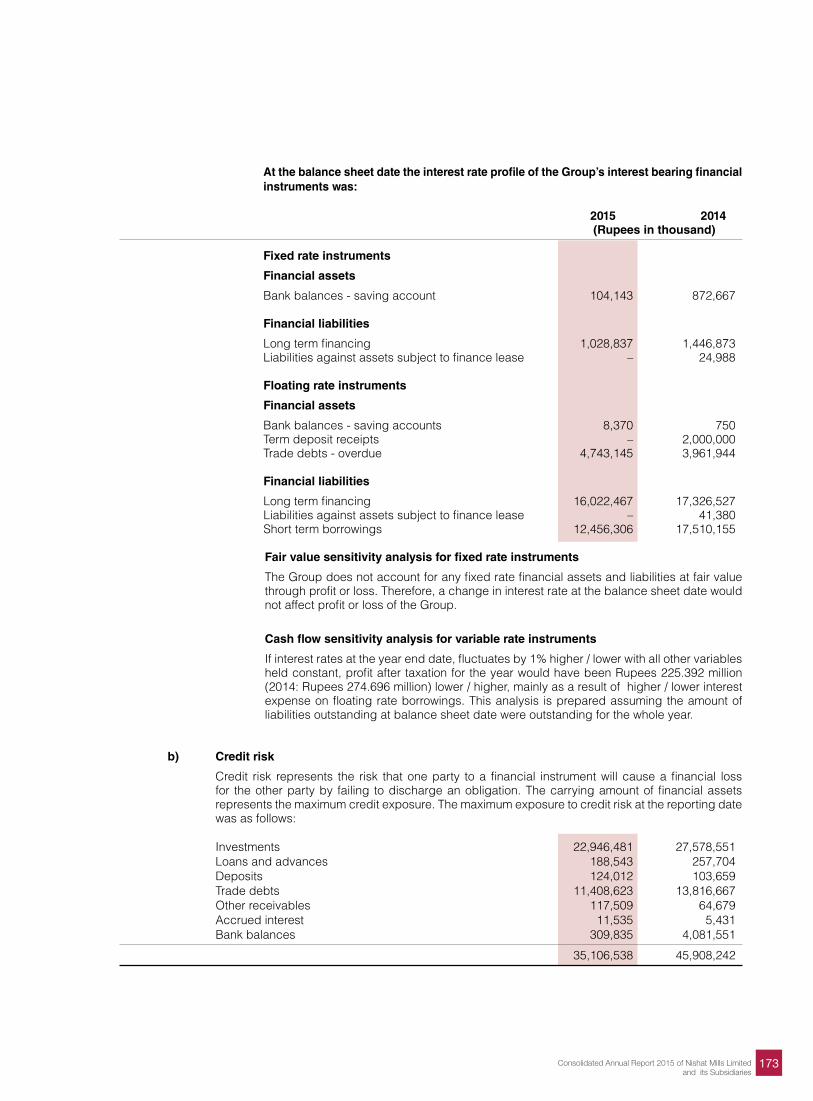
173Consolidated Annual Report 2015 of Nishat Mills Limitedand its Subsidiaries
At the balance sheet date the interest rate profile of the Group’s interest bearing financial instruments was:
2015 2014 (Rupees in thousand)
Fixed rate instruments
Financial assets
Bank balances - saving account 104,143 872,667 Financial liabilities
Long term financing 1,028,837 1,446,873 Liabilities against assets subject to finance lease – 24,988 Floating rate instruments
Financial assets
Bank balances - saving accounts 8,370 750 Term deposit receipts – 2,000,000 Trade debts - overdue 4,743,145 3,961,944 Financial liabilities
Long term financing 16,022,467 17,326,527 Liabilities against assets subject to finance lease – 41,380 Short term borrowings 12,456,306 17,510,155
Fair value sensitivity analysis for fixed rate instruments
The Group does not account for any fixed rate financial assets and liabilities at fair value through profit or loss. Therefore, a change in interest rate at the balance sheet date would not affect profit or loss of the Group.
Cash flow sensitivity analysis for variable rate instruments
If interest rates at the year end date, fluctuates by 1% higher / lower with all other variables held constant, profit after taxation for the year would have been Rupees 225.392 million (2014: Rupees 274.696 million) lower / higher, mainly as a result of higher / lower interest expense on floating rate borrowings. This analysis is prepared assuming the amount of liabilities outstanding at balance sheet date were outstanding for the whole year.
b) Credit risk
Credit risk represents the risk that one party to a financial instrument will cause a financial loss for the other party by failing to discharge an obligation. The carrying amount of financial assets represents the maximum credit exposure. The maximum exposure to credit risk at the reporting date was as follows:
Investments 22,946,481 27,578,551 Loans and advances 188,543 257,704 Deposits 124,012 103,659 Trade debts 11,408,623 13,816,667 Other receivables 117,509 64,679 Accrued interest 11,535 5,431 Bank balances 309,835 4,081,551
35,106,538 45,908,242
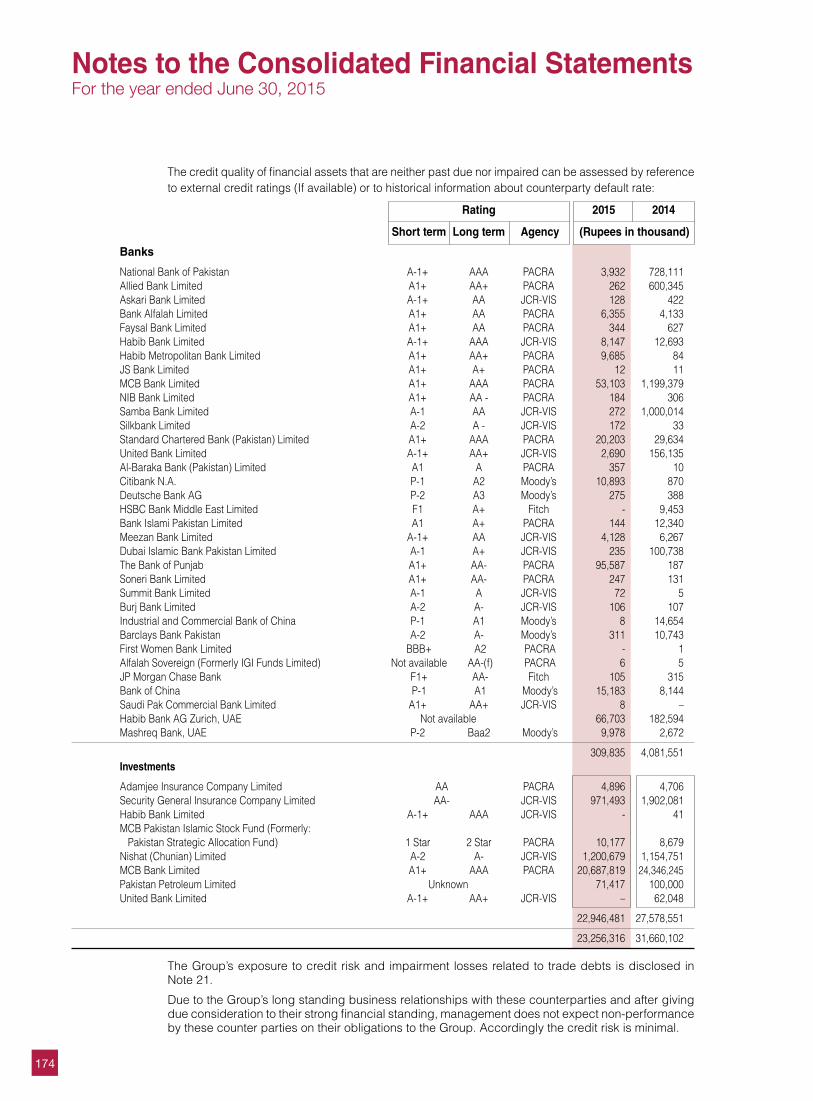
174
The credit quality of financial assets that are neither past due nor impaired can be assessed by reference to external credit ratings (If available) or to historical information about counterparty default rate:
Rating 2015 2014
Short term Long term Agency (Rupees in thousand)
Banks National Bank of Pakistan A-1+ AAA PACRA 3,932 728,111 Allied Bank Limited A1+ AA+ PACRA 262 600,345 Askari Bank Limited A-1+ AA JCR-VIS 128 422 Bank Alfalah Limited A1+ AA PACRA 6,355 4,133 Faysal Bank Limited A1+ AA PACRA 344 627 Habib Bank Limited A-1+ AAA JCR-VIS 8,147 12,693 Habib Metropolitan Bank Limited A1+ AA+ PACRA 9,685 84 JS Bank Limited A1+ A+ PACRA 12 11 MCB Bank Limited A1+ AAA PACRA 53,103 1,199,379 NIB Bank Limited A1+ AA - PACRA 184 306 Samba Bank Limited A-1 AA JCR-VIS 272 1,000,014 Silkbank Limited A-2 A - JCR-VIS 172 33 Standard Chartered Bank (Pakistan) Limited A1+ AAA PACRA 20,203 29,634 United Bank Limited A-1+ AA+ JCR-VIS 2,690 156,135 Al-Baraka Bank (Pakistan) Limited A1 A PACRA 357 10 Citibank N.A. P-1 A2 Moody’s 10,893 870 Deutsche Bank AG P-2 A3 Moody’s 275 388 HSBC Bank Middle East Limited F1 A+ Fitch - 9,453 Bank Islami Pakistan Limited A1 A+ PACRA 144 12,340 Meezan Bank Limited A-1+ AA JCR-VIS 4,128 6,267 Dubai Islamic Bank Pakistan Limited A-1 A+ JCR-VIS 235 100,738 The Bank of Punjab A1+ AA- PACRA 95,587 187 Soneri Bank Limited A1+ AA- PACRA 247 131 Summit Bank Limited A-1 A JCR-VIS 72 5 Burj Bank Limited A-2 A- JCR-VIS 106 107 Industrial and Commercial Bank of China P-1 A1 Moody’s 8 14,654 Barclays Bank Pakistan A-2 A- Moody’s 311 10,743 First Women Bank Limited BBB+ A2 PACRA - 1 Alfalah Sovereign (Formerly IGI Funds Limited) Not available AA-(f) PACRA 6 5 JP Morgan Chase Bank F1+ AA- Fitch 105 315 Bank of China P-1 A1 Moody’s 15,183 8,144 Saudi Pak Commercial Bank Limited A1+ AA+ JCR-VIS 8 – Habib Bank AG Zurich, UAE Not available 66,703 182,594 Mashreq Bank, UAE P-2 Baa2 Moody’s 9,978 2,672
309,835 4,081,551 Investments
Adamjee Insurance Company Limited AA PACRA 4,896 4,706 Security General Insurance Company Limited AA- JCR-VIS 971,493 1,902,081 Habib Bank Limited A-1+ AAA JCR-VIS - 41 MCB Pakistan Islamic Stock Fund (Formerly: Pakistan Strategic Allocation Fund) 1 Star 2 Star PACRA 10,177 8,679 Nishat (Chunian) Limited A-2 A- JCR-VIS 1,200,679 1,154,751 MCB Bank Limited A1+ AAA PACRA 20,687,819 24,346,245 Pakistan Petroleum Limited Unknown 71,417 100,000 United Bank Limited A-1+ AA+ JCR-VIS – 62,048
22,946,481 27,578,551
23,256,316 31,660,102
The Group’s exposure to credit risk and impairment losses related to trade debts is disclosed in Note 21.
Due to the Group’s long standing business relationships with these counterparties and after giving due consideration to their strong financial standing, management does not expect non-performance by these counter parties on their obligations to the Group. Accordingly the credit risk is minimal.
Notes to the Consolidated Financial StatementsFor the year ended June 30, 2015
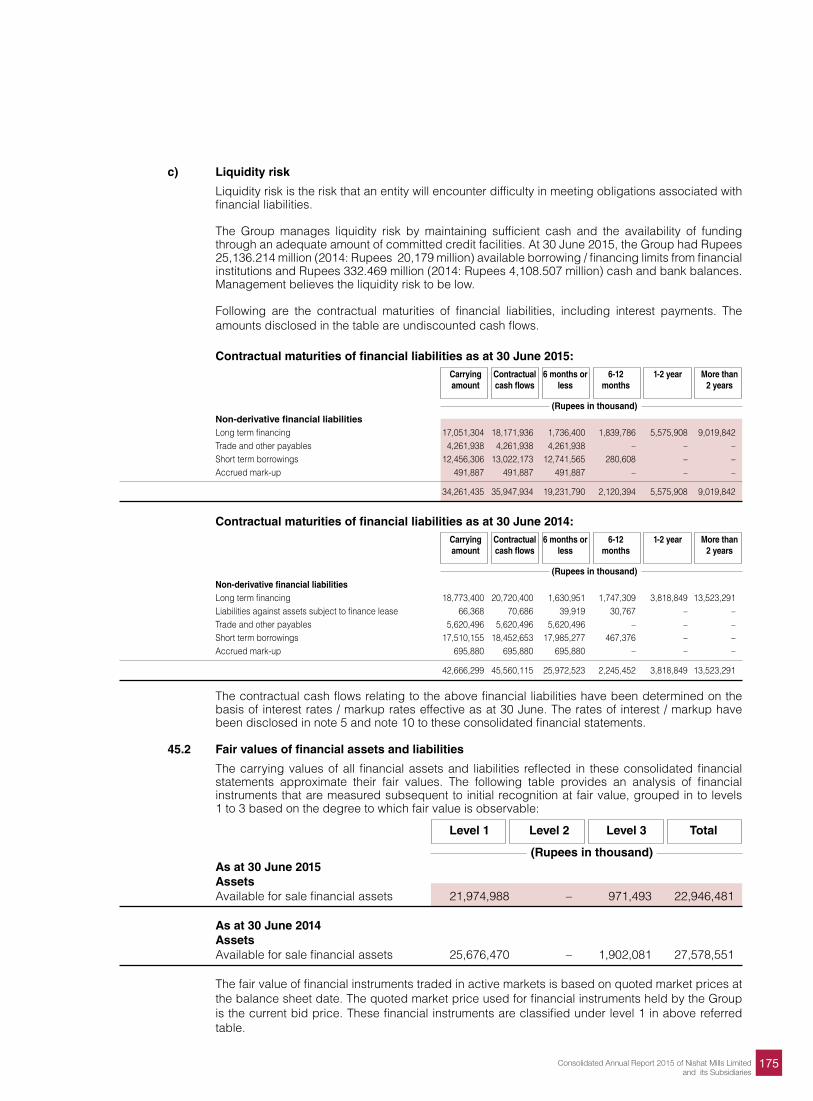
175Consolidated Annual Report 2015 of Nishat Mills Limitedand its Subsidiaries
c) Liquidity risk
Liquidity risk is the risk that an entity will encounter difficulty in meeting obligations associated with financial liabilities.
The Group manages liquidity risk by maintaining sufficient cash and the availability of funding through an adequate amount of committed credit facilities. At 30 June 2015, the Group had Rupees 25,136.214 million (2014: Rupees 20,179 million) available borrowing / financing limits from financial institutions and Rupees 332.469 million (2014: Rupees 4,108.507 million) cash and bank balances. Management believes the liquidity risk to be low.
Following are the contractual maturities of financial liabilities, including interest payments. The amounts disclosed in the table are undiscounted cash flows.
Contractual maturities of financial liabilities as at 30 June 2015: Carrying Contractual 6 months or 6-12 1-2 year More than amount cash flows less months 2 years
(Rupees in thousand) Non-derivative financial liabilities Long term financing 17,051,304 18,171,936 1,736,400 1,839,786 5,575,908 9,019,842 Trade and other payables 4,261,938 4,261,938 4,261,938 – – – Short term borrowings 12,456,306 13,022,173 12,741,565 280,608 – – Accrued mark-up 491,887 491,887 491,887 – – –
34,261,435 35,947,934 19,231,790 2,120,394 5,575,908 9,019,842
Contractual maturities of financial liabilities as at 30 June 2014: Carrying Contractual 6 months or 6-12 1-2 year More than amount cash flows less months 2 years
(Rupees in thousand) Non-derivative financial liabilities Long term financing 18,773,400 20,720,400 1,630,951 1,747,309 3,818,849 13,523,291 Liabilities against assets subject to finance lease 66,368 70,686 39,919 30,767 – – Trade and other payables 5,620,496 5,620,496 5,620,496 – – – Short term borrowings 17,510,155 18,452,653 17,985,277 467,376 – – Accrued mark-up 695,880 695,880 695,880 – – –
42,666,299 45,560,115 25,972,523 2,245,452 3,818,849 13,523,291
The contractual cash flows relating to the above financial liabilities have been determined on the basis of interest rates / markup rates effective as at 30 June. The rates of interest / markup have been disclosed in note 5 and note 10 to these consolidated financial statements.
45.2 Fair values of financial assets and liabilities
The carrying values of all financial assets and liabilities reflected in these consolidated financial statements approximate their fair values. The following table provides an analysis of financial instruments that are measured subsequent to initial recognition at fair value, grouped in to levels 1 to 3 based on the degree to which fair value is observable:
Level 1 Level 2 Level 3 Total
(Rupees in thousand) As at 30 June 2015 Assets Available for sale financial assets 21,974,988 – 971,493 22,946,481 As at 30 June 2014 Assets Available for sale financial assets 25,676,470 – 1,902,081 27,578,551
The fair value of financial instruments traded in active markets is based on quoted market prices at the balance sheet date. The quoted market price used for financial instruments held by the Group is the current bid price. These financial instruments are classified under level 1 in above referred table.
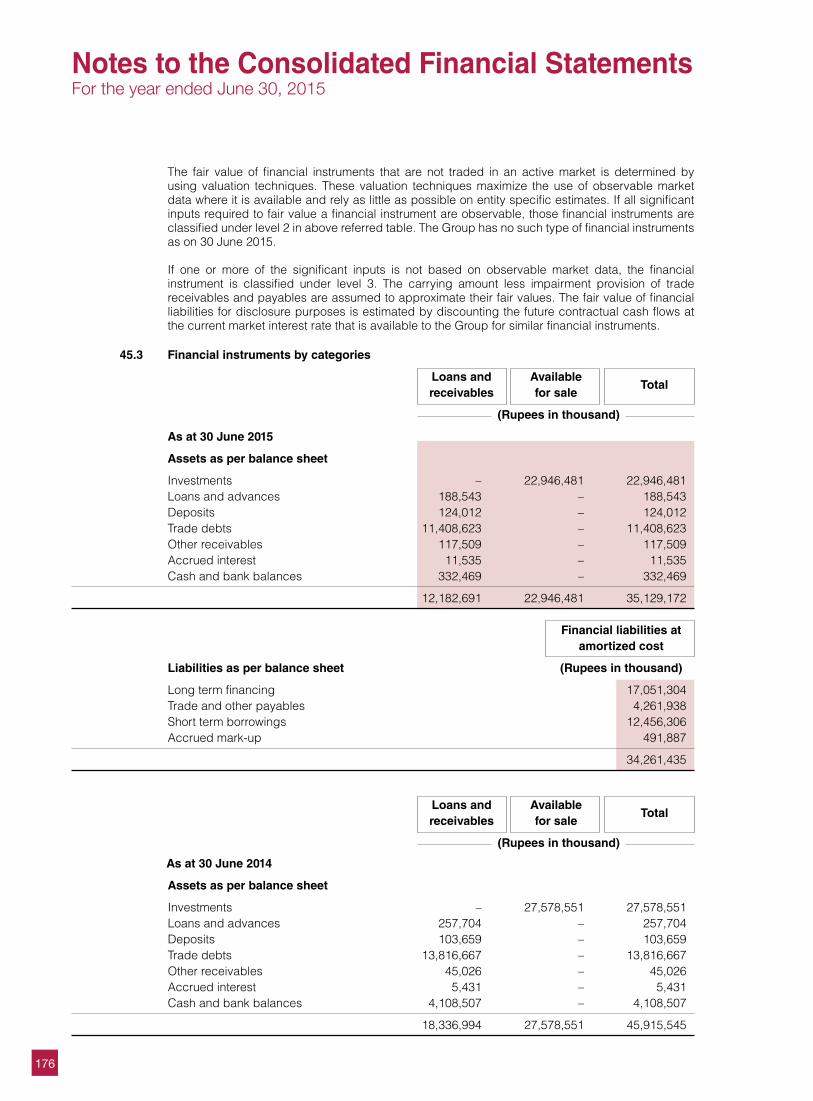
176
The fair value of financial instruments that are not traded in an active market is determined by using valuation techniques. These valuation techniques maximize the use of observable market data where it is available and rely as little as possible on entity specific estimates. If all significant inputs required to fair value a financial instrument are observable, those financial instruments are classified under level 2 in above referred table. The Group has no such type of financial instruments as on 30 June 2015.
If one or more of the significant inputs is not based on observable market data, the financial instrument is classified under level 3. The carrying amount less impairment provision of trade receivables and payables are assumed to approximate their fair values. The fair value of financial liabilities for disclosure purposes is estimated by discounting the future contractual cash flows at the current market interest rate that is available to the Group for similar financial instruments.
45.3 Financial instruments by categories
Loans and Available Total
receivables for sale
(Rupees in thousand)
As at 30 June 2015
Assets as per balance sheet
Investments – 22,946,481 22,946,481 Loans and advances 188,543 – 188,543 Deposits 124,012 – 124,012 Trade debts 11,408,623 – 11,408,623 Other receivables 117,509 – 117,509 Accrued interest 11,535 – 11,535 Cash and bank balances 332,469 – 332,469
12,182,691 22,946,481 35,129,172 Financial liabilities at amortized cost
Liabilities as per balance sheet (Rupees in thousand)
Long term financing 17,051,304 Trade and other payables 4,261,938 Short term borrowings 12,456,306 Accrued mark-up 491,887
34,261,435
Loans and Available
Total receivables for sale
(Rupees in thousand)
As at 30 June 2014
Assets as per balance sheet
Investments – 27,578,551 27,578,551 Loans and advances 257,704 – 257,704 Deposits 103,659 – 103,659 Trade debts 13,816,667 – 13,816,667 Other receivables 45,026 – 45,026 Accrued interest 5,431 – 5,431 Cash and bank balances 4,108,507 – 4,108,507
18,336,994 27,578,551 45,915,545
Notes to the Consolidated Financial StatementsFor the year ended June 30, 2015
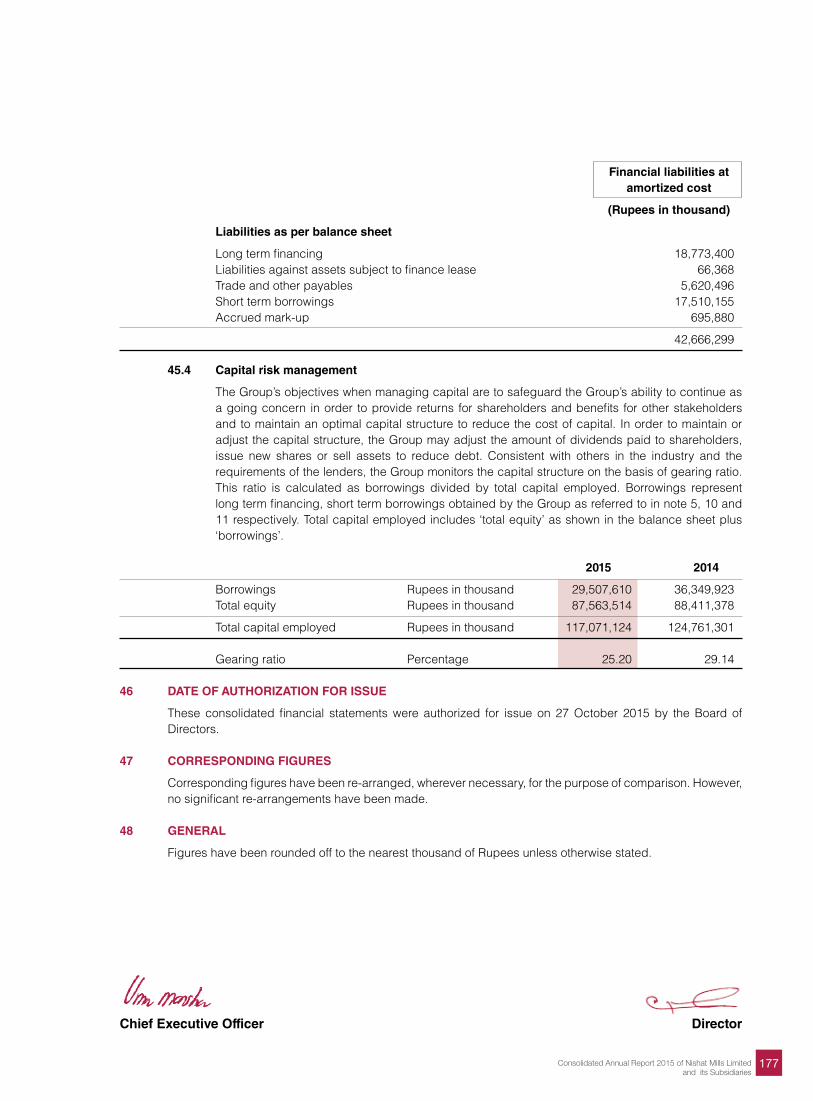
177Consolidated Annual Report 2015 of Nishat Mills Limitedand its Subsidiaries
Financial liabilities at amortized cost
(Rupees in thousand)
Liabilities as per balance sheet
Long term financing 18,773,400 Liabilities against assets subject to finance lease 66,368 Trade and other payables 5,620,496 Short term borrowings 17,510,155 Accrued mark-up 695,880
42,666,299
45.4 Capital risk management
The Group’s objectives when managing capital are to safeguard the Group’s ability to continue as a going concern in order to provide returns for shareholders and benefits for other stakeholders and to maintain an optimal capital structure to reduce the cost of capital. In order to maintain or adjust the capital structure, the Group may adjust the amount of dividends paid to shareholders, issue new shares or sell assets to reduce debt. Consistent with others in the industry and the requirements of the lenders, the Group monitors the capital structure on the basis of gearing ratio. This ratio is calculated as borrowings divided by total capital employed. Borrowings represent long term financing, short term borrowings obtained by the Group as referred to in note 5, 10 and 11 respectively. Total capital employed includes ‘total equity’ as shown in the balance sheet plus ‘borrowings’.
2015 2014
Borrowings Rupees in thousand 29,507,610 36,349,923 Total equity Rupees in thousand 87,563,514 88,411,378
Total capital employed Rupees in thousand 117,071,124 124,761,301 Gearing ratio Percentage 25.20 29.14 46 DATE OF AUTHORIZATION FOR ISSUE
These consolidated financial statements were authorized for issue on 27 October 2015 by the Board of Directors.
47 CORRESPONDING FIGURES
Corresponding figures have been re-arranged, wherever necessary, for the purpose of comparison. However, no significant re-arrangements have been made.
48 GENERAL
Figures have been rounded off to the nearest thousand of Rupees unless otherwise stated.
Chief Executive Officer Director
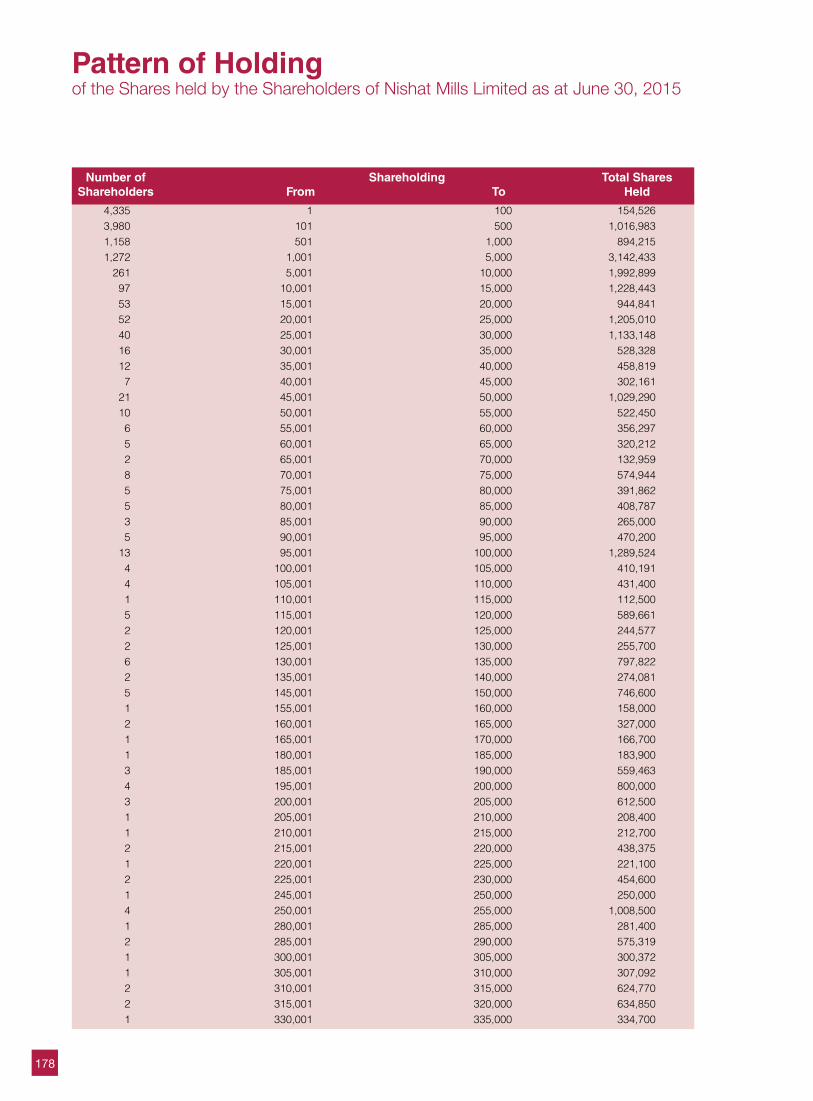
178
Number of Shareholding Total Shares Shareholders From To Held
Pattern of Holding of the Shares held by the Shareholders of Nishat Mills Limited as at June 30, 2015
4,335 1 100 154,526 3,980 101 500 1,016,983 1,158 501 1,000 894,215 1,272 1,001 5,000 3,142,433 261 5,001 10,000 1,992,899 97 10,001 15,000 1,228,443 53 15,001 20,000 944,841 52 20,001 25,000 1,205,010 40 25,001 30,000 1,133,148 16 30,001 35,000 528,328 12 35,001 40,000 458,819 7 40,001 45,000 302,161 21 45,001 50,000 1,029,290 10 50,001 55,000 522,450 6 55,001 60,000 356,297 5 60,001 65,000 320,212 2 65,001 70,000 132,959 8 70,001 75,000 574,944 5 75,001 80,000 391,862 5 80,001 85,000 408,787 3 85,001 90,000 265,000 5 90,001 95,000 470,200 13 95,001 100,000 1,289,524 4 100,001 105,000 410,191 4 105,001 110,000 431,400 1 110,001 115,000 112,500 5 115,001 120,000 589,661 2 120,001 125,000 244,577 2 125,001 130,000 255,700 6 130,001 135,000 797,822 2 135,001 140,000 274,081 5 145,001 150,000 746,600 1 155,001 160,000 158,000 2 160,001 165,000 327,000 1 165,001 170,000 166,700 1 180,001 185,000 183,900 3 185,001 190,000 559,463 4 195,001 200,000 800,000 3 200,001 205,000 612,500 1 205,001 210,000 208,400 1 210,001 215,000 212,700 2 215,001 220,000 438,375 1 220,001 225,000 221,100 2 225,001 230,000 454,600 1 245,001 250,000 250,000 4 250,001 255,000 1,008,500 1 280,001 285,000 281,400 2 285,001 290,000 575,319 1 300,001 305,000 300,372 1 305,001 310,000 307,092 2 310,001 315,000 624,770 2 315,001 320,000 634,850 1 330,001 335,000 334,700
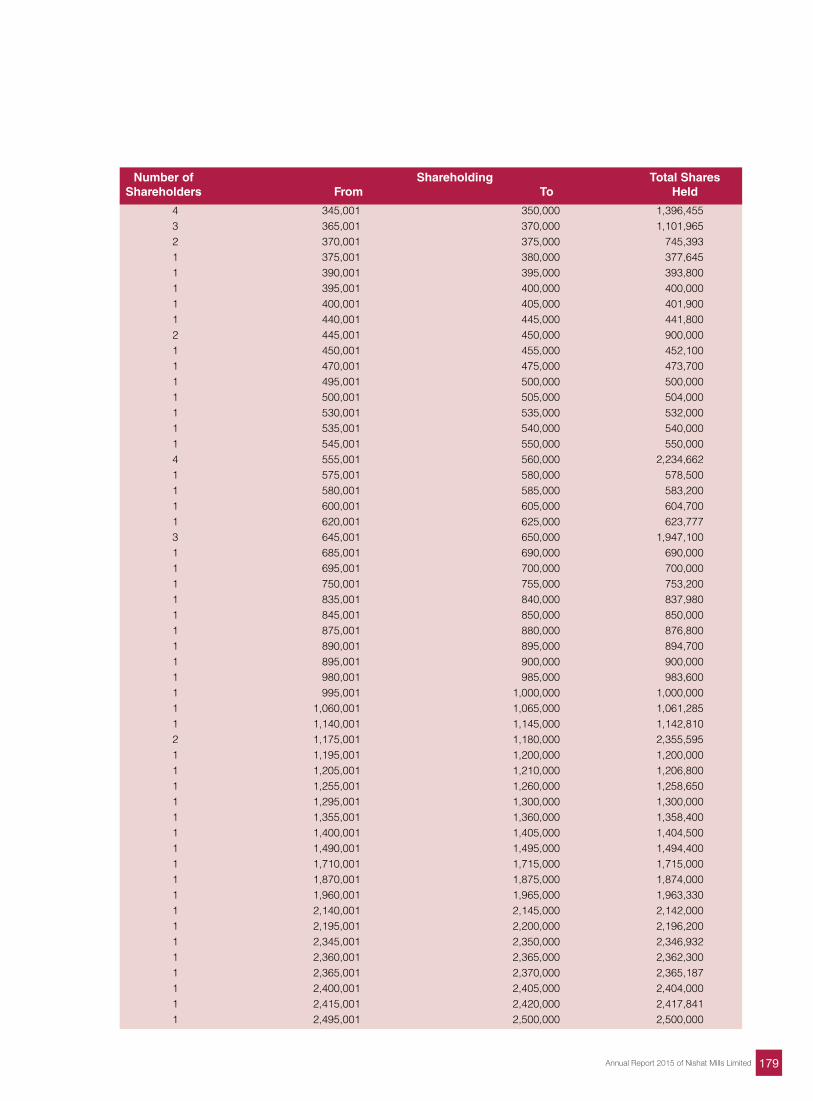
179Annual Report 2015 of Nishat Mills Limited
Number of Shareholding Total Shares Shareholders From To Held
4 345,001 350,000 1,396,455 3 365,001 370,000 1,101,965 2 370,001 375,000 745,393 1 375,001 380,000 377,645 1 390,001 395,000 393,800 1 395,001 400,000 400,000 1 400,001 405,000 401,900 1 440,001 445,000 441,800 2 445,001 450,000 900,000 1 450,001 455,000 452,100 1 470,001 475,000 473,700 1 495,001 500,000 500,000 1 500,001 505,000 504,000 1 530,001 535,000 532,000 1 535,001 540,000 540,000 1 545,001 550,000 550,000 4 555,001 560,000 2,234,662 1 575,001 580,000 578,500 1 580,001 585,000 583,200 1 600,001 605,000 604,700 1 620,001 625,000 623,777 3 645,001 650,000 1,947,100 1 685,001 690,000 690,000 1 695,001 700,000 700,000 1 750,001 755,000 753,200 1 835,001 840,000 837,980 1 845,001 850,000 850,000 1 875,001 880,000 876,800 1 890,001 895,000 894,700 1 895,001 900,000 900,000 1 980,001 985,000 983,600 1 995,001 1,000,000 1,000,000 1 1,060,001 1,065,000 1,061,285 1 1,140,001 1,145,000 1,142,810 2 1,175,001 1,180,000 2,355,595 1 1,195,001 1,200,000 1,200,000 1 1,205,001 1,210,000 1,206,800 1 1,255,001 1,260,000 1,258,650 1 1,295,001 1,300,000 1,300,000 1 1,355,001 1,360,000 1,358,400 1 1,400,001 1,405,000 1,404,500 1 1,490,001 1,495,000 1,494,400 1 1,710,001 1,715,000 1,715,000 1 1,870,001 1,875,000 1,874,000 1 1,960,001 1,965,000 1,963,330 1 2,140,001 2,145,000 2,142,000 1 2,195,001 2,200,000 2,196,200 1 2,345,001 2,350,000 2,346,932 1 2,360,001 2,365,000 2,362,300 1 2,365,001 2,370,000 2,365,187 1 2,400,001 2,405,000 2,404,000 1 2,415,001 2,420,000 2,417,841 1 2,495,001 2,500,000 2,500,000
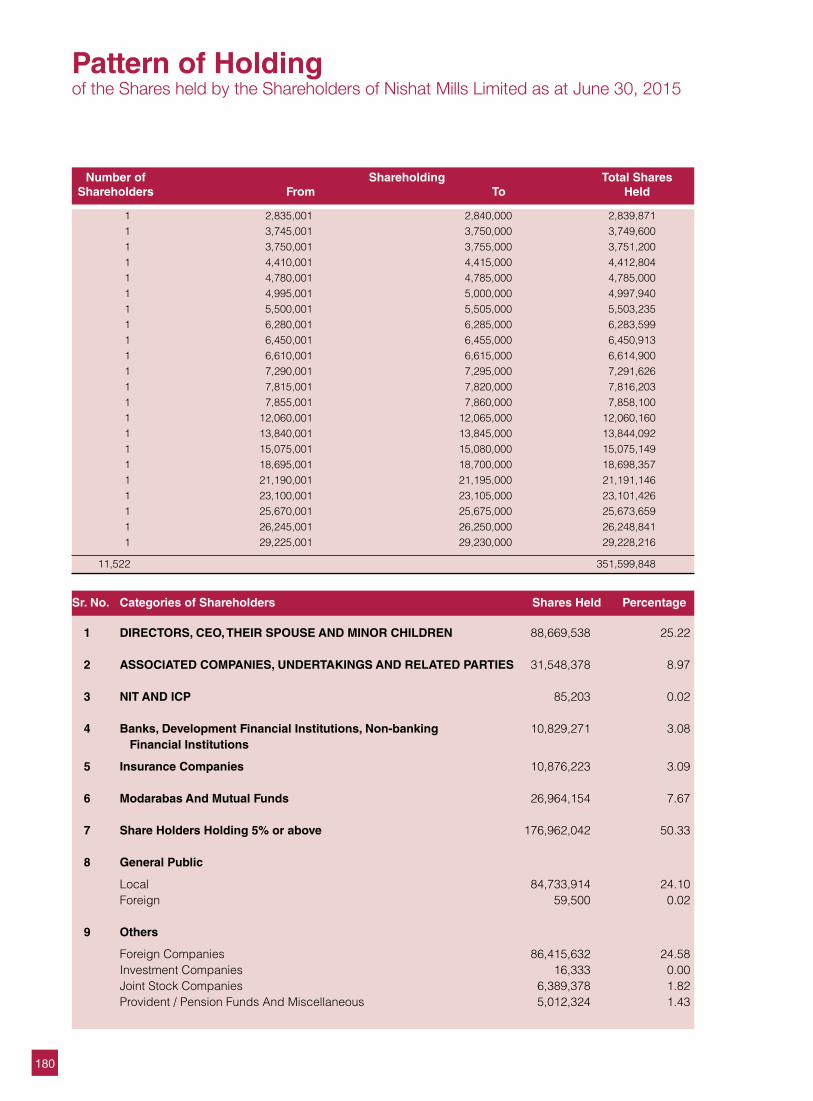
180
Number of Shareholding Total Shares Shareholders From To Held
1 2,835,001 2,840,000 2,839,871 1 3,745,001 3,750,000 3,749,600 1 3,750,001 3,755,000 3,751,200 1 4,410,001 4,415,000 4,412,804 1 4,780,001 4,785,000 4,785,000 1 4,995,001 5,000,000 4,997,940 1 5,500,001 5,505,000 5,503,235 1 6,280,001 6,285,000 6,283,599 1 6,450,001 6,455,000 6,450,913 1 6,610,001 6,615,000 6,614,900 1 7,290,001 7,295,000 7,291,626 1 7,815,001 7,820,000 7,816,203 1 7,855,001 7,860,000 7,858,100 1 12,060,001 12,065,000 12,060,160 1 13,840,001 13,845,000 13,844,092 1 15,075,001 15,080,000 15,075,149 1 18,695,001 18,700,000 18,698,357 1 21,190,001 21,195,000 21,191,146 1 23,100,001 23,105,000 23,101,426 1 25,670,001 25,675,000 25,673,659 1 26,245,001 26,250,000 26,248,841 1 29,225,001 29,230,000 29,228,216
11,522 351,599,848
Pattern of Holding of the Shares held by the Shareholders of Nishat Mills Limited as at June 30, 2015
Sr. No. Categories of Shareholders Shares Held Percentage
1 DIRECTORS, CEO, THEIR SPOUSE AND MINOR CHILDREN 88,669,538 25.22
2 ASSOCIATED COMPANIES, UNDERTAKINGS AND RELATED PARTIES 31,548,378 8.97
3 NIT AND ICP 85,203 0.02
4 Banks, Development Financial Institutions, Non-banking 10,829,271 3.08 Financial Institutions
5 Insurance Companies 10,876,223 3.09
6 Modarabas And Mutual Funds 26,964,154 7.67
7 Share Holders Holding 5% or above 176,962,042 50.33
8 General Public
Local 84,733,914 24.10 Foreign 59,500 0.02
9 Others
Foreign Companies 86,415,632 24.58 Investment Companies 16,333 0.00 Joint Stock Companies 6,389,378 1.82 Provident / Pension Funds And Miscellaneous 5,012,324 1.43
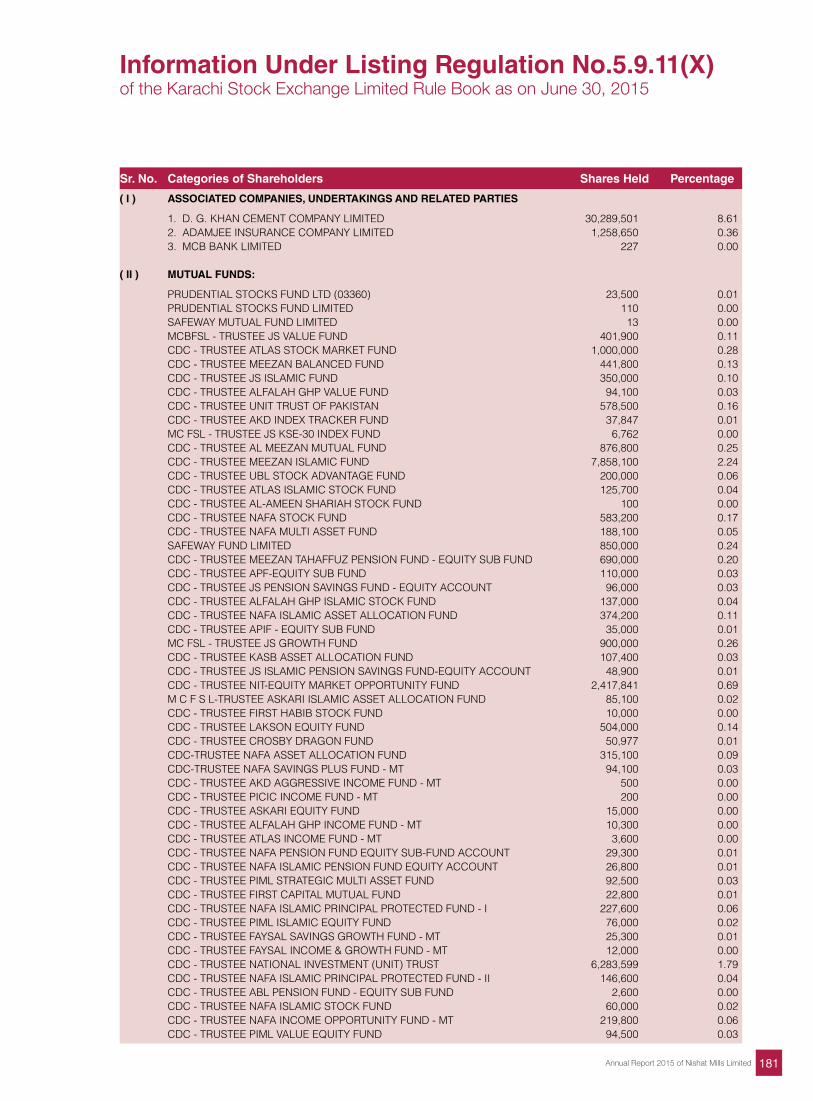
181Annual Report 2015 of Nishat Mills Limited
Sr. No. Categories of Shareholders Shares Held Percentage
( I ) ASSOCIATED COMPANIES, UNDERTAKINGS AND RELATED PARTIES
1. D. G. KHAN CEMENT COMPANY LIMITED 30,289,501 8.61 2. ADAMJEE INSURANCE COMPANY LIMITED 1,258,650 0.36 3. MCB BANK LIMITED 227 0.00
( II ) MUTUAL FUNDS:
PRUDENTIAL STOCKS FUND LTD (03360) 23,500 0.01 PRUDENTIAL STOCKS FUND LIMITED 110 0.00 SAFEWAY MUTUAL FUND LIMITED 13 0.00 MCBFSL - TRUSTEE JS VALUE FUND 401,900 0.11 CDC - TRUSTEE ATLAS STOCK MARKET FUND 1,000,000 0.28 CDC - TRUSTEE MEEZAN BALANCED FUND 441,800 0.13 CDC - TRUSTEE JS ISLAMIC FUND 350,000 0.10 CDC - TRUSTEE ALFALAH GHP VALUE FUND 94,100 0.03 CDC - TRUSTEE UNIT TRUST OF PAKISTAN 578,500 0.16 CDC - TRUSTEE AKD INDEX TRACKER FUND 37,847 0.01 MC FSL - TRUSTEE JS KSE-30 INDEX FUND 6,762 0.00 CDC - TRUSTEE AL MEEZAN MUTUAL FUND 876,800 0.25 CDC - TRUSTEE MEEZAN ISLAMIC FUND 7,858,100 2.24 CDC - TRUSTEE UBL STOCK ADVANTAGE FUND 200,000 0.06 CDC - TRUSTEE ATLAS ISLAMIC STOCK FUND 125,700 0.04 CDC - TRUSTEE AL-AMEEN SHARIAH STOCK FUND 100 0.00 CDC - TRUSTEE NAFA STOCK FUND 583,200 0.17 CDC - TRUSTEE NAFA MULTI ASSET FUND 188,100 0.05 SAFEWAY FUND LIMITED 850,000 0.24 CDC - TRUSTEE MEEZAN TAHAFFUZ PENSION FUND - EQUITY SUB FUND 690,000 0.20 CDC - TRUSTEE APF-EQUITY SUB FUND 110,000 0.03 CDC - TRUSTEE JS PENSION SAVINGS FUND - EQUITY ACCOUNT 96,000 0.03 CDC - TRUSTEE ALFALAH GHP ISLAMIC STOCK FUND 137,000 0.04 CDC - TRUSTEE NAFA ISLAMIC ASSET ALLOCATION FUND 374,200 0.11 CDC - TRUSTEE APIF - EQUITY SUB FUND 35,000 0.01 MC FSL - TRUSTEE JS GROWTH FUND 900,000 0.26 CDC - TRUSTEE KASB ASSET ALLOCATION FUND 107,400 0.03 CDC - TRUSTEE JS ISLAMIC PENSION SAVINGS FUND-EQUITY ACCOUNT 48,900 0.01 CDC - TRUSTEE NIT-EQUITY MARKET OPPORTUNITY FUND 2,417,841 0.69 M C F S L-TRUSTEE ASKARI ISLAMIC ASSET ALLOCATION FUND 85,100 0.02 CDC - TRUSTEE FIRST HABIB STOCK FUND 10,000 0.00 CDC - TRUSTEE LAKSON EQUITY FUND 504,000 0.14 CDC - TRUSTEE CROSBY DRAGON FUND 50,977 0.01 CDC-TRUSTEE NAFA ASSET ALLOCATION FUND 315,100 0.09 CDC-TRUSTEE NAFA SAVINGS PLUS FUND - MT 94,100 0.03 CDC - TRUSTEE AKD AGGRESSIVE INCOME FUND - MT 500 0.00 CDC - TRUSTEE PICIC INCOME FUND - MT 200 0.00 CDC - TRUSTEE ASKARI EQUITY FUND 15,000 0.00 CDC - TRUSTEE ALFALAH GHP INCOME FUND - MT 10,300 0.00 CDC - TRUSTEE ATLAS INCOME FUND - MT 3,600 0.00 CDC - TRUSTEE NAFA PENSION FUND EQUITY SUB-FUND ACCOUNT 29,300 0.01 CDC - TRUSTEE NAFA ISLAMIC PENSION FUND EQUITY ACCOUNT 26,800 0.01 CDC - TRUSTEE PIML STRATEGIC MULTI ASSET FUND 92,500 0.03 CDC - TRUSTEE FIRST CAPITAL MUTUAL FUND 22,800 0.01 CDC - TRUSTEE NAFA ISLAMIC PRINCIPAL PROTECTED FUND - I 227,600 0.06 CDC - TRUSTEE PIML ISLAMIC EQUITY FUND 76,000 0.02 CDC - TRUSTEE FAYSAL SAVINGS GROWTH FUND - MT 25,300 0.01 CDC - TRUSTEE FAYSAL INCOME & GROWTH FUND - MT 12,000 0.00 CDC - TRUSTEE NATIONAL INVESTMENT (UNIT) TRUST 6,283,599 1.79 CDC - TRUSTEE NAFA ISLAMIC PRINCIPAL PROTECTED FUND - II 146,600 0.04 CDC - TRUSTEE ABL PENSION FUND - EQUITY SUB FUND 2,600 0.00 CDC - TRUSTEE NAFA ISLAMIC STOCK FUND 60,000 0.02 CDC - TRUSTEE NAFA INCOME OPPORTUNITY FUND - MT 219,800 0.06 CDC - TRUSTEE PIML VALUE EQUITY FUND 94,500 0.03
Information Under Listing Regulation No.5.9.11(X)of the Karachi Stock Exchange Limited Rule Book as on June 30, 2015
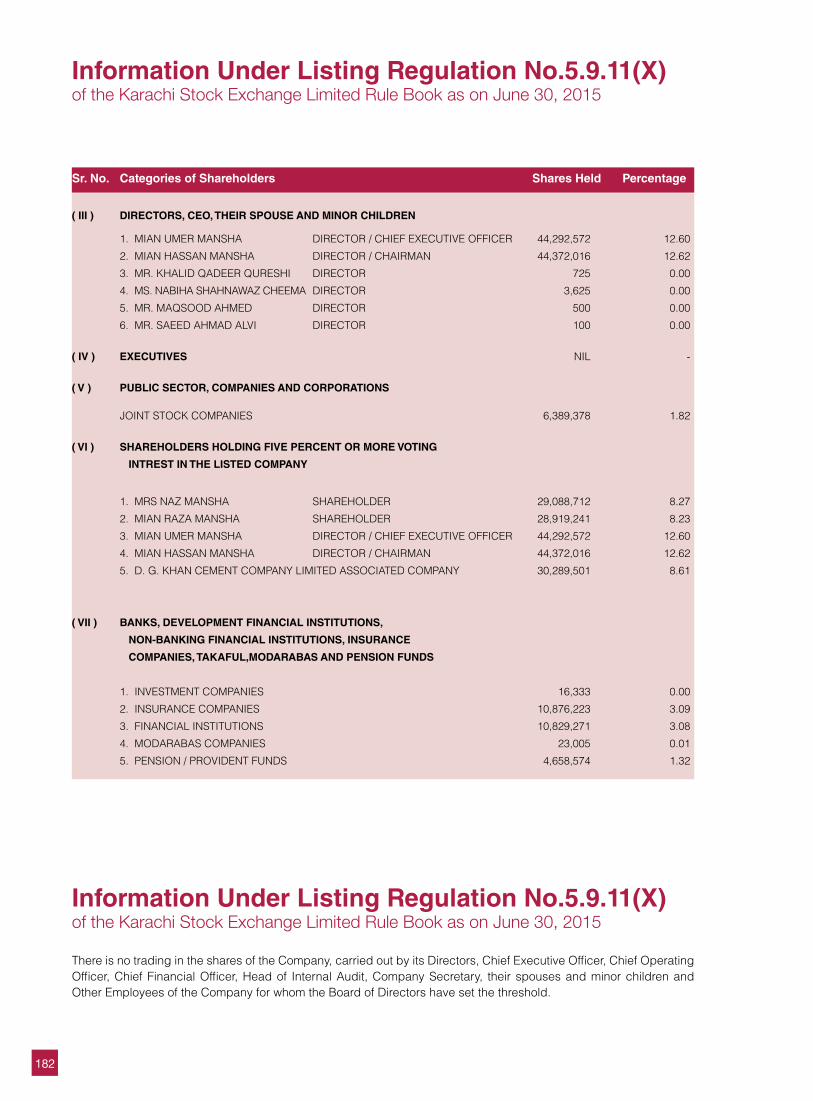
182
( III ) DIRECTORS, CEO, THEIR SPOUSE AND MINOR CHILDREN
1. MIAN UMER MANSHA DIRECTOR / CHIEF EXECUTIVE OFFICER 44,292,572 12.60
2. MIAN HASSAN MANSHA DIRECTOR / CHAIRMAN 44,372,016 12.62
3. MR. KHALID QADEER QURESHI DIRECTOR 725 0.00
4. MS. NABIHA SHAHNAWAZ CHEEMA DIRECTOR 3,625 0.00
5. MR. MAQSOOD AHMED DIRECTOR 500 0.00
6. MR. SAEED AHMAD ALVI DIRECTOR 100 0.00
( IV ) EXECUTIVES NIL -
( V ) PUBLIC SECTOR, COMPANIES AND CORPORATIONS JOINT STOCK COMPANIES 6,389,378 1.82
( VI ) SHAREHOLDERS HOLDING FIVE PERCENT OR MORE VOTING
INTREST IN THE LISTED COMPANY
1. MRS NAZ MANSHA SHAREHOLDER 29,088,712 8.27
2. MIAN RAZA MANSHA SHAREHOLDER 28,919,241 8.23
3. MIAN UMER MANSHA DIRECTOR / CHIEF EXECUTIVE OFFICER 44,292,572 12.60
4. MIAN HASSAN MANSHA DIRECTOR / CHAIRMAN 44,372,016 12.62
5. D. G. KHAN CEMENT COMPANY LIMITED ASSOCIATED COMPANY 30,289,501 8.61
( VII ) BANKS, DEVELOPMENT FINANCIAL INSTITUTIONS,
NON-BANKING FINANCIAL INSTITUTIONS, INSURANCE
COMPANIES, TAKAFUL,MODARABAS AND PENSION FUNDS
1. INVESTMENT COMPANIES 16,333 0.00
2. INSURANCE COMPANIES 10,876,223 3.09
3. FINANCIAL INSTITUTIONS 10,829,271 3.08
4. MODARABAS COMPANIES 23,005 0.01
5. PENSION / PROVIDENT FUNDS 4,658,574 1.32
Sr. No. Categories of Shareholders Shares Held Percentage
There is no trading in the shares of the Company, carried out by its Directors, Chief Executive Officer, Chief Operating Officer, Chief Financial Officer, Head of Internal Audit, Company Secretary, their spouses and minor children and Other Employees of the Company for whom the Board of Directors have set the threshold.
Information Under Listing Regulation No.5.9.11(X)of the Karachi Stock Exchange Limited Rule Book as on June 30, 2015
Information Under Listing Regulation No.5.9.11(X)of the Karachi Stock Exchange Limited Rule Book as on June 30, 2015
Form of Proxy
Pleaseaffix
revenuestampRs. 5
I/We
of
being a member of Nishat Mills Limited, hereby appoint
of
or failing him/her
of
member(s) of the Company, as my/our proxy in my/our absence to attend and vote for me/us and on my/our behalf at the Annual General Meeting of the Company to be held on November 30, 2015 (Monday), at 11:00 a.m. at Nishat Hotel, 9-A, Gulberg III, Mian Mahmood Ali Kasuri Road, Lahore.
as witness may hand this day of 2015
Signed by the said member
in presence of
Signature of witness ...................................... Signature(s) of Members(s)
Name .............................................................
Address .........................................................
.......................................................................
CNIC # ..........................................................
Please quote:
Folio No. Shares held CDC A/C. No.
Important: This instrument appointing a proxy, duly completed, must be received at the Registered Office of the Company at Nishat House, 53-A, Lawrence Road, Lahore not later than 48 hours before the time to holding the annual general meeting.
AFFIXCORRECTPOSTAGE
The Company Secretary
NISHAT MILLS LIMITEDNishat House,53 - A, Lawrence Road, Lahore.Tel : 042 - 36360154UAN : 042 - 111 113 333
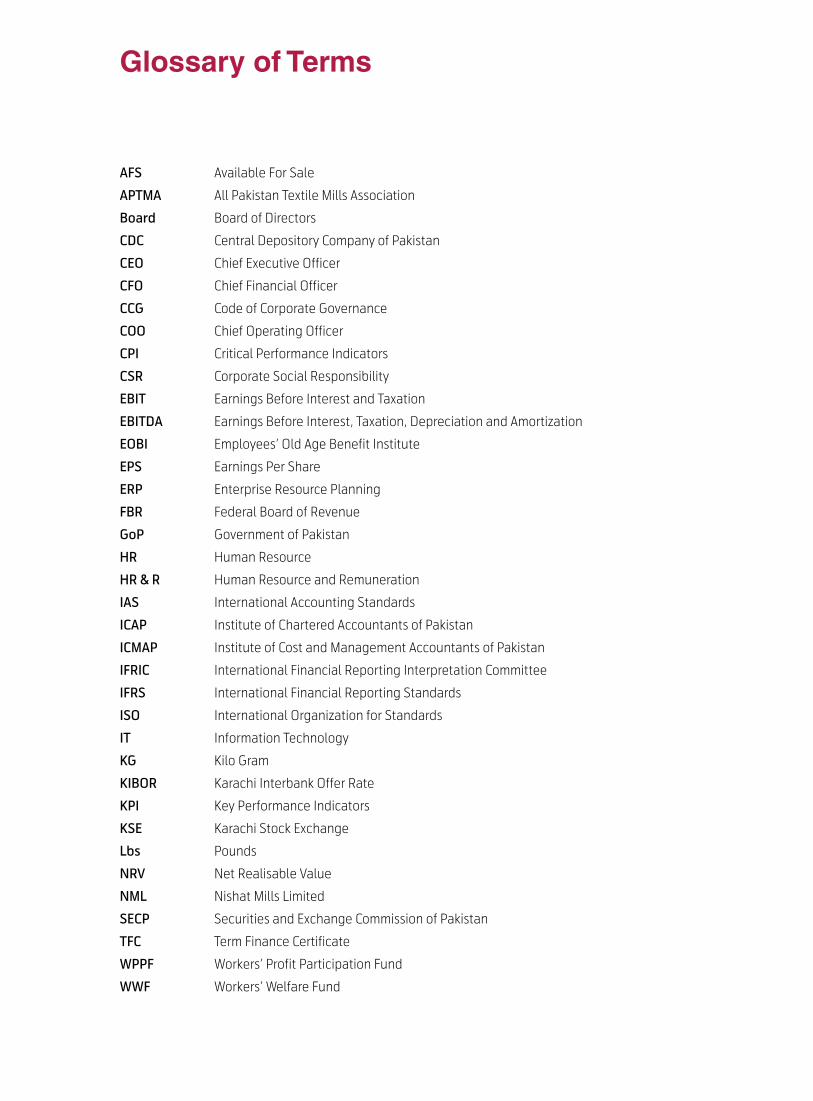
AFS Available For Sale
APTMA All Pakistan Textile Mills Association
Board Board of Directors
CDC Central Depository Company of Pakistan
CEO Chief Executive Officer
CFO Chief Financial Officer
CCG Code of Corporate Governance
COO Chief Operating Officer
CPI Critical Performance Indicators
CSR Corporate Social Responsibility
EBIT Earnings Before Interest and Taxation
EBITDA Earnings Before Interest, Taxation, Depreciation and Amortization
EOBI Employees’ Old Age Benefit Institute
EPS Earnings Per Share
ERP Enterprise Resource Planning
FBR Federal Board of Revenue
GoP Government of Pakistan
HR Human Resource
HR & R Human Resource and Remuneration
IAS International Accounting Standards
ICAP Institute of Chartered Accountants of Pakistan
ICMAP Institute of Cost and Management Accountants of Pakistan
IFRIC International Financial Reporting Interpretation Committee
IFRS International Financial Reporting Standards
ISO International Organization for Standards
IT Information Technology
KG Kilo Gram
KIBOR Karachi Interbank Offer Rate
KPI Key Performance Indicators
KSE Karachi Stock Exchange
Lbs Pounds
NRV Net Realisable Value
NML Nishat Mills Limited
SECP Securities and Exchange Commission of Pakistan
TFC Term Finance Certificate
WPPF Workers’ Profit Participation Fund
WWF Workers’ Welfare Fund
Glossary of Terms
186