Embed Size (px)
Citation preview
_____________
Paria Naghipour, HX5 LLC, 212 Elgin Pkwy SE, Fort Walton Beach, Florida 32548, U.S.A. Steven M. Arnold, NASA Glenn Research Center, 21000 Brookpark Rd, Cleveland, OH 44135, U.S.A.
COVER SHEET
NOTE: This coversheet is intended for you to list your article title and author(s) name only
—this page will not appear on the Electronic Product.
Title: Quasi-Static and Dynamic Analysis of Composite Panels:
Challenges in Engineering-Level Commercial Software
American Society for Composites—Thirty-fifth Technical Conference
Authors (names are for example only): Paria Naghipour
Steven M. Arnold
PAPER DEADLINE: **17 July 2020**
PAPER LENGTH: **20**
SUBMISSION PROCEDURE: Information on the electronic submission of
manuscripts is provided on the conference web site.
INQUIRIES TO: See Editor
We encourage you to read attached Guidelines prior to preparing your paper—this will ensure
your paper is consistent with the format of the articles in the Electronic product.
NOTE: Please submit your paper in Microsoft Word® format or PDF if prepared in a program other than MSWord.Sample guidelines are shown with the correct margins.Follow the style from these guidelines for your page format.
Electronic file submission: When making your final PDF for submission make sure the box at“Printed Optimized PDF” is checked. Also—in Distiller—make certain all fonts are embedded in the document before making the final PDF.
_____________
Paria Naghipour, HX5 LLC, 212 Elgin Pkwy SE, Fort Walton Beach, Florida 32548, U.S.A. Steven M. Arnold, NASA Glenn Research Center, 21000 Brookpark Rd, Cleveland, OH 44135, U.S.A.
(FIRST PAGE OF ARTICLE)
ABSTRACT
In engineering applications, where analysis time and efficiency are essential,
analytical models and commercially available finite element (FE) material models
are the two mainstream methods used to analyze composite crush scenarios. A
reliable numerical model addressing the crushing response of composite materials
requires a nonlinear progressive damage analysis which includes appropriate failure
mechanisms such as matrix cracking, fragmentation, delamination, and fiber
breakage. One might be able to address all these interacting failure responses through
implementation/validation of a user defined material model or by utilization of a
commercially available model, the latter being the most efficient engineering
approach. In this paper, the quasi-static and dynamic crushing response of composite
specimens, consisting of a C-channel and a corrugated geometry manufactured with
carbon fiber/epoxy matrix fabric, are modeled using the progressive composite
damage model within ABAQUS. The novel part of this work, which has not been
previously addressed in the literature, is the utilization of a detailed parametric study
to optimize composite damage model parameters for a given quasi-static crush
simulation in ABAQUS. C-channel experiments were used to calibrate the model and
then refine/optimize a set of material parameters that best fit the experimental results.
These identical parameters were then used to simulate the crush response of the
corrugated channel specimens, thereby making it a pure prediction and not a double
recalibration. Next, the dynamic response of both panels were predicted, further
confirming the predictive capability of the developed numerical model. The effect of
parameter variation on the crush response is fully documented for future use in
engineering applications utilizing this specific ABAQUS damage model.
_____________
Paria Naghipour, HX5 LLC, 212 Elgin Pkwy SE, Fort Walton Beach, Florida 32548, U.S.A. Steven M. Arnold, NASA Glenn Research Center, 21000 Brookpark Rd, Cleveland, OH 44135, U.S.A.
Introduction
Building a reliable numerical model for an engineered-level analysis of quasi-static
and dynamic crushing response in composite structures is a particularly challenging
task. Several failure mechanisms, such as matrix cracking, fragmentation, delamination,
fiber tensile fracture and compressive kinking might lead to progressive crushing and
failure of a composite panel. In a research-based project with no time limits, one might
be able to address all these failure responses, however, the extensive computational
power required to complete this task is not efficient as an engineering approach. In
engineering applications, where analysis time and efficiency are essential, commercially
available finite element (FE) material models are the major mainstream method used to
analyze composite crush scenarios. Commercially available codes with built-in material
models, which are generally used by the engineering community to analyze crushing
behavior of composites, include LS-DYNA, ABAQUS Explicit, RADIOSS and PAM-
CRASH. These built-in material models have some similarities such as utilizing damage
initiation, damage propagation, and failure criteria based on physical (experimentally
measurable) material properties. However, every material model is implemented
differently and accompanied by some nonphysical model parameters, which cannot be
measured experimentally. These parameters often times have an important impact on
simulation accuracy, and therefore understanding their influence is crucial to developing
a reliable and predictive numerical model for composite crushing. Conducting a
parametric study on physical and nonphysical model parameters is essential to
understanding the effect of these properties on load-displacement response and crush
patterns of a given composite panel configuration. A robust built-in material model
should be able to reproduce experimental results reasonably well without the need to
extensively modify model parameters for each different composite geometry (shape and
layup) or model discretization. It also enables the user to determine an optimized set of
properties to produce reasonably acceptable results irrespective of composite geometry.
There are several works available in the literature addressing the crush response of
composite panels with different geometries; utilizing the built-in composite material
models in commercially available FE codes [5-15]. However, the influence of variations
in model parameters and material properties on the crushing behavior of composite
specimens is rarely addressed. In particular, Feraboli et al. [14], and Wade et al. [15]
utilized the LS-DYNA progressive failure material model (MAT54) [16] to simulate
crush experiments of seven different channel and corrugated coupons to further evaluate
the suitability of this material model for crush simulation. Results show that MAT54 is
capable of reproducing experimental results of different crush geometries, however, two
nonphysical parameters, i) the thickness of the crush trigger elements and ii) the MAT54
SOFT parameter (mathematical expedient to avoid global buckling), had to be
calibrated for each separate geometry. Although both papers [14-15] provide the
engineering community with additional insight into the influence of parametric
variation on the crush response, their FE models cannot be considered a predictive tool.
In this paper, the quasi-static and dynamic crushing response of composite
specimens, consisting of a C-channel and a corrugated geometry manufactured with
_____________
Paria Naghipour, HX5 LLC, 212 Elgin Pkwy SE, Fort Walton Beach, Florida 32548, U.S.A. Steven M. Arnold, NASA Glenn Research Center, 21000 Brookpark Rd, Cleveland, OH 44135, U.S.A.
carbon fiber/epoxy matrix fabric, are modeled using the progressive composite damage
model within ABAQUS [17]. The novel part of this work, which has not been
previously addressed in the literature, is the associated detailed parameter study
conducted to establish the sensitivity of the composite damage model available in
ABAQUS with respect to both physical and nonphysical model parameters under a
quasi-static crush scenario. The parametric study entails a systematic variation on
nonphysical model parameters (contact definition, loading curve, and maximum
damage parameter) and physical model parameters (directional strength and fracture
toughness) in the C-channel composite panel subjected to quasi-static crushing. C-
channel experiments were used to calibrate the model and then refine/optimize a set of
material parameters that best fit the experimental results. These identical parameters
were then used to simulate the crush response of the corrugated channel specimens,
thereby making it a pure prediction and not a double recalibration. Next, the dynamic
response of both panels were predicted, further confirming the predictive capability of
the developed numerical model. The effect of parameter variation on the crush response
is fully documented for future use in engineering applications utilizing this specific
ABAQUS damage model.
Experiment and Specimen Manufacturing
The material used in this study was a pre-impregnated composite, made from
braided T700S carbon fiber and TC275-1 dual-cured toughened epoxy, which had a
weight of 536 g (~1.2 lb) and was procured from Tencate Advanced Composites,
Morgan Hill, California. The dry carbon fiber braid was manufactured by A&P
Technologies, Summerside, Ohio, and consisted of a quasi-isotropic [0/+60/–60]S braid
(QISO H-59) with 24K tows in the axial direction (0° tows) and 12K tows in the bias
directions (±60° tows). Test articles were fabricated by hand lay-up of the
T700S/TC275-1 on an aluminum tool with the axial tows of each ply parallel to the
longitudinal axis of the tool. The laminated part was vacuum bagged and cured, as
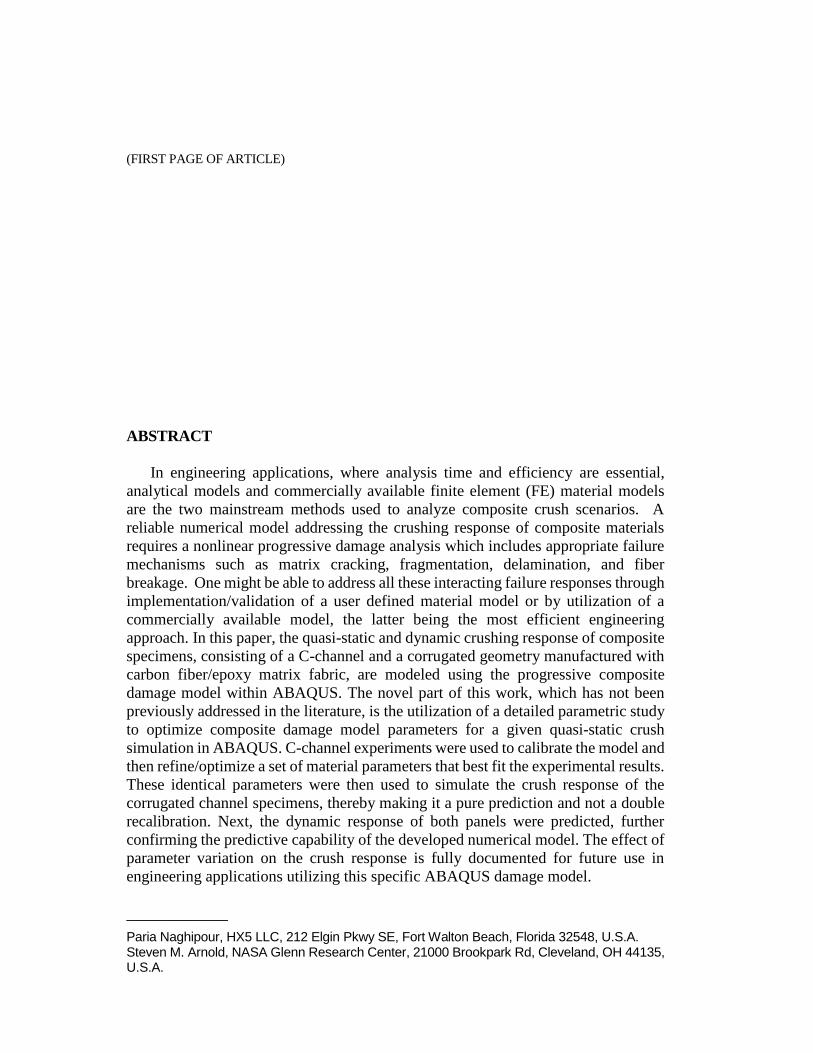
shown in Figure 1, using an autoclave following the vendor recommended five step cure
process: (1) apply full vacuum with an external pressure of 15 psi, (2) heat to 107°C at
a rate of 2.25°C/min, (3) increase pressure to 85 psi and hold for 60 min, (4) heat to
177°C at a rate of 2.25 °C/min, (5) release vacuum, hold for 120 min, and cool to 21 °C
at a rate of 1.1°C/min).
_____________
Paria Naghipour, HX5 LLC, 212 Elgin Pkwy SE, Fort Walton Beach, Florida 32548, U.S.A. Steven M. Arnold, NASA Glenn Research Center, 21000 Brookpark Rd, Cleveland, OH 44135, U.S.A.
Figure 1.—Processing of composite channel parts
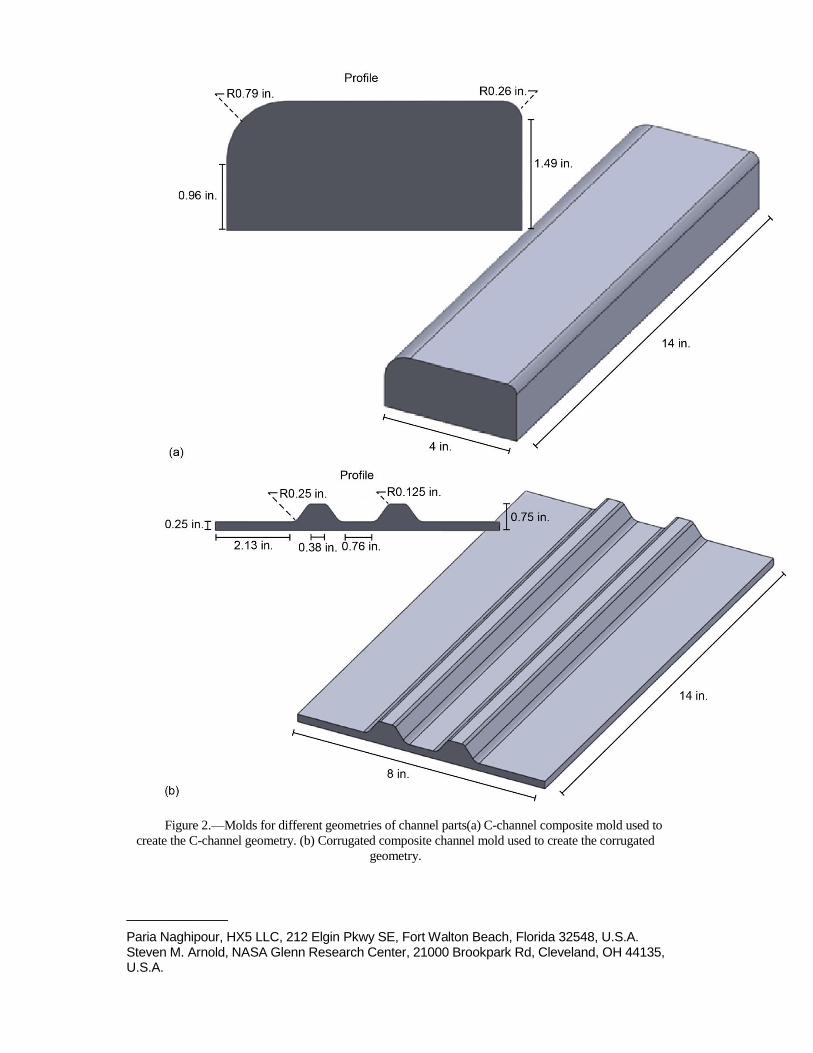
Two aluminum tools were used to produce two different composite channel
shapes. One type of channel had an open rectangular profile (referred to herein as a C-
channel specimen) as shown in Figure 2(a) with different radii defined for the two
corners. Another type of channel consisted of a corrugated profile defined in Figure 2(b)
(referred to herein as a corrugated specimen).Both channels were made with six
composite plies, and the average thickness was 0.135 in. The length of each channel
was approximately 14 in., such that two 5 in. long specimens were obtained from each
of the produced channels with the profile dimension show in Figure 2.
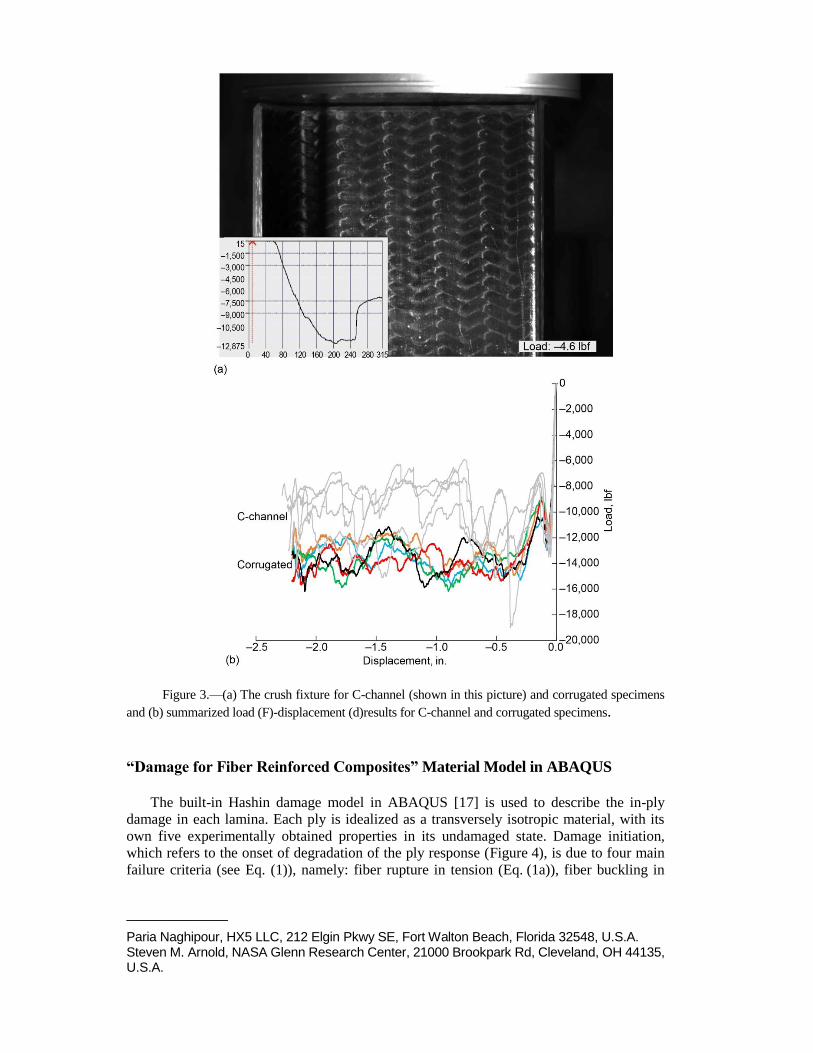
The specimens were machined with a single-sided 45° chamfer to favor the
initiation of stable crushing at one end of the specimen and to avoid undesirable initial
spikes in crush loads which may lead to a specimen instability. This chamfer is known
as the trigger, or crush initiator. Specimens were then tested in the vertical configuration,
resting on a polished hardened steel surface, at a compressive crosshead velocity of ~0.5
in./min. Five repetitions were conducted to obtain average data and ascertain the
repeatability of the experiment. A typical test setup, used for both C-channel and
corrugated specimens, is shown in Figure 3(a), and experimental results are summarized
in Figure 3(b). As it can be observed from the load-displacement data, good repeatability
was achieved for both specimens with a maximum of 11.6 and 3.3 percent variance in
average crush load for C-channel and corrugated panels, respectively.
_____________
Paria Naghipour, HX5 LLC, 212 Elgin Pkwy SE, Fort Walton Beach, Florida 32548, U.S.A. Steven M. Arnold, NASA Glenn Research Center, 21000 Brookpark Rd, Cleveland, OH 44135, U.S.A.
Figure 2.—Molds for different geometries of channel parts(a) C-channel composite mold used to
create the C-channel geometry. (b) Corrugated composite channel mold used to create the corrugated
geometry.
_____________
Paria Naghipour, HX5 LLC, 212 Elgin Pkwy SE, Fort Walton Beach, Florida 32548, U.S.A. Steven M. Arnold, NASA Glenn Research Center, 21000 Brookpark Rd, Cleveland, OH 44135, U.S.A.
Figure 3.—(a) The crush fixture for C-channel (shown in this picture) and corrugated specimens
and (b) summarized load (F)-displacement (d)results for C-channel and corrugated specimens.
“Damage for Fiber Reinforced Composites” Material Model in ABAQUS
The built-in Hashin damage model in ABAQUS [17] is used to describe the in-ply
damage in each lamina. Each ply is idealized as a transversely isotropic material, with its
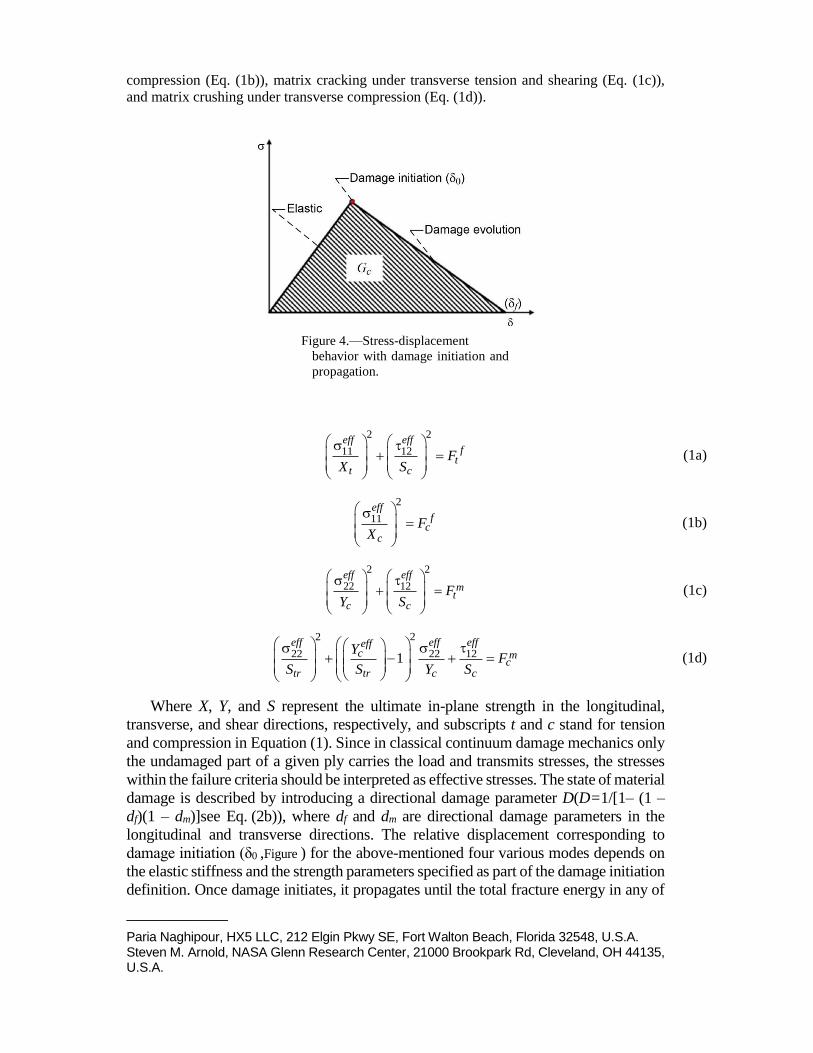
own five experimentally obtained properties in its undamaged state. Damage initiation,
which refers to the onset of degradation of the ply response (Figure 4), is due to four main
failure criteria (see Eq. (1)), namely: fiber rupture in tension (Eq. (1a)), fiber buckling in
_____________
Paria Naghipour, HX5 LLC, 212 Elgin Pkwy SE, Fort Walton Beach, Florida 32548, U.S.A. Steven M. Arnold, NASA Glenn Research Center, 21000 Brookpark Rd, Cleveland, OH 44135, U.S.A.
compression (Eq. (1b)), matrix cracking under transverse tension and shearing (Eq. (1c)),
and matrix crushing under transverse compression (Eq. (1d)).
Figure 4.—Stress-displacement
behavior with damage initiation and
propagation.
2 2
11 12eff eff
ft
t c
FX S
(1a)
2
11eff
fc
c
FX
(1b)
2 2
22 12eff eff
mt
c c
FY S
(1c)
22
22 22 121
eff eff effeffc m
ctr tr c c
YF
S S Y S
(1d)
Where X, Y, and S represent the ultimate in-plane strength in the longitudinal,
transverse, and shear directions, respectively, and subscripts t and c stand for tension
and compression in Equation (1). Since in classical continuum damage mechanics only
the undamaged part of a given ply carries the load and transmits stresses, the stresses
within the failure criteria should be interpreted as effective stresses. The state of material
damage is described by introducing a directional damage parameter D(D=1/[1– (1 –
df)(1 – dm)]see Eq. (2b)), where df and dm are directional damage parameters in the
longitudinal and transverse directions. The relative displacement corresponding to
damage initiation (δ0 ,Figure ) for the above-mentioned four various modes depends on
the elastic stiffness and the strength parameters specified as part of the damage initiation
definition. Once damage initiates, it propagates until the total fracture energy in any of
_____________
Paria Naghipour, HX5 LLC, 212 Elgin Pkwy SE, Fort Walton Beach, Florida 32548, U.S.A. Steven M. Arnold, NASA Glenn Research Center, 21000 Brookpark Rd, Cleveland, OH 44135, U.S.A.
the four mentioned cases reaches its maximum value (Gcmax). Gcmax corresponds to the
area under the triangle in Figure , specified by the user for each of the four mentioned
damage cases as separate input parameters. During damage evolution, three independent
nonnegative in-ply damage parameters, df, dm, and ds reduce the ply stiffness
numerically in the longitudinal, transverse, and shear directions, respectively, until the
final failure point (δf, Figure ) is reached. A mode-specific damage parameter (d ) and
the degradation of the ply stress tensor (σ) can be written as (Eq.(2)).
0
fiber, matrix, shear0
f
f
d
(2a)
11
22
12
1
1 1 1f m
Cd d
(2b)
11 22 21
11 12 22
21 12
1 1 1 0
1 1 1 0
0 0 1 1 1 1
f f m
f m m
f m s
E d d d E
C d d E E d
d d d G
C is the Stiffness matrix, E11, E22, and G12 are the longitudinal, transverse and in
plane shear modulus of the undamaged transversely isotropic lamina, and ν12 and
ν21are the two Poisson’s ratios. Detailed information regarding the mentioned in-ply
damage model such as damage evolution laws or constitutive equations can be found
in the ABAQUS manual [17]. Note ABAQUS uses the terminology fiber, matrix and
shear even though they speak of lamina properties, that is they associate the fiber
with the longitudinal direction, the matrix with the transverse, and shear with the in-
plane shear components.
Finite Element Model
The geometry of both C-shaped and corrugated panels consists of fabric plies
meshed with quadrilateral continuum shell elements (SC8R) with 3 translational
degrees of freedom, utilizing homogenized “composite-layup” in ABAQUS (Figure
5). The model was kept as homogenized to make comparisons with the available
results obtained through LS-DYNA in a previous internal study. Using shell elements
is a better option compared to 3D solid elements for capturing out-of-plane plate
bending. As a result of a mesh study (see [18] for details) a uniform square element
mesh density with element size of 0.04 by 0.04 in. was used to optimize efficiency
and also avoid aspect ratio problems in highly distorted elements for both geometries.
The total number of elements employed for the C-channel and corrugated panel were
132,774, and 120,328, respectively. The in-plane response of the fabric plies was
simulated with the built-in constitutive damage model in ABAQUS described in Eq.
1.
_____________
Paria Naghipour, HX5 LLC, 212 Elgin Pkwy SE, Fort Walton Beach, Florida 32548, U.S.A. Steven M. Arnold, NASA Glenn Research Center, 21000 Brookpark Rd, Cleveland, OH 44135, U.S.A.
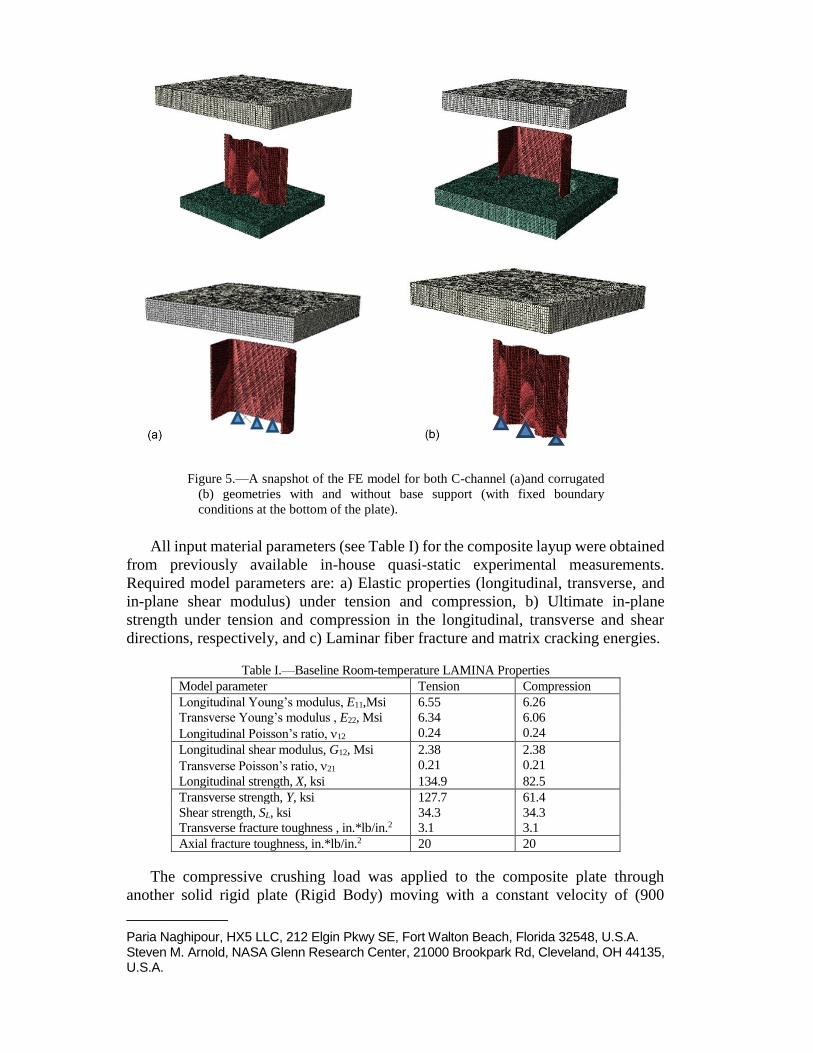
Figure 5.—A snapshot of the FE model for both C-channel (a)and corrugated
(b) geometries with and without base support (with fixed boundary
conditions at the bottom of the plate).
All input material parameters (see Table I) for the composite layup were obtained
from previously available in-house quasi-static experimental measurements.
Required model parameters are: a) Elastic properties (longitudinal, transverse, and
in-plane shear modulus) under tension and compression, b) Ultimate in-plane
strength under tension and compression in the longitudinal, transverse and shear
directions, respectively, and c) Laminar fiber fracture and matrix cracking energies.
Table I.—Baseline Room-temperature LAMINA Properties
Model parameter Tension Compression
Longitudinal Young’s modulus, E11,Msi 6.55 6.26
Transverse Young’s modulus , E22, Msi 6.34 6.06
Longitudinal Poisson’s ratio, 12 0.24 0.24
Longitudinal shear modulus, G12, Msi 2.38 2.38
Transverse Poisson’s ratio, 21 0.21 0.21
Longitudinal strength, X, ksi 134.9 82.5
Transverse strength, Y, ksi 127.7 61.4
Shear strength, SL, ksi 34.3 34.3
Transverse fracture toughness , in.*lb/in.2 3.1 3.1
Axial fracture toughness, in.*lb/in.2 20 20
The compressive crushing load was applied to the composite plate through
another solid rigid plate (Rigid Body) moving with a constant velocity of (900
_____________
Paria Naghipour, HX5 LLC, 212 Elgin Pkwy SE, Fort Walton Beach, Florida 32548, U.S.A. Steven M. Arnold, NASA Glenn Research Center, 21000 Brookpark Rd, Cleveland, OH 44135, U.S.A.
in./min). The smooth step definition method in ABAQUS was utilized to define
applied loading and avoid sudden changes in load application. This method can be
used to define the amplitude (loading) between two consecutive data points to ramp
up or down smoothly from one amplitude value to another. As with any other explicit
solver, to achieve efficient and economic quasi-static simulations, either the loading
rate has to be artificially increased, or mass-scaling (artificially increasing the
material density) should be utilized. In order to make sure the increase in the rate or
the mass did not influence the solution, the kinetic energy (KE) of the plate was
checked and compared to the internal energy of the system. As long as the KE was a
small fraction of the internal energy (KE < 1 percent of internal energy), inertial
effects were considered to be negligible. Here, this artificial increase of the loading
velocity has no effect on the analysis results; dynamic effects only become significant
beyond a velocity of (3000 in./min). For dynamic simulations, the velocity is set to
be 52800 in/min (50 mph) as tested at the GRC dynamic impact Lab. At these high
velocities inertia effects become significant, and the mass/inertia matrix should be
constituted carefully. No mass scaling was used in this analysis. The thickness of one
layer of elements in the top portion of the specimen was halved to simulate the
45chamfer acting as a crush initiator/trigger. In other words, the trigger is modeled
as a single row of reduced thickness elements at the crush front of the specimen. The
contact between the composite and the test rig were modeled using both the general
contact and contact pair algorithms of ABAQUS explicit (see next section for
comparison). After damage initiation and final propagation, the general contact
definition was automatically updated to account for possible post-damage contact. A
snapshot of the FE model for both geometries are shown in Figure 5 with fixed base
support (modeled as a rigid body), and without base support (with fixed boundary
conditions at the bottom of the composite plate to save computational time). These
two boundary conditions (with and without base support) were studied in detail [18],
and it was concluded that removing the bottom rigid support and eliminating
boundary nonlinearity (contact) could further improve model efficiency without
compromising accuracy.
Results and Discussion I: Parametric Studies
After studying mesh quality and improving computational efficiency of the FEA
model, the experimentally measured directional strength values were varied
simultaneously (between 10 to 20 percent) to assess the effect of these changes on
the load-displacement response of the C-channel panel. As reported in detail in [18],
a homogenous decrease/increase of 10, 15, and 20 percent in the compressive and
shear strengths has a notable impact on the peak load, and implicitly affects the post-
peak part of the crushing response. The pre-peak slope is primarily dominated by the
experimentally measured elastic moduli, and constituents an important parameter for
successfully reproducing the pre-peak slope of the crushing response. Hence, there
was no need for a parameter study including elastic moduli variation. The best match
with the experimental results (less than 3% error in the peak load estimation) is
_____________
Paria Naghipour, HX5 LLC, 212 Elgin Pkwy SE, Fort Walton Beach, Florida 32548, U.S.A. Steven M. Arnold, NASA Glenn Research Center, 21000 Brookpark Rd, Cleveland, OH 44135, U.S.A.
obtained with a 15 percent decrease in the directional (transverse) compressive and
shear strength (See [18] for more details).
Next, the quasi-static crush response of the C-channel was also examined with
respect to variations in experimentally measured fracture toughness values. With
higher/lower fracture toughness values, a correspondingly higher/lower mean post-
peak crush load was observed (see [18] for details). It is also worth mentioning that
there is no set standard for measuring in-plane fracture toughness in a composite
panel, much less a braided composite. Therefore, a wide variability in the in-plane
fracture toughness values due to the testing method is common. This can make the
variation margin much larger for the purpose of a parametric study, which might in
turn have significant effects on the post-peak mean crushing load of a composite
panel. However, since a change of 10 to 20 percent from the experimental fracture
toughness values measured at GRC yields reasonably good results, no further
variations were conducted. Results are reported in more detail in [18].
In addition to experimentally measurable material properties, the effect of
nonphysical model parameters (maximum damage parameter (dmax), contact
definition, loading curve) on the crushing response of the C-channel was also studied.
In order to mitigate the instability caused by the default dmax definition in ABAQUS
and also to understand the influence of this non-physical parameter on load-
displacement response, this variable was varied (0.81-0.99) in the analysis and the
results were summarized in [18]. It was observed that the change in dmax affects the
post-peak slope of the load-displacement curve, but not the peak load itself. This, in
conjunction with some variation in fracture toughness values, can be utilized as a
very useful tool to gain more control over the post-peak slope in a crush scenario
while preserving the peak load, as long as dmax is only lowered to a reasonable value.
On the other hand, the effect of loading curve and contact definitions were negligible
on the load-displacement response of the C-channel (details in [18]).
With the experimental variability observed in a given crushing scenario, picking
a load-displacement curve closest to the average experimental data is very subjective.
Here, a combination of a 15 percent reduction in strength and a 20 percent increase
in fracture toughness with a maximum damage parameter set to 0.9 seemed to capture
the peak load, the post-peak crush regimen and the final displacement very closely.
Results and Discussion II: Panel Simulations (Quasi-static and Dynamic)
After studying the influence of physical and nonphysical model parameters on
the load-displacement response of the C-channel, an optimized set of model
parameters (Table II) was compiled to model the crushing response of this panel and
compare it to experimental results (Figure 6). This was done by picking the properties
that provide the best (subjective) fit with the experimental results. As mentioned
earlier, one can say that the baseline curve provides a reasonably good simulation of
the crushing scenario, considering experimental variability. However, this study aims
to shed more light on how parameter variation affects the crushing response rather
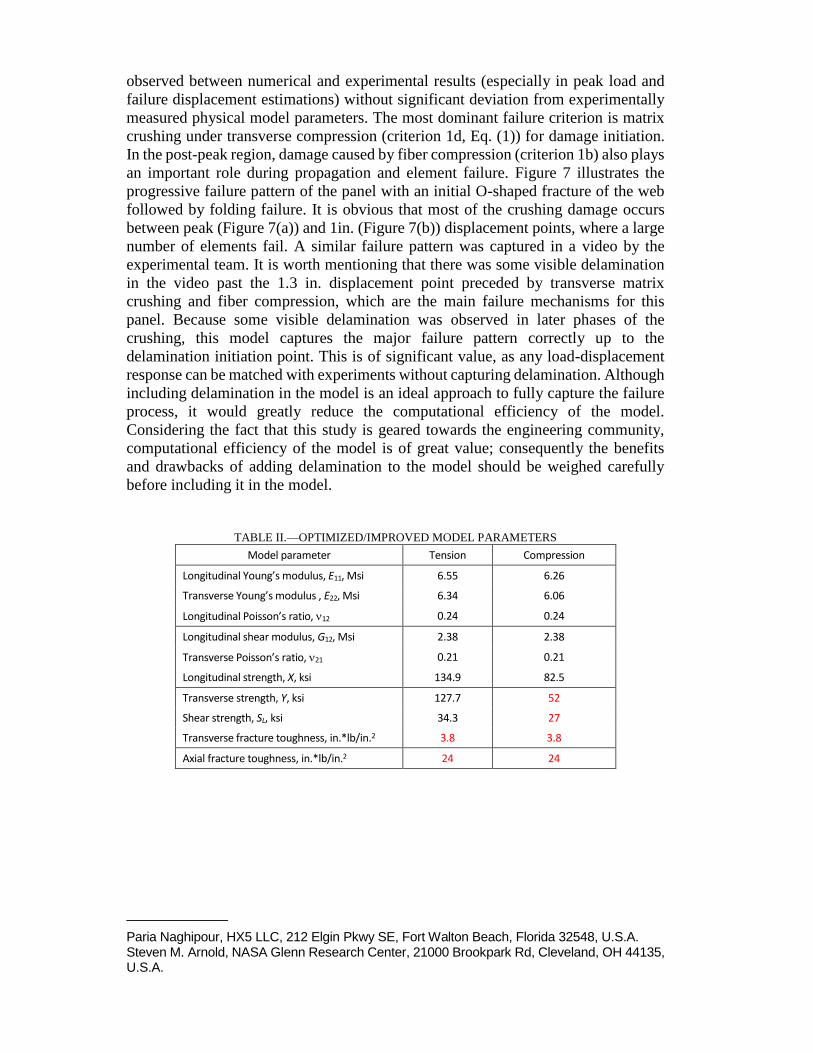
than just matching the experiments. Modified physical parameters from baseline (see
Table I) are shown in red in Table II. One can see that a better agreement was
_____________
Paria Naghipour, HX5 LLC, 212 Elgin Pkwy SE, Fort Walton Beach, Florida 32548, U.S.A. Steven M. Arnold, NASA Glenn Research Center, 21000 Brookpark Rd, Cleveland, OH 44135, U.S.A.
observed between numerical and experimental results (especially in peak load and
failure displacement estimations) without significant deviation from experimentally
measured physical model parameters. The most dominant failure criterion is matrix
crushing under transverse compression (criterion 1d, Eq. (1)) for damage initiation.
In the post-peak region, damage caused by fiber compression (criterion 1b) also plays
an important role during propagation and element failure. Figure 7 illustrates the
progressive failure pattern of the panel with an initial O-shaped fracture of the web
followed by folding failure. It is obvious that most of the crushing damage occurs
between peak (Figure 7(a)) and 1in. (Figure 7(b)) displacement points, where a large
number of elements fail. A similar failure pattern was captured in a video by the
experimental team. It is worth mentioning that there was some visible delamination
in the video past the 1.3 in. displacement point preceded by transverse matrix
crushing and fiber compression, which are the main failure mechanisms for this
panel. Because some visible delamination was observed in later phases of the
crushing, this model captures the major failure pattern correctly up to the
delamination initiation point. This is of significant value, as any load-displacement
response can be matched with experiments without capturing delamination. Although
including delamination in the model is an ideal approach to fully capture the failure
process, it would greatly reduce the computational efficiency of the model.
Considering the fact that this study is geared towards the engineering community,
computational efficiency of the model is of great value; consequently the benefits
and drawbacks of adding delamination to the model should be weighed carefully
before including it in the model.
TABLE II.—OPTIMIZED/IMPROVED MODEL PARAMETERS
Model parameter Tension Compression
Longitudinal Young’s modulus, E11, Msi 6.55 6.26
Transverse Young’s modulus , E22, Msi 6.34 6.06
Longitudinal Poisson’s ratio, 12 0.24 0.24
Longitudinal shear modulus, G12, Msi 2.38 2.38
Transverse Poisson’s ratio, 21 0.21 0.21
Longitudinal strength, X, ksi 134.9 82.5
Transverse strength, Y, ksi 127.7 52
Shear strength, SL, ksi 34.3 27
Transverse fracture toughness, in.*lb/in.2 3.8 3.8
Axial fracture toughness, in.*lb/in.2 24 24
_____________
Paria Naghipour, HX5 LLC, 212 Elgin Pkwy SE, Fort Walton Beach, Florida 32548, U.S.A. Steven M. Arnold, NASA Glenn Research Center, 21000 Brookpark Rd, Cleveland, OH 44135, U.S.A.
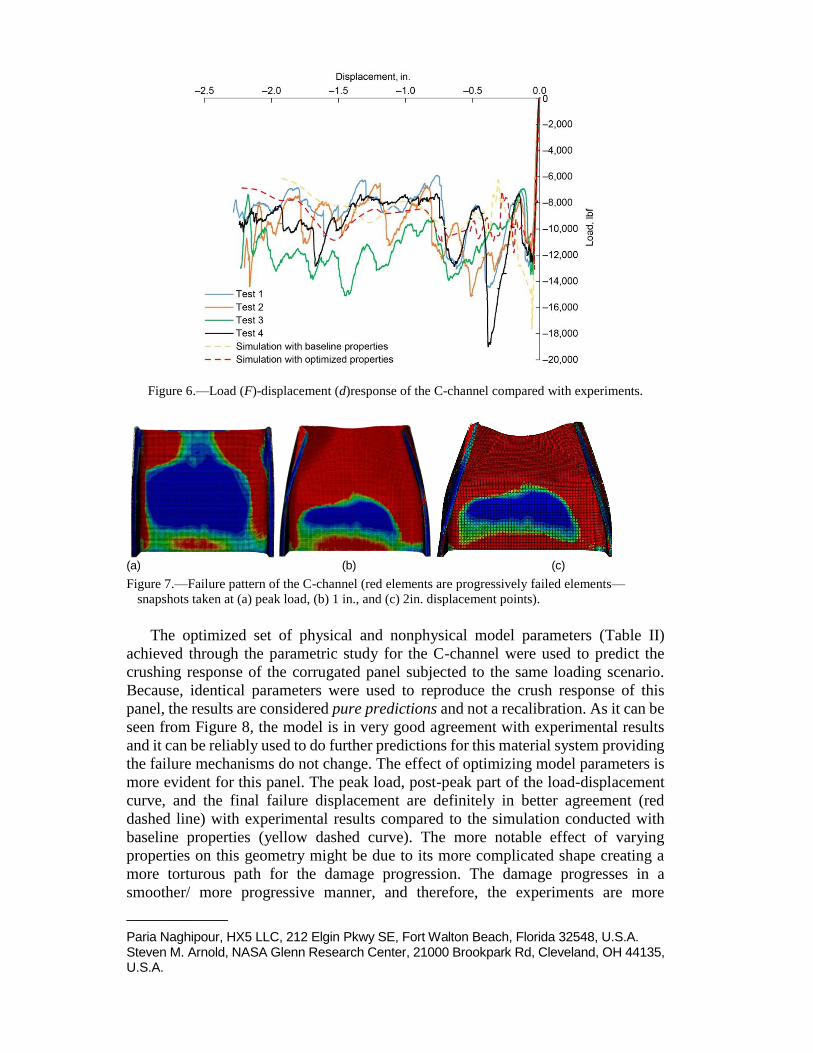
Figure 6.—Load (F)-displacement (d)response of the C-channel compared with experiments.
(a) (b) (c)
Figure 7.—Failure pattern of the C-channel (red elements are progressively failed elements—
snapshots taken at (a) peak load, (b) 1 in., and (c) 2in. displacement points).
The optimized set of physical and nonphysical model parameters (Table II)
achieved through the parametric study for the C-channel were used to predict the
crushing response of the corrugated panel subjected to the same loading scenario.
Because, identical parameters were used to reproduce the crush response of this
panel, the results are considered pure predictions and not a recalibration. As it can be
seen from Figure 8, the model is in very good agreement with experimental results
and it can be reliably used to do further predictions for this material system providing
the failure mechanisms do not change. The effect of optimizing model parameters is
more evident for this panel. The peak load, post-peak part of the load-displacement
curve, and the final failure displacement are definitely in better agreement (red
dashed line) with experimental results compared to the simulation conducted with
baseline properties (yellow dashed curve). The more notable effect of varying
properties on this geometry might be due to its more complicated shape creating a
more torturous path for the damage progression. The damage progresses in a
smoother/ more progressive manner, and therefore, the experiments are more
_____________
Paria Naghipour, HX5 LLC, 212 Elgin Pkwy SE, Fort Walton Beach, Florida 32548, U.S.A. Steven M. Arnold, NASA Glenn Research Center, 21000 Brookpark Rd, Cleveland, OH 44135, U.S.A.
repeatable (as seen from the tests in Figure 8), eliminating extreme fluctuations.
Moreover, the crushing behavior of the geometry becomes more sensitive to
parametric variation. The failure pattern of the corrugated panel is depicted in Figure
9, where one can see initial fracturing of the top portion followed by corner fractures
spreading along the entire specimen. Similar findings were observed in the video
captured in the GRC impact lab. Similar to the C-channel there is some visible
delamination in the video in later phases of the crushing so the model can be said to
capture the major failure pattern correctly up to the delamination initiation point.
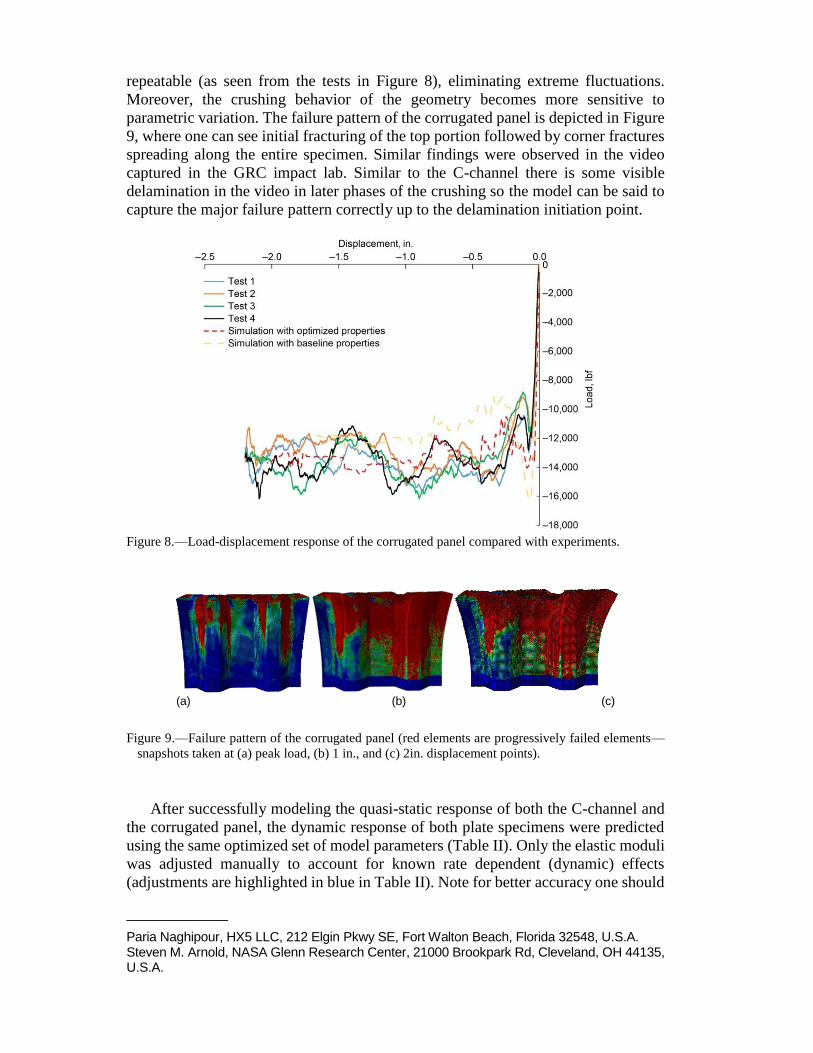
Figure 8.—Load-displacement response of the corrugated panel compared with experiments.
(a) (b) (c)
Figure 9.—Failure pattern of the corrugated panel (red elements are progressively failed elements—
snapshots taken at (a) peak load, (b) 1 in., and (c) 2in. displacement points).
After successfully modeling the quasi-static response of both the C-channel and
the corrugated panel, the dynamic response of both plate specimens were predicted
using the same optimized set of model parameters (Table II). Only the elastic moduli
was adjusted manually to account for known rate dependent (dynamic) effects
(adjustments are highlighted in blue in Table II). Note for better accuracy one should
_____________
Paria Naghipour, HX5 LLC, 212 Elgin Pkwy SE, Fort Walton Beach, Florida 32548, U.S.A. Steven M. Arnold, NASA Glenn Research Center, 21000 Brookpark Rd, Cleveland, OH 44135, U.S.A.
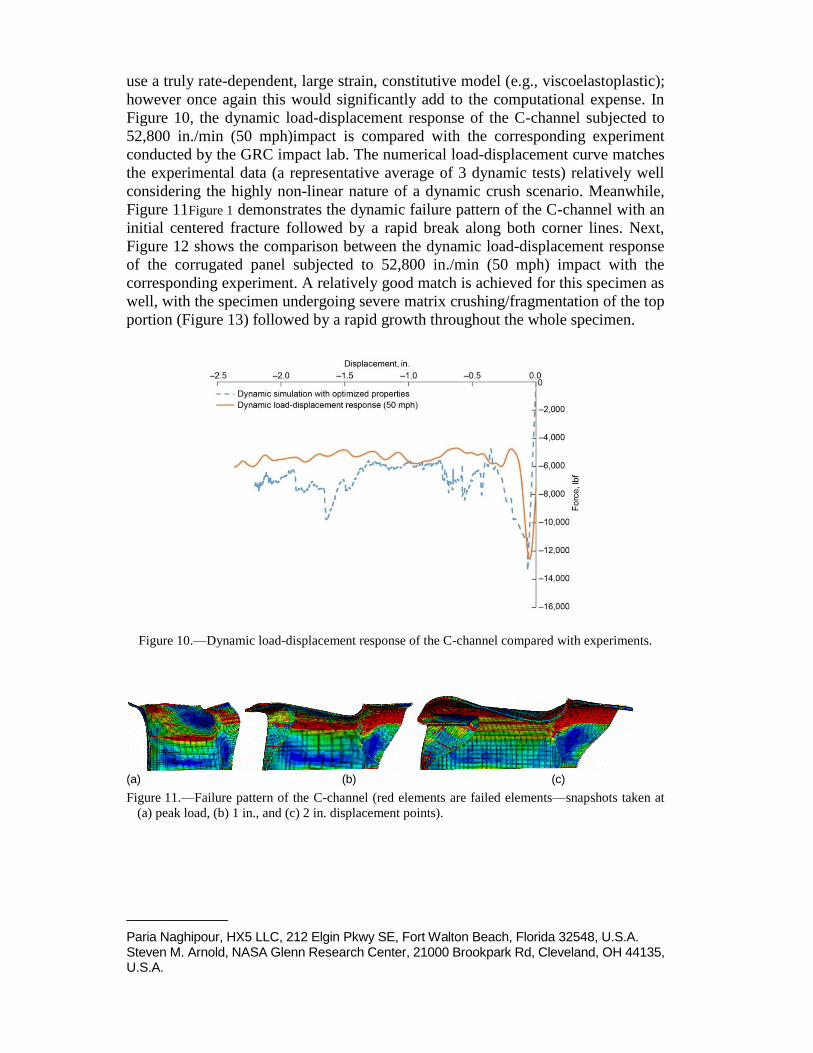
use a truly rate-dependent, large strain, constitutive model (e.g., viscoelastoplastic);
however once again this would significantly add to the computational expense. In
Figure 10, the dynamic load-displacement response of the C-channel subjected to
52,800 in./min (50 mph)impact is compared with the corresponding experiment
conducted by the GRC impact lab. The numerical load-displacement curve matches
the experimental data (a representative average of 3 dynamic tests) relatively well
considering the highly non-linear nature of a dynamic crush scenario. Meanwhile,
Figure 11Figure 1 demonstrates the dynamic failure pattern of the C-channel with an
initial centered fracture followed by a rapid break along both corner lines. Next,
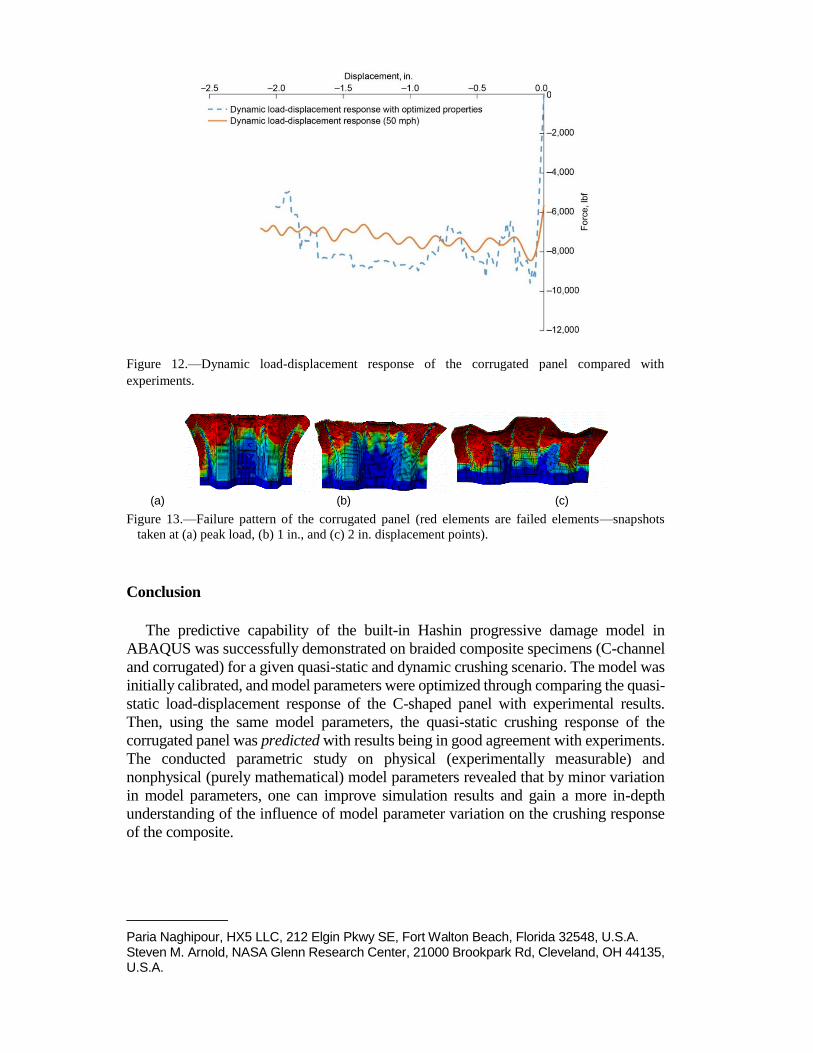
Figure 12 shows the comparison between the dynamic load-displacement response
of the corrugated panel subjected to 52,800 in./min (50 mph) impact with the
corresponding experiment. A relatively good match is achieved for this specimen as
well, with the specimen undergoing severe matrix crushing/fragmentation of the top
portion (Figure 13) followed by a rapid growth throughout the whole specimen.
Figure 10.—Dynamic load-displacement response of the C-channel compared with experiments.
(a) (b) (c)
Figure 11.—Failure pattern of the C-channel (red elements are failed elements—snapshots taken at
(a) peak load, (b) 1 in., and (c) 2 in. displacement points).
_____________
Paria Naghipour, HX5 LLC, 212 Elgin Pkwy SE, Fort Walton Beach, Florida 32548, U.S.A. Steven M. Arnold, NASA Glenn Research Center, 21000 Brookpark Rd, Cleveland, OH 44135, U.S.A.
Figure 12.—Dynamic load-displacement response of the corrugated panel compared with
experiments.
(a) (b) (c)
Figure 13.—Failure pattern of the corrugated panel (red elements are failed elements—snapshots
taken at (a) peak load, (b) 1 in., and (c) 2 in. displacement points).
Conclusion
The predictive capability of the built-in Hashin progressive damage model in
ABAQUS was successfully demonstrated on braided composite specimens (C-channel
and corrugated) for a given quasi-static and dynamic crushing scenario. The model was
initially calibrated, and model parameters were optimized through comparing the quasi-
static load-displacement response of the C-shaped panel with experimental results.
Then, using the same model parameters, the quasi-static crushing response of the
corrugated panel was predicted with results being in good agreement with experiments.
The conducted parametric study on physical (experimentally measurable) and
nonphysical (purely mathematical) model parameters revealed that by minor variation
in model parameters, one can improve simulation results and gain a more in-depth
understanding of the influence of model parameter variation on the crushing response
of the composite.
_____________
Paria Naghipour, HX5 LLC, 212 Elgin Pkwy SE, Fort Walton Beach, Florida 32548, U.S.A. Steven M. Arnold, NASA Glenn Research Center, 21000 Brookpark Rd, Cleveland, OH 44135, U.S.A.
Lessons learned:
By defining proper boundary conditions at the base of the specimen itself, the
base support can be removed from the model to reduce computational time
without compromising accuracy. This also holds true in case of a dynamic
impact, as long as the mass of the impactor is lower compared to the support
mass.
In order to gain a better understanding of the influence of model parameter
variation on the crushing response of the composite, a small-scale parameter
study was very helpful. For the composite damage model available in
ABAQUS:
1. Increasing/decreasing lamina strength has a notable impact on the peak
crush load with some degree of influence on the post-peak slope.
2. With higher/lower fracture toughness values, the mean post-peak crush
load seems to be higher/lower, respectively. However, because of the
highly nonlinear nature of the crushing mechanism in the post-peak
region, most of the obtained load-displacement results lay in the
“acceptable” range. Since there are no standardized test for measuring in-
plane fracture toughness values, the parameter variation margin can be
very wide. This gives the user more leverage on controlling the post-peak
behavior of a given laminate.
3. By default, the upper bound to all damage variables at a material point in
ABAQUS is set to dmax=1. This high value of dmax can cause solution
instability and convergence problems. Although a completely damaged
element is typically defined as an element with a dmax~ 1, one can still
lower the limit to a reasonable degree (~0.85) to avoid the instability
caused by the default dmax definition in ABAQUS, and still preserve
solution accuracy.
4. Contact definitions (general vs. contact pairs) and loading curve slope
(applied as smooth step) do not seem to have any notable impact on load-
displacement results in the quasi-static crushing scenario.
Finally the predictive capability of the model was assessed using the available
dynamic crush test results performed at the GRC Impact Lab. The same set of
optimized model parameters was used to simulate the dynamic crushing response of
both the C-channel and the corrugated panel, making both simulations “pure
predictions” rather than calibrations. Reasonably good agreement was achieved for
both panels considering the highly-nonlinear nature of the dynamic crushing
scenario. Although further geometrical variations are required to fully assure the
predictive capability of the model, this article demonstrates that with a short
parametric study, one can achieve relatively reliable results with readily available
engineering tools in ABAQUS.
_____________
Paria Naghipour, HX5 LLC, 212 Elgin Pkwy SE, Fort Walton Beach, Florida 32548, U.S.A. Steven M. Arnold, NASA Glenn Research Center, 21000 Brookpark Rd, Cleveland, OH 44135, U.S.A.
Acknowledgement
The authors acknowledge the financial support of NASA Glenn Research Center and Honda
R&D Americas, Inc., (SAA3-1304) and the Advanced Composites Program, as well as the
constructive communications with Honda Senior Engineers; Allen Sheldon and Duane Detweiler.
References
1. Carruthers JJ, Kettle AP, Robinson AM. Energy absorption capability and crashworthiness of
composite material structures: a review. ApplMech Rev 1998;51:635–49.Metzger, J.W; “The
behavior of ablating carbon phenolic”, AIAA Paper 72-363, April, 1972
2. Farley GL, Jones RM. Crushing characteristics of continuous fiber-reinforced composite tubes.
J Compos Mater 1992;26(1):37–50.
3. Hinton MJ, Kaddour AS, Soden PD. A comparison of the predictive capabilities of current
failure theories for composite laminates, judged against experimental evidence. Compos
SciTechnol 2002;62(12–13):1725–97.
4. Feraboli P, Rassaian M. Proceedings of the CMH-17 (MIL-HDBK-17) Crashworthiness
Working Group Numerical Round Robin. Costa Mesa, CA, July 2010.
5. Esnaola A, Elguezabal B, AurrekoetxeaJ, Gallego I, Ulacia I. Optimization of the semi-
hexagonal geometry of a composite crus structure by finite element analysis. Composites Part B
2016;93:56-66.
6. Bussadori BP, Schuffenhauer K, Scattina A. Modelling of CFRP crushing structures in explicit
crash analysis. Composites: Part B 2014;60:725–735.
7. Azimi MB, Asgari M. A new bi-tubular conical circular structure for improving crushing
behavior under axial and oblique impacts. International Journal of Mechanical Sciences
2016;105:253–265.
8. Ramos D. Master Thesis: Composite structures impact simulation behavior. TecnicoLisboa.
2014.
9. Chiu LNS, Falzon BGBoman R, Chen B, Yan W. Finite element modelling of composite
structures under crushing load. Composite Structures 2015;131:215–228.
10. El-Hage H, Mallick P K, Zamani N. Numerical modelling of quasi-static axial crush of square
aluminum-composite hybrid tubes, International Journal of Crashworthiness, 2004; 9(6): 653-
664, DOI: 10.1533/ijcr.2004.0320
11. Chien-Hua, HuangYa-Jung Lee. Experiments and simulation of the static contact crush of
composite laminated plates. Composite Structures 2003;61(3):265-270
12. Naghipour P, Aktay L, Johnson A. Numerical investigation of structural crash response of thin-
walled structures on soft soil. Materials and Design 2008; 29 (10):2052-2060.
13. Littell D, Jackson KE, Annett MS, Seal MD, Fasanella EL. The Development of Two
Composite Energy Absorbers for Use in a Transport Rotorcraft Airframe Crash Testbed
(TRACT 2) Full-Scale Crash Test. 71st AHS International Annual Forum and Technology
Display; 5-7 May 2015; Virginia Beach, VA; United States. (ID:20160005978).
14. Feraboli P, Wade B, Deleo F, Rassaian M, Higgins M, Byar A. LS-DYNA MAT54 modeling of
the axial crushing of a composite tape sinusoidal specimen. Composites: Part A, 2011;42:1809-
25.
15. Wade B, Feraboli P, Rassaian M. LS-DYNA MAT54 modeling of the axial crushing of
composite fabric channel and corrugated section specimens. Joint Advanced Materials &
_____________
Paria Naghipour, HX5 LLC, 212 Elgin Pkwy SE, Fort Walton Beach, Florida 32548, U.S.A. Steven M. Arnold, NASA Glenn Research Center, 21000 Brookpark Rd, Cleveland, OH 44135, U.S.A.
Structures Center of Excellence (JAMS) Technical Review. Crashworthiness and Aeroelasticity,
2014. Seattle, Washington.
16. LS-DYNA User’s manual, Volume II Material Models. 2014 (LS-DYNA R7.1)
17. ABAQUS Analysis User’s Guide 6.14. 2014.
18. Naghipour P, Arnold S.M, Lerch B.A, Roberts G, Pereira J.M, Ruggeri C.R. -Static and
Dynamic Analysis of Composite Panels: Characterization and Validation. NASA/TM—2019-
220350.