Embed Size (px)
Citation preview
COVER SHEET
A 1 9 9 9 1 0 0 6 5
SEC Registration Number
C O L F I N A N C I A L G R O U P , I N C . A N D S U B S I
D I A R I E S
(Company’s Full Name)
2 4 0 1 B E a s t T o w e r , T e k t i t e T o w e r s
E x c h a n g e R o a d , O r t i g a s C e n t e r , P a
s i g C i t y
(Business Address: No. Street City/Town/Province)
Ms. Catherine L. Ong 8636-5411
(Contact Person) (Company Telephone Number)
1 2 3 1 17-Q
Month Day (Form Type) Month Day
(Calendar
Year)
June 30, 2021 (Annual
Meeting)
Broker
(Secondary License Type, If Applicable)
CFD Not Applicable
Dept. Requiring this Doc. Amended Articles
Number/section
Total Amount of Borrowings
34
Total No. of Stockholders Domestic Foreign
To be accomplished by SEC Personnel concerned
File Number LCU
Document ID Cashier
S T A M P S
Remarks: Please use BLACK ink for scanning purposes.
2
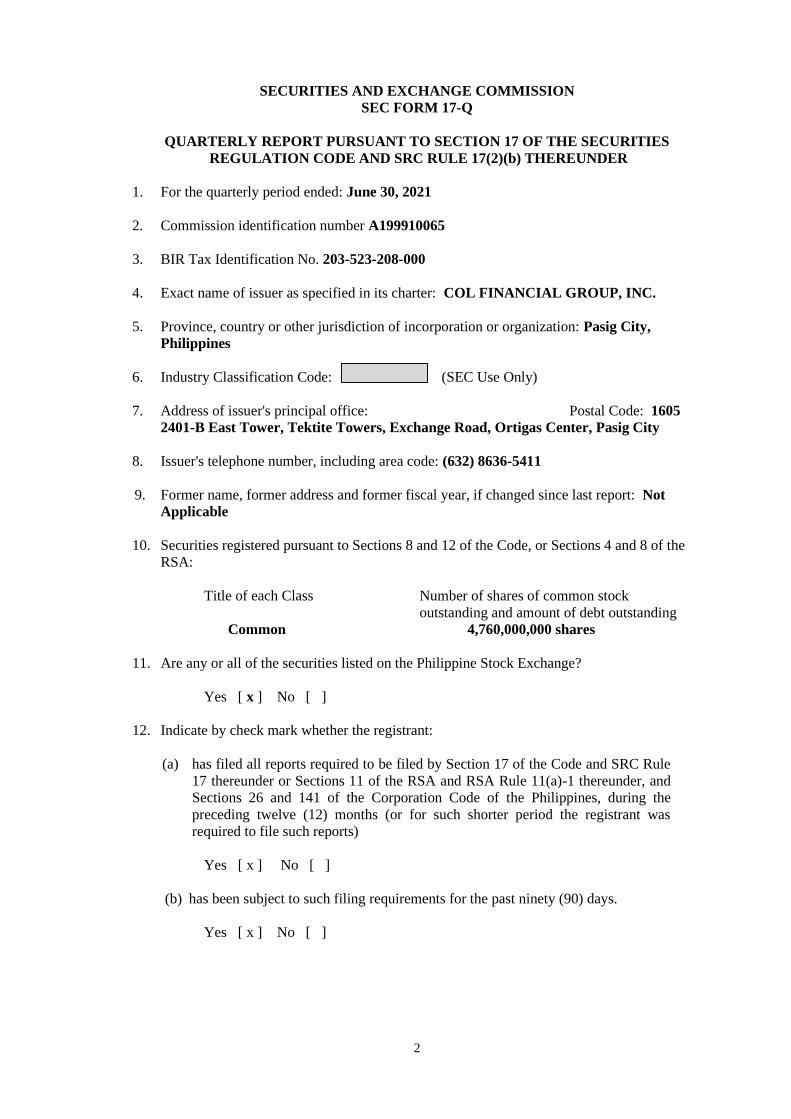
SECURITIES AND EXCHANGE COMMISSION
SEC FORM 17-Q
QUARTERLY REPORT PURSUANT TO SECTION 17 OF THE SECURITIES
REGULATION CODE AND SRC RULE 17(2)(b) THEREUNDER
1. For the quarterly period ended: June 30, 2021
2. Commission identification number A199910065
3. BIR Tax Identification No. 203-523-208-000
4. Exact name of issuer as specified in its charter: COL FINANCIAL GROUP, INC.
5. Province, country or other jurisdiction of incorporation or organization: Pasig City,
Philippines
6. Industry Classification Code: (SEC Use Only)
7. Address of issuer's principal office: Postal Code: 1605
2401-B East Tower, Tektite Towers, Exchange Road, Ortigas Center, Pasig City
8. Issuer's telephone number, including area code: (632) 8636-5411
9. Former name, former address and former fiscal year, if changed since last report: Not
Applicable
10. Securities registered pursuant to Sections 8 and 12 of the Code, or Sections 4 and 8 of the
RSA:
Title of each Class Number of shares of common stock
outstanding and amount of debt outstanding
Common 4,760,000,000 shares
11. Are any or all of the securities listed on the Philippine Stock Exchange?
Yes [ x ] No [ ]
12. Indicate by check mark whether the registrant:
(a) has filed all reports required to be filed by Section 17 of the Code and SRC Rule
17 thereunder or Sections 11 of the RSA and RSA Rule 11(a)-1 thereunder, and
Sections 26 and 141 of the Corporation Code of the Philippines, during the
preceding twelve (12) months (or for such shorter period the registrant was
required to file such reports)
Yes [ x ] No [ ]
(b) has been subject to such filing requirements for the past ninety (90) days.
Yes [ x ] No [ ]
3
PART I – FINANCIAL INFORMATION
Item 1. Financial Statements.
The unaudited consolidated financial statements are filed as part of this Form 17-Q.
Item 2. Management’s Discussion and Analysis (MD&A) of Financial Conditions and
Results of Operations.
The following is a discussion and analysis of the financial performance of COL Financial Group,
Inc. (“COL”, “COL Financial”, or “the Parent Company”) and its subsidiaries collectively
referred to as “the Group”. The discussion aims to provide readers with an appreciation of its
business model and the key factors underlying its financial results. The MD&A should be read
in conjunction with the unaudited consolidated financial statements of the Group filed as part of
this report.
Company Overview
COL Financial Group, Inc., a publicly listed company in the Philippine Stock Exchange (PSE), is
the leading online financial services provider in the Philippines. Incorporated on August 16, 1999,
COL aims to be the most trusted wealth-building partner of every Filipino that provides practical
and ethical financial products through value-driven and innovative solutions to help them achieve
their financial goals.
After completing and passing the rigid regulatory requirements, COL launched in January 2001
its proprietary online trading platform. Through www.colfinancial.com, COL offers real-time
market information and execution, superior investing tools and functionalities, and comprehensive
stock market research and analysis to guide independent investors make well-informed investment
decisions.
To provide investors with online access to the HK stock market, COL established its wholly-
owned foreign subsidiary COL Securities (HK) Limited (the “HK Subsidiary” or “COLHK”) on
June 20, 2001. COLHK customers’ access to the global markets was further expanded when
COLHK entered into a non-disclosed broker account with Interactive Brokers (IB) in August 2014,
which allowed its customers to gain access and electronically trade global equity markets including
but not limited to Japan, USA, Singapore, Germany, and China (via Shanghai-Hong Kong Stock
Connect).
As part of COL’s commitment to provide more useful products and services to help its customers
build genuine wealth, COL launched in July 2015 COL Fund Source, the first and leading online
mutual fund supermarket in the Philippines which provides investors access to a wide selection of
mutual funds.
To diversify COL’s portfolio as a one-stop shop online platform for capital market products,
it has set up in 2019 its own asset management firm, COL Investment Management Inc. (CMI)
to serve as the fund manager for COL Equity Index Unitized Mutual Fund Inc. (CEIUMF) and
COL Cash Management Unitized Mutual Fund Inc. (CCMUF).
Business Model
COL Financial derives a significant proportion of its revenues from its stock brokerage business
in the Philippines. Most of the revenues generated from its Philippine operations include:
1) commission generated from stock trades, 2) interest income from margin financing, and 3)
interest income made from short-term placements.
4
COL also derives revenues from the trail fees arising from its fund distribution business and
from commissions earned by its stock brokerage business in HK through its wholly-owned
subsidiary COLHK.
With its solid foundation deeply rooted in its core values of passion, integrity, commitment,
excellence and teamwork, COL is well-positioned to capitalize both on the anticipated
development of the capital markets as well as the vast opportunities of increasing the retail
investor base in the Philippines.
Industry and Economic Review
Philippine stocks performed poorly during the first half of 2021, with the Philippine Stock
Exchange index (PSEi) ending the year-to-date period lower by 3.3%.
Stocks fell after excitement over the availability of vaccines that would allow the world to defeat
the COVID-19 pandemic was overcome by concerns brought about by numerous issues affecting
the Philippine economy in the short term.
Inflation rate jumped to an average of 4.4% during the first half, exceeding the 2.0% to 4.0%
target range of the Bangko Sentral ng Pilipinas (BSP) as food and transportation prices went up
sharply.
Moreover, the number of daily new COVID-19 cases jumped sharply beginning in March,
overwhelming the healthcare system. To control the spread of the virus, the government
reimposed the enhanced community quarantine (ECQ), which is the strictest form of lockdown,
in the national capital region (NCR) and four neighboring provinces beginning the last week of
March. The imposition of tighter mobility restrictions hurt sentiment for stocks given its
negative implication on the country’s economic recovery which is already the slowest in the
region.
Finally, the vaccination program was very much delayed. As such, as of end June, only 7.0% of
the population had received their first dose, making the Philippines’ vaccination rate one of the
lowest in ASEAN.
Despite the weak performance of the market, average daily value turnover in the Philippine
Stock Exchange (PSE) jumped by 35.9% year-on-year to P=9.0 billion during the first half.
However, non-index stocks led by third line issues accounted for bulk of the increase in trading
volume, largely benefiting only stock brokers focused on local retail investors. During the first
semester, local investors accounted for 66.0% of the PSE’s total value turnover, up from around
53.0% historically. Foreign investors remained cautious, liquidating P=75.0 billion worth of
stocks during the period.
Business Review
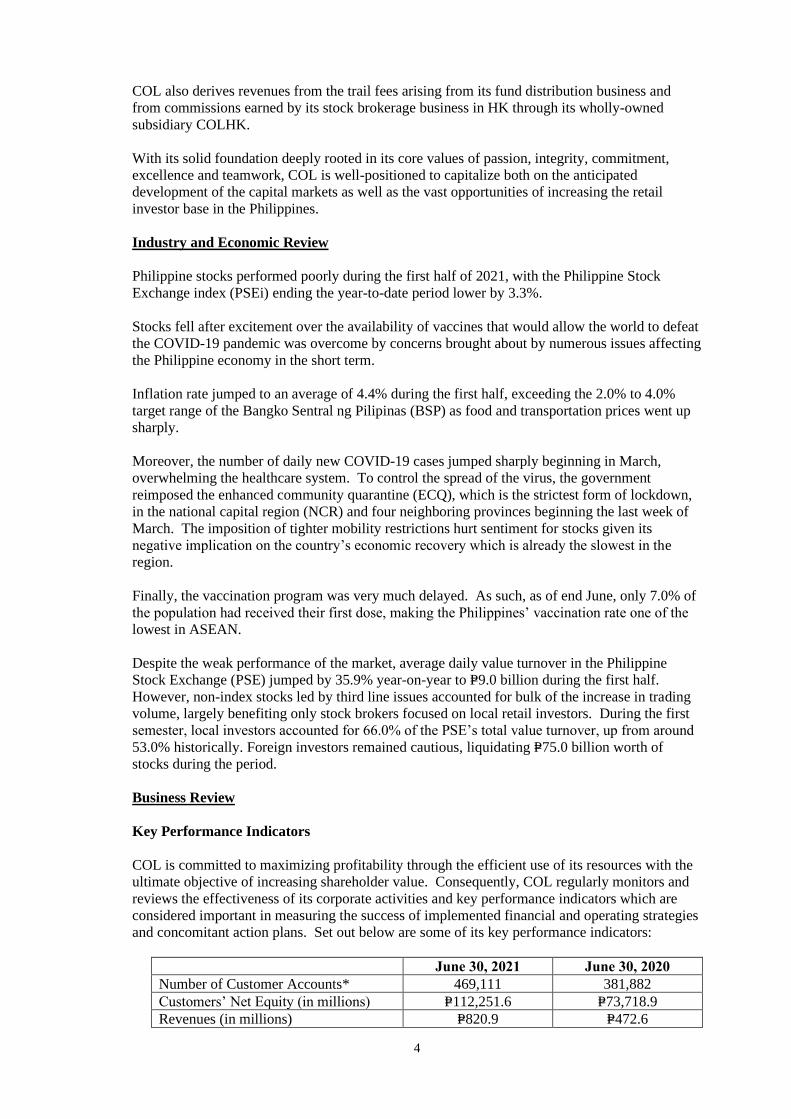
Key Performance Indicators
COL is committed to maximizing profitability through the efficient use of its resources with the
ultimate objective of increasing shareholder value. Consequently, COL regularly monitors and
reviews the effectiveness of its corporate activities and key performance indicators which are
considered important in measuring the success of implemented financial and operating strategies
and concomitant action plans. Set out below are some of its key performance indicators:
June 30, 2021 June 30, 2020
Number of Customer Accounts* 469,111 381,882
Customers’ Net Equity (in millions) P=112,251.6 P=73,718.9
Revenues (in millions) P=820.9 P=472.6
5
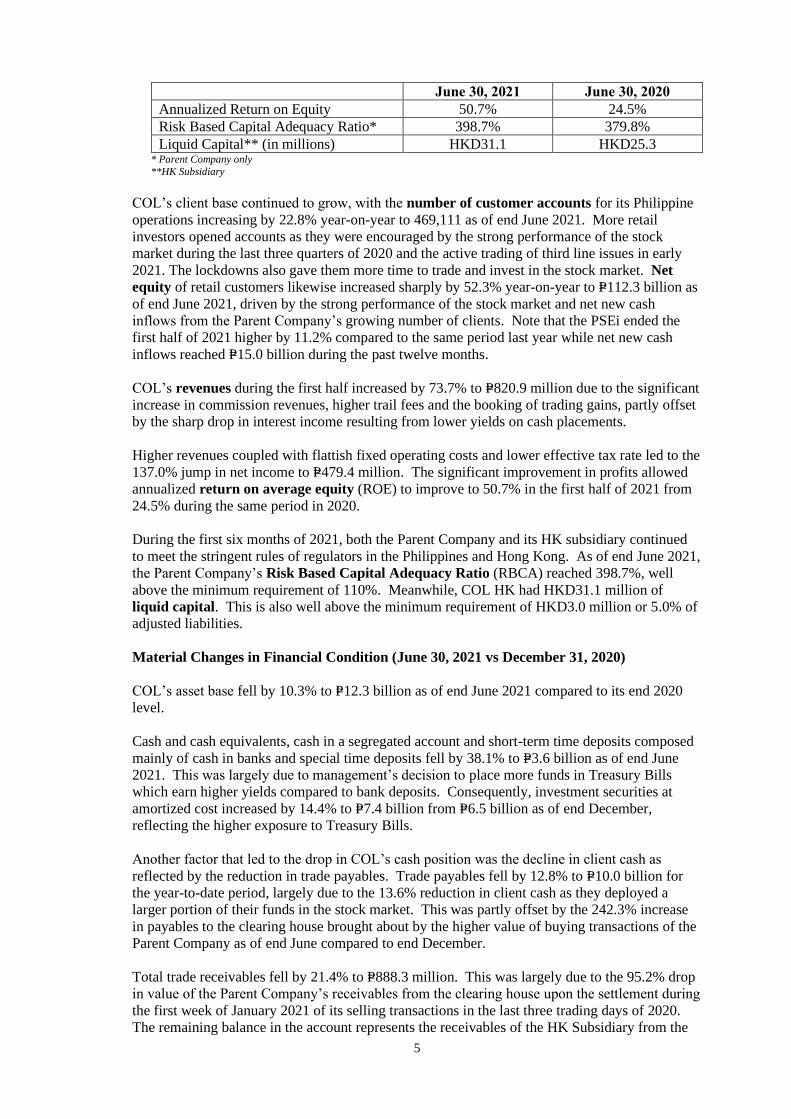
June 30, 2021 June 30, 2020
Annualized Return on Equity 50.7% 24.5%
Risk Based Capital Adequacy Ratio* 398.7% 379.8%
Liquid Capital** (in millions) HKD31.1 HKD25.3 * Parent Company only
**HK Subsidiary
COL’s client base continued to grow, with the number of customer accounts for its Philippine
operations increasing by 22.8% year-on-year to 469,111 as of end June 2021. More retail
investors opened accounts as they were encouraged by the strong performance of the stock
market during the last three quarters of 2020 and the active trading of third line issues in early
2021. The lockdowns also gave them more time to trade and invest in the stock market. Net
equity of retail customers likewise increased sharply by 52.3% year-on-year to P=112.3 billion as
of end June 2021, driven by the strong performance of the stock market and net new cash
inflows from the Parent Company’s growing number of clients. Note that the PSEi ended the
first half of 2021 higher by 11.2% compared to the same period last year while net new cash
inflows reached P=15.0 billion during the past twelve months.
COL’s revenues during the first half increased by 73.7% to P=820.9 million due to the significant
increase in commission revenues, higher trail fees and the booking of trading gains, partly offset
by the sharp drop in interest income resulting from lower yields on cash placements.
Higher revenues coupled with flattish fixed operating costs and lower effective tax rate led to the
137.0% jump in net income to P=479.4 million. The significant improvement in profits allowed
annualized return on average equity (ROE) to improve to 50.7% in the first half of 2021 from
24.5% during the same period in 2020.
During the first six months of 2021, both the Parent Company and its HK subsidiary continued
to meet the stringent rules of regulators in the Philippines and Hong Kong. As of end June 2021,
the Parent Company’s Risk Based Capital Adequacy Ratio (RBCA) reached 398.7%, well
above the minimum requirement of 110%. Meanwhile, COL HK had HKD31.1 million of
liquid capital. This is also well above the minimum requirement of HKD3.0 million or 5.0% of
adjusted liabilities.
Material Changes in Financial Condition (June 30, 2021 vs December 31, 2020)
COL’s asset base fell by 10.3% to P=12.3 billion as of end June 2021 compared to its end 2020
level.
Cash and cash equivalents, cash in a segregated account and short-term time deposits composed
mainly of cash in banks and special time deposits fell by 38.1% to P=3.6 billion as of end June
2021. This was largely due to management’s decision to place more funds in Treasury Bills
which earn higher yields compared to bank deposits. Consequently, investment securities at
amortized cost increased by 14.4% to P=7.4 billion from P=6.5 billion as of end December,
reflecting the higher exposure to Treasury Bills.
Another factor that led to the drop in COL’s cash position was the decline in client cash as
reflected by the reduction in trade payables. Trade payables fell by 12.8% to P=10.0 billion for
the year-to-date period, largely due to the 13.6% reduction in client cash as they deployed a
larger portion of their funds in the stock market. This was partly offset by the 242.3% increase
in payables to the clearing house brought about by the higher value of buying transactions of the
Parent Company as of end June compared to end December.
Total trade receivables fell by 21.4% to P=888.3 million. This was largely due to the 95.2% drop
in value of the Parent Company’s receivables from the clearing house upon the settlement during
the first week of January 2021 of its selling transactions in the last three trading days of 2020.
The remaining balance in the account represents the receivables of the HK Subsidiary from the

6
Hong Kong Securities Clearing Company (HKSCC). This in turn was partly offset by the 22.8%
increase in value of margin loans for the year-to-date period to P=792.4 million as of end June
2021.
Other receivables also fell by 18.5% to P=31.0 million. This was mainly due to the drop in the
value of mutual fund redemptions, reducing the size of receivables from asset management
companies by 52.9% to P=8.2 million.
Prepayments increased by 64.8% to P=10.5 million because of higher local taxes paid in January
of each year and the advanced payments made to procure COVID-19 vaccines for employees.
Property and equipment decreased by 14.4% to P=98.3 million. The amount of capital
expenditures made in the first half was much less than the size of depreciation expenses as most
of the required capital expenditures were already completed in 2019.
Trade payables dropped by 12.8% to P=10.0 billion for the year-to-date period. This was largely
due to the 13.6% decline in payable to customers to P=9.9 billion as they deployed a larger
portion of their portfolio into the market. This was partly offset by the significant increase in
value of payables to the clearing house from P=36.8 million to P=126.1 million, brought about by
the higher value of clients’ buying transaction in the last few trading days of June 2021
compared to end 2020.
Other current liabilities were lower by 41.0% at P=119.3 million.
Income tax payable decreased by 56.8% to P=21.6 million due to the settlement of the Parent
Company’s tax dues as at end 2020 in April 2021 and the lower amount of income taxes booked
for the second quarter of 2021 due to lower taxable income generated for the period.
Stockholders’ equity was up by 9.3% to P=2.0 billion due to the booking of P=479.5 million in net
income during the first half of 2021, less the payment of P=309.4 million in cash dividends.
Material Changes in the Results of Operations (June 30, 2021 vs June 30, 2020)
COL’s consolidated revenues during the first half of 2021 increased by 73.7% to P=820.9 million
from P=472.6 million. Except for interest income, all revenue items improved. Cost of services
increased by 36.1% to P=120.9 million, largely driven by the significant jump in stock exchange
dues and fees, and trading charges. Meanwhile, operating expenses which are largely fixed in
nature, rose by 6.2% to P=115.1 million. Given the slower increase in cost of services and
operating expenses, operating profits more than doubled to P=584.9 million from P=275.3 million.
Provision for income taxes increased by a slower pace of 45.7% to P=104.0 million, brought
about by the impact of the passage of the CREATE bill which resulted to a drop in the effective
tax rate. Because of the foregoing movements, net income grew by 137.0% to P=479.5 million in
the first half of 2021.
COL’s revenues increased largely due to the higher trading activity of retail investors in the local
stock market. Commission revenues jumped by 113.1% from P=300.3 million to P=639.9 million
in the first half of 2021 as average daily value turnover in the PSE increased by 35.9% during
the period in review. COL’s revenues grew by a much faster pace as its market share improved
from 7.0% to 11.2% on a year-on-year basis during the first half of the year.
COL also benefited from the 29.6% increase in trail fees brought about by the higher value of
mutual fund assets under administration (AUA), and the booking of P=52.2 million in trading
gains.
On the other hand, interest income fell sharply by 45.8% to P=84.2 million largely due to the
steep drop in yields on cash placements. Note that yields on placements fell significantly due to
the BSP’s move to cut rates and banks’ reserve requirement ratio (RRR) last year in response to
7
the COVID-19 crisis. Banks also reduced deposit rates because of ample liquidity in the market
Cost of services jumped by 36.11% to P=120.9 million due to the higher trading activity of
customers. Stock exchange dues and fees, and trading charges to complete customers’
transactions jumped by 109.0% and 241.0% to P=15.3 million and P=33.6 million, respectively.
Most of the other expenses that are part of cost of services also increased, although at a slower
pace. Commission expenses rose by 16.7% to P=15.1 million, central depositary fees climbed by
69.4% to P=5.0 million, while other cost of services was higher by 17.6% to P=21.6 million.
Research cost was flat at P=1.2 million, while personnel costs were lower by 19.5% to P=29.1
million. However, the drop in personnel cost was largely due to the reallocation of some
personnel costs from cost of services to operating expenses. Personnel costs booked under
operating expenses increased by 26.8% to P=37.8 million.
Meanwhile, professional fees which are booked under operating expenses increased by 6.3% to
P=24.1 million due to the engagement of a consultant for the Parent Company’s ongoing IT
projects.
Marketing and advertising expenses fell sharply by 36.1% to P=1.7 million as large-scale investor
seminars previously organized by the Parent Company in the year prior were halted because of
the government-imposed restrictions related to COVID-19 pandemic. The Parent Company
instead made a pivotal refocus on online marketing and promotional efforts to generate a
sustained stream of consumer interest and market guidance.
Membership fees and dues increased significantly by 156.3% to P=1.5 million in the first half of
2021. This was largely due to the booking of the substitutional listing fee amounting to
P=428,400 after the Parent Company finalized its 10-for-1 stock split in January 2021. The Parent
Company’s annual listing fee also increased because of its higher market capitalization in 2020
compared to 2019 which was the basis for the computation of fees paid in 2021.
Communications expense booked under operating expense rose by 32.0% P=816,732. Combined
with communications expenses booked under cost of goods sold, total communications expense
rose by 18.9% to P=21.1 million. Communications expense increased as the Parent Company
availed of additional DDoS protection service and domestic leased lines in 2021.
Total expenses comprised of cost of services, operating and other expenses increased by 19.3%
to P=237.4 million. Since revenues grew faster than expenses, income before income tax more
than doubled from P=273.7 million to P=583.5 million.
Net profits increased by an even faster pace of 137.0% to P=479.5 million from P=202.3 million as
the effective tax rate dropped sharply from 26.1% to 17.8% in the first half of 2021 primarily
due to the lower tax rate under the CREATE law, as well as the reversal in April 2021 of the
excess provisions for 2020 amounting to P=9.9 million when the law became effective.
Other Matters
a. COL is not aware of any known trends, demands, commitments, events or uncertainties
that will have a material impact on the Group’s liquidity. The Group has not defaulted
in paying its obligations, which arise mostly from withdrawals made by customers. In
addition, obligations of the Parent Company are fully funded in compliance with the
Securities Regulation Code (SRC) Rule 49.2 while COLHK Subsidiary maintains a fund
for the exclusive benefit of its customers in compliance with the regulations of the
Securities and Futures Commission of Hong Kong.
b. COL is not aware of any events that will trigger direct or contingent financial obligation
that is material to the Group, including any default or acceleration of an obligation.
8
c. COL is not aware of any material off-balance sheet transactions, arrangements,
obligations (including contingent obligations) and other relationships of the Group with
other persons created during the reporting period.
d. COL is not aware of any material commitments for capital expenditures.
e. COL is not aware of any known trends, events, or uncertainties that have had or that are
reasonably expected to have a material favorable or unfavorable impact on net sales or
revenues or income from continuing operations of the Group.
f. COL is not aware of any significant elements of income or loss that did not arise from
the Group’s continuing operations.
g. COL is not aware of any seasonal aspects that had a material effect on the financial
condition or results of operations of the Group.
PART II – OTHER INFORMATION
Not applicable. There are no material disclosures that have not been reported under SEC Form
17-C covered by this period.

9
SIGNATURES
Pursuant to the requirements of the Securities Regulation Code, the issuer has duly caused this
report to be signed on its behalf by the undersigned thereunto duly authorized.
Registrant: COL FINANCIAL GROUP, INC.
By:
Conrado F. Bate
President and Chief Executive Officer
August 17, 2021
Catherine L. Ong
Senior Vice President and Treasurer
August 17, 2021
Lorena E. Velarde
First Vice President and Chief Financial Officer
August 17, 2021
10
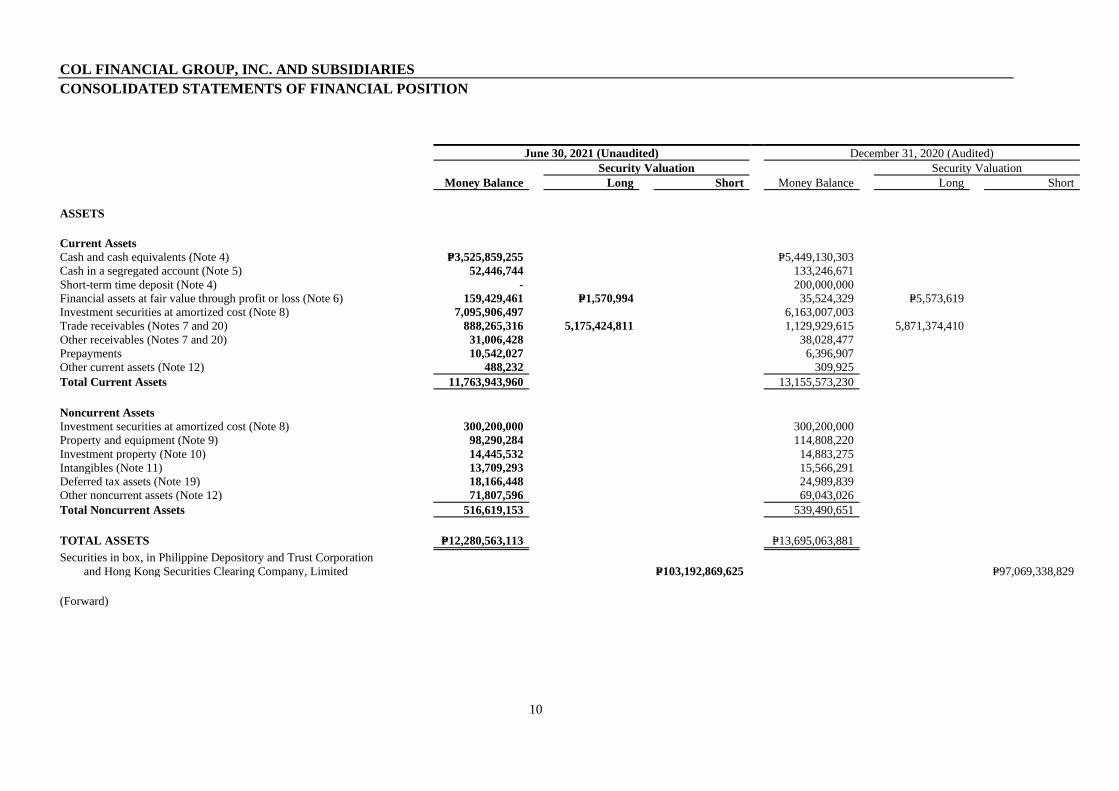
COL FINANCIAL GROUP, INC. AND SUBSIDIARIES
CONSOLIDATED STATEMENTS OF FINANCIAL POSITION
June 30, 2021 (Unaudited) December 31, 2020 (Audited)
Security Valuation Security Valuation
Money Balance Long Short Money Balance Long Short
ASSETS
Current Assets
Cash and cash equivalents (Note 4) P=3,525,859,255 P=5,449,130,303
Cash in a segregated account (Note 5) 52,446,744 133,246,671
Short-term time deposit (Note 4) - 200,000,000
Financial assets at fair value through profit or loss (Note 6) 159,429,461 P=1,570,994 35,524,329 P=5,573,619
Investment securities at amortized cost (Note 8) 7,095,906,497 6,163,007,003
Trade receivables (Notes 7 and 20) 888,265,316 5,175,424,811 1,129,929,615 5,871,374,410
Other receivables (Notes 7 and 20) 31,006,428 38,028,477
Prepayments 10,542,027 6,396,907
Other current assets (Note 12) 488,232 309,925
Total Current Assets 11,763,943,960 13,155,573,230
Noncurrent Assets
Investment securities at amortized cost (Note 8) 300,200,000 300,200,000
Property and equipment (Note 9) 98,290,284 114,808,220
Investment property (Note 10) 14,445,532 14,883,275
Intangibles (Note 11) 13,709,293 15,566,291
Deferred tax assets (Note 19) 18,166,448 24,989,839
Other noncurrent assets (Note 12) 71,807,596 69,043,026
Total Noncurrent Assets 516,619,153 539,490,651
TOTAL ASSETS P=12,280,563,113 P=13,695,063,881
Securities in box, in Philippine Depository and Trust Corporation
and Hong Kong Securities Clearing Company, Limited P=103,192,869,625 P=97,069,338,829
(Forward)
11
June 30, 2021 (Unaudited) December 31, 2020 (Audited)
Security Valuation Security Valuation
Money Balance Long Short Money Balance Long Short
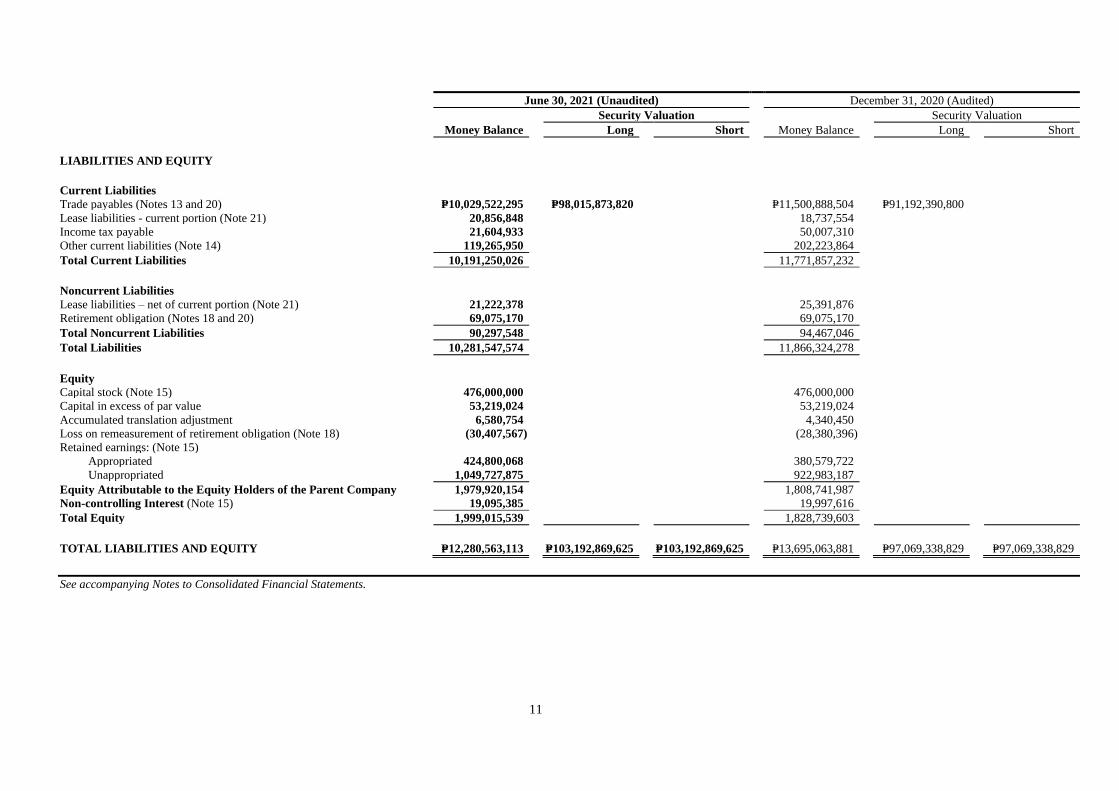
LIABILITIES AND EQUITY
Current Liabilities
Trade payables (Notes 13 and 20) P=10,029,522,295 P=98,015,873,820 P=11,500,888,504 P=91,192,390,800
Lease liabilities - current portion (Note 21) 20,856,848 18,737,554
Income tax payable 21,604,933 50,007,310
Other current liabilities (Note 14) 119,265,950 202,223,864
Total Current Liabilities 10,191,250,026 11,771,857,232
Noncurrent Liabilities
Lease liabilities – net of current portion (Note 21) 21,222,378 25,391,876
Retirement obligation (Notes 18 and 20) 69,075,170 69,075,170
Total Noncurrent Liabilities 90,297,548 94,467,046
Total Liabilities 10,281,547,574 11,866,324,278
Equity
Capital stock (Note 15) 476,000,000 476,000,000
Capital in excess of par value 53,219,024 53,219,024
Accumulated translation adjustment 6,580,754 4,340,450
Loss on remeasurement of retirement obligation (Note 18) (30,407,567) (28,380,396)
Retained earnings: (Note 15)
Appropriated 424,800,068 380,579,722
Unappropriated 1,049,727,875 922,983,187
Equity Attributable to the Equity Holders of the Parent Company 1,979,920,154 1,808,741,987
Non-controlling Interest (Note 15) 19,095,385 19,997,616
Total Equity 1,999,015,539 1,828,739,603
TOTAL LIABILITIES AND EQUITY P=12,280,563,113 P=103,192,869,625 P=103,192,869,625 P=13,695,063,881 P=97,069,338,829 P=97,069,338,829
See accompanying Notes to Consolidated Financial Statements.

12
COL FINANCIAL GROUP, INC. AND SUBSIDIARIES
UNAUDITED CONSOLIDATED STATEMENTS OF INCOME
For the Six Months Ended June 30 For the Quarter Ended June 30
2021 2020 2021 2020
REVENUES (Note 16)
Commissions P=639,888,359 P=300,272,890 P=172,325,510 P=184,707,081 Others:
Interest income (Notes 4, 5, 6, 7, 8 and 20) 84,180,764 155,301,259 43,611,758 75,460,549
Trading gains (losses) - net (Note 6) 52,224,463 (1,359,484) 2,065,091 452,839
Trail fees 10,233,366 7,897,585 5,111,063 3,863,412 Others (Notes 6 and 9) 34,360,554 10,448,795 9,065,685 6,177,821
820,887,506 472,561,045 232,179,107 270,661,702
COST OF SERVICES
Stock exchange dues and fees (Note 16) 48,910,374 17,171,496 12,930,456 10,319,948 Personnel costs (Notes 17, 18 and 20) 29,126,945 36,194,426 14,949,636 18,521,532
Commission expense (Note 20) 15,061,695 12,903,518 7,016,994 7,331,778
Central depository fees 4,978,848 2,939,628 2,462,372 1,431,022 Research 1,214,642 1,235,179 613,045 615,980
Others:
Communications 20,268,247 17,111,093 10,706,392 8,505,847 Others 1,352,734 1,279,992 615,759 815,576
120,913,485 88,835,332 49,294,654 47,541,683
GROSS PROFIT 699,974,021 383,725,713 182,884,453 223,120,019
OPERATING EXPENSES Administrative expenses:
Personnel costs (Notes 17, 18 and 20) 37,770,201 29,790,804 20,399,474 15,341,140
Professional fees (Note 20) 24,056,333 22,626,189 11,791,561 10,757,652 Taxes and licenses 3,294,998 4,660,905 1,618,014 3,394,846
Insurance and bonds 2,358,378 2,479,056 1,117,542 1,176,329
Repairs and maintenance 2,165,628 2,433,756 980,898 1,171,793 Condominium dues 2,072,187 2,203,851 1,004,437 1,089,417
Security and messengerial services 1,960,820 2,656,671 1,008,249 1,654,518
Power, light and water 1,718,604 1,942,020 919,173 1,184,190 Advertising and marketing 1,711,863 2,677,672 889,101 882,225
Membership fees and dues 1,520,351 592,663 553,823 331,230
Periodicals and other subscriptions 919,426 177,677 546,664 76,066 Office supplies 915,234 1,043,929 698,302 197,686
Directors’ fees (Note 20) 865,000 575,000 640,000 400,000 Communications 816,732 618,820 287,521 331,380
Rentals (Note 21) 99,648 161,663 15,005 90,399
Trainings, seminars and meetings 98,455 468,508 98,455 26,765 Others 1,174,463 1,168,396 519,611 348,115
83,518,321 76,277,580 43,087,830 38,453,751
Depreciation and amortization (Notes 9, 10, 11 and 21) 31,520,547 31,915,516 15,644,028 15,703,285
Provision for credit losses (Notes 7) 82,776 188,572 1,676,215 1,375,535
115,121,644 108,381,668 60,408,073 55,532,571
OTHER INCOME (LOSSES)
Interest expense (Note 21) (1,239,677) (1,592,482) (597,465) (769,294)
Foreign exchange losses – net (158,902) (80,112) (25,938) (49,658) Gain on disposal of property and equipment (Note 9) 5,961 – 5,961 –
(1,392,618) (1,672,594) (617,442) (818,952)
INCOME BEFORE INCOME TAX 583,459,759 273,671,451 121,858,938 166,768,496
PROVISION FOR (BENEFIT FROM) INCOME TAX (Note 16)
Current Regular corporate income tax 86,898,677 44,885,900 (1,432,793) 31,455,288
Final income tax 12,636,518 27,551,548 6,645,009 13,625,581
Deferred 4,461,761 (1,068,998) 2,489,459 (456,233)
103,996,956 71,368,450 7,701,675 44,624,636
NET INCOME P=479,462,803 P=202,303,001 P=114,157,263 P=122,143,860
Attributable to:
Equity holders of the Parent Company P=480,365,034 P=203,051,755 P=114,592,120 P=122,485,790
Non-controlling interest (Note 15) (902,231) (748,754) (434,857) (341,930)
P=479,462,803 P=202,303,001 P=114,157,263 P=122,143,860
Earnings Per Share (Note 25)
Basic and diluted P=0.10 P=0.04* P=0.02 P=0.02*
* Restated to show the retroactive effect of the ten-for-one stock split reflected in 2021
See accompanying Notes to Consolidated Financial Statements.
13
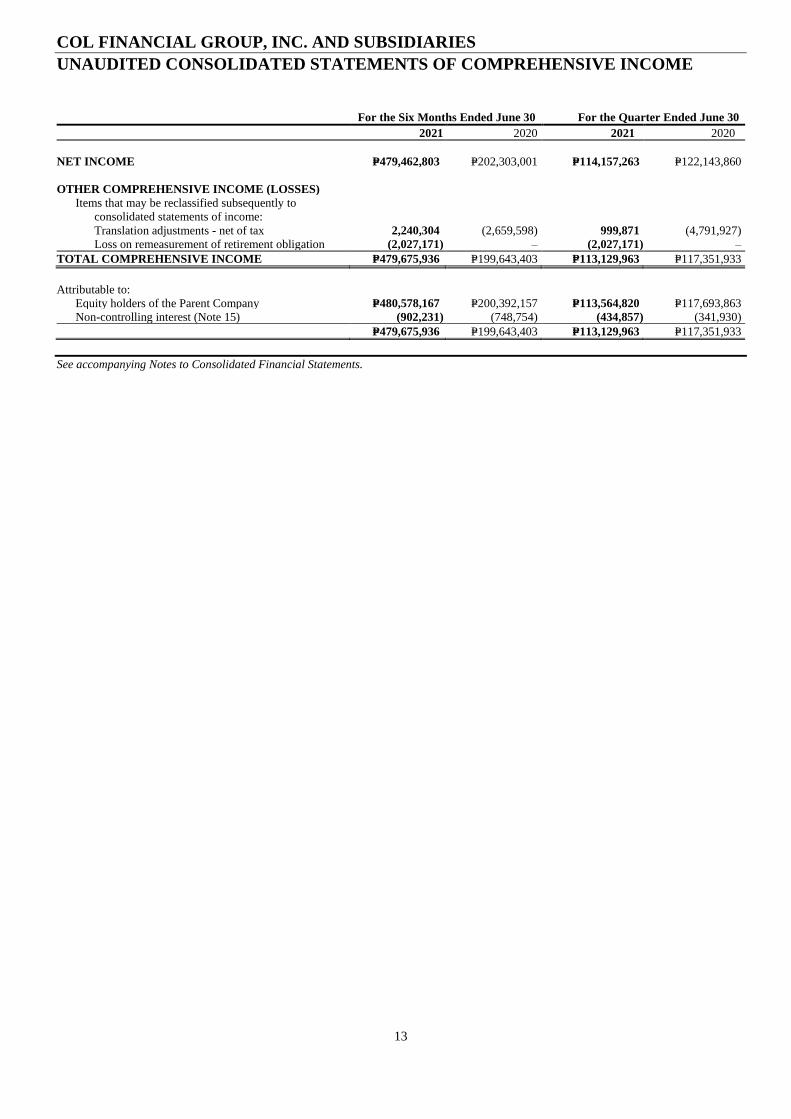
COL FINANCIAL GROUP, INC. AND SUBSIDIARIES
UNAUDITED CONSOLIDATED STATEMENTS OF COMPREHENSIVE INCOME
For the Six Months Ended June 30 For the Quarter Ended June 30
2021 2020 2021 2020
NET INCOME P=479,462,803 P=202,303,001 P=114,157,263 P=122,143,860
OTHER COMPREHENSIVE INCOME (LOSSES)
Items that may be reclassified subsequently to
consolidated statements of income:
Translation adjustments - net of tax 2,240,304 (2,659,598) 999,871 (4,791,927)
Loss on remeasurement of retirement obligation (2,027,171) – (2,027,171) –
TOTAL COMPREHENSIVE INCOME P=479,675,936 P=199,643,403 P=113,129,963 P=117,351,933
Attributable to:
Equity holders of the Parent Company P=480,578,167 P=200,392,157 P=113,564,820 P=117,693,863
Non-controlling interest (Note 15) (902,231) (748,754) (434,857) (341,930)
P=479,675,936 P=199,643,403 P=113,129,963 P=117,351,933
See accompanying Notes to Consolidated Financial Statements.
14
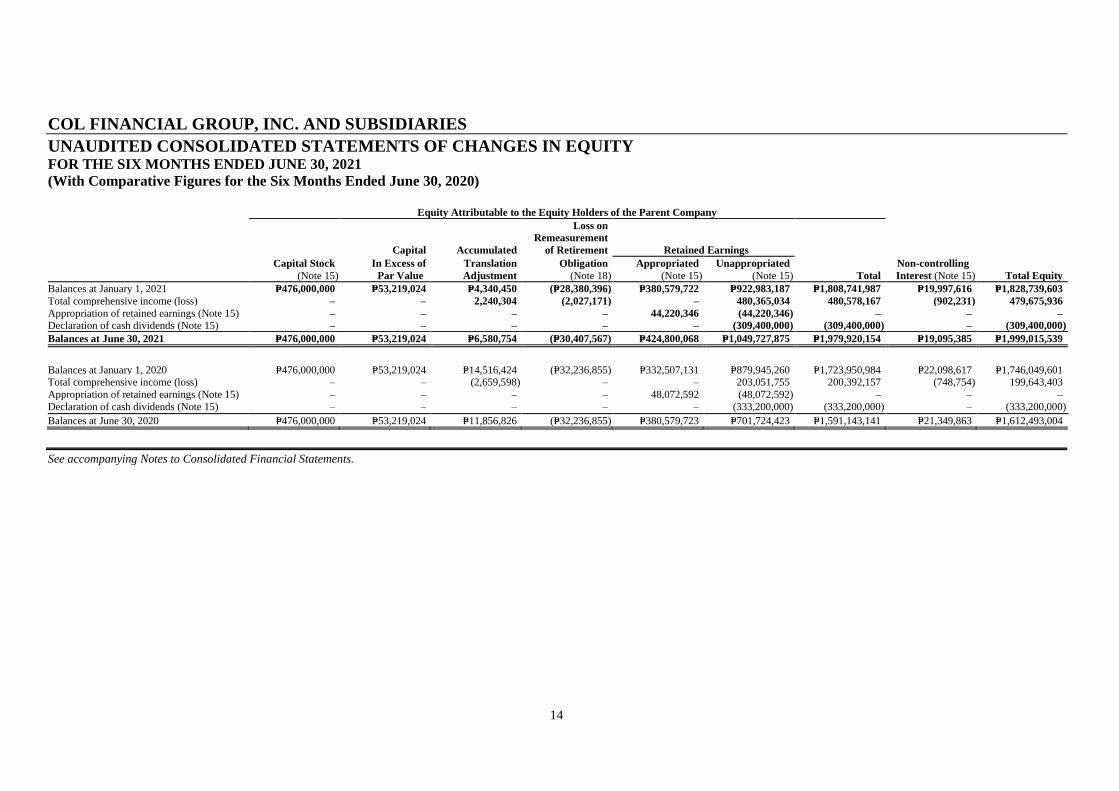
COL FINANCIAL GROUP, INC. AND SUBSIDIARIES
UNAUDITED CONSOLIDATED STATEMENTS OF CHANGES IN EQUITY FOR THE SIX MONTHS ENDED JUNE 30, 2021
(With Comparative Figures for the Six Months Ended June 30, 2020)
Equity Attributable to the Equity Holders of the Parent Company
Capital Accumulated
Loss on
Remeasurement
of Retirement Retained Earnings
Capital Stock
(Note 15)
In Excess of
Par Value
Translation
Adjustment
Obligation
(Note 18)
Appropriated
(Note 15)
Unappropriated
(Note 15) Total
Non-controlling
Interest (Note 15) Total Equity
Balances at January 1, 2021 P=476,000,000 P=53,219,024 P=4,340,450 (P=28,380,396) P=380,579,722 P=922,983,187 P=1,808,741,987 P=19,997,616 P=1,828,739,603
Total comprehensive income (loss) – – 2,240,304 (2,027,171) – 480,365,034 480,578,167 (902,231) 479,675,936
Appropriation of retained earnings (Note 15) – – – – 44,220,346 (44,220,346) – – –
Declaration of cash dividends (Note 15) – – – – – (309,400,000) (309,400,000) – (309,400,000)
Balances at June 30, 2021 P=476,000,000 P=53,219,024 P=6,580,754 (P=30,407,567) P=424,800,068 P=1,049,727,875 P=1,979,920,154 P=19,095,385 P=1,999,015,539
Balances at January 1, 2020 P=476,000,000 P=53,219,024 P=14,516,424 (P=32,236,855) P=332,507,131 P=879,945,260 P=1,723,950,984 P=22,098,617 P=1,746,049,601 Total comprehensive income (loss) – – (2,659,598) – – 203,051,755 200,392,157 (748,754) 199,643,403
Appropriation of retained earnings (Note 15) – – – – 48,072,592 (48,072,592) – – –
Declaration of cash dividends (Note 15) – – – – – (333,200,000) (333,200,000) – (333,200,000)
Balances at June 30, 2020 P=476,000,000 P=53,219,024 P=11,856,826 (P=32,236,855) P=380,579,723 P=701,724,423 P=1,591,143,141 P=21,349,863 P=1,612,493,004
See accompanying Notes to Consolidated Financial Statements.
15
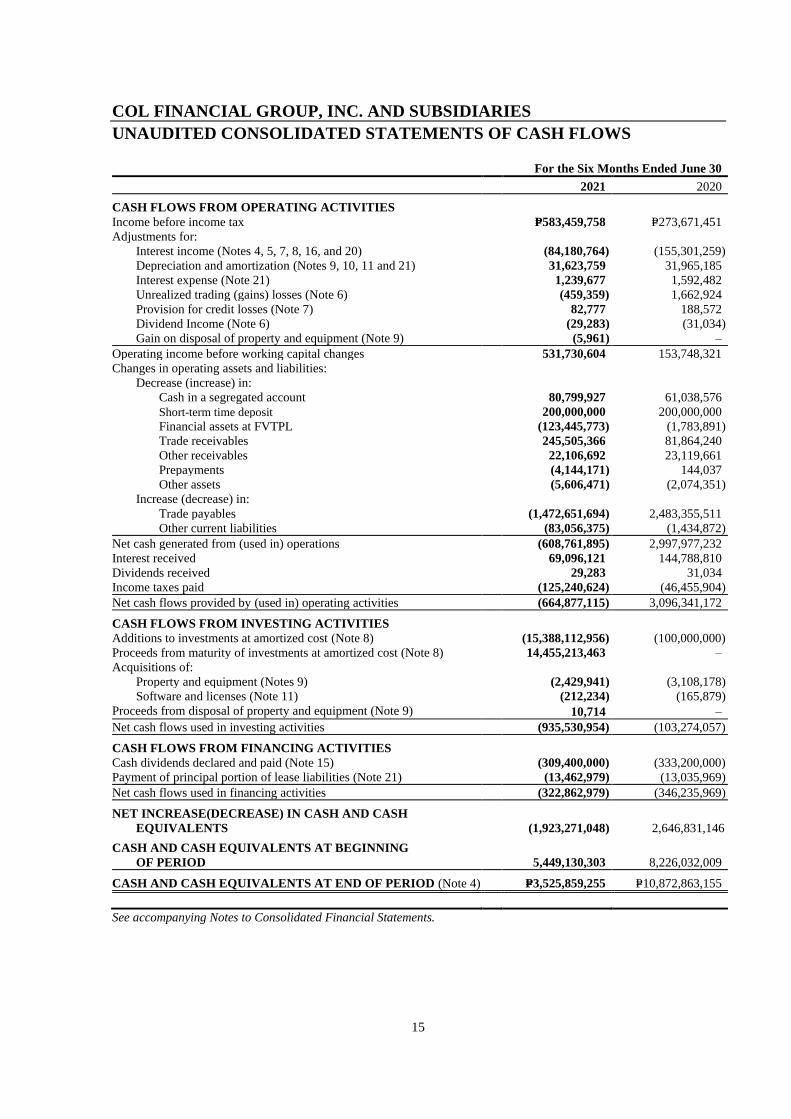
COL FINANCIAL GROUP, INC. AND SUBSIDIARIES
UNAUDITED CONSOLIDATED STATEMENTS OF CASH FLOWS For the Six Months Ended June 30
2021 2020
CASH FLOWS FROM OPERATING ACTIVITIES
Income before income tax P=583,459,758 P=273,671,451
Adjustments for:
Interest income (Notes 4, 5, 7, 8, 16, and 20) (84,180,764) (155,301,259)
Depreciation and amortization (Notes 9, 10, 11 and 21) 31,623,759 31,965,185
Interest expense (Note 21) 1,239,677 1,592,482
Unrealized trading (gains) losses (Note 6) (459,359) 1,662,924
Provision for credit losses (Note 7) 82,777 188,572
Dividend Income (Note 6) (29,283) (31,034)
Gain on disposal of property and equipment (Note 9) (5,961) –
Operating income before working capital changes 531,730,604 153,748,321
Changes in operating assets and liabilities:
Decrease (increase) in:
Cash in a segregated account 80,799,927 61,038,576
Short-term time deposit 200,000,000 200,000,000
Financial assets at FVTPL (123,445,773) (1,783,891)
Trade receivables 245,505,366 81,864,240
Other receivables 22,106,692 23,119,661
Prepayments (4,144,171) 144,037
Other assets (5,606,471) (2,074,351)
Increase (decrease) in:
Trade payables (1,472,651,694) 2,483,355,511
Other current liabilities (83,056,375) (1,434,872)
Net cash generated from (used in) operations (608,761,895) 2,997,977,232
Interest received 69,096,121 144,788,810
Dividends received 29,283 31,034
Income taxes paid (125,240,624) (46,455,904)
Net cash flows provided by (used in) operating activities (664,877,115) 3,096,341,172
CASH FLOWS FROM INVESTING ACTIVITIES
Additions to investments at amortized cost (Note 8) (15,388,112,956) (100,000,000)
Proceeds from maturity of investments at amortized cost (Note 8) 14,455,213,463 –
Acquisitions of:
Property and equipment (Notes 9) (2,429,941) (3,108,178)
Software and licenses (Note 11) (212,234) (165,879)
Proceeds from disposal of property and equipment (Note 9) 10,714 –
Net cash flows used in investing activities (935,530,954) (103,274,057)
CASH FLOWS FROM FINANCING ACTIVITIES
Cash dividends declared and paid (Note 15) (309,400,000) (333,200,000)
Payment of principal portion of lease liabilities (Note 21) (13,462,979) (13,035,969)
Net cash flows used in financing activities (322,862,979) (346,235,969)
NET INCREASE(DECREASE) IN CASH AND CASH
EQUIVALENTS (1,923,271,048) 2,646,831,146
CASH AND CASH EQUIVALENTS AT BEGINNING
OF PERIOD 5,449,130,303 8,226,032,009
CASH AND CASH EQUIVALENTS AT END OF PERIOD (Note 4) P=3,525,859,255 P=10,872,863,155
See accompanying Notes to Consolidated Financial Statements.

16
COL FINANCIAL GROUP, INC. AND SUBSIDIARIES
NOTES TO CONSOLIDATED FINANCIAL STATEMENTS
1. Corporate Information
COL Financial Group, Inc. (the Parent Company or COL Financial) was registered with the Philippine
Securities and Exchange Commission (SEC) on August 16, 1999, primarily to engage in the business of
broker of securities and to provide stockbrokerage services through innovative internet technology. The
registered address of the Parent Company is Unit 2401-B East Tower, Tektite Towers, Exchange Road,
Ortigas Center, Pasig City, Philippines.
COL Financial and its subsidiaries are collectively referred hereinto as the “Group”. The Group is
engaged in offering stock brokerage and fund distribution services. The Group is also engaged in
providing financial advice, in the gathering and distribution of financial and investment information and
statistics and in acting as financial, commercial or business representative.
The Parent Company is a public company listed in the Philippine Stock Exchange (PSE).
On August 15, 2006, the Board of Directors (BOD) of the Parent Company approved the acquisition of
the exchange trading right of Mark Securities Corporation for the purpose of making the Parent
Company a PSE Trading Participant. On December 13, 2006, the BOD of PSE approved the
application of the Parent Company as a Corporate Trading Participant in PSE through the transfer of the
exchange trading right registered in the name of Mark Securities Corporation and the designation of Mr.
Conrado F. Bate as its Nominee Trading Participant (Note 11).
The Parent Company became a clearing member of the Securities Clearing Corporation of the
Philippines (SCCP) and started operating its own seat in the PSE on February 16, 2009.
In 2015, the Parent Company was registered and authorized by the SEC to distribute various mutual
funds issued by the top six (6) fund providers in the Philippines.
In 2019, the Parent Company has set up its own asset management firm to diversify its portfolio as a
one-stop shop online platform for capital market products. The Parent Company also plans to create
unitized funds, a type of fund structure that uses pooled funds to invest with individually reported unit
values for investors, which are different from the equity-laced mutual funds that it now distributes
through its platform.
2. Basis of Preparation, Statement of Compliance and Summary of Significant Accounting Principles
Basis of Preparation
The accompanying consolidated financial statements of the Group have been prepared in accordance
with Philippine Financial Reporting Standards (PFRS). The consolidated financial statements have
been prepared on a historical cost basis, except for financial assets at fair value through profit or loss
(FVTPL) which have been measured at fair value. The Group’s consolidated financial statements are
presented in Philippine peso (PHP), which is the presentation currency under PFRS. Based on the
economic substance of the underlying circumstances relevant to the Group, the functional currency of
the Group has been determined to be Philippine peso, except for COL Securities (HK) Limited
(COLHK) whose functional currency has been determined to be HK dollar (HK$). All values are
rounded to the nearest peso, except when otherwise indicated.
17
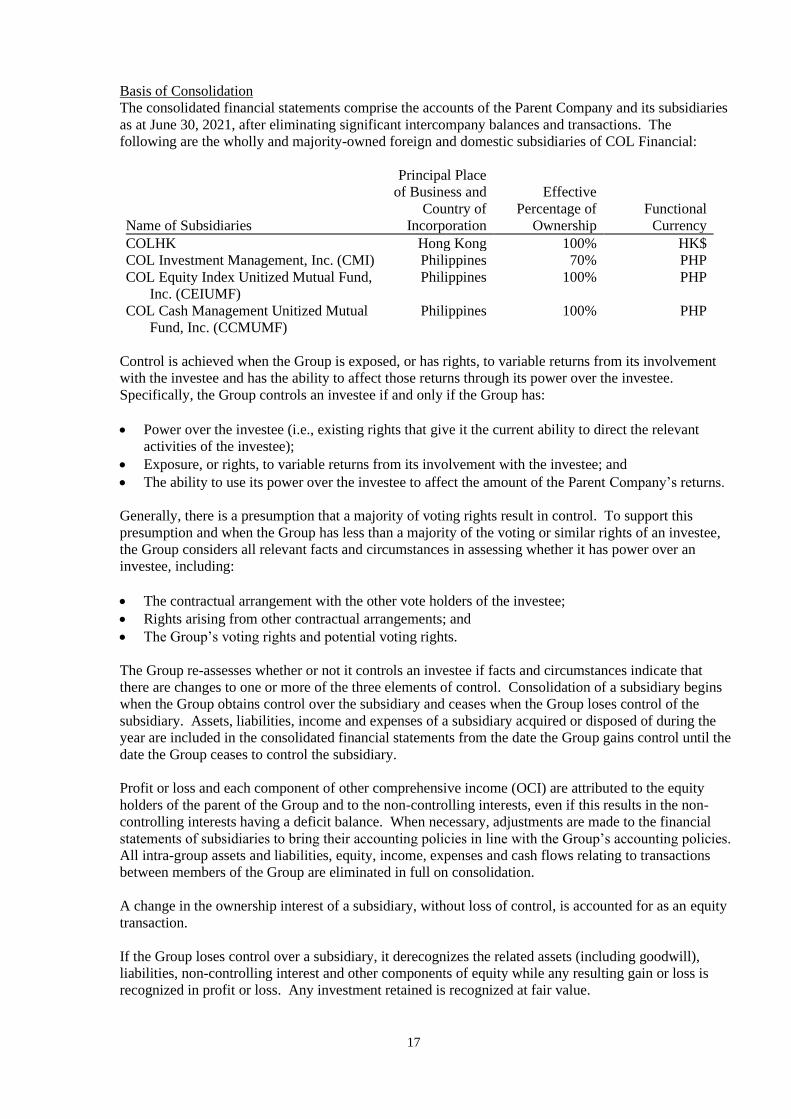
Basis of Consolidation
The consolidated financial statements comprise the accounts of the Parent Company and its subsidiaries
as at June 30, 2021, after eliminating significant intercompany balances and transactions. The
following are the wholly and majority-owned foreign and domestic subsidiaries of COL Financial:
Name of Subsidiaries
Principal Place
of Business and
Country of
Incorporation
Effective
Percentage of
Ownership
Functional
Currency
COLHK Hong Kong 100% HK$
COL Investment Management, Inc. (CMI) Philippines 70% PHP
COL Equity Index Unitized Mutual Fund,
Inc. (CEIUMF)
Philippines 100% PHP
COL Cash Management Unitized Mutual
Fund, Inc. (CCMUMF)
Philippines 100% PHP
Control is achieved when the Group is exposed, or has rights, to variable returns from its involvement
with the investee and has the ability to affect those returns through its power over the investee.
Specifically, the Group controls an investee if and only if the Group has:
• Power over the investee (i.e., existing rights that give it the current ability to direct the relevant
activities of the investee);
• Exposure, or rights, to variable returns from its involvement with the investee; and
• The ability to use its power over the investee to affect the amount of the Parent Company’s returns.
Generally, there is a presumption that a majority of voting rights result in control. To support this
presumption and when the Group has less than a majority of the voting or similar rights of an investee,
the Group considers all relevant facts and circumstances in assessing whether it has power over an
investee, including:
• The contractual arrangement with the other vote holders of the investee;
• Rights arising from other contractual arrangements; and
• The Group’s voting rights and potential voting rights.
The Group re-assesses whether or not it controls an investee if facts and circumstances indicate that
there are changes to one or more of the three elements of control. Consolidation of a subsidiary begins
when the Group obtains control over the subsidiary and ceases when the Group loses control of the
subsidiary. Assets, liabilities, income and expenses of a subsidiary acquired or disposed of during the
year are included in the consolidated financial statements from the date the Group gains control until the
date the Group ceases to control the subsidiary.
Profit or loss and each component of other comprehensive income (OCI) are attributed to the equity
holders of the parent of the Group and to the non-controlling interests, even if this results in the non-
controlling interests having a deficit balance. When necessary, adjustments are made to the financial
statements of subsidiaries to bring their accounting policies in line with the Group’s accounting policies.
All intra-group assets and liabilities, equity, income, expenses and cash flows relating to transactions
between members of the Group are eliminated in full on consolidation.
A change in the ownership interest of a subsidiary, without loss of control, is accounted for as an equity
transaction.
If the Group loses control over a subsidiary, it derecognizes the related assets (including goodwill),
liabilities, non-controlling interest and other components of equity while any resulting gain or loss is
recognized in profit or loss. Any investment retained is recognized at fair value.

18
Non-Controlling Interest
Non-controlling interest represents the portion of profit or loss and net assets not owned, directly or
indirectly, by the Parent Company and are presented in the consolidated statements of income,
consolidated statements of comprehensive income, and within equity in the consolidated statements of
financial position, separately from equity attributable to the Parent Company.
Changes in Accounting Policies and Disclosures
The accounting policies adopted are consistent with those of the previous financial year, except for the
adoption of new standards effective as at January 1, 2021. The Group has not early adopted any
standard, interpretation or amendment that has been issued but is not yet effective.
Unless otherwise indicated, adoption of these new standards did not have an impact on the consolidated
financial statements of the Group.
• Amendments to PFRS 9, PFRS 7, PFRS 4 and PFRS 16, Interest Rate Benchmark Reform –
Phase 2
Effective beginning on or after January 1, 2022
• Amendments to PFRS 3, Reference to the Conceptual Framework
• Amendments to PAS 16, Plant and Equipment: Proceeds before Intended Use
• Amendments to PAS 37, Onerous Contracts – Costs of Fulfilling a Contract
• Annual Improvements to PFRSs 2018-2020 Cycle
o Amendments to PFRS 1, First-time Adoption of Philippines Financial Reporting Standards,
Subsidiary as a first-time adopter
o Amendments to PFRS 9, Financial Instruments, Fees in the ’10 per cent’ test for derecognition
of financial liabilities
o Amendments to PAS 41, Agriculture, Taxation in fair value measurements
Effective beginning on or after January 1, 2023
• Amendments to PAS 1, Classification of Liabilities as Current or Non-current
• PFRS 17, Insurance Contracts
Deferred effectivity
• Amendments to PFRS 10, Consolidated Financial Statements, and PAS 28, Sale or Contribution of
Assets between an Investor and its Associate or Joint Venture
Summary of Significant Accounting Policies
Foreign Currency Translation
Transactions in foreign currencies are initially recorded in the prevailing functional currency spot rate at
the date the transaction first qualifies for recognition. Monetary assets and liabilities denominated in
foreign currencies are translated at the closing functional currency rate of exchange at the reporting
period. All differences are taken to the consolidated statement of income.
On consolidation, the assets and liabilities of the consolidated foreign subsidiary are translated into
Philippine Peso at the rate of exchange prevailing at the reporting date and their statement of income is
translated at the average exchange rates for the year. The exchange differences arising on translation
for consolidation are recognized in equity (under ‘Accumulated translation adjustment’). Upon disposal
of the foreign subsidiary, the component of OCI relating to the foreign subsidiary is recognized in the
consolidated statement of income.
Current versus Non-current Classification
The Group presents assets and liabilities in the consolidated statement of financial position based on
current/non-current classification. An asset is current when it is:
• Expected to be realized or intended to be sold or consumed in a normal operating cycle;
19
• Held primarily for the purpose of trading;
• Expected to be realized within twelve (12) months after reporting period; or
• Cash or cash equivalent unless restricted from being exchanged or used to settle a liability for at
least twelve (12) months after the reporting period.
All other assets are classified as non-current.
A liability is current when:
• It is expected to be settled in a normal operating cycle;
• It is held primarily for the purpose of trading;
• It is due to be settled within twelve months after the reporting period; or
• There is no unconditional right to defer the settlement of the liability for at least twelve (12) months
after the reporting period.
The Group classifies all other liabilities as non-current.
Net deferred tax assets (liabilities) are classified as non-current.
Cash and Cash Equivalents, Short-term Time Deposits and Long-term Time Deposit
Cash includes cash on hand and in banks. Cash equivalents are short-term, highly liquid investments
that are readily convertible to known amounts of cash with original maturities of three (3) months or
less from dates of acquisition and that are subject to insignificant risk of changes in value. Bank
placements and investments with original maturities of more than three (3) months but less than one
year are classified as short-term time deposit while investments with original maturities of more than
one year are classified as long-term time deposit.
Cash in a Segregated Account
Cash in a segregated account represents clients’ monies maintained by COLHK with a licensed bank
arising from its normal course of business.
The asset is recognized to the extent that COLHK bears the risks and rewards related to the clients’
monies deposited in the bank. Similarly, the accompanying liability is recognized to the extent that
COLHK has the obligation to deliver cash to its customers upon withdrawal and is liable for any loss or
misappropriation of clients’ monies.
Financial Instruments - Initial Recognition and Subsequent Measurement
Date of Recognition
Financial instruments are any contracts that give rise to a financial asset of one entity and a financial
liability or equity instrument of another entity. Financial instruments are recognized in the consolidated
statement of financial position when the Group becomes a party to the contractual provisions of the
instrument. Purchases or sales of financial assets that require delivery of assets within the time frame
established by regulation or convention in the marketplace are recognized on the trade date.
Financial Instruments at FVTPL
Financial assets and financial liabilities at FVTPL are recorded in the consolidated statement of
financial position at fair value. Changes in fair value are recorded in ‘Trading gains (losses) - net’ in
the consolidated statement of income. Interest earned or incurred is recorded in interest income or
expense, respectively, while dividend income is recorded in other revenues according to the terms of the
contract, or when the right of the payment has been established.
Initial Recognition and Classification of Financial Instruments
Financial assets are measured at FVTPL unless these are measured at fair value through other
comprehensive income (FVOCI) or at amortized cost. Financial liabilities are classified as either
financial liabilities at FVTPL or financial liabilities at amortized cost. The classification of financial
assets depends on the contractual terms and the business model for managing the financial assets.
Subsequent to initial recognition, the Group may reclassify its financial assets only when there is a
20
change in its business model for managing these financial assets. Reclassification of financial liabilities
is not allowed.
The Group determines its business model at the level that best reflects how it manages groups of
financial assets to achieve its business objective. The Group’s business model is not assessed on an
instrument-by-instrument basis, but at a higher level of aggregated portfolios. As a second step of its
classification process, the Group assesses the contractual terms of financial assets to identify whether
they pass the contractual cash flows test (SPPI test).
Investment securities at FVOCI
Investment securities at FVOCI include debt and equity securities. After initial measurement,
investment securities at FVOCI are subsequently measured at fair value. The unrealized gains and
losses arising from the fair valuation of investment securities at FVOCI are excluded, net of tax as
applicable, from the reported earnings and are included in the consolidated statement of comprehensive
income as ‘Change in net unrealized loss on investment securities at FVOCI’.
Debt securities at FVOCI are those that meet both of the following conditions: (i) the asset is held
within a business model whose objective is to hold the financial assets in order to both collect
contractual cash flows and sell financial assets; and (ii) the contractual terms of the financial asset give
rise on specified dates to cash flows that are SPPI on the outstanding principal amount. The effective
yield component of debt securities at FVOCI, as well as the impact of restatement on foreign currency-
denominated debt securities at FVOCI, is reported in the consolidated statement of income. Interest
earned on holding debt securities at debt securities at FVOCI are reported as ‘Interest income’ using the
effective interest rate (EIR) method. When the debt securities at FVOCI are disposed of, the cumulative
gain or loss previously recognized in the statement of comprehensive income is recognized as ‘Trading
and securities gain (loss) - net’ in the consolidated statement of income. The expected credit losses
(ECL) arising from impairment of such investments are recognized in OCI with a corresponding charge
to ‘Provision for credit losses’ in the consolidated statement of income.
Equity securities designated at FVOCI are those that the Group made an irrevocable election to present
in OCI the subsequent changes in fair value. Dividends earned on holding equity securities at FVOCI
are recognized in the consolidated statement of income as ‘Dividends’ when the right of the payment
has been established, except when the Group benefits from such proceeds as a recovery of part of the
cost of the instrument, in which case, such gains are recorded in OCI. Gains and losses on disposal of
these equity securities are never recycled to profit or loss, but the cumulative gains or losses previously
recognized in the consolidated statement of comprehensive income is reclassified to ‘Surplus’ or any
other appropriate equity account upon disposal. Equity securities at FVOCI are not subject to
impairment assessment.
The Group had no investment securities at FVOCI as at June 30, 2021 and December 31, 2020.
Financial assets at amortized cost
Financial assets at amortized cost are debt financial assets that meet both of the following conditions:
(i) these are held within a business model whose objective is to hold the financial assets in order to
collect contractual cash flows; and (ii) the contractual terms give rise on specified dates to cash flows
that are SPPI on the outstanding principal amount. This accounting policy mainly relates to the
consolidated statement of financial position captions ‘Cash and cash equivalents’, ‘Cash in a segregated
account’, ‘Short-term time deposit’, ‘Trade receivables’, ‘Other receivables’, ‘Investment securities at
amortized cost’ and deposit and refundable contributions to Clearing and Trade Guarantee Fund
(CTGF) and refundable deposits under ‘Other noncurrent assets’, which arise primarily from service
revenues and other types of receivables.
After initial measurement, financial assets at amortized cost are subsequently measured at amortized
cost using the EIR method, less impairment in value. Amortized cost is calculated by taking into
account any discount or premium on acquisition and fees that are an integral part of the EIR. The
amortization is included in ‘Interest income’ in the consolidated statement of income. Gains and losses

21
are recognized in consolidated statement of income when these investments are derecognized or
impaired, as well as through the amortization process. The ECL are recognized in the consolidated
statement of income under ‘Provision for credit losses’. The effects of revaluation on foreign currency-
denominated investments are recognized in the consolidated statement of income.
Fair Value Measurement
The Group measures financial instruments, such as financial assets at FVTPL, at fair value at each end
of the reporting period. Also, fair values of financial instruments measured at amortized cost are
disclosed in Note 24.
Fair value is the estimated price that would be received to sell an asset or paid to transfer a liability in an
orderly transaction between market participants at the measurement date. The fair value measurement
is based on the presumption that the transaction to sell the asset or transfer the liability takes place
either:
• In the principal market for the asset or liability, or
• In the absence of a principal market, in the most advantageous market for the asset or liability.
The principal or the most advantageous market must be accessible by the Group. The fair value of an
asset or a liability is measured using the assumptions that market participants would use when pricing
the asset or liability, assuming that market participants act in their economic best interest.
A fair value measurement of a non-financial asset takes into account a market participant’s ability to
generate economic benefits by using the asset in its highest and best use or by selling it to another
market participant that would use the asset in its highest and best use.
The Group uses valuation techniques that are appropriate in the circumstances and for which sufficient
data are available to measure fair value, maximizing the use of relevant observable inputs and
minimizing the use of unobservable inputs.
All assets and liabilities for which fair value is measured or disclosed in the consolidated financial
statements are categorized within the fair value hierarchy, described as follows, based on the lowest
level input that is significant to the fair value measurement as a whole:
• Level 1 - Quoted (unadjusted) market prices in active markets for identical assets or liabilities
• Level 2 - Valuation techniques for which the lowest level input that is significant to the fair value
measurement is directly or indirectly observable
• Level 3 - Valuation techniques for which the lowest level input that is significant to the fair value
measurement is unobservable
For assets and liabilities that are recognized in the consolidated financial statements on a recurring
basis, the Group determines whether transfers have occurred between Levels in the hierarchy by re-
assessing categorization (based on the lowest level input that is significant to the fair value
measurement as a whole) at each end of the reporting period.
The fair value of equity financial instruments that are actively traded in organized financial markets is
determined by reference to quoted market close prices at the close of business of the reporting period.
For financial instruments where there is no active market, fair value is determined using valuation
techniques. Such techniques include comparison to similar investments for which market observable
prices exist and discounted cash flow analysis or other valuation models.
For the purpose of fair value disclosures, the Group has determined classes of assets and liabilities on
the basis of the nature, characteristics and risks of the asset or liability and the level of the fair value
hierarchy as explained above.
22
Trade Receivables and Payables
Trade receivables from customers, which include margin accounts, and payable to clearing house and
other brokers arise from securities purchased (in a regular way transaction) that have been contracted
for but not yet delivered and settled at the end of the reporting period. Payable to customers and
receivable from clearing house and other brokers arise from securities sold (in a regular way
transaction) that have been contracted for but not yet delivered and settled at the end of the reporting
period. Refer to the accounting policy for ‘Financial assets’ and ‘Financial liabilities’ for recognition
and measurement. The related security valuation shows all positions as of clearance date.
Derecognition of Financial Instruments
Financial Assets
A financial asset (or, where applicable a part of a financial asset or part of a group of similar financial
assets) is derecognized when:
• the rights to receive cash flows from the asset have expired;
• the Group retains the right to receive cash flows from the asset, but has assumed an obligation to
pay them in full without material delay to a third party under a ‘pass-through’ arrangement; or
• the Group has transferred its rights to receive cash flows from the asset and either (a) has transferred
substantially all the risks and rewards of the asset, or (b) has neither transferred nor retained
substantially all the risks and rewards of the asset, but has transferred control of the asset.
When the Group has transferred its rights to receive cash flows from an asset and has neither transferred
nor retained substantially all the risks and rewards of the asset nor transferred control of the asset, the
asset is recognized to the extent of the Group’s continuing involvement in the asset. Continuing
involvement that takes the form of a guarantee over the transferred asset is measured at the lower of the
original carrying amount of the asset and the maximum amount of consideration that the Group could
be required to repay.
Financial Liabilities
A financial liability is derecognized when the obligation under the liability is discharged or cancelled or
has expired.
Where an existing financial liability is replaced by another from the same lender on substantially
different terms, or the terms of an existing liability are substantially modified, such exchange or
modification is treated as a derecognition of the original liability and the recognition of a new liability,
and the difference in the respective carrying amounts is recognized in the consolidated statement of
income.
Impairment of Financial Assets
The Group recognizes an ECL for all debt instruments not held at FVTPL. ECLs are based on the
difference between the contractual cash flows due in accordance with the contract and all the cash flows
that the Group expects to receive, discounted at an approximation of the original effective interest rate.
The expected cash flows will include cash flows from the sale of collateral held or other credit
enhancements that are integral to the contractual terms.
ECLs are recognized in two stages. For credit exposures for which there has not been a significant
increase in credit risk since initial recognition, ECLs are provided for credit losses that result from
default events that are possible within the next 12 months (a 12-month ECL). For those credit
exposures for which there has been a significant increase in credit risk since initial recognition, a loss
allowance is required for credit losses expected over the remaining life of the exposure, irrespective of
the timing of the default (a lifetime ECL).
The Group calculates ECL either on an individual or a collective basis. The Group performs collective
impairment by grouping exposures into smaller homogeneous portfolios based on a combination of
borrower and account characteristics. Accounts with similar risk attributes (i.e. facility, security, credit
23
rating, months-on-books, utilization and collateral type, etc.) are pooled together for calculation
provisions based on the ECL models.
The Group assesses on a forward-looking basis the ECL associated with its debt instrument asset carried
at amortized cost and the exposure arising from unutilized margin trading facility.
For trade receivables, the Group applies a simplified approach in calculating ECLs. Therefore, the
Group does not track changes in credit risk, but instead recognizes a loss allowance based on lifetime
ECLs at each reporting date. The Group has established a provision matrix that is based on its historical
credit loss experience, adjusted for forward-looking factors specific to the debtors and the economic
environment. A broad range of forward-looking factors are considered as economic inputs, such as
growth of the gross domestic product, inflation rates, unemployment rates, interest rates and Philippine
Stock Exchange Composite Index (PSEi) statistical indicators.
For cash and cash equivalents, cash in a segregated account, short-term time deposits and long-term
time deposit, the Group applies the low credit risk simplification.
Generally, the Group considers a financial asset in default when contractual payments are 90 days past
due. However, in certain cases, the Group may also consider a financial asset to be in default when
internal or external information indicates that the Group is unlikely to receive the outstanding
contractual amounts in full before taking into account any credit enhancements held by the Group. A
financial asset is written off when there is no reasonable expectation of recovering the contractual cash
flows. Treasury exposures are considered in default upon occurrence of a credit event such as but not
limited to bankruptcy of counterparty, restructuring, failure to pay on an agreed settlement date, or
request for moratorium.
Offsetting of Financial Assets and Liabilities
Financial assets and liabilities are offset and the net amount is reported in the consolidated statement of
financial position if, and only if, there is a currently enforceable legal right to offset the recognized
amounts and the Group intends to either settle on a net basis, or to realize the asset and the liability
simultaneously. The Group assesses that it has a currently enforceable right of offset if the right is not
contingent on a future event, and is legally enforceable in the normal course of business, event of
default, and event of insolvency or bankruptcy of the Group and all of the counterparties.
Prepayments and Other Assets
The Group’s prepayments are composed of prepaid insurance, prepaid taxes, prepaid rent and other
prepayments. Other current assets are composed of creditable withholding tax (CWT) and input value-
added tax (VAT). Other noncurrent assets are composed of deposit and refundable contributions to
CTGF, refundable deposits, receivable from Bureau of Internal Revenue (BIR), deferred input VAT and
intangible assets under development. These assets are classified as current when it is probable to be
realized within one (1) year from the end of the reporting period. Otherwise, these are classified as
noncurrent assets.
Property and Equipment
Property and equipment is stated at cost, excluding the costs of day-to-day servicing, less accumulated
depreciation and amortization and any accumulated impairment losses, if any.
Such cost includes the cost of replacing part of such property and equipment, if the recognition criteria
are met.
The initial cost of property and equipment comprises its purchase price, including import duties, non-
refundable taxes and any directly attributable costs of bringing the asset to its working condition and
location for its intended use. Expenditures incurred after the property and equipment have been put into
operations, such as repairs and maintenance, are normally charged against income in the period when
the costs are incurred. In situations where it can be clearly demonstrated that the expenditures have
resulted in an increase in the future economic benefits expected to be obtained from the use of an item
24
of property and equipment beyond its originally assessed standard of performance, the expenditures are
capitalized as additional costs of property and equipment.
Each part of an item of property and equipment with a cost that is significant in relation to the total cost
of the item is depreciated separately.
Depreciation and amortization is computed on the straight-line basis over the following estimated useful
lives of the assets:
Category Number of Years
Online trading equipment and facilities 3-10
Furniture, fixtures and equipment 3-10
Leasehold improvements
5 or term of lease,
whichever is shorter
The carrying values of property and equipment are reviewed for impairment when events or changes in
circumstances indicate that the carrying value may not be recoverable.
An item of property and equipment is derecognized upon disposal or when no future economic benefits
are expected from its use or disposal. Any gain or loss arising on derecognition of the asset (calculated
as the difference between the net disposal proceeds and the carrying amount of the asset) is included in
the consolidated statement of income in the year the asset is derecognized. The asset’s residual values,
if any, useful lives and methods are reviewed and adjusted if appropriate, at each end of the reporting
period.
The Group adopted a policy to classify right-of-use assets as part of property and equipment. Prior to
that date, all of the Group’s leases are accounted for as operating leases in accordance with PAS 17,
hence, not recorded in the consolidated statement of financial position. The Group recognizes right-of-
use assets at the commencement date of the lease (i.e., the date the underlying asset is available for use).
Right-of-use assets are initially measured at cost, less any accumulated depreciation and impairment
losses, and adjusted for any remeasurement of lease liabilities. The initial cost of right-of-use assets
includes the amount of lease liabilities recognized, initial direct costs incurred, lease payments made at
or before the commencement date less any lease incentives received and estimate of costs to be incurred
by the lessee in dismantling and removing the underlying asset, restoring the site on which it is located
or restoring the underlying asset to the condition required by the terms and conditions of the lease,
unless those costs are incurred to produce inventories.
Unless the Group is reasonably certain to obtain ownership of the leased asset at the end of the lease
term, the recognized right-of-use assets are depreciated on a straight-line basis over the shorter of their
estimated useful life of five (5) years and lease term. Right-of-use assets are subject to impairment.
Investment Property
Investment properties are measured initially at cost, including transaction costs. Subsequent to initial
recognition, investment properties are carried at cost less accumulated depreciation (for depreciable
investment properties) and impairment in value.
Investment properties are derecognized either when they have been disposed of or when they are
permanently withdrawn from use and no future economic benefit is expected from their disposal. The
difference between the net disposal proceeds and the carrying amount of the asset is recognized in profit
or loss in the period of derecognition.
Expenditures incurred after the investment properties have been put into operations, such as repairs and
maintenance costs, are normally charged to operations in the year in which the costs are incurred.
Depreciation is calculated on a straight-line basis using the remaining useful lives from the time of
acquisition of the investment properties based on appraisal reports but not to exceed 50 years for
buildings and condominium units.
25
Transfers are made to (or from) investment property only when there is a change in use. For a transfer
from investment property to owner-occupied property, the deemed cost for subsequent accounting is the
fair value at the date of change in use. If owner-occupied property becomes an investment property, the
Group accounts for such property in accordance with the policy stated under property and equipment up
to the date of change in use.
Intangibles
Exchange Trading Rights
Exchange trading rights are carried at cost less any allowance for impairment losses and are reviewed
for impairment annually or more frequently if events or changes in circumstances indicate that the
carrying values may be impaired. The exchange trading rights are deemed to have indefinite useful
lives as there is no foreseeable limit to the period over which the asset is expected to generate net cash
inflows for the Group. The assessment of indefinite life is reviewed annually to determine whether the
indefinite useful life continues to be supportable. If not, the change in useful life from indefinite to
finite is made on a prospective basis. The Parent Company does not intend to sell its exchange trading
right in the near future while COLHK’s exchange trading right is a nontransferable right.
Software Costs
Costs related to software purchased by the Group for use in operations are amortized on a straight-line
basis over the estimated life of three (3) to ten (10) years.
Impairment of Non-Financial Assets
The Group assesses at each end of the reporting period whether there is an indication that its
prepayments, property and equipment, intangibles and other assets may be impaired. If any such
indication exists or when the annual impairment testing for an asset is required, the Group makes an
estimate of the asset’s recoverable amount. An asset’s recoverable amount is the higher of the asset’s
value-in-use (VIU) or its fair value less costs to sell. The fair value less costs to sell is the amount
obtainable from the sale of an asset at an arm’s length transaction, while VIU is the present value of
estimated future cash flows expected to arise from the continuing use of an asset and from its disposal at
the end of its useful life. Where the carrying amount of an asset exceeds its recoverable amount, the
asset is considered impaired and is written down to its recoverable amount. An impairment loss is
recognized by a charge against current operations for the excess of the carrying amount of an asset over
its recoverable amount in the year in which it arises.
Intangibles with indefinite useful lives are tested for impairment annually at end of the reporting period
either individually or at the cash generating unit level, as appropriate. Intangibles with finite lives are
assessed for impairment whenever there is an indication that the intangible asset may be impaired. A
previously recognized impairment loss is reversed by a credit to current operations to the extent that it
does not restate the asset to a carrying amount in excess of what would have been determined (net of
any accumulated depreciation and amortization) had no impairment loss been recognized for the asset in
prior years.
Leases
Group as a lessee The Group recognized right-of-use assets and lease liabilities for those leases previously classified as
operating leases, except for leases of low-value assets. The right-of-use assets for all leases were recognized based on the amount equal to the lease liabilities, adjusted for any related prepaid and
accrued lease payments previously recognized. Lease liabilities were recognized based on the present value of the remaining lease payments, discounted using the incremental borrowing rate at the date of
initial application.
Lease liabilities
At the commencement date of the lease, the Group recognizes lease liabilities measured at the present
value of lease payments to be made over the lease term. The lease payments include fixed payments
(including in substance fixed payments) less any lease incentives receivable, variable lease payments
26
that depend on an index or a rate, and amounts expected to be paid under residual value guarantees. The
lease payments also include the exercise price of a purchase option reasonably certain to be exercised by
the Group and payments of penalties for terminating a lease, if the lease term reflects the Group
exercising the option to terminate. The variable lease payments that do not depend on an index or a rate
are recognized as expense in the period on which the event or condition that triggers the payment
occurs.
In calculating the present value of lease payments, the Group uses the incremental borrowing rate at the
lease commencement date if the interest rate implicit in the lease is not readily determinable. After the
commencement date, the amount of lease liabilities is increased to reflect the accretion of interest and
reduced for the lease payments made. In addition, the carrying amount of lease liabilities is remeasured
if there is a modification, a change in the lease term, a change in the in-substance fixed lease payments
or a change in the assessment to purchase the underlying asset.
Leases of low-value assets
The Group applies the leases of low-value assets recognition exemption to leases of office equipment
that are considered of low value. Lease payments on leases of low-value assets are recognized as
expense on a straight-line basis over the lease term.
Provisions
Provisions are recognized when the Group has a present obligation (legal or constructive) as a result of a
past event, it is probable that an outflow of resources embodying economic benefits will be required to
settle the obligation and a reliable estimate can be made of the amount of the obligation. If the effect of
the time value of money is material, provisions are made by discounting the expected future cash flows
at a pre-tax rate that reflects current market assessments of the time value of money and, where
appropriate, the risks specific to the liability. Where discounting is used, the increase in the provision
due to the passage of time is recognized as an interest expense.
Where the Group expects some or all of a provision to be reimbursed, the reimbursement is recognized
as a separate asset but only when the reimbursement is virtually certain. The expense relating to any
provision is presented in the consolidated statement of income, net of any reimbursement.
Capital Stock and Capital Paid-in Excess of Par Value
The Parent Company has issued capital stock that is classified as equity. Incremental costs directly
attributable to the issue of new capital stock are shown in equity as a deduction, net of any related tax
benefit, from the proceeds.
Where the Group purchases the Parent Company’s capital stock (treasury shares), the consideration
paid, including any directly attributable incremental costs (net of applicable taxes) is deducted from
equity attributable to the Parent Company’s stockholders until the shares are cancelled or reissued.
Where such shares are subsequently reissued, any consideration received, net of any directly attributable
incremental transaction costs and the related tax effects, is included in equity.
Amount of contribution in excess of par value is accounted for as a capital in excess of par value.
Capital in excess of par value also arises from additional capital contribution from the stockholders.
Retained Earnings
Retained earnings are accumulated profits realized out of normal and continuous operations of the
business after deducting therefrom distributions to stockholders and transfers to capital or other
accounts. Cash and stock dividends are recognized as a liability and a deduction from equity when they
are approved by the Group’s BOD and stockholders, respectively. Dividends for the year that are
approved after the end of the reporting period are dealt with as an event after the end of the reporting
period.
Retained earnings may also include retrospective effect of changes in accounting policy as may be
required by the transitional provisions of the new or revised accounting policy.
27
Unappropriated retained earnings represent the accumulated profits and gains realized out of the normal
and continuous operations of the Group after deducting therefrom distributions to stockholders and
transfers to capital stocks or other accounts, and which is:
• Not appropriated by its BOD for corporate expansion projects or programs;
• Not covered by a restriction for dividend declaration under a loan agreement;
• Not required under special circumstances obtaining in the Group such as when there is a need for a
special reserve for probable contingencies.
Appropriated retained earnings represent that portion which has been restricted and, therefore, not
available for dividend declaration.
Revenue Recognition
Revenue from contracts with customers is recognized upon transfer of services to the customer at an
amount that reflects the consideration to which the Group expects to be entitled in exchange for those
services.
The Group assesses its revenue arrangements against specific criteria in order to determine if it is acting
as a principal or agent. The Group has concluded that it is the principal in all of its revenue
arrangements except for its brokerage transactions. The following specific recognition criteria must
also be met before revenue is recognized:
Commissions
Commissions are recognized as income upon confirmation of trade deals. These are computed for
every trade transaction based on a flat rate or a percentage of the amount of trading transaction,
whichever is higher.
Trail Fees
Trail fees are recognized as income as they are earned. These pertain to the revenue earned by the
Parent Company from the distribution of mutual funds of various fund houses to its customers and are
computed daily as a percentage of the total assets under administration for each fund.
Revenues outside the scope of PFRS 15
Interest
For all financial instruments measured at amortized cost and interest-bearing financial instruments
classified as investment securities at FVOCI, interest income is recorded at the EIR, which is the rate
that exactly discounts estimated future cash receipts through the expected life of the financial
instrument or a shorter period, where appropriate, to the net carrying amount of the financial asset. The
calculation takes into account all contractual terms of the financial instrument, including any fees or
incremental costs that are directly attributable to the instrument and are an integral part of the EIR. The
adjusted carrying amount is calculated based on the original EIR. The change in carrying amount is
recorded as ‘Interest income’.
Under PFRS 9, when a financial asset becomes credit-impaired, the Group calculates interest income by
applying the EIR to the net amortized cost of the financial asset. If the financial asset cures and is no
longer credit-impaired, the Group reverts to calculating interest income on a gross basis.
Trading gains (losses) - net
Results arising from trading activities include all gains and losses from changes in fair value for
financial assets and financial liabilities at FVTPL and gains and losses from disposal of investment
securities at FVTPL and debt securities at FVOCI.
Unrealized trading gains and losses comprise changes in the fair value of financial instruments for the
period and from reversal of prior period’s unrealized gains and losses for financial instruments which
were realized in the reporting period. Realized gains and losses on disposals of financial instruments
28
classified as at FVTPL are calculated using the first-in, first-out (FIFO) method. They represent the
difference between an instrument’s initial carrying amount and disposal amount.
Dividend
Dividend income is recognized when the right to receive payment is established, which is the date of
declaration.
Other Income
Revenue is recognized in the consolidated statement of income as they are earned.
Costs and Expenses
Costs and expenses are decreases in economic benefits during the accounting period in the form of
outflows or decrease of assets or incurrence of liabilities that result in decreases in equity, other than
those relating to distributions to equity participants. Cost of services such as commissions, direct
personnel costs, stock exchange dues and fees, central depository fees, research costs, and
communication costs are recognized when the related revenue is earned or when the service is rendered.
The majority of operating expenses incurred by the Group such as indirect personnel costs, professional
fees, computer services, and other operating expenses are overhead in nature and are recognized with
regularity as the Group continues its operations.
Retirement Costs
Defined Benefit Plan
The Parent Company has a noncontributory defined benefit retirement plan.
The net defined benefit liability or asset is the aggregate of the present value of the defined benefit
obligation at the end of the reporting period reduced by the fair value of plan assets (if any), adjusted for
any effect of limiting a net defined benefit asset to the asset ceiling. The asset ceiling is the present
value of any economic benefits available in the form of refunds from the plan or reductions in future
contributions to the plan.
The cost of providing benefits under the defined benefit plans is actuarially determined using the
projected unit credit method. This method reflects service rendered by employees to the date of
valuation and incorporates assumptions concerning the employees’ projected salaries.
Defined benefit costs comprise the following:
• Service cost
• Net interest on the net defined benefit liability or asset
• Remeasurements of net defined benefit liability or asset
Service costs which include current service cost, past service costs and gains or losses on non-routine
settlements are recognized as ‘Retirement costs’ under ‘Personnel costs’. Past service costs are
recognized when plan amendment or curtailment occurs.
Net interest on the net defined benefit liability or asset is the change during the period in the net defined
benefit liability or asset that arises from the passage of time which is determined by applying the
discount rate based on government bonds to the net defined benefit liability or asset. Net interest on the
net defined benefit liability or asset is recognized as ‘Interest expense’ in the consolidated statement of
income.
Remeasurements comprising actuarial gains and losses, return on plan assets and any change in the
effect of the asset ceiling (excluding net interest on defined benefit liability) are recognized immediately
in OCI in the period in which they arise. Remeasurements are not reclassified to the consolidated
statement of income in subsequent periods. Remeasurements recognized in OCI are retained in OCI
which are presented as ‘Gain (loss) on remeasurement of retirement obligation’ under equity.

29
Plan assets are assets that are held by a long-term employee benefit fund or qualifying insurance
policies. Plan assets are not available to the creditors of the Group, nor can they be paid directly to the
Group. Fair value of plan assets is based on market price information. When no market price is
available, the fair value of plan assets is estimated by discounting expected future cash flows using a
discount rate that reflects both the risk associated with the plan assets and the maturity or expected
disposal date of those assets (or, if they have no maturity, the expected period until the settlement of the
related obligations). If the fair value of the plan assets is higher than the present value of the defined
benefit obligation, the measurement of the resulting defined benefit asset is limited to the present value
of economic benefits available in the form of refunds from the plan or reductions in future contributions
to the plan.
The Group’s right to be reimbursed of some or all of the expenditure required to settle a defined benefit
obligation is recognized as a separate asset at fair value when and only when reimbursement is virtually
certain.
Defined Contribution Plan
The retirement plan of COLHK is a defined contribution retirement plan. Under a defined contribution
retirement plan, the entity’s legal and constructive obligation is limited to the amount that it agrees to
contribute to the fund. Thus, the amount of the post-employment benefits received by the employee is
determined by the amount of contributions paid by an entity to a post-employment benefit plan, together
with investment returns arising from the contributions. Consequently, actuarial risk (that benefits will
be less than expected) and investment risk (that assets invested will be sufficient to meet expected
benefits) fall on the employee.
The standard requires an entity to recognize short-term employee benefits when an employee has
rendered service in exchange of those benefits.
Earnings per Share (EPS)
Basic EPS is computed by dividing earnings applicable to common stock by the weighted average
number of common shares outstanding, after giving retroactive effect for any stock dividends, stock
splits or reverse stock splits during the year.
Diluted EPS is computed by dividing net income by the weighted average number of common shares
outstanding during the year, after giving retroactive effect for any stock dividends, stock splits or
reverse stock splits during the year, and adjusted for the effect of dilutive options.
Outstanding share options plan (SOP) shares will have a dilutive effect under the treasury stock method
only when the average market price of the underlying common share during the period exceeds the
exercise price of the option. Where the effect of the exercise of all outstanding options has anti-dilutive
effect, basic and diluted EPS are stated at the same amount.
Potential ordinary shares are weighted for the period they are outstanding. Potential ordinary shares
that are converted into ordinary shares during the period are included in the calculation of diluted EPS
from the beginning of the period to the date of conversion; from the date of conversion, the resulting
ordinary shares are included in both basic and diluted EPS.
Taxes
Current Income Tax
Current income tax assets and liabilities are measured at the amount expected to be recovered from or
paid to the taxation authorities. The income tax rates and income tax laws used to compute the amount
are those that are enacted or substantively enacted at the end of the reporting period in the countries
where the Group operates and generates taxable income. Management periodically evaluates positions
taken in the tax returns with respect to situations in which applicable tax regulations are subject to
interpretations and establishes provisions where appropriate.

30
Deferred Income Tax
Deferred income tax is provided, using the balance sheet liability method, on all temporary differences
at the end of the reporting period between the tax bases of assets and liabilities and their carrying
amounts for financial reporting purposes.
Deferred income tax assets and liabilities are recognized for all taxable temporary differences.
With respect to investments in foreign subsidiaries, deferred income tax liabilities are recognized except
where the timing of the reversal of the temporary difference can be controlled and it is probable that the
temporary difference will not reverse in the foreseeable future.
Deferred income tax assets are recognized for all deductible temporary differences including net loss
carry-over to the extent that it is probable that sufficient future taxable income will be available against
which the deductible temporary differences can be utilized. Deferred income tax, however, is not
recognized on temporary differences that arise from the initial recognition of an asset or liability in a
transaction that is not a business combination and, at the time of the transaction, affects neither the
accounting income nor the taxable income or loss.
The carrying amount of deferred income tax assets is reviewed at each end of the reporting period and
reduced to the extent that it is no longer probable that sufficient future taxable income will be available
to allow all or part of the deferred income tax asset to be utilized. Unrecognized deferred income tax
assets are reassessed at each end of the reporting period and are recognized to the extent that it has
become probable that future taxable income will allow the deferred income tax asset to be recovered.
Deferred income tax assets and liabilities are measured at the tax rates that are applicable to the period
when the asset is realized or the liability is settled, based on income tax rates and income tax laws that
have been enacted or substantively enacted at the end of the reporting period.
Deferred income tax relating to items recognized directly in equity is also recognized in equity.
Deferred income tax items are recognized in correlation to the underlying transaction either in OCI or
directly in equity.
Deferred income tax assets and deferred income tax liabilities are offset if a legally enforceable right
exists to offset current income tax assets against current income tax liabilities and deferred income taxes
related to the same taxable entity and the same taxation authority.
Contingencies
Contingent liabilities are not recognized in the consolidated financial statements. These are disclosed
unless the possibility of an outflow of resources embodying economic benefits is remote. Contingent
assets are not recognized in the consolidated financial statements but are disclosed when an inflow of
economic benefits is probable.
Segment Reporting
The Group’s operating businesses are organized and managed separately according to the nature of the
products and services provided, with each segment representing a strategic business unit that offers
different products and serves different markets. Financial information on business segments is
presented in Note 26.
Events After the End of the Reporting Period
Post year-end events that provide additional information about the Group’s position at the end of the
reporting period (adjusting events) are reflected in the consolidated financial statements. Post year-end
events that are not adjusting events are disclosed when material.
Coronavirus outbreak
In late 2019, a cluster of cases displaying the symptoms of a ‘pneumonia of unknown cause’ were
identified in Wuhan, the capital of China’s Hubei province. On December 31, 2019, China alerted the
31
World Health Organization (WHO) of the coronavirus disease 2019 (COVID-19) or coronavirus
outbreak. On January 30, 2020, the International Health Regulations Emergency Committee of the
WHO declared the outbreak a ‘Public Health Emergency of International Concern’. Since then, the
virus has spread worldwide. On March 11, 2020, the WHO announced that the coronavirus outbreak
can be characterized as a pandemic.
In a move to contain the COVID-19 outbreak, on March 13, 2020, the Office of the President of the
Philippines issued a Memorandum directive to impose stringent social distancing measures in the
National Capital Region effective March 15, 2020. On March 16, 2020, Presidential Proclamation No.
929 was issued, declaring a State of Calamity throughout the Philippines for a period of six (6) months
and imposed an enhanced community quarantine (ECQ) throughout the island of Luzon until April 12,
2020, unless earlier lifted or extended. As of June 30, 2021, different parts of the country remain to be
under varying degree of community quarantine.
In order to comply with the government’s measures to monitor and mitigate the effects of COVID-19,
the following were taken by the Group:
• provided safety and health measures for our employees, such as establishing a work-from-home
set-up to majority of our employees to minimize personal contact;
• leased staff houses with close proximity to office premises for the use of employees personally
reporting to work and prepared necessary social distancing measures; and
• made sure that all personnel have access to health insurance coverage.
The scale and duration of these developments remain uncertain as of the report date. However, the
Group exhibited resilience due to the online nature of its business and operations. The Group has
necessary business continuity processes in place that specifically address the disruptions and risks
brought by the pandemic. There were no material changes in the Group’s accounting policies that was
specifically attributable to the pandemic other than the amendments to PFRS 16, COVID-19-related
Rent Concessions.
Considering the evolving nature of the pandemic, the Group will continue to monitor the situation and
respond to new issues accordingly.
3. Significant Accounting Judgments, Estimates and Assumptions
The preparation of the consolidated financial statements in accordance with PFRS requires the Group to
make judgments and estimates that affect the reported amounts of assets, liabilities, income and
expenses and disclosure of contingent assets and contingent liabilities. Future events may occur which
will cause the judgments and assumptions used in arriving at the estimates to change. The effects of
any change in judgments and estimates are reflected in the consolidated financial statements as they
become reasonably determinable.
Judgments and estimates and assumptions are continually evaluated and are based on historical
experience and other factors, including expectations of future events that are believed to be reasonable
under the circumstances. However, actual outcome can differ from these estimates.
Estimates and Assumptions
The key assumptions concerning the future and other key sources of estimation uncertainty at the end of
the reporting period, that have a significant risk of causing a material adjustment to the carrying
amounts of assets and liabilities within the next reporting period are discussed below.
Impairment of the Intangibles
Intangibles include exchange trading rights which are carried at cost less any allowance for impairment
loss. Exchange trading rights are reviewed for impairment annually or more frequently if events or
changes in circumstances indicate that the carrying values may be impaired. The exchange trading
32
rights are deemed to have indefinite useful lives as there is no foreseeable limit to the period over which
the asset is expected to generate net cash inflows for the Group.
The Management’s impairment test for the exchange trading rights is based on the higher of fair value
less costs to sell and VIU. The assumptions used in the calculation of the VIU are sensitive to estimates
of future cash flows from the cash-generating unit, discount rate and revenue growth rate used to project
the cash flows.
The key assumptions used to determine the recoverable amount of the Group’s exchange trading rights
are further explained in Note 11. The Parent Company does not intend to sell its exchange trading right
in the near future. COLHK’s right is nontransferable with an indefinite useful life. As at June 30, 2021
and December 31, 2020, the carrying values of intangibles are disclosed in Note 11.
Estimating Recoverability of Deferred Income Tax Assets
The Group reviews the carrying amounts of deferred income tax assets at each end of the reporting
period and reduces deferred income tax assets to the extent that it is no longer probable that sufficient
future taxable income will be available to allow all or part of the deferred income tax assets to be
utilized. The deferred income tax assets as at June 30, 2021 and December 31, 2020 are disclosed in
Note 19.
Determining Retirement Obligation
The costs of defined retirement obligation as well as the present value of the defined benefit obligation
are determined using actuarial valuations. The actuarial valuation involves making various
assumptions. These include the determination of the discount rates, future salary increases, mortality
rates and future retirement increases. Due to the complexity of the valuation, the underlying
assumptions and its long-term nature, defined benefit obligation are highly sensitive to changes in these
assumptions.
All assumptions are reviewed at each end of the reporting period.
In determining the appropriate discount rate, Management considers the interest rates of government
bonds that are denominated in the currency in which the benefits will be paid, with extrapolated
maturities corresponding to the expected duration of the defined benefit obligation.
Further details about the assumptions used are provided in Note 18.
Leases - Estimating the incremental borrowing rate
The Group cannot readily determine the interest rate implicit in the lease, therefore, it uses its
incremental borrowing rate (IBR) to measure lease liabilities. The IBR is the rate of interest that the
Group would have to pay to borrow over a similar term, and with a similar security, the funds necessary
to obtain an asset of a similar value to the right-of-use asset in a similar economic environment. The
IBR therefore reflects what the Group ‘would have to pay’, which requires estimation when no
observable rates are available (such as for subsidiaries that do not enter into financing transactions) or
when they need to be adjusted to reflect the terms and conditions of the lease (for example, when leases
are not in the subsidiary’s functional currency). The Group estimates the IBR using observable inputs
(such as market interest rates) when available and is required to make certain entity-specific estimates
(such as the subsidiary’s stand-alone credit rating).
The Group’s lease liabilities as at June 30, 2021 and December 31, 2020 are disclosed in Note 21.
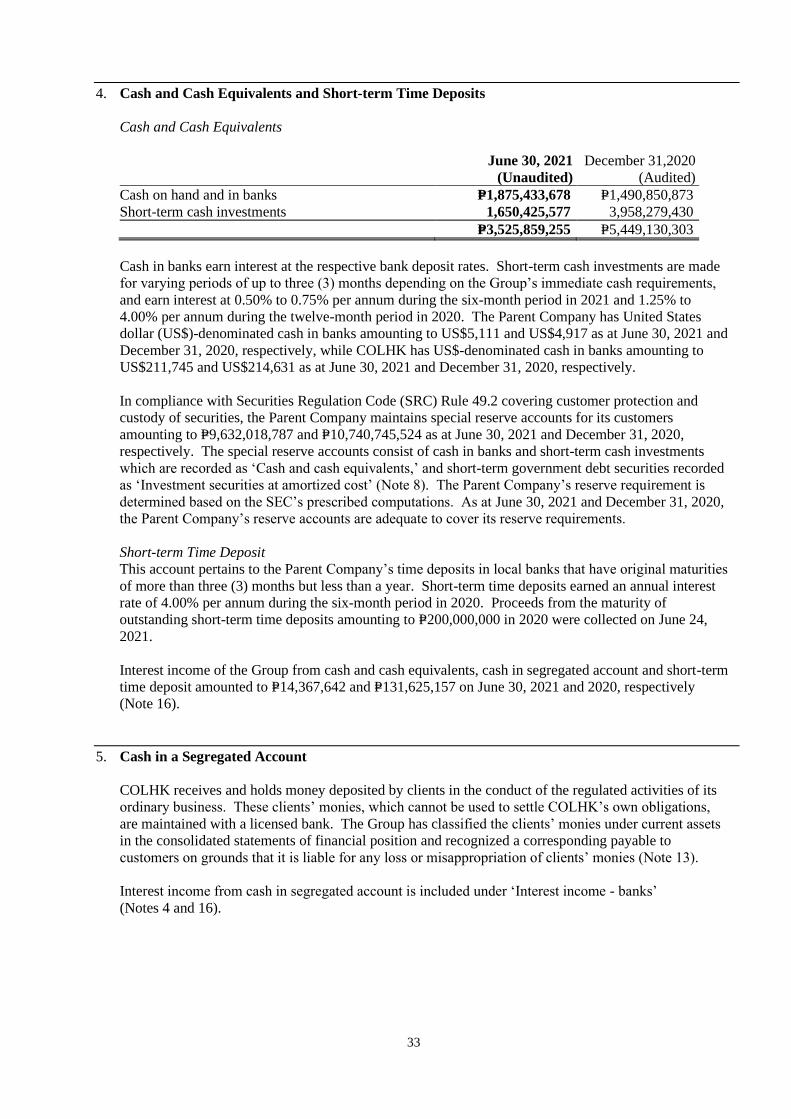
33
4. Cash and Cash Equivalents and Short-term Time Deposits
Cash and Cash Equivalents
June 30, 2021
(Unaudited)
December 31,2020
(Audited)
Cash on hand and in banks P=1,875,433,678 P=1,490,850,873
Short-term cash investments 1,650,425,577 3,958,279,430
P=3,525,859,255 P=5,449,130,303
Cash in banks earn interest at the respective bank deposit rates. Short-term cash investments are made
for varying periods of up to three (3) months depending on the Group’s immediate cash requirements,
and earn interest at 0.50% to 0.75% per annum during the six-month period in 2021 and 1.25% to
4.00% per annum during the twelve-month period in 2020. The Parent Company has United States
dollar (US$)-denominated cash in banks amounting to US$5,111 and US$4,917 as at June 30, 2021 and
December 31, 2020, respectively, while COLHK has US$-denominated cash in banks amounting to
US$211,745 and US$214,631 as at June 30, 2021 and December 31, 2020, respectively.
In compliance with Securities Regulation Code (SRC) Rule 49.2 covering customer protection and
custody of securities, the Parent Company maintains special reserve accounts for its customers
amounting to P=9,632,018,787 and P=10,740,745,524 as at June 30, 2021 and December 31, 2020,
respectively. The special reserve accounts consist of cash in banks and short-term cash investments
which are recorded as ‘Cash and cash equivalents,’ and short-term government debt securities recorded
as ‘Investment securities at amortized cost’ (Note 8). The Parent Company’s reserve requirement is
determined based on the SEC’s prescribed computations. As at June 30, 2021 and December 31, 2020,
the Parent Company’s reserve accounts are adequate to cover its reserve requirements.
Short-term Time Deposit
This account pertains to the Parent Company’s time deposits in local banks that have original maturities
of more than three (3) months but less than a year. Short-term time deposits earned an annual interest
rate of 4.00% per annum during the six-month period in 2020. Proceeds from the maturity of
outstanding short-term time deposits amounting to P=200,000,000 in 2020 were collected on June 24,
2021.
Interest income of the Group from cash and cash equivalents, cash in segregated account and short-term
time deposit amounted to P=14,367,642 and P=131,625,157 on June 30, 2021 and 2020, respectively
(Note 16).
5. Cash in a Segregated Account
COLHK receives and holds money deposited by clients in the conduct of the regulated activities of its
ordinary business. These clients’ monies, which cannot be used to settle COLHK’s own obligations,
are maintained with a licensed bank. The Group has classified the clients’ monies under current assets
in the consolidated statements of financial position and recognized a corresponding payable to
customers on grounds that it is liable for any loss or misappropriation of clients’ monies (Note 13).
Interest income from cash in segregated account is included under ‘Interest income - banks’
(Notes 4 and 16).
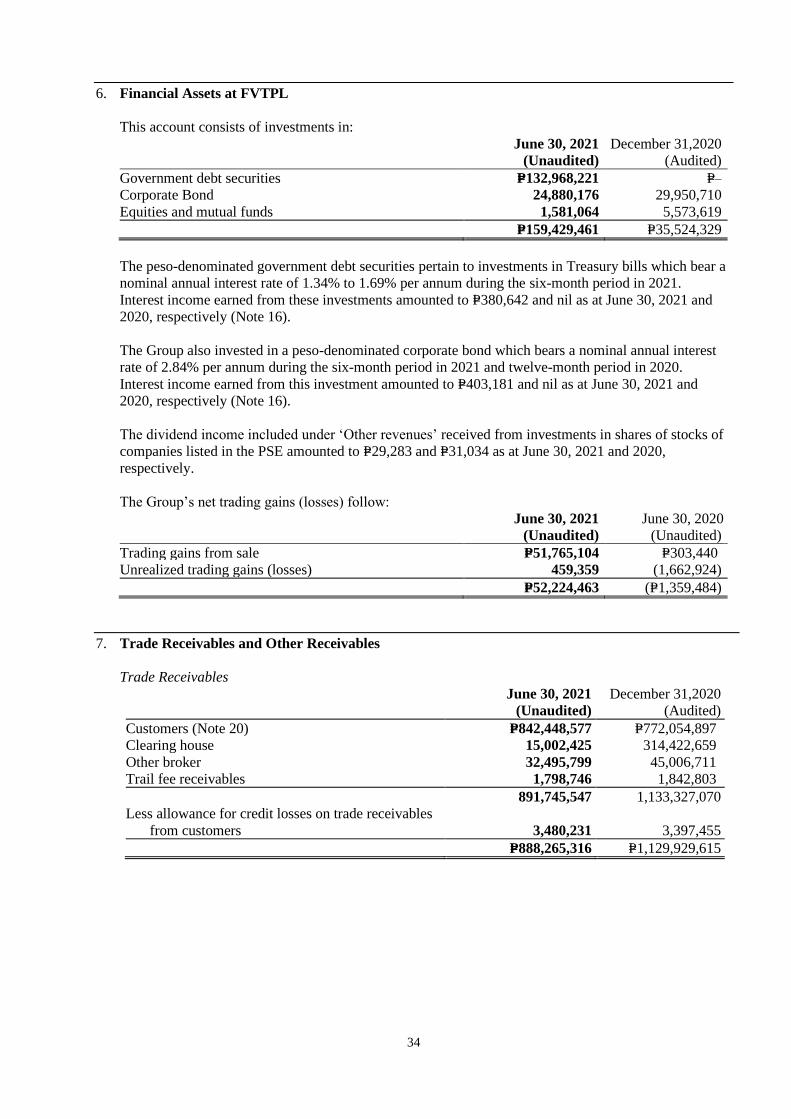
34
6. Financial Assets at FVTPL
This account consists of investments in:
June 30, 2021
(Unaudited)
December 31,2020
(Audited)
Government debt securities P=132,968,221 P=–
Corporate Bond 24,880,176 29,950,710
Equities and mutual funds 1,581,064 5,573,619
P=159,429,461 P=35,524,329
The peso-denominated government debt securities pertain to investments in Treasury bills which bear a
nominal annual interest rate of 1.34% to 1.69% per annum during the six-month period in 2021.
Interest income earned from these investments amounted to P=380,642 and nil as at June 30, 2021 and
2020, respectively (Note 16).
The Group also invested in a peso-denominated corporate bond which bears a nominal annual interest
rate of 2.84% per annum during the six-month period in 2021 and twelve-month period in 2020.
Interest income earned from this investment amounted to P=403,181 and nil as at June 30, 2021 and
2020, respectively (Note 16).
The dividend income included under ‘Other revenues’ received from investments in shares of stocks of
companies listed in the PSE amounted to P=29,283 and P=31,034 as at June 30, 2021 and 2020,
respectively.
The Group’s net trading gains (losses) follow:
June 30, 2021
(Unaudited)
June 30, 2020
(Unaudited)
Trading gains from sale P=51,765,104 P=303,440
Unrealized trading gains (losses) 459,359 (1,662,924)
P=52,224,463 (P=1,359,484)
7. Trade Receivables and Other Receivables
Trade Receivables
June 30, 2021
(Unaudited)
December 31,2020
(Audited)
Customers (Note 20) P=842,448,577 P=772,054,897
Clearing house 15,002,425 314,422,659
Other broker 32,495,799 45,006,711
Trail fee receivables 1,798,746 1,842,803
891,745,547 1,133,327,070
Less allowance for credit losses on trade receivables
from customers 3,480,231 3,397,455
P=888,265,316 P=1,129,929,615

35
The Group’s trade receivables from customers and its security valuation follow:
June 30, 2021
(Unaudited)
December 31, 2020
(Audited)
Money Balance Security Valuation Money Balance Security Valuation
Fully secured accounts:
More than 250% P=560,240,178 P=4,604,527,923 P=473,811,876 P=5,269,246,814
Between 200% and 250% 206,861,837 460,929,190 220,019,722 510,953,734
Between 150% and 200% 35,604,129 69,986,786 12,359,086 23,559,378
Between 100% and 150% 10,257,478 10,627,176 14,938,342 17,280,000
Less than 100% 29,484,365 29,353,736 50,925,765 50,334,484
Unsecured accounts 590 – 106 –
P=842,448,577 P=5,175,424,811 P=772,054,897 P=5,871,374,410
Less allowance for credit losses on
receivable from customers 3,480,231 3,397,455
P=838,968,346 P=768,657,442
As at June 30, 2021 and December 31, 2020, the Parent Company offered a credit line facility
amounting to P=5,360,765,950 and P=5,361,091,950, respectively, to its customers who qualified for
margin account.
Interest income from customers amounted to P=24,750,676 and P=17,677,903 as at June 30, 2021 and
2020, respectively (Note 16).
Trade receivables from margin customers have no specific credit terms but customers are required to
maintain the value of their collateral within a specific level. Once the value of the collateral falls below
this level, customers may either deposit additional collateral or sell stock to cover the deficiency in their
account balance. Meanwhile, receivables from post-paid customers are required to be settled on two (2)
trading days’ term for COLHK and three (3) trading days’ term for the Parent Company. The
receivable balances become demandable upon failure of the customer to duly comply with these
requirements. As at June 30, 2021 and December 31, 2020, P=812,963,622 and P=721,129,026,
respectively, of the total trade receivables from customers are fully covered by collateral.
Trade receivables from clearing house as at June 30, 2021 and December 31, 2020, were fully collected
in July and January 2021, respectively. These are noninterest-bearing and are collected on two (2)
trading days’ term and three (3) trading days’ term following the settlement convention of HK and
Philippines clearing houses, respectively.
Receivables from other broker pertains to clients’ monies deposited to Interactive Brokers (IB) LLC
through COLHK. In March 2014, COLHK opened an account with the said broker to enable its retail
customers to trade in other foreign markets.
Trail fee receivables pertain to the amount due from the mutual fund managers representing the trail fee
earned by the Parent Company for selling mutual funds to its customers. The fee is computed daily and
collected on a monthly basis.
Other Receivables
June 30, 2021
(Unaudited)
December 31,2020
(Audited)
Accrued interest P=12,687,094 P=10,238,969
Mutual fund redemption proceeds (Note 14) 8,244,320 17,484,152
Advances to officers and employees (Note 20) 400,826 1,011,936
Others 9,674,188 9,293,420
P=31,006,428 P=38,028,477
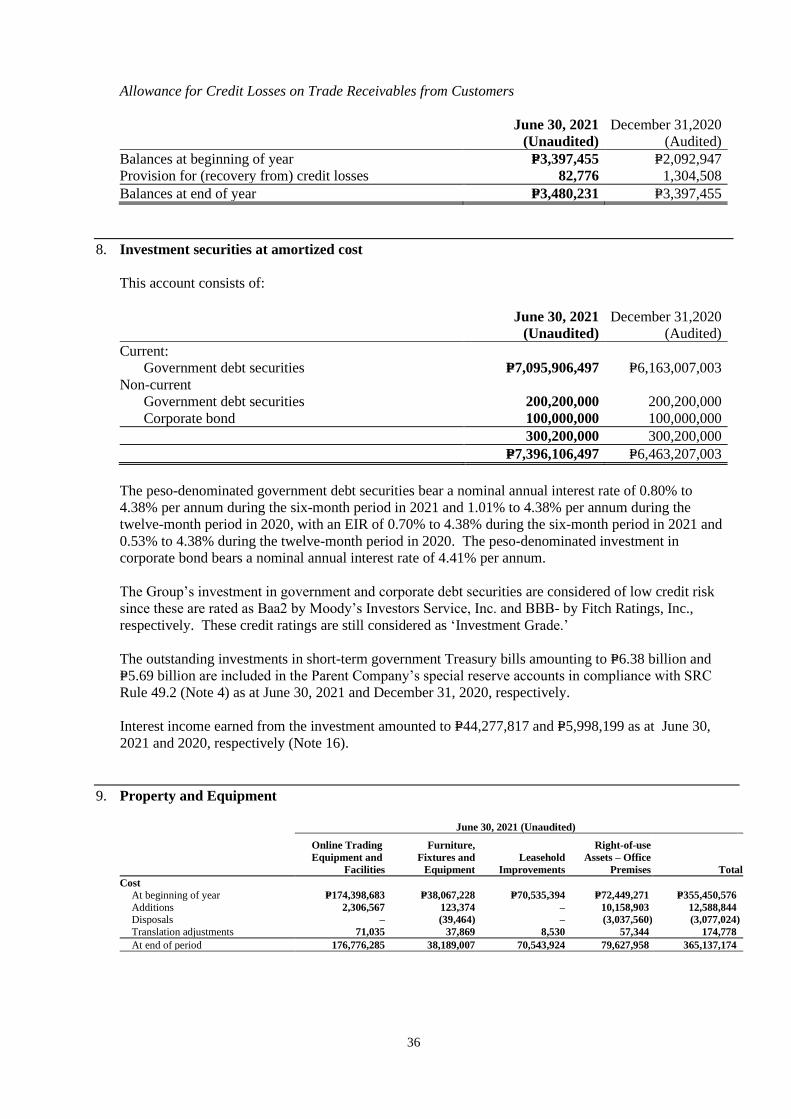
36
Allowance for Credit Losses on Trade Receivables from Customers
June 30, 2021
(Unaudited)
December 31,2020
(Audited)
Balances at beginning of year P=3,397,455 P=2,092,947
Provision for (recovery from) credit losses 82,776 1,304,508
Balances at end of year P=3,480,231 P=3,397,455
8. Investment securities at amortized cost
This account consists of:
June 30, 2021
(Unaudited)
December 31,2020
(Audited)
Current:
Government debt securities P=7,095,906,497 P=6,163,007,003
Non-current
Government debt securities 200,200,000 200,200,000
Corporate bond 100,000,000 100,000,000
300,200,000 300,200,000
P=7,396,106,497 P=6,463,207,003
The peso-denominated government debt securities bear a nominal annual interest rate of 0.80% to
4.38% per annum during the six-month period in 2021 and 1.01% to 4.38% per annum during the
twelve-month period in 2020, with an EIR of 0.70% to 4.38% during the six-month period in 2021 and
0.53% to 4.38% during the twelve-month period in 2020. The peso-denominated investment in
corporate bond bears a nominal annual interest rate of 4.41% per annum.
The Group’s investment in government and corporate debt securities are considered of low credit risk
since these are rated as Baa2 by Moody’s Investors Service, Inc. and BBB- by Fitch Ratings, Inc.,
respectively. These credit ratings are still considered as ‘Investment Grade.’
The outstanding investments in short-term government Treasury bills amounting to P=6.38 billion and
P=5.69 billion are included in the Parent Company’s special reserve accounts in compliance with SRC
Rule 49.2 (Note 4) as at June 30, 2021 and December 31, 2020, respectively.
Interest income earned from the investment amounted to P=44,277,817 and P=5,998,199 as at June 30,
2021 and 2020, respectively (Note 16).
9. Property and Equipment
June 30, 2021 (Unaudited)
Online Trading
Equipment and
Facilities
Furniture,
Fixtures and
Equipment
Leasehold
Improvements
Right-of-use
Assets – Office
Premises Total
Cost
At beginning of year P=174,398,683 P=38,067,228 P=70,535,394 P=72,449,271 P=355,450,576
Additions 2,306,567 123,374 – 10,158,903 12,588,844
Disposals – (39,464) – (3,037,560) (3,077,024)
Translation adjustments 71,035 37,869 8,530 57,344 174,778
At end of period 176,776,285 38,189,007 70,543,924 79,627,958 365,137,174
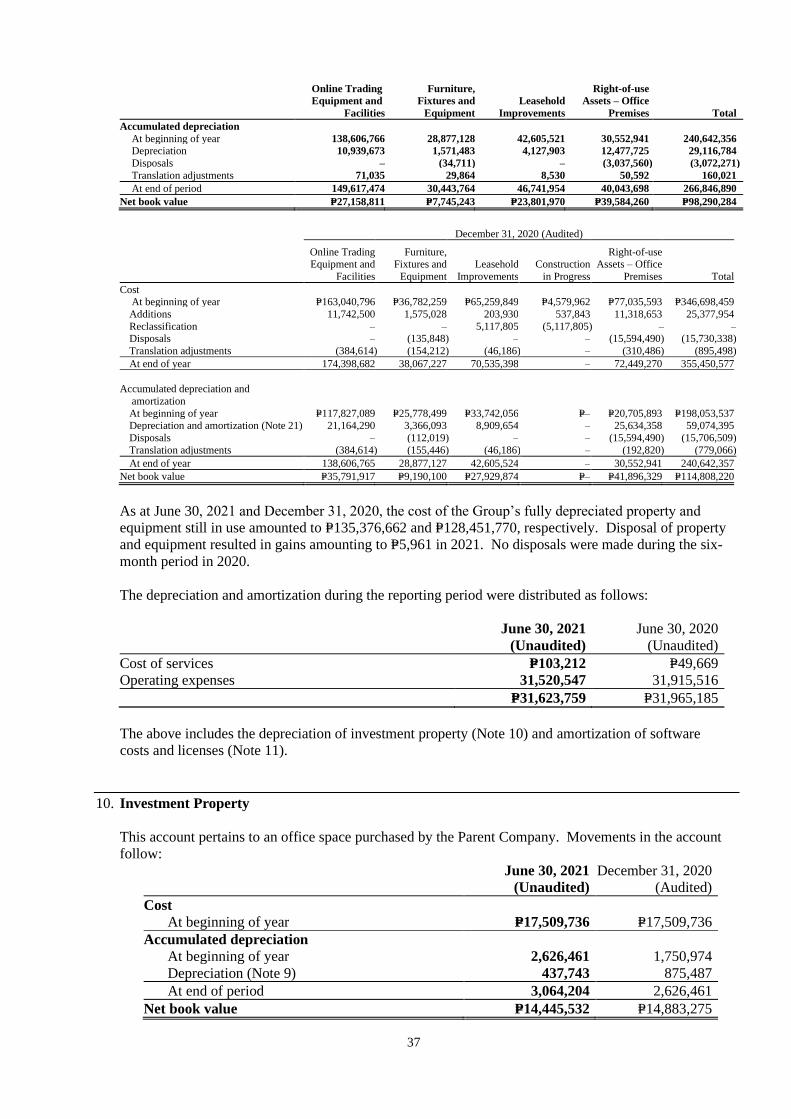
37
Online Trading
Equipment and
Facilities
Furniture,
Fixtures and
Equipment
Leasehold
Improvements
Right-of-use
Assets – Office
Premises Total
Accumulated depreciation
At beginning of year 138,606,766 28,877,128 42,605,521 30,552,941 240,642,356
Depreciation 10,939,673 1,571,483 4,127,903 12,477,725 29,116,784
Disposals – (34,711) – (3,037,560) (3,072,271)
Translation adjustments 71,035 29,864 8,530 50,592 160,021
At end of period 149,617,474 30,443,764 46,741,954 40,043,698 266,846,890
Net book value P=27,158,811 P=7,745,243 P=23,801,970 P=39,584,260 P=98,290,284
December 31, 2020 (Audited)
Online Trading Equipment and
Facilities
Furniture, Fixtures and
Equipment
Leasehold
Improvements
Construction
in Progress
Right-of-use Assets – Office
Premises Total
Cost At beginning of year P=163,040,796 P=36,782,259 P=65,259,849 P=4,579,962 P=77,035,593 P=346,698,459
Additions 11,742,500 1,575,028 203,930 537,843 11,318,653 25,377,954
Reclassification – – 5,117,805 (5,117,805) – – Disposals – (135,848) – – (15,594,490) (15,730,338)
Translation adjustments (384,614) (154,212) (46,186) – (310,486) (895,498)
At end of year 174,398,682 38,067,227 70,535,398 – 72,449,270 355,450,577
Accumulated depreciation and
amortization
At beginning of year P=117,827,089 P=25,778,499 P=33,742,056 P=– P=20,705,893 P=198,053,537 Depreciation and amortization (Note 21) 21,164,290 3,366,093 8,909,654 – 25,634,358 59,074,395
Disposals – (112,019) – – (15,594,490) (15,706,509)
Translation adjustments (384,614) (155,446) (46,186) – (192,820) (779,066)
At end of year 138,606,765 28,877,127 42,605,524 – 30,552,941 240,642,357
Net book value P=35,791,917 P=9,190,100 P=27,929,874 P=– P=41,896,329 P=114,808,220
As at June 30, 2021 and December 31, 2020, the cost of the Group’s fully depreciated property and
equipment still in use amounted to P=135,376,662 and P=128,451,770, respectively. Disposal of property
and equipment resulted in gains amounting to P=5,961 in 2021. No disposals were made during the six-
month period in 2020.
The depreciation and amortization during the reporting period were distributed as follows:
June 30, 2021
(Unaudited)
June 30, 2020
(Unaudited)
Cost of services P=103,212 P=49,669
Operating expenses 31,520,547 31,915,516
P=31,623,759 P=31,965,185
The above includes the depreciation of investment property (Note 10) and amortization of software
costs and licenses (Note 11).
10. Investment Property
This account pertains to an office space purchased by the Parent Company. Movements in the account
follow:
June 30, 2021
(Unaudited)
December 31, 2020
(Audited)
Cost
At beginning of year P=17,509,736 P=17,509,736
Accumulated depreciation
At beginning of year 2,626,461 1,750,974
Depreciation (Note 9) 437,743 875,487
At end of period 3,064,204 2,626,461
Net book value P=14,445,532 P=14,883,275
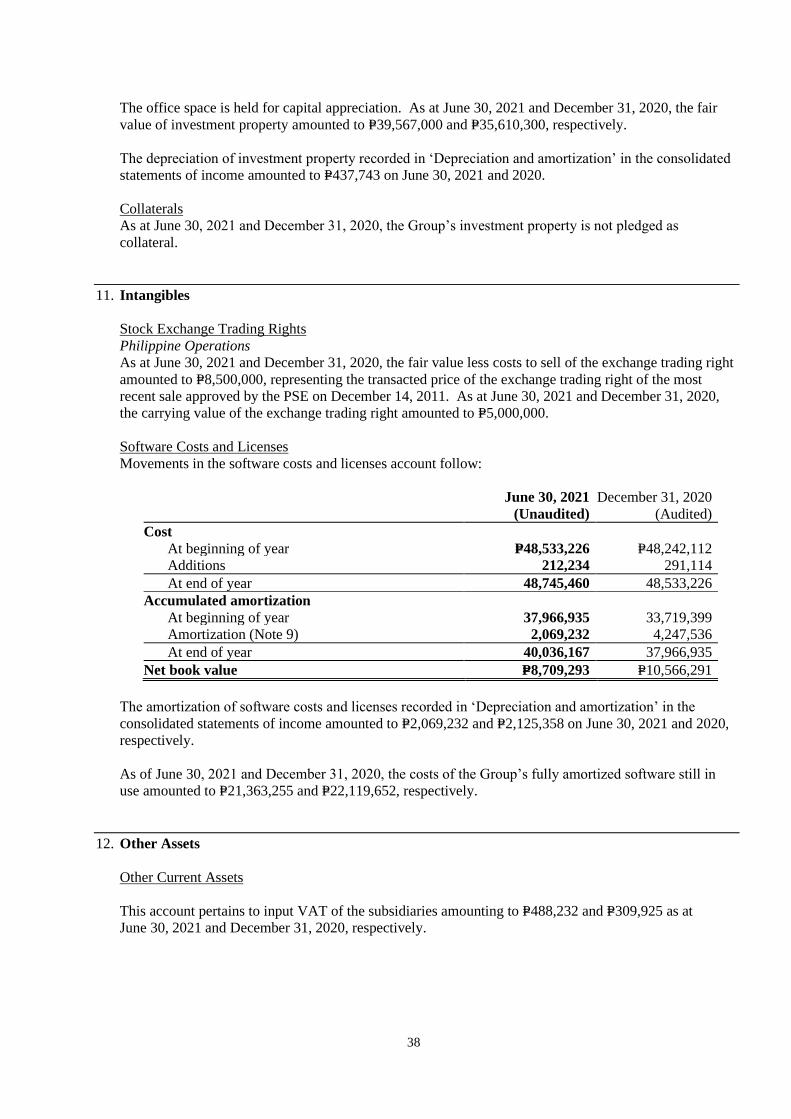
38
The office space is held for capital appreciation. As at June 30, 2021 and December 31, 2020, the fair
value of investment property amounted to P=39,567,000 and P=35,610,300, respectively.
The depreciation of investment property recorded in ‘Depreciation and amortization’ in the consolidated
statements of income amounted to P=437,743 on June 30, 2021 and 2020.
Collaterals
As at June 30, 2021 and December 31, 2020, the Group’s investment property is not pledged as
collateral.
11. Intangibles
Stock Exchange Trading Rights
Philippine Operations
As at June 30, 2021 and December 31, 2020, the fair value less costs to sell of the exchange trading right
amounted to P=8,500,000, representing the transacted price of the exchange trading right of the most
recent sale approved by the PSE on December 14, 2011. As at June 30, 2021 and December 31, 2020,
the carrying value of the exchange trading right amounted to P=5,000,000.
Software Costs and Licenses
Movements in the software costs and licenses account follow:
June 30, 2021
(Unaudited)
December 31, 2020
(Audited)
Cost
At beginning of year P=48,533,226 P=48,242,112
Additions 212,234 291,114
At end of year 48,745,460 48,533,226
Accumulated amortization
At beginning of year 37,966,935 33,719,399
Amortization (Note 9) 2,069,232 4,247,536
At end of year 40,036,167 37,966,935
Net book value P=8,709,293 P=10,566,291
The amortization of software costs and licenses recorded in ‘Depreciation and amortization’ in the
consolidated statements of income amounted to P=2,069,232 and P=2,125,358 on June 30, 2021 and 2020,
respectively.
As of June 30, 2021 and December 31, 2020, the costs of the Group’s fully amortized software still in
use amounted to P=21,363,255 and P=22,119,652, respectively.
12. Other Assets
Other Current Assets
This account pertains to input VAT of the subsidiaries amounting to P=488,232 and P=309,925 as at
June 30, 2021 and December 31, 2020, respectively.
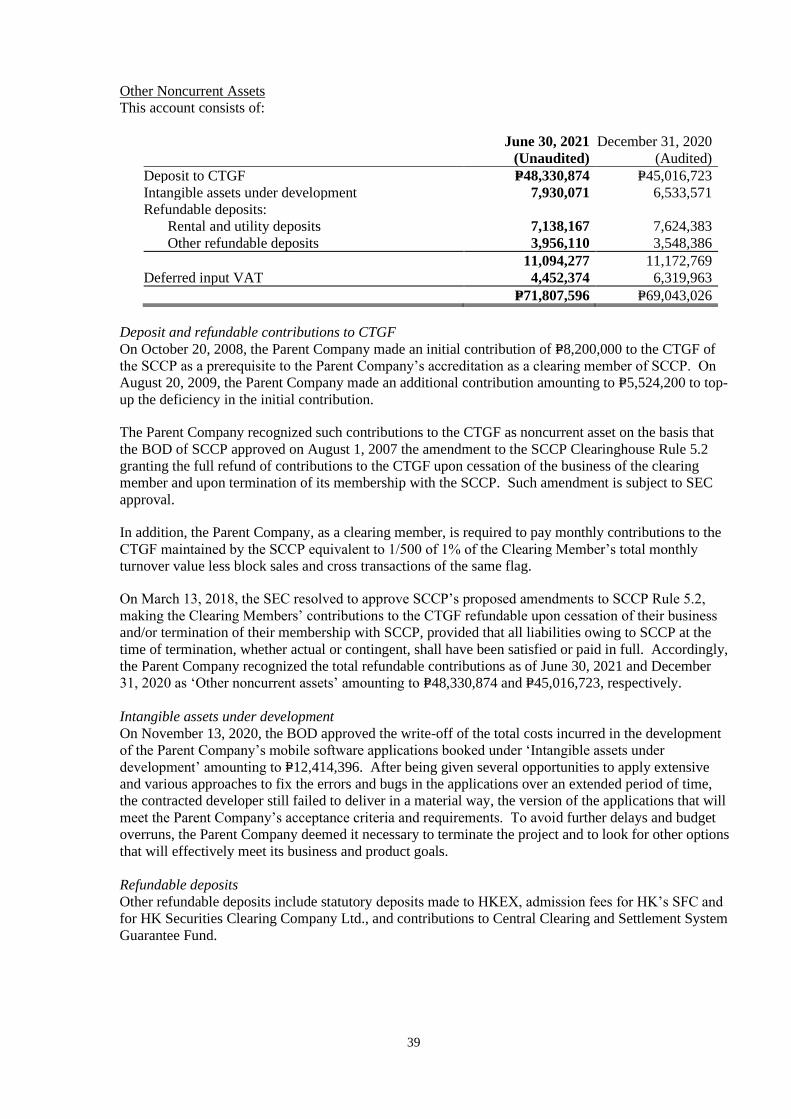
39
Other Noncurrent Assets
This account consists of:
June 30, 2021
(Unaudited)
December 31, 2020
(Audited)
Deposit to CTGF P=48,330,874 P=45,016,723
Intangible assets under development 7,930,071 6,533,571
Refundable deposits:
Rental and utility deposits 7,138,167 7,624,383
Other refundable deposits 3,956,110 3,548,386
11,094,277 11,172,769
Deferred input VAT 4,452,374 6,319,963
P=71,807,596 P=69,043,026
Deposit and refundable contributions to CTGF
On October 20, 2008, the Parent Company made an initial contribution of P=8,200,000 to the CTGF of
the SCCP as a prerequisite to the Parent Company’s accreditation as a clearing member of SCCP. On
August 20, 2009, the Parent Company made an additional contribution amounting to P=5,524,200 to top-
up the deficiency in the initial contribution.
The Parent Company recognized such contributions to the CTGF as noncurrent asset on the basis that
the BOD of SCCP approved on August 1, 2007 the amendment to the SCCP Clearinghouse Rule 5.2
granting the full refund of contributions to the CTGF upon cessation of the business of the clearing
member and upon termination of its membership with the SCCP. Such amendment is subject to SEC
approval.
In addition, the Parent Company, as a clearing member, is required to pay monthly contributions to the
CTGF maintained by the SCCP equivalent to 1/500 of 1% of the Clearing Member’s total monthly
turnover value less block sales and cross transactions of the same flag.
On March 13, 2018, the SEC resolved to approve SCCP’s proposed amendments to SCCP Rule 5.2,
making the Clearing Members’ contributions to the CTGF refundable upon cessation of their business
and/or termination of their membership with SCCP, provided that all liabilities owing to SCCP at the
time of termination, whether actual or contingent, shall have been satisfied or paid in full. Accordingly,
the Parent Company recognized the total refundable contributions as of June 30, 2021 and December
31, 2020 as ‘Other noncurrent assets’ amounting to P=48,330,874 and P=45,016,723, respectively.
Intangible assets under development
On November 13, 2020, the BOD approved the write-off of the total costs incurred in the development
of the Parent Company’s mobile software applications booked under ‘Intangible assets under
development’ amounting to P=12,414,396. After being given several opportunities to apply extensive
and various approaches to fix the errors and bugs in the applications over an extended period of time,
the contracted developer still failed to deliver in a material way, the version of the applications that will
meet the Parent Company’s acceptance criteria and requirements. To avoid further delays and budget
overruns, the Parent Company deemed it necessary to terminate the project and to look for other options
that will effectively meet its business and product goals.
Refundable deposits
Other refundable deposits include statutory deposits made to HKEX, admission fees for HK’s SFC and
for HK Securities Clearing Company Ltd., and contributions to Central Clearing and Settlement System
Guarantee Fund.
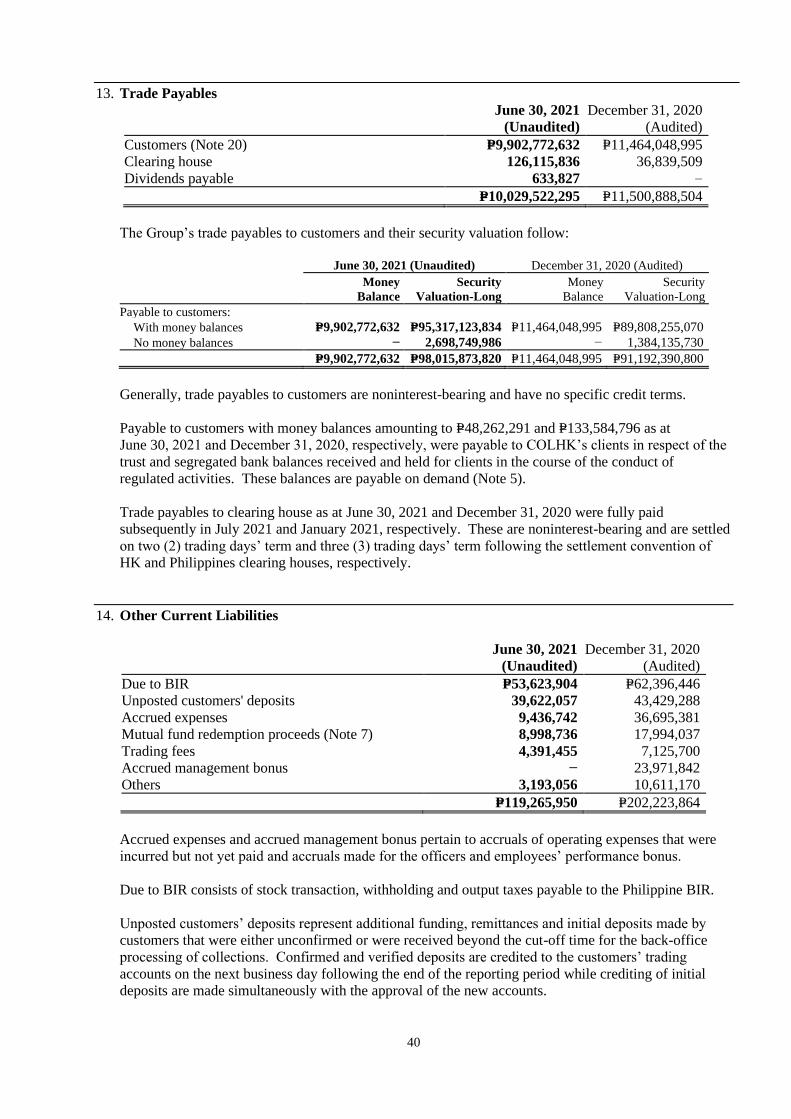
40
13. Trade Payables
June 30, 2021
(Unaudited)
December 31, 2020
(Audited)
Customers (Note 20) P=9,902,772,632 P=11,464,048,995
Clearing house 126,115,836 36,839,509
Dividends payable 633,827 −
P=10,029,522,295 P=11,500,888,504
The Group’s trade payables to customers and their security valuation follow:
June 30, 2021 (Unaudited) December 31, 2020 (Audited)
Money
Balance
Security
Valuation-Long
Money
Balance
Security
Valuation-Long
Payable to customers:
With money balances P=9,902,772,632 P=95,317,123,834 P=11,464,048,995 P=89,808,255,070
No money balances − 2,698,749,986 − 1,384,135,730
P=9,902,772,632 P=98,015,873,820 P=11,464,048,995 P=91,192,390,800
Generally, trade payables to customers are noninterest-bearing and have no specific credit terms.
Payable to customers with money balances amounting to P=48,262,291 and P=133,584,796 as at
June 30, 2021 and December 31, 2020, respectively, were payable to COLHK’s clients in respect of the
trust and segregated bank balances received and held for clients in the course of the conduct of
regulated activities. These balances are payable on demand (Note 5).
Trade payables to clearing house as at June 30, 2021 and December 31, 2020 were fully paid
subsequently in July 2021 and January 2021, respectively. These are noninterest-bearing and are settled
on two (2) trading days’ term and three (3) trading days’ term following the settlement convention of
HK and Philippines clearing houses, respectively.
14. Other Current Liabilities
June 30, 2021
(Unaudited)
December 31, 2020
(Audited)
Due to BIR P=53,623,904 P=62,396,446
Unposted customers' deposits 39,622,057 43,429,288
Accrued expenses 9,436,742 36,695,381
Mutual fund redemption proceeds (Note 7) 8,998,736 17,994,037
Trading fees 4,391,455 7,125,700
Accrued management bonus − 23,971,842
Others 3,193,056 10,611,170
P=119,265,950 P=202,223,864
Accrued expenses and accrued management bonus pertain to accruals of operating expenses that were
incurred but not yet paid and accruals made for the officers and employees’ performance bonus.
Due to BIR consists of stock transaction, withholding and output taxes payable to the Philippine BIR.
Unposted customers’ deposits represent additional funding, remittances and initial deposits made by
customers that were either unconfirmed or were received beyond the cut-off time for the back-office
processing of collections. Confirmed and verified deposits are credited to the customers’ trading
accounts on the next business day following the end of the reporting period while crediting of initial
deposits are made simultaneously with the approval of the new accounts.
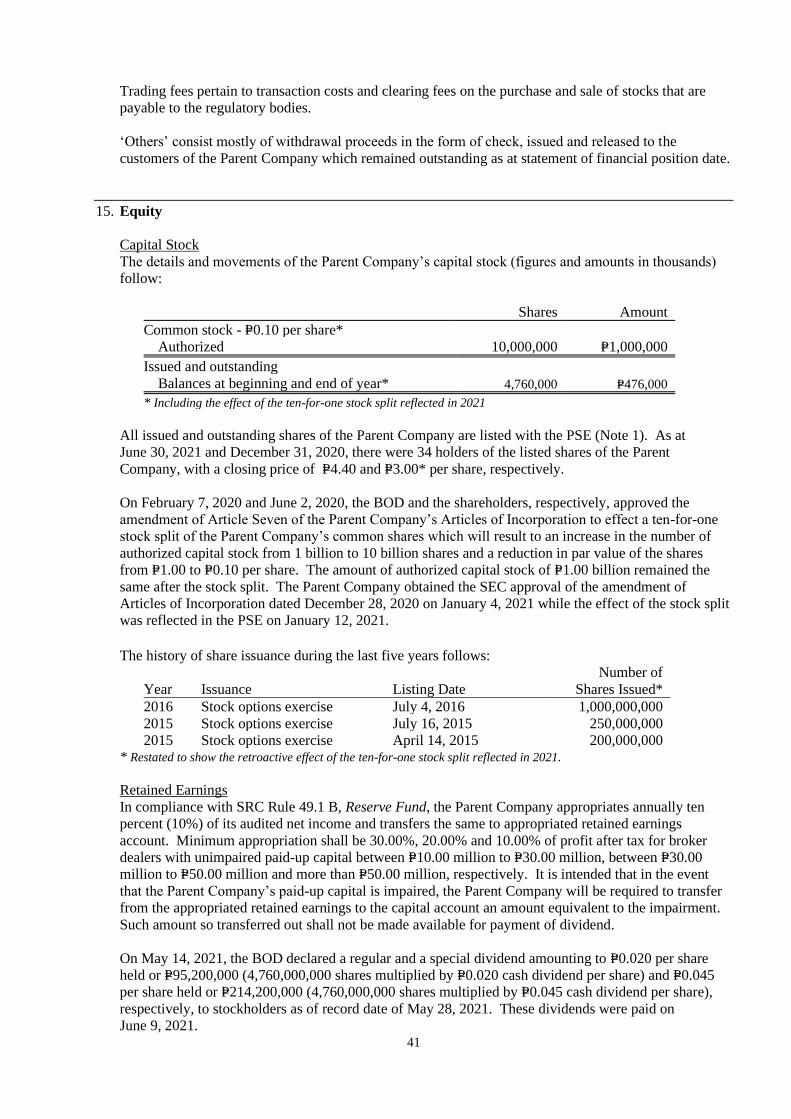
41
Trading fees pertain to transaction costs and clearing fees on the purchase and sale of stocks that are
payable to the regulatory bodies.
‘Others’ consist mostly of withdrawal proceeds in the form of check, issued and released to the
customers of the Parent Company which remained outstanding as at statement of financial position date.
15. Equity
Capital Stock
The details and movements of the Parent Company’s capital stock (figures and amounts in thousands)
follow:
Shares Amount
Common stock - P=0.10 per share*
Authorized 10,000,000 P=1,000,000
Issued and outstanding
Balances at beginning and end of year* 4,760,000 P=476,000
* Including the effect of the ten-for-one stock split reflected in 2021
All issued and outstanding shares of the Parent Company are listed with the PSE (Note 1). As at
June 30, 2021 and December 31, 2020, there were 34 holders of the listed shares of the Parent
Company, with a closing price of P=4.40 and P=3.00* per share, respectively.
On February 7, 2020 and June 2, 2020, the BOD and the shareholders, respectively, approved the
amendment of Article Seven of the Parent Company’s Articles of Incorporation to effect a ten-for-one
stock split of the Parent Company’s common shares which will result to an increase in the number of
authorized capital stock from 1 billion to 10 billion shares and a reduction in par value of the shares
from P=1.00 to P=0.10 per share. The amount of authorized capital stock of P=1.00 billion remained the
same after the stock split. The Parent Company obtained the SEC approval of the amendment of
Articles of Incorporation dated December 28, 2020 on January 4, 2021 while the effect of the stock split
was reflected in the PSE on January 12, 2021.
The history of share issuance during the last five years follows:
Year Issuance Listing Date
Number of
Shares Issued*
2016 Stock options exercise July 4, 2016 1,000,000,000
2015 Stock options exercise July 16, 2015 250,000,000
2015 Stock options exercise April 14, 2015 200,000,000 * Restated to show the retroactive effect of the ten-for-one stock split reflected in 2021.
Retained Earnings
In compliance with SRC Rule 49.1 B, Reserve Fund, the Parent Company appropriates annually ten
percent (10%) of its audited net income and transfers the same to appropriated retained earnings
account. Minimum appropriation shall be 30.00%, 20.00% and 10.00% of profit after tax for broker
dealers with unimpaired paid-up capital between P=10.00 million to P=30.00 million, between P=30.00
million to P=50.00 million and more than P=50.00 million, respectively. It is intended that in the event
that the Parent Company’s paid-up capital is impaired, the Parent Company will be required to transfer
from the appropriated retained earnings to the capital account an amount equivalent to the impairment.
Such amount so transferred out shall not be made available for payment of dividend.
On May 14, 2021, the BOD declared a regular and a special dividend amounting to P=0.020 per share
held or P=95,200,000 (4,760,000,000 shares multiplied by P=0.020 cash dividend per share) and P=0.045
per share held or P=214,200,000 (4,760,000,000 shares multiplied by P=0.045 cash dividend per share),
respectively, to stockholders as of record date of May 28, 2021. These dividends were paid on
June 9, 2021.

42
On April 3, 2020, the BOD declared a regular and a special dividend amounting to P=0.180 per share held or P=85,680,000 (476,000,000 shares multiplied by P=0.180 cash dividend per share) and P=0.520 per share held or P=247,520,000 (476,000,000 shares multiplied by P=0.520 cash dividend per share), respectively, to stockholders as of record date of April 30, 2020. These dividends were paid on May 27, 2020. As of June 30, 2021 and December 31, 2020, the consolidated retained earnings includes the retained earnings of COLHK amounting to P=122,661,314 and P=133,047,343, respectively, which are not available for dividend declaration.
Non-Controlling Interest
The Parent Company formed CMI in 2019 and as of June 30, 2021 and December 31, 2020, 30.00% of
its equity interest is being held by non-controlling interest.
The summarized financial information of CMI is provided below. This information is based on
amounts before inter-company eliminations.
Summarized statements of financial position as of June 30, 2021 (Unaudited) and December 31, 2020
(Audited)
2021 2020
Cash and cash equivalents (current) P=1,226,775 P=53,995,047
Financial assets at FVTPL (current) 59,468,881 9,983,570
Other receivables (current) 172,931 40,380
Other assets (current) 420,072 304,408
Property and equipment (non-current) 3,856,661 4,491,506
Other assets (non-current) 42,877 86,860
Accrued expenses (current) (205,246) (439,894)
Other liabilities (current) (19,429) (173,463)
Lease liability (current) (687,776) (654,256)
Lease liability (non-current) (624,465) (975,437)
Total equity P=63,651,281 P=66,658,721
Attributable to:
Equity holders of the Parent Company P=44,555,896 P=46,661,105
Non-controlling interest 19,095,385 19,997,616
Summarized statements of income for the six months ended June 30, 2021 and 2020 (Unaudited)
2021 2020
Interest income P=361,296 P=914,003
Trading gains - net 140,776 –
Other losses (35,624) –
Pre-operating expenses (3,393,611) (3,227,047)
Loss before income tax (2,927,163) (2,313,044)
Provision for income tax 80,279 182,801
Net loss (P=3,007,442) (P=2,495,845)
Attributable to:
Equity holders of the Parent Company (P=2,105,211) (P=1,747,091)
Non-controlling interest (902,231) (748,754)
Summarized cash flow information for the six months ended June 30, 2021 and 2020 (Unaudited)
2021 2020
Operating activities (P=52,290,602) (P=2,589,954)
Investing activities (124,594) –
Financing activities (353,076) –
Net decrease in cash and cash equivalents (P=52,768,272) (P=2,589,954)
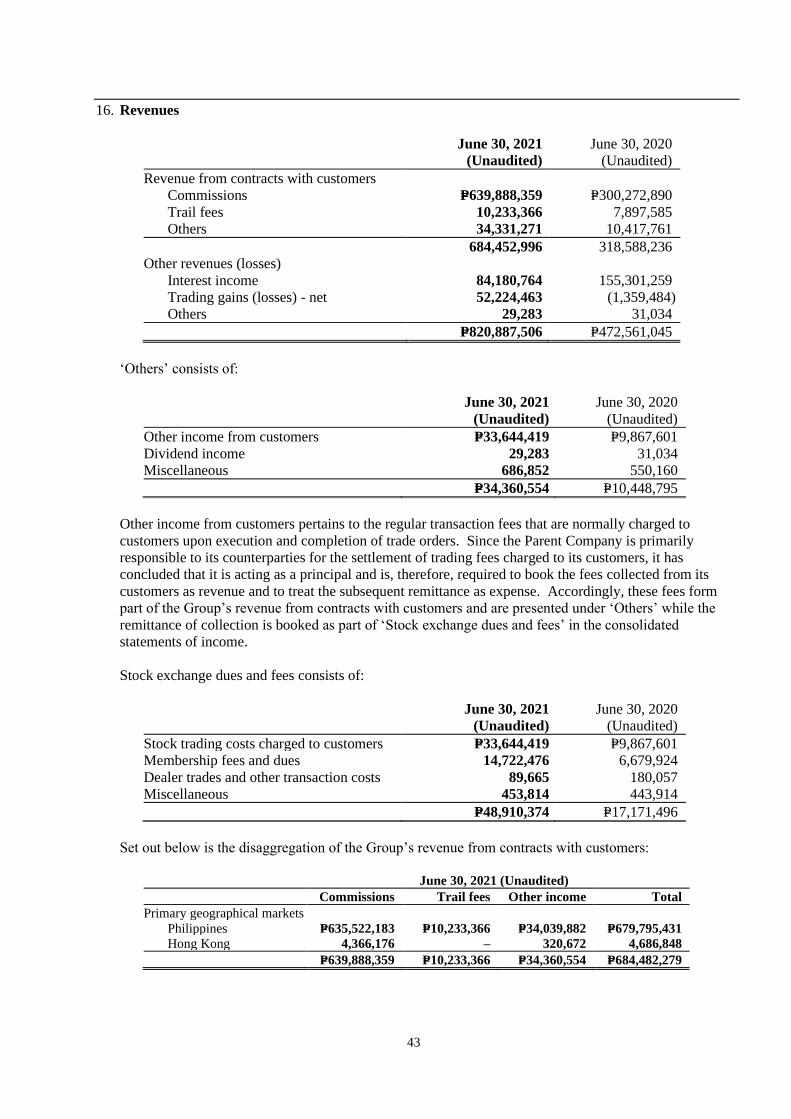
43
16. Revenues
June 30, 2021
(Unaudited)
June 30, 2020
(Unaudited)
Revenue from contracts with customers
Commissions P=639,888,359 P=300,272,890
Trail fees 10,233,366 7,897,585
Others 34,331,271 10,417,761
684,452,996 318,588,236
Other revenues (losses)
Interest income 84,180,764 155,301,259
Trading gains (losses) - net 52,224,463 (1,359,484)
Others 29,283 31,034
P=820,887,506 P=472,561,045
‘Others’ consists of:
June 30, 2021
(Unaudited)
June 30, 2020
(Unaudited)
Other income from customers P=33,644,419 P=9,867,601
Dividend income 29,283 31,034
Miscellaneous 686,852 550,160
P=34,360,554 P=10,448,795
Other income from customers pertains to the regular transaction fees that are normally charged to
customers upon execution and completion of trade orders. Since the Parent Company is primarily
responsible to its counterparties for the settlement of trading fees charged to its customers, it has
concluded that it is acting as a principal and is, therefore, required to book the fees collected from its
customers as revenue and to treat the subsequent remittance as expense. Accordingly, these fees form
part of the Group’s revenue from contracts with customers and are presented under ‘Others’ while the
remittance of collection is booked as part of ‘Stock exchange dues and fees’ in the consolidated
statements of income.
Stock exchange dues and fees consists of:
June 30, 2021
(Unaudited)
June 30, 2020
(Unaudited)
Stock trading costs charged to customers P=33,644,419 P=9,867,601
Membership fees and dues 14,722,476 6,679,924
Dealer trades and other transaction costs 89,665 180,057
Miscellaneous 453,814 443,914
P=48,910,374 P=17,171,496
Set out below is the disaggregation of the Group’s revenue from contracts with customers:
June 30, 2021 (Unaudited)
Commissions Trail fees Other income Total
Primary geographical markets
Philippines P=635,522,183 P=10,233,366 P=34,039,882 P=679,795,431
Hong Kong 4,366,176 – 320,672 4,686,848
P=639,888,359 P=10,233,366 P=34,360,554 P=684,482,279
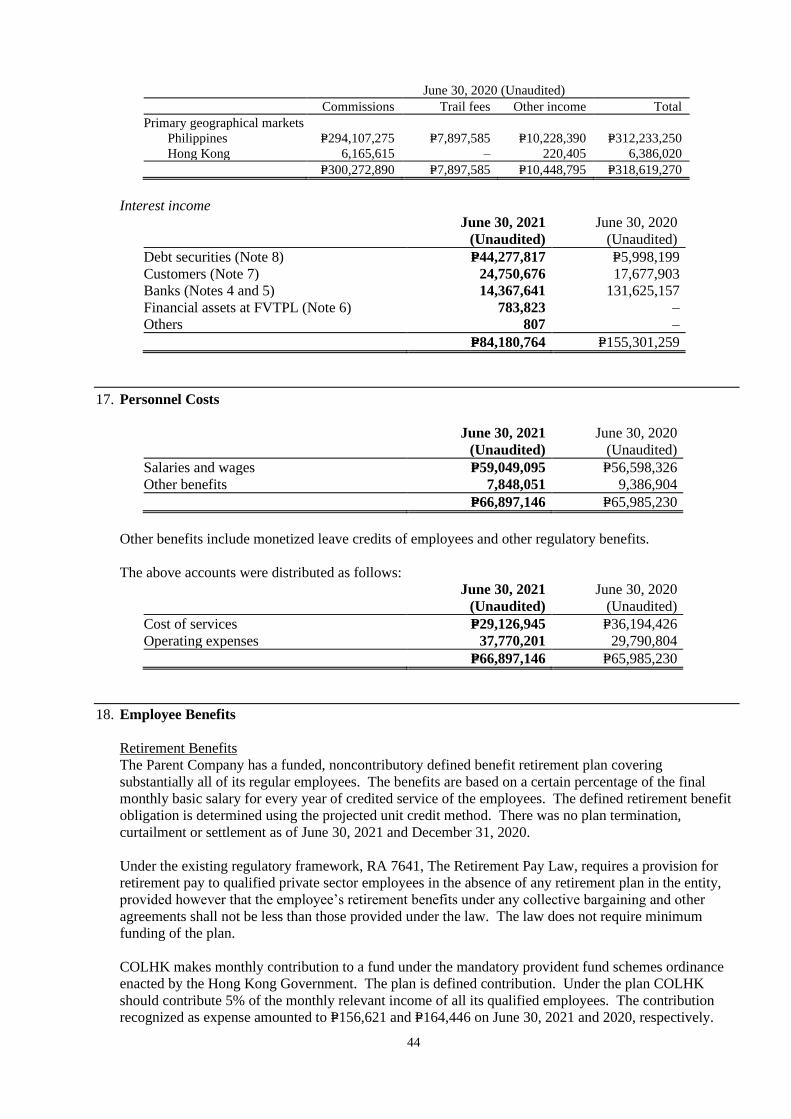
44
June 30, 2020 (Unaudited)
Commissions Trail fees Other income Total
Primary geographical markets
Philippines P=294,107,275 P=7,897,585 P=10,228,390 P=312,233,250
Hong Kong 6,165,615 – 220,405 6,386,020
P=300,272,890 P=7,897,585 P=10,448,795 P=318,619,270
Interest income
June 30, 2021
(Unaudited)
June 30, 2020
(Unaudited)
Debt securities (Note 8) P=44,277,817 P=5,998,199
Customers (Note 7) 24,750,676 17,677,903
Banks (Notes 4 and 5) 14,367,641 131,625,157
Financial assets at FVTPL (Note 6) 783,823 –
Others 807 –
P=84,180,764 P=155,301,259
17. Personnel Costs
June 30, 2021
(Unaudited)
June 30, 2020
(Unaudited)
Salaries and wages P=59,049,095 P=56,598,326
Other benefits 7,848,051 9,386,904
P=66,897,146 P=65,985,230
Other benefits include monetized leave credits of employees and other regulatory benefits.
The above accounts were distributed as follows:
June 30, 2021
(Unaudited)
June 30, 2020
(Unaudited)
Cost of services P=29,126,945 P=36,194,426
Operating expenses 37,770,201 29,790,804
P=66,897,146 P=65,985,230
18. Employee Benefits
Retirement Benefits
The Parent Company has a funded, noncontributory defined benefit retirement plan covering
substantially all of its regular employees. The benefits are based on a certain percentage of the final
monthly basic salary for every year of credited service of the employees. The defined retirement benefit
obligation is determined using the projected unit credit method. There was no plan termination,
curtailment or settlement as of June 30, 2021 and December 31, 2020.
Under the existing regulatory framework, RA 7641, The Retirement Pay Law, requires a provision for
retirement pay to qualified private sector employees in the absence of any retirement plan in the entity,
provided however that the employee’s retirement benefits under any collective bargaining and other
agreements shall not be less than those provided under the law. The law does not require minimum
funding of the plan.
COLHK makes monthly contribution to a fund under the mandatory provident fund schemes ordinance
enacted by the Hong Kong Government. The plan is defined contribution. Under the plan COLHK
should contribute 5% of the monthly relevant income of all its qualified employees. The contribution
recognized as expense amounted to P=156,621 and P=164,446 on June 30, 2021 and 2020, respectively.

45
19. Income Taxes
Current Income Taxes
The breakdown of provision for current income tax is as follows:
June 30, 2021
(Unaudited)
June 30, 2020
(Unaudited)
Regular corporate income tax P=86,898,677 P=44,885,900
Final income tax 12,636,518 27,551,548
P=99,535,195 P=72,437,448
Deferred Income Taxes
The components of the Group’s net deferred tax assets follow:
June 30, 2021
(Unaudited)
December 31, 2020
(Audited)
Retirement obligation P=17,268,792 P=20,722,551
Unamortized past service cost 3,384,939 4,683,871
Accumulated translation adjustment (2,193,585) (1,860,193)
Unrealized trading gains (203,914) (221,926)
Property valuation (111,949) (110,882)
Leases under PFRS 16 22,165 750,949
Allowance for credit losses – 1,019,237
Unrealized foreign exchange losses – 6,232
P=18,166,448 P=24,989,839
Realization of the future tax benefits related to the net deferred tax assets is dependent on many factors,
including the Group’s ability to generate taxable income, within the carry-over period. The deferred tax
asset on property valuation pertains to the temporary difference between the net book value and tax
residual value of COLHK’s property and equipment.
The Group did not recognize deferred tax assets on the following temporary differences since
Management believes that it is not probable that the related benefits will be realized in the future:
June 30, 2021
(Unaudited)
December 31, 2020
(Audited)
Unused tax losses* P=252,000,901 P=252,000,901
NOLCO* 11,848,381 11,848,381
Leases under PFRS 16 2,677,321 –
Allowance for credit losses 3,480,231 –
Unrealized trading losses (383,455) 49,290
Unrealized foreign exchange losses 14,841 –
P=269,638,220 P=263,898,572
* To be quantified at year-end
The unused tax losses pertains to COLHK which can be carried forward indefinitely to offset future
profits.
In 2021, the Parent Company used the optional standard deduction (OSD) method in calculating the
allowed deductions for income tax purposes, while in 2020, the Parent Company availed of the itemized
deduction method.
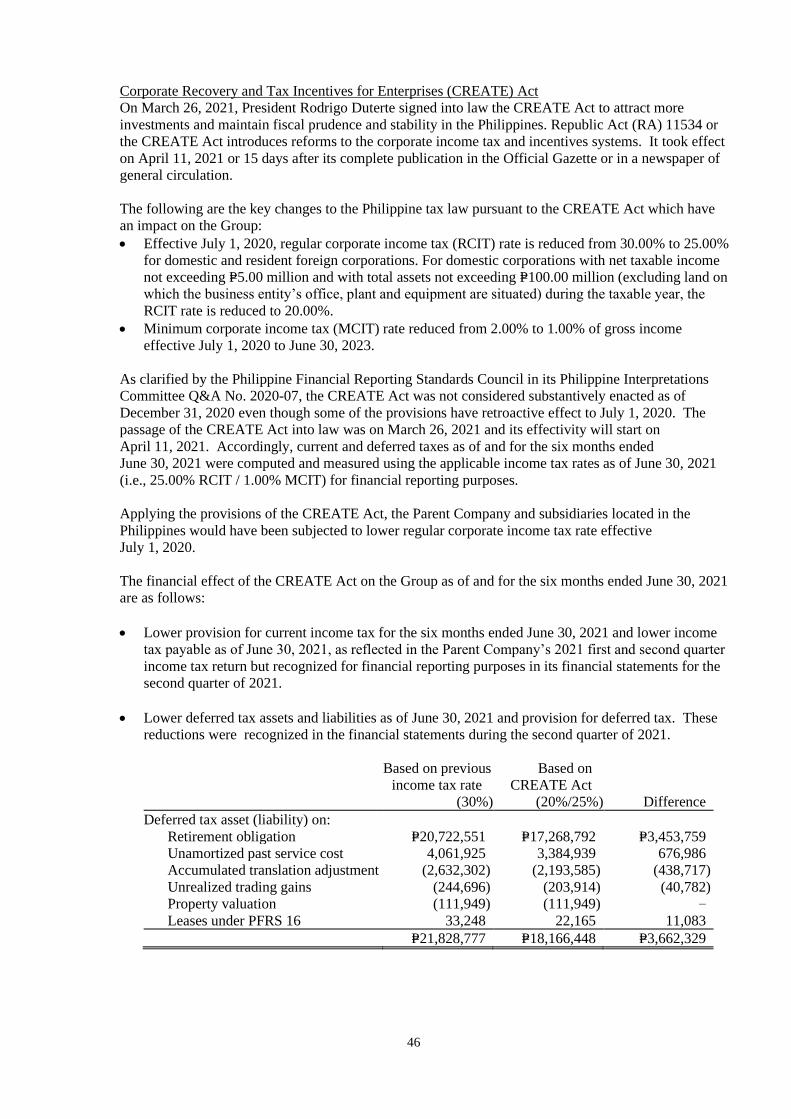
46
Corporate Recovery and Tax Incentives for Enterprises (CREATE) Act
On March 26, 2021, President Rodrigo Duterte signed into law the CREATE Act to attract more
investments and maintain fiscal prudence and stability in the Philippines. Republic Act (RA) 11534 or
the CREATE Act introduces reforms to the corporate income tax and incentives systems. It took effect
on April 11, 2021 or 15 days after its complete publication in the Official Gazette or in a newspaper of
general circulation.
The following are the key changes to the Philippine tax law pursuant to the CREATE Act which have
an impact on the Group:
• Effective July 1, 2020, regular corporate income tax (RCIT) rate is reduced from 30.00% to 25.00%
for domestic and resident foreign corporations. For domestic corporations with net taxable income
not exceeding P=5.00 million and with total assets not exceeding P=100.00 million (excluding land on
which the business entity’s office, plant and equipment are situated) during the taxable year, the
RCIT rate is reduced to 20.00%.
• Minimum corporate income tax (MCIT) rate reduced from 2.00% to 1.00% of gross income
effective July 1, 2020 to June 30, 2023.
As clarified by the Philippine Financial Reporting Standards Council in its Philippine Interpretations
Committee Q&A No. 2020-07, the CREATE Act was not considered substantively enacted as of
December 31, 2020 even though some of the provisions have retroactive effect to July 1, 2020. The
passage of the CREATE Act into law was on March 26, 2021 and its effectivity will start on
April 11, 2021. Accordingly, current and deferred taxes as of and for the six months ended
June 30, 2021 were computed and measured using the applicable income tax rates as of June 30, 2021
(i.e., 25.00% RCIT / 1.00% MCIT) for financial reporting purposes.
Applying the provisions of the CREATE Act, the Parent Company and subsidiaries located in the
Philippines would have been subjected to lower regular corporate income tax rate effective
July 1, 2020.
The financial effect of the CREATE Act on the Group as of and for the six months ended June 30, 2021
are as follows:
• Lower provision for current income tax for the six months ended June 30, 2021 and lower income
tax payable as of June 30, 2021, as reflected in the Parent Company’s 2021 first and second quarter
income tax return but recognized for financial reporting purposes in its financial statements for the
second quarter of 2021.
• Lower deferred tax assets and liabilities as of June 30, 2021 and provision for deferred tax. These
reductions were recognized in the financial statements during the second quarter of 2021.
Based on previous
income tax rate
(30%)
Based on
CREATE Act
(20%/25%) Difference
Deferred tax asset (liability) on:
Retirement obligation P=20,722,551 P=17,268,792 P=3,453,759
Unamortized past service cost 4,061,925 3,384,939 676,986
Accumulated translation adjustment (2,632,302) (2,193,585) (438,717)
Unrealized trading gains (244,696) (203,914) (40,782)
Property valuation (111,949) (111,949) –
Leases under PFRS 16 33,248 22,165 11,083
P=21,828,777 P=18,166,448 P=3,662,329
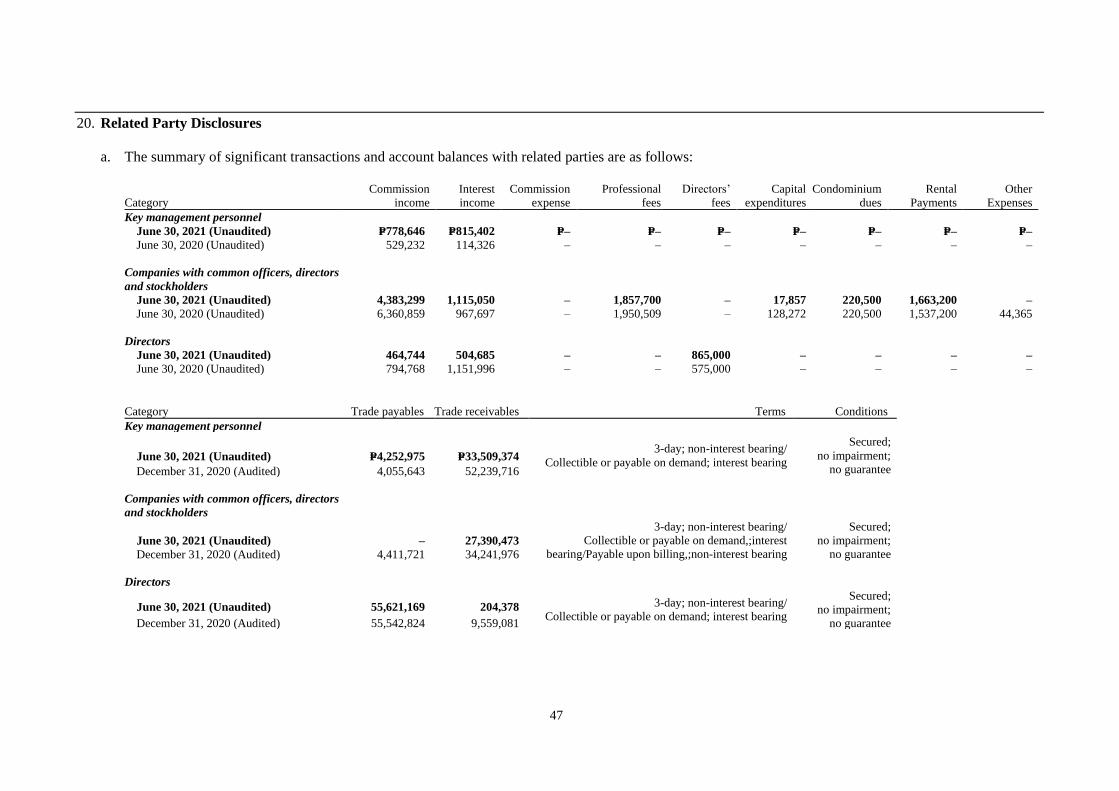
47
20. Related Party Disclosures
a. The summary of significant transactions and account balances with related parties are as follows:
Category
Commission
income
Interest
income
Commission
expense
Professional
fees
Directors’
fees
Capital
expenditures
Condominium
dues
Rental
Payments
Other
Expenses
Key management personnel
June 30, 2021 (Unaudited) P=778,646 P=815,402 P=– P=– P=– P=– P=– P=– P=–
June 30, 2020 (Unaudited) 529,232 114,326 – – – – – – –
Companies with common officers, directors
and stockholders
June 30, 2021 (Unaudited) 4,383,299 1,115,050 – 1,857,700 – 17,857 220,500 1,663,200 –
June 30, 2020 (Unaudited) 6,360,859 967,697 – 1,950,509 – 128,272 220,500 1,537,200 44,365
Directors
June 30, 2021 (Unaudited) 464,744 504,685 – – 865,000 – – – –
June 30, 2020 (Unaudited) 794,768 1,151,996 – – 575,000 – – – –
Category Trade payables Trade receivables Terms Conditions
Key management personnel
June 30, 2021 (Unaudited) P=4,252,975 P=33,509,374 3-day; non-interest bearing/
Collectible or payable on demand; interest bearing
Secured;
no impairment;
no guarantee December 31, 2020 (Audited) 4,055,643 52,239,716
Companies with common officers, directors
and stockholders
June 30, 2021 (Unaudited) – 27,390,473
3-day; non-interest bearing/
Collectible or payable on demand,;interest
bearing/Payable upon billing,;non-interest bearing
Secured;
no impairment;
no guarantee December 31, 2020 (Audited) 4,411,721 34,241,976
Directors
June 30, 2021 (Unaudited) 55,621,169 204,378 3-day; non-interest bearing/
Collectible or payable on demand; interest bearing
Secured;
no impairment;
no guarantee December 31, 2020 (Audited) 55,542,824 9,559,081

48
a. Trade receivables from and payables to related parties are due to be settled in three (3) trading days
in the Philippines and two (2) trading days in HK, except for trade receivables under margin
accounts. Trade receivables from related parties under margin accounts are interest-bearing, not
guaranteed, and secured by shares of stocks (except for trade receivables amounting to P=590 and
P=106, which were unsecured as of June 30, 2021 and December 31, 2020 (Note 7). The trade
receivables from related parties are not impaired.
b. As of June 30, 2021 and December 31, 2020, the Group also has unsecured noninterest-bearing
advances to its officers and employees amounting to P=400,826 and P=1,011,936 with terms ranging
from six months to one year, which are included under ‘Other receivables’ (Note 7).
c. Compensation of key management personnel of the Group follows:
June 30, 2021
(Unaudited)
June 30, 2020
(Unaudited)
Short-term employee benefits P=25,242,595 P=20,714,907
Retirement costs 55,936 29,365
Other benefits 447,489 469,845
P=25,746,020 P=21,214,117
21. Leases
The Group leases its office premises under separate operating lease agreements expiring on various
dates and whose lease terms are negotiated every one (1) to three (3) years. Rental costs charged to
operations amounted to P=99,648 and P=161,663 on June 30, 2021 and 2020, respectively.
The Group applied a single recognition and measurement approach for all leases. Set-out below are the
carrying amount of lease liabilities and the movements during the period:
June 30, 2021
(Unaudited)
December 31, 2020
(Audited)
At beginning of period, as restated P=44,129,430 P=57,222,118
Additions 10,158,903 11,318,653
Accretion of interest 1,239,677 3,104,194
Payments (13,462,979) (26,752,450)
Rent concessions – (565,113)
Translation adjustment 14,195 (197,972)
P=42,079,226 P=44,129,430
Current P=20,856,848 P=18,737,554
Non-current 21,222,378 25,391,876
P=42,079,226 P=44,129,430
COVID-19 Related Rent Concessions
The Group has adopted the practical expedient issued by the Philippine Accounting Standards Board
whereby it has not accounted for rent concessions which are a direct consequence of the COVID-19
pandemic as lease modifications. Instead, the Group recognized these concessions in the statement of
comprehensive income for the year ended December 31, 2020.
The practical expedient may be applied where the following conditions apply:
• The changed lease payments were substantially the same or less than the payments prior to the
rent concession;
• The reductions only affect payments which fall due before June 30, 2021; and
• There has been no substantive change in the terms and conditions of the lease.
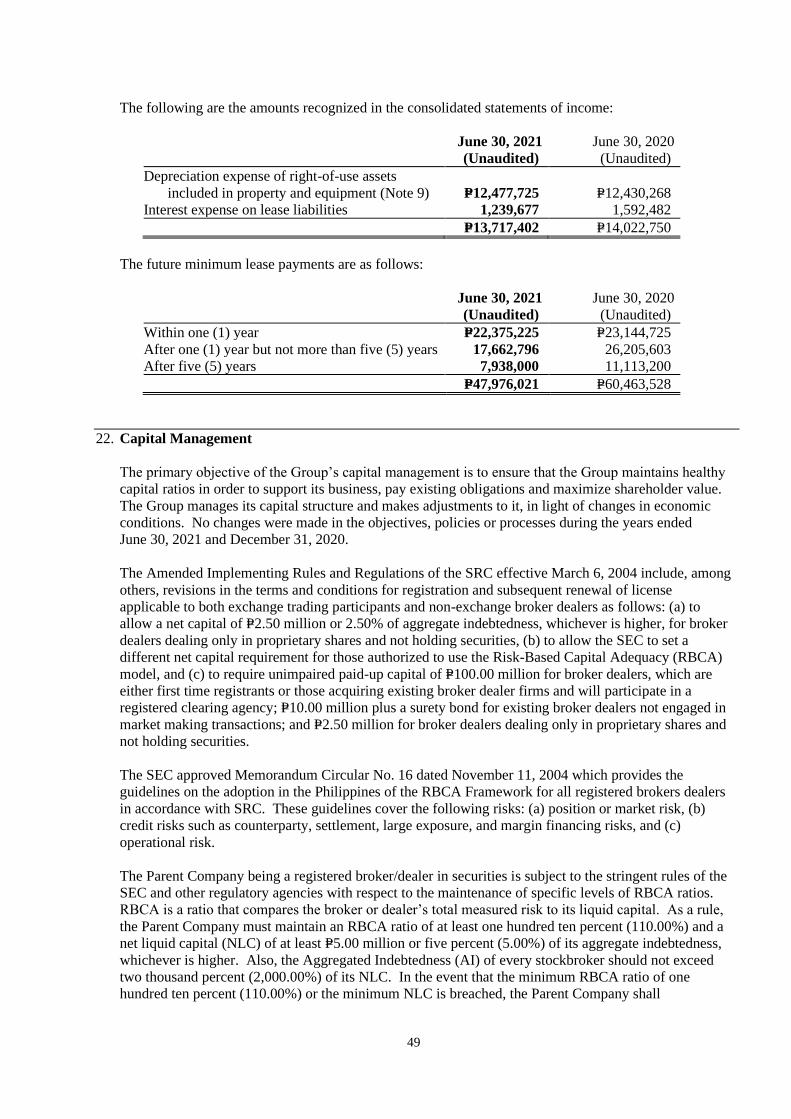
49
The following are the amounts recognized in the consolidated statements of income:
June 30, 2021
(Unaudited)
June 30, 2020
(Unaudited)
Depreciation expense of right-of-use assets
included in property and equipment (Note 9) P=12,477,725 P=12,430,268
Interest expense on lease liabilities 1,239,677 1,592,482
P=13,717,402 P=14,022,750
The future minimum lease payments are as follows:
June 30, 2021
(Unaudited)
June 30, 2020
(Unaudited)
Within one (1) year P=22,375,225 P=23,144,725
After one (1) year but not more than five (5) years 17,662,796 26,205,603
After five (5) years 7,938,000 11,113,200
P=47,976,021 P=60,463,528
22. Capital Management
The primary objective of the Group’s capital management is to ensure that the Group maintains healthy
capital ratios in order to support its business, pay existing obligations and maximize shareholder value.
The Group manages its capital structure and makes adjustments to it, in light of changes in economic
conditions. No changes were made in the objectives, policies or processes during the years ended
June 30, 2021 and December 31, 2020.
The Amended Implementing Rules and Regulations of the SRC effective March 6, 2004 include, among
others, revisions in the terms and conditions for registration and subsequent renewal of license
applicable to both exchange trading participants and non-exchange broker dealers as follows: (a) to
allow a net capital of P=2.50 million or 2.50% of aggregate indebtedness, whichever is higher, for broker
dealers dealing only in proprietary shares and not holding securities, (b) to allow the SEC to set a
different net capital requirement for those authorized to use the Risk-Based Capital Adequacy (RBCA)
model, and (c) to require unimpaired paid-up capital of P=100.00 million for broker dealers, which are
either first time registrants or those acquiring existing broker dealer firms and will participate in a
registered clearing agency; P=10.00 million plus a surety bond for existing broker dealers not engaged in
market making transactions; and P=2.50 million for broker dealers dealing only in proprietary shares and
not holding securities.
The SEC approved Memorandum Circular No. 16 dated November 11, 2004 which provides the
guidelines on the adoption in the Philippines of the RBCA Framework for all registered brokers dealers
in accordance with SRC. These guidelines cover the following risks: (a) position or market risk, (b)
credit risks such as counterparty, settlement, large exposure, and margin financing risks, and (c)
operational risk.
The Parent Company being a registered broker/dealer in securities is subject to the stringent rules of the
SEC and other regulatory agencies with respect to the maintenance of specific levels of RBCA ratios.
RBCA is a ratio that compares the broker or dealer’s total measured risk to its liquid capital. As a rule,
the Parent Company must maintain an RBCA ratio of at least one hundred ten percent (110.00%) and a
net liquid capital (NLC) of at least P=5.00 million or five percent (5.00%) of its aggregate indebtedness,
whichever is higher. Also, the Aggregated Indebtedness (AI) of every stockbroker should not exceed
two thousand percent (2,000.00%) of its NLC. In the event that the minimum RBCA ratio of one
hundred ten percent (110.00%) or the minimum NLC is breached, the Parent Company shall

50
immediately cease doing business as a broker and shall notify the PSE and SEC. As at June 30, 2021
and December 31, 2020, the Parent Company is compliant with the foregoing requirements.
The Parent Company’s capital pertains to equity per books adjusted for deferred tax assets and assets
not readily convertible into cash.
The RBCA ratio of the Parent Company as of June 30, 2021 and December 31, 2020 are as follows:
June 30, 2021
(Unaudited)
December 31, 2020
(Audited)
Equity eligible for net liquid capital P=1,867,746,209 P=1,678,035,456
Less: Ineligible Assets 609,557,959 630,584,805
NLC P=1,258,188,250 P=1,047,450,651
Position risk P=17,291,646 P=15,824,582
Operational risk 205,341,173 199,525,324
Counterparty risk 14 –
Large exposure risk 92,958,678 81,763,884
Total Risk Capital Requirement (TRCR) P=315,591,511 P=297,113,790
AI P=10,145,979,649 P=11,631,871,470
5.00% of AI P=507,298,982 P=581,593,574
Required NLC P=507,298,982 P=581,593,574
Net Risk-Based Capital Excess P=750,889,268 P=465,857,077
Ratio of AI to NLC 806% 1,110%
RBCA ratio (NLC/TRCR) 399% 353%
The following are the definition of terms used in the above computation:
1. Ineligible assets
These pertain to fixed assets and assets which cannot be readily converted into cash.
2. Operational risk requirement
The amount required to cover a level of operational risk which is the exposure associated with
commencing and remaining in business arising separately from exposures covered by other risk
requirements. It is the risk of loss resulting from inadequate or failed internal processes, people and
systems which include, among others, risks of fraud, operational or settlement failure and shortage
of liquid resources, or from external events.
3. Position risk requirement
The amount necessary to accommodate a given level of position risk which is the risk a broker
dealer is exposed to and arising from securities held by it as a principal or in its proprietary or dealer
account.
4. AI
Total money liabilities of a broker dealer arising in connection with any transaction whatsoever, and
includes, among other things, money borrowed, money payable against securities loaned and
securities failed to receive, the market value of securities borrowed to the extent to which no
equivalent value is paid or credited (other than the market value of margin securities borrowed from
customers and margin securities borrowed from non-customers), customers’ and non-customers’
free credit balances, and credit balances in customers’ and non-customers’ account having short
positions in securities subject to the exclusions provided in the said SEC Memorandum.
On May 28, 2009, the SEC approved the PSE’s Rules Governing Trading Rights and Trading
Participants, which supersede the Membership Rules of the PSE. Section 8(c) of Article III of
the said rules requires trading participants to have a minimum unimpaired paid-up capital, as defined by
the SEC, of P=20.00 million effective December 31, 2009, and P=30.00 million effective
51
December 31, 2011 and onwards. As at June 30, 2021 and December 31, 2020, the Parent Company is
compliant with this capital requirement.
The Parent Company’s regulated operations have complied with all externally-imposed capital
requirements as at June 30, 2021 and December 31, 2020.
COLHK monitors capital using liquid capital as provided for under HK’s Securities and Futures
Ordinance (Cap. 571) and Securities and Futures (Financial Resources) Rules (Cap. 571N). COLHK’s
policy is to keep liquid capital at the higher of the floor requirement of HK$3.00 million and computed
variable required capital. As at June 30, 2021 and December 31, 2020, COLHK is compliant with the
said requirement.
23. Financial Risk Management Objectives and Policies
The main purpose of the Group’s financial instruments is to fund its operations. The Group’s principal
financial instruments consist of cash and cash equivalents, cash in a segregated account, short-term time
deposits, financial assets at FVTPL, trade receivables, other receivables, refundable deposits under
other noncurrent assets, trade payables and other current liabilities, which arise from operations.
The main risks arising from the Group’s financial instruments are credit risk, liquidity risk, equity price
risk and foreign currency risk.
The BOD reviews and agrees on the policies for managing each of these risks as summarized below:
Credit risk
Credit risk refers to the potential loss arising from any failure by counterparties to fulfill their
obligations, as and when they fall due. It is inherent to the stock brokerage business as potential losses
may arise due to the failure of its customers and counterparties to fulfill their trading obligations on
settlement dates or the possibility that the value of collateral held to secure obligations becoming
inadequate due to adverse market conditions.
The business model of the Group minimizes its exposure to credit risk. The Group’s customers, except
those granted with a credit line facility by the Parent Company, are required to deposit funds to their
accounts and their purchases are limited to their cash deposit. In order to manage the potential credit
risk associated with the Parent Company’s margin lending activities, the Group has established policies
and procedures in evaluating and approving applications for margin financing as well as the review of
credit performance and limits. In addition, the Parent Company requires its margin customers a Two
Peso (P=2) security cover for every One Peso (P=1) exposure. The security cover can either be in cash or
a combination of cash and marginable stock identified by the Parent Company using a set of criteria.
The Group utilizes an internal credit rating system based on its assessment of the quality of its financial
assets. The Group classifies its financial assets into the following credit grades:
• High grade - This pertains to accounts with a very low probability of default as demonstrated by the
counterparty’s long history of stability, profitability and diversity. This applies to highly rated
financial obligors, strong corporate counterparties and personal borrowers with whom the Group
has excellent repayment experience.
• Standard grade – This pertains to counterparties with no history of default. This applies to
financial assets that are performing as expected.
Financial assets at amortized cost
The Group’s financial assets at amortized cost, which are neither past due nor impaired, are classified as
high grade, due to its high probability of collection (i.e. the counterparty has the evident ability to
satisfy its obligation and the security on the receivables are readily enforceable).

52
Cash and cash equivalents, cash in a segregated account, short-term time deposits and long-term time
deposit are considered high grade and are in stage 1 of the ECL model. These are deposited with
reputable banks duly approved by the BOD and have low probability of insolvency. These are
considered to be low credit risk investments.
Trade receivables from margin customers have no specific credit terms but customers are required to
maintain the value of their collateral within a specific level. Once the value of the collateral falls down
this level, customers may either deposit additional collateral or sell stock to cover any shortfall.
Meanwhile, receivables from post-paid customers are required to be settled on two (2) trading days’
term for COLHK and three (3) trading days’ term for the Parent Company. The receivable balances
become demandable upon failure of the customer to duly comply with these requirements. As at
June 30, 2021 and December 31, 2020, P=842,447,987 and P=772,054,791 of the total receivables from
customers is secured by collateral comprising of equity securities of listed companies with a total
market value of P=5,175,424,811 and P=5,871,374,410, respectively (Note 7).
An impairment analysis is performed at each reporting date using a provision matrix to measure
expected credit losses. The provision matrix is based on the Group’s historical observed default rates.
The calculation reflects the probability-weighted outcome, the time value of money and reasonable and
supportable information that is available at the reporting date about past events, current conditions and
forecasts of future economic conditions.
The aging analyses of the Group’s trade receivables as at June 30, 2021 and December 31, 2020 are
summarized in the following table (gross of allowance for credit losses):
Neither Days past due past due nor
impaired 4-14 days 15-31 days
More than
31 days
Specifically
impaired Total
June 30, 2021 (Unaudited)
Trade receivables P=130,061,722 P=173,992,762 P=188,432,416 P=399,258,647 P=– P=891,745,547
December 31, 2020 (Audited)
Trade receivables 486,995,842 169,869,489 193,331,473 283,130,266 – 1,133,327,070
Past due accounts pertain to margin accounts of the Parent Company that are charged an interest rate
ranging from 8.00% to 10.00%. A margin account has no due date and becomes demandable only when
the equity percentage of the customers falls below 33.33%. The loss rate for trade receivables is
considered minimal.
Transactions through the stock exchange are covered by the guarantee fund contributed by member
brokers and maintained by the clearing house.
Refundable deposits under other noncurrent assets is classified as high grade and is in stage 1 of the
ECL model since the amount shall be kept intact by: (1) the lessor throughout the term of the contract
and shall be returned after the term; and (2) the government institutions as a requirement to conduct
stock brokerage business and shall be returned after the Group ceases to operate its business.
Financial assets at FVTPL
Companies that are consistently profitable, have strong fundamentals and pays out dividends. As at
June 30, 2021 and December 31, 2020, the Group’s financial assets at FVTPL are classified as high
grade since these are with entities of good reputation.
Investment securities at amortized cost
The investments are classified as high grade. The Group’s investment in government and corporate
security is considered of low credit risk since these are rated as Baa2 by Moody’s Investors Service, Inc.
and BBB- by Fitch Ratings Inc, respectively. These credit ratings can still be considered as ’Investment
Grade.’
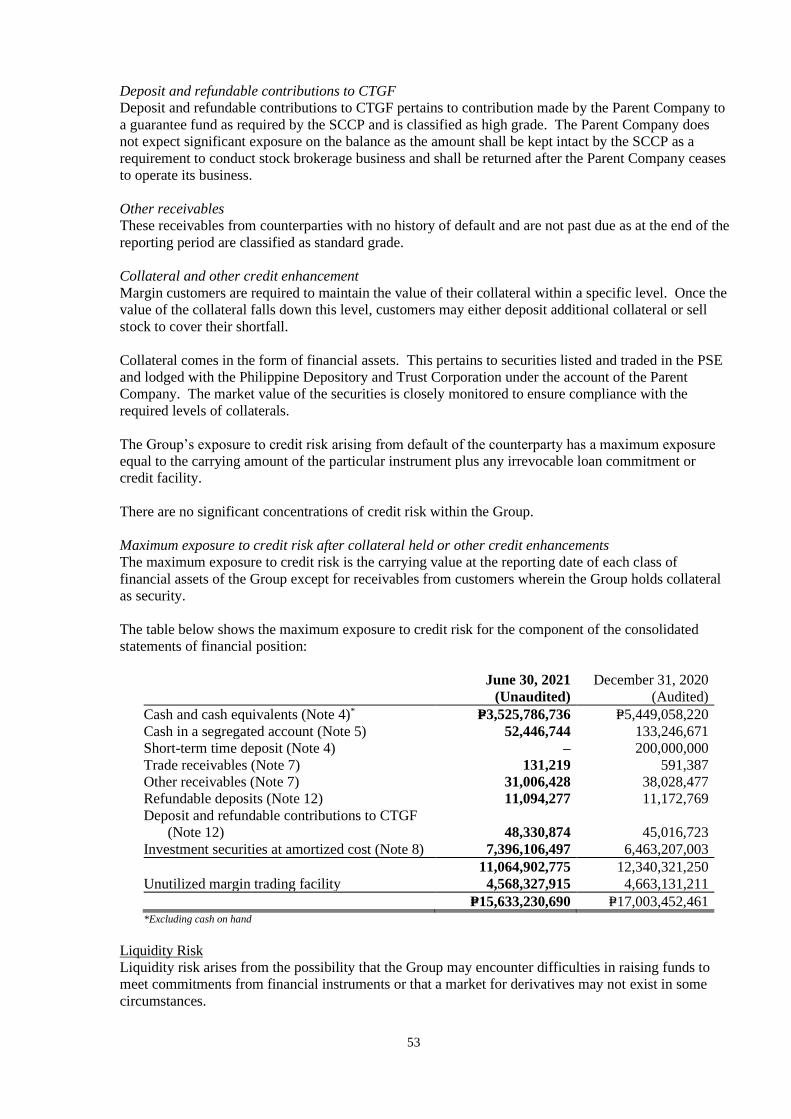
53
Deposit and refundable contributions to CTGF
Deposit and refundable contributions to CTGF pertains to contribution made by the Parent Company to
a guarantee fund as required by the SCCP and is classified as high grade. The Parent Company does
not expect significant exposure on the balance as the amount shall be kept intact by the SCCP as a
requirement to conduct stock brokerage business and shall be returned after the Parent Company ceases
to operate its business.
Other receivables
These receivables from counterparties with no history of default and are not past due as at the end of the
reporting period are classified as standard grade.
Collateral and other credit enhancement
Margin customers are required to maintain the value of their collateral within a specific level. Once the
value of the collateral falls down this level, customers may either deposit additional collateral or sell
stock to cover their shortfall.
Collateral comes in the form of financial assets. This pertains to securities listed and traded in the PSE
and lodged with the Philippine Depository and Trust Corporation under the account of the Parent
Company. The market value of the securities is closely monitored to ensure compliance with the
required levels of collaterals.
The Group’s exposure to credit risk arising from default of the counterparty has a maximum exposure
equal to the carrying amount of the particular instrument plus any irrevocable loan commitment or
credit facility.
There are no significant concentrations of credit risk within the Group.
Maximum exposure to credit risk after collateral held or other credit enhancements
The maximum exposure to credit risk is the carrying value at the reporting date of each class of
financial assets of the Group except for receivables from customers wherein the Group holds collateral
as security.
The table below shows the maximum exposure to credit risk for the component of the consolidated
statements of financial position:
June 30, 2021
(Unaudited)
December 31, 2020
(Audited)
Cash and cash equivalents (Note 4)* P=3,525,786,736 P=5,449,058,220
Cash in a segregated account (Note 5) 52,446,744 133,246,671
Short-term time deposit (Note 4) – 200,000,000
Trade receivables (Note 7) 131,219 591,387
Other receivables (Note 7) 31,006,428 38,028,477
Refundable deposits (Note 12) 11,094,277 11,172,769
Deposit and refundable contributions to CTGF
(Note 12) 48,330,874 45,016,723
Investment securities at amortized cost (Note 8) 7,396,106,497 6,463,207,003
11,064,902,775 12,340,321,250
Unutilized margin trading facility 4,568,327,915 4,663,131,211
P=15,633,230,690 P=17,003,452,461 *Excluding cash on hand
Liquidity Risk
Liquidity risk arises from the possibility that the Group may encounter difficulties in raising funds to
meet commitments from financial instruments or that a market for derivatives may not exist in some
circumstances.
54
The Group manages its liquidity profile to meet the following objectives: a) to ensure that adequate
funding is available at all times; b) to meet commitments as they arise without incurring unnecessary
costs; and c) to be able to access funding when needed at the least possible cost.
As at June 30, 2021 and December 31, 2020, all of the Group’s financial liabilities, which consist of
trade payables and other current liabilities (except statutory payables), are contractually payable on
demand and up to sixty (60) days’ term.
Correspondingly, the financial assets that can be used by the Group to manage its liquidity risk as at
June 30, 2021 and December 31, 2020 consist of cash and cash equivalents, short-term time deposits,
financial assets at FVTPL and trade receivables.
Market Risk
Market risk is the risk of loss to future earnings, to fair values or to future cash flows that may result
from changes in the price of a financial instrument. The value of a financial instrument may change as a
result of changes in interest rates, foreign currency exchanges rates, commodity prices, equity prices
and other market changes. The Group’s market risk originates from its holdings of equity instruments
and foreign currency-denominated financial instruments.
Equity Price Risk
Equity price risk is the risk to earnings or capital arising from changes in stock exchange indices
relating to its quoted equity securities. The Group’s exposure to equity price risk relates primarily to its
financial assets at FVTPL which pertain to investments in shares of stock of companies listed in the
PSE and in mutual fund shares. The Group’s policy is to maintain the risk within an acceptable level.
Movement in share price is monitored regularly to determine the impact on its financial position.
Since the carrying amount of financial assets subject to equity price risk is immaterial relative to the
consolidated financial statements, Management believes that disclosure of equity price risk sensitivity
analysis as at June 30, 2021 and December 31, 2020 is not significant.
Foreign Currency Risk
The Group’s policy is to maintain foreign currency exposure within acceptable limits and within
existing regulatory guidelines. The Group believes that its profile of foreign currency exposure on its
assets and liabilities is within conservative limits for a financial institution engaged in the type of
business in which the Group is engaged.
The Group’s exposure to foreign currency exchange risk arises from its US dollar-denominated cash in
banks amounting to US$216,855 and US$219,548 as at June 30, 2021 and December 31, 2020,
respectively (Note 4).
Since the amount of US$-denominated cash in bank subject to foreign currency risk is immaterial
relative to the consolidated financial statements, Management believes that disclosure of foreign
currency risk analysis as at June 30, 2021 and December 31, 2020 is not significant.
Offsetting of Financial Assets and Liabilities
The table below presents information about rights to offset related arrangements (such as collateral
posting requirements) for financial instruments under an enforceable master netting agreements or
similar agreements.

55
June 30, 2021 (Unaudited)
Financial Instruments
Recognized at
End of Reporting
Period by Type
Gross Carrying
Amounts
(Before
Offsetting)
Gross Amounts
Offset in
Accordance with
the Offsetting
Criteria
Net Amount
Presented in
Consolidated
Statements of
Financial
Position
Effect of Remaining Rights of
Set-Off (Including Rights to Set
Off Financial Collateral) that
do not Meet PAS 32 Offsetting
Criteria
Financial
Instruments
Fair Value of
Financial
Collateral Net Exposure
[a] [b] [c] = [a-b] [d] [e] [f] = [c-d]
Financial Assets
Receivable from customers P=842,448,577 P=– P=842,448,577 P=3,969,842 P=– P=838,478,735
Receivable from clearing house 15,002,425 – 15,002,425 – – 15,002,425
P=857,451,002 P=– P=857,451,002 P=3,969,842 P=– P=853,481,160
Financial Liabilities
Payable to customers P=9,902,772,632 P=– P=9,902,772,632 P=3,969,842 P=– P=9,898,802,790
Payable to clearing house 126,115,836 – 126,115,836 – – 126,115,836
P=10,028,888,468 P=– P=10,028,888,468 P=3,969,842 P=– P=10,024,918,626
December 31, 2020 (Audited)
Financial Instruments Recognized at
End of Reporting
Period by Type
Gross Carrying Amounts
(Before
Offsetting)
Gross Amounts
Offset in Accordance with
the Offsetting
Criteria
Net Amount Presented in
Consolidated Statements of
Financial
Position
Effect of Remaining Rights of
Set-Off (Including Rights to Set Off Financial Collateral) that do
not Meet PAS 32
Offsetting Criteria
Financial
Instruments
Fair Value of
Financial
Collateral Net Exposure
[a] [b] [c] = [a-b] [d] [e] [f] = [c-d]
Financial Assets Receivable from customers P=772,054,897 P=– P=772,054,897 P=2,123,830 P=– P=769,931,067
Due from clearing house 314,422,659 – 314,422,659 36,839,509 – 277,583,150
P=1,086,477,556 P=– P=1,086,477,556 P=38,963,339 P=– P=1,047,514,217
Financial Liabilities
Payable to customers P=11,464,048,995 P=– P=11,464,048,995 P=2,123,830 P=– P=11,461,925,165 Due to clearing house 36,839,509 – 36,839,509 36,839,509 – –
P=11,500,888,504 P=– P=11,500,888,504 P=38,963,339 P=– P=11,461,925,165
24. Fair Value Measurement
The following table shows the carrying value and fair value of the Group’s refundable deposits,
investment securities at amortized cost and investment property, whose carrying value does not
approximate its fair value as at June 30, 2021 and December 31, 2020:
Carrying Values Fair Values
June 30, 2021
(Unaudited)
December 31,
2020 (Audited)
June 30, 2021
(Unaudited)
December 31,
2020 (Audited)
Refundable deposits P=11,094,277 P=11,172,769 P=9,663,477 P=9,731,846
Investment securities at
amortized cost 7,396,106,497 6,463,207,003 7,399,532,836 6,471,437,493
Investment property 14,445,532 14,883,275 39,567,000 35,610,300
The carrying amounts of cash and cash equivalents, cash in a segregated account, short-term time
deposits, trade receivables, other receivables, trade payables and other current liabilities, which are all
subject to normal trade credit terms and are short-term in nature, approximate their fair values.
The carrying value of long-term time deposit approximates its fair value since the placement earns
interest at prevailing market rates.
Financial Assets at FVTPL
The Group’s financial assets at FVTPL are carried at their fair values as at June 30, 2021 and
December 31, 2020. Fair value of financial assets at FVTPL is based on the closing quoted prices of

56
stock investments published by the PSE. Fair value of mutual funds is based on net asset values
computed and published by the mutual fund providers. Fair value of debt securities is based on the
quoted market price in an active market as at June 30, 2021 and December 31, 2020.
Refundable Deposits
The fair value of the refundable deposits is based on the present value of the future cash flows
discounted using credit adjusted risk-free rates for a similar type of instrument using 2.8% as at
June 30, 2021 and December 31, 2020. There are no changes in the valuation techniques in 2021 and
2020.
Investment securities at amortized cost
The fair value of the investments is based on the quoted market price in an active market as at
June 30, 2021 and December 31, 2020.
Investment Property
The fair value of the investment property has been based on highest and best use of property being
appraised. Valuations were derived on the basis of recent sales of similar properties in the same areas
as the investment property and taking into account the economic conditions prevailing at the time the
valuations were made and comparability of similar properties sold with the property being valued.
Fair Value Hierarchy
All assets and liabilities for which fair value is measured or disclosed in the consolidated financial
statements are categorized within the fair value hierarchy as follows:
June 30, 2021 (Unaudited)
Level 1 Level 2 Level 3
Asset measured at fair value:
Financial assets at FVTPL P=158,904,953 P=524,508 P=–
Asset for which fair values are disclosed:
Refundable deposits – – 9,663,477
Investment securities at amortized cost 7,399,532,836 –
Investment property – – 39,567,000
December 31, 2020 (Audited)
Level 1 Level 2 Level 3
Asset measured at fair value:
Financial assets at FVTPL P=34,985,873 P=538,456 P=–
Asset for which fair values are disclosed:
Refundable deposits – – 9,731,846
Investment securities at amortized cost 6,471,437,493 – –
Investment property – – 35,610,300
During the period ended June 30, 2021 and the year ended December 31, 2020, there were no transfers
among levels 1, 2 and 3 of fair value measurements.
25. EPS Computation
June 30, 2021
(Unaudited)
June 30, 2020
(Unaudited)
Net income attributable to the equity holders of the Parent Company P=480,365,034 P=203,051,755
Weighted average number of shares for earnings per share* (Note 15) 4,760,000,000 4,760,000,000
Basic and diluted earnings per share P=0.10 P=0.04
* Weighted average number of shares on June 30, 2020 was recomputed to show the retroactive effect of the ten-for-one
stock split reflected in 2021.
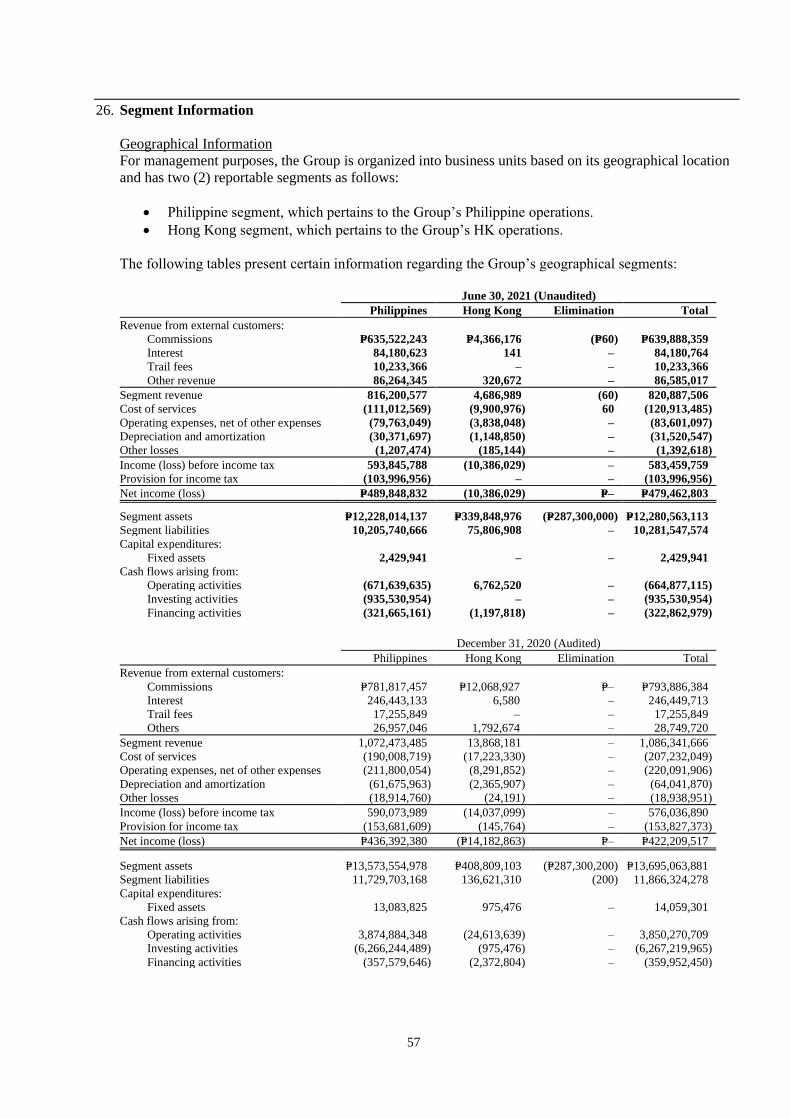
57
26. Segment Information
Geographical Information
For management purposes, the Group is organized into business units based on its geographical location
and has two (2) reportable segments as follows:
• Philippine segment, which pertains to the Group’s Philippine operations.
• Hong Kong segment, which pertains to the Group’s HK operations.
The following tables present certain information regarding the Group’s geographical segments:
June 30, 2021 (Unaudited)
Philippines Hong Kong Elimination Total
Revenue from external customers:
Commissions P=635,522,243 P=4,366,176 (P=60) P=639,888,359
Interest 84,180,623 141 – 84,180,764
Trail fees 10,233,366 – – 10,233,366
Other revenue 86,264,345 320,672 – 86,585,017
Segment revenue 816,200,577 4,686,989 (60) 820,887,506
Cost of services (111,012,569) (9,900,976) 60 (120,913,485)
Operating expenses, net of other expenses (79,763,049) (3,838,048) – (83,601,097)
Depreciation and amortization (30,371,697) (1,148,850) – (31,520,547)
Other losses (1,207,474) (185,144) – (1,392,618)
Income (loss) before income tax 593,845,788 (10,386,029) – 583,459,759
Provision for income tax (103,996,956) – – (103,996,956)
Net income (loss) P=489,848,832 (10,386,029) P=– P=479,462,803
Segment assets P=12,228,014,137 P=339,848,976 (P=287,300,000) P=12,280,563,113
Segment liabilities 10,205,740,666 75,806,908 – 10,281,547,574
Capital expenditures:
Fixed assets 2,429,941 – – 2,429,941
Cash flows arising from:
Operating activities (671,639,635) 6,762,520 – (664,877,115)
Investing activities (935,530,954) – – (935,530,954)
Financing activities (321,665,161) (1,197,818) – (322,862,979)
December 31, 2020 (Audited)
Philippines Hong Kong Elimination Total
Revenue from external customers:
Commissions P=781,817,457 P=12,068,927 P=– P=793,886,384
Interest 246,443,133 6,580 – 246,449,713
Trail fees 17,255,849 – – 17,255,849
Others 26,957,046 1,792,674 – 28,749,720
Segment revenue 1,072,473,485 13,868,181 – 1,086,341,666
Cost of services (190,008,719) (17,223,330) – (207,232,049)
Operating expenses, net of other expenses (211,800,054) (8,291,852) – (220,091,906)
Depreciation and amortization (61,675,963) (2,365,907) – (64,041,870)
Other losses (18,914,760) (24,191) – (18,938,951)
Income (loss) before income tax 590,073,989 (14,037,099) – 576,036,890
Provision for income tax (153,681,609) (145,764) – (153,827,373)
Net income (loss) P=436,392,380 (P=14,182,863) P=– P=422,209,517
Segment assets P=13,573,554,978 P=408,809,103 (P=287,300,200) P=13,695,063,881
Segment liabilities 11,729,703,168 136,621,310 (200) 11,866,324,278
Capital expenditures:
Fixed assets 13,083,825 975,476 – 14,059,301
Cash flows arising from:
Operating activities 3,874,884,348 (24,613,639) – 3,850,270,709
Investing activities (6,266,244,489) (975,476) – (6,267,219,965)
Financing activities (357,579,646) (2,372,804) – (359,952,450)
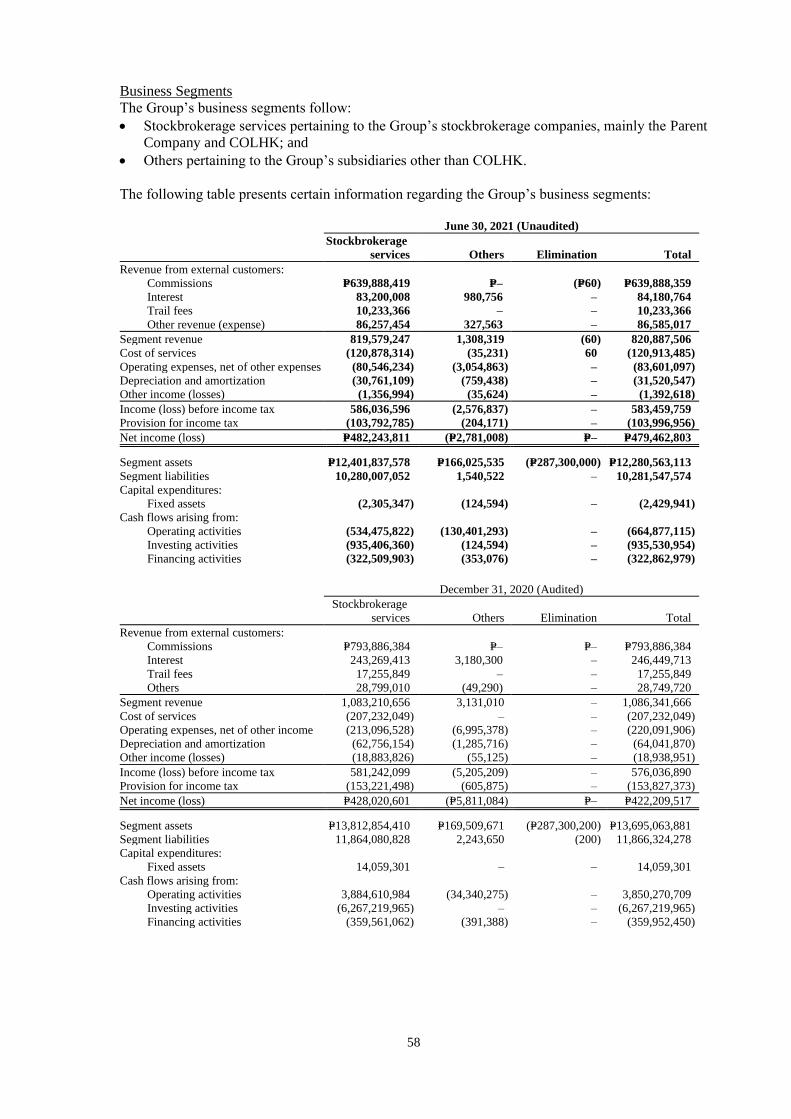
58
Business Segments
The Group’s business segments follow:
• Stockbrokerage services pertaining to the Group’s stockbrokerage companies, mainly the Parent
Company and COLHK; and
• Others pertaining to the Group’s subsidiaries other than COLHK.
The following table presents certain information regarding the Group’s business segments:
June 30, 2021 (Unaudited)
Stockbrokerage
services Others Elimination Total
Revenue from external customers:
Commissions P=639,888,419 P=– (P=60) P=639,888,359
Interest 83,200,008 980,756 – 84,180,764
Trail fees 10,233,366 – – 10,233,366
Other revenue (expense) 86,257,454 327,563 – 86,585,017
Segment revenue 819,579,247 1,308,319 (60) 820,887,506
Cost of services (120,878,314) (35,231) 60 (120,913,485)
Operating expenses, net of other expenses (80,546,234) (3,054,863) – (83,601,097)
Depreciation and amortization (30,761,109) (759,438) – (31,520,547)
Other income (losses) (1,356,994) (35,624) – (1,392,618)
Income (loss) before income tax 586,036,596 (2,576,837) – 583,459,759
Provision for income tax (103,792,785) (204,171) – (103,996,956)
Net income (loss) P=482,243,811 (P=2,781,008) P=– P=479,462,803
Segment assets P=12,401,837,578 P=166,025,535 (P=287,300,000) P=12,280,563,113
Segment liabilities 10,280,007,052 1,540,522 – 10,281,547,574
Capital expenditures:
Fixed assets (2,305,347) (124,594) – (2,429,941)
Cash flows arising from:
Operating activities (534,475,822) (130,401,293) – (664,877,115)
Investing activities (935,406,360) (124,594) – (935,530,954)
Financing activities (322,509,903) (353,076) – (322,862,979)
December 31, 2020 (Audited)
Stockbrokerage
services Others Elimination Total
Revenue from external customers:
Commissions P=793,886,384 P=– P=– P=793,886,384
Interest 243,269,413 3,180,300 – 246,449,713
Trail fees 17,255,849 – – 17,255,849
Others 28,799,010 (49,290) – 28,749,720
Segment revenue 1,083,210,656 3,131,010 – 1,086,341,666
Cost of services (207,232,049) – – (207,232,049)
Operating expenses, net of other income (213,096,528) (6,995,378) – (220,091,906)
Depreciation and amortization (62,756,154) (1,285,716) – (64,041,870)
Other income (losses) (18,883,826) (55,125) – (18,938,951)
Income (loss) before income tax 581,242,099 (5,205,209) – 576,036,890
Provision for income tax (153,221,498) (605,875) – (153,827,373)
Net income (loss) P=428,020,601 (P=5,811,084) P=– P=422,209,517
Segment assets P=13,812,854,410 P=169,509,671 (P=287,300,200) P=13,695,063,881
Segment liabilities 11,864,080,828 2,243,650 (200) 11,866,324,278
Capital expenditures:
Fixed assets 14,059,301 – – 14,059,301
Cash flows arising from:
Operating activities 3,884,610,984 (34,340,275) – 3,850,270,709
Investing activities (6,267,219,965) – – (6,267,219,965)
Financing activities (359,561,062) (391,388) – (359,952,450)

59
SCHEDULE I
COL FINANCIAL GROUP, INC. AND SUBSIDIARIES
SCHEDULE SHOWING FINANCIAL SOUNDNESS INDICATORS
PURSUANT TO SRC RULE 68, AS AMENDED
Formula
June 30,
2021
June 30,
2020
Profitability ratios:
Return on assets Net Income (NI)/Total Assets 3.92% 1.63%
Return on equity (annualized) NI/Average Equity* 50.74% 24.50%
Net profit margin NI/Net Sales 58.52% 42.97%
Solvency and liquidity ratios:
Current ratio Current Assets/Current Liabilities 1.15:1 1.11:1
Debt to equity ratio Total Liabilities/Average Equity* 5.43:1 6.58:1
Quick ratio Liquid Assets/Current Liabilities 1.15:1 1.09:1
Asset to equity ratio Total Assets/Average Equity* 6.49:1 7.55:1
Other relevant ratios:
RBCA ratio 399% 380%
Ratio of AI to NLC 806% 1,285%
* Equity Attributable to the Equity Holders of the Parent Company


![* X e b ¥ #0 )45 9 %* & #0 )42 9 #0 )45 9 %* & #0 )42 9 %* & Ý l ½ {  > / E ' & Ì " 3 ( ÿ èôôð󺯯÷÷÷®ãó®äáéëéîáéòãïî®ãïí¯ > ; A [ ] [ ã ¿](https://img.pdfslide.us/doc/110x75/5ad1fe2b7f8b9aff738c32d6/-x-e-b-0-45-9-0-42-9-0-45-9-0-42-9-l-e-3-a-r-a.jpg)