Embed Size (px)
Citation preview

cover en uitnodiging.indd 1 22-2-2016 14:44:31


Integrated assessment of farm level adaptation
to climate change in agriculture –
An application to Flevoland, The Netherlands
Maryia Mandryk
binnenwerk.indd 1 23-2-2016 21:54:21

Thesis committee
Promotor
Prof. Dr M.K. van Ittersum
Personal chair at the Plant Production Systems Group
Wageningen University
Co-promotors
Dr P. Reidsma
Assistant professor, Plant Production Systems Group
Wageningen University
Prof. Dr B.J.M. Arts
Professor of Forest and Nature Conservation Policy
Wageningen University
Other members
Prof. Dr I.J.M. de Boer, Wageningen University
Prof. H. Lehtonen, Natural Resources Institute Finland (Luke), Helsinki, Finland
Dr W.A.H. Rossing, Wageningen University
Dr G.R. Biesbroek, Wageningen University
This research was conducted under the auspices of the C.T. de Wit Graduate School for Production Ecology and Resource Conservation.
Integrated assessment of farm level adaptation
to climate change in agriculture –
An application to Flevoland, The Netherlands
Maryia Mandryk
Thesis
submitted in fulfillment of the requirements for the degree of doctor
at Wageningen University
by the authority of the Rector Magnificus
Prof. Dr A.P.J. Mol,
in the presence of the
Thesis Committee appointed by the Academic Board
to be defended in public
on Tuesday 29th of March 2016
at 4 p.m. in the Aula.
binnenwerk.indd 2 23-2-2016 21:54:21

Thesis committee
Promotor
Prof. Dr M.K. van Ittersum
Personal chair at the Plant Production Systems Group
Wageningen University
Co-promotors
Dr P. Reidsma
Assistant professor, Plant Production Systems Group
Wageningen University
Prof. Dr B.J.M. Arts
Professor of Forest and Nature Conservation Policy
Wageningen University
Other members
Prof. Dr I.J.M. de Boer, Wageningen University
Prof. H. Lehtonen, Natural Resources Institute Finland (Luke), Helsinki, Finland
Dr W.A.H. Rossing, Wageningen University
Dr G.R. Biesbroek, Wageningen University
This research was conducted under the auspices of the C.T. de Wit Graduate School for Production Ecology and Resource Conservation.
Integrated assessment of farm level adaptation
to climate change in agriculture –
An application to Flevoland, The Netherlands
Maryia Mandryk
Thesis
submitted in fulfillment of the requirements for the degree of doctor
at Wageningen University
by the authority of the Rector Magnificus
Prof. Dr A.P.J. Mol,
in the presence of the
Thesis Committee appointed by the Academic Board
to be defended in public
on Tuesday 29th of March 2016
at 4 p.m. in the Aula.
binnenwerk.indd 3 23-2-2016 21:54:21


Propositions
1. Climate change impact and adaptation assessments of the Intergovernmental Panel on
Climate Change (IPCC) underestimate adaptation opportunities in agriculture, because they
largely ignore the options at farm level.
(this thesis)
2. Although farmers in Flevoland do have more objectives, in tactical decision-making they
focus on economic result maximization, while for strategic decision-making they also
prioritize soil organic matter.
(this thesis)
3. Modern food supply chains have become more vulnerable to disturbances due to high
performance pressure.
4. An integrated assessment is needed to judge the potential role of insects in global food and
feed production.
5. According to modern Dutch farmers’ wisdom, the best alternative farm plan includes a
partner with an off-farm job.
6. When looked at from the outer space, the Earth seems too small to accommodate all human
activity.
Propositions belonging to the thesis entitled:
Integrated assessment of farm level adaptation to climate change in agriculture –
An application to Flevoland, The Netherlands
Maryia Mandryk
Wageningen, 29 March 2016
propositions.indd 1 22-2-2016 13:11:49

Table of contents
Chapter 1 General Introduction
1
Chapter 2 Scenarios of long term farm structural change for application in climate change impact assessment
11
Chapter 3 The role of farmers’ objectives in current farm practices and adaptation preferences
35
Chapter 4 Crop and farm level adaptation under future climate challenges
59
Chapter 5 Institutional constraints for adaptive capacity to climate change in agriculture
83
Chapter 6 Synthesis
109
References
129
Summary
141
Samenvatting
145
Acknowledgements
149
About the author
151
List of publications
153
Education certificate 155
An application to Flevoland, The Netherlands
155 pages.
PhD thesis, Wageningen University, Wagening en, NL(2016)
Maryia Mandryk
Integrated assessment of farm level adaptation to climate change in agriculture –
With references, with summaries in English and Dutch
ISBN: 978-94-6257-661-2
binnenwerk.indd 4 23-2-2016 21:54:21

Table of contents
Chapter 1 General Introduction
1
Chapter 2 Scenarios of long term farm structural change for application in climate change impact assessment
11
Chapter 3 The role of farmers’ objectives in current farm practices and adaptation preferences
35
Chapter 4 Crop and farm level adaptation under future climate challenges
59
Chapter 5 Institutional constraints for adaptive capacity to climate change in agriculture
83
Chapter 6 Synthesis
109
References
129
Summary
141
Samenvatting
145
Acknowledgements
149
About the author
151
List of publications
153
Education certificate 155
An application to Flevoland, The Netherlands
155 pages.
PhD thesis, Wageningen University, Wageningen, NL(2016)
Maryia Mandryk
Integrated assessment of farm level adaptation to climate change in agriculture –
With references, with summaries in English and Dutch
ISBN: 978-94-6257-661-2
binnenwerk.indd 5 23-2-2016 21:54:21

Chapter 1
General Introduction
binnenwerk.indd 6 23-2-2016 21:54:21

Chapter 1
General Introduction
binnenwerk.indd 1 23-2-2016 21:54:21

Chapter 1
2
1.1 Background 1.1.1 Climate change impacts and adaptation at different levels Climate change has become an issue of concern during the last decades. In many regions of the world one can observe effects of changes in climatic conditions or climate variability on crop productivity, farmers’ income and land use (Audsley et al. 2006; Berry et al. 2006; Bindi and Olesen 2010; Bradshaw et al. 2004; Olesen and Bindi 2002; Porter et al. 2014; Reidsma et al. 2009). Especially severe climate change effects are expected in tropical regions (e.g. Sub-Saharan Africa) (Porter et al. 2014). Also for the future of agriculture in a temperate zone such as the Netherlands, the potential importance of climate change cannot be ignored, especially regarding effects of weather extremes (Bresser 2005; Eitzinger et al. 2013; Peltonen-Sainio et al. 2010; Schaap et al. 2011; Tebaldi et al. 2006; van Dorland 2008).
To withstand the negative impacts and to take advantage of the opportunities arising from climate change, the agricultural sector will need to implement adaptation measures (Olesen et al. 2011; Schaap et al. 2013). Adaptation measures to climate change in agriculture refer to practices that might be adopted to alleviate expected adverse impacts or to take advantage of positive impacts (Smit and Skinner 2002). A body of literature that has been published in the last decade provides a number of theoretical frameworks for adaptation research (Acosta et al. 2013; Berry et al. 2006; Meinke et al. 2009; Tol 2005; Yohe and Tol 2002). In parallel, there is an increasing number of empirical studies that propose adaptation measures at crop, farm and regional/sectoral levels. Considerable attention is given to the development of new adaptation measures, but it is also important to assess whether these measures are feasible in terms of implementation (Easterling et al. 2007; Smit and Skinner 2002).
The recent report of the Intergovernmental Panel on Climate Change (IPCC) is generally more negative regarding impacts of climate change on agriculture compared to the previous report, also for temperate regions (Porter et al. 2014). Such conclusions have been drawn with a focus mostly on crop level impacts and adaptation, whereas actual impacts feature at higher aggregation levels. Adaptation occurs across scales, but actual decisions are made at a management unit, i.e. farm level (Adger et al. 2005; Rodriguez et al. 2014; Rounsevell et al. 2003). Impacts and adaptation should thus be assessed at farm level, and farm variability should be considered. Impacts of future climate change are usually projected on current farms and cropping systems (Porter et al. 2014). Since the impacts of climate change will be relatively minor in the short term, assessments must be performed for a long time horizon, when climate change will likely be more manifest. For such a time horizon, effects of other drivers of change must also be considered. The farms in the future are not the same as the current ones: they will evolve through structural changes.
Assessments of impacts on and adaptation to climate change in agriculture have focused primarily on food production (Porter et al. 2014). At the same time, farming systems in Europe are diverse in terms of their characteristics, objectives and
General Introduction
3
performance, which largely influenced adaptation of farms to past climate change and variability (Reidsma et al. 2010). One of the factors contributing to increasing farm diversity recently is a shift towards multifunctional agriculture associated with a broader role of agriculture in a modern society (van der Ploeg et al. 2009; Renting et al. 2009; Meerburg et al. 2009). Next to primarily economic objectives, farmers are assumed to have other objectives (e.g. social, environmental) influencing their management practices. Farm specific adaptation measures to climate change should therefore account for the differences in farm objectives.
Adaptation of agricultural systems to climate change is embedded in a broader context. In the latest IPCC report (Klein et al. 2014a), it was concluded that effective governance and institutions for facilitating adaptation planning and implementation across multiple sectors within regions is by far the dominant adaptation opportunity and constraint. An assessment of the institutional context is therefore needed to assess the feasibility of implementation of adaptation measures to climate change from an institutional perspective.
In the following sections we introduce main issues relevant to improve climate impact and adaptation assessments in agriculture: farm structural change, farmers multiple objectives, adaptation at different organizational levels and the institutional context. 1.1.2 Farm structural change Changes in agricultural policy setting, market responses and technological development were shown to be at least equally important drivers of change for agriculture as climate change (Hermans et al. 2010; O'Brien and Leichenko 2000). Due to the impact of these drivers, farms in The Netherlands have been changing considerably since World War II (Meerburg et al. 2009). Those changes affected not only the numbers of farms, but also accounted for new farm types through structural changes. Structural changes fall into the category of strategic (medium to long-term) investment decisions to fundamentally change farm size, specialization or production intensity (Zimmermann et al. 2009).
The most common quantitative methods to study farm structural change are econometric models, as shown in the review by Zimmermann et al. (2009), or agent-based models as applied by Piorr et al. (2009). However, nearly all of the past studies had short time horizons. Econometric models have been used to assess farm structural change due to climate change on the long term (e.g. Seo et al. 2010). Those models have still been using the assumption that all farmers are profit maximizers, which has been disputed for instance by Rufino et al. (2011). In agent-based models the decisions are also often based on profit maximization (Piorr et al. 2009). Furthermore, a long time horizon brings many uncertainties as to how future farm development will unfold in the context of multiple drivers of change acting at different levels. A scenario approach is therefore needed that can deal with both qualitative and quantitative information.
binnenwerk.indd 2 23-2-2016 21:54:22

Chapter 1
2
1.1 Background 1.1.1 Climate change impacts and adaptation at different levels Climate change has become an issue of concern during the last decades. In many regions of the world one can observe effects of changes in climatic conditions or climate variability on crop productivity, farmers’ income and land use (Audsley et al. 2006; Berry et al. 2006; Bindi and Olesen 2010; Bradshaw et al. 2004; Olesen and Bindi 2002; Porter et al. 2014; Reidsma et al. 2009). Especially severe climate change effects are expected in tropical regions (e.g. Sub-Saharan Africa) (Porter et al. 2014). Also for the future of agriculture in a temperate zone such as the Netherlands, the potential importance of climate change cannot be ignored, especially regarding effects of weather extremes (Bresser 2005; Eitzinger et al. 2013; Peltonen-Sainio et al. 2010; Schaap et al. 2011; Tebaldi et al. 2006; van Dorland 2008).
To withstand the negative impacts and to take advantage of the opportunities arising from climate change, the agricultural sector will need to implement adaptation measures (Olesen et al. 2011; Schaap et al. 2013). Adaptation measures to climate change in agriculture refer to practices that might be adopted to alleviate expected adverse impacts or to take advantage of positive impacts (Smit and Skinner 2002). A body of literature that has been published in the last decade provides a number of theoretical frameworks for adaptation research (Acosta et al. 2013; Berry et al. 2006; Meinke et al. 2009; Tol 2005; Yohe and Tol 2002). In parallel, there is an increasing number of empirical studies that propose adaptation measures at crop, farm and regional/sectoral levels. Considerable attention is given to the development of new adaptation measures, but it is also important to assess whether these measures are feasible in terms of implementation (Easterling et al. 2007; Smit and Skinner 2002).
The recent report of the Intergovernmental Panel on Climate Change (IPCC) is generally more negative regarding impacts of climate change on agriculture compared to the previous report, also for temperate regions (Porter et al. 2014). Such conclusions have been drawn with a focus mostly on crop level impacts and adaptation, whereas actual impacts feature at higher aggregation levels. Adaptation occurs across scales, but actual decisions are made at a management unit, i.e. farm level (Adger et al. 2005; Rodriguez et al. 2014; Rounsevell et al. 2003). Impacts and adaptation should thus be assessed at farm level, and farm variability should be considered. Impacts of future climate change are usually projected on current farms and cropping systems (Porter et al. 2014). Since the impacts of climate change will be relatively minor in the short term, assessments must be performed for a long time horizon, when climate change will likely be more manifest. For such a time horizon, effects of other drivers of change must also be considered. The farms in the future are not the same as the current ones: they will evolve through structural changes.
Assessments of impacts on and adaptation to climate change in agriculture have focused primarily on food production (Porter et al. 2014). At the same time, farming systems in Europe are diverse in terms of their characteristics, objectives and
General Introduction
3
performance, which largely influenced adaptation of farms to past climate change and variability (Reidsma et al. 2010). One of the factors contributing to increasing farm diversity recently is a shift towards multifunctional agriculture associated with a broader role of agriculture in a modern society (van der Ploeg et al. 2009; Renting et al. 2009; Meerburg et al. 2009). Next to primarily economic objectives, farmers are assumed to have other objectives (e.g. social, environmental) influencing their management practices. Farm specific adaptation measures to climate change should therefore account for the differences in farm objectives.
Adaptation of agricultural systems to climate change is embedded in a broader context. In the latest IPCC report (Klein et al. 2014a), it was concluded that effective governance and institutions for facilitating adaptation planning and implementation across multiple sectors within regions is by far the dominant adaptation opportunity and constraint. An assessment of the institutional context is therefore needed to assess the feasibility of implementation of adaptation measures to climate change from an institutional perspective.
In the following sections we introduce main issues relevant to improve climate impact and adaptation assessments in agriculture: farm structural change, farmers multiple objectives, adaptation at different organizational levels and the institutional context. 1.1.2 Farm structural change Changes in agricultural policy setting, market responses and technological development were shown to be at least equally important drivers of change for agriculture as climate change (Hermans et al. 2010; O'Brien and Leichenko 2000). Due to the impact of these drivers, farms in The Netherlands have been changing considerably since World War II (Meerburg et al. 2009). Those changes affected not only the numbers of farms, but also accounted for new farm types through structural changes. Structural changes fall into the category of strategic (medium to long-term) investment decisions to fundamentally change farm size, specialization or production intensity (Zimmermann et al. 2009).
The most common quantitative methods to study farm structural change are econometric models, as shown in the review by Zimmermann et al. (2009), or agent-based models as applied by Piorr et al. (2009). However, nearly all of the past studies had short time horizons. Econometric models have been used to assess farm structural change due to climate change on the long term (e.g. Seo et al. 2010). Those models have still been using the assumption that all farmers are profit maximizers, which has been disputed for instance by Rufino et al. (2011). In agent-based models the decisions are also often based on profit maximization (Piorr et al. 2009). Furthermore, a long time horizon brings many uncertainties as to how future farm development will unfold in the context of multiple drivers of change acting at different levels. A scenario approach is therefore needed that can deal with both qualitative and quantitative information.
binnenwerk.indd 3 23-2-2016 21:54:22

Chapter 1
4
Hierarchical scenario development to arrive at scenarios at regional level has been performed in many studies (Abildtrup et al. 2006; Audsley et al. 2006; Dockerty et al. 2006; Rounsevell et al. 2003; Vandermeulen et al. 2009). These studies, however, focused on modeling spatial distribution of agricultural land use at regional and EU scale under global environmental (climate) change and policy drivers and did not consider farm structural changes induced by these drivers. Reidsma et al. (2006) made an attempt to project changes in intensity of farm types in order to assess changes in agricultural biodiversity, but this study lacked other farm structural characteristics besides intensity. Development of hierarchically consistent scenarios of farm structural change at farm and regional level defined by plausible directions of change in climate and socio-economic developments has not been performed previously. We need these scenarios to put climate change impacts into context of other drivers of change and to assess the impacts of more specific crop and farm level adaptation strategies to climate change in the long term. 1.1.3 Farmers multiple objectives In many studies on assessment of adaptation to climate change using economic modelling, farmer’s multiple objectives are neglected and farmers are seen as ultimate profit maximizers (Audsley et al. 2006; Seo 2010). Profit maximization is an appropriate assumption when exploring optimal farm plans (Janssen and van Ittersum 2007; Van Ittersum et al. 1998), but cannot always be used to project actual choices made by farmers (see also Rufino et al. (2011)). In reality farmers often choose for managerial options considering also other objectives, and they select options that are not necessarily the most optimal from an economic point of view.
Studies that do consider multiple and conflicting objectives generally focus on trade-offs between these objectives (Dogliotti et al. 2005; Groot and Rossing 2011; Tittonell et al. 2007). However, most of these studies did not pay attention to the importance of these objectives for the farmers and/or methods to derive this importance. As argued by Jones (2011), the methodology of weight elicitation and reporting of objectives is currently somewhat random and ad hoc in nature. The weights attached to different objectives are usually recovered through the existing cropping patterns, hence the actual behaviour of farmers is explained through assessment of a compromise between different objectives by modelling farm current performance (Berkhout et al. 2011; Gómez-Limón et al. 2003; Romero and Rehman 2003; Sumpsi et al. 1997). In other studies farmers were asked about their objectives in interviews. Different methods may, however, result in different outcomes, and comparing methods may shed light on differences between what farmers say, do and want.
General Introduction
5
1.1.4 Levels of adaptation: crop and farm level There has been much more research on crop response to climate change than on human response to climate change (van Oort et al. 2012). The 5th IPCC Working Group II report (Porter et al. 2014) has focused mainly on crop level impacts and adaptation – based on the results of crop models and statistical analyses – with little emphasis on farm level adaptation. Empirical studies have compared climate change impacts in Europe with and without adaptation (Moore and Lobell 2014; Reidsma et al. 2010) and found that adaptation can largely reduce the impacts of climate change and climate variability on European agriculture.
Climate change impact assessment in agriculture needs to be based on integrated assessment and farming systems analysis, and account for adaptation at different levels and not just the crop level (Reidsma et al. 2015). The use of bio-economic models linking crop growth models with economic decision models has been suggested in various studies as a way forward towards integrated assessments of adaptation to climate change (Challinor et al. 2009; Finger and Calanca 2011; Lehmann et al. 2013; Olesen et al. 2011; Reidsma et al. 2010; Reidsma et al. 2015). Most studies with bio-economic models applied optimization techniques to identify adaptation strategies (Kanellopoulos et al. 2014; Lehmann et al. 2013; Schütze and Schmitz 2010). However, those studies solely addressed impacts of climate change and management on economic yield without considering the multifunctional role of agriculture. Multiple objectives have been considered, but not at farm level (Holzkämper et al. 2015; Klein et al. 2014b). I argue that in adaptation research it is important to consider farmers’ multiple objectives when further assessing farm and crop level adaptation. 1.1.5 Institutional context Institutions are the rules of the game in a society or, in other words, institutions are the constraints devised by humans that shape human interaction (North 1991). Under North’s framework, institutions consist of both informal (customs, tradition, codes of conduct) and formal (laws, property rights) sets of rules, compliance procedures and moral and ethical behavioral norms designed to constrain individuals in their interaction within society (North, 1991). Although North’s definition is probably the most cited one, it has also been criticized. In particular, other scholars have emphasized the potentially enabling properties of institutions for self-organization, besides constraining ones (Arts et al. 2006; Giddens 1981). From these definitions, the functions of institutions can be summarized as giving structure, building expectations, and setting both constraints and incentives for human interactions.
An enabling institutional environment is an important precondition for the implementation of adaptation measures (Adger et al. 2005; Nelson et al. 2007; Challinor 2008). Initially, the IPCC named economic resources, technology, information and skills, infrastructure, institutions and equity as the main determinants of the adaptive capacity of a society to climate change (Smit 2000). Later, the integral
binnenwerk.indd 4 23-2-2016 21:54:22

Chapter 1
4
Hierarchical scenario development to arrive at scenarios at regional level has been performed in many studies (Abildtrup et al. 2006; Audsley et al. 2006; Dockerty et al. 2006; Rounsevell et al. 2003; Vandermeulen et al. 2009). These studies, however, focused on modeling spatial distribution of agricultural land use at regional and EU scale under global environmental (climate) change and policy drivers and did not consider farm structural changes induced by these drivers. Reidsma et al. (2006) made an attempt to project changes in intensity of farm types in order to assess changes in agricultural biodiversity, but this study lacked other farm structural characteristics besides intensity. Development of hierarchically consistent scenarios of farm structural change at farm and regional level defined by plausible directions of change in climate and socio-economic developments has not been performed previously. We need these scenarios to put climate change impacts into context of other drivers of change and to assess the impacts of more specific crop and farm level adaptation strategies to climate change in the long term. 1.1.3 Farmers multiple objectives In many studies on assessment of adaptation to climate change using economic modelling, farmer’s multiple objectives are neglected and farmers are seen as ultimate profit maximizers (Audsley et al. 2006; Seo 2010). Profit maximization is an appropriate assumption when exploring optimal farm plans (Janssen and van Ittersum 2007; Van Ittersum et al. 1998), but cannot always be used to project actual choices made by farmers (see also Rufino et al. (2011)). In reality farmers often choose for managerial options considering also other objectives, and they select options that are not necessarily the most optimal from an economic point of view.
Studies that do consider multiple and conflicting objectives generally focus on trade-offs between these objectives (Dogliotti et al. 2005; Groot and Rossing 2011; Tittonell et al. 2007). However, most of these studies did not pay attention to the importance of these objectives for the farmers and/or methods to derive this importance. As argued by Jones (2011), the methodology of weight elicitation and reporting of objectives is currently somewhat random and ad hoc in nature. The weights attached to different objectives are usually recovered through the existing cropping patterns, hence the actual behaviour of farmers is explained through assessment of a compromise between different objectives by modelling farm current performance (Berkhout et al. 2011; Gómez-Limón et al. 2003; Romero and Rehman 2003; Sumpsi et al. 1997). In other studies farmers were asked about their objectives in interviews. Different methods may, however, result in different outcomes, and comparing methods may shed light on differences between what farmers say, do and want.
General Introduction
5
1.1.4 Levels of adaptation: crop and farm level There has been much more research on crop response to climate change than on human response to climate change (van Oort et al. 2012). The 5th IPCC Working Group II report (Porter et al. 2014) has focused mainly on crop level impacts and adaptation – based on the results of crop models and statistical analyses – with little emphasis on farm level adaptation. Empirical studies have compared climate change impacts in Europe with and without adaptation (Moore and Lobell 2014; Reidsma et al. 2010) and found that adaptation can largely reduce the impacts of climate change and climate variability on European agriculture.
Climate change impact assessment in agriculture needs to be based on integrated assessment and farming systems analysis, and account for adaptation at different levels and not just the crop level (Reidsma et al. 2015). The use of bio-economic models linking crop growth models with economic decision models has been suggested in various studies as a way forward towards integrated assessments of adaptation to climate change (Challinor et al. 2009; Finger and Calanca 2011; Lehmann et al. 2013; Olesen et al. 2011; Reidsma et al. 2010; Reidsma et al. 2015). Most studies with bio-economic models applied optimization techniques to identify adaptation strategies (Kanellopoulos et al. 2014; Lehmann et al. 2013; Schütze and Schmitz 2010). However, those studies solely addressed impacts of climate change and management on economic yield without considering the multifunctional role of agriculture. Multiple objectives have been considered, but not at farm level (Holzkämper et al. 2015; Klein et al. 2014b). I argue that in adaptation research it is important to consider farmers’ multiple objectives when further assessing farm and crop level adaptation. 1.1.5 Institutional context Institutions are the rules of the game in a society or, in other words, institutions are the constraints devised by humans that shape human interaction (North 1991). Under North’s framework, institutions consist of both informal (customs, tradition, codes of conduct) and formal (laws, property rights) sets of rules, compliance procedures and moral and ethical behavioral norms designed to constrain individuals in their interaction within society (North, 1991). Although North’s definition is probably the most cited one, it has also been criticized. In particular, other scholars have emphasized the potentially enabling properties of institutions for self-organization, besides constraining ones (Arts et al. 2006; Giddens 1981). From these definitions, the functions of institutions can be summarized as giving structure, building expectations, and setting both constraints and incentives for human interactions.
An enabling institutional environment is an important precondition for the implementation of adaptation measures (Adger et al. 2005; Nelson et al. 2007; Challinor 2008). Initially, the IPCC named economic resources, technology, information and skills, infrastructure, institutions and equity as the main determinants of the adaptive capacity of a society to climate change (Smit 2000). Later, the integral
binnenwerk.indd 5 23-2-2016 21:54:22

Chapter 1
6
roles of institutions, governance arrangements and management practices were further emphasized (Brooks et al. 2005; Gupta et al. 2010; Yohe and Tol 2002; Engle 2011). As stated by the IPCC (2007), when institutions are supporting the social actors to anticipate and proactively respond to changes, other determinants of adaptive capacity improve and consequently adaptive capacity as a whole improves (Parry et al. 2007). Considering that climate change brings unpredictable changes, it calls for institutions that enhance the adaptive capacity of a society. In the latest IPCC report (Klein et al. 2014a), it was concluded that effective governance and institutions for facilitating adaptation planning and implementation across multiple sectors within regions is by far the dominant adaptation opportunity and constraint.
Many studies have focused on the adaptive capacity of institutions to cope with climate change. Recent literature on adaptation reveals different terms used to describe factors that may hinder implementation of adaptation from an institutional perspective (see review by Biesbroek et al. (2013)). Termeer et al. (2012) use the term institutional weaknesses. De Bruin et al. (2009) assess institutional complexities, while Moser and Ekstrom (2010) and Biesbroek et al. (2011) speak about barriers to climate change adaptation. However, none of those studies specifically focus on the agricultural sector.
While farmers can make decisions regarding crop and farm level adaptation measures directly, they are influenced by the institutional context. Assessing this context allows for a broader picture regarding adaptation to climate change for agriculture. 1.2 Objective and research questions This thesis investigates adaptation measures to climate change for arable farming systems at multiple levels of organization (crop, farm and regional levels) using integrated assessment and a focus on farming systems. The integrated assessment approach includes scenario analysis on the drivers for future changes in agricultural systems; modelling the trade-offs between important farmers’ objectives derived through a participatory process; assessment of adaptation measures in terms of improvement of farming systems performance on the important objectives; and an institutional analysis of the adaptive capacity to climate change.
The overall objective of this thesis is to improve climate change impact and adaptation assessment of agricultural systems by focussing on farm level adaptation and the broader context it is embedded in. This thesis is an interdisciplinary study that assesses not only adaptation to climate change for agricultural systems, but also the context within which climate change adaptation takes place.
The following research questions are linked to the different aspects of integrated assessment of adaptation to climate change and investigated in the thesis:
General Introduction
7
Farm structural change • How to assess future structural change of farms in a region, under different
plausible future scenarios? • What will the farms of the future look like?
Farmers’ multiple objectives • What are the important farmers’ objectives based on what farmers say, do and
want? • How do farmers’ objectives relate to farmers’ currently implemented practices
and to preferred adaptation options? Crop versus farm level adaptation
• What will be the impact of gradual climate change on farm performance? • What will be the impact of the changes in future frequency of extreme events
on farm performance? • How important is crop level adaptation compared to farm level adaptation in
improving farm performance on important objectives in climate change scenarios?
• How do different farmers’ objectives influence preferences for different adaptation measures to climate change?
Institutional context • How to assess the feasibility of implementing adaptation measures from an
institutional perspective? • What are institutional constraints for adaptive capacity to respond to climate
change challenges?
Finally, in the general discussion of the thesis, I address the following questions: • What future images of agriculture in Flevoland are to be identified, given the
findings of this thesis? • What methodological contribution does this thesis provide to climate change
impact and adaptation assessment of agricultural systems? 1.3. Case study The methods developed in this thesis are meant to be generic and not case study specific. I chose to work with the most productive agricultural region in the Netherlands, province Flevoland, with large scale, intensive arable farming as the main type of agricultural activity. Since the agricultural sector is important for the economy of the province, assessment of impacts of and adaptation to climate change in agriculture has a high relevance for this region. Flevoland had already been a hotspot for the research project Klimaat en Landbouw Noord Nederland (Climate and Agriculture in the North of the Netherlands), thus a participatory process was already ongoing and data availability was relatively good. Besides, Flevoland is considered somewhat representative for other productive agricultural regions, especially in Northern Europe.
binnenwerk.indd 6 23-2-2016 21:54:22

Chapter 1
6
roles of institutions, governance arrangements and management practices were further emphasized (Brooks et al. 2005; Gupta et al. 2010; Yohe and Tol 2002; Engle 2011). As stated by the IPCC (2007), when institutions are supporting the social actors to anticipate and proactively respond to changes, other determinants of adaptive capacity improve and consequently adaptive capacity as a whole improves (Parry et al. 2007). Considering that climate change brings unpredictable changes, it calls for institutions that enhance the adaptive capacity of a society. In the latest IPCC report (Klein et al. 2014a), it was concluded that effective governance and institutions for facilitating adaptation planning and implementation across multiple sectors within regions is by far the dominant adaptation opportunity and constraint.
Many studies have focused on the adaptive capacity of institutions to cope with climate change. Recent literature on adaptation reveals different terms used to describe factors that may hinder implementation of adaptation from an institutional perspective (see review by Biesbroek et al. (2013)). Termeer et al. (2012) use the term institutional weaknesses. De Bruin et al. (2009) assess institutional complexities, while Moser and Ekstrom (2010) and Biesbroek et al. (2011) speak about barriers to climate change adaptation. However, none of those studies specifically focus on the agricultural sector.
While farmers can make decisions regarding crop and farm level adaptation measures directly, they are influenced by the institutional context. Assessing this context allows for a broader picture regarding adaptation to climate change for agriculture. 1.2 Objective and research questions This thesis investigates adaptation measures to climate change for arable farming systems at multiple levels of organization (crop, farm and regional levels) using integrated assessment and a focus on farming systems. The integrated assessment approach includes scenario analysis on the drivers for future changes in agricultural systems; modelling the trade-offs between important farmers’ objectives derived through a participatory process; assessment of adaptation measures in terms of improvement of farming systems performance on the important objectives; and an institutional analysis of the adaptive capacity to climate change.
The overall objective of this thesis is to improve climate change impact and adaptation assessment of agricultural systems by focussing on farm level adaptation and the broader context it is embedded in. This thesis is an interdisciplinary study that assesses not only adaptation to climate change for agricultural systems, but also the context within which climate change adaptation takes place.
The following research questions are linked to the different aspects of integrated assessment of adaptation to climate change and investigated in the thesis:
General Introduction
7
Farm structural change • How to assess future structural change of farms in a region, under different
plausible future scenarios? • What will the farms of the future look like?
Farmers’ multiple objectives • What are the important farmers’ objectives based on what farmers say, do and
want? • How do farmers’ objectives relate to farmers’ currently implemented practices
and to preferred adaptation options? Crop versus farm level adaptation
• What will be the impact of gradual climate change on farm performance? • What will be the impact of the changes in future frequency of extreme events
on farm performance? • How important is crop level adaptation compared to farm level adaptation in
improving farm performance on important objectives in climate change scenarios?
• How do different farmers’ objectives influence preferences for different adaptation measures to climate change?
Institutional context • How to assess the feasibility of implementing adaptation measures from an
institutional perspective? • What are institutional constraints for adaptive capacity to respond to climate
change challenges?
Finally, in the general discussion of the thesis, I address the following questions: • What future images of agriculture in Flevoland are to be identified, given the
findings of this thesis? • What methodological contribution does this thesis provide to climate change
impact and adaptation assessment of agricultural systems? 1.3. Case study The methods developed in this thesis are meant to be generic and not case study specific. I chose to work with the most productive agricultural region in the Netherlands, province Flevoland, with large scale, intensive arable farming as the main type of agricultural activity. Since the agricultural sector is important for the economy of the province, assessment of impacts of and adaptation to climate change in agriculture has a high relevance for this region. Flevoland had already been a hotspot for the research project Klimaat en Landbouw Noord Nederland (Climate and Agriculture in the North of the Netherlands), thus a participatory process was already ongoing and data availability was relatively good. Besides, Flevoland is considered somewhat representative for other productive agricultural regions, especially in Northern Europe.
binnenwerk.indd 7 23-2-2016 21:54:22

Chapter 1
8
Flevoland is the youngest province of the Netherlands, and was formed as a result of reclamation of the former Zuiderzee, later known as IJsselmeer. The first farmers settled in the Northern part of the current province (Noordoostpolder) during WWII. The province was originally designed to serve as an area for optimal agricultural production. High quality soils, good infrastructure, allotment of land (large, rectangular parcels convenient for management) and water availability made it possible to start up large specialized farms. Hence, Flevoland is an area having favourable conditions for agricultural production (Rienks 2009).
Agriculture in Flevoland plays a key role for development and spatial planning. About 75% of the area in the province (89086 ha) is used for agriculture (CBS 2012). Agriculture provides 5.5% of the Gross Regional Product and 6% of employment in Flevoland (in 2012 for the Netherlands these indicators were 1.6% and 2.4%, respectively). The dominating farm type is arable farming which comprises 78% of the total farm population and occupies 70% of utilized agricultural area (CBS 2012). In the past decades the agricultural area has decreased due to urbanization, expansion of infrastructure and natural areas.
Farms in Flevoland have been changing considerably during the last 30 years due to the changing economic and social environment in which they are embedded. A decline in number of farms and increase in farm size has been observed over the past decades. In the period 1980-2010 the number of arable farms decreased by 30%, whereas the average farm area increased by 20% (CBS 2012). 1.4 Thesis outline This thesis is composed of six chapters, including this General Introduction (Chapter 1) and a Synthesis (Chapter 6). Following the aim of the research, the thesis chapters are focussed on the assessment of adaptation to climate change at different levels of organisation (Chapter 4) and on the assessment of the context of adaptation (Chapters 2, 3 and 5) (Figure 1.1).
Chapter 2 defines the context of adaptation to future climate change for arable farming systems by assessing the contribution of different drivers to farm structural change. In the first step current farm types and their distribution were identified using a farm typology. Next, a historical analysis was performed to assess the impact of important drivers (technology, policy, market and climate change) on the farm structure. The outcome of this step was the relative contribution of each driver to the changes in each of the farm structural dimensions (orientation, size, intensity, specialization). In the next step, socio-economic and climate scenarios were downscaled to the regional level to explore effects of changes in the drivers and subsequent changes in farm dimensions and characteristics towards 2050. First, the results on changes in farm dimensions were obtained at regional level. Subsequently, these were downscaled to the farm level using transition rules, resulting in scenarios of farm structural change.
General Introduction
9
Figure 1.1 – Schematic outline of the thesis. Chapter 3 further defines the context of adaptation to climate change and is
focussed on assessment of important objectives of farmers. The procedure to derive importance weights for multiple objectives built upon different methods: interviews with farmers, assessment of current farm performance and preferred adaptation options. This chapter assessed how a farmer’s stated objectives relate to his currently implemented practices and to preferred adaptation options.
Chapter 4 builds on the findings of Chapter 3 and focusses on assessment of adaptation measures at crop and farm level, considering farmer’s multiple objectives. First, the impacts of gradual climate change and extreme events on farm performance were assessed in terms of the most important farmers’ objectives (identified in Chapter 3). Next, the importance of crop and farm level adaptation measures for the improvement of farm performance was assessed considering the objectives. Chapter 4 further analysed whether different prioritizing in terms of objectives could influence preference for different adaptation measures to climate change.
Chapter 5 describes the development of a framework for the assessment of crucial institutional preconditions that facilitate the implementation of adaptation measures to climate change. The Procedure for Institutional Compatibility Assessment (PICA) was adopted and modified. Institutions in the framework are characterized by a set of crucial institutional preconditions (CIPs) and indicators linked to each CIP. CIPs refer to both institutional incentives and constraints for implementation of adaptation measures (here to climate change). Based on information from workshops, interviews and a literature review, a combination of ranking and scoring techniques was applied to assess institutional incentives and constraints for adaptation measures, together indicating the institutional feasibility of implementation of adaptation measures.
binnenwerk.indd 8 23-2-2016 21:54:22

Chapter 1
8
Flevoland is the youngest province of the Netherlands, and was formed as a result of reclamation of the former Zuiderzee, later known as IJsselmeer. The first farmers settled in the Northern part of the current province (Noordoostpolder) during WWII. The province was originally designed to serve as an area for optimal agricultural production. High quality soils, good infrastructure, allotment of land (large, rectangular parcels convenient for management) and water availability made it possible to start up large specialized farms. Hence, Flevoland is an area having favourable conditions for agricultural production (Rienks 2009).
Agriculture in Flevoland plays a key role for development and spatial planning. About 75% of the area in the province (89086 ha) is used for agriculture (CBS 2012). Agriculture provides 5.5% of the Gross Regional Product and 6% of employment in Flevoland (in 2012 for the Netherlands these indicators were 1.6% and 2.4%, respectively). The dominating farm type is arable farming which comprises 78% of the total farm population and occupies 70% of utilized agricultural area (CBS 2012). In the past decades the agricultural area has decreased due to urbanization, expansion of infrastructure and natural areas.
Farms in Flevoland have been changing considerably during the last 30 years due to the changing economic and social environment in which they are embedded. A decline in number of farms and increase in farm size has been observed over the past decades. In the period 1980-2010 the number of arable farms decreased by 30%, whereas the average farm area increased by 20% (CBS 2012). 1.4 Thesis outline This thesis is composed of six chapters, including this General Introduction (Chapter 1) and a Synthesis (Chapter 6). Following the aim of the research, the thesis chapters are focussed on the assessment of adaptation to climate change at different levels of organisation (Chapter 4) and on the assessment of the context of adaptation (Chapters 2, 3 and 5) (Figure 1.1).
Chapter 2 defines the context of adaptation to future climate change for arable farming systems by assessing the contribution of different drivers to farm structural change. In the first step current farm types and their distribution were identified using a farm typology. Next, a historical analysis was performed to assess the impact of important drivers (technology, policy, market and climate change) on the farm structure. The outcome of this step was the relative contribution of each driver to the changes in each of the farm structural dimensions (orientation, size, intensity, specialization). In the next step, socio-economic and climate scenarios were downscaled to the regional level to explore effects of changes in the drivers and subsequent changes in farm dimensions and characteristics towards 2050. First, the results on changes in farm dimensions were obtained at regional level. Subsequently, these were downscaled to the farm level using transition rules, resulting in scenarios of farm structural change.
General Introduction
9
Figure 1.1 – Schematic outline of the thesis. Chapter 3 further defines the context of adaptation to climate change and is
focussed on assessment of important objectives of farmers. The procedure to derive importance weights for multiple objectives built upon different methods: interviews with farmers, assessment of current farm performance and preferred adaptation options. This chapter assessed how a farmer’s stated objectives relate to his currently implemented practices and to preferred adaptation options.
Chapter 4 builds on the findings of Chapter 3 and focusses on assessment of adaptation measures at crop and farm level, considering farmer’s multiple objectives. First, the impacts of gradual climate change and extreme events on farm performance were assessed in terms of the most important farmers’ objectives (identified in Chapter 3). Next, the importance of crop and farm level adaptation measures for the improvement of farm performance was assessed considering the objectives. Chapter 4 further analysed whether different prioritizing in terms of objectives could influence preference for different adaptation measures to climate change.
Chapter 5 describes the development of a framework for the assessment of crucial institutional preconditions that facilitate the implementation of adaptation measures to climate change. The Procedure for Institutional Compatibility Assessment (PICA) was adopted and modified. Institutions in the framework are characterized by a set of crucial institutional preconditions (CIPs) and indicators linked to each CIP. CIPs refer to both institutional incentives and constraints for implementation of adaptation measures (here to climate change). Based on information from workshops, interviews and a literature review, a combination of ranking and scoring techniques was applied to assess institutional incentives and constraints for adaptation measures, together indicating the institutional feasibility of implementation of adaptation measures.
General Introduction
9
Figure 1.1 – Schematic outline of the thesis. Chapter 3 further defines the context of adaptation to climate change and is
focussed on assessment of important objectives of farmers. The procedure to derive importance weights for multiple objectives built upon different methods: interviews with farmers, assessment of current farm performance and preferred adaptation options. This chapter assessed how a farmer’s stated objectives relate to his currently implemented practices and to preferred adaptation options.
Chapter 4 builds on the findings of Chapter 3 and focusses on assessment of adaptation measures at crop and farm level, considering farmer’s multiple objectives. First, the impacts of gradual climate change and extreme events on farm performance were assessed in terms of the most important farmers’ objectives (identified in Chapter 3). Next, the importance of crop and farm level adaptation measures for the improvement of farm performance was assessed considering the objectives. Chapter 4 further analysed whether different prioritizing in terms of objectives could influence preference for different adaptation measures to climate change.
Chapter 5 describes the development of a framework for the assessment of crucial institutional preconditions that facilitate the implementation of adaptation measures to climate change. The Procedure for Institutional Compatibility Assessment (PICA) was adopted and modified. Institutions in the framework are characterized by a set of crucial institutional preconditions (CIPs) and indicators linked to each CIP. CIPs refer to both institutional incentives and constraints for implementation of adaptation measures (here to climate change). Based on information from workshops, interviews and a literature review, a combination of ranking and scoring techniques was applied to assess institutional incentives and constraints for adaptation measures, together indicating the institutional feasibility of implementation of adaptation measures.
binnenwerk.indd 9 23-2-2016 21:54:25

Chapter 1
10
Chapter 6 synthesizes the preceding chapters by presenting images of the future of agriculture in Flevoland under contrasting socio-economic and climate scenarios with the focus on climate change adaptation. The contribution of the thesis to the current research on impacts and adaptation to climate change in agriculture is discussed, and conclusions are drawn.
Chapter 2
Scenarios of long term farm structural change for application in climate change impact assessment
Abstract Towards 2050, climate change is one of the possible drivers that will change the farming landscape, but market, policy and technological development may be at least equally important. In the last decade, many studies assessed impacts of climate change and specific adaptation strategies. However, adaptation to climate change must be considered in the context of other driving forces that will cause farms of the future to look differently from today’s farms. In this Chapter we use a historical analysis of the influence of different drivers on farm structure, complemented with literature and stakeholder consultations, to assess future structural change of farms in a region under different plausible futures. As climate change is one of the drivers considered, this Chapter thus puts climate change impact and adaptation into the context of other drivers. The province of Flevoland in the North of the Netherlands was used as case study, with arable farming as the main activity. To account for the heterogeneity of farms and to indicate possible directions of farm structural change, a farm typology was developed. Trends in past developments in farm types were analyzed with data from the Dutch agricultural census. The historical analysis allowed to detect the relative importance of driving forces that contributed to farm structural changes. Simultaneously, scenario assumptions about changes in these driving forces elaborated at global and European levels, were downscaled for Flevoland, to regional and farm type level in order to project impacts of drivers on farm structural change towards 2050. Input from stakeholders was also used to detail the downscaled scenarios and to derive historical and future relationships between drivers and farm structural change. These downscaled scenarios and future driver-farm structural change relationships were used to derive quantitative estimations of farm structural change at regional and farm type level in Flevoland. In addition, stakeholder input was used to also derive images of future farms in Flevoland. The estimated farm structural changes differed substantially between the two scenarios. Our estimations of farm structural change provide a proper context for assessing impacts of and adaptation to climate change in 2050 at crop and farm level. Keywords: Agriculture, adaptation, climate change, farm structural change, Flevoland
This chapter has been published as: Mandryk M, Reidsma P, van Ittersum M (2012) Scenarios of long-term farm structural change for application in climate change impact assessment. Landscape Ecology 27 (4):509-527.
binnenwerk.indd 10 23-2-2016 21:54:25
Chapter 1
10
Chapter 6 synthesizes the preceding chapters by presenting images of the future of agriculture in Flevoland under contrasting socio-economic and climate scenarios with the focus on climate change adaptation. The contribution of the thesis to the current research on impacts and adaptation to climate change in agriculture is discussed, and conclusions are drawn.
Chapter 2
Scenarios of long term farm structural change for application in climate change impact assessment
Abstract Towards 2050, climate change is one of the possible drivers that will change the farming landscape, but market, policy and technological development may be at least equally important. In the last decade, many studies assessed impacts of climate change and specific adaptation strategies. However, adaptation to climate change must be considered in the context of other driving forces that will cause farms of the future to look differently from today’s farms. In this Chapter we use a historical analysis of the influence of different drivers on farm structure, complemented with literature and stakeholder consultations, to assess future structural change of farms in a region under different plausible futures. As climate change is one of the drivers considered, this Chapter thus puts climate change impact and adaptation into the context of other drivers. The province of Flevoland in the North of the Netherlands was used as case study, with arable farming as the main activity. To account for the heterogeneity of farms and to indicate possible directions of farm structural change, a farm typology was developed. Trends in past developments in farm types were analyzed with data from the Dutch agricultural census. The historical analysis allowed to detect the relative importance of driving forces that contributed to farm structural changes. Simultaneously, scenario assumptions about changes in these driving forces elaborated at global and European levels, were downscaled for Flevoland, to regional and farm type level in order to project impacts of drivers on farm structural change towards 2050. Input from stakeholders was also used to detail the downscaled scenarios and to derive historical and future relationships between drivers and farm structural change. These downscaled scenarios and future driver-farm structural change relationships were used to derive quantitative estimations of farm structural change at regional and farm type level in Flevoland. In addition, stakeholder input was used to also derive images of future farms in Flevoland. The estimated farm structural changes differed substantially between the two scenarios. Our estimations of farm structural change provide a proper context for assessing impacts of and adaptation to climate change in 2050 at crop and farm level. Keywords: Agriculture, adaptation, climate change, farm structural change, Flevoland
This chapter has been published as: Mandryk M, Reidsma P, van Ittersum M (2012) Scenarios of long-term farm structural change for application in climate change impact assessment. Landscape Ecology 27 (4):509-527.
binnenwerk.indd 11 23-2-2016 21:54:25

Chapter 2
12
2.1 Introduction Globally, climate change became an important issue during the last decades. In many regions in the world one can observe effects of the changes in climatic conditions or climate variability on crop productivity, farmers’ income and land use (Berry et al. 2006; Bindi and Olesen 2010; Bradshaw et al. 2004; Olesen and Bindi 2002; Reidsma et al. 2009). Also for the future of agriculture in a temperate zone such as The Netherlands the potential importance of climate change cannot be ignored, especially regarding effects of weather extremes (Bresser 2005; Peltonen-Sainio et al. 2010; Schaap et al. 2011; van Dorland 2008). However, changes in agricultural policy setting, market responses and technological development were shown to be at least equally important drivers of change for agriculture (Hermans et al. 2010). Due to the impact of these drivers, farms in The Netherlands have been changing considerably since World War II (Meerburg et al. 2009). Those changes affected not only the numbers of farms, but also accounted for new farm types through structural changes. Structural changes fall into the category of strategic (medium to long-term) investment decisions to fundamentally change farm size, specialization or production intensity (Zimmermann et al. 2009).
Impacts of future climate change are usually projected on current farms and cropping systems (Porter et al. 2014). Since the impacts of climate change will be relatively minor in the short term, assessments must be performed for a long time horizon (2050 in present study), when climate change will likely be more manifest. For such time horizon effects of other drivers must be considered. At the same time, assessments of impacts and adaptation strategies have focused primarily on food production (Porter et al. 2014), while in The Netherlands and Europe as a whole, multifunctionality has become more important. Effective adaptation strategies thus need to consider additional economic, social and environmental objectives, associated with the multifunctionality of agriculture. Therefore, one has to take into account that the farms in the future are not the same as the current ones: they will evolve through structural changes.
The most common quantitative method to study farm structural change is using econometric models, as shown in the review by Zimmermann et al. (2009), or agent-based models as applied by Piorr et al. (2009). However, nearly all of the past studies had short time horizons. Econometric models have been used to assess farm structural change due to climate change on the long term (e.g. Seo et al. 2010), but using the assumption that farmers are profit maximizers, has been disputed by Rufino et al. (2011). Furthermore, a long time horizon brings many uncertainties as to how future farm development will unfold in the context of multiple drivers of change acting at different levels. Agent-based models may provide a more realistic approach, but also in these models decisions are often based on profit maximization (Piorr et al. 2009). Valbuena et al. (2010) developed rules reflecting current farmers’ behavior, but their study focused on specific decisions. Generally, when dealing with a long time horizon,
Farm structural change
13
these models cannot be used. A scenario approach is needed that can deal with both qualitative and quantitative information.
Hierarchical scenario development to arrive at scenarios at regional level has been performed in many studies (Abildtrup et al. 2006; Audsley et al. 2006; Dockerty et al. 2006; Rounsevell et al. 2003; Vandermeulen et al. 2009). These studies, however, focused on modeling spatial distribution of agricultural land use at regional and EU scale under global environmental (climate) change and policy drivers and did not consider farm structural changes induced by these drivers. Reidsma et al. (2006) made an attempt to project changes in intensity of farm types in order to assess changes in agricultural biodiversity, but this study lacked other farm structural characteristics besides intensity. Development of hierarchically consistent scenarios of farm structural change at farm and regional level defined by plausible directions of change in climate and socio-economic developments has not been performed previously. We need these scenarios to put climate change impacts into context of other drivers of change and to assess the impacts of more specific crop and farm level adaptation strategies to climate change in the long term. The aim of this paper is therefore to assess future structural change of farms in a region, under different plausible future scenarios.
The province of Flevoland in the Netherlands with large scale, intensive arable farming as the main type of agricultural activity has been chosen as a case study for the scenario development of farm structural change towards 2050. 2.2 Materials and Methods 2.2.1 Case study Flevoland is the youngest province of the Netherlands, and was formed as a result of reclamation of the former Zuiderzee later known as IJsselmeer. The first farmers settled in the Northern part of the current province (Noordoostpolder) during WWII. The province was originally designed to serve as an area for optimal agricultural production. High quality soils, good infrastructure, allotment of land (large, rectangular parcels convenient for management) and water availability made it possible for starting up large specialized farms. Hence, Flevoland is an area having favourable conditions for agricultural production (Rienks 2009).
Agriculture in Flevoland plays a key role for development and spatial planning. About 75% of the area in the province (90820 ha) is used for agriculture (CBS 2009). Agriculture provides 5.5% of the Gross Regional Product and 6% of employment in Flevoland (in 2007 for the Netherlands these indicators were 1.8% and 3%, respectively). The dominating farm type is arable farming which comprises 70% of the total farm population and occupies 65% of utilized agricultural area (CBS 2009). In the past decades the agricultural area has decreased due to urbanization, expansion of infrastructure and natural areas.
Farms in Flevoland have been changing considerably during the last 30 years due to the changing economic and social environment in which they are embedded. We
binnenwerk.indd 12 23-2-2016 21:54:25

Chapter 2
12
2.1 Introduction Globally, climate change became an important issue during the last decades. In many regions in the world one can observe effects of the changes in climatic conditions or climate variability on crop productivity, farmers’ income and land use (Berry et al. 2006; Bindi and Olesen 2010; Bradshaw et al. 2004; Olesen and Bindi 2002; Reidsma et al. 2009). Also for the future of agriculture in a temperate zone such as The Netherlands the potential importance of climate change cannot be ignored, especially regarding effects of weather extremes (Bresser 2005; Peltonen-Sainio et al. 2010; Schaap et al. 2011; van Dorland 2008). However, changes in agricultural policy setting, market responses and technological development were shown to be at least equally important drivers of change for agriculture (Hermans et al. 2010). Due to the impact of these drivers, farms in The Netherlands have been changing considerably since World War II (Meerburg et al. 2009). Those changes affected not only the numbers of farms, but also accounted for new farm types through structural changes. Structural changes fall into the category of strategic (medium to long-term) investment decisions to fundamentally change farm size, specialization or production intensity (Zimmermann et al. 2009).
Impacts of future climate change are usually projected on current farms and cropping systems (Porter et al. 2014). Since the impacts of climate change will be relatively minor in the short term, assessments must be performed for a long time horizon (2050 in present study), when climate change will likely be more manifest. For such time horizon effects of other drivers must be considered. At the same time, assessments of impacts and adaptation strategies have focused primarily on food production (Porter et al. 2014), while in The Netherlands and Europe as a whole, multifunctionality has become more important. Effective adaptation strategies thus need to consider additional economic, social and environmental objectives, associated with the multifunctionality of agriculture. Therefore, one has to take into account that the farms in the future are not the same as the current ones: they will evolve through structural changes.
The most common quantitative method to study farm structural change is using econometric models, as shown in the review by Zimmermann et al. (2009), or agent-based models as applied by Piorr et al. (2009). However, nearly all of the past studies had short time horizons. Econometric models have been used to assess farm structural change due to climate change on the long term (e.g. Seo et al. 2010), but using the assumption that farmers are profit maximizers, has been disputed by Rufino et al. (2011). Furthermore, a long time horizon brings many uncertainties as to how future farm development will unfold in the context of multiple drivers of change acting at different levels. Agent-based models may provide a more realistic approach, but also in these models decisions are often based on profit maximization (Piorr et al. 2009). Valbuena et al. (2010) developed rules reflecting current farmers’ behavior, but their study focused on specific decisions. Generally, when dealing with a long time horizon,
Farm structural change
13
these models cannot be used. A scenario approach is needed that can deal with both qualitative and quantitative information.
Hierarchical scenario development to arrive at scenarios at regional level has been performed in many studies (Abildtrup et al. 2006; Audsley et al. 2006; Dockerty et al. 2006; Rounsevell et al. 2003; Vandermeulen et al. 2009). These studies, however, focused on modeling spatial distribution of agricultural land use at regional and EU scale under global environmental (climate) change and policy drivers and did not consider farm structural changes induced by these drivers. Reidsma et al. (2006) made an attempt to project changes in intensity of farm types in order to assess changes in agricultural biodiversity, but this study lacked other farm structural characteristics besides intensity. Development of hierarchically consistent scenarios of farm structural change at farm and regional level defined by plausible directions of change in climate and socio-economic developments has not been performed previously. We need these scenarios to put climate change impacts into context of other drivers of change and to assess the impacts of more specific crop and farm level adaptation strategies to climate change in the long term. The aim of this paper is therefore to assess future structural change of farms in a region, under different plausible future scenarios.
The province of Flevoland in the Netherlands with large scale, intensive arable farming as the main type of agricultural activity has been chosen as a case study for the scenario development of farm structural change towards 2050. 2.2 Materials and Methods 2.2.1 Case study Flevoland is the youngest province of the Netherlands, and was formed as a result of reclamation of the former Zuiderzee later known as IJsselmeer. The first farmers settled in the Northern part of the current province (Noordoostpolder) during WWII. The province was originally designed to serve as an area for optimal agricultural production. High quality soils, good infrastructure, allotment of land (large, rectangular parcels convenient for management) and water availability made it possible for starting up large specialized farms. Hence, Flevoland is an area having favourable conditions for agricultural production (Rienks 2009).
Agriculture in Flevoland plays a key role for development and spatial planning. About 75% of the area in the province (90820 ha) is used for agriculture (CBS 2009). Agriculture provides 5.5% of the Gross Regional Product and 6% of employment in Flevoland (in 2007 for the Netherlands these indicators were 1.8% and 3%, respectively). The dominating farm type is arable farming which comprises 70% of the total farm population and occupies 65% of utilized agricultural area (CBS 2009). In the past decades the agricultural area has decreased due to urbanization, expansion of infrastructure and natural areas.
Farms in Flevoland have been changing considerably during the last 30 years due to the changing economic and social environment in which they are embedded. We
binnenwerk.indd 13 23-2-2016 21:54:25
Chapter 2
14
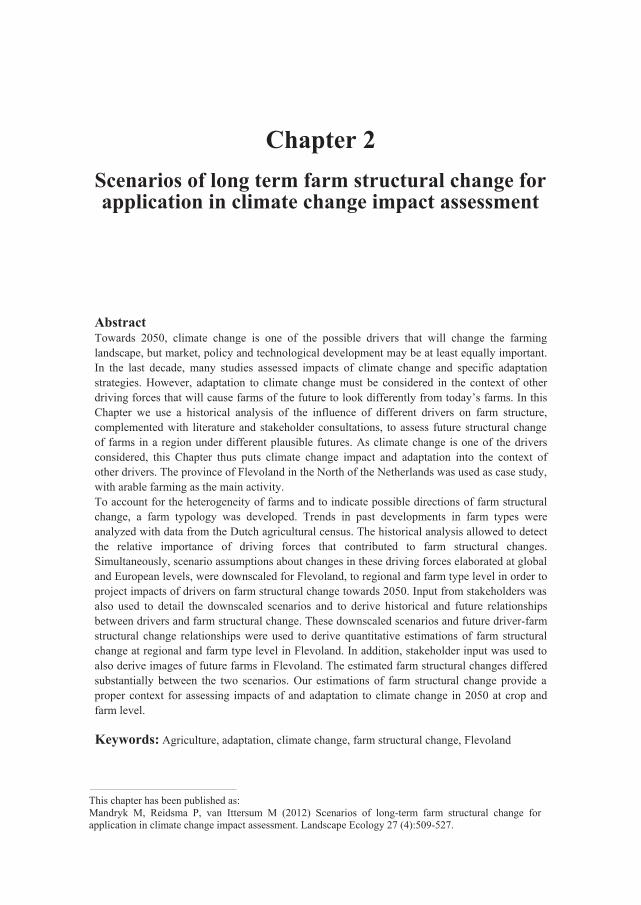
observe a decline in number of farms and increase in farm size over the past decades (Figure 2.1). In the period 1980-2010 the number of arable farms decreased by 30%, whereas the average farm area increased by 20% (CBS 2009). 2.2.2 General procedure The procedure to assess structural change of farms for 2050 includes several steps (Figure 2.2). In the first step we identified current farm types and their distribution using a farm typology. In the second step, a historical analysis was performed to assess the impact of important drivers (technology, policy, market and climate change) on the farm structure. The outcome of this step is the relative contribution of each driver to the changes in each of the farm structural dimensions (orientation, size, intensity, specialization). In the next step, socio-economic and climate scenarios were downscaled to the regional level to explore effects of changes in the drivers and subsequent changes in farm dimensions and characteristics towards 2050. We first obtained the results on changes in farm dimensions at regional level. Subsequently, we downscaled these to the farm level using transition rules, resulting in scenarios of farm structural change. a) b)
Figure 2.1 – Dynamics in a) farm population in Flevoland in 1980-2008; b) average area of arable farms in Flevoland in 1980-2008. Source: CBS. 2.2.3 Stakeholder input To develop images on future farms in Flevoland, besides data and literature, we additionally used information from stakeholders (farmers, representatives of water boards, local policy makers). The stakeholder workshop was organized in the study area on the 1st of March 2010. The participants of the workshop contributed to the assessment of historical relationships between drivers and farm structural dimensions and to projections on future impacts of drivers on farm structural change in the scenarios. Their input was also used to derive images of future farms for the two scenarios.
Farm structural change
15
Figure 2.2 – Overview of the methodological approach to assess farm structural change. Abbreviations are explained in the text. 2.2.4 Classification farm types in 2008 To capture the variability in arable farming systems in Flevoland and their structural change in the future, the farm typology for farms in the European Union proposed by Andersen et al. (2007) was further specified for the region. The typology is based on the combination of four dimensions of which size, intensity, and specialization are similar to Andersen et al. Orientation (see below) was added as an extra dimension as it influences decision making of farmers and the landscape. An overview of the typology including thresholds for the dimensions is provided in Table 1.1.
The units of the dimensions of size, intensity and specialization and their thresholds are taken from the Dutch agricultural census. Farm size refers to the economic size of an agricultural holding and is measured in NGE. In 2008 1 NGE equaled to € 1420. It is a Dutch version of the European Size Unit (ESU), used to measure farm size across the EU and record it in FADN (Farm Accountancy Data Network). Intensity is measured in NGE per ha and thus refers to output intensity. Specialization is defined by the crops with the highest share in the standard gross margin (SGM) grown on a farm. Orientation was identified through the share of output from non-agricultural activities. We hypothesize that farms having different orientations adopt different adaptation measures when confronted with external
b)a)
Chapter 2
14
observe a decline in number of farms and increase in farm size over the past decades (Figure 2.1). In the period 1980-2010 the number of arable farms decreased by 30%, whereas the average farm area increased by 20% (CBS 2009). 2.2.2 General procedure The procedure to assess structural change of farms for 2050 includes several steps (Figure 2.2). In the first step we identified current farm types and their distribution using a farm typology. In the second step, a historical analysis was performed to assess the impact of important drivers (technology, policy, market and climate change) on the farm structure. The outcome of this step is the relative contribution of each driver to the changes in each of the farm structural dimensions (orientation, size, intensity, specialization). In the next step, socio-economic and climate scenarios were downscaled to the regional level to explore effects of changes in the drivers and subsequent changes in farm dimensions and characteristics towards 2050. We first obtained the results on changes in farm dimensions at regional level. Subsequently, we downscaled these to the farm level using transition rules, resulting in scenarios of farm structural change. a) b)
Figure 2.1 – Dynamics in a) farm population in Flevoland in 1980-2008; b) average area of arable farms in Flevoland in 1980-2008. Source: CBS. 2.2.3 Stakeholder input To develop images on future farms in Flevoland, besides data and literature, we additionally used information from stakeholders (farmers, representatives of water boards, local policy makers). The stakeholder workshop was organized in the study area on the 1st of March 2010. The participants of the workshop contributed to the assessment of historical relationships between drivers and farm structural dimensions and to projections on future impacts of drivers on farm structural change in the scenarios. Their input was also used to derive images of future farms for the two scenarios.
Farm structural change
15
Figure 2.2 – Overview of the methodological approach to assess farm structural change. Abbreviations are explained in the text. 2.2.4 Classification farm types in 2008 To capture the variability in arable farming systems in Flevoland and their structural change in the future, the farm typology for farms in the European Union proposed by Andersen et al. (2007) was further specified for the region. The typology is based on the combination of four dimensions of which size, intensity, and specialization are similar to Andersen et al. Orientation (see below) was added as an extra dimension as it influences decision making of farmers and the landscape. An overview of the typology including thresholds for the dimensions is provided in Table 1.1.
The units of the dimensions of size, intensity and specialization and their thresholds are taken from the Dutch agricultural census. Farm size refers to the economic size of an agricultural holding and is measured in NGE. In 2008 1 NGE equaled to € 1420. It is a Dutch version of the European Size Unit (ESU), used to measure farm size across the EU and record it in FADN (Farm Accountancy Data Network). Intensity is measured in NGE per ha and thus refers to output intensity. Specialization is defined by the crops with the highest share in the standard gross margin (SGM) grown on a farm. Orientation was identified through the share of output from non-agricultural activities. We hypothesize that farms having different orientations adopt different adaptation measures when confronted with external
binnenwerk.indd 14 23-2-2016 21:54:27

Chapter 2
14
observe a decline in number of farms and increase in farm size over the past decades (Figure 2.1). In the period 1980-2010 the number of arable farms decreased by 30%, whereas the average farm area increased by 20% (CBS 2009). 2.2.2 General procedure The procedure to assess structural change of farms for 2050 includes several steps (Figure 2.2). In the first step we identified current farm types and their distribution using a farm typology. In the second step, a historical analysis was performed to assess the impact of important drivers (technology, policy, market and climate change) on the farm structure. The outcome of this step is the relative contribution of each driver to the changes in each of the farm structural dimensions (orientation, size, intensity, specialization). In the next step, socio-economic and climate scenarios were downscaled to the regional level to explore effects of changes in the drivers and subsequent changes in farm dimensions and characteristics towards 2050. We first obtained the results on changes in farm dimensions at regional level. Subsequently, we downscaled these to the farm level using transition rules, resulting in scenarios of farm structural change. a) b)
Figure 2.1 – Dynamics in a) farm population in Flevoland in 1980-2008; b) average area of arable farms in Flevoland in 1980-2008. Source: CBS. 2.2.3 Stakeholder input To develop images on future farms in Flevoland, besides data and literature, we additionally used information from stakeholders (farmers, representatives of water boards, local policy makers). The stakeholder workshop was organized in the study area on the 1st of March 2010. The participants of the workshop contributed to the assessment of historical relationships between drivers and farm structural dimensions and to projections on future impacts of drivers on farm structural change in the scenarios. Their input was also used to derive images of future farms for the two scenarios.
Farm structural change
15
Figure 2.2 – Overview of the methodological approach to assess farm structural change. Abbreviations are explained in the text. 2.2.4 Classification farm types in 2008 To capture the variability in arable farming systems in Flevoland and their structural change in the future, the farm typology for farms in the European Union proposed by Andersen et al. (2007) was further specified for the region. The typology is based on the combination of four dimensions of which size, intensity, and specialization are similar to Andersen et al. Orientation (see below) was added as an extra dimension as it influences decision making of farmers and the landscape. An overview of the typology including thresholds for the dimensions is provided in Table 1.1.
The units of the dimensions of size, intensity and specialization and their thresholds are taken from the Dutch agricultural census. Farm size refers to the economic size of an agricultural holding and is measured in NGE. In 2008 1 NGE equaled to € 1420. It is a Dutch version of the European Size Unit (ESU), used to measure farm size across the EU and record it in FADN (Farm Accountancy Data Network). Intensity is measured in NGE per ha and thus refers to output intensity. Specialization is defined by the crops with the highest share in the standard gross margin (SGM) grown on a farm. Orientation was identified through the share of output from non-agricultural activities. We hypothesize that farms having different orientations adopt different adaptation measures when confronted with external
binnenwerk.indd 15 23-2-2016 21:54:30

Chapter 2
16
changes, since orientation can point at farmers’ objectives, or farming styles as defined by van der Ploeg et al. (2009). We distinguish three farm types based on their major objectives, or orientations: production-oriented, entrepreneur-oriented and nature conservation-oriented. These farm categories are recognized by Dutch policy makers (Dokter and Oppewal 2009; Jongeneel et al. 2008; Venema et al. 2009). To account for other functions agriculture can provide to a society, an entrepreneur-oriented type of farmers was included into the typology. These farmers diversify their income with alternative societal functions of agriculture: sustainable energy production, housing goods or animals (garaging), processing of agricultural products, recreation, education and care farming. Nature conservation farmers represent a separate orientation due to the significant role nature conservation plays in Dutch agriculture (Daniel and Perraud 2009). For assigning all individual farms to the farm typology the Geographical Information System for Agricultural Businesses (GIAB) was used, containing all 1114 arable farms in Flevoland for the year 2008. Table 2.1 – Farm typology (dimensions and thresholds) used in the research. Each farm type is defined by a size, intensity, specialization and orientation dimension.
Dimension Division/Class Thresholds/Description
Size (NGE1) Small Medium Large Extra large
<20 20-70 70-150 >150
Intensity (NGE/ha) Low Medium High
<1.3 1.4-2.0 >2.1
Specialization
Specialized root crops Specialized flower bulbs Specialized vegetables Diverse mainly root crops Diverse arable
sugar beets and potato > 2/3 SGM2 flower bulb > 2/3 SGM vegetables > 2/3 SGM 1/3 < sugar beets and potato< = 2/3 SGMand cereals, maize, peas, rapeseed, sunflower, natural area AND vegetables > 2/3 SGM all arable > 2/3 SGM
Orientation
Production
Entrepreneur Nature conservation
no multifunctional activities or <= 10% output from 1 multifunctional activity > 10-50% output from multifunctional activities OR <10% + minimum 2 different activities farmer participates in nature conservation
1 NGE is a national size unit, representing gross income from cultivation of a certain crop or from keeping a certain animal (CBS 2008), equaling 1420 € in 2008. 2 SGM is a standard gross margin of a crop.
Farm structural change
17
2.2.5 Historical trend analysis In our research we considered four major drivers for farm structural change in the future. Literature and historical data analysis showed that farm structural change is mainly influenced by technological progress, policy intervention and market developments (Koomen et al. 2005; Meerburg et al. 2009; van Bruchem and Silvis 2008). As the aim of this paper is to put climate change impacts into context, for further investigation we chose as drivers technology, policy, market, and climate change.
We first performed historical trend analyses for all typology dimensions (orientation, economic size, intensity, and specialization) to observe the dynamics in structural change. Secondly, historical trend analyses were performed for the drivers, and lastly the relationships between dimensions and drivers were analysed. The major data source for the historical analysis was the Dutch agricultural census accessed through Statistics Netherlands (CBS). These data provide the following information for agricultural development in Flevoland and the Netherlands over the period 1986-2008: total number of farms per year and average values for economic size and area of arable farms, area of most important crops, and dynamics in yields and prices. The data on multifunctional activities (number of farms implementing the activities, types of activities and percentage of total economic output from these activities) were available since 2003. However, these data were not complete and consistent. This is mostly attributed to the procedure the data have been collected: there are different data sources and different definitions of multifunctional activities (Roest et al. 2010). Additional data at farm level were obtained through a sample of individual farms (on average, 25 observations for Flevoland and 165 for the Netherlands per year) from the Dutch FADN for the period 2001-2008. The information in the dataset included farm management (e.g. costs of fertilizer), farm structural (e.g. farm size) and additional characteristics (e.g. total subsidies).
Changes in values of each of the dimensions over time were assessed through selected indicators. For size and intensity these were the same as used for the farm typology (Table 1.1), but for the categorical dimensions, numerical variables needed to be selected. For specialization we selected area of root crops, flower bulbs, and vegetables (% in total arable and non-greenhouse horticultural land); and for orientation: the share of non-agricultural output (% from total economic output). For farm size additionally we considered the farm size in ha.
Indicators were also assigned to drivers, to study the impact of each driver on farm structural change. The indicators were selected on the basis of similar studies that were investigating impacts of certain drivers on farm level responses (e.g. Reidsma et al. 2010). For technology we used variable input costs for cultivating 1 ha of ware potato (€/ha) and winter wheat (€/ha); for policy: total subsidies (€/ha); for market: prices for ware potato (€/100 kg) and winter wheat (€/100kg); for climate: minimum and maximum annual temperature (°C).
binnenwerk.indd 16 23-2-2016 21:54:31

Chapter 2
16
changes, since orientation can point at farmers’ objectives, or farming styles as defined by van der Ploeg et al. (2009). We distinguish three farm types based on their major objectives, or orientations: production-oriented, entrepreneur-oriented and nature conservation-oriented. These farm categories are recognized by Dutch policy makers (Dokter and Oppewal 2009; Jongeneel et al. 2008; Venema et al. 2009). To account for other functions agriculture can provide to a society, an entrepreneur-oriented type of farmers was included into the typology. These farmers diversify their income with alternative societal functions of agriculture: sustainable energy production, housing goods or animals (garaging), processing of agricultural products, recreation, education and care farming. Nature conservation farmers represent a separate orientation due to the significant role nature conservation plays in Dutch agriculture (Daniel and Perraud 2009). For assigning all individual farms to the farm typology the Geographical Information System for Agricultural Businesses (GIAB) was used, containing all 1114 arable farms in Flevoland for the year 2008. Table 2.1 – Farm typology (dimensions and thresholds) used in the research. Each farm type is defined by a size, intensity, specialization and orientation dimension.
Dimension Division/Class Thresholds/Description
Size (NGE1) Small Medium Large Extra large
<20 20-70 70-150 >150
Intensity (NGE/ha) Low Medium High
<1.3 1.4-2.0 >2.1
Specialization
Specialized root crops Specialized flower bulbs Specialized vegetables Diverse mainly root crops Diverse arable
sugar beets and potato > 2/3 SGM2 flower bulb > 2/3 SGM vegetables > 2/3 SGM 1/3 < sugar beets and potato< = 2/3 SGMand cereals, maize, peas, rapeseed, sunflower, natural area AND vegetables > 2/3 SGM all arable > 2/3 SGM
Orientation
Production
Entrepreneur Nature conservation
no multifunctional activities or <= 10% output from 1 multifunctional activity > 10-50% output from multifunctional activities OR <10% + minimum 2 different activities farmer participates in nature conservation
1 NGE is a national size unit, representing gross income from cultivation of a certain crop or from keeping a certain animal (CBS 2008), equaling 1420 € in 2008. 2 SGM is a standard gross margin of a crop.
Farm structural change
17
2.2.5 Historical trend analysis In our research we considered four major drivers for farm structural change in the future. Literature and historical data analysis showed that farm structural change is mainly influenced by technological progress, policy intervention and market developments (Koomen et al. 2005; Meerburg et al. 2009; van Bruchem and Silvis 2008). As the aim of this paper is to put climate change impacts into context, for further investigation we chose as drivers technology, policy, market, and climate change.
We first performed historical trend analyses for all typology dimensions (orientation, economic size, intensity, and specialization) to observe the dynamics in structural change. Secondly, historical trend analyses were performed for the drivers, and lastly the relationships between dimensions and drivers were analysed. The major data source for the historical analysis was the Dutch agricultural census accessed through Statistics Netherlands (CBS). These data provide the following information for agricultural development in Flevoland and the Netherlands over the period 1986-2008: total number of farms per year and average values for economic size and area of arable farms, area of most important crops, and dynamics in yields and prices. The data on multifunctional activities (number of farms implementing the activities, types of activities and percentage of total economic output from these activities) were available since 2003. However, these data were not complete and consistent. This is mostly attributed to the procedure the data have been collected: there are different data sources and different definitions of multifunctional activities (Roest et al. 2010). Additional data at farm level were obtained through a sample of individual farms (on average, 25 observations for Flevoland and 165 for the Netherlands per year) from the Dutch FADN for the period 2001-2008. The information in the dataset included farm management (e.g. costs of fertilizer), farm structural (e.g. farm size) and additional characteristics (e.g. total subsidies).
Changes in values of each of the dimensions over time were assessed through selected indicators. For size and intensity these were the same as used for the farm typology (Table 1.1), but for the categorical dimensions, numerical variables needed to be selected. For specialization we selected area of root crops, flower bulbs, and vegetables (% in total arable and non-greenhouse horticultural land); and for orientation: the share of non-agricultural output (% from total economic output). For farm size additionally we considered the farm size in ha.
Indicators were also assigned to drivers, to study the impact of each driver on farm structural change. The indicators were selected on the basis of similar studies that were investigating impacts of certain drivers on farm level responses (e.g. Reidsma et al. 2010). For technology we used variable input costs for cultivating 1 ha of ware potato (€/ha) and winter wheat (€/ha); for policy: total subsidies (€/ha); for market: prices for ware potato (€/100 kg) and winter wheat (€/100kg); for climate: minimum and maximum annual temperature (°C).
binnenwerk.indd 17 23-2-2016 21:54:31
Chapter 2
18
The relation between each driver and dimension was investigated based on i) correlation and regression analysis using regional level data from 1986-2008 (CBS); ii) correlation and regression analysis using farm level data from 2008 (FADN); iii) literature review on the contribution of each driver to the change in each dimension (Smit 2004; van Bruchem and Silvis 2008); iv) stakeholder workshop. The four methods mentioned above give qualitative (literature review and stakeholder workshop) and quantitative (statistical analyses) results on the contribution of each driver to the change in each dimension. Consequently, all four methods are considered to assess the relation between the driver and dimension: i) no significant impact on structural change; ii) impact on structural change; iii) strong impact on structural change. 2.2.6 Assessing future farm structural change Scenarios We used two plausible contrasting scenarios regarding future climate and socio-economic change to assess future farm structural change. For assessing impacts of climate change towards 2050 we used scenarios from the Royal Dutch Meteorology Institute (KNMI) (van den Hurk et al. 2006). The G climate scenario assumes a moderate temperature increase of 1°C by 2050, whereas the W scenario assumes a significant temperature increase of 2°C by 2050. To account for possible future trends in socio-economic developments, we used scenarios A1 Global Economy and B2 Regional Communities from the commonly used Dutch WLO scenarios (van Drunen and Berkhout, 2008). These scenarios are adapted from Westhoek et al. (2006) for the situation in the Netherlands, and are similar to the IPCC SRES scenarios (Nakicenovic and Swart 2000). Following suggestions of Henseler et al. (2009) we assume that the more economically and globally oriented A1 scenario goes with a significant temperature increase of 2°C by 2050, i.e. the W scenario. The more environmentally and regionally oriented B2 scenario is assumed to match with a moderate temperature increase of 1°C by 2050 represented by the G scenario. These combined scenarios were used by Riedijk et al. (2007) to assess future land use in Flevoland for the year 2040. We extrapolated their results on total arable land towards 2050 and used these in our study. Drivers at regional level Per scenario, we analyzed possible developments in drivers impacting structural change. We used the same indicators for drivers as in the historical trend analysis. Applying scenario assumptions on changes in technology, policy, market and climate (Table 2.2) we projected the impact of two scenarios on the indicators for these drivers.
Farm structural change
19
Table 2.2 – Assumptions on development of drivers and dimensions per scenario. Driver Indicators A1 B2 Source Technology Policy Market Climate change
Total costs Subsidies Price wheat Price potato Temperature
Continuation of historical trend No crop subsidies and price support +68 % increase +15% increase +2 °C increase
25% of continuation of historical trend Subsidies for environmental and social services -11% decrease +5% increase +1 °C increase
Own assumption based on Ewert et al. (2005),1
European Commission (2010) Ewert et al. (2011) KNMI scenarios (van der Hurk et al. 2007)
Dimension Size Intensity Specialization Orientation2
NGE & ha NGE/ha Crop areas Nature Enterpreneur
Continuation of historical trend Depends on changes in size and specialization Continuation of historical trend 0% 30%
25% of continuation of historical trend No increase possible 25% of continuation of historical trend For both: all farms that can increase their income with multifunctional activities
Own assumption based on Abildtrup et al. (2006) and Janssen et al. (2006) Own assumption based on Janssen et al. (2006) Own assumption based on Janssen et al. (2006) Own assumptions and stakeholder consultations
1 Estimations in Ewert et al. (2005) referred to technology development represented by yield changes. In B2 yield changes were assumed to remain stable. We assume a slight increase in total costs, considering the development of clean and energy saving technology. 2 Too few data were available to extrapolate. These general assumptions are further detailed in the downscaling to farm level.
Developments in technology will be of a different nature in the two scenarios. While in A1 technological progress will be related to further increase crop productivity accompanied with necessary intensification of production, in B2 the focus will be on clean and energy saving technology, which does not necessarily lead to higher production intensity. The Common Agricultural Policy (CAP) is assumed to develop differently in A1 and B2. In A1 we assume adoption of option 3 proposed by the European Commission (EC) in November 2010, which implies abolishment of direct payments and introduction of small payments for environmental public goods. In B2 we see the CAP to be similar to option 1 as proposed by the EC: maintaining levels of payments for social and environmental services. Future market developments in these scenarios are assessed through changes in prices for agricultural commodities using the CAPRI model (Britz 2005; Ewert et al. 2011). The simulated price scenarios comprise changes on the supply side (yield changes due to climate change and technological development) as well as on the demand side (population and GDP). While in A1 there will be considerable increase in prices for wheat and ware potato
binnenwerk.indd 18 23-2-2016 21:54:31

Chapter 2
18
The relation between each driver and dimension was investigated based on i) correlation and regression analysis using regional level data from 1986-2008 (CBS); ii) correlation and regression analysis using farm level data from 2008 (FADN); iii) literature review on the contribution of each driver to the change in each dimension (Smit 2004; van Bruchem and Silvis 2008); iv) stakeholder workshop. The four methods mentioned above give qualitative (literature review and stakeholder workshop) and quantitative (statistical analyses) results on the contribution of each driver to the change in each dimension. Consequently, all four methods are considered to assess the relation between the driver and dimension: i) no significant impact on structural change; ii) impact on structural change; iii) strong impact on structural change. 2.2.6 Assessing future farm structural change Scenarios We used two plausible contrasting scenarios regarding future climate and socio-economic change to assess future farm structural change. For assessing impacts of climate change towards 2050 we used scenarios from the Royal Dutch Meteorology Institute (KNMI) (van den Hurk et al. 2006). The G climate scenario assumes a moderate temperature increase of 1°C by 2050, whereas the W scenario assumes a significant temperature increase of 2°C by 2050. To account for possible future trends in socio-economic developments, we used scenarios A1 Global Economy and B2 Regional Communities from the commonly used Dutch WLO scenarios (van Drunen and Berkhout, 2008). These scenarios are adapted from Westhoek et al. (2006) for the situation in the Netherlands, and are similar to the IPCC SRES scenarios (Nakicenovic and Swart 2000). Following suggestions of Henseler et al. (2009) we assume that the more economically and globally oriented A1 scenario goes with a significant temperature increase of 2°C by 2050, i.e. the W scenario. The more environmentally and regionally oriented B2 scenario is assumed to match with a moderate temperature increase of 1°C by 2050 represented by the G scenario. These combined scenarios were used by Riedijk et al. (2007) to assess future land use in Flevoland for the year 2040. We extrapolated their results on total arable land towards 2050 and used these in our study. Drivers at regional level Per scenario, we analyzed possible developments in drivers impacting structural change. We used the same indicators for drivers as in the historical trend analysis. Applying scenario assumptions on changes in technology, policy, market and climate (Table 2.2) we projected the impact of two scenarios on the indicators for these drivers.
Farm structural change
19
Table 2.2 – Assumptions on development of drivers and dimensions per scenario. Driver Indicators A1 B2 Source Technology Policy Market Climate change
Total costs Subsidies Price wheat Price potato Temperature
Continuation of historical trend No crop subsidies and price support +68 % increase +15% increase +2 °C increase
25% of continuation of historical trend Subsidies for environmental and social services -11% decrease +5% increase +1 °C increase
Own assumption based on Ewert et al. (2005),1
European Commission (2010) Ewert et al. (2011) KNMI scenarios (van der Hurk et al. 2007)
Dimension Size Intensity Specialization Orientation2
NGE & ha NGE/ha Crop areas Nature Enterpreneur
Continuation of historical trend Depends on changes in size and specialization Continuation of historical trend 0% 30%
25% of continuation of historical trend No increase possible 25% of continuation of historical trend For both: all farms that can increase their income with multifunctional activities
Own assumption based on Abildtrup et al. (2006) and Janssen et al. (2006) Own assumption based on Janssen et al. (2006) Own assumption based on Janssen et al. (2006) Own assumptions and stakeholder consultations
1 Estimations in Ewert et al. (2005) referred to technology development represented by yield changes. In B2 yield changes were assumed to remain stable. We assume a slight increase in total costs, considering the development of clean and energy saving technology. 2 Too few data were available to extrapolate. These general assumptions are further detailed in the downscaling to farm level.
Developments in technology will be of a different nature in the two scenarios. While in A1 technological progress will be related to further increase crop productivity accompanied with necessary intensification of production, in B2 the focus will be on clean and energy saving technology, which does not necessarily lead to higher production intensity. The Common Agricultural Policy (CAP) is assumed to develop differently in A1 and B2. In A1 we assume adoption of option 3 proposed by the European Commission (EC) in November 2010, which implies abolishment of direct payments and introduction of small payments for environmental public goods. In B2 we see the CAP to be similar to option 1 as proposed by the EC: maintaining levels of payments for social and environmental services. Future market developments in these scenarios are assessed through changes in prices for agricultural commodities using the CAPRI model (Britz 2005; Ewert et al. 2011). The simulated price scenarios comprise changes on the supply side (yield changes due to climate change and technological development) as well as on the demand side (population and GDP). While in A1 there will be considerable increase in prices for wheat and ware potato
binnenwerk.indd 19 23-2-2016 21:54:31

Chapter 2
20
due to large increase in demand, in B2 the prices will slightly increase (potato) or decrease (wheat). Dimensions at regional level At regional level, farm structural change is represented by changes in regional average values of each of the typology dimensions. These were estimated using three steps. First, we extrapolated historical trends (see e.g. Figure 2.1) in the farm structural dimensions towards 2050, considering different types of functions (linear, exponential, logarithmic) and time periods. The best fitting and explanatory function and time period were used for extrapolation. Scenario assumptions in A1 (B2) on changes in dimensions were used to adjust these extrapolations (Table 2.2). This method yields first estimations based on historical trends. Secondly, the outcomes from the historical analysis and the development of drivers per scenario show which drivers are important for changes in farm type dimensions in the future. Consequently, the drivers that will have a strong influence on a dimension in the future are used to derive future regional values for the particular dimension. For this we first obtained a statistical relationship (regression) between each impacting driver and a structural dimension. Then we linearly extrapolated the historical trend of the indicator for the drivers that showed significant trends over time, towards 2050. Next, we used A1 (B2) scenario assumptions on changes in drivers in the future and generated the future value for the indicator for a driver. Finally, we used the projected indicator value and the statistical relationship between the corresponding driver and structural dimension to derive values for a structural dimension in the A1 (B2) projection. Thirdly, both methods were combined and qualitatively interpreted, based on literature and stakeholder consultations. The first method uses historical information on dimensions itself, but ignores the influence of specific drivers. The second method allows to correct projected changes for changes in the drivers. However, a statistical relationship is not necessarily causal and the regression function may be influenced by other factors. Furthermore, even when literature and stakeholders are supportive of relationships, this may not be represented by the data. In some cases, the influence of drivers therefore had to be interpreted more qualitatively. For each dimension, the used procedure is explained in the results section. Classification farm types in 2050 The current farm typology together with projections on changes in regional averages of structural dimensions towards 2050 were used to assess farm structural change, resulting in a classification of farm types in 2050. Transition rules were developed for the downscaling of regional to farm type level. The structural dimensions for which projected regional averages had a solid statistical basis, were used as a starting point.
Farm structural change
21
As this differed for the A1 and B2 scenarios, the resulting rules were slightly different. Overall, the rules can be summarized as follows:
1. Based on the historical analysis, make assumptions on changes in size classes (stable, decrease, increase).
2. In each size class (starting with the ones that are projected to decrease in number), farms have several options:
a) increase size, b) increase intensity, c) change specialization, d) change orientation, e) stop, f) remain without changes. For each option, the average % change of all farm types should be similar to the projected regional average. In general, it is assumed that the average farm area (in ha and NGE), intensity (in NGE/ha) and crop areas per farm type remain the same. How these rules were applied exactly will be further detailed in the Results section. 2.3 Results 2.3.1 Classification farm types in 2008 In Figure 2.3 and Appendix 2.A we summarize the distribution of farm types in Flevoland in 2008. The currently dominant farm type is production oriented-large size-medium intensive-diverse: mainly root and tuber crops (19.3% of area). This farm type has an average economic size of 104 NGE and area of 64 ha. At regional level, the vast majority of farms is production-oriented (88.5%). Large and medium intensive farms are prevailing. In terms of specialization, most farms are diverse, with mainly root and tuber crops. 2.3.2 Regional level: historical trends of dimensions The outcomes of the historical trend analyses over 1986-2008 per farm structural dimension show that there was a slight increase in farm size, which was related to an increase in intensity up to 2001, and to an increase in farm area in the last years (Figure 2.4a, b). With farm area increasing faster than NGE, intensity decreased in the last decade. One of the reasons for an increase in average area is that the number of farms with the size of 50-100 NGE decreased dramatically (Figure 2.4c). There have been clear changes in specialization (Figure 2.4d). Area of root and tuber crops is currently decreasing in Flevoland (mainly sugar beet) after a period of slight increase (potato) and stabilization (sugar beet) in the 1980’s and 90’s. The areas of vegetables and flower bulbs increased, but the latter remains low in comparison to other crop areas. As to orientation, for the last 10 years (since the data is available) the percentage of farm output from multifunctional activities has varied significantly (Figure 2.4e). This variation is most likely due to a change in the way data are collected. Currently, the most popular multifunctional activities, according to CBS (2009), include work loan, nature conservation, and garaging (keeping goods or animals on the farm).
binnenwerk.indd 20 23-2-2016 21:54:31

Chapter 2
20
due to large increase in demand, in B2 the prices will slightly increase (potato) or decrease (wheat). Dimensions at regional level At regional level, farm structural change is represented by changes in regional average values of each of the typology dimensions. These were estimated using three steps. First, we extrapolated historical trends (see e.g. Figure 2.1) in the farm structural dimensions towards 2050, considering different types of functions (linear, exponential, logarithmic) and time periods. The best fitting and explanatory function and time period were used for extrapolation. Scenario assumptions in A1 (B2) on changes in dimensions were used to adjust these extrapolations (Table 2.2). This method yields first estimations based on historical trends. Secondly, the outcomes from the historical analysis and the development of drivers per scenario show which drivers are important for changes in farm type dimensions in the future. Consequently, the drivers that will have a strong influence on a dimension in the future are used to derive future regional values for the particular dimension. For this we first obtained a statistical relationship (regression) between each impacting driver and a structural dimension. Then we linearly extrapolated the historical trend of the indicator for the drivers that showed significant trends over time, towards 2050. Next, we used A1 (B2) scenario assumptions on changes in drivers in the future and generated the future value for the indicator for a driver. Finally, we used the projected indicator value and the statistical relationship between the corresponding driver and structural dimension to derive values for a structural dimension in the A1 (B2) projection. Thirdly, both methods were combined and qualitatively interpreted, based on literature and stakeholder consultations. The first method uses historical information on dimensions itself, but ignores the influence of specific drivers. The second method allows to correct projected changes for changes in the drivers. However, a statistical relationship is not necessarily causal and the regression function may be influenced by other factors. Furthermore, even when literature and stakeholders are supportive of relationships, this may not be represented by the data. In some cases, the influence of drivers therefore had to be interpreted more qualitatively. For each dimension, the used procedure is explained in the results section. Classification farm types in 2050 The current farm typology together with projections on changes in regional averages of structural dimensions towards 2050 were used to assess farm structural change, resulting in a classification of farm types in 2050. Transition rules were developed for the downscaling of regional to farm type level. The structural dimensions for which projected regional averages had a solid statistical basis, were used as a starting point.
Farm structural change
21
As this differed for the A1 and B2 scenarios, the resulting rules were slightly different. Overall, the rules can be summarized as follows:
1. Based on the historical analysis, make assumptions on changes in size classes (stable, decrease, increase).
2. In each size class (starting with the ones that are projected to decrease in number), farms have several options:
a) increase size, b) increase intensity, c) change specialization, d) change orientation, e) stop, f) remain without changes. For each option, the average % change of all farm types should be similar to the projected regional average. In general, it is assumed that the average farm area (in ha and NGE), intensity (in NGE/ha) and crop areas per farm type remain the same. How these rules were applied exactly will be further detailed in the Results section. 2.3 Results 2.3.1 Classification farm types in 2008 In Figure 2.3 and Appendix 2.A we summarize the distribution of farm types in Flevoland in 2008. The currently dominant farm type is production oriented-large size-medium intensive-diverse: mainly root and tuber crops (19.3% of area). This farm type has an average economic size of 104 NGE and area of 64 ha. At regional level, the vast majority of farms is production-oriented (88.5%). Large and medium intensive farms are prevailing. In terms of specialization, most farms are diverse, with mainly root and tuber crops. 2.3.2 Regional level: historical trends of dimensions The outcomes of the historical trend analyses over 1986-2008 per farm structural dimension show that there was a slight increase in farm size, which was related to an increase in intensity up to 2001, and to an increase in farm area in the last years (Figure 2.4a, b). With farm area increasing faster than NGE, intensity decreased in the last decade. One of the reasons for an increase in average area is that the number of farms with the size of 50-100 NGE decreased dramatically (Figure 2.4c). There have been clear changes in specialization (Figure 2.4d). Area of root and tuber crops is currently decreasing in Flevoland (mainly sugar beet) after a period of slight increase (potato) and stabilization (sugar beet) in the 1980’s and 90’s. The areas of vegetables and flower bulbs increased, but the latter remains low in comparison to other crop areas. As to orientation, for the last 10 years (since the data is available) the percentage of farm output from multifunctional activities has varied significantly (Figure 2.4e). This variation is most likely due to a change in the way data are collected. Currently, the most popular multifunctional activities, according to CBS (2009), include work loan, nature conservation, and garaging (keeping goods or animals on the farm).
binnenwerk.indd 21 23-2-2016 21:54:32

Chapter 2
22
Figure 2.3 – Regional farm type distribution and structural change in % from utilized arable area. 2.3.3 Historical driver – dimension relationship Changes in farm type dimensions were mainly attributed to technological progress, market development, and policy; climate seemed to have less influence (Table 2.3, Figure 2.5). In some cases the relationship between a driver and dimension was not confirmed by the statistical analyses, whereas literature review and stakeholder interactions had pointed at a relationship.
Farm structural change
23
Figure 2.4 – Changes in structural dimensions in time: a) farm size (NGE and ha); b) farm intensity (NGE/ha); c) numbers of farms in different size classes and their average farm area (ha); d) areas (%) of crop types; e) percentage of farm output from multifunctional activities. Source: CBS. For Figure 4d only data from 2000 onwards are presented, because the way data are collected changed. In the period 1986-2000 the % of sugar beet area in total area was stable, while the areas of potato, vegetables and flower bulbs increased.
Regarding orientation, literature (e.g. Roest et al. 2010) and stakeholders learned us that policy incentives stimulated adoption of non-agricultural activities (Table 2.3). The impact from market was indirect: the farmers looked for alternative sources of income due to a decrease over time in prices for the major crops. Both relationships were not reflected in statistics (Figure 2.5) due to short time series and unreliable data on multifunctional activities.
d)
c)
e)
b) a)
binnenwerk.indd 22 23-2-2016 21:54:36

Chapter 2
22
Figure 2.3 – Regional farm type distribution and structural change in % from utilized arable area. 2.3.3 Historical driver – dimension relationship Changes in farm type dimensions were mainly attributed to technological progress, market development, and policy; climate seemed to have less influence (Table 2.3, Figure 2.5). In some cases the relationship between a driver and dimension was not confirmed by the statistical analyses, whereas literature review and stakeholder interactions had pointed at a relationship.
Farm structural change
23
Figure 2.4 – Changes in structural dimensions in time: a) farm size (NGE and ha); b) farm intensity (NGE/ha); c) numbers of farms in different size classes and their average farm area (ha); d) areas (%) of crop types; e) percentage of farm output from multifunctional activities. Source: CBS. For Figure 4d only data from 2000 onwards are presented, because the way data are collected changed. In the period 1986-2000 the % of sugar beet area in total area was stable, while the areas of potato, vegetables and flower bulbs increased.
Regarding orientation, literature (e.g. Roest et al. 2010) and stakeholders learned us that policy incentives stimulated adoption of non-agricultural activities (Table 2.3). The impact from market was indirect: the farmers looked for alternative sources of income due to a decrease over time in prices for the major crops. Both relationships were not reflected in statistics (Figure 2.5) due to short time series and unreliable data on multifunctional activities.
d)
c)
e)
b) a)
Chapter 2
22
Figure 2.3 – Regional farm type distribution and structural change in % from utilized arable area. 2.3.3 Historical driver – dimension relationship Changes in farm type dimensions were mainly attributed to technological progress, market development, and policy; climate seemed to have less influence (Table 2.3, Figure 2.5). In some cases the relationship between a driver and dimension was not confirmed by the statistical analyses, whereas literature review and stakeholder interactions had pointed at a relationship.
Farm structural change
23
Figure 2.4 – Changes in structural dimensions in time: a) farm size (NGE and ha); b) farm intensity (NGE/ha); c) numbers of farms in different size classes and their average farm area (ha); d) areas (%) of crop types; e) percentage of farm output from multifunctional activities. Source: CBS. For Figure 4d only data from 2000 onwards are presented, because the way data are collected changed. In the period 1986-2000 the % of sugar beet area in total area was stable, while the areas of potato, vegetables and flower bulbs increased.
Regarding orientation, literature (e.g. Roest et al. 2010) and stakeholders learned us that policy incentives stimulated adoption of non-agricultural activities (Table 2.3). The impact from market was indirect: the farmers looked for alternative sources of income due to a decrease over time in prices for the major crops. Both relationships were not reflected in statistics (Figure 2.5) due to short time series and unreliable data on multifunctional activities.
d)
c)
e)
b) a) b)a)
c)
d) e)
binnenwerk.indd 23 23-2-2016 21:54:40
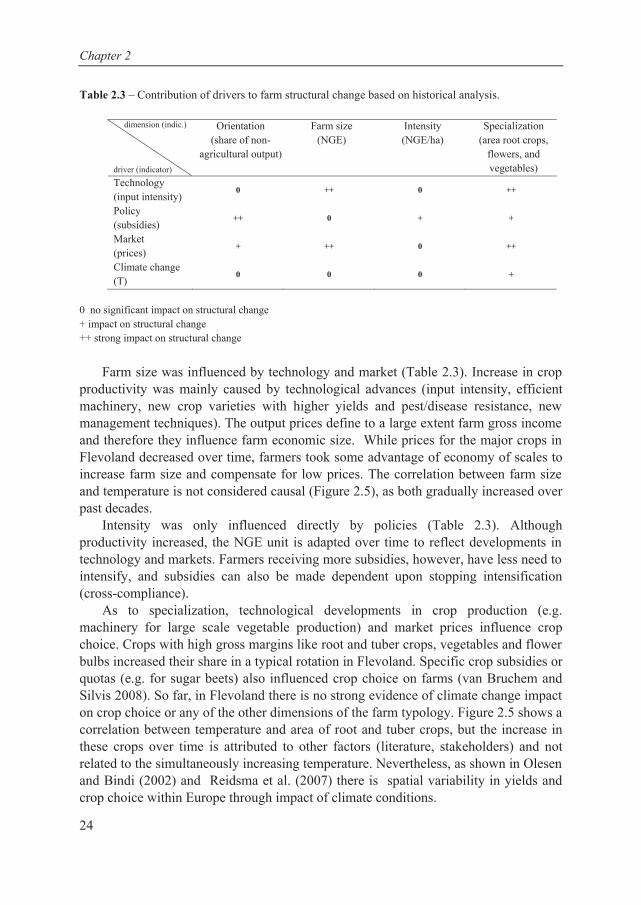
Chapter 2
24
Table 2.3 – Contribution of drivers to farm structural change based on historical analysis.
dimension (indic.)
driver (indicator)
Orientation (share of non-
agricultural output)
Farm size (NGE)
Intensity (NGE/ha)
Specialization (area root crops,
flowers, and vegetables)
Technology (input intensity)
0 ++ 0 ++
Policy (subsidies)
++ 0 + +
Market (prices)
+ ++ 0 ++
Climate change (T)
0 0 0 +
0 no significant impact on structural change + impact on structural change ++ strong impact on structural change
Farm size was influenced by technology and market (Table 2.3). Increase in crop
productivity was mainly caused by technological advances (input intensity, efficient machinery, new crop varieties with higher yields and pest/disease resistance, new management techniques). The output prices define to a large extent farm gross income and therefore they influence farm economic size. While prices for the major crops in Flevoland decreased over time, farmers took some advantage of economy of scales to increase farm size and compensate for low prices. The correlation between farm size and temperature is not considered causal (Figure 2.5), as both gradually increased over past decades.
Intensity was only influenced directly by policies (Table 2.3). Although productivity increased, the NGE unit is adapted over time to reflect developments in technology and markets. Farmers receiving more subsidies, however, have less need to intensify, and subsidies can also be made dependent upon stopping intensification (cross-compliance).
As to specialization, technological developments in crop production (e.g. machinery for large scale vegetable production) and market prices influence crop choice. Crops with high gross margins like root and tuber crops, vegetables and flower bulbs increased their share in a typical rotation in Flevoland. Specific crop subsidies or quotas (e.g. for sugar beets) also influenced crop choice on farms (van Bruchem and Silvis 2008). So far, in Flevoland there is no strong evidence of climate change impact on crop choice or any of the other dimensions of the farm typology. Figure 2.5 shows a correlation between temperature and area of root and tuber crops, but the increase in these crops over time is attributed to other factors (literature, stakeholders) and not related to the simultaneously increasing temperature. Nevertheless, as shown in Olesen and Bindi (2002) and Reidsma et al. (2007) there is spatial variability in yields and crop choice within Europe through impact of climate conditions.
Farm structural change
25
Figure 2.5 – Statistical relationships (correlation) between drivers and structural dimensions. Source: CBS, except for the indicator for driver of policy (total subsidies) and the indicator for dimension of orientation (% output from multifunctional activities) which were taken from FADN. Regression function is shown only in cases when the relationship is significant (p < 0.05). 2.3.4 Future driver-dimension relationship
Applying the scenario assumptions on changes in technology, policy, markets, and climate (presented earlier in Table 2.2) we projected the impact of drivers per dimension in two scenarios (Table 2.4). Overall, impacts are similar to Table 2.3, but the size depends on the change in drivers, which is different for the A1 and B2 scenario. Next to size of impact, types of impact can also differ. As mentioned earlier, in B2 the technology changes will be in the direction of energy-saving and environmentally friendly, which will have less influence on farm structure than in A1. For orientation, policy is the major driver that has a different focus per scenario with respect to stimuli for adoption of particular non-agricultural activities on the farm.
binnenwerk.indd 24 23-2-2016 21:54:40

Chapter 2
24
Table 2.3 – Contribution of drivers to farm structural change based on historical analysis.
dimension (indic.)
driver (indicator)
Orientation (share of non-
agricultural output)
Farm size (NGE)
Intensity (NGE/ha)
Specialization (area root crops,
flowers, and vegetables)
Technology (input intensity)
0 ++ 0 ++
Policy (subsidies)
++ 0 + +
Market (prices)
+ ++ 0 ++
Climate change (T)
0 0 0 +
0 no significant impact on structural change + impact on structural change ++ strong impact on structural change
Farm size was influenced by technology and market (Table 2.3). Increase in crop
productivity was mainly caused by technological advances (input intensity, efficient machinery, new crop varieties with higher yields and pest/disease resistance, new management techniques). The output prices define to a large extent farm gross income and therefore they influence farm economic size. While prices for the major crops in Flevoland decreased over time, farmers took some advantage of economy of scales to increase farm size and compensate for low prices. The correlation between farm size and temperature is not considered causal (Figure 2.5), as both gradually increased over past decades.
Intensity was only influenced directly by policies (Table 2.3). Although productivity increased, the NGE unit is adapted over time to reflect developments in technology and markets. Farmers receiving more subsidies, however, have less need to intensify, and subsidies can also be made dependent upon stopping intensification (cross-compliance).
As to specialization, technological developments in crop production (e.g. machinery for large scale vegetable production) and market prices influence crop choice. Crops with high gross margins like root and tuber crops, vegetables and flower bulbs increased their share in a typical rotation in Flevoland. Specific crop subsidies or quotas (e.g. for sugar beets) also influenced crop choice on farms (van Bruchem and Silvis 2008). So far, in Flevoland there is no strong evidence of climate change impact on crop choice or any of the other dimensions of the farm typology. Figure 2.5 shows a correlation between temperature and area of root and tuber crops, but the increase in these crops over time is attributed to other factors (literature, stakeholders) and not related to the simultaneously increasing temperature. Nevertheless, as shown in Olesen and Bindi (2002) and Reidsma et al. (2007) there is spatial variability in yields and crop choice within Europe through impact of climate conditions.
Farm structural change
25
Figure 2.5 – Statistical relationships (correlation) between drivers and structural dimensions. Source: CBS, except for the indicator for driver of policy (total subsidies) and the indicator for dimension of orientation (% output from multifunctional activities) which were taken from FADN. Regression function is shown only in cases when the relationship is significant (p < 0.05). 2.3.4 Future driver-dimension relationship
Applying the scenario assumptions on changes in technology, policy, markets, and climate (presented earlier in Table 2.2) we projected the impact of drivers per dimension in two scenarios (Table 2.4). Overall, impacts are similar to Table 2.3, but the size depends on the change in drivers, which is different for the A1 and B2 scenario. Next to size of impact, types of impact can also differ. As mentioned earlier, in B2 the technology changes will be in the direction of energy-saving and environmentally friendly, which will have less influence on farm structure than in A1. For orientation, policy is the major driver that has a different focus per scenario with respect to stimuli for adoption of particular non-agricultural activities on the farm.
Farm structural change
25
Figure 2.5 – Statistical relationships (correlation) between drivers and structural dimensions. Source: CBS, except for the indicator for driver of policy (total subsidies) and the indicator for dimension of orientation (% output from multifunctional activities) which were taken from FADN. Regression function is shown only in cases when the relationship is significant (p < 0.05). 2.3.4 Future driver-dimension relationship
Applying the scenario assumptions on changes in technology, policy, markets, and climate (presented earlier in Table 2.2) we projected the impact of drivers per dimension in two scenarios (Table 2.4). Overall, impacts are similar to Table 2.3, but the size depends on the change in drivers, which is different for the A1 and B2 scenario. Next to size of impact, types of impact can also differ. As mentioned earlier, in B2 the technology changes will be in the direction of energy-saving and environmentally friendly, which will have less influence on farm structure than in A1. For orientation, policy is the major driver that has a different focus per scenario with respect to stimuli for adoption of particular non-agricultural activities on the farm.
binnenwerk.indd 25 23-2-2016 21:54:45
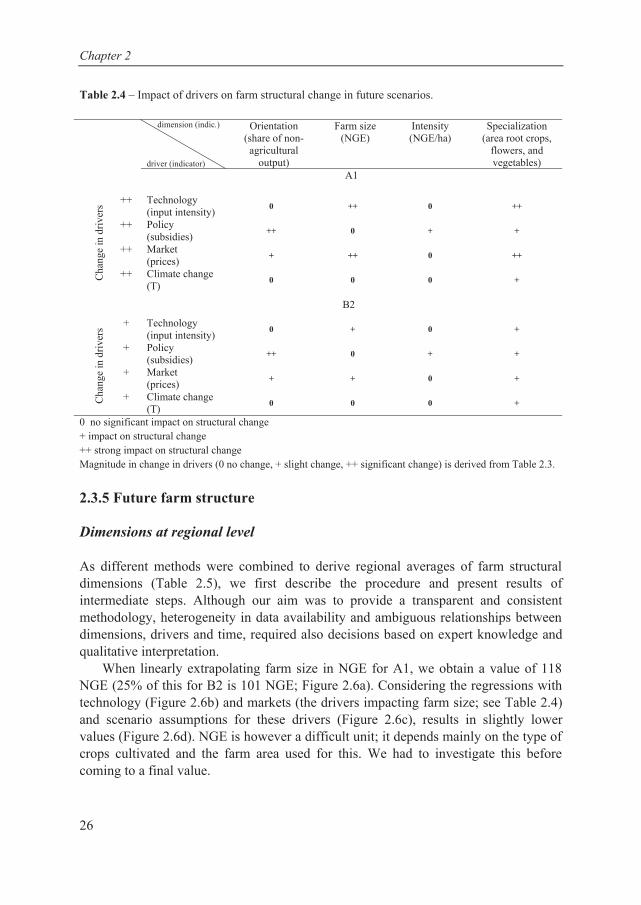
Chapter 2
26
Table 2.4 – Impact of drivers on farm structural change in future scenarios.
dimension (indic.) driver (indicator)
Orientation (share of non-agricultural
output)
Farm size (NGE)
Intensity (NGE/ha)
Specialization (area root crops,
flowers, and vegetables)
A1
C
hang
e in
driv
ers ++ Technology
(input intensity) 0 ++ 0 ++
++ Policy (subsidies) ++ 0 + +
++ Market (prices) + ++ 0 ++
++ Climate change (T) 0 0 0 +
B2
C
hang
e in
driv
ers + Technology
(input intensity) 0 + 0 +
+ Policy (subsidies) ++ 0 + +
+ Market (prices) + + 0 +
+ Climate change (T) 0 0 0 +
0 no significant impact on structural change + impact on structural change ++ strong impact on structural change Magnitude in change in drivers (0 no change, + slight change, ++ significant change) is derived from Table 2.3.
2.3.5 Future farm structure Dimensions at regional level As different methods were combined to derive regional averages of farm structural dimensions (Table 2.5), we first describe the procedure and present results of intermediate steps. Although our aim was to provide a transparent and consistent methodology, heterogeneity in data availability and ambiguous relationships between dimensions, drivers and time, required also decisions based on expert knowledge and qualitative interpretation.
When linearly extrapolating farm size in NGE for A1, we obtain a value of 118 NGE (25% of this for B2 is 101 NGE; Figure 2.6a). Considering the regressions with technology (Figure 2.6b) and markets (the drivers impacting farm size; see Table 2.4) and scenario assumptions for these drivers (Figure 2.6c), results in slightly lower values (Figure 2.6d). NGE is however a difficult unit; it depends mainly on the type of crops cultivated and the farm area used for this. We had to investigate this before coming to a final value.
Farm structural change
27
Table 2.5 –Regional averages of farm structural dimensions. Dimensions Structural characteristics 2008 A1 change B2 change Arable UAA, 103 ha 781 682 -13% 72 2 -8% Number of arable farms 11001 7163 -35% 9623 -13% Size
Average farm area, ha Average size, NGE
561
951 75 128
+34% +34%
59 98
+6% +4%
Intensity Specialization
Average intensity, NGE/ha Area root/tuber crops, % arable UAA Area vegetables, % arable UAA Area flower bulbs, % arable UAA
1.71 401 261 4.01
1.7 26 38 6.4
0% -36% +51% +60%
1.7 37 29 4.6
-2% -9% +13% +15%
Orientation
Entrepreneur oriented farms, % of farms Nature oriented farms, % of farms
84 24
30 0
+275% -100%
30 30
+275% +1400%
1 CBS 2 Extrapolated from 2040 values as projected by Riedijk et al. (2007) 3 Calculated by dividing future arable UAA by projected average farm area. It is assumed that the % arable UAA in arable farm types remains stable, as was the case in the past 4 GIAB
Figure 2.6 – Schematic representation of procedure to derive future farm size in A1 scenario, with a) summary of all steps, b) Step 2a relationship driver-dimension, c) Step 2b extrapolating historical trend driver, d) Step 2c projection dimension based on driver. Source: CBS.
If the increase in farm area since 1995 continues, this results in an average farm area of 84 ha (see Figure 2.4a). Using the relationship with technology (Figure 2.5), we obtain a lower value, and we use the average of both, 75 ha, as the projection for A1 (59 ha in B2) (Table 2.5). As the statistical relationship between farm area and
binnenwerk.indd 26 23-2-2016 21:54:45

Chapter 2
26
Table 2.4 – Impact of drivers on farm structural change in future scenarios.
dimension (indic.) driver (indicator)
Orientation (share of non-agricultural
output)
Farm size (NGE)
Intensity (NGE/ha)
Specialization (area root crops,
flowers, and vegetables)
A1
C
hang
e in
driv
ers ++ Technology
(input intensity) 0 ++ 0 ++
++ Policy (subsidies) ++ 0 + +
++ Market (prices) + ++ 0 ++
++ Climate change (T) 0 0 0 +
B2
C
hang
e in
driv
ers + Technology
(input intensity) 0 + 0 +
+ Policy (subsidies) ++ 0 + +
+ Market (prices) + + 0 +
+ Climate change (T) 0 0 0 +
0 no significant impact on structural change + impact on structural change ++ strong impact on structural change Magnitude in change in drivers (0 no change, + slight change, ++ significant change) is derived from Table 2.3.
2.3.5 Future farm structure Dimensions at regional level As different methods were combined to derive regional averages of farm structural dimensions (Table 2.5), we first describe the procedure and present results of intermediate steps. Although our aim was to provide a transparent and consistent methodology, heterogeneity in data availability and ambiguous relationships between dimensions, drivers and time, required also decisions based on expert knowledge and qualitative interpretation.
When linearly extrapolating farm size in NGE for A1, we obtain a value of 118 NGE (25% of this for B2 is 101 NGE; Figure 2.6a). Considering the regressions with technology (Figure 2.6b) and markets (the drivers impacting farm size; see Table 2.4) and scenario assumptions for these drivers (Figure 2.6c), results in slightly lower values (Figure 2.6d). NGE is however a difficult unit; it depends mainly on the type of crops cultivated and the farm area used for this. We had to investigate this before coming to a final value.
Farm structural change
27
Table 2.5 –Regional averages of farm structural dimensions. Dimensions Structural characteristics 2008 A1 change B2 change Arable UAA, 103 ha 781 682 -13% 72 2 -8% Number of arable farms 11001 7163 -35% 9623 -13% Size
Average farm area, ha Average size, NGE
561
951 75 128
+34% +34%
59 98
+6% +4%
Intensity Specialization
Average intensity, NGE/ha Area root/tuber crops, % arable UAA Area vegetables, % arable UAA Area flower bulbs, % arable UAA
1.71 401 261 4.01
1.7 26 38 6.4
0% -36% +51% +60%
1.7 37 29 4.6
-2% -9% +13% +15%
Orientation
Entrepreneur oriented farms, % of farms Nature oriented farms, % of farms
84 24
30 0
+275% -100%
30 30
+275% +1400%
1 CBS 2 Extrapolated from 2040 values as projected by Riedijk et al. (2007) 3 Calculated by dividing future arable UAA by projected average farm area. It is assumed that the % arable UAA in arable farm types remains stable, as was the case in the past 4 GIAB
Figure 2.6 – Schematic representation of procedure to derive future farm size in A1 scenario, with a) summary of all steps, b) Step 2a relationship driver-dimension, c) Step 2b extrapolating historical trend driver, d) Step 2c projection dimension based on driver. Source: CBS.
If the increase in farm area since 1995 continues, this results in an average farm area of 84 ha (see Figure 2.4a). Using the relationship with technology (Figure 2.5), we obtain a lower value, and we use the average of both, 75 ha, as the projection for A1 (59 ha in B2) (Table 2.5). As the statistical relationship between farm area and
Farm structural change
27
Table 2.5 –Regional averages of farm structural dimensions. Dimensions Structural characteristics 2008 A1 change B2 change Arable UAA, 103 ha 781 682 -13% 72 2 -8% Number of arable farms 11001 7163 -35% 9623 -13% Size
Average farm area, ha Average size, NGE
561
951 75 128
+34% +34%
59 98
+6% +4%
Intensity Specialization
Average intensity, NGE/ha Area root/tuber crops, % arable UAA Area vegetables, % arable UAA Area flower bulbs, % arable UAA
1.71 401 261 4.01
1.7 26 38 6.4
0% -36% +51% +60%
1.7 37 29 4.6
-2% -9% +13% +15%
Orientation
Entrepreneur oriented farms, % of farms Nature oriented farms, % of farms
84 24
30 0
+275% -100%
30 30
+275% +1400%
1 CBS 2 Extrapolated from 2040 values as projected by Riedijk et al. (2007) 3 Calculated by dividing future arable UAA by projected average farm area. It is assumed that the % arable UAA in arable farm types remains stable, as was the case in the past 4 GIAB
Figure 2.6 – Schematic representation of procedure to derive future farm size in A1 scenario, with a) summary of all steps, b) Step 2a relationship driver-dimension, c) Step 2b extrapolating historical trend driver, d) Step 2c projection dimension based on driver. Source: CBS.
If the increase in farm area since 1995 continues, this results in an average farm area of 84 ha (see Figure 2.4a). Using the relationship with technology (Figure 2.5), we obtain a lower value, and we use the average of both, 75 ha, as the projection for A1 (59 ha in B2) (Table 2.5). As the statistical relationship between farm area and
binnenwerk.indd 27 23-2-2016 21:54:48

Chapter 2
28
input costs (technology) is much stronger than the relationship with product prices (market) (Figure 2.5), the latter is not used for the projections.
Using values on changes in NGE and in ha as calculated with these two quantitative methods, results in a faster increase in area than NGE, and therefore a decreasing intensity. However, in A1 with increasing areas of vegetables and flower bulbs, it is likely that intensity remains stable. Therefore we calculate the final value for farm size based on the projected value for farm area and a stable intensity (Figure 2.6a; Table 2.5). In B2, intensity can decrease (Table 2.2), and values for farm size and farm area are used to calculate change in intensity.
With regard to specialization, it is clear that potato area is relatively stable (Figure 2.4d), sugar beet area is quickly decreasing, while projecting change in vegetable area depends on the statistical relationship (linear, exponential, logarithmic) and time period taken. It is likely that in A1 sugar beet will disappear (following the trend, further liberalization) and will be replaced by vegetables like onion and carrots (possible due to technological development and high market value). For flower bulbs a linear trend is extrapolated. In the B2 scenario projected changes will be 25% of the historical trend, resulting in similar but smaller changes.
Lastly, orientation will change. In A1 there are no subsidies for nature conservation, so these farms will disappear. Increase in share of entrepreneurial, or multifunctional farming happens, since farmers seek alternative sources of income due to changes in the agricultural policy paradigm (abolishment of payments and little alternative subsidies). It is assumed that 30% of the farmers will be entrepreneur in 2050. In B2, multifunctional activities become profitable when alternative income and subsidies exceed gross margin of crops. It is assumed that also in this scenario 30% will become entrepreneur, and another 30% will become nature oriented. These assumptions are made on the basis of literature review (e.g. Jongeneel et al. 2008, European Commission 2010), and were discussed with stakeholders. In summary, in A1 large changes are projected for all dimensions, while in B2 the main change is the one in orientation. Farm level structural change and classification farm types in 2050 At regional level, several changes are very clear in the A1 scenario. Already now, medium sized farms are quickly reducing in number (Figure 2.4c), and it is projected that medium sized production oriented farms cannot remain viable. If all these medium sized farm except for the ones specialized in vegetables and flower bulbs disappear, we come close to the 384 farms that were projected to stop (Table 2.5), and to projected regional averages of size in NGE and ha.
Not all disappearing medium sized farms stop, but some increase farm area (resulting in higher size class), some change specialization and some become entrepreneur. Considering that the resulting average size was similar to projected regional average, we can assume that the number of these medium sized farms moving
Farm structural change
29
to large farms is similar to the number of large farms stopping. Only farms specialized in vegetables and flower bulbs move to large size (see Appendix 2.A).
With regard to specialization, in A1 it is projected that all sugar beets are replaced by vegetables. This implies that ‘specialized: root crops’ become ‘diverse: mainly root crops’ and the latter become ‘diverse: arable’. Farms specializing in vegetables are mainly the horticultural ones, and not much change in area is foreseen here (see Figure 2.4d). Using regional average changes in dimensions as boundaries for changes, we have to conclude that the increase in area of flower bulbs has to come from an increase in the average area of very large farms.
Lastly, it was projected that 30% of the farmers become entrepreneur. Currently, only medium and large sized farms are entrepreneur, and they are all medium intensive. It was assumed that 10% of the medium sized production oriented farms could remain viable by becoming entrepreneur; the other entrepreneurs are large farms. In addition, if these medium sized farms remain instead of stop, this implies that some large farms move to very large, so that the regional projected average is reached.
In the B2 scenario, much less changes occur. As medium sized farms can remain viable, it was assumed that the projected decrease in farm number by 13% occurred in medium, large and very large farms to the same extent. Secondly, the increase in size of 4% needs to come from medium sized farms, as the increase to very large farms is assumed to be restricted. For specialization the same rules are applied as in A1, but as the vegetable area only slightly increases, the contribution to SGM does not cross thresholds, and specialization types remain the same. The main change in B2 is the change in orientation. For the transitions, we assumed that all the medium intensive farms can earn more per ha by moving to other orientation types, resulting in 70% of the farmers compared to the earlier assumed 60%. Currently, 20% of the multifunctional farmers have nature conservation area, but in the B2 scenario we assume this becomes 50%.
The results on classification of farm types in 2050 in two scenarios are given in Appendix 2.A. The most important farm type in A1 is production oriented-very large-medium intensive-diverse: arable (16%), similar to current, but one size class larger and a change from ‘diverse: mainly root crops’ to ‘diverse: arable’ due to disappearance of sugar beets. In B2 the largest type is entrepreneur oriented-large-medium intensive-diverse: mainly root crops (15%). The aggregated farm level results are shown in Figure 2.3. Images of future farms Images of farms of the future (in 2050) in Flevoland for two scenarios were derived from the farm structural change scenarios, complemented by stakeholder visions.
As presented in the previous section, in the A1 scenario a typical farm is a large scale, capital intensive holding with the average farm size of 130 ha. In the stakeholder workshop, farmers, however, would expect this farm to be larger by 2050, i.e. 150-180
binnenwerk.indd 28 23-2-2016 21:54:48

Chapter 2
28
input costs (technology) is much stronger than the relationship with product prices (market) (Figure 2.5), the latter is not used for the projections.
Using values on changes in NGE and in ha as calculated with these two quantitative methods, results in a faster increase in area than NGE, and therefore a decreasing intensity. However, in A1 with increasing areas of vegetables and flower bulbs, it is likely that intensity remains stable. Therefore we calculate the final value for farm size based on the projected value for farm area and a stable intensity (Figure 2.6a; Table 2.5). In B2, intensity can decrease (Table 2.2), and values for farm size and farm area are used to calculate change in intensity.
With regard to specialization, it is clear that potato area is relatively stable (Figure 2.4d), sugar beet area is quickly decreasing, while projecting change in vegetable area depends on the statistical relationship (linear, exponential, logarithmic) and time period taken. It is likely that in A1 sugar beet will disappear (following the trend, further liberalization) and will be replaced by vegetables like onion and carrots (possible due to technological development and high market value). For flower bulbs a linear trend is extrapolated. In the B2 scenario projected changes will be 25% of the historical trend, resulting in similar but smaller changes.
Lastly, orientation will change. In A1 there are no subsidies for nature conservation, so these farms will disappear. Increase in share of entrepreneurial, or multifunctional farming happens, since farmers seek alternative sources of income due to changes in the agricultural policy paradigm (abolishment of payments and little alternative subsidies). It is assumed that 30% of the farmers will be entrepreneur in 2050. In B2, multifunctional activities become profitable when alternative income and subsidies exceed gross margin of crops. It is assumed that also in this scenario 30% will become entrepreneur, and another 30% will become nature oriented. These assumptions are made on the basis of literature review (e.g. Jongeneel et al. 2008, European Commission 2010), and were discussed with stakeholders. In summary, in A1 large changes are projected for all dimensions, while in B2 the main change is the one in orientation. Farm level structural change and classification farm types in 2050 At regional level, several changes are very clear in the A1 scenario. Already now, medium sized farms are quickly reducing in number (Figure 2.4c), and it is projected that medium sized production oriented farms cannot remain viable. If all these medium sized farm except for the ones specialized in vegetables and flower bulbs disappear, we come close to the 384 farms that were projected to stop (Table 2.5), and to projected regional averages of size in NGE and ha.
Not all disappearing medium sized farms stop, but some increase farm area (resulting in higher size class), some change specialization and some become entrepreneur. Considering that the resulting average size was similar to projected regional average, we can assume that the number of these medium sized farms moving
Farm structural change
29
to large farms is similar to the number of large farms stopping. Only farms specialized in vegetables and flower bulbs move to large size (see Appendix 2.A).
With regard to specialization, in A1 it is projected that all sugar beets are replaced by vegetables. This implies that ‘specialized: root crops’ become ‘diverse: mainly root crops’ and the latter become ‘diverse: arable’. Farms specializing in vegetables are mainly the horticultural ones, and not much change in area is foreseen here (see Figure 2.4d). Using regional average changes in dimensions as boundaries for changes, we have to conclude that the increase in area of flower bulbs has to come from an increase in the average area of very large farms.
Lastly, it was projected that 30% of the farmers become entrepreneur. Currently, only medium and large sized farms are entrepreneur, and they are all medium intensive. It was assumed that 10% of the medium sized production oriented farms could remain viable by becoming entrepreneur; the other entrepreneurs are large farms. In addition, if these medium sized farms remain instead of stop, this implies that some large farms move to very large, so that the regional projected average is reached.
In the B2 scenario, much less changes occur. As medium sized farms can remain viable, it was assumed that the projected decrease in farm number by 13% occurred in medium, large and very large farms to the same extent. Secondly, the increase in size of 4% needs to come from medium sized farms, as the increase to very large farms is assumed to be restricted. For specialization the same rules are applied as in A1, but as the vegetable area only slightly increases, the contribution to SGM does not cross thresholds, and specialization types remain the same. The main change in B2 is the change in orientation. For the transitions, we assumed that all the medium intensive farms can earn more per ha by moving to other orientation types, resulting in 70% of the farmers compared to the earlier assumed 60%. Currently, 20% of the multifunctional farmers have nature conservation area, but in the B2 scenario we assume this becomes 50%.
The results on classification of farm types in 2050 in two scenarios are given in Appendix 2.A. The most important farm type in A1 is production oriented-very large-medium intensive-diverse: arable (16%), similar to current, but one size class larger and a change from ‘diverse: mainly root crops’ to ‘diverse: arable’ due to disappearance of sugar beets. In B2 the largest type is entrepreneur oriented-large-medium intensive-diverse: mainly root crops (15%). The aggregated farm level results are shown in Figure 2.3. Images of future farms Images of farms of the future (in 2050) in Flevoland for two scenarios were derived from the farm structural change scenarios, complemented by stakeholder visions.
As presented in the previous section, in the A1 scenario a typical farm is a large scale, capital intensive holding with the average farm size of 130 ha. In the stakeholder workshop, farmers, however, would expect this farm to be larger by 2050, i.e. 150-180
binnenwerk.indd 29 23-2-2016 21:54:48

Chapter 2
30
ha. This can be achieved through a considerable share of rented land in the total amount of utilized agricultural area (up to 75%). The farm is operating in a close collaboration with neighbouring farms in terms of management operations and (partial) processing of the products. Technical advances on such farm are the attributes of precision agriculture, which contribute to high labour efficiency and productivity. Production is focused on seed and ware potato. Stakeholders expect Flevoland to guarantee its position in export of seed potato by maintaining the high quality of the product. Sugar beet cultivation disappears due to the high competition on the global sugar market. Besides vegetables, as a substitute for sugar beet in a bio-based economy scenario local stakeholders mentioned energy crops. The quality issue remains important for all groups of products, driven by consumer preferences. Efficient arrangement of processing of products on the farm makes favourable conditions for retail sales. In general, the production-processing-delivering chain is highly technically efficient on this farm. The major “survival” strategy for this farm type is orientation on the world market where it has guaranteed its niche through delivering high quality products (ware and seed potato, vegetables) and innovative technology.
A typical farm in the B2 scenario is multifunctional with a projected farm size of 64 ha (see Appendix 2.A); farmers foresee an average area up to 80-120 ha. According to the stakeholders, this farm type will mostly produce organically. The output intensity is kept to the current level through strict environmental legislation aimed at limiting growth potential of agriculture. The share of rented land varies between 50 and 75 %. Cooperation between neighbours is strongly supported by regional development policy. Technological progress is focused on environmentally friendly production means (environmentally beneficial technology) and development of biological crop varieties. The balance between consumer demand and production supply is regionally based. A farm becomes a part of a local market chain (retail, direct sells from a farm, local supermarkets). Traditional crops dominate in the arable farm specialization: consumption potato, seed potato, winter wheat, and sugar beet. In general, the projections on future farms based on historical analysis were supported by the vision of stakeholders. The main mismatches between the farmers expectations and quantitative projections are found in estimation of future farm area. 2.4 Discussion and concluding remarks We presented a method to assess farm structural change at regional and farm level towards 2050, which was not previously performed for such a long time horizon. The analysis shows that historical trends, consistent scenario assumptions and stakeholder input can be used to derive regional and farm level estimations of farm structural change and plausible images of arable farms towards 2050. This information on farm structural change provides a better basis for assessment of impacts of and adaptation to climate change than the current farms.
Farm structural change
31
2.4.1 Limitations and qualifications of the methodology We experienced that the proposed methodology was not straightforward to implement. A limitation of the method is that it relies on availability of good historical data on farm structure. For some dimensions, such as orientation, this was lacking in our case. Data on multifunctional activities were not complete and consistent. Therefore, we made assumptions based on literature review and consulted stakeholders regarding transition of farms from production oriented towards entrepreneur and nature conservation types. Our assumption was partly confirmed, as the total % of multifunctional farmers as projected based on literature and stakeholder consultations in B2, 60%, was similar to the number of medium intensive farms, i.e. 70%. Those are the farms that may earn more with multifunctional activities than with agricultural activities. The exact percentage and distribution between entrepreneurs and nature oriented farms depends on how budgets for nature conservation and other environmental and social services will be allocated. Stakeholders indicated that most farmers in Flevoland will change their activities if they can earn money with it; on the other hand it is also clear that most of them prefer to select only one additional activity to focus on.
A second limitation is, that our indicator choice is debatable. Ewert et al. (2005) proposed to model technological progress through potential yield and the gap between actual and potential yield. We used variable input costs as a reflection of technological progress. For the quantitative analysis based on statistics we chose to work with one indicator per driver to assess the impact of each driver on farm structural change and to assess the impacts of scenario assumptions on a driver. Yet, scenarios are too complex and cannot be reflected by just one indicator per driver. Therefore we complemented the results based on the drivers with results based on the dimensions itself and with literature review and stakeholders’ perspectives.
Transition rules to downscale the regional results to the farm type level could not be developed independent of the scenarios assumptions and results at regional level. The way farm type dimensions and their thresholds are defined differs per dimension, and the same holds for the related scenario projections at regional level. Therefore, it appeared that using the regional level results as boundary conditions for changes at farm level, resulted in more reliable and consistent projections than using general transition rules.
Our results are reflecting the application of a positive rather than a normative approach (see e.g. Waldhardt et al. (2010)), i.e. projections are based on what can be expected, not on what is aimed for or desirable from a normative point of view. Grounded in historical data analysis, the results give predictions on possible developments in drivers and in farm structural characteristics influenced by the drivers. The stakeholders (farmers, representatives of farmers organizations and water board) agreed on the translation of the global change scenarios to the regional application, but often projected more drastic changes (especially in size) than can be expected based on the historical data analysis. This probably originates from the fact
binnenwerk.indd 30 23-2-2016 21:54:48

Chapter 2
30
ha. This can be achieved through a considerable share of rented land in the total amount of utilized agricultural area (up to 75%). The farm is operating in a close collaboration with neighbouring farms in terms of management operations and (partial) processing of the products. Technical advances on such farm are the attributes of precision agriculture, which contribute to high labour efficiency and productivity. Production is focused on seed and ware potato. Stakeholders expect Flevoland to guarantee its position in export of seed potato by maintaining the high quality of the product. Sugar beet cultivation disappears due to the high competition on the global sugar market. Besides vegetables, as a substitute for sugar beet in a bio-based economy scenario local stakeholders mentioned energy crops. The quality issue remains important for all groups of products, driven by consumer preferences. Efficient arrangement of processing of products on the farm makes favourable conditions for retail sales. In general, the production-processing-delivering chain is highly technically efficient on this farm. The major “survival” strategy for this farm type is orientation on the world market where it has guaranteed its niche through delivering high quality products (ware and seed potato, vegetables) and innovative technology.
A typical farm in the B2 scenario is multifunctional with a projected farm size of 64 ha (see Appendix 2.A); farmers foresee an average area up to 80-120 ha. According to the stakeholders, this farm type will mostly produce organically. The output intensity is kept to the current level through strict environmental legislation aimed at limiting growth potential of agriculture. The share of rented land varies between 50 and 75 %. Cooperation between neighbours is strongly supported by regional development policy. Technological progress is focused on environmentally friendly production means (environmentally beneficial technology) and development of biological crop varieties. The balance between consumer demand and production supply is regionally based. A farm becomes a part of a local market chain (retail, direct sells from a farm, local supermarkets). Traditional crops dominate in the arable farm specialization: consumption potato, seed potato, winter wheat, and sugar beet. In general, the projections on future farms based on historical analysis were supported by the vision of stakeholders. The main mismatches between the farmers expectations and quantitative projections are found in estimation of future farm area. 2.4 Discussion and concluding remarks We presented a method to assess farm structural change at regional and farm level towards 2050, which was not previously performed for such a long time horizon. The analysis shows that historical trends, consistent scenario assumptions and stakeholder input can be used to derive regional and farm level estimations of farm structural change and plausible images of arable farms towards 2050. This information on farm structural change provides a better basis for assessment of impacts of and adaptation to climate change than the current farms.
Farm structural change
31
2.4.1 Limitations and qualifications of the methodology We experienced that the proposed methodology was not straightforward to implement. A limitation of the method is that it relies on availability of good historical data on farm structure. For some dimensions, such as orientation, this was lacking in our case. Data on multifunctional activities were not complete and consistent. Therefore, we made assumptions based on literature review and consulted stakeholders regarding transition of farms from production oriented towards entrepreneur and nature conservation types. Our assumption was partly confirmed, as the total % of multifunctional farmers as projected based on literature and stakeholder consultations in B2, 60%, was similar to the number of medium intensive farms, i.e. 70%. Those are the farms that may earn more with multifunctional activities than with agricultural activities. The exact percentage and distribution between entrepreneurs and nature oriented farms depends on how budgets for nature conservation and other environmental and social services will be allocated. Stakeholders indicated that most farmers in Flevoland will change their activities if they can earn money with it; on the other hand it is also clear that most of them prefer to select only one additional activity to focus on.
A second limitation is, that our indicator choice is debatable. Ewert et al. (2005) proposed to model technological progress through potential yield and the gap between actual and potential yield. We used variable input costs as a reflection of technological progress. For the quantitative analysis based on statistics we chose to work with one indicator per driver to assess the impact of each driver on farm structural change and to assess the impacts of scenario assumptions on a driver. Yet, scenarios are too complex and cannot be reflected by just one indicator per driver. Therefore we complemented the results based on the drivers with results based on the dimensions itself and with literature review and stakeholders’ perspectives.
Transition rules to downscale the regional results to the farm type level could not be developed independent of the scenarios assumptions and results at regional level. The way farm type dimensions and their thresholds are defined differs per dimension, and the same holds for the related scenario projections at regional level. Therefore, it appeared that using the regional level results as boundary conditions for changes at farm level, resulted in more reliable and consistent projections than using general transition rules.
Our results are reflecting the application of a positive rather than a normative approach (see e.g. Waldhardt et al. (2010)), i.e. projections are based on what can be expected, not on what is aimed for or desirable from a normative point of view. Grounded in historical data analysis, the results give predictions on possible developments in drivers and in farm structural characteristics influenced by the drivers. The stakeholders (farmers, representatives of farmers organizations and water board) agreed on the translation of the global change scenarios to the regional application, but often projected more drastic changes (especially in size) than can be expected based on the historical data analysis. This probably originates from the fact
binnenwerk.indd 31 23-2-2016 21:54:48

Chapter 2
32
that the vision of farmers also reflects how they would like to see their own future; stakeholder views are more normative. 2.4.2 Implications of the estimated farm structural change The majority of performed studies on impacts of and adaptation to climate change are either focusing on changes in sowing dates and cultivars in the current farming setting (e.g. Easterling 1996; Kaiser et al. 1993), and/or assess economic implications in that current setting (Prato et al. 2010). Our study provides a setting for assessment of adaptation strategies to future climate change in a broader context of other important changes and allows to account for alternative functions of agriculture to society in the future. Specific adaptation strategies, their adoption, and the sensitivity to different drivers can be further explored using bio-economic models (e.g. Kanellopoulos et al. 2010; Kanellopoulos et al. 2011). We note, however, that the detail of the farm structural change assessment should be determined by the exact aim of the follow-up studies. Since the method we propose is laborious and requires consistent historical data, part of our method could be substituted by a stronger role of stakeholder consultations, if images of future farms are sufficient rather than a comprehensive and consistent assessment of farm structural change at regional and farm level.
This paper does not explicitly addresses landscape impacts. However, Figure 2.5 indicates the implications of farm structural change for the landscape in Flevoland towards 2050 in different scenarios. Arable farming occupies a large area of Flevoland and therefore largely influences the landscape. In A1 in Flevoland we can expect large scale farming systems specializing in intensive crops. In B2 there is still place for smaller farms. In general this scenario is characterized by a higher diversity in farming landscape with focus on local crops and markets, more nature conservation and provision of alternative functions to the society. Therefore, the two scenarios will be quite contrasting in terms of implications for nature and other landscape functions in Flevoland.
Farm structural change
33
A
ppen
dix
2.A
– F
arm
leve
l res
ults
on
farm
stru
ctur
al c
hang
e in
two
scen
ario
s.
2008
A
1 B
2
Orie
ntat
ion
Size
In
tens
ity
Spec
ializ
atio
n1 %
ara
ble
UA
A2
NG
E ha
N
GE/
ha 1.1
9 11
6.0 6.0
5.0 sporc toor :dezilaiceps/elbara :esrevid
muide
m lla
ms noitcudorp
1 4.1
9 31
50.0 1.0
40.0 selbategev
2 3 m
ediu
m
high
di
vers
e: m
ainl
y ro
ot c
rop/
spec
ializ
ed: r
oot c
rops
2.
4 0
2.0
50
22
2.3 3.7
6 14
50.0 0
60.0 sblub re
wolf 4
6.1 92
64 0
0 7.9
sporc toor :dezilaiceps/elbara :esrevid/sporc toor ylniam : esrevid
muide
m 5
7.1 52
14 0
0 4.0
selbategev 6
0.7 61
111 2.0
5.0 2.0
sblub rewolf
hgih egral
7 4.2
44 401
4.5 2.6
2.5 sporc toor :dezilaiceps/sporc toor ylnia
m :esrevid 8
6.1 05
28 0
0.1 0
selbategev
muidem
9 6.1
46 401
0.0 6.9
3.91 sporc toor ylnia
m :esrevid 01
16 985
2.5 1.8
4 sblub re
wolf hgih
egral yrev 11
3 9.
7 4.2 801
452 2.6
4.8 6.6
sporc toor :dezilaiceps/sporc toor ylniam :esrevid
21 7.1
031 422
0 3.61
7.8 sporc toor ylnia
m :esrevid
muidem
31 5.1
63 55
1.6 9.2
4.1 sporc toor ylnia
m :esrevid
muidem
muide
m ruenerpertne
41 0.0
0 0
2.0 0.0
0 selbategev
5116
99 7.41
1.31 1.4
sporc toor ylniam :esrevid
muide
m egral
614
1.6 7.1
031 422
1.4 0
0 sporc toor ylnia
m :esrevid
muidem
egral yrev 71 18
natu
re
med
ium
m
ediu
m
dive
rse:
mai
nly
root
cro
ps/d
iver
se: a
rabl
e/sp
ecia
lized
: roo
t cro
ps
0 0
4.0
46
29
1.6 0.0
0 0
2.0 0
0 selbategev
91 6.2
73 79
1.0 0
1.0 sporc toor ylnia
m :esrevid hgih
egral 02
16 501
1.11 0
6.0 sporc toor ylnia
m :esrevid
muidem
124
1.7 5.2
231 433
8.0 0
8.0 sporc toor ylnia
m :esrevid hgih
egral yrev 22
7.1 411
991 0.4
0 4.0
sporc toor ylniam :esrevid
muide
m
32
1 In
A1,
all
‘spe
cial
ized
: roo
t cro
ps’ b
ecom
e ‘d
iver
se: m
ainl
y ro
ot c
rops
’, an
d th
e la
tter b
ecom
e ‘d
iver
se: a
rabl
e’.
2 The
rem
aini
ng a
rabl
e ar
ea is
occ
upie
d by
ara
ble
in m
ixed
farm
type
s.
3 In
A1,
the
aver
age
area
of t
hese
flow
er b
ulbs
incr
ease
s to
108
ha, s
imila
r to
the
othe
r spe
cial
izat
ion
type
. In
B2,
the
incr
ease
is h
alf o
f thi
s, i.e
. 85
ha.
4 As i
n B
2 th
ese
entre
pren
eur a
nd n
atur
e or
ient
ed fa
rms a
re p
rodu
ctio
n or
ient
ed fa
rms
that
mov
ed, t
he a
vera
ge a
rea
is 6
4 ha
.
binnenwerk.indd 32 23-2-2016 21:54:49

Chapter 2
32
that the vision of farmers also reflects how they would like to see their own future; stakeholder views are more normative. 2.4.2 Implications of the estimated farm structural change The majority of performed studies on impacts of and adaptation to climate change are either focusing on changes in sowing dates and cultivars in the current farming setting (e.g. Easterling 1996; Kaiser et al. 1993), and/or assess economic implications in that current setting (Prato et al. 2010). Our study provides a setting for assessment of adaptation strategies to future climate change in a broader context of other important changes and allows to account for alternative functions of agriculture to society in the future. Specific adaptation strategies, their adoption, and the sensitivity to different drivers can be further explored using bio-economic models (e.g. Kanellopoulos et al. 2010; Kanellopoulos et al. 2011). We note, however, that the detail of the farm structural change assessment should be determined by the exact aim of the follow-up studies. Since the method we propose is laborious and requires consistent historical data, part of our method could be substituted by a stronger role of stakeholder consultations, if images of future farms are sufficient rather than a comprehensive and consistent assessment of farm structural change at regional and farm level.
This paper does not explicitly addresses landscape impacts. However, Figure 2.5 indicates the implications of farm structural change for the landscape in Flevoland towards 2050 in different scenarios. Arable farming occupies a large area of Flevoland and therefore largely influences the landscape. In A1 in Flevoland we can expect large scale farming systems specializing in intensive crops. In B2 there is still place for smaller farms. In general this scenario is characterized by a higher diversity in farming landscape with focus on local crops and markets, more nature conservation and provision of alternative functions to the society. Therefore, the two scenarios will be quite contrasting in terms of implications for nature and other landscape functions in Flevoland.
Farm structural change
33
App
endi
x 2.
A –
Far
m le
vel r
esul
ts o
n fa
rm st
ruct
ural
cha
nge
in tw
o sc
enar
ios.
2008
A
1 B
2
Orie
ntat
ion
Size
In
tens
ity
Spec
ializ
atio
n1 %
ara
ble
UA
A2
NG
E ha
N
GE/
ha 1.1
9 11
6.0 6.0
5.0 sporc toor :dezilaiceps/elbara :esrevid
muide
m lla
ms noitcudorp
1 4.1
9 31
50.0 1.0
40.0 selbategev
2 3 m
ediu
m
high
di
vers
e: m
ainl
y ro
ot c
rop/
spec
ializ
ed: r
oot c
rops
2.
4 0
2.0
50
22
2.3 3.7
6 14
50.0 0
60.0 sblub re
wolf 4
6.1 92
64 0
0 7.9
sporc toor :dezilaiceps/elbara :esrevid/sporc toor ylniam : esrevid
muide
m 5
7.1 52
14 0
0 4.0
selbategev 6
0.7 61
111 2.0
5.0 2.0
sblub rewolf
hgih egral
7 4.2
44 401
4.5 2.6
2.5 sporc toor :dezilaiceps/sporc toor ylnia
m :esrevid 8
6.1 05
28 0
0.1 0
selbategev
muidem
9 6.1
46 401
0.0 6.9
3.91 sporc toor ylnia
m :esrevid 01
16 985
2.5 1.8
4 sblub re
wolf hgih
egral yrev 11
3 9.
7 4.2 801
452 2.6
4.8 6.6
sporc toor :dezilaiceps/sporc toor ylniam :esrevid
21 7.1
031 422
0 3.61
7.8 sporc toor ylnia
m :esrevid
muidem
31 5.1
63 55
1.6 9.2
4.1 sporc toor ylnia
m :esrevid
muidem
muide
m ruenerpertne
41 0.0
0 0
2.0 0.0
0 selbategev
5116
99 7.41
1.31 1.4
sporc toor ylniam :esrevid
muide
m egral
614
1.6 7.1
031 422
1.4 0
0 sporc toor ylnia
m :esrevid
muidem
egral yrev 71 18
natu
re
med
ium
m
ediu
m
dive
rse:
mai
nly
root
cro
ps/d
iver
se: a
rabl
e/sp
ecia
lized
: roo
t cro
ps
0 0
4.0
46
29
1.6 0.0
0 0
2.0 0
0 selbategev
91 6.2
73 79
1.0 0
1.0 sporc toor ylnia
m :esrevid hgih
egral 02
16 501
1.11 0
6.0 sporc toor ylnia
m :esrevid
muidem
124
1.7 5.2
231 433
8.0 0
8.0 sporc toor ylnia
m :esrevid hgih
egral yrev 22
7.1 411
991 0.4
0 4.0
sporc toor ylniam :esrevid
muide
m
32
1 In
A1,
all
‘spe
cial
ized
: roo
t cro
ps’ b
ecom
e ‘d
iver
se: m
ainl
y ro
ot c
rops
’, an
d th
e la
tter b
ecom
e ‘d
iver
se: a
rabl
e’.
2 The
rem
aini
ng a
rabl
e ar
ea is
occ
upie
d by
ara
ble
in m
ixed
farm
type
s.
3 In
A1,
the
aver
age
area
of t
hese
flow
er b
ulbs
incr
ease
s to
108
ha, s
imila
r to
the
othe
r spe
cial
izat
ion
type
. In
B2,
the
incr
ease
is h
alf o
f thi
s, i.e
. 85
ha.
4 As i
n B
2 th
ese
entre
pren
eur a
nd n
atur
e or
ient
ed fa
rms a
re p
rodu
ctio
n or
ient
ed fa
rms
that
mov
ed, t
he a
vera
ge a
rea
is 6
4 ha
.
binnenwerk.indd 33 23-2-2016 21:54:50

Chapter 3
The role of farmers’ objectives in current farm practices and adaptation preferences
Abstract The diversity in farmer’s objectives and responses is not always considered in integrated assessment studies. In this Chapter we present an approach to assess how a farmer’s stated objectives relate to his currently implemented practices and to preferred adaptation options, and we discuss what this implies for integrated assessments of adaptation to climate change. We based our approach on a combination of Multi-Criteria Decision Making methods. We consistently assessed the importance of a farmer’s objectives from what farmers say (based on interviews), from what farmers actually do (by analysing current farm performance) and from what farmers want (through selected alternative farm plan). Our study was performed for six arable farms in Flevoland, a province in the Netherlands. Based on interviews with farmers, we reduced the long list of possible objectives to the most important ones. The objectives we assessed included maximization of economic result and soil organic matter, and minimization of gross margin variance, working hours and nitrogen balance. In our sample, farmer’s stated preferences in objectives were often not reflected in realized farming practices. Adaptation preferences of farmers largely resembled their current performance, but generally involved a move towards stated preferences. Our results suggest that although farmers do have more objectives, in practical decision-making they focus on economic result maximization, while for strategic decision-making they account for soil organic matter which is indirectly related to long term income. Keywords: multi-criteria decision making; multi-objective optimization; agriculture; arable
farm; farmer’s objectives
This chapter has been published as: Mandryk M, Reidsma P, Kanellopoulos A, Groot JJ, van Ittersum M (2014) The role of farmers’ objectives in current farm practices and adaptation preferences: a case study in Flevoland, the Netherlands. Regional Environmental Change 14 (4):1463-1478.
binnenwerk.indd 34 23-2-2016 21:54:50

Chapter 3
The role of farmers’ objectives in current farm practices and adaptation preferences
Abstract The diversity in farmer’s objectives and responses is not always considered in integrated assessment studies. In this Chapter we present an approach to assess how a farmer’s stated objectives relate to his currently implemented practices and to preferred adaptation options, and we discuss what this implies for integrated assessments of adaptation to climate change. We based our approach on a combination of Multi-Criteria Decision Making methods. We consistently assessed the importance of a farmer’s objectives from what farmers say (based on interviews), from what farmers actually do (by analysing current farm performance) and from what farmers want (through selected alternative farm plan). Our study was performed for six arable farms in Flevoland, a province in the Netherlands. Based on interviews with farmers, we reduced the long list of possible objectives to the most important ones. The objectives we assessed included maximization of economic result and soil organic matter, and minimization of gross margin variance, working hours and nitrogen balance. In our sample, farmer’s stated preferences in objectives were often not reflected in realized farming practices. Adaptation preferences of farmers largely resembled their current performance, but generally involved a move towards stated preferences. Our results suggest that although farmers do have more objectives, in practical decision-making they focus on economic result maximization, while for strategic decision-making they account for soil organic matter which is indirectly related to long term income. Keywords: multi-criteria decision making; multi-objective optimization; agriculture; arable
farm; farmer’s objectives
This chapter has been published as: Mandryk M, Reidsma P, Kanellopoulos A, Groot JJ, van Ittersum M (2014) The role of farmers’ objectives in current farm practices and adaptation preferences: a case study in Flevoland, the Netherlands. Regional Environmental Change 14 (4):1463-1478.
binnenwerk.indd 35 23-2-2016 21:54:50
Chapter 3
36
3.1 Introduction In the coming decades, climate change will become an important force driving farming systems to adapt (Bindi and Olesen 2010, Hermans et al. 2010, Prato et al. 2010). Besides adaptation to climate change, a farmer also has to adapt his management practices to react to changes in market and policy and to benefit from technological progress. These drivers also influence management and adaptation in the present situation (see Chapter 2). Therefore, in order to assess adaptation preferences of farmers against future challenges, it is relevant to study factors that influence adaptation in the current situation.
Farming systems in Europe are diverse in terms of their characteristics, objectives and performance, which largely influenced adaptation of farms to past climate change and variability (Reidsma et al. 2010). One of the factors contributing to increasing farm diversity recently is a shift towards multifunctional agriculture associated with a broader role of agriculture in a modern society (Meerburg et al. 2009, Renting et al. 2009, van der Ploeg et al. 2009). Next to primarily economic objectives, farmers are assumed to have other objectives (e.g. social, environmental) influencing their management practices. Farm specific adaptation measures to drivers of change will differ depending on farmers’ objectives.
In many studies on assessment of adaptation to climate change using economic modelling, farmer’s multiple objectives are often neglected and farmers are seen as ultimate profit maximizers (Audsley et al. 2006, Seo 2010). Profit maximization may be used to explore optimal farm plans(Van Ittersum et al. 1998, ten Berge et al. 2000, Janssen and van Ittersum 2007), but not to project actual choices made by farmers (see also Rufino et al. (2011)). In reality farmers often choose for managerial options considering also other objectives, and they select options that are not necessarily the most optimal.
Dogliotti et al. (2005), Tittonell et al. (2007), Groot and Rossing (2011) assessed multiple and conflicting farmer’s objectives by emphasizing the values of objectives achieved in certain scenarios. As the result, these studies propose the best alternative farm plan versus current farm performance as to considered objectives. However, elicitation of importance weights and assessment of relations between weights for current and future farm performance in terms of different objectives were not considered in these studies. As argued by Jones (2011), the methodology of weight elicitation and reporting is currently somewhat random and ad hoc in nature. The weights attached to different objectives are usually recovered through the existing cropping patterns, hence the actual behaviour of farmers is explained through assessment of a compromise between different objectives by modelling farm current performance (Sumpsi et al. 1997, Gómez-Limón et al. 2003, Romero and Rehman 2003, Berkhout et al. 2011). Other studies use objectives as stated by farmers in interviews (e.g., van Calker et al. 2005). Different methods may, however, lead to different results, as actions (i.e. performance) are often not the result of conscious goals (i.e. stated objectives) (Dijksterhuis and Aarts 2010).
Farmers’ multiple objectives
37
This paper presents an approach to assess how stated objectives of farmers relate to their currently implemented practices and to preferred adaptation options. Our approach allows to quantify the importance of farmer’s multiple objectives and to compare different methods for deriving preferential weights. An important sub-question in the study is to reveal the underlying objectives determining farm adaptation preferences. We hypothesize that different methods to elicit weights of objectives will lead to different results, implying that the chosen method will influence assessments of impacts and adaptation to future changes. We expect profit to be a relatively important objective, as the case study area Flevoland is highly productive.
We first describe the data and the model we used in the study. Next, we describe the procedure to derive importance weights for multiple objectives considered in the study using different methods: interviews with farmers, assessment of current farm performance and preferred adaptation options. Finally, we discuss our findings by comparing different sets of weights for the objectives. 3.2 Materials and Methods 3.2.1 Data collection In the present study we decided to model individual arable farms rather than to formulate prototypes based on averaging farm characteristics. This provided opportunities to obtain case study specific input for the model, to receive feedback on the modeling results and to perform model validation through multiple iterations with individual farmers (in two rounds of interviews). We surveyed six arable farms from the province of Flevoland, The Netherlands. We assigned each farm to a farm type based on the typology developed in Chapter 2. Variables of the farm typology and data on farm structure and resources are given in Table 3.1. Table 3.1 – Survey data of the six farms on farm structure and resources. The definition and thresholds for farm orientation, size, intensity and specialization are given in Table 2.1.
Farm
co
de
Structure % UAA1 Flevo-land
Resources Orientation Size Intensity Specialization Area,
ha Labour, hrs/yr
Soil OM2,
% P1 P2 P3 N1 E1 E2
Production Production Production Nature Entrepreneur Entrepreneur
Large Large Large Large Large Medium
High Medium Medium Medium Medium Medium
Diverse mainly root crops Diverse mainly root crops Diverse arable Specialized root crops Diverse mainly root crops Diverse mainly root crops
5.2 19.3 19.3 0.1 4.1 1.4
54 68 70 52 53 36
3300 2860 2750 4080 5000 1600
2.0 4.3 4.5 2.5 2.3 4.2
1UAA is utilized agricultural area 2OM is organic matter
binnenwerk.indd 36 23-2-2016 21:54:50

Chapter 3
36
3.1 Introduction In the coming decades, climate change will become an important force driving farming systems to adapt (Bindi and Olesen 2010, Hermans et al. 2010, Prato et al. 2010). Besides adaptation to climate change, a farmer also has to adapt his management practices to react to changes in market and policy and to benefit from technological progress. These drivers also influence management and adaptation in the present situation (see Chapter 2). Therefore, in order to assess adaptation preferences of farmers against future challenges, it is relevant to study factors that influence adaptation in the current situation.
Farming systems in Europe are diverse in terms of their characteristics, objectives and performance, which largely influenced adaptation of farms to past climate change and variability (Reidsma et al. 2010). One of the factors contributing to increasing farm diversity recently is a shift towards multifunctional agriculture associated with a broader role of agriculture in a modern society (Meerburg et al. 2009, Renting et al. 2009, van der Ploeg et al. 2009). Next to primarily economic objectives, farmers are assumed to have other objectives (e.g. social, environmental) influencing their management practices. Farm specific adaptation measures to drivers of change will differ depending on farmers’ objectives.
In many studies on assessment of adaptation to climate change using economic modelling, farmer’s multiple objectives are often neglected and farmers are seen as ultimate profit maximizers (Audsley et al. 2006, Seo 2010). Profit maximization may be used to explore optimal farm plans(Van Ittersum et al. 1998, ten Berge et al. 2000, Janssen and van Ittersum 2007), but not to project actual choices made by farmers (see also Rufino et al. (2011)). In reality farmers often choose for managerial options considering also other objectives, and they select options that are not necessarily the most optimal.
Dogliotti et al. (2005), Tittonell et al. (2007), Groot and Rossing (2011) assessed multiple and conflicting farmer’s objectives by emphasizing the values of objectives achieved in certain scenarios. As the result, these studies propose the best alternative farm plan versus current farm performance as to considered objectives. However, elicitation of importance weights and assessment of relations between weights for current and future farm performance in terms of different objectives were not considered in these studies. As argued by Jones (2011), the methodology of weight elicitation and reporting is currently somewhat random and ad hoc in nature. The weights attached to different objectives are usually recovered through the existing cropping patterns, hence the actual behaviour of farmers is explained through assessment of a compromise between different objectives by modelling farm current performance (Sumpsi et al. 1997, Gómez-Limón et al. 2003, Romero and Rehman 2003, Berkhout et al. 2011). Other studies use objectives as stated by farmers in interviews (e.g., van Calker et al. 2005). Different methods may, however, lead to different results, as actions (i.e. performance) are often not the result of conscious goals (i.e. stated objectives) (Dijksterhuis and Aarts 2010).
Farmers’ multiple objectives
37
This paper presents an approach to assess how stated objectives of farmers relate to their currently implemented practices and to preferred adaptation options. Our approach allows to quantify the importance of farmer’s multiple objectives and to compare different methods for deriving preferential weights. An important sub-question in the study is to reveal the underlying objectives determining farm adaptation preferences. We hypothesize that different methods to elicit weights of objectives will lead to different results, implying that the chosen method will influence assessments of impacts and adaptation to future changes. We expect profit to be a relatively important objective, as the case study area Flevoland is highly productive.
We first describe the data and the model we used in the study. Next, we describe the procedure to derive importance weights for multiple objectives considered in the study using different methods: interviews with farmers, assessment of current farm performance and preferred adaptation options. Finally, we discuss our findings by comparing different sets of weights for the objectives. 3.2 Materials and Methods 3.2.1 Data collection In the present study we decided to model individual arable farms rather than to formulate prototypes based on averaging farm characteristics. This provided opportunities to obtain case study specific input for the model, to receive feedback on the modeling results and to perform model validation through multiple iterations with individual farmers (in two rounds of interviews). We surveyed six arable farms from the province of Flevoland, The Netherlands. We assigned each farm to a farm type based on the typology developed in Chapter 2. Variables of the farm typology and data on farm structure and resources are given in Table 3.1. Table 3.1 – Survey data of the six farms on farm structure and resources. The definition and thresholds for farm orientation, size, intensity and specialization are given in Table 2.1.
Farm
co
de
Structure % UAA1 Flevo-land
Resources Orientation Size Intensity Specialization Area,
ha Labour, hrs/yr
Soil OM2,
% P1 P2 P3 N1 E1 E2
Production Production Production Nature Entrepreneur Entrepreneur
Large Large Large Large Large Medium
High Medium Medium Medium Medium Medium
Diverse mainly root crops Diverse mainly root crops Diverse arable Specialized root crops Diverse mainly root crops Diverse mainly root crops
5.2 19.3 19.3 0.1 4.1 1.4
54 68 70 52 53 36
3300 2860 2750 4080 5000 1600
2.0 4.3 4.5 2.5 2.3 4.2
1UAA is utilized agricultural area 2OM is organic matter
binnenwerk.indd 37 23-2-2016 21:54:51

Chapter 3
38
In the first round of interviews (spring 2011) we obtained individual farm data regarding current farm practices, i.e. crops grown on the farm, crop yields and inputs of nitrogen, phosphorus and potassium (NPK) per crop (Appendix 3.A). In addition, we asked farmers about their preferences regarding alternative crops in their farm plans and about production restrictions for growing certain crops. Some crop level data, i.e. cultivation costs, contract work costs, labour requirement as well as crop prices (the running average of four years) were obtained from the Dutch information handbook for arable farming and horticulture (Anonymous 2009). We also obtained quantitative information of farmer’s stated importance of objectives by asking farmers to rank the objectives considered in the study.
In the second round of interviews (summer 2012) we presented the modelling outcomes to farmers in terms of alternative farm plans. Farmers were asked to select the most preferred farm plan from the large set of alternative farm plans generated by the model. The selection procedure was accompanied by a discussion with two authors of this paper, which provided good insights in farmers’ reasoning behind the decision-making. 3.2.2 Model description
In the study we used the multi-objective optimization model FarmDESIGN (Groot et al. 2012), developed to support the learning and decision-making process of re-designing farming systems. The model allows to calculate the consequences of farm configuration on a large set of farm performance indicators (e.g. nutrient balances and flows, labour balance, organic matter balance and operating profits), and subsequently to explore trade-offs between farmers’ multiple objectives (i.e. selected farm performance indicators), by linking a bio-economic component to a multi-objective Pareto-based Differential Evolution algorithm. The outcomes of the optimization runs are alternative farm configurations based on the original farm plan evaluated in terms of the multiple objectives.
We made some adjustments to the model to make it applicable to our research. We added minimizing of risk as a new objective, defined as a minimization of variance in gross margin. A variance co-variance matrix of gross margins was calculated based on five year data on yields, prices and cultivation costs for main arable crops in Flevoland. Consequently, a quadratic function was obtained and used to calculate variance in gross margin for specific farm production plans, according to Hazell and Norton (1986). For easier communication with farmers, we replaced the original objective of labour balance (defined by a difference between required and available labour on a farm) by labour requirement (i.e. a straightforward reference to the working hours needed for a certain farm plan). A flexible setup of the FarmDESIGN model allows its performance indicators to become either objectives (for minimization or maximization) or constraints (to restrict values to a user-defined range) depending on the user’s needs.
Farmers’ multiple objectives
39
A detailed model description is provided by Groot et al. (2012). An overview of rotational, general and nutrient balance constraints, input data for calculating nutrient balances and organic matter balance is presented in Appendices 3.B-3.E. 3.2.3 Methodology In this study we aimed to analyse how farmers’ intentions were related to practical decision-making. Therefore, we investigated whether the stated importance of objectives by farmers was realized in their current performance and reflected in their strategic choice of preferred adaptation options (Figure 3.1).
Figure 3.1 – Conceptual framework of the study.
To deal with multiple conflicting objectives, we based our methodological approach on the Multi-Criteria Decision Making (MCDM) techniques as defined by Romero and Rehman (2003). We included the following steps: a) identifying farmers’ objectives from a literature review and interviews with farmers and experts; b) ranking the objectives by interviewing farmers and deriving the stated weights for the objectives (wi interview weights); c) generating alternative farm plans and calculating trade-offs between objectives; d) assessing importance of objectives in farm current performance by comparing current farm plan to all generated alternative plans and deriving the realized weights for objectives (wp performance weights); e) selecting the most preferred alternative farm plan by farmers and deriving the strategic weights for different objectives from trade-offs (wa adaptation weights); and f) comparing objective weights wi, wp and wa. In this way we investigated how farmers’ stated objectives relate to practical decision-making and whether the objectives influence the choice of most preferred alternative farm plans, or the choice for adaptation. The explanation for each step is given below.
binnenwerk.indd 38 23-2-2016 21:54:51
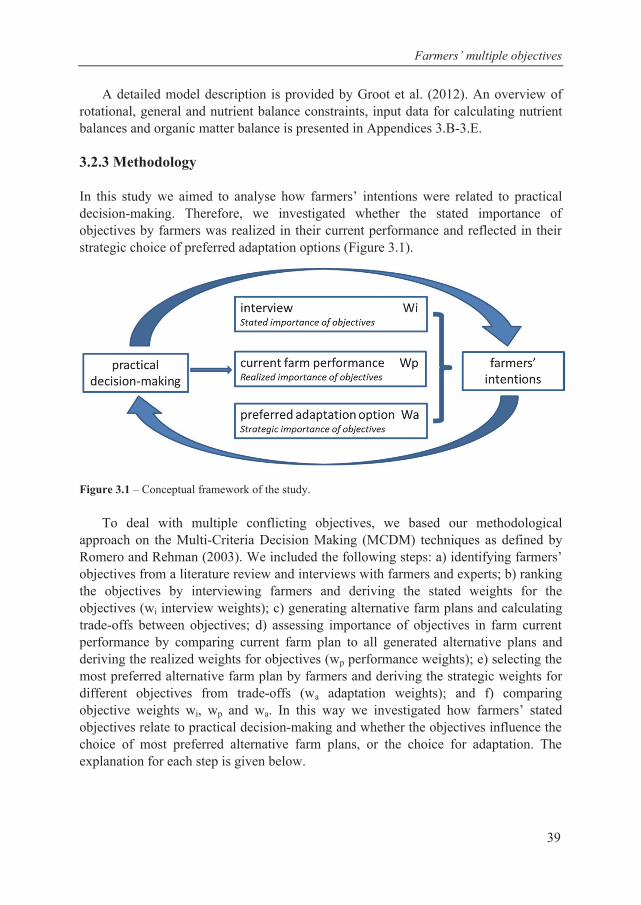
Chapter 3
38
In the first round of interviews (spring 2011) we obtained individual farm data regarding current farm practices, i.e. crops grown on the farm, crop yields and inputs of nitrogen, phosphorus and potassium (NPK) per crop (Appendix 3.A). In addition, we asked farmers about their preferences regarding alternative crops in their farm plans and about production restrictions for growing certain crops. Some crop level data, i.e. cultivation costs, contract work costs, labour requirement as well as crop prices (the running average of four years) were obtained from the Dutch information handbook for arable farming and horticulture (Anonymous 2009). We also obtained quantitative information of farmer’s stated importance of objectives by asking farmers to rank the objectives considered in the study.
In the second round of interviews (summer 2012) we presented the modelling outcomes to farmers in terms of alternative farm plans. Farmers were asked to select the most preferred farm plan from the large set of alternative farm plans generated by the model. The selection procedure was accompanied by a discussion with two authors of this paper, which provided good insights in farmers’ reasoning behind the decision-making. 3.2.2 Model description
In the study we used the multi-objective optimization model FarmDESIGN (Groot et al. 2012), developed to support the learning and decision-making process of re-designing farming systems. The model allows to calculate the consequences of farm configuration on a large set of farm performance indicators (e.g. nutrient balances and flows, labour balance, organic matter balance and operating profits), and subsequently to explore trade-offs between farmers’ multiple objectives (i.e. selected farm performance indicators), by linking a bio-economic component to a multi-objective Pareto-based Differential Evolution algorithm. The outcomes of the optimization runs are alternative farm configurations based on the original farm plan evaluated in terms of the multiple objectives.
We made some adjustments to the model to make it applicable to our research. We added minimizing of risk as a new objective, defined as a minimization of variance in gross margin. A variance co-variance matrix of gross margins was calculated based on five year data on yields, prices and cultivation costs for main arable crops in Flevoland. Consequently, a quadratic function was obtained and used to calculate variance in gross margin for specific farm production plans, according to Hazell and Norton (1986). For easier communication with farmers, we replaced the original objective of labour balance (defined by a difference between required and available labour on a farm) by labour requirement (i.e. a straightforward reference to the working hours needed for a certain farm plan). A flexible setup of the FarmDESIGN model allows its performance indicators to become either objectives (for minimization or maximization) or constraints (to restrict values to a user-defined range) depending on the user’s needs.
Farmers’ multiple objectives
39
A detailed model description is provided by Groot et al. (2012). An overview of rotational, general and nutrient balance constraints, input data for calculating nutrient balances and organic matter balance is presented in Appendices 3.B-3.E. 3.2.3 Methodology In this study we aimed to analyse how farmers’ intentions were related to practical decision-making. Therefore, we investigated whether the stated importance of objectives by farmers was realized in their current performance and reflected in their strategic choice of preferred adaptation options (Figure 3.1).
Figure 3.1 – Conceptual framework of the study.
To deal with multiple conflicting objectives, we based our methodological approach on the Multi-Criteria Decision Making (MCDM) techniques as defined by Romero and Rehman (2003). We included the following steps: a) identifying farmers’ objectives from a literature review and interviews with farmers and experts; b) ranking the objectives by interviewing farmers and deriving the stated weights for the objectives (wi interview weights); c) generating alternative farm plans and calculating trade-offs between objectives; d) assessing importance of objectives in farm current performance by comparing current farm plan to all generated alternative plans and deriving the realized weights for objectives (wp performance weights); e) selecting the most preferred alternative farm plan by farmers and deriving the strategic weights for different objectives from trade-offs (wa adaptation weights); and f) comparing objective weights wi, wp and wa. In this way we investigated how farmers’ stated objectives relate to practical decision-making and whether the objectives influence the choice of most preferred alternative farm plans, or the choice for adaptation. The explanation for each step is given below.
Farmers’ multiple objectives
39
A detailed model description is provided by Groot et al. (2012). An overview of rotational, general and nutrient balance constraints, input data for calculating nutrient balances and organic matter balance is presented in Appendices 3.B-3.E. 3.2.3 Methodology In this study we aimed to analyse how farmers’ intentions were related to practical decision-making. Therefore, we investigated whether the stated importance of objectives by farmers was realized in their current performance and reflected in their strategic choice of preferred adaptation options (Figure 3.1).
Figure 3.1 – Conceptual framework of the study.
To deal with multiple conflicting objectives, we based our methodological approach on the Multi-Criteria Decision Making (MCDM) techniques as defined by Romero and Rehman (2003). We included the following steps: a) identifying farmers’ objectives from a literature review and interviews with farmers and experts; b) ranking the objectives by interviewing farmers and deriving the stated weights for the objectives (wi interview weights); c) generating alternative farm plans and calculating trade-offs between objectives; d) assessing importance of objectives in farm current performance by comparing current farm plan to all generated alternative plans and deriving the realized weights for objectives (wp performance weights); e) selecting the most preferred alternative farm plan by farmers and deriving the strategic weights for different objectives from trade-offs (wa adaptation weights); and f) comparing objective weights wi, wp and wa. In this way we investigated how farmers’ stated objectives relate to practical decision-making and whether the objectives influence the choice of most preferred alternative farm plans, or the choice for adaptation. The explanation for each step is given below.
binnenwerk.indd 39 23-2-2016 21:54:52

Chapter 3
40
Identification of objectives
The method to identify farmers’ objectives was based on literature (Berkhout et al. 2011; Gómez-Limón et al. 2004; van Calker et al. 2005), expert consultations and interviews with farmers. Table 3.2 presents the identified objectives to be used in the research. Table 3.2 – Overview of objectives and indicators considered in the study.
Objective Indicator 1. Farm economic result maximization Gross margin of crops (€/ha) 2. Soil quality maximization OM balance (kg OM/ha) 3. Working hours minimization Labour requirement (hrs/ha) 4. Nitrogen balance minimization1 N balance (kg N/ha) 5. Gross margin variation minimization Gross margin variation (€/ha) 1Nitrogen balance is calculated as a difference between nitrogen inputs (from fertilizer and atmospheric deposition) and outputs (with crop products) on the farm. A low balance means that there is no large nitrogen surplus in the system
Interviews – stated weights wi Each interviewed farmer (n=6) was asked to rank the objectives considered in this study. Assessment of the relative importance of farmers’ objectives was based on two ranking methods: interval ranking and ordinal ranking (van Calker et al. 2005). In interval ranking the farmers were asked to rank each objective according to its perceived importance. A Likert scale of 1 to 5 was used, with 1 being not important for management decisions and 5 being very important. In ordinal ranking the respondents were asked to place the objectives in order of importance.
Next, the relative importance weights of the objectives were calculated for each respondent and ranking method. The relative importance weight , for objective i, respondent j, and ranking method k, is calculated as follows:
(equation 3.1) where is the value of objective i for respondent j and ranking method k, is the average ranking of all objectives for respondent j and ranking method k. Next, to be able to compare the weights with weights based on other methods, the standard normalization procedure was used, resulting in the sum of weights for all objectives for each farmer to be 1. By using the relative importance weights of both ranking methods, each respondent was tested for internal consistency with the Spearman Rank Correlation Coefficient. The results of non-consistent respondents are to be omitted from the analysis.
Initially we considered a larger number of objectives (n=10) to be assessed in this study. Besides the objectives presented in Table 3.2, we also considered maximization of alternative income, added value of products and landscape quality, and
Farmers’ multiple objectives
41
minimization of costs and work by third parties. After we obtained the results from ranking of objectives by farmers, we selected five objectives that consistently received the highest weights in both ranking methods (interval and ordinal). Generating alternative farm plans We used the FarmDESIGN model to generate alternative farm plans for each individual farm. We first included alternative activities for each farm, which included crops currently not grown on the farm, but grown on the other surveyed farms. This means that for each farm there were three to five alternative crops available from a total of nine crops observed on the surveyed farms (Appendix 3.A). Crops from the own rotation on each farm were assumed to maintain the current yields as obtained with current management (NPK application). Yields and NPK management for alternative crops are average values observed among the surveyed farms. Our assumption therefore was that farmers continue growing current crops with current management and only apply alternative management for alternative crops. With this assumption we aim at showing the effect from relatively small changes in the current farm plan, as most of the model options (alternative farm plans) will include one or two new crops. These plans are realistic for a farmer, as they are easy to implement for the farmer within a 1-3 year period. Besides, we did not want to overwhelm the farmer with solutions involving several management options for the same crop. All crop shares in alternative rotations were within feasible ranges from an agronomical point of view. This requirement was met through rotational constraints that were applied during the generation stage (Appendix 3.B). Machinery was assumed not to be a constraint, as in reality most farmers collaborate with one or more other farmers and have access to different types of machines needed for cultivation of different crops. After we entered all proposed alternative activities into the model, we ran the model for each farm individually with 10.000 iterations, optimizing the five objectives considered in the study. For each farm the model generated 900 alternative farm plans. The cloud of solutions (consisting of the alternative farm plans) was plotted in a two-dimensional space to represent trade-offs between different objectives. Current farm performance - realized weights wp
We compared the values for objectives from the current farm plan with the ideal and anti-ideal values for objectives from the whole set of generated alternative farm plans. The ideal value refers to the best attainable value for an objective, either maximum or minimum (depending on the direction of optimization), within the whole set of generated farm plans. The anti-ideal value is the opposite of ideal, i.e. is the worst value for an objective. To compare the current farm performance according to different objectives and to derive relative importance weights for the objectives wp, we applied the approach of Nordström et al. (2009):
binnenwerk.indd 40 23-2-2016 21:54:53

Chapter 3
40
Identification of objectives
The method to identify farmers’ objectives was based on literature (Berkhout et al. 2011; Gómez-Limón et al. 2004; van Calker et al. 2005), expert consultations and interviews with farmers. Table 3.2 presents the identified objectives to be used in the research. Table 3.2 – Overview of objectives and indicators considered in the study.
Objective Indicator 1. Farm economic result maximization Gross margin of crops (€/ha) 2. Soil quality maximization OM balance (kg OM/ha) 3. Working hours minimization Labour requirement (hrs/ha) 4. Nitrogen balance minimization1 N balance (kg N/ha) 5. Gross margin variation minimization Gross margin variation (€/ha) 1Nitrogen balance is calculated as a difference between nitrogen inputs (from fertilizer and atmospheric deposition) and outputs (with crop products) on the farm. A low balance means that there is no large nitrogen surplus in the system
Interviews – stated weights wi Each interviewed farmer (n=6) was asked to rank the objectives considered in this study. Assessment of the relative importance of farmers’ objectives was based on two ranking methods: interval ranking and ordinal ranking (van Calker et al. 2005). In interval ranking the farmers were asked to rank each objective according to its perceived importance. A Likert scale of 1 to 5 was used, with 1 being not important for management decisions and 5 being very important. In ordinal ranking the respondents were asked to place the objectives in order of importance.
Next, the relative importance weights of the objectives were calculated for each respondent and ranking method. The relative importance weight , for objective i, respondent j, and ranking method k, is calculated as follows:
(equation 3.1) where is the value of objective i for respondent j and ranking method k, is the average ranking of all objectives for respondent j and ranking method k. Next, to be able to compare the weights with weights based on other methods, the standard normalization procedure was used, resulting in the sum of weights for all objectives for each farmer to be 1. By using the relative importance weights of both ranking methods, each respondent was tested for internal consistency with the Spearman Rank Correlation Coefficient. The results of non-consistent respondents are to be omitted from the analysis.
Initially we considered a larger number of objectives (n=10) to be assessed in this study. Besides the objectives presented in Table 3.2, we also considered maximization of alternative income, added value of products and landscape quality, and
Farmers’ multiple objectives
41
minimization of costs and work by third parties. After we obtained the results from ranking of objectives by farmers, we selected five objectives that consistently received the highest weights in both ranking methods (interval and ordinal). Generating alternative farm plans We used the FarmDESIGN model to generate alternative farm plans for each individual farm. We first included alternative activities for each farm, which included crops currently not grown on the farm, but grown on the other surveyed farms. This means that for each farm there were three to five alternative crops available from a total of nine crops observed on the surveyed farms (Appendix 3.A). Crops from the own rotation on each farm were assumed to maintain the current yields as obtained with current management (NPK application). Yields and NPK management for alternative crops are average values observed among the surveyed farms. Our assumption therefore was that farmers continue growing current crops with current management and only apply alternative management for alternative crops. With this assumption we aim at showing the effect from relatively small changes in the current farm plan, as most of the model options (alternative farm plans) will include one or two new crops. These plans are realistic for a farmer, as they are easy to implement for the farmer within a 1-3 year period. Besides, we did not want to overwhelm the farmer with solutions involving several management options for the same crop. All crop shares in alternative rotations were within feasible ranges from an agronomical point of view. This requirement was met through rotational constraints that were applied during the generation stage (Appendix 3.B). Machinery was assumed not to be a constraint, as in reality most farmers collaborate with one or more other farmers and have access to different types of machines needed for cultivation of different crops. After we entered all proposed alternative activities into the model, we ran the model for each farm individually with 10.000 iterations, optimizing the five objectives considered in the study. For each farm the model generated 900 alternative farm plans. The cloud of solutions (consisting of the alternative farm plans) was plotted in a two-dimensional space to represent trade-offs between different objectives. Current farm performance - realized weights wp
We compared the values for objectives from the current farm plan with the ideal and anti-ideal values for objectives from the whole set of generated alternative farm plans. The ideal value refers to the best attainable value for an objective, either maximum or minimum (depending on the direction of optimization), within the whole set of generated farm plans. The anti-ideal value is the opposite of ideal, i.e. is the worst value for an objective. To compare the current farm performance according to different objectives and to derive relative importance weights for the objectives wp, we applied the approach of Nordström et al. (2009):
binnenwerk.indd 41 23-2-2016 21:54:53

Chapter 3
42
(equation 3.2) where is the weight for an objective from a generated alternative farm plan, and
are the ideal and anti-ideal values, respectively, for the rth objective within the set of generated alternative farm plans (j); is the outcome that corresponds to the jth farm plan when it is evaluated according to the rth objective (here, it is the value for rth objectives from the current farm plan). According to this approach, all the weights are bound between 0 (ideal value) and 1 (anti-ideal value) and represent distances or degrees of discrepancy from the ideal value. We normalized the weights to let the sum of weights for all objectives equal to 1 for each farm plan. In addition, we reversed the ideal and anti-ideal values with 1 becoming an ideal value instead of 0:
(equation 3.3)
where is the normalized weight for an objective from a generated alternative farm plan. The objectives with the weights, that are closer to the ideal value 1, are considered more important. Preferred adaptation option – strategic weights wa In the second round of interviews each farmer was asked to indicate the most preferred alternative farm plan generated by the model. The selection of the most preferred alternative represented farmer’s strategic decision as to the choice of adaptation options. The procedure to present the model results to the farmer included the following steps. Firstly, the model FarmDESIGN was presented and briefly explained (model components, inputs, outputs). Secondly, the farmer was shown clouds formed by all alternative options (n=900) generated by the model for their own farm. The clouds represent trade-offs between different objectives. Current performance of the farm was indicated in the graphs. Thirdly, the farmer was shown a list of 25-30 alternative solutions that were pre-selected from the full set of alternatives. This list included a cropping pattern and values for all 5 objectives associated to each of the alternative activities. For each objective we also provided the relative change compared to the current farm plan (improvement or worsening of objective values). The pre-selection of activities was based on: a) analyses of trade-offs between objectives that can still be improved and other important objectives for the farmer (based on ranking of objectives and farm current performance); b) farmer’s crop preferences stated in the first interview; c) production restrictions for certain crops stated in the first interview. The farmer was asked to indicate the most attractive alternative farm plan, considering its contribution to the improvement of farm’s current performance and trade-offs between objectives. In case the farmer identified the most preferred alternative activity in terms of objectives, but he was not satisfied with the cropping plan corresponding to these objectives, we went back to the file with all 900 alternatives and tried to find the best compromise.
Farmers’ multiple objectives
43
Next, we derived weights for different objectives by comparing the values for objectives from the preferred alternative farm plan with the ideal and anti-ideal values for objectives from the whole set of generated alternative farm plans. Comparison of weights wi, wp and wa
We compared weights for different objectives obtained from different methods in the study. We used the percentage of absolute deviation (PAD) to estimate the absolute deviation between different sets of weights (Hazell and Norton 1986):
(equation 3.4)
where and are the weights of objectives obtained from different methods that are being compared. By using PAD we could determine how close different sets of objectives relate to each other. In addition, we used the Pearson correlation coefficient (r). Whereas the PAD reflects much of the level of the weights, the correlation rather reflects the ranking. 3.3 Results 3.3.1 Interviews – stated weights wi Table 3.3 includes the derived stated weights wi for the objectives based on interval ranking. All respondents (n=6) were internally consistent (there was an association between both interval and ordinal ranking methods at P < 0.05).
From the results in Table 3.3 we observe that each farmer demonstrated a unique pattern regarding stated importance of objectives. However, there were certain similarities in ranking of objectives among farmers. In most cases farmers found several objectives equally important. Farm economic result and soil quality (defined as soil organic matter balance) are clearly prioritized. Farms E1 and E2 ranked soil quality higher than farm economic result. The other objectives, especially minimization of working hours, received lower importance weights. 3.3.2. Current farm performance – realized weights wp The starting point for generation of alternative farm plans for each farm is given in Figure 3.2. The figure demonstrates how each farm currently performs in terms of different objectives within the sample of farms. The data used to explain current farm performance is given in Appendix 3.A.
binnenwerk.indd 42 23-2-2016 21:54:53

Chapter 3
42
(equation 3.2) where is the weight for an objective from a generated alternative farm plan, and
are the ideal and anti-ideal values, respectively, for the rth objective within the set of generated alternative farm plans (j); is the outcome that corresponds to the jth farm plan when it is evaluated according to the rth objective (here, it is the value for rth objectives from the current farm plan). According to this approach, all the weights are bound between 0 (ideal value) and 1 (anti-ideal value) and represent distances or degrees of discrepancy from the ideal value. We normalized the weights to let the sum of weights for all objectives equal to 1 for each farm plan. In addition, we reversed the ideal and anti-ideal values with 1 becoming an ideal value instead of 0:
(equation 3.3)
where is the normalized weight for an objective from a generated alternative farm plan. The objectives with the weights, that are closer to the ideal value 1, are considered more important. Preferred adaptation option – strategic weights wa In the second round of interviews each farmer was asked to indicate the most preferred alternative farm plan generated by the model. The selection of the most preferred alternative represented farmer’s strategic decision as to the choice of adaptation options. The procedure to present the model results to the farmer included the following steps. Firstly, the model FarmDESIGN was presented and briefly explained (model components, inputs, outputs). Secondly, the farmer was shown clouds formed by all alternative options (n=900) generated by the model for their own farm. The clouds represent trade-offs between different objectives. Current performance of the farm was indicated in the graphs. Thirdly, the farmer was shown a list of 25-30 alternative solutions that were pre-selected from the full set of alternatives. This list included a cropping pattern and values for all 5 objectives associated to each of the alternative activities. For each objective we also provided the relative change compared to the current farm plan (improvement or worsening of objective values). The pre-selection of activities was based on: a) analyses of trade-offs between objectives that can still be improved and other important objectives for the farmer (based on ranking of objectives and farm current performance); b) farmer’s crop preferences stated in the first interview; c) production restrictions for certain crops stated in the first interview. The farmer was asked to indicate the most attractive alternative farm plan, considering its contribution to the improvement of farm’s current performance and trade-offs between objectives. In case the farmer identified the most preferred alternative activity in terms of objectives, but he was not satisfied with the cropping plan corresponding to these objectives, we went back to the file with all 900 alternatives and tried to find the best compromise.
Farmers’ multiple objectives
43
Next, we derived weights for different objectives by comparing the values for objectives from the preferred alternative farm plan with the ideal and anti-ideal values for objectives from the whole set of generated alternative farm plans. Comparison of weights wi, wp and wa
We compared weights for different objectives obtained from different methods in the study. We used the percentage of absolute deviation (PAD) to estimate the absolute deviation between different sets of weights (Hazell and Norton 1986):
(equation 3.4)
where and are the weights of objectives obtained from different methods that are being compared. By using PAD we could determine how close different sets of objectives relate to each other. In addition, we used the Pearson correlation coefficient (r). Whereas the PAD reflects much of the level of the weights, the correlation rather reflects the ranking. 3.3 Results 3.3.1 Interviews – stated weights wi Table 3.3 includes the derived stated weights wi for the objectives based on interval ranking. All respondents (n=6) were internally consistent (there was an association between both interval and ordinal ranking methods at P < 0.05).
From the results in Table 3.3 we observe that each farmer demonstrated a unique pattern regarding stated importance of objectives. However, there were certain similarities in ranking of objectives among farmers. In most cases farmers found several objectives equally important. Farm economic result and soil quality (defined as soil organic matter balance) are clearly prioritized. Farms E1 and E2 ranked soil quality higher than farm economic result. The other objectives, especially minimization of working hours, received lower importance weights. 3.3.2. Current farm performance – realized weights wp The starting point for generation of alternative farm plans for each farm is given in Figure 3.2. The figure demonstrates how each farm currently performs in terms of different objectives within the sample of farms. The data used to explain current farm performance is given in Appendix 3.A.
binnenwerk.indd 43 23-2-2016 21:54:53

Chapter 3
44
Table 3.3 – Normalized weights for objectives, percentage of absolute deviation (PAD) and Pearson correlation (r) between weights obtained from different methods.
Objectives
ER OM NB LR R PAD,
% r
FARM P1
wi interviews 0.25 0.25 0.19 0.06 0.25 Wi-Wp 92 0.29 wp performance 0.59 0.04 0.31 0.04 0.02 Wp-Wa 56 0.96 wa preferred alternative 0.37 0.18 0.25 0.12 0.08 Wi-Wa 48 0.32
FARM P2 wi interviews 0.23 0.23 0.18 0.18 0.18 Wi-Wp 40 0.25 wp performance 0.35 0.11 0.22 0.23 0.10 Wp-Wa 16 0.94 wa preferred alternative 0.32 0.17 0.18 0.22 0.12 Wi-Wa 25 0.52
FARM P3 wi interviews 0.22 0.22 0.11 0.22 0.22 Wi-Wp 28 -0.12 wp performance 0.22 0.15 0.21 0.26 0.16 Wp-Wa 14 0.86 wa preferred alternative 0.28 0.12 0.22 0.24 0.14 Wi-Wa 37 -0.16
FARM N1 wi interviews 0.21 0.21 0.21 0.21 0.17 Wi-Wp 32 0.64 wp performance 0.28 0.22 0.29 0.12 0.10 Wp-Wa 0 1.00 wa preferred alternative 0.28 0.22 0.29 0.12 0.10 Wi-Wa 32 0.64
FARM E1 wi interviews 0.19 0.24 0.24 0.09 0.24 Wi-Wp 62 0.19 wp performance 0.32 0.10 0.40 0.11 0.07 Wp-Wa 8 0.99 wa preferred alternative 0.34 0.11 0.36 0.11 0.08 Wi-Wa 59 0.18
FARM E2 wi interviews 0.16 0.34 0.16 0.16 0.16 Wi-Wp 37 -0.53 wp performance 0.21 0.17 0.17 0.25 0.21 Wp-Wa 36 -0.35 wa preferred alternative 0.23 0.14 0.32 0.17 0.14 Wi-Wa 47 -0.44
AVERAGE wi interviews 0.21 0.25 0.18 0.15 0.20 Wi-Wp 49 -0.15 wp performance 0.33 0.13 0.27 0.17 0.11 Wp-Wa 22 0.98 wa preferred alternative 0.30 0.16 0.27 0.16 0.11 Wi-Wa 41 -0.03
Farmers’ multiple objectives
45
Figure 3.2 – Performance of current farm plans within the sample.
Farms P2 and E1 showed the best performance in terms of economic result. These
farms grow seed onion and winter carrot, the crops with the highest gross margin (higher than 7600€/ha). Farms N1, P1 and E1 performed best within the sample on the soil organic matter balance. These farms either applied a lot of organic fertilizer (farms P1 and E1) or had a large share of crops that added a large amount of effective organic matter to the soil (for farm N1 the share of wheat in the rotation is 0.33). The best performance in terms of nitrogen balance was observed for farm E1. This farm has green peas in its rotation, which does not require mineral nitrogen supply. The application of nitrogen for seed potato, which has a 0.3 share in the farm’s rotation, did not exceed the average of 116 kg N/ha for Flevoland, as it is often the case on other farms. Farms P3, P2 and E2 demonstrated the best performance for labour requirement. These farms grow a large share of crops with lowest labour requirements (wheat, sugar beet and green peas have joint shares in the farm plans within the range of 0.5-0.6). In terms of gross margin variance, or risk, the best performing farm within the sample was E2. Farm E2 avoided the combination of seed onion and consumption (or seed) potato in the rotation, in contrast to most of the other farms. Seed onion and potato are the crops with high co-variances of gross margins, which means that the
binnenwerk.indd 44 23-2-2016 21:54:54

Chapter 3
44
Table 3.3 – Normalized weights for objectives, percentage of absolute deviation (PAD) and Pearson correlation (r) between weights obtained from different methods.
Objectives
ER OM NB LR R PAD,
% r
FARM P1
wi interviews 0.25 0.25 0.19 0.06 0.25 Wi-Wp 92 0.29 wp performance 0.59 0.04 0.31 0.04 0.02 Wp-Wa 56 0.96 wa preferred alternative 0.37 0.18 0.25 0.12 0.08 Wi-Wa 48 0.32
FARM P2 wi interviews 0.23 0.23 0.18 0.18 0.18 Wi-Wp 40 0.25 wp performance 0.35 0.11 0.22 0.23 0.10 Wp-Wa 16 0.94 wa preferred alternative 0.32 0.17 0.18 0.22 0.12 Wi-Wa 25 0.52
FARM P3 wi interviews 0.22 0.22 0.11 0.22 0.22 Wi-Wp 28 -0.12 wp performance 0.22 0.15 0.21 0.26 0.16 Wp-Wa 14 0.86 wa preferred alternative 0.28 0.12 0.22 0.24 0.14 Wi-Wa 37 -0.16
FARM N1 wi interviews 0.21 0.21 0.21 0.21 0.17 Wi-Wp 32 0.64 wp performance 0.28 0.22 0.29 0.12 0.10 Wp-Wa 0 1.00 wa preferred alternative 0.28 0.22 0.29 0.12 0.10 Wi-Wa 32 0.64
FARM E1 wi interviews 0.19 0.24 0.24 0.09 0.24 Wi-Wp 62 0.19 wp performance 0.32 0.10 0.40 0.11 0.07 Wp-Wa 8 0.99 wa preferred alternative 0.34 0.11 0.36 0.11 0.08 Wi-Wa 59 0.18
FARM E2 wi interviews 0.16 0.34 0.16 0.16 0.16 Wi-Wp 37 -0.53 wp performance 0.21 0.17 0.17 0.25 0.21 Wp-Wa 36 -0.35 wa preferred alternative 0.23 0.14 0.32 0.17 0.14 Wi-Wa 47 -0.44
AVERAGE wi interviews 0.21 0.25 0.18 0.15 0.20 Wi-Wp 49 -0.15 wp performance 0.33 0.13 0.27 0.17 0.11 Wp-Wa 22 0.98 wa preferred alternative 0.30 0.16 0.27 0.16 0.11 Wi-Wa 41 -0.03
Farmers’ multiple objectives
45
Figure 3.2 – Performance of current farm plans within the sample.
Farms P2 and E1 showed the best performance in terms of economic result. These
farms grow seed onion and winter carrot, the crops with the highest gross margin (higher than 7600€/ha). Farms N1, P1 and E1 performed best within the sample on the soil organic matter balance. These farms either applied a lot of organic fertilizer (farms P1 and E1) or had a large share of crops that added a large amount of effective organic matter to the soil (for farm N1 the share of wheat in the rotation is 0.33). The best performance in terms of nitrogen balance was observed for farm E1. This farm has green peas in its rotation, which does not require mineral nitrogen supply. The application of nitrogen for seed potato, which has a 0.3 share in the farm’s rotation, did not exceed the average of 116 kg N/ha for Flevoland, as it is often the case on other farms. Farms P3, P2 and E2 demonstrated the best performance for labour requirement. These farms grow a large share of crops with lowest labour requirements (wheat, sugar beet and green peas have joint shares in the farm plans within the range of 0.5-0.6). In terms of gross margin variance, or risk, the best performing farm within the sample was E2. Farm E2 avoided the combination of seed onion and consumption (or seed) potato in the rotation, in contrast to most of the other farms. Seed onion and potato are the crops with high co-variances of gross margins, which means that the
Farmers’ multiple objectives
45
Figure 3.2 – Performance of current farm plans within the sample.
Farms P2 and E1 showed the best performance in terms of economic result. These
farms grow seed onion and winter carrot, the crops with the highest gross margin (higher than 7600€/ha). Farms N1, P1 and E1 performed best within the sample on the soil organic matter balance. These farms either applied a lot of organic fertilizer (farms P1 and E1) or had a large share of crops that added a large amount of effective organic matter to the soil (for farm N1 the share of wheat in the rotation is 0.33). The best performance in terms of nitrogen balance was observed for farm E1. This farm has green peas in its rotation, which does not require mineral nitrogen supply. The application of nitrogen for seed potato, which has a 0.3 share in the farm’s rotation, did not exceed the average of 116 kg N/ha for Flevoland, as it is often the case on other farms. Farms P3, P2 and E2 demonstrated the best performance for labour requirement. These farms grow a large share of crops with lowest labour requirements (wheat, sugar beet and green peas have joint shares in the farm plans within the range of 0.5-0.6). In terms of gross margin variance, or risk, the best performing farm within the sample was E2. Farm E2 avoided the combination of seed onion and consumption (or seed) potato in the rotation, in contrast to most of the other farms. Seed onion and potato are the crops with high co-variances of gross margins, which means that the
binnenwerk.indd 45 23-2-2016 21:54:56

Chapter 3
46
simultaneous appearance of these crops in a farm plan makes it more risky due to both yield and price variations for these crops.
The FarmDESIGN model generated clouds of alternative farm plans for each farm. For each alternative farm plan the model calculated the values of performance indicators that were selected as objectives. By plotting all alternative farm plans in two-dimensional spaces we assessed the relations between different objectives. We found that not all pairs of objectives represented trade-offs given the dataset we used. For example, there was a trade-off between the objectives economic result and organic matter balance, but no trade-off between economic result and nitrogen balance within the solution space we considered, i.e. economic result improved with a lower nitrogen balance (Figure 3.3). The no-trade-off situation between economic result and nitrogen balance is explained by policy regulations of nitrogen application in the Netherlands (see also section 3.4 Discussion).
Figure 3.3 – Performance of generated alternative farm plans in terms of economic result and organic matter balance and economic result and nitrogen balance (farm P3).
Table 3.4 presents the results on realized weights of objectives derived from
current farm performance relative to the solution space defined by the performance of available alternatives. From the obtained weights for different objectives we observed that all surveyed farms (except for E2) performed well as to the economic result (especially farms P1and P2 are close to the maximum achievable economic result with their current production pattern). Performance in terms of labour requirement and nitrogen balance varied significantly among farms. However, in general farms performed relatively better as to the latter objectives compared to their performance in terms of organic matter balance and risk. None of the farms demonstrated an optimal performance for these two objectives.
Farmers’ multiple objectives
47
Table 3.4 – Importance weights of objectives derived from current performance (wp) and from preferred alternative farm plan (wa).
Farm ER OM NB LR R €/ha Kg OM/ha kg N/ha hrs/ha €/ha
P1 current1 3144 -661 61 42 1869 alternative2 2898 -384 47 36 1629 ideal3 3543 416 -19 13 209 anti-ideal3 71 -936 132 44 1927 wp
4 0.59 0.04 0.31 0.04 0.02 wa
4 0.37 0.18 0.25 0.12 0.08 P2 current 4660 -2332 33 22 1273 alternative 4387 -2127 51 22 1195 ideal 4891 -1463 -42 13 229 anti-ideal 189 -2703 139 37 1658 wp 0.35 0.11 0.22 0.23 0.10 wa 0.32 0.17 0.18 0.22 0.12 P3 current 3069 -2283 57 20 1108 alternative 3477 -2475 64 24 1243 ideal 4752 -1515 -21 13 223 anti-ideal 101 -2884 179 41 1843 wp 0.22 0.15 0.21 0.26 0.16 wa 0.28 0.12 0.22 0.24 0.14 N1 current 3134 -702 45 30 1368 alternative 3134 -702 45 30 1368 ideal 4931 -22 -45 13 227 anti-ideal 145 -1344 199 36 1664 wp 0.28 0.22 0.29 0.12 0.10 wa 0.28 0.22 0.29 0.12 0.10 E1 current 3809 -928 16 36 1673 alternative 4015 -878 30 36 1643 ideal 5019 87 3 19 504 anti-ideal 408 -1206 174 42 1888 wp 0.32 0.10 0.40 0.11 0.07 wa 0.34 0.11 0.36 0.11 0.08 E2 current 2491 -2127 49 24 1011 alternative 2655 -2199 -6 29 1283 ideal 4760 -1358 -39 13 233 anti-ideal 118 -2633 108 40 1793 wp 0.21 0.17 0.17 0.25 0.21 wa 0.23 0.14 0.32 0.17 0.14
1current - values for objectives from current farm performance 2alternative – values for objectives from preferred alternative farm plan 3ideal and anti-ideal – best and worst values for objectives, respectively (depending on the direction of optimization: maximization or minimization) from the cloud of generated alternative farm plans 4wp – weights for objectives from current farm performance; wa – weights for objectives from preferred alternative farm plan; both wp and wa are within the range of 0.00 (anti-ideal value) to 1.00 (ideal value)
Chapter 3
46
simultaneous appearance of these crops in a farm plan makes it more risky due to both yield and price variations for these crops.
The FarmDESIGN model generated clouds of alternative farm plans for each farm. For each alternative farm plan the model calculated the values of performance indicators that were selected as objectives. By plotting all alternative farm plans in two-dimensional spaces we assessed the relations between different objectives. We found that not all pairs of objectives represented trade-offs given the dataset we used. For example, there was a trade-off between the objectives economic result and organic matter balance, but no trade-off between economic result and nitrogen balance within the solution space we considered, i.e. economic result improved with a lower nitrogen balance (Figure 3.3). The no-trade-off situation between economic result and nitrogen balance is explained by policy regulations of nitrogen application in the Netherlands (see also section 3.4 Discussion).
Figure 3.3 – Performance of generated alternative farm plans in terms of economic result and organic matter balance and economic result and nitrogen balance (farm P3).
Table 3.4 presents the results on realized weights of objectives derived from
current farm performance relative to the solution space defined by the performance of available alternatives. From the obtained weights for different objectives we observed that all surveyed farms (except for E2) performed well as to the economic result (especially farms P1and P2 are close to the maximum achievable economic result with their current production pattern). Performance in terms of labour requirement and nitrogen balance varied significantly among farms. However, in general farms performed relatively better as to the latter objectives compared to their performance in terms of organic matter balance and risk. None of the farms demonstrated an optimal performance for these two objectives.
binnenwerk.indd 46 23-2-2016 21:54:58

Chapter 3
46
simultaneous appearance of these crops in a farm plan makes it more risky due to both yield and price variations for these crops.
The FarmDESIGN model generated clouds of alternative farm plans for each farm. For each alternative farm plan the model calculated the values of performance indicators that were selected as objectives. By plotting all alternative farm plans in two-dimensional spaces we assessed the relations between different objectives. We found that not all pairs of objectives represented trade-offs given the dataset we used. For example, there was a trade-off between the objectives economic result and organic matter balance, but no trade-off between economic result and nitrogen balance within the solution space we considered, i.e. economic result improved with a lower nitrogen balance (Figure 3.3). The no-trade-off situation between economic result and nitrogen balance is explained by policy regulations of nitrogen application in the Netherlands (see also section 3.4 Discussion).
Figure 3.3 – Performance of generated alternative farm plans in terms of economic result and organic matter balance and economic result and nitrogen balance (farm P3).
Table 3.4 presents the results on realized weights of objectives derived from
current farm performance relative to the solution space defined by the performance of available alternatives. From the obtained weights for different objectives we observed that all surveyed farms (except for E2) performed well as to the economic result (especially farms P1and P2 are close to the maximum achievable economic result with their current production pattern). Performance in terms of labour requirement and nitrogen balance varied significantly among farms. However, in general farms performed relatively better as to the latter objectives compared to their performance in terms of organic matter balance and risk. None of the farms demonstrated an optimal performance for these two objectives.
Farmers’ multiple objectives
47
Table 3.4 – Importance weights of objectives derived from current performance (wp) and from preferred alternative farm plan (wa).
Farm ER OM NB LR R €/ha Kg OM/ha kg N/ha hrs/ha €/ha
P1 current1 3144 -661 61 42 1869 alternative2 2898 -384 47 36 1629 ideal3 3543 416 -19 13 209 anti-ideal3 71 -936 132 44 1927 wp
4 0.59 0.04 0.31 0.04 0.02 wa
4 0.37 0.18 0.25 0.12 0.08 P2 current 4660 -2332 33 22 1273 alternative 4387 -2127 51 22 1195 ideal 4891 -1463 -42 13 229 anti-ideal 189 -2703 139 37 1658 wp 0.35 0.11 0.22 0.23 0.10 wa 0.32 0.17 0.18 0.22 0.12 P3 current 3069 -2283 57 20 1108 alternative 3477 -2475 64 24 1243 ideal 4752 -1515 -21 13 223 anti-ideal 101 -2884 179 41 1843 wp 0.22 0.15 0.21 0.26 0.16 wa 0.28 0.12 0.22 0.24 0.14 N1 current 3134 -702 45 30 1368 alternative 3134 -702 45 30 1368 ideal 4931 -22 -45 13 227 anti-ideal 145 -1344 199 36 1664 wp 0.28 0.22 0.29 0.12 0.10 wa 0.28 0.22 0.29 0.12 0.10 E1 current 3809 -928 16 36 1673 alternative 4015 -878 30 36 1643 ideal 5019 87 3 19 504 anti-ideal 408 -1206 174 42 1888 wp 0.32 0.10 0.40 0.11 0.07 wa 0.34 0.11 0.36 0.11 0.08 E2 current 2491 -2127 49 24 1011 alternative 2655 -2199 -6 29 1283 ideal 4760 -1358 -39 13 233 anti-ideal 118 -2633 108 40 1793 wp 0.21 0.17 0.17 0.25 0.21 wa 0.23 0.14 0.32 0.17 0.14
1current - values for objectives from current farm performance 2alternative – values for objectives from preferred alternative farm plan 3ideal and anti-ideal – best and worst values for objectives, respectively (depending on the direction of optimization: maximization or minimization) from the cloud of generated alternative farm plans 4wp – weights for objectives from current farm performance; wa – weights for objectives from preferred alternative farm plan; both wp and wa are within the range of 0.00 (anti-ideal value) to 1.00 (ideal value)
Chapter 3
46
simultaneous appearance of these crops in a farm plan makes it more risky due to both yield and price variations for these crops.
The FarmDESIGN model generated clouds of alternative farm plans for each farm. For each alternative farm plan the model calculated the values of performance indicators that were selected as objectives. By plotting all alternative farm plans in two-dimensional spaces we assessed the relations between different objectives. We found that not all pairs of objectives represented trade-offs given the dataset we used. For example, there was a trade-off between the objectives economic result and organic matter balance, but no trade-off between economic result and nitrogen balance within the solution space we considered, i.e. economic result improved with a lower nitrogen balance (Figure 3.3). The no-trade-off situation between economic result and nitrogen balance is explained by policy regulations of nitrogen application in the Netherlands (see also section 3.4 Discussion).
Figure 3.3 – Performance of generated alternative farm plans in terms of economic result and organic matter balance and economic result and nitrogen balance (farm P3).
Table 3.4 presents the results on realized weights of objectives derived from
current farm performance relative to the solution space defined by the performance of available alternatives. From the obtained weights for different objectives we observed that all surveyed farms (except for E2) performed well as to the economic result (especially farms P1and P2 are close to the maximum achievable economic result with their current production pattern). Performance in terms of labour requirement and nitrogen balance varied significantly among farms. However, in general farms performed relatively better as to the latter objectives compared to their performance in terms of organic matter balance and risk. None of the farms demonstrated an optimal performance for these two objectives.
binnenwerk.indd 47 23-2-2016 21:54:58

Chapter 3
48
3.3.3 Preferred adaptation option – strategic weights wa
For the farm plan that farmers preferred most out of all generated alternatives, we obtained the values for different objectives and derived importance weights for the objectives (see Table 3.4). Due to the existing trade-off between economic result and organic matter balance, for most of the farms it was not possible to choose an alternative farm plan with a better performance for both objectives simultaneously. Farms P3 and E2 preferred to have improved economic result, while farms P1 and P2 preferred an improved organic matter balance (Table 3.5). For farm E1 there were still options for improving both objectives simultaneously. However, the elicited weights indicated a higher ranking for the objective of economic result compared to the organic matter balance on all farms. Weights for objectives from preferred farm plans depend on the distance of the objective’s value to the ideal and anti-ideal values for that objective within the whole cloud of alternative farm plans. For example, when farmer P1 chooses an alternative farm plan which improves soil organic matter by 55%, a sacrifice 8% of economic result would be required (Table 3.5). But because among all generated options the value of economic result of the preferred farm plan was closer to the achievable maximum than the value of organic matter, economic result received a higher importance weight compared to organic matter (Table 3.4).
The objectives nitrogen balance, labour requirement and risk were considered as secondary by farmers, after they found the best compromise in terms of economic result and soil organic matter balance. The ranking of these objectives from the preferred alternative farm plan depended on existing trade-offs with economic result and organic matter balance.
In terms of cropping pattern, most farmers preferred to have small changes to their farm plan by introducing only one new crop (Table 3.5). Farmers P3 and E2 were not concerned about an increased complexity of the farm plan and allowed 2-3 new crops to enter the alternative farm plan. Farmer N1 was satisfied with his current performance and cropping pattern and responded that he still prefers his own plan above all the generated alternatives.
Farmers’ multiple objectives
49
Tab
le 3
.5–
Com
paris
on b
etw
een
curr
ent a
nd s
elec
ted
alte
rnat
ive
farm
pla
ns in
term
s of c
hang
es in
obj
ectiv
es’
valu
es a
nd c
rop
area
s.
Farm
pla
nsO
bjec
tives
Crop
are
as, h
a
ER €/ha
OM
kg O
M/h
a
NB
kg N
/ha
LR hrs/
ha
R €/ha
WW
SBGP
WC
SPSO
CHGR
CP
P1Cu
rrent
3144
-661
6142
1869
09
00
189
99
0
P1 A
ltern
2898
(-8
%)
-384
(+55
%)
47 (-
33%
)36
(-15
%)
1629
(-13
%)
109
00
189
08
0
P2Cu
rrent
4660
-233
233
2212
7317
120
110
120
017
P2A
ltern
4387
(-6
%)
-213
7 (+
9%)
51 (
+54%
)22
1195
(-6%
)29
00
110
120
017
P3Cu
rrent
3069
-228
357
2015
4421
147
00
140
014
P3A
ltern
3477
(+13
%)
-247
5 (-8
%)
64 (
+12%
)24
(+2
0%)
1243
(-20
%)
147
84
414
05
15
N1C
urre
nt31
34-7
0245
3013
6817
100
011
60
06
N1
Alte
rn*
3134
-702
4530
1368
1710
00
116
00
6
E1 C
urre
nt38
09-9
2816
3616
737
104
518
90
00
E1 A
ltern
4015
(+5%
)-8
78(+
5%)
30 (
+88%
)36
1643
(-2%
)10
73
616
80
00
E2Cu
rrent
2491
-212
749
2410
119
90
00
09
09
E2A
ltern
2655
(+7%
)-2
199
(-3%
)-6
(-88
%)
29 (
+21%
)12
83 (
+27%
)9
80
03
59
01
WW
-win
ter w
heat
; SB-
suga
r bee
t; GP
-gre
en p
eas;
WC-
win
ter
carro
t; SP
-see
d po
tato
; SO
-see
d on
ion;
CH
-chi
cory
; GR
-gra
ss; C
P-co
nsum
ptio
n po
tato
. ER
-farm
eco
nom
ic re
sult;
OM
-org
anic
mat
ter
bala
nce;
NB-
N b
alan
ce; L
R-la
bour
req
uire
men
t;R-
risk
(gro
ss m
argi
n va
rianc
e).
In b
old
are
valu
es fo
r obj
ectiv
es th
at im
prov
ed, u
nder
lined
are
val
ues f
or o
bjec
tives
that
wor
sene
d. P
erce
ntag
e of
cha
nge i
n va
lues
for o
bjec
tives
for a
ltern
ativ
e ac
tiviti
es is
giv
enin
par
enth
esis
. *F
arm
er N
1 se
lect
ed h
isow
n pl
an.
binnenwerk.indd 48 23-2-2016 21:54:58
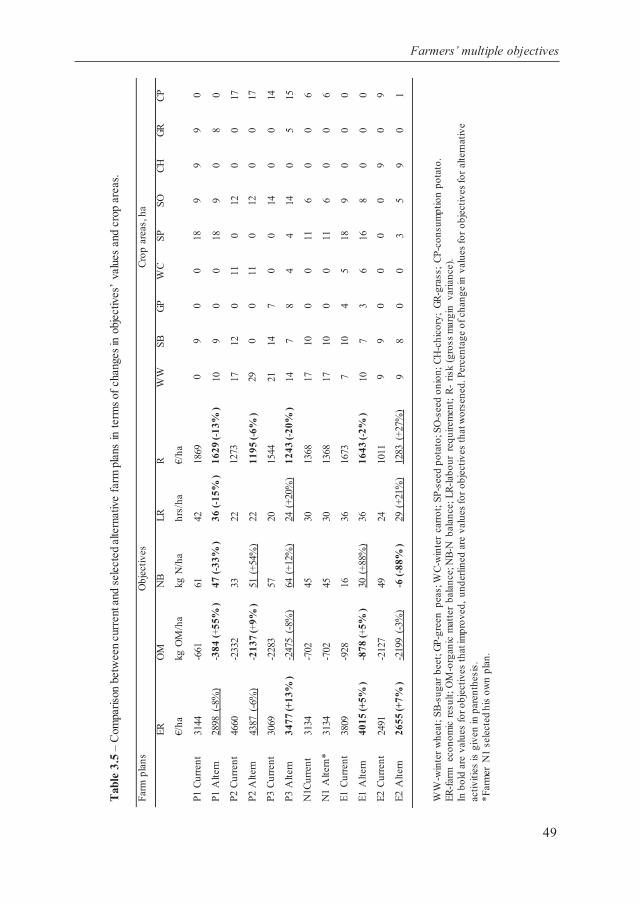
Chapter 3
48
3.3.3 Preferred adaptation option – strategic weights wa
For the farm plan that farmers preferred most out of all generated alternatives, we obtained the values for different objectives and derived importance weights for the objectives (see Table 3.4). Due to the existing trade-off between economic result and organic matter balance, for most of the farms it was not possible to choose an alternative farm plan with a better performance for both objectives simultaneously. Farms P3 and E2 preferred to have improved economic result, while farms P1 and P2 preferred an improved organic matter balance (Table 3.5). For farm E1 there were still options for improving both objectives simultaneously. However, the elicited weights indicated a higher ranking for the objective of economic result compared to the organic matter balance on all farms. Weights for objectives from preferred farm plans depend on the distance of the objective’s value to the ideal and anti-ideal values for that objective within the whole cloud of alternative farm plans. For example, when farmer P1 chooses an alternative farm plan which improves soil organic matter by 55%, a sacrifice 8% of economic result would be required (Table 3.5). But because among all generated options the value of economic result of the preferred farm plan was closer to the achievable maximum than the value of organic matter, economic result received a higher importance weight compared to organic matter (Table 3.4).
The objectives nitrogen balance, labour requirement and risk were considered as secondary by farmers, after they found the best compromise in terms of economic result and soil organic matter balance. The ranking of these objectives from the preferred alternative farm plan depended on existing trade-offs with economic result and organic matter balance.
In terms of cropping pattern, most farmers preferred to have small changes to their farm plan by introducing only one new crop (Table 3.5). Farmers P3 and E2 were not concerned about an increased complexity of the farm plan and allowed 2-3 new crops to enter the alternative farm plan. Farmer N1 was satisfied with his current performance and cropping pattern and responded that he still prefers his own plan above all the generated alternatives.
Farmers’ multiple objectives
49
Tab
le 3
.5–
Com
paris
on b
etw
een
curr
ent a
nd s
elec
ted
alte
rnat
ive
farm
pla
ns in
term
s of c
hang
es in
obj
ectiv
es’
valu
es a
nd c
rop
area
s.
Farm
pla
nsO
bjec
tives
Crop
are
as, h
a
ER €/ha
OM
kg O
M/h
a
NB
kg N
/ha
LR hrs/
ha
R €/ha
WW
SBGP
WC
SPSO
CHGR
CP
P1Cu
rrent
3144
-661
6142
1869
09
00
189
99
0
P1 A
ltern
2898
(-8
%)
-384
(+55
%)
47 (-
33%
)36
(-15
%)
1629
(-13
%)
109
00
189
08
0
P2Cu
rrent
4660
-233
233
2212
7317
120
110
120
017
P2A
ltern
4387
(-6
%)
-213
7 (+
9%)
51 (
+54%
)22
1195
(-6%
)29
00
110
120
017
P3Cu
rrent
3069
-228
357
2015
4421
147
00
140
014
P3A
ltern
3477
(+13
%)
-247
5 (-8
%)
64 (
+12%
)24
(+2
0%)
1243
(-20
%)
147
84
414
05
15
N1C
urre
nt31
34-7
0245
3013
6817
100
011
60
06
N1
Alte
rn*
3134
-702
4530
1368
1710
00
116
00
6
E1 C
urre
nt38
09-9
2816
3616
737
104
518
90
00
E1 A
ltern
4015
(+5%
)-8
78(+
5%)
30 (
+88%
)36
1643
(-2%
)10
73
616
80
00
E2Cu
rrent
2491
-212
749
2410
119
90
00
09
09
E2A
ltern
2655
(+7%
)-2
199
(-3%
)-6
(-88
%)
29 (
+21%
)12
83 (
+27%
)9
80
03
59
01
WW
-win
ter w
heat
; SB-
suga
r bee
t; GP
-gre
en p
eas;
WC-
win
ter
carro
t; SP
-see
d po
tato
; SO
-see
d on
ion;
CH
-chi
cory
; GR
-gra
ss; C
P-co
nsum
ptio
n po
tato
. ER
-farm
eco
nom
ic re
sult;
OM
-org
anic
mat
ter
bala
nce;
NB-
N b
alan
ce; L
R-la
bour
req
uire
men
t;R-
risk
(gro
ss m
argi
n va
rianc
e).
In b
old
are
valu
es fo
r obj
ectiv
es th
at im
prov
ed, u
nder
lined
are
val
ues f
or o
bjec
tives
that
wor
sene
d. P
erce
ntag
e of
cha
nge i
n va
lues
for o
bjec
tives
for a
ltern
ativ
e ac
tiviti
es is
giv
enin
par
enth
esis
. *F
arm
er N
1 se
lect
ed h
isow
n pl
an.
binnenwerk.indd 49 23-2-2016 21:54:59
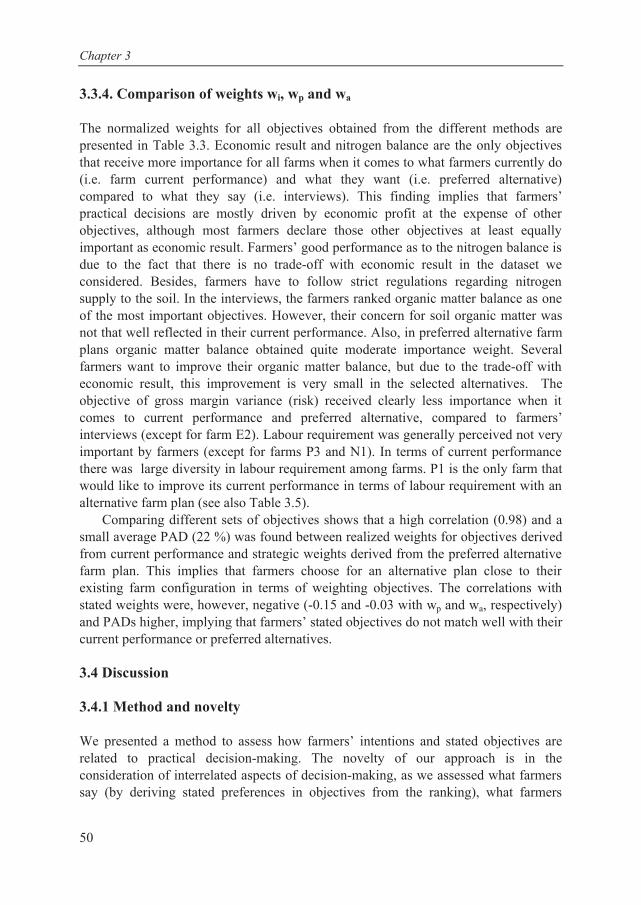
Chapter 3
50
3.3.4. Comparison of weights wi, wp and wa The normalized weights for all objectives obtained from the different methods are presented in Table 3.3. Economic result and nitrogen balance are the only objectives that receive more importance for all farms when it comes to what farmers currently do (i.e. farm current performance) and what they want (i.e. preferred alternative) compared to what they say (i.e. interviews). This finding implies that farmers’ practical decisions are mostly driven by economic profit at the expense of other objectives, although most farmers declare those other objectives at least equally important as economic result. Farmers’ good performance as to the nitrogen balance is due to the fact that there is no trade-off with economic result in the dataset we considered. Besides, farmers have to follow strict regulations regarding nitrogen supply to the soil. In the interviews, the farmers ranked organic matter balance as one of the most important objectives. However, their concern for soil organic matter was not that well reflected in their current performance. Also, in preferred alternative farm plans organic matter balance obtained quite moderate importance weight. Several farmers want to improve their organic matter balance, but due to the trade-off with economic result, this improvement is very small in the selected alternatives. The objective of gross margin variance (risk) received clearly less importance when it comes to current performance and preferred alternative, compared to farmers’ interviews (except for farm E2). Labour requirement was generally perceived not very important by farmers (except for farms P3 and N1). In terms of current performance there was large diversity in labour requirement among farms. P1 is the only farm that would like to improve its current performance in terms of labour requirement with an alternative farm plan (see also Table 3.5).
Comparing different sets of objectives shows that a high correlation (0.98) and a small average PAD (22 %) was found between realized weights for objectives derived from current performance and strategic weights derived from the preferred alternative farm plan. This implies that farmers choose for an alternative plan close to their existing farm configuration in terms of weighting objectives. The correlations with stated weights were, however, negative (-0.15 and -0.03 with wp and wa, respectively) and PADs higher, implying that farmers’ stated objectives do not match well with their current performance or preferred alternatives. 3.4 Discussion 3.4.1 Method and novelty We presented a method to assess how farmers’ intentions and stated objectives are related to practical decision-making. The novelty of our approach is in the consideration of interrelated aspects of decision-making, as we assessed what farmers say (by deriving stated preferences in objectives from the ranking), what farmers
Farmers’ multiple objectives
51
actually do (by assessing farm current performance) and what farmers want (through selected alternative farm plan).
Our approach is based on a combination of Multi-Criteria Decision Making methods. We assume that weights elicited from direct ranking of objectives (from interviews), if normalized, can be compared with weights recovered from current and future farm performance. Sumpsi et al. (1997) argued that the elicitation of weights of objectives through farmer’s actual behaviour (here: performance) is a more straightforward and sound method than through interviews, but that both methods are valid. Our analysis shows that both methods give very different results, and farmers do not do what they intend. Similar discrepancies between optimal and actual resource-use behaviour have been found in consumer studies (Jager et al. 2000, Janssen and Jager 2001).
In the present study we used the FarmDESIGN model (Groot et al. 2012), that performed optimization based on a heuristic approach. The heuristic algorithms of evolutionary computation have proven to be a reliable and practical approach to simulate real-world systems (Mayer et al. 2008, Dury et al. 2012). The FarmDESIGN model allows simultaneous optimization of multiple objectives to approach the trade-off frontier, and thereby produces a cloud of alternative activities which are not necessarily the optimal solutions (Groot and Rossing 2011). We used the outcomes of the model to elicit weights from current performance and from the most preferred alternative farm plan. The ideal and anti-ideal values from the generated solution space determined importance weights for different objectives. Hence, the elicited weights might be sensitive to the calculated solution space, which does not necessarily reach the Pareto surface (i.e. when the values for conflicting objectives did not reach the optimum in the optimization).
Because of intensive data collection, we only assessed six farms. These farms are, however, representative for six farm types, which comprise 30% of the arable land in Flevoland. They include farms with different orientations, size, intensity and specialization, of which the more dominant ones (see Chapter 2) are represented. The specialization ‘diverse arable’ is currently small, but could largely increase towards 2050 under certain scenarios (see Chapter 2). We acknowledge that in terms of size, ‘very large’ farms are missing, while this is a large group and is projected to increase. We are nevertheless confident that the solution space largely covers the possibilities in the region. 3.4.2 Interpretation of results In terms of objectives considered in the research, economic result appeared to be the most important objective for farms’ current performance. These results, however, cannot be generalized to other production circumstances. For example, Berkhout et al. (2010) found that for West African smallholders staple food production, sustainability and risk aversion appear to be more important objectives than gross margin. Some objectives considered in our study received low weights in interviews, while they
binnenwerk.indd 50 23-2-2016 21:54:59

Chapter 3
50
3.3.4. Comparison of weights wi, wp and wa The normalized weights for all objectives obtained from the different methods are presented in Table 3.3. Economic result and nitrogen balance are the only objectives that receive more importance for all farms when it comes to what farmers currently do (i.e. farm current performance) and what they want (i.e. preferred alternative) compared to what they say (i.e. interviews). This finding implies that farmers’ practical decisions are mostly driven by economic profit at the expense of other objectives, although most farmers declare those other objectives at least equally important as economic result. Farmers’ good performance as to the nitrogen balance is due to the fact that there is no trade-off with economic result in the dataset we considered. Besides, farmers have to follow strict regulations regarding nitrogen supply to the soil. In the interviews, the farmers ranked organic matter balance as one of the most important objectives. However, their concern for soil organic matter was not that well reflected in their current performance. Also, in preferred alternative farm plans organic matter balance obtained quite moderate importance weight. Several farmers want to improve their organic matter balance, but due to the trade-off with economic result, this improvement is very small in the selected alternatives. The objective of gross margin variance (risk) received clearly less importance when it comes to current performance and preferred alternative, compared to farmers’ interviews (except for farm E2). Labour requirement was generally perceived not very important by farmers (except for farms P3 and N1). In terms of current performance there was large diversity in labour requirement among farms. P1 is the only farm that would like to improve its current performance in terms of labour requirement with an alternative farm plan (see also Table 3.5).
Comparing different sets of objectives shows that a high correlation (0.98) and a small average PAD (22 %) was found between realized weights for objectives derived from current performance and strategic weights derived from the preferred alternative farm plan. This implies that farmers choose for an alternative plan close to their existing farm configuration in terms of weighting objectives. The correlations with stated weights were, however, negative (-0.15 and -0.03 with wp and wa, respectively) and PADs higher, implying that farmers’ stated objectives do not match well with their current performance or preferred alternatives. 3.4 Discussion 3.4.1 Method and novelty We presented a method to assess how farmers’ intentions and stated objectives are related to practical decision-making. The novelty of our approach is in the consideration of interrelated aspects of decision-making, as we assessed what farmers say (by deriving stated preferences in objectives from the ranking), what farmers
Farmers’ multiple objectives
51
actually do (by assessing farm current performance) and what farmers want (through selected alternative farm plan).
Our approach is based on a combination of Multi-Criteria Decision Making methods. We assume that weights elicited from direct ranking of objectives (from interviews), if normalized, can be compared with weights recovered from current and future farm performance. Sumpsi et al. (1997) argued that the elicitation of weights of objectives through farmer’s actual behaviour (here: performance) is a more straightforward and sound method than through interviews, but that both methods are valid. Our analysis shows that both methods give very different results, and farmers do not do what they intend. Similar discrepancies between optimal and actual resource-use behaviour have been found in consumer studies (Jager et al. 2000, Janssen and Jager 2001).
In the present study we used the FarmDESIGN model (Groot et al. 2012), that performed optimization based on a heuristic approach. The heuristic algorithms of evolutionary computation have proven to be a reliable and practical approach to simulate real-world systems (Mayer et al. 2008, Dury et al. 2012). The FarmDESIGN model allows simultaneous optimization of multiple objectives to approach the trade-off frontier, and thereby produces a cloud of alternative activities which are not necessarily the optimal solutions (Groot and Rossing 2011). We used the outcomes of the model to elicit weights from current performance and from the most preferred alternative farm plan. The ideal and anti-ideal values from the generated solution space determined importance weights for different objectives. Hence, the elicited weights might be sensitive to the calculated solution space, which does not necessarily reach the Pareto surface (i.e. when the values for conflicting objectives did not reach the optimum in the optimization).
Because of intensive data collection, we only assessed six farms. These farms are, however, representative for six farm types, which comprise 30% of the arable land in Flevoland. They include farms with different orientations, size, intensity and specialization, of which the more dominant ones (see Chapter 2) are represented. The specialization ‘diverse arable’ is currently small, but could largely increase towards 2050 under certain scenarios (see Chapter 2). We acknowledge that in terms of size, ‘very large’ farms are missing, while this is a large group and is projected to increase. We are nevertheless confident that the solution space largely covers the possibilities in the region. 3.4.2 Interpretation of results In terms of objectives considered in the research, economic result appeared to be the most important objective for farms’ current performance. These results, however, cannot be generalized to other production circumstances. For example, Berkhout et al. (2010) found that for West African smallholders staple food production, sustainability and risk aversion appear to be more important objectives than gross margin. Some objectives considered in our study received low weights in interviews, while they
binnenwerk.indd 51 23-2-2016 21:54:59

Chapter 3
52
seemed to be considered in practical decision-making. This applies first to nitrogen balance. Although farmers were not concerned about their nitrogen application, they needed to remain within the regulated norms. Besides, in our dataset a low nitrogen balance was achieved with high economic result. Certain objectives did not seem to be very important for current farm plans, but receive more attention when searching for alternatives, e.g. soil organic matter balance.
The selected alternative farm plan determined the strategic weights for objectives for the future situation. The reasoning behind the choice of an alternative farm plan for most of the farmers was simple: to have a more extensive farm plan (e.g. by increasing share of wheat in the rotation) to maintain the soil organic matter balance, but also to maintain income at a level similar to the current situation. Farmers were concerned about their production level in the long term, and therefore almost all alternative farm plans (or adaptation options) increase the soil organic matter balance in first place. Also, the selected plans were close to their current farm plan (to prevent large investments necessary to switch to alternative crops; see also Sterk et al. 2006). Besides, the current level of soil organic matter and soil structure hinder growing certain crops (e.g. carrots or seed potato). Regarding working hours, farmers can tolerate a higher labour input, if the result in terms of gross margin will be high. Since risk is calculated as a variance in gross margins, farmers assumed that losses in one year could be compensated by extra income in another year. Therefore, risk received smaller importance weights in the selected alternative farm plans.
In our study we observe differences in performance in terms of important objective weights between farms from different farm types (orientations). For example, production-oriented farms P1 and P2 have the largest realized weights for economic result derived from the current performance of their farm plans. In the selected alternative farm plans for these farms the priority in strategic weights goes again to economic result. Farms with entrepreneurial orientation (E1 and E2) have also other sources of income next to primary production, and therefore the economic result receives smaller importance weights for these farms. 3.4.3 Use of objective weights in adaptation research and modelling Janssen and van Ittersum (2007) stressed the need to better reflect actual farmer decision-making in bio-economic models. Potential heterogeneity in decision-making structure between different farm types can have impact on the choice of adaptation measures. In previous integrated assessments for arable farms in Flevoland it was assumed that farms have a single objective function (Kanellopoulos et al. 2010, Kanellopoulos et al. 2014). In Kanellopoulos et al. (2010), the objective was maximizing gross margin corrected for risk, but as positive mathematical programming was used, other objectives were partly implicitly considered in the quadratic cost functions. Kanellopoulos et al. (2014) suggested that 41% of the farmers in Flevoland could be considered as profit maximizers, but other objectives were not investigated. Here, we made those other objectives explicit. We therefore will be able
Farmers’ multiple objectives
53
to assign importance weights to a multi-attribute utility function to assess farm type specific adaptation measures using a bio-economic model.
As a result of this study we obtained three sets of weights for multiple objectives. However, not all weights will be finally used in follow-up impact assessment studies. Weights recovered from the interviews will correspond to the farm plans that will not provide enough income to the farmers to be competitive, as in practice the real threshold, or anti-ideal value, for farm economic result is higher than calculated by the model (the model calculated alternative farm plans with economic result starting from 71€/ha, while for most of the farms the acceptable economic result lies within the range 2500-3500€/ha, see Table 3.4). Weights recovered from current farm performance reflected the actual farmers’ decision-making and therefore might appear more suitable. However, these weights are related to the current conditions, which might change in the future (e.g. soil organic matter balance), and thus the performance weights for the objectives might change. Comparing the outcomes of bio-economic modelling studies using different sets of weights will be interesting to understand the importance of different weights of objectives for adaptation.
In terms of importance of particular objectives, economic result and soil organic matter balance seem to be the most crucial ones for strategic decisions (and the selection of adaptation options) of the farmers investigated in this study. 3.5 Conclusions The presented approach provides insight in farmers’ decision-making. We consistently assessed the importance of their objectives from what farmers say (by deriving stated preferences of objectives from the ranking), from what farmers actually do (by analysing current farm performance) and from what farmers want (through selected alternative farm plan).
The stated importance of objectives (from the interview) was not always realized in their practical decision-making (i.e. current performance). However, the strategic weights of farmers’ objectives appeared to be relatively close to the realized importance of objectives, as farmers tended to select an alternative farm plan (i.e. adaptation option) that would not differ largely from their current farm plan in terms of objective prioritizing. At the same time, adaptation preferences of farmers moved in the direction of their stated preferences.
In terms of objectives considered in the research, economic result appeared to be the most important objective for farms’ current performance. Towards the future, farmers were searching for more sustainable management options and were more concerned about soil organic matter. Nitrogen balance does not receive a lot of additional attention from farmers’ side, as nitrogen application is strictly regulated in the Netherlands.
The different sets of weights for multiple objectives from the different methods can be further used in bio-economic modelling, to assess adaptation measures to climatic and socio-economic change.
binnenwerk.indd 52 23-2-2016 21:54:59

Chapter 3
52
seemed to be considered in practical decision-making. This applies first to nitrogen balance. Although farmers were not concerned about their nitrogen application, they needed to remain within the regulated norms. Besides, in our dataset a low nitrogen balance was achieved with high economic result. Certain objectives did not seem to be very important for current farm plans, but receive more attention when searching for alternatives, e.g. soil organic matter balance.
The selected alternative farm plan determined the strategic weights for objectives for the future situation. The reasoning behind the choice of an alternative farm plan for most of the farmers was simple: to have a more extensive farm plan (e.g. by increasing share of wheat in the rotation) to maintain the soil organic matter balance, but also to maintain income at a level similar to the current situation. Farmers were concerned about their production level in the long term, and therefore almost all alternative farm plans (or adaptation options) increase the soil organic matter balance in first place. Also, the selected plans were close to their current farm plan (to prevent large investments necessary to switch to alternative crops; see also Sterk et al. 2006). Besides, the current level of soil organic matter and soil structure hinder growing certain crops (e.g. carrots or seed potato). Regarding working hours, farmers can tolerate a higher labour input, if the result in terms of gross margin will be high. Since risk is calculated as a variance in gross margins, farmers assumed that losses in one year could be compensated by extra income in another year. Therefore, risk received smaller importance weights in the selected alternative farm plans.
In our study we observe differences in performance in terms of important objective weights between farms from different farm types (orientations). For example, production-oriented farms P1 and P2 have the largest realized weights for economic result derived from the current performance of their farm plans. In the selected alternative farm plans for these farms the priority in strategic weights goes again to economic result. Farms with entrepreneurial orientation (E1 and E2) have also other sources of income next to primary production, and therefore the economic result receives smaller importance weights for these farms. 3.4.3 Use of objective weights in adaptation research and modelling Janssen and van Ittersum (2007) stressed the need to better reflect actual farmer decision-making in bio-economic models. Potential heterogeneity in decision-making structure between different farm types can have impact on the choice of adaptation measures. In previous integrated assessments for arable farms in Flevoland it was assumed that farms have a single objective function (Kanellopoulos et al. 2010, Kanellopoulos et al. 2014). In Kanellopoulos et al. (2010), the objective was maximizing gross margin corrected for risk, but as positive mathematical programming was used, other objectives were partly implicitly considered in the quadratic cost functions. Kanellopoulos et al. (2014) suggested that 41% of the farmers in Flevoland could be considered as profit maximizers, but other objectives were not investigated. Here, we made those other objectives explicit. We therefore will be able
Farmers’ multiple objectives
53
to assign importance weights to a multi-attribute utility function to assess farm type specific adaptation measures using a bio-economic model.
As a result of this study we obtained three sets of weights for multiple objectives. However, not all weights will be finally used in follow-up impact assessment studies. Weights recovered from the interviews will correspond to the farm plans that will not provide enough income to the farmers to be competitive, as in practice the real threshold, or anti-ideal value, for farm economic result is higher than calculated by the model (the model calculated alternative farm plans with economic result starting from 71€/ha, while for most of the farms the acceptable economic result lies within the range 2500-3500€/ha, see Table 3.4). Weights recovered from current farm performance reflected the actual farmers’ decision-making and therefore might appear more suitable. However, these weights are related to the current conditions, which might change in the future (e.g. soil organic matter balance), and thus the performance weights for the objectives might change. Comparing the outcomes of bio-economic modelling studies using different sets of weights will be interesting to understand the importance of different weights of objectives for adaptation.
In terms of importance of particular objectives, economic result and soil organic matter balance seem to be the most crucial ones for strategic decisions (and the selection of adaptation options) of the farmers investigated in this study. 3.5 Conclusions The presented approach provides insight in farmers’ decision-making. We consistently assessed the importance of their objectives from what farmers say (by deriving stated preferences of objectives from the ranking), from what farmers actually do (by analysing current farm performance) and from what farmers want (through selected alternative farm plan).
The stated importance of objectives (from the interview) was not always realized in their practical decision-making (i.e. current performance). However, the strategic weights of farmers’ objectives appeared to be relatively close to the realized importance of objectives, as farmers tended to select an alternative farm plan (i.e. adaptation option) that would not differ largely from their current farm plan in terms of objective prioritizing. At the same time, adaptation preferences of farmers moved in the direction of their stated preferences.
In terms of objectives considered in the research, economic result appeared to be the most important objective for farms’ current performance. Towards the future, farmers were searching for more sustainable management options and were more concerned about soil organic matter. Nitrogen balance does not receive a lot of additional attention from farmers’ side, as nitrogen application is strictly regulated in the Netherlands.
The different sets of weights for multiple objectives from the different methods can be further used in bio-economic modelling, to assess adaptation measures to climatic and socio-economic change.
binnenwerk.indd 53 23-2-2016 21:54:59

Chapter 3
54
Farmers’ multiple objectives
55
A.3 xidneppA
)deunitnoc(–
snalp mraf tnerruc fo scitsiretcarah
C.
ah/gk ,rezilitref laicifitrA
cinagrorezilitref
erahs ,ecirp
gk/€y
dlei, ah/g
1000
knoitavitluc c
stsoah/€ ,
seuneveR,
/€ah
,MG /€
ah,riuqer.baL
srh/
ah ,
MO.ffE
ah/gkN
PK
ah/g
1Eteeb ragus
2.040.0
085361
00235651
410041
8210
00
saep neerg90.0
71.07
0710911
020111
00572
00
52torrac retni
w90.0
41.058
299200911
809812
051511
0042
52otatop dees
23.062.0
543367
007117604
07009
411631
0420
noino dees71.0
31.008
727200401
376773
051331
94042
02E
taehw retni
w52.0
41.001
6870041
41631
0562312
240
0teeb ragus
52.040.0
095361
00635691
410041
2210
090
otatop noitpmusnoc
52.041.0
550162
00770905
62009
953531
6630
yrocihc52.0
31.053
55220554
592244
05642
83371
0
1000
k
Chapter 3
54
App
endi
x 3.
A–
Cha
ract
erist
ics o
f cur
rent
farm
pla
ns.
Arti
ficia
l fe
rtiliz
er,
kg/h
aor
gani
c fe
rtiliz
er
shar
epr
ice,
€/
kgyi
eld,
1000
kg/h
acu
ltiva
tion
cost
s, €
/ha
Reve
nues
,€/
haGM
, €/
haLa
b.re
quir,
hrs/
haEf
f.OM
, kg
/ha
NP
K10
00kg
/ha
P1 seed
pot
ato
0.33
0.26
4476
3311
440
3807
7090
030
00
20su
gar b
eet
0.17
0.04
9016
3536
0019
6514
1400
540
020
seed
oni
on0.
170.
1390
2727
1170
089
7337
150
00
020
gras
s0.
170.
047
805
280
-525
1420
0054
00
20ch
icor
y0.
170.
1335
2255
4550
2295
4465
00
00
20P2 w
inte
r whe
at0.
250.
1411
786
1540
754
1326
5081
00
30su
gar b
eet
0.17
0.04
100
1635
4000
2365
1414
0012
00
00
cons
umpt
ion
pota
to0.
250.
1463
2610
8820
6210
2690
054
018
040
seed
oni
on0.
20.
1370
2727
9100
6373
3715
012
548
930
win
ter c
arro
t0.
130.
1485
2992
1190
089
0821
150
540
112
0P3 w
inte
r whe
at0.
30.
1410
786
1400
614
1326
5081
00
50su
gar b
eet
0.2
0.04
100
1635
4000
2365
1414
0010
80
00
cons
umpt
ion
pota
to0.
20.
1455
2960
7700
4740
2690
021
451
969
seed
oni
on0.
20.
1370
2727
9100
6373
3715
015
246
013
.5gr
een
peas
0.1
0.17
817
013
6011
9011
500
2769
00
N1
win
ter w
heat
0.33
0.14
1178
615
4075
413
2650
199
00
0su
gar b
eet
0.17
0.04
100
1635
4000
2365
1414
0012
20
900
cons
umpt
ion
pota
to0.
070.
1463
2960
8820
5860
2690
026
535
150
0se
ed o
nion
0.17
0.13
7027
2791
0063
7337
150
140
1815
50
seed
pot
ato
0.26
0.26
4576
3311
700
4067
7090
072
4296
0
binnenwerk.indd 54 23-2-2016 21:55:01

Farmers’ multiple objectives
55
A.3 xidneppA
)deunitnoc(–
snalp mraf tnerruc fo scitsiretcarah
C.
ah/gk ,rezilitref laicifitrA
cinagrorezilitref
erahs ,ecirp
gk/€y
dlei, ah/g
1000
knoitavitluc c
stsoah/€ ,
seuneveR,
/€ah
,MG /€
ah,riuqer.baL
srh/
ah ,
MO.ffE
ah/gkN
PK
ah/g
1Eteeb ragus
2.040.0
085361
00235651
410041
8210
00
saep neerg90.0
71.07
0710911
020111
00572
00
52torrac retni
w90.0
41.058
299200911
809812
051511
0042
52otatop dees
23.062.0
543367
007117604
07009
411631
0420
noino dees71.0
31.008
727200401
376773
051331
94042
02E
taehw retni
w52.0
41.001
6870041
41631
0562312
240
0teeb ragus
52.040.0
095361
00635691
410041
2210
090
otatop noitpmusnoc
52.041.0
550162
00770905
62009
953531
6630
yrocihc52.0
31.053
55220554
592244
05642
83371
0
1000
k
Chapter 3
54
App
endi
x 3.
A–
Cha
ract
erist
ics o
f cur
rent
farm
pla
ns.
Arti
ficia
l fe
rtiliz
er,
kg/h
aor
gani
c fe
rtiliz
er
shar
epr
ice,
€/
kgyi
eld,
1000
kg/h
acu
ltiva
tion
cost
s, €
/ha
Reve
nues
,€/
haGM
, €/
haLa
b.re
quir,
hrs/
haEf
f.OM
, kg
/ha
NP
K10
00kg
/ha
P1 seed
pot
ato
0.33
0.26
4476
3311
440
3807
7090
030
00
20su
gar b
eet
0.17
0.04
9016
3536
0019
6514
1400
540
020
seed
oni
on0.
170.
1390
2727
1170
089
7337
150
00
020
gras
s0.
170.
047
805
280
-525
1420
0054
00
20ch
icor
y0.
170.
1335
2255
4550
2295
4465
00
00
20P2 w
inte
r whe
at0.
250.
1411
786
1540
754
1326
5081
00
30su
gar b
eet
0.17
0.04
100
1635
4000
2365
1414
0012
00
00
cons
umpt
ion
pota
to0.
250.
1463
2610
8820
6210
2690
054
018
040
seed
oni
on0.
20.
1370
2727
9100
6373
3715
012
548
930
win
ter c
arro
t0.
130.
1485
2992
1190
089
0821
150
540
112
0P3 w
inte
r whe
at0.
30.
1410
786
1400
614
1326
5081
00
50su
gar b
eet
0.2
0.04
100
1635
4000
2365
1414
0010
80
00
cons
umpt
ion
pota
to0.
20.
1455
2960
7700
4740
2690
021
451
969
seed
oni
on0.
20.
1370
2727
9100
6373
3715
015
246
013
.5gr
een
peas
0.1
0.17
817
013
6011
9011
500
2769
00
N1
win
ter w
heat
0.33
0.14
1178
615
4075
413
2650
199
00
0su
gar b
eet
0.17
0.04
100
1635
4000
2365
1414
0012
20
900
cons
umpt
ion
pota
to0.
070.
1463
2960
8820
5860
2690
026
535
150
0se
ed o
nion
0.17
0.13
7027
2791
0063
7337
150
140
1815
50
seed
pot
ato
0.26
0.26
4576
3311
700
4067
7090
072
4296
0
binnenwerk.indd 55 23-2-2016 21:55:02

Chapter 3
56
Appendix 3.B – Rotational constraints included in FarmDESIGN Rotational constraints Included in FarmDESIGN Remarks
• Timing 1. Sowing and harvesting dates 2. Minimum inter-crop period
• Sequence and frequency 3. Restriction on crop successions 4. Maximum frequency of each crop in rotation1:
Sugar beet Winter wheat
Green peas Winter carrot
Seed potato Seed onion
Chicory 5. Maximum frequency of groups of crops in rotation:
Root and tuber crops Potatoes
6. Minimum period before repeating a crop • Farm specific feasibility and applicability
7. Maximum lengths of rotation in years 8. Maximum number of different crops in rotation 9. Maximum number of main and secondary crops: Main crops (sugar beet, seed potato, seed onion, winter wheat,
chicory) Secondary crops (winter carrot, green peas)
- - -
0.20 0.5
0.17 0.17 0.25 0.17 0.25
0.7 0.33
- - - - - -
Sb quota
1Dogliotti et al. (2004) Appendix 3.C – General and nutrient balances constraints included in FarmDESIGN Constraints Min Max Original farm plan (P1) General & profit constraints GM crops (euro) GM variance (euro) Farm area (ha) Nutrient constraints Balance N (unit) Balance P (unit) Balance K (unit)
0 0 52 -100 0 -100
1000000 1000000 54 300 100 100
169758 100933 54 61 57 -48
Appendix 3.D – Organic matter balance at farm P1 (kg/ha) Inputs Crop residues Green manure Own manure Added manure Outputs Manure degradation SOM degradation Erosion losses Balance
651
0 0
859
787 1572
0 -850
Farmers’ multiple objectives
57
Appendix 3.E – Nutrient balances at farm P1( kg/ha/year) N P K Inputs Crop products to soil Fixation Atmospheric deposition Non-symbiotic fixation Import fertilizer & manure Outputs Export crop products Export animal products Export with manure Balance Inputs Outputs Balance
0 0 241 122 169 145 0 0 205 145 61
0 0 1 0 91 35 0 0 92 35 57
0 0 3 0 115 166 0 0 118 166 -48
1Janssen (1999) 2Calculations by Janssen, depends on the organic matter content
binnenwerk.indd 56 23-2-2016 21:55:02

Chapter 3
56
Appendix 3.B – Rotational constraints included in FarmDESIGN Rotational constraints Included in FarmDESIGN Remarks
• Timing 1. Sowing and harvesting dates 2. Minimum inter-crop period
• Sequence and frequency 3. Restriction on crop successions 4. Maximum frequency of each crop in rotation1:
Sugar beet Winter wheat
Green peas Winter carrot
Seed potato Seed onion
Chicory 5. Maximum frequency of groups of crops in rotation:
Root and tuber crops Potatoes
6. Minimum period before repeating a crop • Farm specific feasibility and applicability
7. Maximum lengths of rotation in years 8. Maximum number of different crops in rotation 9. Maximum number of main and secondary crops: Main crops (sugar beet, seed potato, seed onion, winter wheat,
chicory) Secondary crops (winter carrot, green peas)
- - -
0.20 0.5
0.17 0.17 0.25 0.17 0.25
0.7 0.33
- - - - - -
Sb quota
1Dogliotti et al. (2004) Appendix 3.C – General and nutrient balances constraints included in FarmDESIGN Constraints Min Max Original farm plan (P1) General & profit constraints GM crops (euro) GM variance (euro) Farm area (ha) Nutrient constraints Balance N (unit) Balance P (unit) Balance K (unit)
0 0 52 -100 0 -100
1000000 1000000 54 300 100 100
169758 100933 54 61 57 -48
Appendix 3.D – Organic matter balance at farm P1 (kg/ha) Inputs Crop residues Green manure Own manure Added manure Outputs Manure degradation SOM degradation Erosion losses Balance
651
0 0
859
787 1572
0 -850
Farmers’ multiple objectives
57
Appendix 3.E – Nutrient balances at farm P1( kg/ha/year) N P K Inputs Crop products to soil Fixation Atmospheric deposition Non-symbiotic fixation Import fertilizer & manure Outputs Export crop products Export animal products Export with manure Balance Inputs Outputs Balance
0 0 241 122 169 145 0 0 205 145 61
0 0 1 0 91 35 0 0 92 35 57
0 0 3 0 115 166 0 0 118 166 -48
1Janssen (1999) 2Calculations by Janssen, depends on the organic matter content
binnenwerk.indd 57 23-2-2016 21:55:03

Chapter 3
58
Chapter 4
Crop and farm level adaptation under future climate challenges
Abstract Climate change is expressed in both a shift of mean climatic conditions and an increase in the frequency and severity of weather extremes. The weather extremes are often projected to have a larger impact on agricultural production than gradual increase in temperature or gradual change in precipitation. To cope with the impacts of future climate change, farmers will have to apply adaptation measures at crop and farm level. The choice of the adaptation measures is assumed to be determined by farm resources, current layout and performance of the farm and farmer’s objectives. Here we present a method to assess the importance of crop and farm level measures to adapt to climate change and extreme events considering farmers’ different objectives. We used a multi-objective optimization model to generate alternative farm plans and assess the impacts of previously identified farm and crop level adaptation measures in terms of farm performance on the objectives of maximizing farm economic result and soil organic matter balance. Our results for selected arable farms in the province of Flevoland (the Netherlands) suggest that gradual climate change improves farm performance in terms of farm economic result. The degree of improvement varies per scenario and per farm, depending on the cropping pattern. At the same time, extreme events neutralize positive impacts of gradual climate change. A combination of crop and farm level adaptation is needed for the surveyed farms in terms of improving both farm economic result and organic matter balance. Keywords: climate change, extreme events, agriculture, adaptation measures, multi-objective
optimization
This chapter is to be submitted as: Mandryk M, Reidsma P, van Ittersum MK. Crop and farm level adaptation under future climate challenges: an exploratory study considering multiple objectives for Flevoland, the Netherlands.
binnenwerk.indd 58 23-2-2016 21:55:03

Chapter 4
Crop and farm level adaptation under future climate challenges
Abstract Climate change is expressed in both a shift of mean climatic conditions and an increase in the frequency and severity of weather extremes. The weather extremes are often projected to have a larger impact on agricultural production than gradual increase in temperature or gradual change in precipitation. To cope with the impacts of future climate change, farmers will have to apply adaptation measures at crop and farm level. The choice of the adaptation measures is assumed to be determined by farm resources, current layout and performance of the farm and farmer’s objectives. Here we present a method to assess the importance of crop and farm level measures to adapt to climate change and extreme events considering farmers’ different objectives. We used a multi-objective optimization model to generate alternative farm plans and assess the impacts of previously identified farm and crop level adaptation measures in terms of farm performance on the objectives of maximizing farm economic result and soil organic matter balance. Our results for selected arable farms in the province of Flevoland (the Netherlands) suggest that gradual climate change improves farm performance in terms of farm economic result. The degree of improvement varies per scenario and per farm, depending on the cropping pattern. At the same time, extreme events neutralize positive impacts of gradual climate change. A combination of crop and farm level adaptation is needed for the surveyed farms in terms of improving both farm economic result and organic matter balance. Keywords: climate change, extreme events, agriculture, adaptation measures, multi-objective
optimization
This chapter is to be submitted as: Mandryk M, Reidsma P, van Ittersum MK. Crop and farm level adaptation under future climate challenges: an exploratory study considering multiple objectives for Flevoland, the Netherlands.
binnenwerk.indd 59 23-2-2016 21:55:03

Chapter 4
60
4.1 Introduction Climate change is expressed in both a shift of mean climatic conditions (e.g. temperature and precipitation), and an increase in the frequency and severity of weather extremes (Eitzinger et al. 2013; Porter et al. 2014; Tebaldi et al. 2006). The weather extremes are often projected to have a larger impact on agricultural production than gradual increase in temperature or gradual change in precipitation (Moriondo et al. 2011; Schaap et al. 2013; Van Oort et al. 2012a). More frequent droughts and extreme weather events during the cropping season are likely to increase the number of unfavourable years, which may cause enhanced yield instability and make current agricultural areas less suitable for traditional crops (Olesen and Bindi 2002), with climate change impacts varying across crops and regions (Klein et al. 2014; Supit et al. 2012).
The impacts of climate change that induced changes in extreme weather events have only been assessed at crop level (Eitzinger et al. 2013; White et al. 2011). To cope with the impacts of future climate change farmers will also have to apply adaptation measures at other levels than the crop. Adaptation measures to climate change in agriculture include a large variety of activities directly related to reducing vulnerability to climate change, such as technological developments or changes in farm production practices (Smit and Skinner 2002). The latter also include farm level adjustments in crop rotations by shifting from currently grown to alternative crops and changes in land use (Klein et al. 2013). Cropping plan decisions are crucial steps in crop production processes and have considerable effects on the annual and long-term productivity and profitability of farms (Dury et al. 2012). Only few studies examined changes in crop rotations as adaptation option to climate change (Klein et al. 2014).
There has been much more research on plant response to climate change than on human response to climate change (van Oort et al. 2012b). The chapter on “Food security and food production systems” in the 5th IPCC WG2 report (Porter et al. 2014) has focused mainly on crop level impacts and adaptation – based on the results of crop models and statistical analyses – with little emphasis on farm level adaptation. Several empirical studies have compared climate change impacts in Europe with and without adaptation (Moore and Lobell 2014; Reidsma et al. 2010) and found that adaptation can largely reduce the impacts of climate change and climate variability on European agriculture. Details on the measures, their costs and adoption rates have not been studied, however.
Climate change impact assessment in agriculture needs to be based on integrated assessment and farming systems analysis, and account for adaptation at different levels (Reidsma et al. 2015). The use of bio-economic models linking crop growth models with economic decision models has been suggested in various studies as a way forward towards integrated assessment of adaptation to climate change (Challinor et al. 2009; Finger and Calanca 2011; Lehmann et al. 2013; Olesen et al. 2011; Reidsma et al. 2010; Reidsma et al. 2015). The use of an optimization technique to identify adaptation strategies was only conducted in few studies (Kanellopoulos et al. 2014;
Crop and farm level adaptation
61
Lehmann et al. 2013; Schütze and Schmitz 2010). However, those studies solely addressed impacts of climate change and management on economic yield without considering the multifunctional role of agriculture. Multiple objectives have been considered, but not at farm level (Holzkämper et al. 2015; Klein et al. 2014). Farm level responses towards climate change considering a farmer’s multiple objectives have not yet been assessed.
In Chapter 3 we assessed the role of farmer’s objectives in terms of current farm practices and adaptation preferences. We showed that prioritizing in farmer’s objectives can change when focusing on future adaptation options compared to the current farm performance. Economic result and maintaining the organic matter balance appeared to be the most important farmers’ objectives in strategic decision making involving adaptation in the Dutch province Flevoland (Chapter 3). Weights given to different objectives can however change in the future. Farm structural change will take place and current farms will likely look different around 2050 in terms of economic size, specialization, intensity and farmer’s objectives (Chapter 2).
The present study assesses the role of crop and farm level measures to adapt to climate change considering farmers’ different objectives. More specifically we are aiming at answering the following research questions. 1) What will be the impact of gradual climate change on farm performance? 2) What will be the impact of the changes in future frequency of extreme events on farm performance? 3) How important is crop level adaptation compared to farm level adaptation in improving farm performance on important objectives (i.e. economic result and soil quality maximization) in climate change scenarios with extreme events? 4) How will different farmers’ objectives influence preferences for different adaptation measures to climate change? 4.2 Methods 4.2.1 Farms, farmer’s objectives and farm plans We surveyed six arable farms from the province of Flevoland, The Netherlands (Table 4.1). We assigned each farm to farm types based on the typology developed in Chapter 2.
We previously assessed that objectives of maximizing farm economic result (i.e. gross margin of crops, €/ha) and soil quality (i.e. organic matter balance, kg OM/ha) were most important for the surveyed farmers (Chapter 3). Each of the farms performed differently in terms of the most important objectives, which is attributed mainly to the cropping pattern and the management (Table 4.2).
We also previously asked farmers to indicate the “desired”, or preferred alternative farm plans. Preferred alternative farm plans were initially meant to improve farm performance on the important objectives in the current climate (see Chapter 3).
binnenwerk.indd 60 23-2-2016 21:55:03

Chapter 4
60
4.1 Introduction Climate change is expressed in both a shift of mean climatic conditions (e.g. temperature and precipitation), and an increase in the frequency and severity of weather extremes (Eitzinger et al. 2013; Porter et al. 2014; Tebaldi et al. 2006). The weather extremes are often projected to have a larger impact on agricultural production than gradual increase in temperature or gradual change in precipitation (Moriondo et al. 2011; Schaap et al. 2013; Van Oort et al. 2012a). More frequent droughts and extreme weather events during the cropping season are likely to increase the number of unfavourable years, which may cause enhanced yield instability and make current agricultural areas less suitable for traditional crops (Olesen and Bindi 2002), with climate change impacts varying across crops and regions (Klein et al. 2014; Supit et al. 2012).
The impacts of climate change that induced changes in extreme weather events have only been assessed at crop level (Eitzinger et al. 2013; White et al. 2011). To cope with the impacts of future climate change farmers will also have to apply adaptation measures at other levels than the crop. Adaptation measures to climate change in agriculture include a large variety of activities directly related to reducing vulnerability to climate change, such as technological developments or changes in farm production practices (Smit and Skinner 2002). The latter also include farm level adjustments in crop rotations by shifting from currently grown to alternative crops and changes in land use (Klein et al. 2013). Cropping plan decisions are crucial steps in crop production processes and have considerable effects on the annual and long-term productivity and profitability of farms (Dury et al. 2012). Only few studies examined changes in crop rotations as adaptation option to climate change (Klein et al. 2014).
There has been much more research on plant response to climate change than on human response to climate change (van Oort et al. 2012b). The chapter on “Food security and food production systems” in the 5th IPCC WG2 report (Porter et al. 2014) has focused mainly on crop level impacts and adaptation – based on the results of crop models and statistical analyses – with little emphasis on farm level adaptation. Several empirical studies have compared climate change impacts in Europe with and without adaptation (Moore and Lobell 2014; Reidsma et al. 2010) and found that adaptation can largely reduce the impacts of climate change and climate variability on European agriculture. Details on the measures, their costs and adoption rates have not been studied, however.
Climate change impact assessment in agriculture needs to be based on integrated assessment and farming systems analysis, and account for adaptation at different levels (Reidsma et al. 2015). The use of bio-economic models linking crop growth models with economic decision models has been suggested in various studies as a way forward towards integrated assessment of adaptation to climate change (Challinor et al. 2009; Finger and Calanca 2011; Lehmann et al. 2013; Olesen et al. 2011; Reidsma et al. 2010; Reidsma et al. 2015). The use of an optimization technique to identify adaptation strategies was only conducted in few studies (Kanellopoulos et al. 2014;
Crop and farm level adaptation
61
Lehmann et al. 2013; Schütze and Schmitz 2010). However, those studies solely addressed impacts of climate change and management on economic yield without considering the multifunctional role of agriculture. Multiple objectives have been considered, but not at farm level (Holzkämper et al. 2015; Klein et al. 2014). Farm level responses towards climate change considering a farmer’s multiple objectives have not yet been assessed.
In Chapter 3 we assessed the role of farmer’s objectives in terms of current farm practices and adaptation preferences. We showed that prioritizing in farmer’s objectives can change when focusing on future adaptation options compared to the current farm performance. Economic result and maintaining the organic matter balance appeared to be the most important farmers’ objectives in strategic decision making involving adaptation in the Dutch province Flevoland (Chapter 3). Weights given to different objectives can however change in the future. Farm structural change will take place and current farms will likely look different around 2050 in terms of economic size, specialization, intensity and farmer’s objectives (Chapter 2).
The present study assesses the role of crop and farm level measures to adapt to climate change considering farmers’ different objectives. More specifically we are aiming at answering the following research questions. 1) What will be the impact of gradual climate change on farm performance? 2) What will be the impact of the changes in future frequency of extreme events on farm performance? 3) How important is crop level adaptation compared to farm level adaptation in improving farm performance on important objectives (i.e. economic result and soil quality maximization) in climate change scenarios with extreme events? 4) How will different farmers’ objectives influence preferences for different adaptation measures to climate change? 4.2 Methods 4.2.1 Farms, farmer’s objectives and farm plans We surveyed six arable farms from the province of Flevoland, The Netherlands (Table 4.1). We assigned each farm to farm types based on the typology developed in Chapter 2.
We previously assessed that objectives of maximizing farm economic result (i.e. gross margin of crops, €/ha) and soil quality (i.e. organic matter balance, kg OM/ha) were most important for the surveyed farmers (Chapter 3). Each of the farms performed differently in terms of the most important objectives, which is attributed mainly to the cropping pattern and the management (Table 4.2).
We also previously asked farmers to indicate the “desired”, or preferred alternative farm plans. Preferred alternative farm plans were initially meant to improve farm performance on the important objectives in the current climate (see Chapter 3).
binnenwerk.indd 61 23-2-2016 21:55:03

Chapter 4
62
Table 4.1– Survey data of the six farms on farm structure and resources. The definition and thresholds for farm orientation, size, intensity and specialization are provided in Chapter 2.
Farm
co
de
Structure % UAA1 Flevo-land
Resources Orientation Size Intensity Specialization Area,
ha Labour, hrs/yr
Soil OM2,
% P1 P2 P3 N1 E1 E2
Production Production Production Nature Entrepreneur Entrepreneur
Large Large Large Large Large Medium
High Medium Medium Medium Medium Medium
Diverse mainly root crops Diverse mainly root crops Diverse arable Specialized root crops Diverse mainly root crops Diverse mainly root crops
5.2 19.3 19.3 0.1 4.1 1.4
54 68 70 52 53 36
3300 2860 2750 4080 5000 1600
2.0 4.3 4.5 2.5 2.3 4.2
1UAA is utilized agricultural area 2OM is organic matter
Table 4.2 –Current farm plans in terms of objectives’ values and crop areas.
WW-winter wheat; SB-sugar beet; GP-green peas; WC-winter carrot; SP-seed potato; SO-seed onion; CH-chicory; GR-grass; CP-consumption potato 4.2.2 Climate change, extreme events Climate change scenarios The effects of climate change towards 2050 on crop yields of the surveyed farms were assessed based on the available results on simulated potential yields in Flevoland with the WOFOST model (Van Diepen et al. 1989) for two future climate change scenarios G and W+; without any adaptation, e. g. for cultivar and sowing dates (Reidsma et al. 2015; Wolf et al. 2011; see Appendix 4.A). The climate scenarios have been developed by the Royal Dutch Meteorology Institute (KNMI) (van den Hurk et al. 2006). The G climate scenario assumes a moderate global temperature increase of 1°C by 2050 with no change in atmospheric circulation, whereas the W+ scenario assumes a significant global temperature increase of 2°C by 2050 accompanied by a change in atmospheric circulation, resulting in dryer summers. CO2 concentrations were assumed 478 mol CO2 mol-1 for the G scenario and 567 mol CO2 mol-1 for the W+ scenario.
Farm Objectives Crop areas (ha)
Economic result (k€/ha)
Organic matter
balance (t OM/ha)
WW SB GP WC SP SO CH GR CP
P1 3.14 -0.66 0 9 0 0 18 9 9 9 0 P2 4.66 -2.33 17 12 0 11 0 12 0 0 17 P3 3.07 -2.28 21 14 7 0 0 14 0 0 14 N1 3.13 -0.70 17 10 0 0 11 6 0 0 6 E1 3.81 -0.93 7 10 4 5 18 9 0 0 0 E2 2.50 -2.13 9 9 0 0 0 0 9 0 9
Crop and farm level adaptation
63
Effects of extreme events on crop yields The most relevant climate related risks of extreme events on crop production for the sample farms were identified based on Schaap et al. (2011). In the present study we focus on high value crops in Flevoland, which are the most heavily impacted crops by climate change and have high economic importance (Schaap et al. 2013). Besides, climate change impacts on high value crops determine farm level impacts and therefore influence the choice for adaptation. High value crops for arable farming in Flevoland are seed and consumption potato and seed onion, which comprise a large share in typical crop rotations in the region (from 0.25 to 0.50 on 6 surveyed farms). Although winter carrot also has a high gross margin, the share of this crop in rotations in Flevoland is much smaller and therefore in this thesis we refer to potatoes and onion as high value crops. We assessed five effects from extreme events with damage more than 1000 €/ha (de Wit et al. 2009; Schaap et al. 2013). For seed and consumption potato these are heat wave and warm winter; for seed onion, warm and wet conditions.
We calculated the yield reduction caused by extreme events based on change of frequency of extreme events in the future and average damage of the effects:
, (equation 4.1) where is a relative yield reduction (fraction); D is the average relative yield damage (fraction); is future frequency of an extreme event and is the current frequency. The results are presented in Table 4.3. Table 4.3 – Effects of weather extremes on major arable crops in the North of the Netherlands. Extreme event Yield damage
D Absolute occurrence
(nr/30 years)Frequency
(occurrence/year) Yield reduction Y
min max 1990 G W+ 1990 Fc
GFf
W+Ff
1990 G W+ Seed onion Warm + wet 0.50 0.60 1 10 21 0.03 0.33 0.70 0 0.17 0.37 Seed/consumption potato Heat wave 0.25 0.75 8 14 40 0.27 0.47 1.33 0 0.10 0.52 Warm winter 0.25 0.75 3 7 21 0.10 0.23 0.70 0 0.07 0.32
We further estimated the reduction factors for yield in a year when both extreme events would happen sequentially, i.e. heat wave is followed by a warm winter (the case of seed and consumption potato). Yield reduction from a warm winter should be multiplied with the yield reduction by the heat wave:
, (equation 4.2)
where is a yield after a total damage from both extreme events (t/ha); Y is the original yield (t/ha); is a damage from the first extreme event (fraction); is a damage from the succeeding effect (fraction).
binnenwerk.indd 62 23-2-2016 21:55:04

Chapter 4
62
Table 4.1– Survey data of the six farms on farm structure and resources. The definition and thresholds for farm orientation, size, intensity and specialization are provided in Chapter 2.
Farm
co
de
Structure % UAA1 Flevo-land
Resources Orientation Size Intensity Specialization Area,
ha Labour, hrs/yr
Soil OM2,
% P1 P2 P3 N1 E1 E2
Production Production Production Nature Entrepreneur Entrepreneur
Large Large Large Large Large Medium
High Medium Medium Medium Medium Medium
Diverse mainly root crops Diverse mainly root crops Diverse arable Specialized root crops Diverse mainly root crops Diverse mainly root crops
5.2 19.3 19.3 0.1 4.1 1.4
54 68 70 52 53 36
3300 2860 2750 4080 5000 1600
2.0 4.3 4.5 2.5 2.3 4.2
1UAA is utilized agricultural area 2OM is organic matter
Table 4.2 –Current farm plans in terms of objectives’ values and crop areas.
WW-winter wheat; SB-sugar beet; GP-green peas; WC-winter carrot; SP-seed potato; SO-seed onion; CH-chicory; GR-grass; CP-consumption potato 4.2.2 Climate change, extreme events Climate change scenarios The effects of climate change towards 2050 on crop yields of the surveyed farms were assessed based on the available results on simulated potential yields in Flevoland with the WOFOST model (Van Diepen et al. 1989) for two future climate change scenarios G and W+; without any adaptation, e. g. for cultivar and sowing dates (Reidsma et al. 2015; Wolf et al. 2011; see Appendix 4.A). The climate scenarios have been developed by the Royal Dutch Meteorology Institute (KNMI) (van den Hurk et al. 2006). The G climate scenario assumes a moderate global temperature increase of 1°C by 2050 with no change in atmospheric circulation, whereas the W+ scenario assumes a significant global temperature increase of 2°C by 2050 accompanied by a change in atmospheric circulation, resulting in dryer summers. CO2 concentrations were assumed 478 mol CO2 mol-1 for the G scenario and 567 mol CO2 mol-1 for the W+ scenario.
Farm Objectives Crop areas (ha)
Economic result (k€/ha)
Organic matter
balance (t OM/ha)
WW SB GP WC SP SO CH GR CP
P1 3.14 -0.66 0 9 0 0 18 9 9 9 0 P2 4.66 -2.33 17 12 0 11 0 12 0 0 17 P3 3.07 -2.28 21 14 7 0 0 14 0 0 14 N1 3.13 -0.70 17 10 0 0 11 6 0 0 6 E1 3.81 -0.93 7 10 4 5 18 9 0 0 0 E2 2.50 -2.13 9 9 0 0 0 0 9 0 9
Crop and farm level adaptation
63
Effects of extreme events on crop yields The most relevant climate related risks of extreme events on crop production for the sample farms were identified based on Schaap et al. (2011). In the present study we focus on high value crops in Flevoland, which are the most heavily impacted crops by climate change and have high economic importance (Schaap et al. 2013). Besides, climate change impacts on high value crops determine farm level impacts and therefore influence the choice for adaptation. High value crops for arable farming in Flevoland are seed and consumption potato and seed onion, which comprise a large share in typical crop rotations in the region (from 0.25 to 0.50 on 6 surveyed farms). Although winter carrot also has a high gross margin, the share of this crop in rotations in Flevoland is much smaller and therefore in this thesis we refer to potatoes and onion as high value crops. We assessed five effects from extreme events with damage more than 1000 €/ha (de Wit et al. 2009; Schaap et al. 2013). For seed and consumption potato these are heat wave and warm winter; for seed onion, warm and wet conditions.
We calculated the yield reduction caused by extreme events based on change of frequency of extreme events in the future and average damage of the effects:
, (equation 4.1) where is a relative yield reduction (fraction); D is the average relative yield damage (fraction); is future frequency of an extreme event and is the current frequency. The results are presented in Table 4.3. Table 4.3 – Effects of weather extremes on major arable crops in the North of the Netherlands. Extreme event Yield damage
D Absolute occurrence
(nr/30 years)Frequency
(occurrence/year) Yield reduction Y
min max 1990 G W+ 1990 Fc
GFf
W+Ff
1990 G W+ Seed onion Warm + wet 0.50 0.60 1 10 21 0.03 0.33 0.70 0 0.17 0.37 Seed/consumption potato Heat wave 0.25 0.75 8 14 40 0.27 0.47 1.33 0 0.10 0.52 Warm winter 0.25 0.75 3 7 21 0.10 0.23 0.70 0 0.07 0.32
We further estimated the reduction factors for yield in a year when both extreme events would happen sequentially, i.e. heat wave is followed by a warm winter (the case of seed and consumption potato). Yield reduction from a warm winter should be multiplied with the yield reduction by the heat wave:
, (equation 4.2)
where is a yield after a total damage from both extreme events (t/ha); Y is the original yield (t/ha); is a damage from the first extreme event (fraction); is a damage from the succeeding effect (fraction).
binnenwerk.indd 63 23-2-2016 21:55:04

Chapter 4
64
4.2.3 Adaptation measures Crop level adaptation Adaptation measures against risk of future climate-related extreme events for high value crops in Flevoland have been identified in Schaap et al. (2013). From the list of adaptation measures per crop and per main climate risk we selected measures proposed for the impact of a climatic factor of more than 1000 €/ha/year on average (de Wit et al. 2009) that appeared to be most cost-effective based on Schaap et al. (2013) (Table 4.4). Table 4.4 – Selected adaptation measures at crop level (source: Schaap et al. 2013). Climate risks and adaptation measures Impact
(weight of economic loss)
Effectiveness E (to reduce crop losses due to climatic factor)
Annual costs (k€/ha)
Investment costs (k€/ha)
Seed and consumption potato Heat wave – second growth 0.25-0.75 1. Plant in wider ridges 0.75 - > 50 2. Drip irrigation 0.9 1 - 3. Optimise crop cover 0.5 0-0.5 - Warm winter – early sprouting 0.25-0.75 4. Air conditioning 0.9 0.1-0.2 - Seed onion Warm and wet – fungi infection 0.50-0.60 1. Chemical protection 0.9 0.5-1 10-100 2. UV-light protection 0.9 0.5-1 30
We assumed here that if a farmer implements a combination of adaptation measures against different climate risks associated with extreme events in his farm plan, this might further reduce the crop losses. Practically it means combining the measure against warm winter (i.e. air conditioning) with one of the three measures against heat wave (i.e. plant in wide ridges; drip irrigation; and optimize crop cover). It is unlikely that a farmer would choose a combination of more than two adaptation measures per risk, considering the cost-effectiveness of measures and overlap in effects to reduce the impacts of extreme events. We also assumed that a farmer would always apply the adaptation measure in advance of a growing season, not knowing whether the event will occur, so he would also always have costs of the measures.
We calculated the final yield (i.e. yield with (combinations of) adaptation measures against extreme events applied) in a sequence of calculation steps (see also Table 4.5):
, (equation 4.3)
Crop and farm level adaptation
65
where is a final yield (t/ha); Y is the original yield (no impact of extreme events) (t/ha); and is a yield reduction (fraction) due to application of an adaptation measure a against an extreme event i, calculated as follows:
, (equation 2.4)
where is a relative yield reduction caused by extreme event i (see equation 2.1) and
is the effectiveness of the adaptation measure a (fraction; see Table 4.3). Using the example of seed potato, we can illustrate how the calculation of final
yield (YA) has been performed for farm P1 (see also Table 4.5). Due to climate change, yield of seed potato in 2050W+ was estimated to increase by 2.8% (Reidsma et al. 2015; Wolf et al. 2011). For farm P1 seed potato yield (Y) will become 45.2 t/ha. The yield reduction (Y ) caused by extreme effect “heat wave” is 0.52 (see Table 4.3). There are three adaptation measures proposed against heat wave (see also Table 4.4), each of them with different effectiveness E. Measure 1 (plant in wider ridges), for example, if applied alone, will secure a yield (YA) of 39.3 t/ha due to its effectiveness E to reduce the damage by a heat wave by 0.75. However, the yield will still be affected by “warm winter” (with the yield reduction (Y ) of 0.32). Therefore, the yield (YA) with impacts of both extreme events and adaptation against heat wave by planting in wider ridges will be 26.9 t/ha. Table 4.5– Selected (cost-)effective crop level adaptation measures. Yield reduction and impact of extreme events are presented for W+ scenario for farm P1.
adaptation measures yield2050 (t/ha)
yield
reduc-tion Y 1
yield reduc-tion Y 2
yield reduc-tion Y ai
no impact of extreme
events Y
impact of extreme
events and adapt YA
cost of adaptation measure (k€/ha)
Seed potato 45.2 No adaptation 14.8 n/a
Heat wave 1 plant in wider ridges 0.32 0.13 26.7 - 2 drip irrigation 0.32 0.05 29.2 1.0 3 optimize crop cover 0.32 0.26 22.7 0.25
Warm winter 4 air conditioning 0.52 0.03 21.0 0.15
Heat wave and warm winter 5 plant in wide ridges and air conditioning 0.0039 45.0 0.15
6 drip irrigation and air conditioning 0.0015 45.1 1.15
7 optimize crop cover and air conditioning 0.0078 44.8 0.4
Seed onion 102.8 No adaptation 64.8 n/a
Warm and wet 1 chemical protection 0.04 98.7 0.5-1.0 2 UV-light protection 0.04 98.7 0.5-1.0
binnenwerk.indd 64 23-2-2016 21:55:04

Chapter 4
64
4.2.3 Adaptation measures Crop level adaptation Adaptation measures against risk of future climate-related extreme events for high value crops in Flevoland have been identified in Schaap et al. (2013). From the list of adaptation measures per crop and per main climate risk we selected measures proposed for the impact of a climatic factor of more than 1000 €/ha/year on average (de Wit et al. 2009) that appeared to be most cost-effective based on Schaap et al. (2013) (Table 4.4). Table 4.4 – Selected adaptation measures at crop level (source: Schaap et al. 2013). Climate risks and adaptation measures Impact
(weight of economic loss)
Effectiveness E (to reduce crop losses due to climatic factor)
Annual costs (k€/ha)
Investment costs (k€/ha)
Seed and consumption potato Heat wave – second growth 0.25-0.75 1. Plant in wider ridges 0.75 - > 50 2. Drip irrigation 0.9 1 - 3. Optimise crop cover 0.5 0-0.5 - Warm winter – early sprouting 0.25-0.75 4. Air conditioning 0.9 0.1-0.2 - Seed onion Warm and wet – fungi infection 0.50-0.60 1. Chemical protection 0.9 0.5-1 10-100 2. UV-light protection 0.9 0.5-1 30
We assumed here that if a farmer implements a combination of adaptation measures against different climate risks associated with extreme events in his farm plan, this might further reduce the crop losses. Practically it means combining the measure against warm winter (i.e. air conditioning) with one of the three measures against heat wave (i.e. plant in wide ridges; drip irrigation; and optimize crop cover). It is unlikely that a farmer would choose a combination of more than two adaptation measures per risk, considering the cost-effectiveness of measures and overlap in effects to reduce the impacts of extreme events. We also assumed that a farmer would always apply the adaptation measure in advance of a growing season, not knowing whether the event will occur, so he would also always have costs of the measures.
We calculated the final yield (i.e. yield with (combinations of) adaptation measures against extreme events applied) in a sequence of calculation steps (see also Table 4.5):
, (equation 4.3)
Crop and farm level adaptation
65
where is a final yield (t/ha); Y is the original yield (no impact of extreme events) (t/ha); and is a yield reduction (fraction) due to application of an adaptation measure a against an extreme event i, calculated as follows:
, (equation 2.4)
where is a relative yield reduction caused by extreme event i (see equation 2.1) and
is the effectiveness of the adaptation measure a (fraction; see Table 4.3). Using the example of seed potato, we can illustrate how the calculation of final
yield (YA) has been performed for farm P1 (see also Table 4.5). Due to climate change, yield of seed potato in 2050W+ was estimated to increase by 2.8% (Reidsma et al. 2015; Wolf et al. 2011). For farm P1 seed potato yield (Y) will become 45.2 t/ha. The yield reduction (Y ) caused by extreme effect “heat wave” is 0.52 (see Table 4.3). There are three adaptation measures proposed against heat wave (see also Table 4.4), each of them with different effectiveness E. Measure 1 (plant in wider ridges), for example, if applied alone, will secure a yield (YA) of 39.3 t/ha due to its effectiveness E to reduce the damage by a heat wave by 0.75. However, the yield will still be affected by “warm winter” (with the yield reduction (Y ) of 0.32). Therefore, the yield (YA) with impacts of both extreme events and adaptation against heat wave by planting in wider ridges will be 26.9 t/ha. Table 4.5– Selected (cost-)effective crop level adaptation measures. Yield reduction and impact of extreme events are presented for W+ scenario for farm P1.
adaptation measures yield2050 (t/ha)
yield
reduc-tion Y 1
yield reduc-tion Y 2
yield reduc-tion Y ai
no impact of extreme
events Y
impact of extreme
events and adapt YA
cost of adaptation measure (k€/ha)
Seed potato 45.2 No adaptation 14.8 n/a
Heat wave 1 plant in wider ridges 0.32 0.13 26.7 - 2 drip irrigation 0.32 0.05 29.2 1.0 3 optimize crop cover 0.32 0.26 22.7 0.25
Warm winter 4 air conditioning 0.52 0.03 21.0 0.15
Heat wave and warm winter 5 plant in wide ridges and air conditioning 0.0039 45.0 0.15
6 drip irrigation and air conditioning 0.0015 45.1 1.15
7 optimize crop cover and air conditioning 0.0078 44.8 0.4
Seed onion 102.8 No adaptation 64.8 n/a
Warm and wet 1 chemical protection 0.04 98.7 0.5-1.0 2 UV-light protection 0.04 98.7 0.5-1.0
binnenwerk.indd 65 23-2-2016 21:55:05

Chapter 4
66
Farm level adaptation Changes in crop rotations (i.e. shift to alternative crops) are included as adaptation measures at farm level in our study. Adaptation measures aimed at improvement of organic matter balance at farm level include increased share of wheat (up till 50%) and grass in rotation. When farms aim to improve the farm economic result in the first place, they shift to alternative – mostly high value – crops or increase the share of currently grown high value crops in their rotation. In general, in this study preferred alternative farm plans in the current situation represent farm level adaptation in the current situation (i.e. improvement of farm performance on indicators linked to different objectives – see also Chapter 3). We assess whether these preferred alternative farm plans can also be considered as farm level adaptation in future scenarios. In addition, we investigate impacts of climate change on economic result and organic matter balance per crop, to propose improved farm level adaptation, depending on the objectives of the farmers. 4.2.4 Input and output assumptions Under future climate change one could also anticipate changes in important inputs for crop growth. Additional fertilizer inputs required for the yield increases due to climate change in the W+ and G scenarios have been calculated, using the same approach as described by Kanellopoulos et al. (2014) and Wolf et al. (2011). For higher yield levels we assumed a fixed recovery fraction of the N applied to calculate fertilizer N requirement, while the nitrogen required for 20 % of actual yield is supplied by the soil. The resulting changes in fertilizer nutrient application per crop in the future are provided in Appendices 4.A and 4.B. We focus here on the nitrogen applications (kg N/ha) and assume that the future changes in fertilizer costs are linearly related to those of N fertilizers.
We assumed a neutral impact of future climate change on soil organic matter balance on the surveyed farms, because the effect of climate change on soil organic matter contents is largely uncertain. In our study the organic matter balance is calculated as an average per ha at farm level, and is defined as the sum of organic matter addition from crop residues and manure minus organic matter decomposition (of indigenous plus added soil organic matter). Erosion can be ignored on the flat polders of the Netherlands with clayey soils. Following yield increase under gradual climate change, crop residues to soil might also increase in the future. However, the effects of yield increases on soil organic matter through residues are largely uncertain (Wiesmeier et al. 2014), since especially the link between relatively short-term plant responses to CO2 enrichment and any longer term consequences for organic matter accumulation are very difficult to measure (Norby 1994). The (future) climatic factors influencing the soil organic matter decomposition process (i.e. temperature, precipitation and CO2 concentration) are often shown to cancel out each other, meaning the overall impact of climate change on the soil organic matter balance is not
Crop and farm level adaptation
67
as large as concluded from the results of single factor studies (Gärdenäs et al. 2011). Hence, the effects of climate change on changing inputs of organic matter and its decomposition for given farm plans in Flevoland are assumed to balance each other across the time frame of our study. Changes in organic matter balance in the future will be determined much more by changes in crop types and rotation sequences, as one of the main management practices influencing soil organic matter sequestration on farms at given intensity levels (Ogle et al. 2010).
Assumptions on current and changing labour requirement due to implementation of certain adaptation measures were based on the Dutch information handbook for arable farming and horticulture (Anonymous 2009), depending on a fixed amount of hours for a certain management operation (i.e. a part of the adaptation measure). For example, the adaptation measure “optimize crop cover” will include tillage operation, which implies three hours/ha extra in terms of labour requirement for seed potato cultivation. Since total labour requirement for seed potato cultivation (without adaptation measures) is 70 hours/ha, the total labour requirement with adaptation measure “optimize crop cover” becomes 73 hours/ ha (see Appendices 4.C-4.E).
Crop prices in the future scenarios were assumed to be at the level of 2010 (see also Appendix 4.F). 4.2.5 Model description In this study we used the multi-objective optimization model FarmDESIGN (Groot et al. 2012), developed to support the learning and decision-making process of re-designing farming systems. The model allows to calculate the consequences of a farm configuration for a large set of farm performance indicators (e.g. nutrient balances and flows, labour balance, organic matter balance and operating profits), and subsequently to explore trade-offs between farmers’ multiple objectives, by linking a bio-economic component to a multi-objective Pareto-based Differential Evolution algorithm. The outcomes of the optimization runs are alternative farm configurations (i.e. cropping patterns) based on the original farm plan evaluated in terms of the multiple objectives. The objectives included in the optimization process of the model include maximization of economic result, soil quality, minimization of labour balance, risk and nitrogen balance (see Chapter 3).
A detailed model description is provided by Groot et al. (2012). The adjustments –referring to risk and labour – we made to the model to make it applicable for our research are described in Chapter 3 and Appendix 4.F. An overview of rotational constraints, general and nutrient balances constraints, input data for calculating nutrient balances and organic matter balance is also presented in Chapter 3. 4.2.6 Model simulations required to answer the research questions Each simulation with the FarmDESIGN model aimed to answer a specific research question of the paper and show the impacts of future climate scenarios (with and
binnenwerk.indd 66 23-2-2016 21:55:05

Chapter 4
66
Farm level adaptation Changes in crop rotations (i.e. shift to alternative crops) are included as adaptation measures at farm level in our study. Adaptation measures aimed at improvement of organic matter balance at farm level include increased share of wheat (up till 50%) and grass in rotation. When farms aim to improve the farm economic result in the first place, they shift to alternative – mostly high value – crops or increase the share of currently grown high value crops in their rotation. In general, in this study preferred alternative farm plans in the current situation represent farm level adaptation in the current situation (i.e. improvement of farm performance on indicators linked to different objectives – see also Chapter 3). We assess whether these preferred alternative farm plans can also be considered as farm level adaptation in future scenarios. In addition, we investigate impacts of climate change on economic result and organic matter balance per crop, to propose improved farm level adaptation, depending on the objectives of the farmers. 4.2.4 Input and output assumptions Under future climate change one could also anticipate changes in important inputs for crop growth. Additional fertilizer inputs required for the yield increases due to climate change in the W+ and G scenarios have been calculated, using the same approach as described by Kanellopoulos et al. (2014) and Wolf et al. (2011). For higher yield levels we assumed a fixed recovery fraction of the N applied to calculate fertilizer N requirement, while the nitrogen required for 20 % of actual yield is supplied by the soil. The resulting changes in fertilizer nutrient application per crop in the future are provided in Appendices 4.A and 4.B. We focus here on the nitrogen applications (kg N/ha) and assume that the future changes in fertilizer costs are linearly related to those of N fertilizers.
We assumed a neutral impact of future climate change on soil organic matter balance on the surveyed farms, because the effect of climate change on soil organic matter contents is largely uncertain. In our study the organic matter balance is calculated as an average per ha at farm level, and is defined as the sum of organic matter addition from crop residues and manure minus organic matter decomposition (of indigenous plus added soil organic matter). Erosion can be ignored on the flat polders of the Netherlands with clayey soils. Following yield increase under gradual climate change, crop residues to soil might also increase in the future. However, the effects of yield increases on soil organic matter through residues are largely uncertain (Wiesmeier et al. 2014), since especially the link between relatively short-term plant responses to CO2 enrichment and any longer term consequences for organic matter accumulation are very difficult to measure (Norby 1994). The (future) climatic factors influencing the soil organic matter decomposition process (i.e. temperature, precipitation and CO2 concentration) are often shown to cancel out each other, meaning the overall impact of climate change on the soil organic matter balance is not
Crop and farm level adaptation
67
as large as concluded from the results of single factor studies (Gärdenäs et al. 2011). Hence, the effects of climate change on changing inputs of organic matter and its decomposition for given farm plans in Flevoland are assumed to balance each other across the time frame of our study. Changes in organic matter balance in the future will be determined much more by changes in crop types and rotation sequences, as one of the main management practices influencing soil organic matter sequestration on farms at given intensity levels (Ogle et al. 2010).
Assumptions on current and changing labour requirement due to implementation of certain adaptation measures were based on the Dutch information handbook for arable farming and horticulture (Anonymous 2009), depending on a fixed amount of hours for a certain management operation (i.e. a part of the adaptation measure). For example, the adaptation measure “optimize crop cover” will include tillage operation, which implies three hours/ha extra in terms of labour requirement for seed potato cultivation. Since total labour requirement for seed potato cultivation (without adaptation measures) is 70 hours/ha, the total labour requirement with adaptation measure “optimize crop cover” becomes 73 hours/ ha (see Appendices 4.C-4.E).
Crop prices in the future scenarios were assumed to be at the level of 2010 (see also Appendix 4.F). 4.2.5 Model description In this study we used the multi-objective optimization model FarmDESIGN (Groot et al. 2012), developed to support the learning and decision-making process of re-designing farming systems. The model allows to calculate the consequences of a farm configuration for a large set of farm performance indicators (e.g. nutrient balances and flows, labour balance, organic matter balance and operating profits), and subsequently to explore trade-offs between farmers’ multiple objectives, by linking a bio-economic component to a multi-objective Pareto-based Differential Evolution algorithm. The outcomes of the optimization runs are alternative farm configurations (i.e. cropping patterns) based on the original farm plan evaluated in terms of the multiple objectives. The objectives included in the optimization process of the model include maximization of economic result, soil quality, minimization of labour balance, risk and nitrogen balance (see Chapter 3).
A detailed model description is provided by Groot et al. (2012). The adjustments –referring to risk and labour – we made to the model to make it applicable for our research are described in Chapter 3 and Appendix 4.F. An overview of rotational constraints, general and nutrient balances constraints, input data for calculating nutrient balances and organic matter balance is also presented in Chapter 3. 4.2.6 Model simulations required to answer the research questions Each simulation with the FarmDESIGN model aimed to answer a specific research question of the paper and show the impacts of future climate scenarios (with and
binnenwerk.indd 67 23-2-2016 21:55:05

Chapter 4
68
without adaptation against extreme events) for both current and preferred alternative farm plans for each surveyed farm. The short description of the simulations is provided below.
Simulation 1 addresses the research question What will be the impact of gradual climate change on farm performance? The aim of the simulation was to show the effects of gradual climate change on farm performance in W+ and G climate scenarios, without the option of implementing adaptation measures specific for climate change. Farm performance may differ per farm and objective. For this simulation we used future yields and fertilizer N application for all crops from Appendices 4.A and 4.B. The results of the simulation are compared to the situation with current climate.
Simulation 2 addresses the research question Will the changes in future frequency of extreme events impact farm performance to a larger extent than a gradual climate change? This simulation investigates the damage of future extreme events on yields of high value crops and the impacts on the gross margin of crops for the surveyed farms. Here we applied yield reduction for high value crops caused by extreme events (equations 4.1 and 4.2). Fertilizer input and yields for other crops remained unchanged from simulation 1 (gradual climate change only). The outcomes of the simulation are compared to simulation 1.
Simulation 3 addresses the research question How important is crop level adaptation compared to farm level in improving farm performance on important objectives (i.e. economic result and soil quality) in climate change scenarios with extreme events? Here we investigate what gives more benefits: crop or farm level adaptation. We assess whether it is interesting for farmers to invest in crop level adaptation to cope with extreme events affecting potato and onion yields, or whether switching to other crops is a better adaptation option. For this simulation we added adaptation measures for high value crops and the corresponding yield per adaptation measure (Table 4.5) to the FarmDESIGN model. Labour requirement and costs of the adaptation measures are provided in Appendix 4. E. Fertilizer input and yields for other crops were the same as in simulations 1 and 2. We compared the results of the simulation to the results of simulation 1 (gradual climate change and no effects of extreme events).
The research question Will different farmers’ objectives lead to different preferences for different adaptation measures to climate change? does not require a separate model simulation and can be addressed by analysing the results of simulation 3.
4.2.7 Farm performance in the current situation We first summarize the performance of the current farm plans in the current climate situation and describe the choice for preferred alternative farm plans, focusing on the objectives of economic result and organic matter balance. These results were presented in detail in Chapter 3.
Crop and farm level adaptation
69
Farms P2 and E1 showed the best performance in terms of economic result in the situation with current climate (Figure 4.1). These farms grow seed onion and winter carrot, the crops with the highest gross margin (more than 7600€/ha). Farms N1, P1 and E1 performed best within the sample as to the soil organic matter balance. These farms either applied a lot of organic fertilizer (farms P1 and E1) or had a large share of crops that added a large amount of effective organic matter to the soil (for farm N1 the share of wheat in the rotation was 0.33). Figure 4.1 – Performance of sampled farms in terms of economic result and organic matter balance.
Regarding adaptation preferences in the current climate, the surveyed farms demonstrated quite a large diversity in terms of preferred alternative farm plans, depending on their current cropping pattern, current performance as to the important objectives and the priorities they gave to different objectives (Chapter 3). Farmers P1, P2 and E1 focused on improvement of organic matter balance and therefore chose to grow more winter wheat. The share of high value crops in these farm plans remained unchanged. Farmers P3 and E2 were more interested in economic result maximization and therefore their preferred alternative farm plans had increased share of high value crops. Farmer P3 decided to grow seed potato next to consumption potato and seed onion, while Farmer E2 preferred to switch from consumption potato to seed potato and seed onion. Farmer N1 was satisfied with his current performance and cropping pattern and preferred to keep it unchanged, including the share of high value crops. 4.3 Results Table 4.6 provides the simulation results in terms of organic matter balance and gross margin of crops for the current and preferred alternative farm plans. Each simulation corresponds to the specific research question. 4.3.1 What will be the impact of gradual climate change on farm performance? The results of the simulation for selected farms show that in both climate change scenarios farms will achieve a better economic result with the current farm plan (up to 40%), while we assume organic matter balance remains unchanged. Since yield
binnenwerk.indd 68 23-2-2016 21:55:05
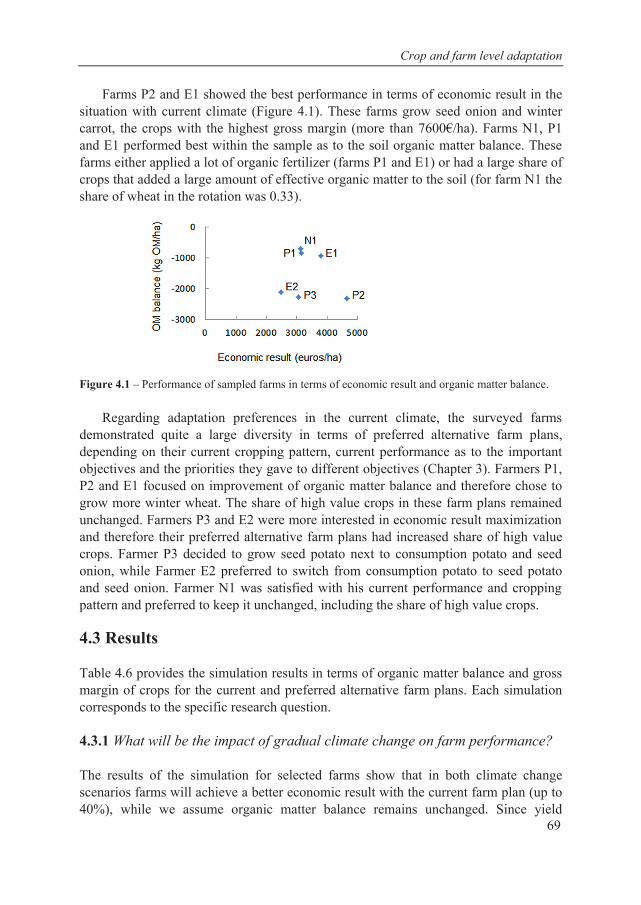
Chapter 4
68
without adaptation against extreme events) for both current and preferred alternative farm plans for each surveyed farm. The short description of the simulations is provided below.
Simulation 1 addresses the research question What will be the impact of gradual climate change on farm performance? The aim of the simulation was to show the effects of gradual climate change on farm performance in W+ and G climate scenarios, without the option of implementing adaptation measures specific for climate change. Farm performance may differ per farm and objective. For this simulation we used future yields and fertilizer N application for all crops from Appendices 4.A and 4.B. The results of the simulation are compared to the situation with current climate.
Simulation 2 addresses the research question Will the changes in future frequency of extreme events impact farm performance to a larger extent than a gradual climate change? This simulation investigates the damage of future extreme events on yields of high value crops and the impacts on the gross margin of crops for the surveyed farms. Here we applied yield reduction for high value crops caused by extreme events (equations 4.1 and 4.2). Fertilizer input and yields for other crops remained unchanged from simulation 1 (gradual climate change only). The outcomes of the simulation are compared to simulation 1.
Simulation 3 addresses the research question How important is crop level adaptation compared to farm level in improving farm performance on important objectives (i.e. economic result and soil quality) in climate change scenarios with extreme events? Here we investigate what gives more benefits: crop or farm level adaptation. We assess whether it is interesting for farmers to invest in crop level adaptation to cope with extreme events affecting potato and onion yields, or whether switching to other crops is a better adaptation option. For this simulation we added adaptation measures for high value crops and the corresponding yield per adaptation measure (Table 4.5) to the FarmDESIGN model. Labour requirement and costs of the adaptation measures are provided in Appendix 4. E. Fertilizer input and yields for other crops were the same as in simulations 1 and 2. We compared the results of the simulation to the results of simulation 1 (gradual climate change and no effects of extreme events).
The research question Will different farmers’ objectives lead to different preferences for different adaptation measures to climate change? does not require a separate model simulation and can be addressed by analysing the results of simulation 3.
4.2.7 Farm performance in the current situation We first summarize the performance of the current farm plans in the current climate situation and describe the choice for preferred alternative farm plans, focusing on the objectives of economic result and organic matter balance. These results were presented in detail in Chapter 3.
Crop and farm level adaptation
69
Farms P2 and E1 showed the best performance in terms of economic result in the situation with current climate (Figure 4.1). These farms grow seed onion and winter carrot, the crops with the highest gross margin (more than 7600€/ha). Farms N1, P1 and E1 performed best within the sample as to the soil organic matter balance. These farms either applied a lot of organic fertilizer (farms P1 and E1) or had a large share of crops that added a large amount of effective organic matter to the soil (for farm N1 the share of wheat in the rotation was 0.33). Figure 4.1 – Performance of sampled farms in terms of economic result and organic matter balance.
Regarding adaptation preferences in the current climate, the surveyed farms demonstrated quite a large diversity in terms of preferred alternative farm plans, depending on their current cropping pattern, current performance as to the important objectives and the priorities they gave to different objectives (Chapter 3). Farmers P1, P2 and E1 focused on improvement of organic matter balance and therefore chose to grow more winter wheat. The share of high value crops in these farm plans remained unchanged. Farmers P3 and E2 were more interested in economic result maximization and therefore their preferred alternative farm plans had increased share of high value crops. Farmer P3 decided to grow seed potato next to consumption potato and seed onion, while Farmer E2 preferred to switch from consumption potato to seed potato and seed onion. Farmer N1 was satisfied with his current performance and cropping pattern and preferred to keep it unchanged, including the share of high value crops. 4.3 Results Table 4.6 provides the simulation results in terms of organic matter balance and gross margin of crops for the current and preferred alternative farm plans. Each simulation corresponds to the specific research question. 4.3.1 What will be the impact of gradual climate change on farm performance? The results of the simulation for selected farms show that in both climate change scenarios farms will achieve a better economic result with the current farm plan (up to 40%), while we assume organic matter balance remains unchanged. Since yield
Crop and farm level adaptation
69
Farms P2 and E1 showed the best performance in terms of economic result in the situation with current climate (Figure 4.1). These farms grow seed onion and winter carrot, the crops with the highest gross margin (more than 7600€/ha). Farms N1, P1 and E1 performed best within the sample as to the soil organic matter balance. These farms either applied a lot of organic fertilizer (farms P1 and E1) or had a large share of crops that added a large amount of effective organic matter to the soil (for farm N1 the share of wheat in the rotation was 0.33). Figure 4.1 – Performance of sampled farms in terms of economic result and organic matter balance.
Regarding adaptation preferences in the current climate, the surveyed farms demonstrated quite a large diversity in terms of preferred alternative farm plans, depending on their current cropping pattern, current performance as to the important objectives and the priorities they gave to different objectives (Chapter 3). Farmers P1, P2 and E1 focused on improvement of organic matter balance and therefore chose to grow more winter wheat. The share of high value crops in these farm plans remained unchanged. Farmers P3 and E2 were more interested in economic result maximization and therefore their preferred alternative farm plans had increased share of high value crops. Farmer P3 decided to grow seed potato next to consumption potato and seed onion, while Farmer E2 preferred to switch from consumption potato to seed potato and seed onion. Farmer N1 was satisfied with his current performance and cropping pattern and preferred to keep it unchanged, including the share of high value crops. 4.3 Results Table 4.6 provides the simulation results in terms of organic matter balance and gross margin of crops for the current and preferred alternative farm plans. Each simulation corresponds to the specific research question. 4.3.1 What will be the impact of gradual climate change on farm performance? The results of the simulation for selected farms show that in both climate change scenarios farms will achieve a better economic result with the current farm plan (up to 40%), while we assume organic matter balance remains unchanged. Since yield
binnenwerk.indd 69 23-2-2016 21:55:06
Chapter 4
70
increases in W+ and G climate scenarios vary across crops (see Appendix 4.A), farms with different farm plans will profit differently from climate change. All farms are simulated to have a higher increase in gross margin of crops in the G scenario, due to higher yields – especially for seed potato and onion – compared to the W+ scenario.
The gross margins of crops for the preferred alternative farm plans for farms P1 and P2 profit less from climate change compared to the current plan. For farms E2 and P3 the situation is the opposite, partly because the farms selected more profitable and more intensive crops.
From the simulation results we can conclude that gradual climate change improves farm performance in terms of farm economic result. The degree of improvement varies per scenario and per farm, depending on the cropping pattern. Farms growing seed onion and seed potato profit more from the yield increase and thus also gross margin increase in the G scenario. 4.3.2 What will be the impact of the changes in future frequency of extreme events on farm performance? Our simulation results show that the impacts of extreme events on farm economic result for the current farm plans differ considerably between the G and W+ scenarios (Table 4.6). In the W+ scenario with extreme events, all farms are simulated to have a huge negative impact from the extreme events on gross margin of crops for the current farm plan compared to the gradual climate change scenario, since all farms have high value crops in the current farm plan. In the G scenario with extreme events, the values for the gross margin of crops remain around the current level for all farms. For the preferred alternative farm plans, there is more diversity in impacts of extreme events on farm plans. In the W+ scenario, there is also a severe negative impact of the extreme events on the gross margin of crops, similarly to the situation with the current farm plans. In the G scenario, farms E1, E2 and P3 can still increase their gross margin of crops compared to the current situation, benefiting from relatively small impacts of the extreme events on high value crops counterbalanced by general productivity increase for other crops. Preferred alternative farm plans for farms E1, E2 and P3 are therefore less vulnerable to climate change.
From the explanations of the simulation results mentioned above we can conclude that the changes in future frequency of extreme events impact farm performance very negatively in terms of gross margin of crops in the W+ scenario (from -24 to -93%) and in the G scenario the impacts differ per farm (i.e. per specific cropping pattern) (from -9 to +22%).
Crop and farm level adaptation
71
Tab
le 4
.6–
Gro
ss m
argi
n of
cro
ps a
nd o
rgan
ic m
atte
r bal
ance
for t
he si
x fa
rms i
n di
ffer
ent s
cena
rios f
or th
e cu
rren
t and
pre
ferr
ed a
ltern
ativ
e fa
rm p
lans
1 .
P1P2
P3
Scen
ario
Ada
ptat
ion
leve
lFa
rm p
lan
Org
anic
m
atte
r ba
lanc
e (t
OM
/ha)
%ch
ange
G
ross
m
argi
n of
cr
ops
(k€/
ha)
%ch
ange
O
rgan
ic
mat
ter
bala
nce
(tO
M/h
a)
%ch
ange
G
ross
m
argi
n of
cr
ops
(k€/
ha)
%ch
ange
O
rgan
ic
mat
ter
bala
nce
(tO
M/h
a)
%ch
ange
G
ross
m
argi
n of
cr
ops
(k€/
ha)
%ch
ange
Wha
t will
be
the
impa
ct o
f gra
dual
clim
ate
chan
ge o
n fa
rm p
erfo
rman
ce?
Cur
rent
cl
imat
eC
urre
nt-0
.66
3.14
-2.3
34.
66-2
.28
3.07
Pref
.alte
rnat
ive
-0.3
8+4
22.
90-8
-2.1
4+9
4.39
-6-2
.48
-83.
48+1
3
W+
CC
onl
y2C
urre
nt-0
.66
04.
00+2
7-2
.33
05.
41+1
6-2
.28
03.
61+1
8Pr
ef.a
ltern
ativ
e-0
.38
+42
3.66
+17
-2.1
4+9
4.94
+6-2
.48
-84.
05+3
2
G C
C o
nly2
Cur
rent
-0.6
60
4.39
+40
-2.3
30
5.72
+23
-2.2
80
3.79
+23
Pref
.alte
rnat
ive
-0.3
8+4
24.
01+2
8-2
.14
+95.
34+1
5-2
.48
-84.
35+4
2W
hat w
ill b
e th
e im
pact
of t
he c
hang
es in
futu
re fr
eque
ncy
of e
xtre
me
even
ts o
n fa
rm p
erfo
rman
ce?
W+
CC
+EE3
Cur
rent
-0.6
60
0.55
-82
-2.3
30
3.24
-30
-2.2
80
1.79
-42
Farm
Pref
.alte
rnat
ive
-0.3
8+4
20.
21-9
3-2
.14
+92.
77-4
1-2
.48
-81.
72-4
4
G C
C+E
E3C
urre
nt-0
.66
03.
22+3
-2.3
30
4.97
+7-2
.28
03.
11+1
Farm
Pref
.alte
rnat
ive
-0.3
8+4
22.
86-9
-2.1
4+9
4.58
-2-2
.48
-83.
52+1
5H
ow im
porta
nt is
cro
p le
vel a
dapt
atio
n co
mpa
red
to fa
rm le
vel a
dapt
atio
n in
impr
ovin
g fa
rm p
erfo
rman
ce o
n im
porta
nt o
bjec
tives
(i.e
. eco
nom
ic re
sult
and
soil
qual
ity
max
imiz
atio
n)in
clim
ate
chan
ge sc
enar
ios w
ith e
xtre
me
even
ts?
W
+ C
C+E
E fu
ll ad
optio
n
of m
ost
prof
itabl
ead
apta
tion
mea
sure
s
Cro
pC
urre
nt-0
.66
03.
72+1
8-2
.33
05.
16+1
1-2
.28
03.
32+8
Farm
+cro
pPr
ef.a
ltern
ativ
e-0
.38
+42
3.37
+7-2
.14
+94.
69+1
-2.4
8-8
3.30
+8
G C
C+E
E fu
ll ad
optio
n o
f m
ost p
rofit
able
ad
apta
tion
mea
sure
s
Cro
pC
urre
nt-0
.66
04.
16+3
2-2
.33
05.
48+1
8-2
.28
03.
49+1
4Fa
rm+c
rop
Pref
.alte
rnat
ive
-0.3
8+4
23.
80+2
1-2
.14
+95.
09+9
-2.4
8-8
3.92
+28
1 Cur
rent
farm
pla
ns a
nd p
refe
rred
alte
rnat
ive
farm
pla
ns in
diff
eren
t sce
nario
s are
com
pare
dto
the
curr
ent f
arm
pla
n in
the
curr
ent c
limat
e. T
he v
alue
s for
pr
efer
red
alte
rnat
ive
farm
pla
ns a
re g
iven
in b
old.
2 Gra
dual
clim
ate
chan
ge sc
enar
ios
3 Clim
ate
chan
ge sc
enar
ios w
ith e
xtre
me
even
ts
binnenwerk.indd 70 23-2-2016 21:55:07
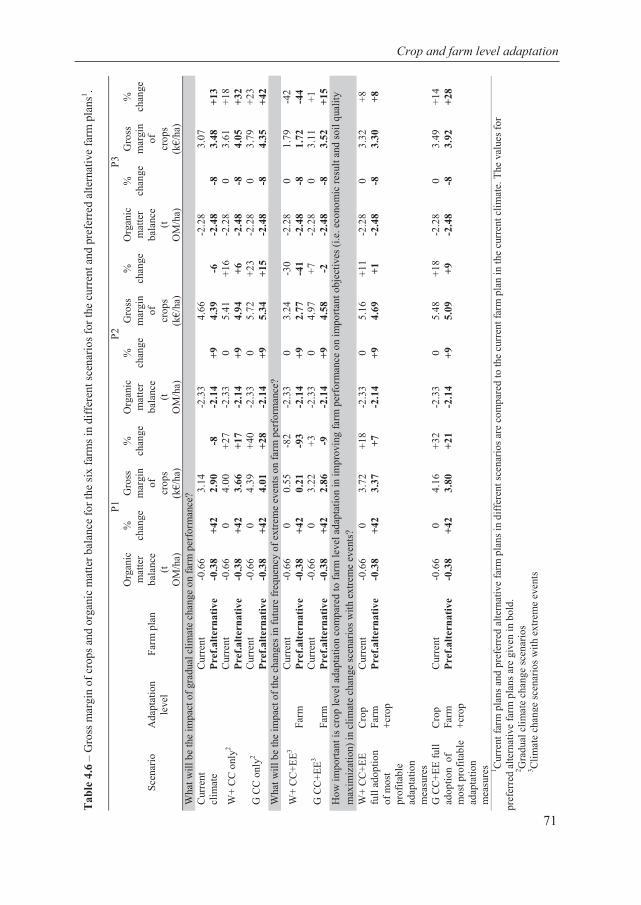
Chapter 4
70
increases in W+ and G climate scenarios vary across crops (see Appendix 4.A), farms with different farm plans will profit differently from climate change. All farms are simulated to have a higher increase in gross margin of crops in the G scenario, due to higher yields – especially for seed potato and onion – compared to the W+ scenario.
The gross margins of crops for the preferred alternative farm plans for farms P1 and P2 profit less from climate change compared to the current plan. For farms E2 and P3 the situation is the opposite, partly because the farms selected more profitable and more intensive crops.
From the simulation results we can conclude that gradual climate change improves farm performance in terms of farm economic result. The degree of improvement varies per scenario and per farm, depending on the cropping pattern. Farms growing seed onion and seed potato profit more from the yield increase and thus also gross margin increase in the G scenario. 4.3.2 What will be the impact of the changes in future frequency of extreme events on farm performance? Our simulation results show that the impacts of extreme events on farm economic result for the current farm plans differ considerably between the G and W+ scenarios (Table 4.6). In the W+ scenario with extreme events, all farms are simulated to have a huge negative impact from the extreme events on gross margin of crops for the current farm plan compared to the gradual climate change scenario, since all farms have high value crops in the current farm plan. In the G scenario with extreme events, the values for the gross margin of crops remain around the current level for all farms. For the preferred alternative farm plans, there is more diversity in impacts of extreme events on farm plans. In the W+ scenario, there is also a severe negative impact of the extreme events on the gross margin of crops, similarly to the situation with the current farm plans. In the G scenario, farms E1, E2 and P3 can still increase their gross margin of crops compared to the current situation, benefiting from relatively small impacts of the extreme events on high value crops counterbalanced by general productivity increase for other crops. Preferred alternative farm plans for farms E1, E2 and P3 are therefore less vulnerable to climate change.
From the explanations of the simulation results mentioned above we can conclude that the changes in future frequency of extreme events impact farm performance very negatively in terms of gross margin of crops in the W+ scenario (from -24 to -93%) and in the G scenario the impacts differ per farm (i.e. per specific cropping pattern) (from -9 to +22%).
Crop and farm level adaptation
71
Crop and farm level adaptation
71
Tab
le 4
.6–
Gro
ss m
argi
n of
cro
ps a
nd o
rgan
ic m
atte
r bal
ance
for t
he si
x fa
rms i
n di
ffer
ent s
cena
rios f
or th
e cu
rren
t and
pre
ferr
ed a
ltern
ativ
e fa
rm p
lans
1 .
P1P2
P3
Scen
ario
Ada
ptat
ion
leve
lFa
rm p
lan
Org
anic
m
atte
r ba
lanc
e (t
OM
/ha)
%ch
ange
G
ross
m
argi
n of
cr
ops
(k€/
ha)
%ch
ange
O
rgan
ic
mat
ter
bala
nce
(tO
M/h
a)
%ch
ange
G
ross
m
argi
n of
cr
ops
(k€/
ha)
%ch
ange
O
rgan
ic
mat
ter
bala
nce
(tO
M/h
a)
%ch
ange
G
ross
m
argi
n of
cr
ops
(k€/
ha)
%ch
ange
Wha
t will
be
the
impa
ct o
f gra
dual
clim
ate
chan
ge o
n fa
rm p
erfo
rman
ce?
Cur
rent
cl
imat
eC
urre
nt-0
.66
3.14
-2.3
34.
66-2
.28
3.07
Pref
.alte
rnat
ive
-0.3
8+4
22.
90-8
-2.1
4+9
4.39
-6-2
.48
-83.
48+1
3
W+
CC
onl
y2C
urre
nt-0
.66
04.
00+2
7-2
.33
05.
41+1
6-2
.28
03.
61+1
8Pr
ef.a
ltern
ativ
e-0
.38
+42
3.66
+17
-2.1
4+9
4.94
+6-2
.48
-84.
05+3
2
G C
C o
nly2
Cur
rent
-0.6
60
4.39
+40
-2.3
30
5.72
+23
-2.2
80
3.79
+23
Pref
.alte
rnat
ive
-0.3
8+4
24.
01+2
8-2
.14
+95.
34+1
5-2
.48
-84.
35+4
2W
hat w
ill b
e th
e im
pact
of t
he c
hang
es in
futu
re fr
eque
ncy
of e
xtre
me
even
ts o
n fa
rm p
erfo
rman
ce?
W+
CC
+EE3
Cur
rent
-0.6
60
0.55
-82
-2.3
30
3.24
-30
-2.2
80
1.79
-42
Farm
Pref
.alte
rnat
ive
-0.3
8+4
20.
21-9
3-2
.14
+92.
77-4
1-2
.48
-81.
72-4
4
G C
C+E
E3C
urre
nt-0
.66
03.
22+3
-2.3
30
4.97
+7-2
.28
03.
11+1
Farm
Pref
.alte
rnat
ive
-0.3
8+4
22.
86-9
-2.1
4+9
4.58
-2-2
.48
-83.
52+1
5H
ow im
porta
nt is
cro
p le
vel a
dapt
atio
n co
mpa
red
to fa
rm le
vel a
dapt
atio
n in
impr
ovin
g fa
rm p
erfo
rman
ce o
n im
porta
nt o
bjec
tives
(i.e
. eco
nom
ic re
sult
and
soil
qual
ity
max
imiz
atio
n)in
clim
ate
chan
ge sc
enar
ios w
ith e
xtre
me
even
ts?
W
+ C
C+E
E fu
ll ad
optio
n
of m
ost
prof
itabl
ead
apta
tion
mea
sure
s
Cro
pC
urre
nt-0
.66
03.
72+1
8-2
.33
05.
16+1
1-2
.28
03.
32+8
Farm
+cro
pPr
ef.a
ltern
ativ
e-0
.38
+42
3.37
+7-2
.14
+94.
69+1
-2.4
8-8
3.30
+8
G C
C+E
E fu
ll ad
optio
n o
f m
ost p
rofit
able
ad
apta
tion
mea
sure
s
Cro
pC
urre
nt-0
.66
04.
16+3
2-2
.33
05.
48+1
8-2
.28
03.
49+1
4Fa
rm+c
rop
Pref
.alte
rnat
ive
-0.3
8+4
23.
80+2
1-2
.14
+95.
09+9
-2.4
8-8
3.92
+28
1 Cur
rent
farm
pla
ns a
nd p
refe
rred
alte
rnat
ive
farm
pla
ns in
diff
eren
t sce
nario
s are
com
pare
dto
the
curr
ent f
arm
pla
n in
the
curr
ent c
limat
e. T
he v
alue
s for
pr
efer
red
alte
rnat
ive
farm
pla
ns a
re g
iven
in b
old.
2 Gra
dual
clim
ate
chan
ge sc
enar
ios
3 Clim
ate
chan
ge sc
enar
ios w
ith e
xtre
me
even
ts
binnenwerk.indd 71 23-2-2016 21:55:07

Crop and farm level adaptation
73
4.3.3 How important is crop level adaptation compared to farm level adaptation in improving farm performance on important objectives (i.e. economic result and soil quality) in climate change scenarios with extreme events? Crop level adaptation Since we did not ask farmers which adaptation measures against extreme events for high value crops they would eventually choose for their current and preferred alternative farm plans, we assessed the impacts on farm performance in case of a full adoption of the most profitable adaptation measures from Table 4.7 (on 100% of the crop area). For seed and consumption potato adaptation measure 5, which is a combination of plant in wider ridges (measure 1) and air conditioning (measure 4), appeared to have the highest gross margin per ha (Table 4.7). For seed onion measures 1 and 2 (chemical protection and UV-light protection) were equally profitable.
Full adoption of most profitable adaptation measures for high value crops for current farm plans would result in an overall increase in gross margins of crops on all farms, relative to the current climate, with higher gross margins in the G scenario compared to the W+ scenario (Table 4.6). This implies that the negative effects of extreme events for the current farm plans could be almost neutralized (i.e. gross margins are slightly lower than in climate change only scenarios) by adopting crop level measures including plant in wider ridges and air conditioning for potatoes and chemical protection and UV-light protection for onions. Farm level adaptation Farm level adaptation in terms of switching to the alternative farm plan, is not effective for all surveyed farms with regard to increase of gross margin of crops in the W+ scenario, since extreme events negatively impact the yields of high value crops in preferred alternative farm plans. In the G scenario, farm level adaptation improved farm gross margin of crops for farms P3, E1 and E2 with the improvement for E2 farm being the most significant (+22%). For farm P2 the impact could be regarded neutral, while for P1 there is a slight negative impact (-9%). At the same time, farm level adaptation – shift to (more) winter wheat – improved organic matter balance on farms P1, P2 and slightly on E1.
In Table 4.7 it can be observed that adaptation towards winter carrot would be most beneficial regarding gross margin for all farms, however soil restrictions often stop farmers from growing this intensive crop. Even without crop level adaptation, the gross margins of seed onion are higher than for other crops, and therefore switching to other crops from seed onion is not interesting from a gross margin point of view. For seed and consumption potato, crop level adaptation ensures higher gross margins than when switching to other crops (except winter carrot), and therefore crop level adaptation is more profitable than farm level adaptation. Shifting to sugar beet and chicory does become relatively more profitable compared to the current situation.
Chapter 4
72
Tab
le 4
.6(c
ontin
ued)
–G
ross
mar
gin
of c
rops
and
org
anic
mat
ter b
alan
ce fo
r the
six
farm
s in
diff
eren
t sce
nario
s for
the
curr
ent a
nd p
refe
rred
al
tern
ativ
e fa
rm p
lans
.N
11E1
E2
Scen
ario
Ada
ptat
ion
leve
lFa
rm p
lan
Org
anic
m
atte
r ba
lanc
e (t
OM
/ha)
%ch
ange
G
ross
m
argi
n of
cr
ops
(k€/
ha)
%ch
ange
O
rgan
ic
mat
ter
bala
nce
(tO
M/h
a)
%ch
ange
G
ross
m
argi
n of
cr
ops
(k€/
ha)
%ch
ange
O
rgan
ic
mat
ter
bala
nce
(tO
M/h
a)
%ch
ange
G
ross
m
argi
n of
cr
ops
(k€/
ha)
%ch
ange
Wha
t will
be
the
impa
ct o
f gra
dual
clim
ate
chan
ge o
n fa
rm p
erfo
rman
ce?
Cur
rent
cl
imat
eC
urre
nt-0
.70
3.13
-0.9
33.
81-2
.13
2.50
Pref
.alte
rnat
ive
-0.7
00
3.13
0-0
.88
+54.
02+5
-2.2
2-4
2.66
+6W
+ C
C
only
Cur
rent
-0.7
00
3.62
+16
-0.9
30
4.66
+22
-2.1
30
2.96
+18
Pref
.alte
rnat
ive
-0.7
00
3.62
+16
-0.8
8+5
4.65
+22
-2.2
2-4
3.38
+35
G C
C
only
Cur
rent
-0.7
00
3.92
+25
-0.9
30
5.09
+34
-2.1
30
3.10
+24
Pref
.alte
rnat
ive
-0.7
00
3.92
+25
-0.8
8+5
5.10
+34
-2.2
2-4
3.58
+43
Wha
t will
be
the
impa
ct o
f the
cha
nges
in fu
ture
freq
uenc
y of
ext
rem
e ev
ents
on
farm
per
form
ance
? W
+ C
C+E
EC
urre
nt-0
.70
00.
66-7
9-0
.93
01.
17-6
9-2
.13
01.
31-4
8Fa
rmPr
ef.a
ltern
ativ
e-0
.70
00.
66-7
9-0
.88
+51.
36-6
4-2
.22
-41.
90-2
4
G C
C+E
EC
urre
nt-0
.70
02.
97-5
-0.9
30
3.93
+3-2
.13
02.
72+9
Farm
Pref
.alte
rnat
ive
-0.7
00
2.97
-5-0
.88
+54.
01+5
-2.2
2-4
3.04
+22
How
impo
rtant
is c
rop
leve
l ada
ptat
ion
com
pare
d to
farm
leve
l ada
ptat
ion
in im
prov
ing
farm
per
form
ance
on
impo
rtant
obj
ectiv
es (i
.e. e
cono
mic
resu
lt an
d so
il qu
ality
max
imiz
atio
n)in
clim
ate
chan
ge sc
enar
ios w
ith e
xtre
me
even
ts?
W+
CC
+EE
full
adop
tion
of
mos
t pr
ofita
ble
adap
tatio
n m
easu
res
Cro
pC
urre
nt-0
.70
03.
42+9
-0.9
30
4.38
+15
-2.1
30
2.86
+14
Farm
+cro
pPr
ef.a
ltern
ativ
e-0
.70
03.
42+9
-0.8
8+5
4.39
+15
-2.2
2-4
2.08
-17
G C
C+E
E fu
ll ad
optio
n
of m
ost
prof
itabl
ead
apta
tion
mea
sure
s
Cro
pC
urre
nt-0
.70
03.
75+2
0-0
.93
04.
87+2
8-2
.13
03.
06+2
2Fa
rm+c
rop
Pref
.alte
rnat
ive
-0.7
00
3.75
+20
-0.8
8+5
4.89
+28
-2.2
2-4
3.32
+33
1 For f
arm
N1
ther
e w
as n
o fa
rm le
vel a
dapt
atio
n, si
nce
the
farm
er p
refe
rred
to k
eep
the
curr
ent f
arm
pla
n un
chan
ged
binnenwerk.indd 72 23-2-2016 21:55:08

Crop and farm level adaptation
73
4.3.3 How important is crop level adaptation compared to farm level adaptation in improving farm performance on important objectives (i.e. economic result and soil quality) in climate change scenarios with extreme events? Crop level adaptation Since we did not ask farmers which adaptation measures against extreme events for high value crops they would eventually choose for their current and preferred alternative farm plans, we assessed the impacts on farm performance in case of a full adoption of the most profitable adaptation measures from Table 4.7 (on 100% of the crop area). For seed and consumption potato adaptation measure 5, which is a combination of plant in wider ridges (measure 1) and air conditioning (measure 4), appeared to have the highest gross margin per ha (Table 4.7). For seed onion measures 1 and 2 (chemical protection and UV-light protection) were equally profitable.
Full adoption of most profitable adaptation measures for high value crops for current farm plans would result in an overall increase in gross margins of crops on all farms, relative to the current climate, with higher gross margins in the G scenario compared to the W+ scenario (Table 4.6). This implies that the negative effects of extreme events for the current farm plans could be almost neutralized (i.e. gross margins are slightly lower than in climate change only scenarios) by adopting crop level measures including plant in wider ridges and air conditioning for potatoes and chemical protection and UV-light protection for onions. Farm level adaptation Farm level adaptation in terms of switching to the alternative farm plan, is not effective for all surveyed farms with regard to increase of gross margin of crops in the W+ scenario, since extreme events negatively impact the yields of high value crops in preferred alternative farm plans. In the G scenario, farm level adaptation improved farm gross margin of crops for farms P3, E1 and E2 with the improvement for E2 farm being the most significant (+22%). For farm P2 the impact could be regarded neutral, while for P1 there is a slight negative impact (-9%). At the same time, farm level adaptation – shift to (more) winter wheat – improved organic matter balance on farms P1, P2 and slightly on E1.
In Table 4.7 it can be observed that adaptation towards winter carrot would be most beneficial regarding gross margin for all farms, however soil restrictions often stop farmers from growing this intensive crop. Even without crop level adaptation, the gross margins of seed onion are higher than for other crops, and therefore switching to other crops from seed onion is not interesting from a gross margin point of view. For seed and consumption potato, crop level adaptation ensures higher gross margins than when switching to other crops (except winter carrot), and therefore crop level adaptation is more profitable than farm level adaptation. Shifting to sugar beet and chicory does become relatively more profitable compared to the current situation.
Chapter 4
72
Tab
le 4
.6(c
ontin
ued)
–G
ross
mar
gin
of c
rops
and
org
anic
mat
ter b
alan
ce fo
r the
six
farm
s in
diff
eren
t sce
nario
s for
the
curr
ent a
nd p
refe
rred
al
tern
ativ
e fa
rm p
lans
.N
11E1
E2
Scen
ario
Ada
ptat
ion
leve
lFa
rm p
lan
Org
anic
m
atte
r ba
lanc
e (t
OM
/ha)
%ch
ange
G
ross
m
argi
n of
cr
ops
(k€/
ha)
%ch
ange
O
rgan
ic
mat
ter
bala
nce
(tO
M/h
a)
%ch
ange
G
ross
m
argi
n of
cr
ops
(k€/
ha)
%ch
ange
O
rgan
ic
mat
ter
bala
nce
(tO
M/h
a)
%ch
ange
G
ross
m
argi
n of
cr
ops
(k€/
ha)
%ch
ange
Wha
t will
be
the
impa
ct o
f gra
dual
clim
ate
chan
ge o
n fa
rm p
erfo
rman
ce?
Cur
rent
cl
imat
eC
urre
nt-0
.70
3.13
-0.9
33.
81-2
.13
2.50
Pref
.alte
rnat
ive
-0.7
00
3.13
0-0
.88
+54.
02+5
-2.2
2-4
2.66
+6W
+ C
C
only
Cur
rent
-0.7
00
3.62
+16
-0.9
30
4.66
+22
-2.1
30
2.96
+18
Pref
.alte
rnat
ive
-0.7
00
3.62
+16
-0.8
8+5
4.65
+22
-2.2
2-4
3.38
+35
G C
C
only
Cur
rent
-0.7
00
3.92
+25
-0.9
30
5.09
+34
-2.1
30
3.10
+24
Pref
.alte
rnat
ive
-0.7
00
3.92
+25
-0.8
8+5
5.10
+34
-2.2
2-4
3.58
+43
Wha
t will
be
the
impa
ct o
f the
cha
nges
in fu
ture
freq
uenc
y of
ext
rem
e ev
ents
on
farm
per
form
ance
? W
+ C
C+E
EC
urre
nt-0
.70
00.
66-7
9-0
.93
01.
17-6
9-2
.13
01.
31-4
8Fa
rmPr
ef.a
ltern
ativ
e-0
.70
00.
66-7
9-0
.88
+51.
36-6
4-2
.22
-41.
90-2
4
G C
C+E
EC
urre
nt-0
.70
02.
97-5
-0.9
30
3.93
+3-2
.13
02.
72+9
Farm
Pref
.alte
rnat
ive
-0.7
00
2.97
-5-0
.88
+54.
01+5
-2.2
2-4
3.04
+22
How
impo
rtant
is c
rop
leve
l ada
ptat
ion
com
pare
d to
farm
leve
l ada
ptat
ion
in im
prov
ing
farm
per
form
ance
on
impo
rtant
obj
ectiv
es (i
.e. e
cono
mic
resu
lt an
d so
il qu
ality
max
imiz
atio
n)in
clim
ate
chan
ge sc
enar
ios w
ith e
xtre
me
even
ts?
W+
CC
+EE
full
adop
tion
of
mos
t pr
ofita
ble
adap
tatio
n m
easu
res
Cro
pC
urre
nt-0
.70
03.
42+9
-0.9
30
4.38
+15
-2.1
30
2.86
+14
Farm
+cro
pPr
ef.a
ltern
ativ
e-0
.70
03.
42+9
-0.8
8+5
4.39
+15
-2.2
2-4
2.08
-17
G C
C+E
E fu
ll ad
optio
n
of m
ost
prof
itabl
ead
apta
tion
mea
sure
s
Cro
pC
urre
nt-0
.70
03.
75+2
0-0
.93
04.
87+2
8-2
.13
03.
06+2
2Fa
rm+c
rop
Pref
.alte
rnat
ive
-0.7
00
3.75
+20
-0.8
8+5
4.89
+28
-2.2
2-4
3.32
+33
1 For f
arm
N1
ther
e w
as n
o fa
rm le
vel a
dapt
atio
n, si
nce
the
farm
er p
refe
rred
to k
eep
the
curr
ent f
arm
pla
n un
chan
ged
binnenwerk.indd 73 23-2-2016 21:55:08
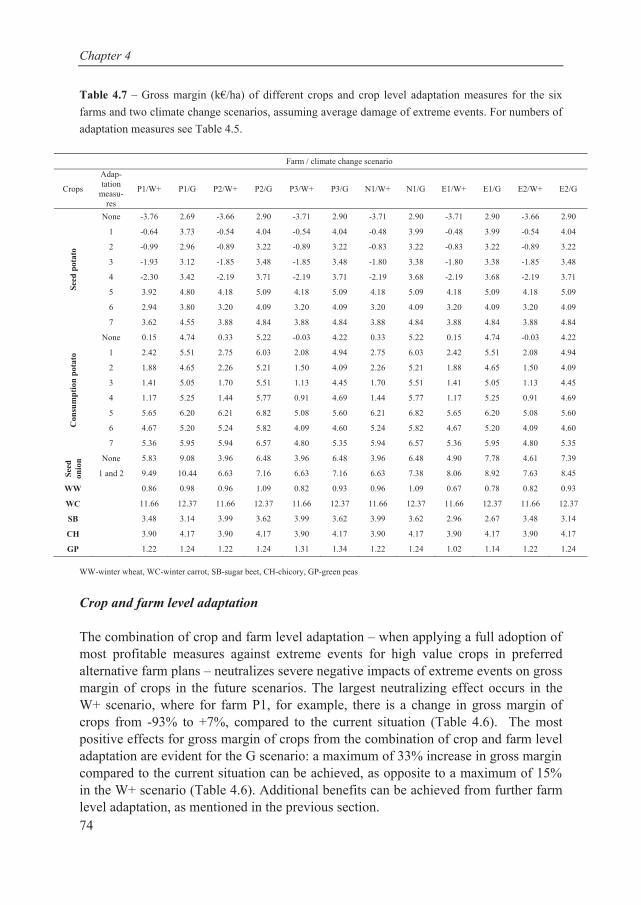
Chapter 4
74
Table 4.7 – Gross margin (k€/ha) of different crops and crop level adaptation measures for the six farms and two climate change scenarios, assuming average damage of extreme events. For numbers of adaptation measures see Table 4.5.
Farm / climate change scenario
Crops
Adap-tation
measu-res
P1/W+ P1/G P2/W+ P2/G P3/W+ P3/G N1/W+ N1/G E1/W+ E1/G E2/W+ E2/G
Seed
pot
ato
None -3.76 2.69 -3.66 2.90 -3.71 2.90 -3.71 2.90 -3.71 2.90 -3.66 2.90
1 -0.64 3.73 -0.54 4.04 -0.54 4.04 -0.48 3.99 -0.48 3.99 -0.54 4.04
2 -0.99 2.96 -0.89 3.22 -0.89 3.22 -0.83 3.22 -0.83 3.22 -0.89 3.22
3 -1.93 3.12 -1.85 3.48 -1.85 3.48 -1.80 3.38 -1.80 3.38 -1.85 3.48
4 -2.30 3.42 -2.19 3.71 -2.19 3.71 -2.19 3.68 -2.19 3.68 -2.19 3.71
5 3.92 4.80 4.18 5.09 4.18 5.09 4.18 5.09 4.18 5.09 4.18 5.09
6 2.94 3.80 3.20 4.09 3.20 4.09 3.20 4.09 3.20 4.09 3.20 4.09
7 3.62 4.55 3.88 4.84 3.88 4.84 3.88 4.84 3.88 4.84 3.88 4.84
Con
sum
ptio
n po
tato
None 0.15 4.74 0.33 5.22 -0.03 4.22 0.33 5.22 0.15 4.74 -0.03 4.22
1 2.42 5.51 2.75 6.03 2.08 4.94 2.75 6.03 2.42 5.51 2.08 4.94
2 1.88 4.65 2.26 5.21 1.50 4.09 2.26 5.21 1.88 4.65 1.50 4.09
3 1.41 5.05 1.70 5.51 1.13 4.45 1.70 5.51 1.41 5.05 1.13 4.45
4 1.17 5.25 1.44 5.77 0.91 4.69 1.44 5.77 1.17 5.25 0.91 4.69
5 5.65 6.20 6.21 6.82 5.08 5.60 6.21 6.82 5.65 6.20 5.08 5.60
6 4.67 5.20 5.24 5.82 4.09 4.60 5.24 5.82 4.67 5.20 4.09 4.60
7 5.36 5.95 5.94 6.57 4.80 5.35 5.94 6.57 5.36 5.95 4.80 5.35
Seed
on
ion None 5.83 9.08 3.96 6.48 3.96 6.48 3.96 6.48 4.90 7.78 4.61 7.39
1 and 2 9.49 10.44 6.63 7.16 6.63 7.16 6.63 7.38 8.06 8.92 7.63 8.45
WW 0.86 0.98 0.96 1.09 0.82 0.93 0.96 1.09 0.67 0.78 0.82 0.93
WC 11.66 12.37 11.66 12.37 11.66 12.37 11.66 12.37 11.66 12.37 11.66 12.37
SB 3.48 3.14 3.99 3.62 3.99 3.62 3.99 3.62 2.96 2.67 3.48 3.14
CH 3.90 4.17 3.90 4.17 3.90 4.17 3.90 4.17 3.90 4.17 3.90 4.17
GP 1.22 1.24 1.22 1.24 1.31 1.34 1.22 1.24 1.02 1.14 1.22 1.24 WW-winter wheat, WC-winter carrot, SB-sugar beet, CH-chicory, GP-green peas
Crop and farm level adaptation The combination of crop and farm level adaptation – when applying a full adoption of most profitable measures against extreme events for high value crops in preferred alternative farm plans – neutralizes severe negative impacts of extreme events on gross margin of crops in the future scenarios. The largest neutralizing effect occurs in the W+ scenario, where for farm P1, for example, there is a change in gross margin of crops from -93% to +7%, compared to the current situation (Table 4.6). The most positive effects for gross margin of crops from the combination of crop and farm level adaptation are evident for the G scenario: a maximum of 33% increase in gross margin compared to the current situation can be achieved, as opposite to a maximum of 15% in the W+ scenario (Table 4.6). Additional benefits can be achieved from further farm level adaptation, as mentioned in the previous section.
Crop and farm level adaptation
75
In general, crop level adaptation was simulated to be most effective in increase of gross margin of crops for farms P1 and P2 in both scenarios, and for farms P3 and E2 in the W+ scenario. Farm level adaptation was simulated to be the most effective for farm E2 in the G scenario. A combination of farm and crop level adaptation was simulated to be the most effective for farm E1 in both scenarios and for farms E2 and P3 in the G scenario. In the W+ scenario farms cannot avoid negative impacts of extreme events on gross margin of crops with farm level adaptation. One needs to apply crop level measures against extreme events either on the current farm plan or in combination with farm level adaptation. In the G scenario, farm level adaptation can be profitable (examples of farms E2 and P3), when increasing the share of seed potato. 4.3.4 How do different farmers’ objectives influence preferences for different adaptation measures to climate change? In Chapter 3 we found that among the surveyed farms, P1 and P2 focused on improvement of organic matter balance, when selecting the preferred alternative farm plan in the current situation, while for P3 and E2 farms the priority in terms of objectives was to increase the farm economic result in the current situation. For farm E1 there were still options for improving both objectives simultaneously, and the farm chose to do so. Farm N1 was satisfied with the current performance as to the important objectives.
Using the example of farm P1 we can show how different objectives could lead to different preferences for adaptation measures to climate change. Table 4.6 shows that with the preferred alternative farm plan of farm P1 the gross margin increase will be lower compared to the current farm plan (+7% compared to + 18% in W+ CC+EE full adoption of most profitable adaptation measures), while organic matter balance will be less negative (-0.38 compared to -0.66 t OM/ha). There are additional options generated by the FarmDESIGN model that can increase gross margin of crops and maintain organic matter balance at the level of the preferred alternative farm plan. Crop level adaptation will always be positive for gross margin, and is assumed to have no impact on organic matter. Main differences therefore depend on farm level adaptation in terms of switching crops. Switching from grass to winter wheat would be beneficial regarding both objectives. If the farm would opt for further increase in organic matter balance, there are only few options that do not cause a simultaneous decrease in gross margin of crops. Those options include a switch to winter wheat from grass and partially from chicory and seed potato (see also Appendix 4. G).
If the main objective of the farmer is improvement of gross margin of crops, cultivating high value crops remains the best option, although adaptation measures need to be adopted, which will slightly reduce gross margin. If farms aim to prioritize gross margin of crops and organic matter simultaneously, shifting to winter wheat is a good option, as it improves organic matter balance on the farm and has a relatively small negative effect from climate change on its gross margin.
binnenwerk.indd 74 23-2-2016 21:55:09

Chapter 4
74
Table 4.7 – Gross margin (k€/ha) of different crops and crop level adaptation measures for the six farms and two climate change scenarios, assuming average damage of extreme events. For numbers of adaptation measures see Table 4.5.
Farm / climate change scenario
Crops
Adap-tation
measu-res
P1/W+ P1/G P2/W+ P2/G P3/W+ P3/G N1/W+ N1/G E1/W+ E1/G E2/W+ E2/G
Seed
pot
ato
None -3.76 2.69 -3.66 2.90 -3.71 2.90 -3.71 2.90 -3.71 2.90 -3.66 2.90
1 -0.64 3.73 -0.54 4.04 -0.54 4.04 -0.48 3.99 -0.48 3.99 -0.54 4.04
2 -0.99 2.96 -0.89 3.22 -0.89 3.22 -0.83 3.22 -0.83 3.22 -0.89 3.22
3 -1.93 3.12 -1.85 3.48 -1.85 3.48 -1.80 3.38 -1.80 3.38 -1.85 3.48
4 -2.30 3.42 -2.19 3.71 -2.19 3.71 -2.19 3.68 -2.19 3.68 -2.19 3.71
5 3.92 4.80 4.18 5.09 4.18 5.09 4.18 5.09 4.18 5.09 4.18 5.09
6 2.94 3.80 3.20 4.09 3.20 4.09 3.20 4.09 3.20 4.09 3.20 4.09
7 3.62 4.55 3.88 4.84 3.88 4.84 3.88 4.84 3.88 4.84 3.88 4.84
Con
sum
ptio
n po
tato
None 0.15 4.74 0.33 5.22 -0.03 4.22 0.33 5.22 0.15 4.74 -0.03 4.22
1 2.42 5.51 2.75 6.03 2.08 4.94 2.75 6.03 2.42 5.51 2.08 4.94
2 1.88 4.65 2.26 5.21 1.50 4.09 2.26 5.21 1.88 4.65 1.50 4.09
3 1.41 5.05 1.70 5.51 1.13 4.45 1.70 5.51 1.41 5.05 1.13 4.45
4 1.17 5.25 1.44 5.77 0.91 4.69 1.44 5.77 1.17 5.25 0.91 4.69
5 5.65 6.20 6.21 6.82 5.08 5.60 6.21 6.82 5.65 6.20 5.08 5.60
6 4.67 5.20 5.24 5.82 4.09 4.60 5.24 5.82 4.67 5.20 4.09 4.60
7 5.36 5.95 5.94 6.57 4.80 5.35 5.94 6.57 5.36 5.95 4.80 5.35
Seed
on
ion None 5.83 9.08 3.96 6.48 3.96 6.48 3.96 6.48 4.90 7.78 4.61 7.39
1 and 2 9.49 10.44 6.63 7.16 6.63 7.16 6.63 7.38 8.06 8.92 7.63 8.45
WW 0.86 0.98 0.96 1.09 0.82 0.93 0.96 1.09 0.67 0.78 0.82 0.93
WC 11.66 12.37 11.66 12.37 11.66 12.37 11.66 12.37 11.66 12.37 11.66 12.37
SB 3.48 3.14 3.99 3.62 3.99 3.62 3.99 3.62 2.96 2.67 3.48 3.14
CH 3.90 4.17 3.90 4.17 3.90 4.17 3.90 4.17 3.90 4.17 3.90 4.17
GP 1.22 1.24 1.22 1.24 1.31 1.34 1.22 1.24 1.02 1.14 1.22 1.24 WW-winter wheat, WC-winter carrot, SB-sugar beet, CH-chicory, GP-green peas
Crop and farm level adaptation The combination of crop and farm level adaptation – when applying a full adoption of most profitable measures against extreme events for high value crops in preferred alternative farm plans – neutralizes severe negative impacts of extreme events on gross margin of crops in the future scenarios. The largest neutralizing effect occurs in the W+ scenario, where for farm P1, for example, there is a change in gross margin of crops from -93% to +7%, compared to the current situation (Table 4.6). The most positive effects for gross margin of crops from the combination of crop and farm level adaptation are evident for the G scenario: a maximum of 33% increase in gross margin compared to the current situation can be achieved, as opposite to a maximum of 15% in the W+ scenario (Table 4.6). Additional benefits can be achieved from further farm level adaptation, as mentioned in the previous section.
Crop and farm level adaptation
75
In general, crop level adaptation was simulated to be most effective in increase of gross margin of crops for farms P1 and P2 in both scenarios, and for farms P3 and E2 in the W+ scenario. Farm level adaptation was simulated to be the most effective for farm E2 in the G scenario. A combination of farm and crop level adaptation was simulated to be the most effective for farm E1 in both scenarios and for farms E2 and P3 in the G scenario. In the W+ scenario farms cannot avoid negative impacts of extreme events on gross margin of crops with farm level adaptation. One needs to apply crop level measures against extreme events either on the current farm plan or in combination with farm level adaptation. In the G scenario, farm level adaptation can be profitable (examples of farms E2 and P3), when increasing the share of seed potato. 4.3.4 How do different farmers’ objectives influence preferences for different adaptation measures to climate change? In Chapter 3 we found that among the surveyed farms, P1 and P2 focused on improvement of organic matter balance, when selecting the preferred alternative farm plan in the current situation, while for P3 and E2 farms the priority in terms of objectives was to increase the farm economic result in the current situation. For farm E1 there were still options for improving both objectives simultaneously, and the farm chose to do so. Farm N1 was satisfied with the current performance as to the important objectives.
Using the example of farm P1 we can show how different objectives could lead to different preferences for adaptation measures to climate change. Table 4.6 shows that with the preferred alternative farm plan of farm P1 the gross margin increase will be lower compared to the current farm plan (+7% compared to + 18% in W+ CC+EE full adoption of most profitable adaptation measures), while organic matter balance will be less negative (-0.38 compared to -0.66 t OM/ha). There are additional options generated by the FarmDESIGN model that can increase gross margin of crops and maintain organic matter balance at the level of the preferred alternative farm plan. Crop level adaptation will always be positive for gross margin, and is assumed to have no impact on organic matter. Main differences therefore depend on farm level adaptation in terms of switching crops. Switching from grass to winter wheat would be beneficial regarding both objectives. If the farm would opt for further increase in organic matter balance, there are only few options that do not cause a simultaneous decrease in gross margin of crops. Those options include a switch to winter wheat from grass and partially from chicory and seed potato (see also Appendix 4. G).
If the main objective of the farmer is improvement of gross margin of crops, cultivating high value crops remains the best option, although adaptation measures need to be adopted, which will slightly reduce gross margin. If farms aim to prioritize gross margin of crops and organic matter simultaneously, shifting to winter wheat is a good option, as it improves organic matter balance on the farm and has a relatively small negative effect from climate change on its gross margin.
binnenwerk.indd 75 23-2-2016 21:55:09
Chapter 4
76
4.4 Discussion 4.4.1 Impact of climate change, including extreme events, on farm performance The beneficial effect of gradual climate change on the yield of most of the temperate arable crops in the Netherlands (Angulo et al. 2013; Reidsma et al. 2015; Wolf et al. 2011) was confirmed in our study in terms of economic result at farm level (i.e. gross margin of crops). Similar findings on positive effects on climate change on farm income were reported by Kanellopoulos et al. (2014) and Reidsma et al. (2015), where arable farms in Flevoland were simulated to have an average increase of 7.3% of farm income in the W+ scenario. Our results showed a range from 16 to 27% increase in gross margin of crops on the surveyed farms in the W+ scenario (see Table 4.6).
The assessment of effects of extreme events at farm level is new in adaptation literature. Reidsma et al. (2015) showed that an increased future frequency of extreme events poses large risks on crop yields and therefore affects farm economic results. This was clearly confirmed in our study: positive effects of gradual climate change were offset on all farms in the W+ scenario (Table 4.6). 4.4.2 Adaptation at crop and farm level One of the important outcomes of this study is the fact that adaptation measures for high value crops help prevent large damage for the gross margin of crops from extreme events on all farm types. At the same time, for some farms climate change will have less impact when farmers apply farm level adaptation and switch to other crops (i.e. reduce the share of high value crops and increase the share of winter wheat). The shift to (more) winter wheat also helps to improve the soil organic matter balance on a farm. The combination of crop and farm level adaptation appeared to be the most effective strategy in improving organic matter balance and maintaining farm economic result under climate change and extreme events.
Crop level adaptation of existing cropping systems (e.g. changes in varieties, planting times, irrigation and residue management) has been widely assessed and acknowledged to be effective against future climate challenges (Challinor et al. 2014). The benefits of this type of adaptation vary with crops and across regions and temperature changes; however, on average, they provide approximately 15 to 18% yield benefit when compared with no adaptation (Porter at al. 2014). Yield benefits in Flevoland were in the same range (Wolf et al. 2011; Reidsma et al. 2015). When considering also the impacts of extreme events as in our study, yield benefits from adaptation measures compared to no adaptation are much higher: up to 67 % if a combination of adaptation measures against different extreme events is used (see also Table 4.5).
Farm level adaptation generally received much less attention in adaptation literature. The studies addressing farm level adaptation to climate change (e.g. Leclère
Crop and farm level adaptation
77
et al. 2013; Klein et al. 2013; Troost and Berger 2014) usually aggregate the results to a regional level. For example, Leclère et al. (2013) assessed farm level autonomous adaptation to climate change for EU-15 member states and showed that largest gains in crop gross margins were found when adopting crop management practices, rather than shifts in cropping patterns, which is also the case in the present study. In general the studies on farm level adaptation show that the adaptation allows farmers to largely benefit from the new possibilities offered by climate change, depending on the various crop responses to climate change. 4.4.3 Influence of farmers’ objectives The importance of different objectives in relation to adaptation preferences to future climate change has been hardly assessed. Klein et al. (2014), for example, assessed the trade-offs between agricultural production and other ecosystem functions (i.e. soil conservation and water provision) under future climate change. Overall they found that the combination of practices that can sustain high productivity in the future was the same as under current climate. Trade-offs between agricultural productivity, soil erosion and N-leaching were found likely to aggravate with climate change. The effects of the extreme events were, however, not included in the analysis.
Chapter 3 concluded that preferences in objectives shift when moving from the current farm practices towards adaptation options in the current climate. Here we show what are the implications from the different preferences in objectives when adapting to future climate change, including extreme events. From the sample of six arable farms in Flevoland we learned that if the main objective of the farmer is improvement of gross margin of crops, cultivating high value crops remains the best option, although under the condition of applying crop level adaptation measures against extreme events. If a farmer aims to prioritize gross margin of crops and organic matter simultaneously, a shift at farm level to (more) winter wheat is a good option, as it improves organic matter balance on the farm and keeps the negative impacts of climate change on gross margin of crops limited, at least under the price ratios we assumed. 4.4.4 Influence of assumptions and methodological limitations The outcomes of our study involving effects of extreme events are largely dependent on the many, and often simplified assumptions we made regarding future damage of the extreme events on crop yields and on the effects of climate change on soil organic matter. Impacts of extreme events on future crop yields are uncertain, with especially the estimated yield damage having a very wide range (see Table 4.3). We assumed an average impact of extreme events on high value crops, which could have implications for calculated cost-efficiency of certain adaptation measures. For example, drip irrigation was not the most cost-efficient adaptation measure in the present study, as it was in Schaap et al. (2013), when high impact of extreme events on crops yields was assumed. With an average instead of high damage, the high annual costs of drip
binnenwerk.indd 76 23-2-2016 21:55:09

Chapter 4
76
4.4 Discussion 4.4.1 Impact of climate change, including extreme events, on farm performance The beneficial effect of gradual climate change on the yield of most of the temperate arable crops in the Netherlands (Angulo et al. 2013; Reidsma et al. 2015; Wolf et al. 2011) was confirmed in our study in terms of economic result at farm level (i.e. gross margin of crops). Similar findings on positive effects on climate change on farm income were reported by Kanellopoulos et al. (2014) and Reidsma et al. (2015), where arable farms in Flevoland were simulated to have an average increase of 7.3% of farm income in the W+ scenario. Our results showed a range from 16 to 27% increase in gross margin of crops on the surveyed farms in the W+ scenario (see Table 4.6).
The assessment of effects of extreme events at farm level is new in adaptation literature. Reidsma et al. (2015) showed that an increased future frequency of extreme events poses large risks on crop yields and therefore affects farm economic results. This was clearly confirmed in our study: positive effects of gradual climate change were offset on all farms in the W+ scenario (Table 4.6). 4.4.2 Adaptation at crop and farm level One of the important outcomes of this study is the fact that adaptation measures for high value crops help prevent large damage for the gross margin of crops from extreme events on all farm types. At the same time, for some farms climate change will have less impact when farmers apply farm level adaptation and switch to other crops (i.e. reduce the share of high value crops and increase the share of winter wheat). The shift to (more) winter wheat also helps to improve the soil organic matter balance on a farm. The combination of crop and farm level adaptation appeared to be the most effective strategy in improving organic matter balance and maintaining farm economic result under climate change and extreme events.
Crop level adaptation of existing cropping systems (e.g. changes in varieties, planting times, irrigation and residue management) has been widely assessed and acknowledged to be effective against future climate challenges (Challinor et al. 2014). The benefits of this type of adaptation vary with crops and across regions and temperature changes; however, on average, they provide approximately 15 to 18% yield benefit when compared with no adaptation (Porter at al. 2014). Yield benefits in Flevoland were in the same range (Wolf et al. 2011; Reidsma et al. 2015). When considering also the impacts of extreme events as in our study, yield benefits from adaptation measures compared to no adaptation are much higher: up to 67 % if a combination of adaptation measures against different extreme events is used (see also Table 4.5).
Farm level adaptation generally received much less attention in adaptation literature. The studies addressing farm level adaptation to climate change (e.g. Leclère
Crop and farm level adaptation
77
et al. 2013; Klein et al. 2013; Troost and Berger 2014) usually aggregate the results to a regional level. For example, Leclère et al. (2013) assessed farm level autonomous adaptation to climate change for EU-15 member states and showed that largest gains in crop gross margins were found when adopting crop management practices, rather than shifts in cropping patterns, which is also the case in the present study. In general the studies on farm level adaptation show that the adaptation allows farmers to largely benefit from the new possibilities offered by climate change, depending on the various crop responses to climate change. 4.4.3 Influence of farmers’ objectives The importance of different objectives in relation to adaptation preferences to future climate change has been hardly assessed. Klein et al. (2014), for example, assessed the trade-offs between agricultural production and other ecosystem functions (i.e. soil conservation and water provision) under future climate change. Overall they found that the combination of practices that can sustain high productivity in the future was the same as under current climate. Trade-offs between agricultural productivity, soil erosion and N-leaching were found likely to aggravate with climate change. The effects of the extreme events were, however, not included in the analysis.
Chapter 3 concluded that preferences in objectives shift when moving from the current farm practices towards adaptation options in the current climate. Here we show what are the implications from the different preferences in objectives when adapting to future climate change, including extreme events. From the sample of six arable farms in Flevoland we learned that if the main objective of the farmer is improvement of gross margin of crops, cultivating high value crops remains the best option, although under the condition of applying crop level adaptation measures against extreme events. If a farmer aims to prioritize gross margin of crops and organic matter simultaneously, a shift at farm level to (more) winter wheat is a good option, as it improves organic matter balance on the farm and keeps the negative impacts of climate change on gross margin of crops limited, at least under the price ratios we assumed. 4.4.4 Influence of assumptions and methodological limitations The outcomes of our study involving effects of extreme events are largely dependent on the many, and often simplified assumptions we made regarding future damage of the extreme events on crop yields and on the effects of climate change on soil organic matter. Impacts of extreme events on future crop yields are uncertain, with especially the estimated yield damage having a very wide range (see Table 4.3). We assumed an average impact of extreme events on high value crops, which could have implications for calculated cost-efficiency of certain adaptation measures. For example, drip irrigation was not the most cost-efficient adaptation measure in the present study, as it was in Schaap et al. (2013), when high impact of extreme events on crops yields was assumed. With an average instead of high damage, the high annual costs of drip
binnenwerk.indd 77 23-2-2016 21:55:09
Chapter 4
78
irrigation cause this measure to be less attractive than other proposed measures with the same efficiency against the negative effects on potato yields from the heat wave. Note that also a switch to another cultivar may be a good adaptation measure. This measure was not included in the present study, as it is rather a sector level measure. However, today already different cultivars are available with variable resistance against heat.
The focus of our study was on high value crops and the most severe climate risks (extreme events). There are several possible approaches of calculating the effects of extreme events on crop yield. In the present study we did not account for current impact of extreme events on current yields, whereas Paas (2013) included the current impacts. Diogo et al. (2014) also did it differently: they showed both impacts of extreme events in the current and in the future situation, and did not focus on the change. There is also much uncertainty regarding incorporation of effects of extreme events in crop models. The recent review article of Barlow et al. (2015) investigates how contemporary processed based crop models do not adequately account for the impact of climate extremes (especially heat stress) on crop yield. In this study we assumed that the effects of climate extremes were not adequately included in the crop model WOFOST, and therefore considered these separately.
We did not perform an uncertainty analysis in the present study, but the information on gross margins of crops with and without adaptation measures in Table 4.7 allows to understand some of the uncertainty related to the effects of extreme events on crop yields. Prices of potatoes, but also of other crops may vary largely over time, influencing their relative profitability. In all scenarios and on all farms, gross margins of seed and consumption potato with adaptation are less than half of those of winter carrot. Prices thus need to change a lot to change this relative difference. Adaptation towards winter carrot would be most beneficial regarding gross margin for all farms, however, we did not assess the impacts of the extreme events on winter carrot. Even without crop level adaptation, the gross margins of seed onion are higher than for other crops, and therefore switching to other crops from seed onion is not interesting from a gross margin point of view. However, in the W+ scenario the gross margin of sugar beet and chicory do come closer to those of seed onion and potatoes for several farms, thus becoming better alternative options of adaptation at farm level.
We assumed that changes in soil organic matter balance on farms will occur with farm level adaptation (i.e. shift to alternative crops), while soil organic matter content for given farm plans will not change due to climate change. In the literature we found very different estimates of the possible effect of climate change on soil organic matter in the temperate zone (especially in Europe), with some showing loss of soil organic matter, and others showing no loss and sometimes a slight accumulation of soil organic matter. According to Smith et al. (2008), small scale laboratory and field experiments and modelling studies suggest that climate change is likely to induce soil carbon loss from northern ecosystems, but little evidence comes from large scale observation. Smith et al. (2005), using the RothC model, showed that increases in plant productivity in Europe would likely counterbalance increased decomposition due
Crop and farm level adaptation
79
to global warming towards 2080. The recent research based on space-for-time substitution technique (Barraclough et al. 2015) also showed that organo-mineral and mineral soils under temperate conditions could exhibit very different responses to changes in climate. Many modelling studies used the IPCC climate scenarios to estimate the effects of climate change on soil organic matter. In most cases, large uncertainties are evident for the different scenarios in terms of future values for soil organic matter (Luo et al. 2015; Smith et al. 2005; Zhong and Xu 2014).
In general, an increase in productivity having a positive impact on soil organic matter balance counterbalances the increase in decomposition under climate change. In our analysis, crop productivity decreases due to climate change and extreme events, so it is likely that soil organic matter will be negatively affected by climate change. The net effect is uncertain, but is projected to be smaller than the effects of crop changes (see also Smith et al. 2005). The large role of crop rotations and land use history in maintaining soil organic matter is also found in Ogle et al. (2010) and Reijneveld et al. (2009). Land use change in their perception is however much broader than the crop change as we simulated.
Maintaining soil organic matter balance appeared to be one of the important objectives for farmers in the region. Therefore one can expect that the farmers would try to prevent soil organic matter decrease over time by applying extra adaptation measures, e.g. keeping more crop residues on the field, applying green manures. There is already much attention for soil conservation measures in the EU Common Agricultural Policy, and also in the Netherlands farmers obtain agro-environmental payments when they take measures that increase soil organic matter contents. 4.4.5 Concluding remarks Based on bio-economic modelling using individual farm data on farms endowments, structure and objectives, we assessed possible impacts of gradual climate change, extreme events and adaptation measures at crop and farm levels. Our results for selected arable farms in Flevoland suggest that gradual climate change improves farm performance in terms of farm economic result. The degree of improvement varies per climate change scenario and per farm, depending on the cropping pattern. At the same time, extreme events neutralize positive impacts of gradual climate change. A combination of crop and farm level adaptation appeared to be the best option for the surveyed farms in terms of improving both farm economic result and soil organic matter balance.
So far, farm level responses and adaptation strategies to climate change have not received sufficient attention in adaptation literature in our view. While White et al. (2011) and Porter et al. (2014) strive for more accurate simulation of impacts of climate change on crop production, we argue that farming systems analysis and integrated assessment of impact and adaptation options to climate change are similarly important. The present research contributes to a better representation of farm level adaptation in climate change research.
binnenwerk.indd 78 23-2-2016 21:55:09

Chapter 4
78
irrigation cause this measure to be less attractive than other proposed measures with the same efficiency against the negative effects on potato yields from the heat wave. Note that also a switch to another cultivar may be a good adaptation measure. This measure was not included in the present study, as it is rather a sector level measure. However, today already different cultivars are available with variable resistance against heat.
The focus of our study was on high value crops and the most severe climate risks (extreme events). There are several possible approaches of calculating the effects of extreme events on crop yield. In the present study we did not account for current impact of extreme events on current yields, whereas Paas (2013) included the current impacts. Diogo et al. (2014) also did it differently: they showed both impacts of extreme events in the current and in the future situation, and did not focus on the change. There is also much uncertainty regarding incorporation of effects of extreme events in crop models. The recent review article of Barlow et al. (2015) investigates how contemporary processed based crop models do not adequately account for the impact of climate extremes (especially heat stress) on crop yield. In this study we assumed that the effects of climate extremes were not adequately included in the crop model WOFOST, and therefore considered these separately.
We did not perform an uncertainty analysis in the present study, but the information on gross margins of crops with and without adaptation measures in Table 4.7 allows to understand some of the uncertainty related to the effects of extreme events on crop yields. Prices of potatoes, but also of other crops may vary largely over time, influencing their relative profitability. In all scenarios and on all farms, gross margins of seed and consumption potato with adaptation are less than half of those of winter carrot. Prices thus need to change a lot to change this relative difference. Adaptation towards winter carrot would be most beneficial regarding gross margin for all farms, however, we did not assess the impacts of the extreme events on winter carrot. Even without crop level adaptation, the gross margins of seed onion are higher than for other crops, and therefore switching to other crops from seed onion is not interesting from a gross margin point of view. However, in the W+ scenario the gross margin of sugar beet and chicory do come closer to those of seed onion and potatoes for several farms, thus becoming better alternative options of adaptation at farm level.
We assumed that changes in soil organic matter balance on farms will occur with farm level adaptation (i.e. shift to alternative crops), while soil organic matter content for given farm plans will not change due to climate change. In the literature we found very different estimates of the possible effect of climate change on soil organic matter in the temperate zone (especially in Europe), with some showing loss of soil organic matter, and others showing no loss and sometimes a slight accumulation of soil organic matter. According to Smith et al. (2008), small scale laboratory and field experiments and modelling studies suggest that climate change is likely to induce soil carbon loss from northern ecosystems, but little evidence comes from large scale observation. Smith et al. (2005), using the RothC model, showed that increases in plant productivity in Europe would likely counterbalance increased decomposition due
Crop and farm level adaptation
79
to global warming towards 2080. The recent research based on space-for-time substitution technique (Barraclough et al. 2015) also showed that organo-mineral and mineral soils under temperate conditions could exhibit very different responses to changes in climate. Many modelling studies used the IPCC climate scenarios to estimate the effects of climate change on soil organic matter. In most cases, large uncertainties are evident for the different scenarios in terms of future values for soil organic matter (Luo et al. 2015; Smith et al. 2005; Zhong and Xu 2014).
In general, an increase in productivity having a positive impact on soil organic matter balance counterbalances the increase in decomposition under climate change. In our analysis, crop productivity decreases due to climate change and extreme events, so it is likely that soil organic matter will be negatively affected by climate change. The net effect is uncertain, but is projected to be smaller than the effects of crop changes (see also Smith et al. 2005). The large role of crop rotations and land use history in maintaining soil organic matter is also found in Ogle et al. (2010) and Reijneveld et al. (2009). Land use change in their perception is however much broader than the crop change as we simulated.
Maintaining soil organic matter balance appeared to be one of the important objectives for farmers in the region. Therefore one can expect that the farmers would try to prevent soil organic matter decrease over time by applying extra adaptation measures, e.g. keeping more crop residues on the field, applying green manures. There is already much attention for soil conservation measures in the EU Common Agricultural Policy, and also in the Netherlands farmers obtain agro-environmental payments when they take measures that increase soil organic matter contents. 4.4.5 Concluding remarks Based on bio-economic modelling using individual farm data on farms endowments, structure and objectives, we assessed possible impacts of gradual climate change, extreme events and adaptation measures at crop and farm levels. Our results for selected arable farms in Flevoland suggest that gradual climate change improves farm performance in terms of farm economic result. The degree of improvement varies per climate change scenario and per farm, depending on the cropping pattern. At the same time, extreme events neutralize positive impacts of gradual climate change. A combination of crop and farm level adaptation appeared to be the best option for the surveyed farms in terms of improving both farm economic result and soil organic matter balance.
So far, farm level responses and adaptation strategies to climate change have not received sufficient attention in adaptation literature in our view. While White et al. (2011) and Porter et al. (2014) strive for more accurate simulation of impacts of climate change on crop production, we argue that farming systems analysis and integrated assessment of impact and adaptation options to climate change are similarly important. The present research contributes to a better representation of farm level adaptation in climate change research.
binnenwerk.indd 79 23-2-2016 21:55:10

Chapter 4
80
Appendix 4.A – Yield changes in future climate scenarios (%). Crop W+ G Winter wheat 2.7 10.5 Sugar beet 28.6 19.3 Green peas 9.1 10.6 Winter carrot 14.2 20.3 Seed potato 2.8 10.0 Seed onion 14.2 20.3 Consumption potato 2.2 8.4 Chicory 14.2 20.3 Appendix 4.B – Inputs of N fertilizer in future climate scenarios, average among surveyed farms (kg N/ha). Crop 2010 W+ G Winter wheat 229 236 259 Sugar beet 128 174 159 Green peas 117 130 133 Winter carrot 195 230 244 Seed potato 116 119 130 Seed onion 151 179 189 Consumption potato 312 322 347 Chicory 78 92 98 Appendix 4.C – Labour hours per crop operation per ha (Anonymous 2009).
Operation Consumption potato Seed potato Seed onion
Land preparation 3 3 3 Planting/sowing 1 3 0 Crop protection 10 13 9 Hand weeding 0 0 15 Harvest and processing 12 51 10 Total 26 70 37 Appendix 4.D– Assumptions regarding changes in labour requirements and costs of adaptation measures (from Schaap et al. 2013).
Adaptation measures Operation Extra hours
(hrs/ha) Costs (k€/ha) Plant in wider ridges Land preparation -1 0 Drip irrigation Extra/irrigation 0 1 Optimize crop cover Land preparation 3 0.25 Air conditioning Extra/postharvest 0 0.15 Chemical protection Crop protection 1 0.75 Uv-light protection Crop protection 6 0.75
Crop and farm level adaptation
81
Appendix 4.E – Labour requirements and costs of adaptation measures, included in FarmDESIGN.
Crops Adaptation measures
Labour requirement (hours/ha) Costs (€/ha)
Seed potato 1 plant in wider ridges 69 7633 2 drip irrigation 70 8633 3 optimize crop cover 73 7883 4 air conditioning 70 7783 5 plant in wide ridges and air conditioning 69 7783 6 drip irrigation and air conditioning 70 8783 7 optimize crop cover and air conditioning 73 8033 Consumption potato 1 plant in wider ridges 25 2610 2 drip irrigation 26 3610 3 optimize crop cover 29 2860 4 air conditioning 26 2760 5 plant in wide ridges and air conditioning 25 2760 6 drip irrigation and air conditioning 26 3760 7 optimize crop cover and air conditioning 29 3010 Seed onion 1 chemical protection 38 3477 2 UV-light protection 43 3477 3 chemical protection and UV-light protection 44 4227
Appendix 4.F – Risk and extreme events. The change in frequency of future climate related extreme events will influence the crop yields and hence will result in variation of gross margin of crops, which is included as one of the five objectives in a multiple objective optimization modelling with the FarmDESIGN model. A variance co-variance matrix of gross margins was calculated based on five year data on input/output quantities and prices (Hazell and Norton 1986). A quadratic function was obtained and used to calculate variation in gross margin for specific farm production plans. We calculated co-variance matrices for a five year period (around 2050) with the following assumptions. We used fixed prices and costs for the period 2006-2010 to calculate variation in gross margin for the period 2046-2050 due to yield variation. We assumed that yield change for seed, consumption potato and seed onion will be affected by extreme events and adaptation measures. The future frequencies of extreme events (per scenario) were calculated for the period 2046-2050. In the W+ scenario, for example, a heat wave will occur every year (and one or two years twice per year) in the period 2046-2050. Warm winter and warm and wet conditions will occur three times in five years. The current year 2009 is assumed to be the year without extreme events “warm winter” and “warm and wet conditions” (based on observed highest yields in the period 2006-2010; we assumed that in the future the year 2049 will also be without extreme events). The future yield without adaptation will depend on the damage of the extreme events (see equation 4.1). Yield with adaptation measures will depend on effectiveness of different (combinations of) adaptation measures. As a result, we obtained a variance-co-variance matrix per scenario. The matrix was used as an input to the bio-economic model FarmDESIGN to calculate the risk for every generated farm plan.
binnenwerk.indd 80 23-2-2016 21:55:10

Chapter 4
80
Appendix 4.A – Yield changes in future climate scenarios (%). Crop W+ G Winter wheat 2.7 10.5 Sugar beet 28.6 19.3 Green peas 9.1 10.6 Winter carrot 14.2 20.3 Seed potato 2.8 10.0 Seed onion 14.2 20.3 Consumption potato 2.2 8.4 Chicory 14.2 20.3 Appendix 4.B – Inputs of N fertilizer in future climate scenarios, average among surveyed farms (kg N/ha). Crop 2010 W+ G Winter wheat 229 236 259 Sugar beet 128 174 159 Green peas 117 130 133 Winter carrot 195 230 244 Seed potato 116 119 130 Seed onion 151 179 189 Consumption potato 312 322 347 Chicory 78 92 98 Appendix 4.C – Labour hours per crop operation per ha (Anonymous 2009).
Operation Consumption potato Seed potato Seed onion
Land preparation 3 3 3 Planting/sowing 1 3 0 Crop protection 10 13 9 Hand weeding 0 0 15 Harvest and processing 12 51 10 Total 26 70 37 Appendix 4.D– Assumptions regarding changes in labour requirements and costs of adaptation measures (from Schaap et al. 2013).
Adaptation measures Operation Extra hours
(hrs/ha) Costs (k€/ha) Plant in wider ridges Land preparation -1 0 Drip irrigation Extra/irrigation 0 1 Optimize crop cover Land preparation 3 0.25 Air conditioning Extra/postharvest 0 0.15 Chemical protection Crop protection 1 0.75 Uv-light protection Crop protection 6 0.75
Crop and farm level adaptation
81
Appendix 4.E – Labour requirements and costs of adaptation measures, included in FarmDESIGN.
Crops Adaptation measures
Labour requirement (hours/ha) Costs (€/ha)
Seed potato 1 plant in wider ridges 69 7633 2 drip irrigation 70 8633 3 optimize crop cover 73 7883 4 air conditioning 70 7783 5 plant in wide ridges and air conditioning 69 7783 6 drip irrigation and air conditioning 70 8783 7 optimize crop cover and air conditioning 73 8033 Consumption potato 1 plant in wider ridges 25 2610 2 drip irrigation 26 3610 3 optimize crop cover 29 2860 4 air conditioning 26 2760 5 plant in wide ridges and air conditioning 25 2760 6 drip irrigation and air conditioning 26 3760 7 optimize crop cover and air conditioning 29 3010 Seed onion 1 chemical protection 38 3477 2 UV-light protection 43 3477 3 chemical protection and UV-light protection 44 4227
Appendix 4.F – Risk and extreme events. The change in frequency of future climate related extreme events will influence the crop yields and hence will result in variation of gross margin of crops, which is included as one of the five objectives in a multiple objective optimization modelling with the FarmDESIGN model. A variance co-variance matrix of gross margins was calculated based on five year data on input/output quantities and prices (Hazell and Norton 1986). A quadratic function was obtained and used to calculate variation in gross margin for specific farm production plans. We calculated co-variance matrices for a five year period (around 2050) with the following assumptions. We used fixed prices and costs for the period 2006-2010 to calculate variation in gross margin for the period 2046-2050 due to yield variation. We assumed that yield change for seed, consumption potato and seed onion will be affected by extreme events and adaptation measures. The future frequencies of extreme events (per scenario) were calculated for the period 2046-2050. In the W+ scenario, for example, a heat wave will occur every year (and one or two years twice per year) in the period 2046-2050. Warm winter and warm and wet conditions will occur three times in five years. The current year 2009 is assumed to be the year without extreme events “warm winter” and “warm and wet conditions” (based on observed highest yields in the period 2006-2010; we assumed that in the future the year 2049 will also be without extreme events). The future yield without adaptation will depend on the damage of the extreme events (see equation 4.1). Yield with adaptation measures will depend on effectiveness of different (combinations of) adaptation measures. As a result, we obtained a variance-co-variance matrix per scenario. The matrix was used as an input to the bio-economic model FarmDESIGN to calculate the risk for every generated farm plan.
binnenwerk.indd 81 23-2-2016 21:55:10

Chapter 4
82
Appendix 4.G – Examples of alternative farm plans generated by FarmDESIGN for farm P1 in the W+ scenario that improve organic matter balance and/or economic result.
WW-winter wheat; SB-sugar beet; GP-green peas; WC-winter carrot; SP-seed potato; SO-seed onion; CH-chicory; GR-grass; CP-consumption potato 1including most profitable crop level adaptation measures against extreme events
Objectives Crop areas (ha)
Farm plan
Economic result
(k€/ha)
Organic matter balance
(t OM/ha)
WW SB GP WC SP1 SO1 CH GR CP
Current 3.14 -0.66 0 9 0 0 18 9 9 9 0 Alt 1 3.98 -0.66 7 10 6 0 13 12 2 0 0 Alt 2 4.18 -0.64 7 10 0 0 12 12 9 0 0 Alt 3 3.37 -0.38 18 10 0 0 6 12 4 0 0 Alt 4 1.98 0.04 27 10 6 0 0 4 0 3 0
Chapter 5
Institutional constraints for adaptive capacity to climate change in agriculture
Abstract Institutional feasibility defined as the ability of institutions to support adaptive capacity, is an important aspect of climate adaptation, through its influence on the implementation of adaptation measures to climate change. The objective of this Chapter is to create a framework for assessing institutional preconditions that enable or constrain climate change adaptation measures in agriculture and to apply the framework to a case study in agriculture. We adopted and modified the Procedure for Institutional Compatibility Assessment (PICA). Institutions in our framework are characterized by a set of crucial institutional preconditions (CIPs) and indicators linked to each CIP. CIPs refer to both institutional incentives and constraints for implementation of adaptation measures (here to climate change). We applied a combination of ranking and scoring techniques based on information from workshops, interviews and a literature review to assess institutional incentives and constraints for adaptation measures, together indicating the institutional feasibility of implementation of adaptation measures. We selected and assessed three adaptation measures relevant to agriculture in Flevoland, a province in the Netherlands: 1) improvement of water management and irrigation facilities; 2) relocation of farms; and 3) development of new crop varieties. The two main constraining CIPs for the implementation of the measures were found to be (1) heterogeneity of actors’ interests and (2) availability of resources. Based on the institutional feasibility analysis, the implementation of water management and improvement of irrigation facilities will potentially face fewer institutional constraints compared to the other two measures. We conclude that our approach proves applicable for institutional analyses of adaptation measures for current and future (climate) challenges at different levels of implementation, but that more applications are needed to test its validity and robustness. Keywords: institutions; climate change; adaptation; agriculture
This chapter has been published as: Mandryk M, Reidsma P, Kartikasari K, van Ittersum M, Arts B (2015) Institutional constraints for adaptive capacity to climate change in Flevoland's agriculture. Environmental Science & Policy 48 (0):147-162.
binnenwerk.indd 82 23-2-2016 21:55:10

Chapter 4
82
Appendix 4.G – Examples of alternative farm plans generated by FarmDESIGN for farm P1 in the W+ scenario that improve organic matter balance and/or economic result.
WW-winter wheat; SB-sugar beet; GP-green peas; WC-winter carrot; SP-seed potato; SO-seed onion; CH-chicory; GR-grass; CP-consumption potato 1including most profitable crop level adaptation measures against extreme events
Objectives Crop areas (ha)
Farm plan
Economic result
(k€/ha)
Organic matter balance
(t OM/ha)
WW SB GP WC SP1 SO1 CH GR CP
Current 3.14 -0.66 0 9 0 0 18 9 9 9 0 Alt 1 3.98 -0.66 7 10 6 0 13 12 2 0 0 Alt 2 4.18 -0.64 7 10 0 0 12 12 9 0 0 Alt 3 3.37 -0.38 18 10 0 0 6 12 4 0 0 Alt 4 1.98 0.04 27 10 6 0 0 4 0 3 0
Chapter 5
Institutional constraints for adaptive capacity to climate change in agriculture
Abstract Institutional feasibility defined as the ability of institutions to support adaptive capacity, is an important aspect of climate adaptation, through its influence on the implementation of adaptation measures to climate change. The objective of this Chapter is to create a framework for assessing institutional preconditions that enable or constrain climate change adaptation measures in agriculture and to apply the framework to a case study in agriculture. We adopted and modified the Procedure for Institutional Compatibility Assessment (PICA). Institutions in our framework are characterized by a set of crucial institutional preconditions (CIPs) and indicators linked to each CIP. CIPs refer to both institutional incentives and constraints for implementation of adaptation measures (here to climate change). We applied a combination of ranking and scoring techniques based on information from workshops, interviews and a literature review to assess institutional incentives and constraints for adaptation measures, together indicating the institutional feasibility of implementation of adaptation measures. We selected and assessed three adaptation measures relevant to agriculture in Flevoland, a province in the Netherlands: 1) improvement of water management and irrigation facilities; 2) relocation of farms; and 3) development of new crop varieties. The two main constraining CIPs for the implementation of the measures were found to be (1) heterogeneity of actors’ interests and (2) availability of resources. Based on the institutional feasibility analysis, the implementation of water management and improvement of irrigation facilities will potentially face fewer institutional constraints compared to the other two measures. We conclude that our approach proves applicable for institutional analyses of adaptation measures for current and future (climate) challenges at different levels of implementation, but that more applications are needed to test its validity and robustness. Keywords: institutions; climate change; adaptation; agriculture
This chapter has been published as: Mandryk M, Reidsma P, Kartikasari K, van Ittersum M, Arts B (2015) Institutional constraints for adaptive capacity to climate change in Flevoland's agriculture. Environmental Science & Policy 48 (0):147-162.
binnenwerk.indd 83 23-2-2016 21:55:10

Chapter 5
84
5.1 Institutions and adaptive capacity to respond to climate change Climate change is very likely to threaten agricultural production in the future and temperate regions like the Netherlands are no exception (Audsley et al., 2006; Bindi and Olesen, 2010; Reidsma et al., 2009; Schaap et al., 2011). To withstand the negative impacts and to take advantage of the opportunities arising from climate change, the agricultural sector will need to implement adaptation measures (Olesen et al., 2011; Schaap et al., 2013). Adaptation measures to climate change in agriculture refer to practices that might be adopted to alleviate expected adverse impacts or to take advantage of positive impacts (Smit and Skinner, 2002).
A body of literature that has been published in the last decade provides a number of theoretical frameworks for adaptation research (Acosta et al., 2013; Berry et al., 2006; Meinke et al., 2009; Tol, 2005; Yohe and Tol, 2002). In parallel, there is an increasing number of studies that propose adaptation measures at crop, farm and regional/sectoral levels. Considerable attention is given to the development of new adaptation measures, but it is also important to assess whether these measures are feasible in terms of implementation (Easterling et al., 2007; Smit and Skinner, 2002). Yet, relatively few assessments on the likely adoption rates of these potential adaptation measures are available (Howden et al., 2007; Reidsma et al., 2010; Reidsma et al., 2007).
An enabling institutional environment is an important precondition for the implementation of adaptation measures (Adger et al., 2005; Challinor, 2008; Nelson et al., 2007). Initially, the Intergovernmental Panel on Climate Change (IPCC) named economic resources, technology, information and skills, infrastructure, institutions and equity as the main determinants of the adaptive capacity of a society to climate change (Smit, 2000). Later, the integral roles of institutions, governance arrangements and management practices were further emphasized (Brooks et al., 2005; Engle, 2011; Gupta et al., 2010; Yohe and Tol, 2002). As stated by the IPCC (2007), when institutions are supporting the social actors to anticipate and proactively respond to changes, other determinants of adaptive capacity improve, and consequently adaptive capacity as a whole improves (Parry et al., 2007). Considering that climate change brings unpredictable changes, it calls for institutions that enhance the adaptive capacity of a society. In the latest IPCC report (Klein et al., 2014), it was concluded that effective governance and institutions for facilitating adaptation planning and implementation across multiple sectors within regions is by far the dominant adaptation opportunity and constraint.
This study aims to develop a framework for the assessment of crucial institutional preconditions that facilitate the implementation of adaptation measures to climate change. More specifically, our article focuses on the following two research questions: 1) how to identify institutional constraints for adaptive capacity to respond to climate change challenges; and 2) how to assess the feasibility of implementing adaptation measures from an institutional perspective. We applied our framework to the
Institutional context
85
agricultural sector in Flevoland. Flevoland is the most productive agricultural region in the Netherlands, and the agricultural sector is important for the economy of the province. Earlier we explored adaptation options for this province at farm and management level (Chapter 4) and now we investigate its institutional feasibility. 5.2 Frameworks to assess institutional factors influencing adaptation Institutions are the rules of the game in a society or, in other words, institutions are the humanly devised constraints that shape human interaction (North, 1991). Under North’s framework, institutions consist of both informal (customs, tradition, codes of conduct) and formal (laws, property rights) sets of rules, compliance procedures and moral and ethical behavioral norms designed to constrain individuals in the interest of maximizing the wealth or utility of the principals (North, 1991). Although North’s definition is probably the most cited one, it has also been criticized. In particular, other scholars have emphasized the potentially enabling properties of institutions for self-organization, besides constraining agents for principals (Arts et al., 2006; Giddens, 1981). From these definitions, the functions of institutions can be summarized as giving structure, building expectations, and setting both constraints and incentives for human interactions.
Many studies have focused on the adaptive capacity of institutions to cope with climate change. Recent literature on adaptation reveals different terms used to describe factors that may hinder implementation of adaptation from an institutional perspective (see review paper of Biesbroek et al. 2013). Termeer et al. (2012) use the term institutional weaknesses. De Bruin et al. (2009) assess institutional complexities, while Moser and Ekstrom (2010) and Biesbroek et al. (2011) speak about barriers to climate change adaptation. Gupta et al. (2010) focus on assessment of adaptive capacity of institutions and propose an assessment framework called the adaptation wheel. According to Gupta et al. (2010), institutional adaptive capacity includes characteristics of institutions that enable society to cope with climate change and the degree to which institutions allow and encourage actors to change these institutions to cope with climate change. Qualities of institutions that are crucial to enable climate change adaptation are: variety, learning capacity, room for autonomous change, leadership, resources and fair governance (Gupta et al., 2010). The first three were later labelled core qualities, while the last three were called supporting qualities by Termeer et al. (2012). The failures of institutions on any of the above-mentioned qualities are perceived as institutional weaknesses (Termeer et al., 2012). It seems that this institutional literature on climate adaptation exhibits a normative bias: the more institutions and the better they function, the higher the adaptive capacity. We acknowledge that less institutions can be beneficial as well, for example when they create barriers for innovation. Therefore we adhere to an analytical approach below that is agnostic to more or less institutions for climate adaptation ex ante.
For assessments of institutional preconditions in relation to climate change adaptation in agriculture, the definition and analysis of institutions by Theesfeld et al.
binnenwerk.indd 84 23-2-2016 21:55:11

Chapter 5
84
5.1 Institutions and adaptive capacity to respond to climate change Climate change is very likely to threaten agricultural production in the future and temperate regions like the Netherlands are no exception (Audsley et al., 2006; Bindi and Olesen, 2010; Reidsma et al., 2009; Schaap et al., 2011). To withstand the negative impacts and to take advantage of the opportunities arising from climate change, the agricultural sector will need to implement adaptation measures (Olesen et al., 2011; Schaap et al., 2013). Adaptation measures to climate change in agriculture refer to practices that might be adopted to alleviate expected adverse impacts or to take advantage of positive impacts (Smit and Skinner, 2002).
A body of literature that has been published in the last decade provides a number of theoretical frameworks for adaptation research (Acosta et al., 2013; Berry et al., 2006; Meinke et al., 2009; Tol, 2005; Yohe and Tol, 2002). In parallel, there is an increasing number of studies that propose adaptation measures at crop, farm and regional/sectoral levels. Considerable attention is given to the development of new adaptation measures, but it is also important to assess whether these measures are feasible in terms of implementation (Easterling et al., 2007; Smit and Skinner, 2002). Yet, relatively few assessments on the likely adoption rates of these potential adaptation measures are available (Howden et al., 2007; Reidsma et al., 2010; Reidsma et al., 2007).
An enabling institutional environment is an important precondition for the implementation of adaptation measures (Adger et al., 2005; Challinor, 2008; Nelson et al., 2007). Initially, the Intergovernmental Panel on Climate Change (IPCC) named economic resources, technology, information and skills, infrastructure, institutions and equity as the main determinants of the adaptive capacity of a society to climate change (Smit, 2000). Later, the integral roles of institutions, governance arrangements and management practices were further emphasized (Brooks et al., 2005; Engle, 2011; Gupta et al., 2010; Yohe and Tol, 2002). As stated by the IPCC (2007), when institutions are supporting the social actors to anticipate and proactively respond to changes, other determinants of adaptive capacity improve, and consequently adaptive capacity as a whole improves (Parry et al., 2007). Considering that climate change brings unpredictable changes, it calls for institutions that enhance the adaptive capacity of a society. In the latest IPCC report (Klein et al., 2014), it was concluded that effective governance and institutions for facilitating adaptation planning and implementation across multiple sectors within regions is by far the dominant adaptation opportunity and constraint.
This study aims to develop a framework for the assessment of crucial institutional preconditions that facilitate the implementation of adaptation measures to climate change. More specifically, our article focuses on the following two research questions: 1) how to identify institutional constraints for adaptive capacity to respond to climate change challenges; and 2) how to assess the feasibility of implementing adaptation measures from an institutional perspective. We applied our framework to the
Institutional context
85
agricultural sector in Flevoland. Flevoland is the most productive agricultural region in the Netherlands, and the agricultural sector is important for the economy of the province. Earlier we explored adaptation options for this province at farm and management level (Chapter 4) and now we investigate its institutional feasibility. 5.2 Frameworks to assess institutional factors influencing adaptation Institutions are the rules of the game in a society or, in other words, institutions are the humanly devised constraints that shape human interaction (North, 1991). Under North’s framework, institutions consist of both informal (customs, tradition, codes of conduct) and formal (laws, property rights) sets of rules, compliance procedures and moral and ethical behavioral norms designed to constrain individuals in the interest of maximizing the wealth or utility of the principals (North, 1991). Although North’s definition is probably the most cited one, it has also been criticized. In particular, other scholars have emphasized the potentially enabling properties of institutions for self-organization, besides constraining agents for principals (Arts et al., 2006; Giddens, 1981). From these definitions, the functions of institutions can be summarized as giving structure, building expectations, and setting both constraints and incentives for human interactions.
Many studies have focused on the adaptive capacity of institutions to cope with climate change. Recent literature on adaptation reveals different terms used to describe factors that may hinder implementation of adaptation from an institutional perspective (see review paper of Biesbroek et al. 2013). Termeer et al. (2012) use the term institutional weaknesses. De Bruin et al. (2009) assess institutional complexities, while Moser and Ekstrom (2010) and Biesbroek et al. (2011) speak about barriers to climate change adaptation. Gupta et al. (2010) focus on assessment of adaptive capacity of institutions and propose an assessment framework called the adaptation wheel. According to Gupta et al. (2010), institutional adaptive capacity includes characteristics of institutions that enable society to cope with climate change and the degree to which institutions allow and encourage actors to change these institutions to cope with climate change. Qualities of institutions that are crucial to enable climate change adaptation are: variety, learning capacity, room for autonomous change, leadership, resources and fair governance (Gupta et al., 2010). The first three were later labelled core qualities, while the last three were called supporting qualities by Termeer et al. (2012). The failures of institutions on any of the above-mentioned qualities are perceived as institutional weaknesses (Termeer et al., 2012). It seems that this institutional literature on climate adaptation exhibits a normative bias: the more institutions and the better they function, the higher the adaptive capacity. We acknowledge that less institutions can be beneficial as well, for example when they create barriers for innovation. Therefore we adhere to an analytical approach below that is agnostic to more or less institutions for climate adaptation ex ante.
For assessments of institutional preconditions in relation to climate change adaptation in agriculture, the definition and analysis of institutions by Theesfeld et al.
binnenwerk.indd 85 23-2-2016 21:55:11

Chapter 5
86
(2010) is – in our view – more analytical, specific and relevant. Institutions include mechanisms – such as rules on distribution of (financial) resources – that facilitate or hamper decision-making aiming at sustainable development by political actors. Further, institutional arrangements affect (positively or negatively) the implementation of rules by the authorities and the behaviour of farmers and other actors, while following the rules. Theesfeld et al. (2010) introduced an approach for ex-ante institutional analysis. They aimed to assess the institutional compatibility of specific policy options. This concept refers to the compatibility between policy options on the one hand and the respective institutional environment on the other. Based on this as an entry point, Theesfeld et al. (2010) developed the so-called Procedure for Institutional Compatibility Assessment (PICA) framework to assess the feasibility of policy options from an institutional perspective. The various institutional properties that potentially influence the implementation of policy options are called Crucial Institutional Aspects (CIAs). A detailed list of CIAs can be found in the report of Schleyer et al. (2007). An example of a constraining CIA is “contradictory policy instruments and rules” referring to a list of regulations and tools that are currently applied in the area and that could be contradictory to future policy options in question.
Here we prefer to use the term Crucial Institutional Precondition (CIP), since we want to stress that we selected and adapted CIAs from PICA in such a way that they are formulated as preconditions, both constraints and incentives, and can be rated and scored accordingly. CIPs include constraints and incentives in facilitating the implementation of respective adaptation measures. In this paper we use the term ‘institutional feasibility’ in the general assessment and when we focus on the institutional constraints specifically. Institutional feasibility is determined by institutional constraints and incentives. We define institutional constraints to climate change adaptation as conditions that emerge from an institutional setting and which reduce the likelihood of successful implementation of particular adaptation measures. The opposite holds for institutional incentives: these increase the chances of successful implementation.
While Gupta et al. (2010) refer to an abstract set of qualities of adaptive capacity of institutions, other authors are more specific about the institutional preconditions for adaptation options and therefore their frameworks could be used to link with and amend the PICA framework. De Bruin et al. (2009) used the term institutional complexity to assess the institutional environment for the implementation of various adaptation options to climate change. Elements of institutional complexity are: clashes between institutional rules (corresponding to the CIP of contradicting policy instruments and rules); the organizational consequences of the option; the cooperative relations or associations which are necessary for implementation (corresponding to the CIP of heterogeneity/fragmentation of actors’ interests); and the degree of renewal of the option in relation to existing arrangements (captured by the CIP of experiences with developing and introducing the measure). Information on institutional complexity can be used in combination with the ranking of an option, to develop an adaptation
Institutional context
87
strategy that both deals with the priority options and solves the institutional barriers that may emerge during implementation. However, the institutional complexity was not integrated in the Multi-Criteria Analysis by de Bruin et al. (2009) and was meant to be used in combination with other complexities (technical and social) to indicate their relative importance for the implementation of particular adaptation measures.
Among the barriers to adaptation occurring at different stages in the adaptation process (i.e. understanding, planning and managing) defined by Moser and Ekstrom (2010) we find barriers (e.g. sufficient resources, availability of information and experience with measures) that directly correspond to the CIPs inspired by the CIAs of Theesfeld et al. (2010). Based on this descriptive wealth of institutional preconditions for adaptation we decided to use CIPs that correspond with the existing literature on institutional feasibility for climate change adaptation.
There is added value in using an amended version of PICA to assess institutional constraints and incentives for implementation of adaptation measures of climate change. PICA captures a variety of aspects essential for the assessment of the institutional preconditions for adaptation to climate change, while some modification allows for a semi-quantitative assessment. A semi-quantitative assessment does not rely on quantitative data which are not available for specific measures in specific regions, while qualitative information from experts and stakeholders can be included. Quantifying this information afterwards allows a comparison of measures. The use of PICA in this study is depicted in Figure 5.1. Adjustments made to PICA are described in the following section. 5.3. Operationalization of PICA 5.3.1 Inventory of climate change risks, impacts and adaptation measures We started by making an inventory of main risks and impacts of climate change on arable farming in Flevoland and of the relevant adaptation measures. The inventory was mainly obtained from de Wit et al. (2009); Wolf et al. (2010) and Schaap et al. (2013), which are related studies within the AgriAdapt project of which this study was also part. In AgriAdapt quantitative studies and participatory methods were combined to assess climate change impact and adaptation (Wolf et al., 2012). However, other studies that assessed climate risks and adaptation for the Netherlands, i.e. Groot et al. (2006) and Bruin et al. (2009), have also been consulted. As to the crops, the focus was on seed potato, which is the main agricultural commodity, from an economic point of view, in Flevoland.
binnenwerk.indd 86 23-2-2016 21:55:11

Chapter 5
86
(2010) is – in our view – more analytical, specific and relevant. Institutions include mechanisms – such as rules on distribution of (financial) resources – that facilitate or hamper decision-making aiming at sustainable development by political actors. Further, institutional arrangements affect (positively or negatively) the implementation of rules by the authorities and the behaviour of farmers and other actors, while following the rules. Theesfeld et al. (2010) introduced an approach for ex-ante institutional analysis. They aimed to assess the institutional compatibility of specific policy options. This concept refers to the compatibility between policy options on the one hand and the respective institutional environment on the other. Based on this as an entry point, Theesfeld et al. (2010) developed the so-called Procedure for Institutional Compatibility Assessment (PICA) framework to assess the feasibility of policy options from an institutional perspective. The various institutional properties that potentially influence the implementation of policy options are called Crucial Institutional Aspects (CIAs). A detailed list of CIAs can be found in the report of Schleyer et al. (2007). An example of a constraining CIA is “contradictory policy instruments and rules” referring to a list of regulations and tools that are currently applied in the area and that could be contradictory to future policy options in question.
Here we prefer to use the term Crucial Institutional Precondition (CIP), since we want to stress that we selected and adapted CIAs from PICA in such a way that they are formulated as preconditions, both constraints and incentives, and can be rated and scored accordingly. CIPs include constraints and incentives in facilitating the implementation of respective adaptation measures. In this paper we use the term ‘institutional feasibility’ in the general assessment and when we focus on the institutional constraints specifically. Institutional feasibility is determined by institutional constraints and incentives. We define institutional constraints to climate change adaptation as conditions that emerge from an institutional setting and which reduce the likelihood of successful implementation of particular adaptation measures. The opposite holds for institutional incentives: these increase the chances of successful implementation.
While Gupta et al. (2010) refer to an abstract set of qualities of adaptive capacity of institutions, other authors are more specific about the institutional preconditions for adaptation options and therefore their frameworks could be used to link with and amend the PICA framework. De Bruin et al. (2009) used the term institutional complexity to assess the institutional environment for the implementation of various adaptation options to climate change. Elements of institutional complexity are: clashes between institutional rules (corresponding to the CIP of contradicting policy instruments and rules); the organizational consequences of the option; the cooperative relations or associations which are necessary for implementation (corresponding to the CIP of heterogeneity/fragmentation of actors’ interests); and the degree of renewal of the option in relation to existing arrangements (captured by the CIP of experiences with developing and introducing the measure). Information on institutional complexity can be used in combination with the ranking of an option, to develop an adaptation
Institutional context
87
strategy that both deals with the priority options and solves the institutional barriers that may emerge during implementation. However, the institutional complexity was not integrated in the Multi-Criteria Analysis by de Bruin et al. (2009) and was meant to be used in combination with other complexities (technical and social) to indicate their relative importance for the implementation of particular adaptation measures.
Among the barriers to adaptation occurring at different stages in the adaptation process (i.e. understanding, planning and managing) defined by Moser and Ekstrom (2010) we find barriers (e.g. sufficient resources, availability of information and experience with measures) that directly correspond to the CIPs inspired by the CIAs of Theesfeld et al. (2010). Based on this descriptive wealth of institutional preconditions for adaptation we decided to use CIPs that correspond with the existing literature on institutional feasibility for climate change adaptation.
There is added value in using an amended version of PICA to assess institutional constraints and incentives for implementation of adaptation measures of climate change. PICA captures a variety of aspects essential for the assessment of the institutional preconditions for adaptation to climate change, while some modification allows for a semi-quantitative assessment. A semi-quantitative assessment does not rely on quantitative data which are not available for specific measures in specific regions, while qualitative information from experts and stakeholders can be included. Quantifying this information afterwards allows a comparison of measures. The use of PICA in this study is depicted in Figure 5.1. Adjustments made to PICA are described in the following section. 5.3. Operationalization of PICA 5.3.1 Inventory of climate change risks, impacts and adaptation measures We started by making an inventory of main risks and impacts of climate change on arable farming in Flevoland and of the relevant adaptation measures. The inventory was mainly obtained from de Wit et al. (2009); Wolf et al. (2010) and Schaap et al. (2013), which are related studies within the AgriAdapt project of which this study was also part. In AgriAdapt quantitative studies and participatory methods were combined to assess climate change impact and adaptation (Wolf et al., 2012). However, other studies that assessed climate risks and adaptation for the Netherlands, i.e. Groot et al. (2006) and Bruin et al. (2009), have also been consulted. As to the crops, the focus was on seed potato, which is the main agricultural commodity, from an economic point of view, in Flevoland.
binnenwerk.indd 87 23-2-2016 21:55:11

Chapter 5
88
Figure 5.1 – Research framework based on adjustments to PICA. All steps were performed by the research team, except for ranking of CIPs, which was performed by experts. Arrows between plain boxes refer to the sequence of steps. Grey boxes refer to data sources. Arrows from grey boxes refer to direct input. Dashed arrows refer to supportive information.
Institutional context
89
5.3.2 Typology and selection of adaptation measures Following the inventory, we made a typology of adaptation measures. Besides the classification of adaptation measures based on the type of risks and impacts, the inventory included adaptation measures for implementation at different levels: crop, farm and regional/sectoral level. Adaptation measures at the crop level are specifically related to options for maintaining yields and quality of production of a specific crop. Farm level measures operate across the entire farm and take into account how changes in production may impact the income of farmers. Measures at regional/sectoral level have a broader context. They address general problems in the region as well as the national policy agenda on climate change adaptation.
We also identified the degree of institutional relevance for each adaptation measure by the number of actors at different levels (i.e. crop, farm, region) involved in the implementation of the measure. The lower the level of implementation of the measure, the fewer actors with different viewpoints and institutional aspects are potentially involved. The measures at crop and farm level mainly involve farmers as the dominant actors. Implementation of adaptation measures at the regional/sectoral level involves a number of actors and therefore more institutional incentives and constraints can potentially arise. The degree of interaction between actors is also higher at the regional/sectoral level compared to the farm and crop level.
For illustration of our framework we selected adaptation measures with relatively high institutional relevance. 5.3.3 Identification of CIPs We modified PICA with respect to the selection of CIPs which potentially influence implementation of adaptation measures. First, we assigned relevant CIAs from the original PICA library (Schleyer et al., 2007) to the selected set of adaptation measures. We modified and added new CIPs to the PICA library of CIAs based on a literature review (e.g. Gupta et al., 2010; Bergsma et al., 2012; Biesbroek et al. 2011; Termeer et al., 2012). Next, the selected CIPs (from the PICA list and the literature) were checked for their relevance with key stakeholders during workshops. As a result of these steps, we obtained a final list of CIPs to be used to assess the institutional feasibility of adaptation measures. During the process of modifying the PICA list of CIAs, we also assigned two types of indicators to each CIP: quantitative and qualitative (Table 5.1). The aim of the indicators was to explain the meaning of each CIP to the experts we interviewed and to allow for a semi-quantitative assessment of the feasibility of implementation of adaptation measures from an institutional perspective.
Chapter 5
88
Figure 5.1 – Research framework based on adjustments to PICA. All steps were performed by the research team, except for ranking of CIPs, which was performed by experts. Arrows between plain boxes refer to the sequence of steps. Grey boxes refer to data sources. Arrows from grey boxes refer to direct input. Dashed arrows refer to supportive information.
binnenwerk.indd 88 23-2-2016 21:55:15

Chapter 5
88
Figure 5.1 – Research framework based on adjustments to PICA. All steps were performed by the research team, except for ranking of CIPs, which was performed by experts. Arrows between plain boxes refer to the sequence of steps. Grey boxes refer to data sources. Arrows from grey boxes refer to direct input. Dashed arrows refer to supportive information.
Institutional context
89
5.3.2 Typology and selection of adaptation measures Following the inventory, we made a typology of adaptation measures. Besides the classification of adaptation measures based on the type of risks and impacts, the inventory included adaptation measures for implementation at different levels: crop, farm and regional/sectoral level. Adaptation measures at the crop level are specifically related to options for maintaining yields and quality of production of a specific crop. Farm level measures operate across the entire farm and take into account how changes in production may impact the income of farmers. Measures at regional/sectoral level have a broader context. They address general problems in the region as well as the national policy agenda on climate change adaptation.
We also identified the degree of institutional relevance for each adaptation measure by the number of actors at different levels (i.e. crop, farm, region) involved in the implementation of the measure. The lower the level of implementation of the measure, the fewer actors with different viewpoints and institutional aspects are potentially involved. The measures at crop and farm level mainly involve farmers as the dominant actors. Implementation of adaptation measures at the regional/sectoral level involves a number of actors and therefore more institutional incentives and constraints can potentially arise. The degree of interaction between actors is also higher at the regional/sectoral level compared to the farm and crop level.
For illustration of our framework we selected adaptation measures with relatively high institutional relevance. 5.3.3 Identification of CIPs We modified PICA with respect to the selection of CIPs which potentially influence implementation of adaptation measures. First, we assigned relevant CIAs from the original PICA library (Schleyer et al., 2007) to the selected set of adaptation measures. We modified and added new CIPs to the PICA library of CIAs based on a literature review (e.g. Gupta et al., 2010; Bergsma et al., 2012; Biesbroek et al. 2011; Termeer et al., 2012). Next, the selected CIPs (from the PICA list and the literature) were checked for their relevance with key stakeholders during workshops. As a result of these steps, we obtained a final list of CIPs to be used to assess the institutional feasibility of adaptation measures. During the process of modifying the PICA list of CIAs, we also assigned two types of indicators to each CIP: quantitative and qualitative (Table 5.1). The aim of the indicators was to explain the meaning of each CIP to the experts we interviewed and to allow for a semi-quantitative assessment of the feasibility of implementation of adaptation measures from an institutional perspective.
Chapter 5
88
Figure 5.1 – Research framework based on adjustments to PICA. All steps were performed by the research team, except for ranking of CIPs, which was performed by experts. Arrows between plain boxes refer to the sequence of steps. Grey boxes refer to data sources. Arrows from grey boxes refer to direct input. Dashed arrows refer to supportive information.
binnenwerk.indd 89 23-2-2016 21:55:15

Chapter 5
90
5.3.4 Data collection and analysis We used workshops and interviews as primary sources of information for our research. In total we organized three workshops (held between November 2011 – January 2012) with a total number of 48 participants. We organized one workshop in the study area, where we invited stakeholders from the region (n=9), and two at Wageningen University, which were attended by experts in policy analysis (Forest and Nature Conservation Policy group, n=12) and agricultural systems (Plant Production Systems group, n=27). The workshop participants provided us with quantitative information on the relative importance of the CIPs for each adaptation measure (see Section 5.3.5). Discussions during workshops yielded extra insights into the nature of institutional incentives and constraints to adaptation to climate change in Flevoland.
To obtain a better understanding of institutional preconditions for adaptation measures to climate change in agriculture in Flevoland, we had several follow-up discussions with workshop participants. Additionally, we conducted semi-structured interviews with experts in fields closely related to the adaptation measures we assessed. Interviews with experts (n=9) also provided us with quantitative information on the relative importance of the CIPs for each adaptation measure. During the interviews and workshops experts also provided detailed qualitative information on the CIPs and indicators for each adaptation measure. This supported scoring of the CIPs in terms of the extent to which they are currently constraining each adaptation measure (see Section 5.3.6).
We verified the information from the workshops and interviews with findings from the institutional literature on climate change adaptation in the Netherlands (e.g. Bergsma et al., 2012; Biesbroek et al., 2011; Groot et al., 2006; Gupta et al., 2010; Termeer at al., 2012). Finally, we discussed the results and the draft of this manuscript with a secretary of the provincial board of farmers’ organizations and a policy maker on spatial planning and water management from the Dutch Ministry of Infrastructure and Environment. These two experts provided their comments and judgment on the method used and the scores assigned to the CIPs. 5.3.5 Ranking CIPs The importance of CIPs per adaptation measure was based on ranking using direct ranks R1 (i.e. whether a CIP is important for the implementation of an adaptation measure) and percentage of relative importance R2 (i.e. how important is the CIP). During the workshops and interviews we asked the participants to rank each CIP in the range from the most important (R1 = 1) to the least important (R1 = 7) for each adaptation measure. In order to check the consistency of the answers, the participants were also asked to assign a percentage indicating to what extent a certain CIP is important relative to the others.
Institutional context
91
We summarized the results on ranks (R1) and percentage of relative importance (R2) from the workshops and interviews by calculating the average of R1 and R2 per CIP from the respondents’ answers. We also calculated the frequency of each CIP being ranked the highest (i.e.,1) to check if the result of the three highest ranked CIPs was consistent with the result from the procedure using the average of R1 and R2 for each CIP.
Based on the ranking information, we identified which CIPs are considered to be the three most important for each adaptation measure. The most important CIPs (lowest value of R1) are not necessarily constraining the implementation of particular adaptation measures in the current institutional setting in Flevoland. 5.3.6 Scoring CIPs To assess to what extent a certain CIP is currently constraining the implementation of the respective adaptation measures; we analyzed qualitative information from workshops and interviews, and checked our findings with literature. Similar to the semi-quantitative analysis in Yohe and Tol (2002), we assigned scores to each CIP through the interpretation of the qualitative information from workshops and interviews. These scores were checked by the secretary of the provincial board of farmers’ organizations and a policy-maker on spatial planning and water management from the Dutch Ministry of Infrastructure and Environment. Consequently, we finalized the scores. The scores of CIPs (S) are subjective values ranging from 0 (Low) to 5 (High) according to the perceived degree to which CIPs constrain the implementation of a specific adaptation measure. 5.3.7 Institutional feasibility An assessment of the institutional feasibility of each adaptation measure was performed in three steps.
We first assessed the Constraint-Ability of each of the seven CIPs as to the implementation of each adaptation measure. Let the average of the percentage of relative importance of ranks be denoted by R2(j) and Scores of CIPs be denoted by S(j), and j = 1, …,7 referring to the CIPs. The Constraint-Ability CA(j) is the multiplication of R2(j) and S(j) (Equation 5.1). We normalized the outcome values by multiplying ranks and scores by 0.01. The Constraint-Ability of a CIP is high, if the value is low:
CA(j) = R2(j)*S(j)*0.01 (equation 5.1)
Next, we assumed that a CIP with the maximum value for Constraint-Ability is the
most constraining one for the implementation of a particular adaptation measure, i.e. this CIP is an Institutional Constraint (IC), with the value:
binnenwerk.indd 90 23-2-2016 21:55:15

Chapter 5
90
5.3.4 Data collection and analysis We used workshops and interviews as primary sources of information for our research. In total we organized three workshops (held between November 2011 – January 2012) with a total number of 48 participants. We organized one workshop in the study area, where we invited stakeholders from the region (n=9), and two at Wageningen University, which were attended by experts in policy analysis (Forest and Nature Conservation Policy group, n=12) and agricultural systems (Plant Production Systems group, n=27). The workshop participants provided us with quantitative information on the relative importance of the CIPs for each adaptation measure (see Section 5.3.5). Discussions during workshops yielded extra insights into the nature of institutional incentives and constraints to adaptation to climate change in Flevoland.
To obtain a better understanding of institutional preconditions for adaptation measures to climate change in agriculture in Flevoland, we had several follow-up discussions with workshop participants. Additionally, we conducted semi-structured interviews with experts in fields closely related to the adaptation measures we assessed. Interviews with experts (n=9) also provided us with quantitative information on the relative importance of the CIPs for each adaptation measure. During the interviews and workshops experts also provided detailed qualitative information on the CIPs and indicators for each adaptation measure. This supported scoring of the CIPs in terms of the extent to which they are currently constraining each adaptation measure (see Section 5.3.6).
We verified the information from the workshops and interviews with findings from the institutional literature on climate change adaptation in the Netherlands (e.g. Bergsma et al., 2012; Biesbroek et al., 2011; Groot et al., 2006; Gupta et al., 2010; Termeer at al., 2012). Finally, we discussed the results and the draft of this manuscript with a secretary of the provincial board of farmers’ organizations and a policy maker on spatial planning and water management from the Dutch Ministry of Infrastructure and Environment. These two experts provided their comments and judgment on the method used and the scores assigned to the CIPs. 5.3.5 Ranking CIPs The importance of CIPs per adaptation measure was based on ranking using direct ranks R1 (i.e. whether a CIP is important for the implementation of an adaptation measure) and percentage of relative importance R2 (i.e. how important is the CIP). During the workshops and interviews we asked the participants to rank each CIP in the range from the most important (R1 = 1) to the least important (R1 = 7) for each adaptation measure. In order to check the consistency of the answers, the participants were also asked to assign a percentage indicating to what extent a certain CIP is important relative to the others.
Institutional context
91
We summarized the results on ranks (R1) and percentage of relative importance (R2) from the workshops and interviews by calculating the average of R1 and R2 per CIP from the respondents’ answers. We also calculated the frequency of each CIP being ranked the highest (i.e.,1) to check if the result of the three highest ranked CIPs was consistent with the result from the procedure using the average of R1 and R2 for each CIP.
Based on the ranking information, we identified which CIPs are considered to be the three most important for each adaptation measure. The most important CIPs (lowest value of R1) are not necessarily constraining the implementation of particular adaptation measures in the current institutional setting in Flevoland. 5.3.6 Scoring CIPs To assess to what extent a certain CIP is currently constraining the implementation of the respective adaptation measures; we analyzed qualitative information from workshops and interviews, and checked our findings with literature. Similar to the semi-quantitative analysis in Yohe and Tol (2002), we assigned scores to each CIP through the interpretation of the qualitative information from workshops and interviews. These scores were checked by the secretary of the provincial board of farmers’ organizations and a policy-maker on spatial planning and water management from the Dutch Ministry of Infrastructure and Environment. Consequently, we finalized the scores. The scores of CIPs (S) are subjective values ranging from 0 (Low) to 5 (High) according to the perceived degree to which CIPs constrain the implementation of a specific adaptation measure. 5.3.7 Institutional feasibility An assessment of the institutional feasibility of each adaptation measure was performed in three steps.
We first assessed the Constraint-Ability of each of the seven CIPs as to the implementation of each adaptation measure. Let the average of the percentage of relative importance of ranks be denoted by R2(j) and Scores of CIPs be denoted by S(j), and j = 1, …,7 referring to the CIPs. The Constraint-Ability CA(j) is the multiplication of R2(j) and S(j) (Equation 5.1). We normalized the outcome values by multiplying ranks and scores by 0.01. The Constraint-Ability of a CIP is high, if the value is low:
CA(j) = R2(j)*S(j)*0.01 (equation 5.1)
Next, we assumed that a CIP with the maximum value for Constraint-Ability is the
most constraining one for the implementation of a particular adaptation measure, i.e. this CIP is an Institutional Constraint (IC), with the value:
binnenwerk.indd 91 23-2-2016 21:55:16
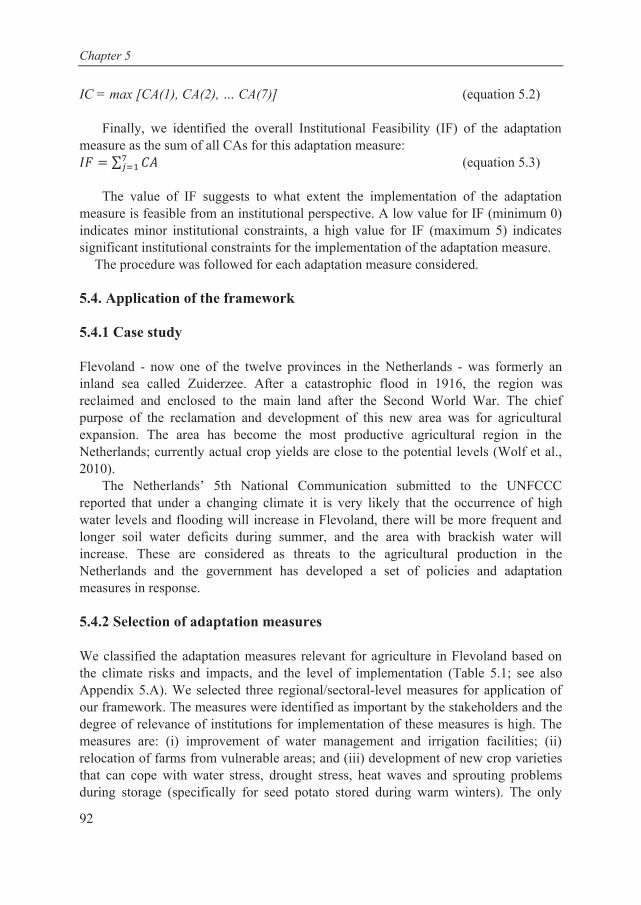
Chapter 5
92
IC = max [CA(1), CA(2), … CA(7)] (equation 5.2) Finally, we identified the overall Institutional Feasibility (IF) of the adaptation
measure as the sum of all CAs for this adaptation measure: (equation 5.3)
The value of IF suggests to what extent the implementation of the adaptation
measure is feasible from an institutional perspective. A low value for IF (minimum 0) indicates minor institutional constraints, a high value for IF (maximum 5) indicates significant institutional constraints for the implementation of the adaptation measure. The procedure was followed for each adaptation measure considered. 5.4. Application of the framework 5.4.1 Case study Flevoland - now one of the twelve provinces in the Netherlands - was formerly an inland sea called Zuiderzee. After a catastrophic flood in 1916, the region was reclaimed and enclosed to the main land after the Second World War. The chief purpose of the reclamation and development of this new area was for agricultural expansion. The area has become the most productive agricultural region in the Netherlands; currently actual crop yields are close to the potential levels (Wolf et al., 2010).
The Netherlands’ 5th National Communication submitted to the UNFCCC reported that under a changing climate it is very likely that the occurrence of high water levels and flooding will increase in Flevoland, there will be more frequent and longer soil water deficits during summer, and the area with brackish water will increase. These are considered as threats to the agricultural production in the Netherlands and the government has developed a set of policies and adaptation measures in response. 5.4.2 Selection of adaptation measures We classified the adaptation measures relevant for agriculture in Flevoland based on the climate risks and impacts, and the level of implementation (Table 5.1; see also Appendix 5.A). We selected three regional/sectoral-level measures for application of our framework. The measures were identified as important by the stakeholders and the degree of relevance of institutions for implementation of these measures is high. The measures are: (i) improvement of water management and irrigation facilities; (ii) relocation of farms from vulnerable areas; and (iii) development of new crop varieties that can cope with water stress, drought stress, heat waves and sprouting problems during storage (specifically for seed potato stored during warm winters). The only
Institutional context
93
other adaptation measure for which it has been suggested that institutions were very important (Appendix 5.A) was water storage on farmland. We did not assess this measure separately, as it is related to measures (i) and (ii). Table 5.1 – Risks of climate change on agriculture in Flevoland and relevant adaptation measures.
No Climate change risk Adaptation measures 1 Changes in the precipitation Improvement of water management and irrigation facilities a. Changes in the duration and intensity of
wet and dry periods Relocation of farms from the vulnerable areas
b. High intensity of rainfall in spring and
autumn Adjustment of crop rotation schemes and timing of planting dates and harvesting dates
Increase ability of surface drainage Increase permeability of sub-soil Water storage on farmland Choice of crop variety and genotype that can cope with increased water
stress Develop new varieties which can cope with increased water stress GPS steering to prevent damage to soil structure Automatic inflation correction of the machinery tyres c. Reduced rainfall with high evaporation
in summer Soil moisture conservation practices such as conservation tillage
Water storage on farmland during high rainfall periods 2 Warm and wet conditions during summer Choice of crop variety and genotype Optimise nutrient management Develop new varieties which are resistant to the respective pests and
diseases Chemical protection UV-light protection 3 Heat wave Plant in wider ridges Plant and harvest earlier Drip irrigation Optimise crop cover Develop heat resistant varieties 4 Warm winter Develop new varieties which can cope with the sprouting problem Air conditioning Sprouting control with chemicals 5 Sea level rise Relocation of farms from the vulnerable areas Develop new crop varieties that can cope with high salinity Insurance 6 Gradual climate change Farm diversification Farm size enlargement Farm intensification Changes in specialization
5.4.3 CIPs and indicators In Table 5.2 we present the CIPs used in our framework and the quantitative and qualitative indicators required to characterize each of them. Both indicators were used in ranking and scoring the indicator. If quantitative data were available, these were used, but to get a good impression of the constraint-ability of a CIP, qualitative information is needed. The qualitative indicators also helped to explain the meaning of a CIP.
binnenwerk.indd 92 23-2-2016 21:55:16

Chapter 5
92
IC = max [CA(1), CA(2), … CA(7)] (equation 5.2) Finally, we identified the overall Institutional Feasibility (IF) of the adaptation
measure as the sum of all CAs for this adaptation measure: (equation 5.3)
The value of IF suggests to what extent the implementation of the adaptation
measure is feasible from an institutional perspective. A low value for IF (minimum 0) indicates minor institutional constraints, a high value for IF (maximum 5) indicates significant institutional constraints for the implementation of the adaptation measure. The procedure was followed for each adaptation measure considered. 5.4. Application of the framework 5.4.1 Case study Flevoland - now one of the twelve provinces in the Netherlands - was formerly an inland sea called Zuiderzee. After a catastrophic flood in 1916, the region was reclaimed and enclosed to the main land after the Second World War. The chief purpose of the reclamation and development of this new area was for agricultural expansion. The area has become the most productive agricultural region in the Netherlands; currently actual crop yields are close to the potential levels (Wolf et al., 2010).
The Netherlands’ 5th National Communication submitted to the UNFCCC reported that under a changing climate it is very likely that the occurrence of high water levels and flooding will increase in Flevoland, there will be more frequent and longer soil water deficits during summer, and the area with brackish water will increase. These are considered as threats to the agricultural production in the Netherlands and the government has developed a set of policies and adaptation measures in response. 5.4.2 Selection of adaptation measures We classified the adaptation measures relevant for agriculture in Flevoland based on the climate risks and impacts, and the level of implementation (Table 5.1; see also Appendix 5.A). We selected three regional/sectoral-level measures for application of our framework. The measures were identified as important by the stakeholders and the degree of relevance of institutions for implementation of these measures is high. The measures are: (i) improvement of water management and irrigation facilities; (ii) relocation of farms from vulnerable areas; and (iii) development of new crop varieties that can cope with water stress, drought stress, heat waves and sprouting problems during storage (specifically for seed potato stored during warm winters). The only
Institutional context
93
other adaptation measure for which it has been suggested that institutions were very important (Appendix 5.A) was water storage on farmland. We did not assess this measure separately, as it is related to measures (i) and (ii). Table 5.1 – Risks of climate change on agriculture in Flevoland and relevant adaptation measures.
No Climate change risk Adaptation measures 1 Changes in the precipitation Improvement of water management and irrigation facilities a. Changes in the duration and intensity of
wet and dry periods Relocation of farms from the vulnerable areas
b. High intensity of rainfall in spring and
autumn Adjustment of crop rotation schemes and timing of planting dates and harvesting dates
Increase ability of surface drainage Increase permeability of sub-soil Water storage on farmland Choice of crop variety and genotype that can cope with increased water
stress Develop new varieties which can cope with increased water stress GPS steering to prevent damage to soil structure Automatic inflation correction of the machinery tyres c. Reduced rainfall with high evaporation
in summer Soil moisture conservation practices such as conservation tillage
Water storage on farmland during high rainfall periods 2 Warm and wet conditions during summer Choice of crop variety and genotype Optimise nutrient management Develop new varieties which are resistant to the respective pests and
diseases Chemical protection UV-light protection 3 Heat wave Plant in wider ridges Plant and harvest earlier Drip irrigation Optimise crop cover Develop heat resistant varieties 4 Warm winter Develop new varieties which can cope with the sprouting problem Air conditioning Sprouting control with chemicals 5 Sea level rise Relocation of farms from the vulnerable areas Develop new crop varieties that can cope with high salinity Insurance 6 Gradual climate change Farm diversification Farm size enlargement Farm intensification Changes in specialization
5.4.3 CIPs and indicators In Table 5.2 we present the CIPs used in our framework and the quantitative and qualitative indicators required to characterize each of them. Both indicators were used in ranking and scoring the indicator. If quantitative data were available, these were used, but to get a good impression of the constraint-ability of a CIP, qualitative information is needed. The qualitative indicators also helped to explain the meaning of a CIP.
binnenwerk.indd 93 23-2-2016 21:55:16

Chapter 5
94
Table 5.2 – Selected CIPs and their indicators. CIP
Indicators Quantitative Qualitative
1. Administrative levels involved in the implementation of the measure
Number of administrative levels involved in the implementation of the measure
1. Hypothesis about positive/negative effect of having more/less levels (e.g. nested or multi-level governance)
2. Degree of coordination/communication 3. Clear formal task distribution and/or subsidiarity?
2.Contradictory policy instruments and rules
1. Number of relevant instruments in this field
2. Ratio (%) of contradictory policy instruments and rules to the total number of policy instruments and rules
1. What are the contradictory policy instruments and rules?
2. What is the effect of contradiction? 3. Which instrument has better/stronger political, legal
and financial backing?
3.Availability of resources (e.g. financial, personnel, etc)
Share of budget for implementation of the measure (absolute and relative) - should be enough to implement the measure and be coming from the responsible level
1. How large is the share of budget for the implementation of a particular measure a) compared to the share for other programs? b) relative to the actual cost for implementation of the respective measure?
2. What is the annual change in the share of budget and developments over the past years?
3. Is the target met annually? 4.Political continuity Number of changes in the board within
the last 10 years (at the responsible level: province or water board)
1. Even if the board changes, is the composition of political power/coalitions also changed?
2. Do the changes influence the implementation of strategic plans?
3. Does the change in board/cabinet cause changes in financial policy and budget allocation?
5.Heterogeneity/fragmentation of actors’ interests
1. Number of related actors 2. Number of farmers (incl.
information about his/her farm size and specialization)
3. Number of private companies (e.g. water company, recreation)
4. Number of nature protection organizations
1. Main concerns of farmers from different groups (differing in farm size, specialization, diversification and intensity)
2. Main concerns of other actors such as water board or industry
3. Main/prioritized programs of the local government 4. Hypothesis that high heterogeneity can create
constraints in implementing the adaptation measure. 6.Experiences with developing and introducing the measure
Inventory of previous/existing programs related to the measure
1. Improvement of water management and irrigation facilities a. What are main programs for improvement in
water management and irrigation facilities? b. What are the highlighted discussions from
previous programs in water management and irrigation facilities?
2. Relocation of farms a. Has there been any relocation of farms in the last
10 years? b. What were the highlighted concerns during the
relocation? c. Any conflicts/issues?
3. Development of new varieties a. What are the main problems in the development
of new varieties? b. What are the highlighted issues?
7.Availability of information 1. Number of written agricultural specialized press outlets (distinguish between scientific and outreach/practice oriented journals)
2. Pattern/network of information dissemination
3. How many of the publications (%) are dealing with climate change in a wider sense?
1. How many related publications per month? 2. What is the main information they deliver? 3. Are the monthly/seasonal weather forecast and climate
change scenarios of KNMI distributed/accessible to farmers?
4. Do farmers use this information?
Institutional context
95
5.4.4 Stakeholder analysis and interviewed experts The experts we interviewed were identified according to their potential roles in the implementation of the adaptation measures (Table 5.3).
For assessment of institutional feasibility of the first measure (improvement of water management and irrigation facilities), we interviewed five experts in the water sector in Flevoland: one from Zuiderzeeland water board; three from farmers’ organizations; and one from the division for Sustainability, Environment and Water of the provincial government in Flevoland. Three of these five respondents were also interviewed for the second measure (relocation of farms), because the issue of relocation is closely related to the management of water and facilities for irrigation in the region, and the same stakeholder groups are involved, although in a different order of priority. Table 5.3 – Overview of the stakeholder groups in Flevoland related to the implementation of the adaptation measures.
Adaptation measures Related stakeholder groups Involvement in the implementation of the measure1
Improvement of water management and irrigation facilities
Local water board (Zuiderzeeland) +++ Farmers and farmers’ organizations (LTO)
+++
Union of water boards ++ Municipalities ++ Central and Provincial government + Nature protection organizations + Domestic (household) water users + Companies, industries, other water users +
Relocation of farms Farmers and farmers’ organizations (LTO)
+++
Central and Provincial government +++ Domestic (household) water users +++ Municipalities ++ Nature protection organizations + Development of new crop varieties Breeding companies +++ Farmers and farmers’ organizations
(LTO) +++
University, research centres, other academic/scientific pool
++
Municipalities + Provincial government + Central government + 1 More + indicate higher involvement in the implementation of the measure, as assessed by the researchers
The interviews for the third measure (development of new crop varieties) were
conducted with two plant breeding experts in the Plant Sciences Department of
binnenwerk.indd 94 23-2-2016 21:55:17

Chapter 5
94
Table 5.2 – Selected CIPs and their indicators. CIP
Indicators Quantitative Qualitative
1. Administrative levels involved in the implementation of the measure
Number of administrative levels involved in the implementation of the measure
1. Hypothesis about positive/negative effect of having more/less levels (e.g. nested or multi-level governance)
2. Degree of coordination/communication 3. Clear formal task distribution and/or subsidiarity?
2.Contradictory policy instruments and rules
1. Number of relevant instruments in this field
2. Ratio (%) of contradictory policy instruments and rules to the total number of policy instruments and rules
1. What are the contradictory policy instruments and rules?
2. What is the effect of contradiction? 3. Which instrument has better/stronger political, legal
and financial backing?
3.Availability of resources (e.g. financial, personnel, etc)
Share of budget for implementation of the measure (absolute and relative) - should be enough to implement the measure and be coming from the responsible level
1. How large is the share of budget for the implementation of a particular measure a) compared to the share for other programs? b) relative to the actual cost for implementation of the respective measure?
2. What is the annual change in the share of budget and developments over the past years?
3. Is the target met annually? 4.Political continuity Number of changes in the board within
the last 10 years (at the responsible level: province or water board)
1. Even if the board changes, is the composition of political power/coalitions also changed?
2. Do the changes influence the implementation of strategic plans?
3. Does the change in board/cabinet cause changes in financial policy and budget allocation?
5.Heterogeneity/fragmentation of actors’ interests
1. Number of related actors 2. Number of farmers (incl.
information about his/her farm size and specialization)
3. Number of private companies (e.g. water company, recreation)
4. Number of nature protection organizations
1. Main concerns of farmers from different groups (differing in farm size, specialization, diversification and intensity)
2. Main concerns of other actors such as water board or industry
3. Main/prioritized programs of the local government 4. Hypothesis that high heterogeneity can create
constraints in implementing the adaptation measure. 6.Experiences with developing and introducing the measure
Inventory of previous/existing programs related to the measure
1. Improvement of water management and irrigation facilities a. What are main programs for improvement in
water management and irrigation facilities? b. What are the highlighted discussions from
previous programs in water management and irrigation facilities?
2. Relocation of farms a. Has there been any relocation of farms in the last
10 years? b. What were the highlighted concerns during the
relocation? c. Any conflicts/issues?
3. Development of new varieties a. What are the main problems in the development
of new varieties? b. What are the highlighted issues?
7.Availability of information 1. Number of written agricultural specialized press outlets (distinguish between scientific and outreach/practice oriented journals)
2. Pattern/network of information dissemination
3. How many of the publications (%) are dealing with climate change in a wider sense?
1. How many related publications per month? 2. What is the main information they deliver? 3. Are the monthly/seasonal weather forecast and climate
change scenarios of KNMI distributed/accessible to farmers?
4. Do farmers use this information?
Institutional context
95
5.4.4 Stakeholder analysis and interviewed experts The experts we interviewed were identified according to their potential roles in the implementation of the adaptation measures (Table 5.3).
For assessment of institutional feasibility of the first measure (improvement of water management and irrigation facilities), we interviewed five experts in the water sector in Flevoland: one from Zuiderzeeland water board; three from farmers’ organizations; and one from the division for Sustainability, Environment and Water of the provincial government in Flevoland. Three of these five respondents were also interviewed for the second measure (relocation of farms), because the issue of relocation is closely related to the management of water and facilities for irrigation in the region, and the same stakeholder groups are involved, although in a different order of priority. Table 5.3 – Overview of the stakeholder groups in Flevoland related to the implementation of the adaptation measures.
Adaptation measures Related stakeholder groups Involvement in the implementation of the measure1
Improvement of water management and irrigation facilities
Local water board (Zuiderzeeland) +++ Farmers and farmers’ organizations (LTO)
+++
Union of water boards ++ Municipalities ++ Central and Provincial government + Nature protection organizations + Domestic (household) water users + Companies, industries, other water users +
Relocation of farms Farmers and farmers’ organizations (LTO)
+++
Central and Provincial government +++ Domestic (household) water users +++ Municipalities ++ Nature protection organizations + Development of new crop varieties Breeding companies +++ Farmers and farmers’ organizations
(LTO) +++
University, research centres, other academic/scientific pool
++
Municipalities + Provincial government + Central government + 1 More + indicate higher involvement in the implementation of the measure, as assessed by the researchers
The interviews for the third measure (development of new crop varieties) were
conducted with two plant breeding experts in the Plant Sciences Department of
binnenwerk.indd 95 23-2-2016 21:55:17

Chapter 5
96
Wageningen University and one farmer in Flevoland who has been collaborating with a breeding company to conduct research on breeding new crop varieties of seed potato. In addition, we also consulted two breeding experts from two potato breeding companies in the Netherlands on the issue of development of new crop varieties. 5.4.5 Ranking of CIPS We identified which CIPs are considered as the three most important for each adaptation measure (Table 5.4). The most important CIPs for the first two measures (improvement of water management and irrigation facilities and relocation of farms) were similar: heterogeneity of actors’ interests, availability of resources, and administration levels involved in the implementation of the measure. For the third measure (development of new varieties), the market was perceived as the main driver, which was not included as a CIP in our framework. Among the institutional aspects listed in the framework, the three most important CIPs were: availability of resources, experience with developing and introducing the measure and availability of information. 5.4.6 Scoring of CIPs and institutional feasibility Table 5.4 summarizes the results on constraint-ability, institutional constraints and institutional feasibility of each measure. Details on the derivation of scores based on qualitative information from workshops, interviews and findings from a literature review are provided in Appendix 5.B. The adaptation measure ‘improvement of water management and irrigation facilities’ appeared to be the most feasible to implement in Flevoland from an institutional perspective. The value of institutional feasibility for this measure pointed at fewer institutional constraints compared to the other two measures. Relocation of farms appeared the most difficult to implement, since its value for institutional feasibility indicated potentially more institutional constraints. Different CIPs constrained the implementation of each measure. For improvement of water management, no substantial institutional constraints were named by participants of the workshops and interviews or were found in the literature (Table 5.5 and Appendix 5.B). The most constraining CIP for this measure appeared to be heterogeneity of actors’ interests (IC=0.75). Relocation of farms appears to be mostly constrained by heterogeneity of actors’ interests (IC=1.38). The issue of relocation was described by experts and in literature as “very problematic”, especially due to the large number of potentially-conflicting parties involved, debates around financial compensation and, no official policy on relocation.
Institutional context
97
T
able
5.4
– R
anki
ng o
f CIP
s for
ada
ptat
ion
mea
sure
s to
clim
ate
chan
ge a
t reg
iona
l lev
el.
CIA
s A
dapt
atio
n m
easu
res
retaw fo tne
mevorpmI
m
anag
emen
t1 R
eloc
atio
n of
farm
s2 D
evel
opm
ent o
f new
var
ietie
s3
R gniknaR
1
(1-7
) R
elat
ive
impo
rtanc
e R
2 (%
)4
Ran
king
R1
(1-7
) R
elat
ive
impo
rtanc
e R
2 (%
)4
Ran
king
R1
(1-7
) R
elat
ive
impo
rtanc
e R
2 (%
)4 1.
Adm
inis
trativ
e le
vels
invo
lved
in th
e im
plem
enta
tion
of th
e m
easu
re
2 15
.0
3 15
.0
7 10
.0
2. C
ontra
dict
ory
polic
y in
stru
men
ts a
nd ru
les
4 18
.0
4 2.
5 6
11.0
3. A
vaila
bilit
y of
reso
urce
s 1
25.0
2
27.5
1
22.0
4. P
oliti
cal c
ontin
uity
5
15.0
5
12.5
4
8.0
5. H
eter
ogen
eity
/frag
men
tatio
n of
act
ors’
inte
rest
s 3
25.0
1
27.5
5
15.0
6. E
xper
ienc
es w
ith d
evel
opin
g an
d in
trodu
cing
the
mea
sure
6
2.0
6 12
.5
3 14
.0
7. A
vaila
bilit
y of
info
rmat
ion
7 0.
0 7
2.5
2 20
.0
1 num
ber o
f int
ervi
ewee
s/nu
mbe
r of r
espo
nden
ts: 2
5 pe
rson
s/25
per
sons
2 n
umbe
r of i
nter
view
ees/
num
ber o
f res
pond
ents
: 5 p
erso
ns/ 3
per
sons
(few
peo
ple
cons
ider
them
selv
es a
s exp
erts
in th
is is
sue)
3 n
umbe
r of i
nter
view
ees/
num
ber o
f res
pond
ents
: 27
pers
ons/
27 p
erso
ns
4 sum
equ
als t
o 10
0%
binnenwerk.indd 96 23-2-2016 21:55:19
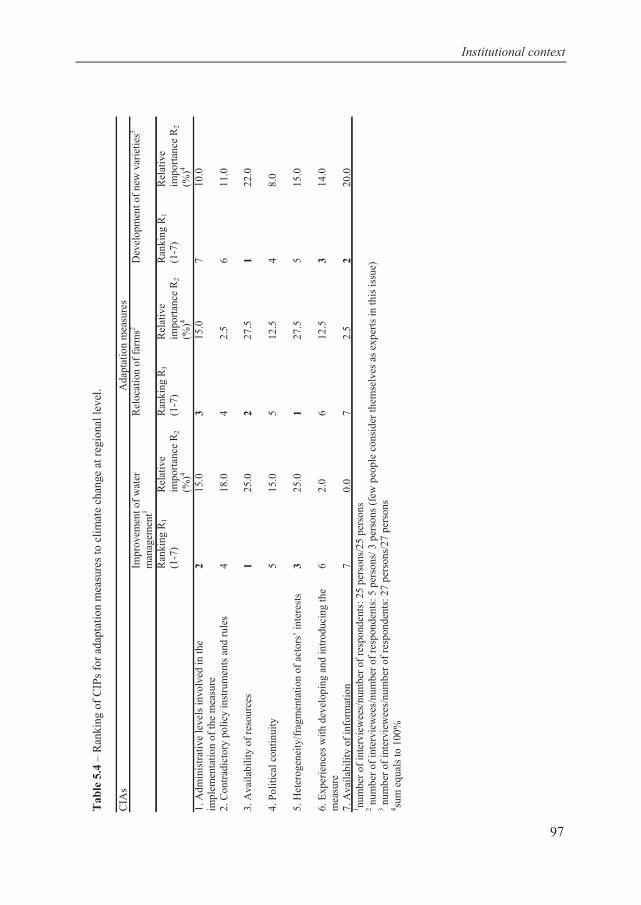
Chapter 5
96
Wageningen University and one farmer in Flevoland who has been collaborating with a breeding company to conduct research on breeding new crop varieties of seed potato. In addition, we also consulted two breeding experts from two potato breeding companies in the Netherlands on the issue of development of new crop varieties. 5.4.5 Ranking of CIPS We identified which CIPs are considered as the three most important for each adaptation measure (Table 5.4). The most important CIPs for the first two measures (improvement of water management and irrigation facilities and relocation of farms) were similar: heterogeneity of actors’ interests, availability of resources, and administration levels involved in the implementation of the measure. For the third measure (development of new varieties), the market was perceived as the main driver, which was not included as a CIP in our framework. Among the institutional aspects listed in the framework, the three most important CIPs were: availability of resources, experience with developing and introducing the measure and availability of information. 5.4.6 Scoring of CIPs and institutional feasibility Table 5.4 summarizes the results on constraint-ability, institutional constraints and institutional feasibility of each measure. Details on the derivation of scores based on qualitative information from workshops, interviews and findings from a literature review are provided in Appendix 5.B. The adaptation measure ‘improvement of water management and irrigation facilities’ appeared to be the most feasible to implement in Flevoland from an institutional perspective. The value of institutional feasibility for this measure pointed at fewer institutional constraints compared to the other two measures. Relocation of farms appeared the most difficult to implement, since its value for institutional feasibility indicated potentially more institutional constraints. Different CIPs constrained the implementation of each measure. For improvement of water management, no substantial institutional constraints were named by participants of the workshops and interviews or were found in the literature (Table 5.5 and Appendix 5.B). The most constraining CIP for this measure appeared to be heterogeneity of actors’ interests (IC=0.75). Relocation of farms appears to be mostly constrained by heterogeneity of actors’ interests (IC=1.38). The issue of relocation was described by experts and in literature as “very problematic”, especially due to the large number of potentially-conflicting parties involved, debates around financial compensation and, no official policy on relocation.
Institutional context
97
T
able
5.4
– R
anki
ng o
f CIP
s for
ada
ptat
ion
mea
sure
s to
clim
ate
chan
ge a
t reg
iona
l lev
el.
CIA
s A
dapt
atio
n m
easu
res
retaw fo tne
mevorpmI
m
anag
emen
t1 R
eloc
atio
n of
farm
s2 D
evel
opm
ent o
f new
var
ietie
s3
R gniknaR
1
(1-7
) R
elat
ive
impo
rtanc
e R
2 (%
)4
Ran
king
R1
(1-7
) R
elat
ive
impo
rtanc
e R
2 (%
)4
Ran
king
R1
(1-7
) R
elat
ive
impo
rtanc
e R
2 (%
)4 1.
Adm
inis
trativ
e le
vels
invo
lved
in th
e im
plem
enta
tion
of th
e m
easu
re
2 15
.0
3 15
.0
7 10
.0
2. C
ontra
dict
ory
polic
y in
stru
men
ts a
nd ru
les
4 18
.0
4 2.
5 6
11.0
3. A
vaila
bilit
y of
reso
urce
s 1
25.0
2
27.5
1
22.0
4. P
oliti
cal c
ontin
uity
5
15.0
5
12.5
4
8.0
5. H
eter
ogen
eity
/frag
men
tatio
n of
act
ors’
inte
rest
s 3
25.0
1
27.5
5
15.0
6. E
xper
ienc
es w
ith d
evel
opin
g an
d in
trodu
cing
the
mea
sure
6
2.0
6 12
.5
3 14
.0
7. A
vaila
bilit
y of
info
rmat
ion
7 0.
0 7
2.5
2 20
.0
1 num
ber o
f int
ervi
ewee
s/nu
mbe
r of r
espo
nden
ts: 2
5 pe
rson
s/25
per
sons
2 n
umbe
r of i
nter
view
ees/
num
ber o
f res
pond
ents
: 5 p
erso
ns/ 3
per
sons
(few
peo
ple
cons
ider
them
selv
es a
s exp
erts
in th
is is
sue)
3 n
umbe
r of i
nter
view
ees/
num
ber o
f res
pond
ents
: 27
pers
ons/
27 p
erso
ns
4 sum
equ
als t
o 10
0%
binnenwerk.indd 97 23-2-2016 21:55:20

Institutional context
99
For the development of new varieties, the availability of resources appeared to be the most constraining CIP (IC=0.66). Specifically for potato, breeding is a long and arduous process, and it can take more than 15 years before a new cultivar can be released. Demand for new varieties is determined by the need to produce more productive, more resistant and higher quality crops. Such demand drives the market and amplifies the interests of all stakeholders, particularly the breeders. In the context of constraining policies, experts did not see any possible effects from the contradiction in policy instruments and rules to their activities. For example, in the light of the present discussion about banning genetically modified organisms (GMO) within the EU, the interviewed experts nevertheless anticipate dynamics in international discussions, and hence believe that in the future GMOs may be allowed.
In summary, from an institutional perspective, heterogeneity of actor’s interests and availability of resources appeared to be the most constraining CIPs for adaptation measures to be implemented against risks associated with climate change. 5.5. Discussion 5.5.1 Novelty We presented a method to assess institutional preconditions for adaptive capacity to respond to climate change challenges. We classified adaptation measures based on the type of risks and impacts the measures address or and the level of implementation (crop, farm and at regional/sectoral). This categorization assisted in identifying different institutions and institutional arrangements involved at each level. The methodology is not scale dependent as it is based on stakeholder input and literature. Hence, our framework can be used to assess adaptation measures at other levels of implementation (e.g. crop, farm, nation) and in other socio-economic and bio-physical contexts, than those presented in this paper. With our broad definition of institutional context/preconditions - using CIPs - we captured the main barriers to adaptation (i.e. institutional, social, financial, and informational). While many studies on institutional analyses provide potentially endless lists of barriers to adaptation (e.g. Biesbroek et al. 2013; Moser and Ekstrom 2010), our study was relatively focused. Firstly, we focused on three adaptation measures which were designed in a participatory manner and therefore are relevant to stakeholders. Second, we limited our analysis to seven crucial institutional preconditions. As a result, we were able to describe the degree of importance for different institutional constraints to implementation of the adaptation measures. The main objective of our institutional assessment was to evaluate the overall coping capacity of a society through assessment of determinants of adaptive capacity. Such an objective and approach is in line with the adaptation wheel of Gupta et al. (2010), however, dimensions and criteria of the adaptation wheel are rather abstract and difficult to explain to the interviewees (Bergsma et al., 2012).
Chapter 5
98 Tab
le 5
.5–
Sum
mar
y of
the
resu
lts in
terp
reta
tion.
See
App
endi
x 5.
2 fo
r rea
sons
beh
ind
the
scor
ing.
CIP
Mea
sure
1W
ater
man
agem
ent
Mea
sure
2R
eloc
atio
n of
farm
sM
easu
re 3
Dev
elop
men
t of n
ew v
arie
ties
R2(%
)R
elat
ive
impo
rtanc
e
S (0
–5)
1
Scor
es
CA
(Con
stra
int-
abili
ty)
R2(%
)R
elat
ive
impo
rtanc
e
S (0
–5)
1
Scor
esC
A(C
onst
rain
t-ab
ility
)
R2(%
)R
elat
ive
impo
rtanc
e
S (0
–5)
1
Scor
esC
A(C
onst
rain
t-a
bilit
y)1.
Adm
inis
trativ
e le
vels
invo
lved
in
the
impl
emen
tatio
n of
the
mea
sure
153
0.45
154
0.60
103
0.30
2. C
ontra
dict
ory
polic
y in
stru
men
ts
and
rule
s18
10.
182.
51
0.03
114
0.44
3. A
vaila
bilit
y of
reso
urce
s25
20.
5027
.53
0.83
223
0.66
4. P
oliti
cal c
ontin
uity
150
0.00
12.5
00.
008
10.
085.
Het
erog
enei
ty/fr
agm
enta
tion
of
acto
rs’ i
nter
ests
253
0.75
27.5
51.
3815
30.
456.
Exp
erie
nces
with
dev
elop
ing
and
intro
duci
ng th
e m
easu
re2
10.
0212
.52
0.25
140
0.00
7. A
vaila
bilit
y of
info
rmat
ion
01
0.00
2.5
30.
0820
30.
60To
tal s
um10
010
010
0IC
(Ins
titut
iona
l con
stra
int)
Het
erog
e-ne
ity/
frag
men
ta-
tion
of a
ctor
’s
inte
rest
s (0
.75)
Het
erog
e-ne
ity/
frag
men
ta-
tion
of a
ctor
’s
inte
rest
s (1
.38)
Ava
ilabi
-lit
y of
re
sour
ces
(0.6
6)
IF (I
nstit
utio
nal f
easi
bilit
y)(M
in in
stitu
tiona
l con
stra
ints
=0;
M
ax in
stitu
tiona
l con
stra
ints
=5)
1.90
3.15
2.53
1 0 re
pres
ents
no
inst
itutio
nal c
onst
rain
ts, 5
repr
esen
ts m
ajor
inst
itutio
nal c
onst
rain
s
binnenwerk.indd 98 23-2-2016 21:55:22

Institutional context
99
For the development of new varieties, the availability of resources appeared to be the most constraining CIP (IC=0.66). Specifically for potato, breeding is a long and arduous process, and it can take more than 15 years before a new cultivar can be released. Demand for new varieties is determined by the need to produce more productive, more resistant and higher quality crops. Such demand drives the market and amplifies the interests of all stakeholders, particularly the breeders. In the context of constraining policies, experts did not see any possible effects from the contradiction in policy instruments and rules to their activities. For example, in the light of the present discussion about banning genetically modified organisms (GMO) within the EU, the interviewed experts nevertheless anticipate dynamics in international discussions, and hence believe that in the future GMOs may be allowed.
In summary, from an institutional perspective, heterogeneity of actor’s interests and availability of resources appeared to be the most constraining CIPs for adaptation measures to be implemented against risks associated with climate change. 5.5. Discussion 5.5.1 Novelty We presented a method to assess institutional preconditions for adaptive capacity to respond to climate change challenges. We classified adaptation measures based on the type of risks and impacts the measures address or and the level of implementation (crop, farm and at regional/sectoral). This categorization assisted in identifying different institutions and institutional arrangements involved at each level. The methodology is not scale dependent as it is based on stakeholder input and literature. Hence, our framework can be used to assess adaptation measures at other levels of implementation (e.g. crop, farm, nation) and in other socio-economic and bio-physical contexts, than those presented in this paper. With our broad definition of institutional context/preconditions - using CIPs - we captured the main barriers to adaptation (i.e. institutional, social, financial, and informational). While many studies on institutional analyses provide potentially endless lists of barriers to adaptation (e.g. Biesbroek et al. 2013; Moser and Ekstrom 2010), our study was relatively focused. Firstly, we focused on three adaptation measures which were designed in a participatory manner and therefore are relevant to stakeholders. Second, we limited our analysis to seven crucial institutional preconditions. As a result, we were able to describe the degree of importance for different institutional constraints to implementation of the adaptation measures. The main objective of our institutional assessment was to evaluate the overall coping capacity of a society through assessment of determinants of adaptive capacity. Such an objective and approach is in line with the adaptation wheel of Gupta et al. (2010), however, dimensions and criteria of the adaptation wheel are rather abstract and difficult to explain to the interviewees (Bergsma et al., 2012).
Chapter 5
98 Tab
le 5
.5–
Sum
mar
y of
the
resu
lts in
terp
reta
tion.
See
App
endi
x 5.
2 fo
r rea
sons
beh
ind
the
scor
ing.
CIP
Mea
sure
1W
ater
man
agem
ent
Mea
sure
2R
eloc
atio
n of
farm
sM
easu
re 3
Dev
elop
men
t of n
ew v
arie
ties
R2(%
)R
elat
ive
impo
rtanc
e
S (0
–5)
1
Scor
es
CA
(Con
stra
int-
abili
ty)
R2(%
)R
elat
ive
impo
rtanc
e
S (0
–5)
1
Scor
esC
A(C
onst
rain
t-ab
ility
)
R2(%
)R
elat
ive
impo
rtanc
e
S (0
–5)
1
Scor
esC
A(C
onst
rain
t-a
bilit
y)1.
Adm
inis
trativ
e le
vels
invo
lved
in
the
impl
emen
tatio
n of
the
mea
sure
153
0.45
154
0.60
103
0.30
2. C
ontra
dict
ory
polic
y in
stru
men
ts
and
rule
s18
10.
182.
51
0.03
114
0.44
3. A
vaila
bilit
y of
reso
urce
s25
20.
5027
.53
0.83
223
0.66
4. P
oliti
cal c
ontin
uity
150
0.00
12.5
00.
008
10.
085.
Het
erog
enei
ty/fr
agm
enta
tion
of
acto
rs’ i
nter
ests
253
0.75
27.5
51.
3815
30.
456.
Exp
erie
nces
with
dev
elop
ing
and
intro
duci
ng th
e m
easu
re2
10.
0212
.52
0.25
140
0.00
7. A
vaila
bilit
y of
info
rmat
ion
01
0.00
2.5
30.
0820
30.
60To
tal s
um10
010
010
0IC
(Ins
titut
iona
l con
stra
int)
Het
erog
e-ne
ity/
frag
men
ta-
tion
of a
ctor
’s
inte
rest
s (0
.75)
Het
erog
e-ne
ity/
frag
men
ta-
tion
of a
ctor
’s
inte
rest
s (1
.38)
Ava
ilabi
-lit
y of
re
sour
ces
(0.6
6)
IF (I
nstit
utio
nal f
easi
bilit
y)(M
in in
stitu
tiona
l con
stra
ints
=0;
M
ax in
stitu
tiona
l con
stra
ints
=5)
1.90
3.15
2.53
1 0 re
pres
ents
no
inst
itutio
nal c
onst
rain
ts, 5
repr
esen
ts m
ajor
inst
itutio
nal c
onst
rain
s
binnenwerk.indd 99 23-2-2016 21:55:23
Chapter 5
100
Few attempts have been performed to define the concept of barriers to adaptation to climate change, to develop indicators and to distinguish barriers from non-barriers (see Biesbroek et al., 2013). In our study we identified and prioritized the relevant institutional preconditions for certain adaptation measures, and by doing so we reframed the concept of adaptation. The concept of adaptation was framed as a definable problem (here in terms of implementing a particular adaptation measure to climate change), which according to Biesbroek et al. (2013), is a constructive approach.
Another advantage of our study comes from the use of contextual knowledge. Many existing studies are theoretical and are not often tested in practice. We used stakeholder workshops and expert interviews with people from the case study area. This enhanced the practical value of our study by incorporating local knowledge from key stakeholders.
Institutional barriers, or constraints to adaptation have been perceived for a long time and treated as static concepts. However, Biesbroek et al. (2014) have shown that institutional barriers are in fact flexible mechanisms, or even organisms that evolve through time. Here we provide an assessment of institutional constraints based on importance ranks and the extent of current constraints, both of which could be used separately. For example, deriving scores for CIPs under future scenarios (e.g. up to 2050) would allow us to capture the dynamics of institutional constraints by exploring the future institutional setting. 5.5.2 Limitations and challenges We experienced some challenges in assigning scores to assess to which degree certain CIPs are constraining implementation of the measures. Unlike the interpretation of quantitative information to obtain the ranks, scores mainly depend on the researchers’ judgment of the interviews with stakeholders and experts. Misinterpretation of the information obtained in the interviews may lead to an incorrect score. Similar challenges were recognized by Gupta et al. (2010).
In some cases the ranking of CIPs overlapped with the scoring (i.e. the constraining aspect of the CIP). For example, the two CIPs, availability of resources and availability of information are closely related to the adaptation measures we assessed. Therefore, these CIPs were generally ranked and scored high in terms of currently constraining the adaptation measures. On the other hand, political continuity refers to the institutional setting exclusively, so the score related to this setting, while the rank referred specifically to the adaptation measure. Similar issues have been reported by Bergsma et al. (2012) and Biesbroek et al. (2013). To a certain extent, individual CIPs may be double counted, but this mostly occurs when CIPs are highly constraining. Given that the primary objective of our assessment was to identify the main constraints, this “double counting” is not a deficiency for the approach per se.
Institutional context
101
All values in this study, especially the values for constraint-ability (CA) and institutional feasibility (IF), remain indicative only: they cannot be associated with any statistical significance. Their purpose is to indicate relative feasibility of implementation of a particular adaptation measure compared to the other measures. 5.5.3 Institutional feasibility In general, our results on institutional feasibility of adaptation measures yielded similar findings to other studies focusing on barriers to adaptation (Biesbroek et al., 2013). Our findings are also comparable to those from studies of institutional aspects in water management in Spain (Avellá and García-Mollá, 2009) and irrigation management in Haiti (Boyer et al., 2011). Our and others’ results suggest that institutional setting is crucial in water management, especially for the coordination of roles and compromises among different stakeholders. Biesbroek et al. (2011) also found that among the most highly ranked barriers to climate change adaptation in the Netherlands - besides short term thinking of the politicians versus long term dynamics of climate change - are conflicting interests (corresponding to our heterogeneity of interests), lack of financial resources, and unclear division of tasks and responsibilities. The results of our study suggested that availability of resources (in particular financial resources) is potentially one of the most constraining CIPs for the implementation of adaptation measures in agriculture. Interestingly, the importance of financial resources as barriers to adaptation has been often contested (Biesbroek et al. 2011; Gupta et al. 2010; Theesfeld, 2010). In fact, several studies claim that the role of financial resources is generally overestimated and that efforts to create more adaptive capacity by generating more resources is most likely insufficient (Biesbroek et al. 2011; Gupta et al. 2010). Authors of these studies often downplay the discussion about resource constraints by claiming that better use of existing resources (not just financial) would reduce the need for more financial resources (Biesbroek et al., 2013; Burch, 2010).
In our case respondents ranked resources as the highest constraint for development of new varieties. This discrepancy in results between our study and previous research can be explained by the fact that we were referring to a specific adaptation measure for agriculture in Flevoland, while authors such as Biesbroek et al. (2011) were referring to climate change adaptation as a general concept. 5.5.4 Relevance for adaptation to climate change In general, the regional/sectoral adaptation measures assessed in this study are very important for the agricultural sector in Flevoland to overcome future climate challenges. This statement has been confirmed by stakeholders in the region during workshops and interviews. De Bruin et al. (2009) found that water management scored highest among adaptation measures to climate change in the Netherlands, based on importance, urgency and co-benefits. Choice of crop varieties and genotypes also received high scores in de Bruin et al.’s study. The choice of crop variety and
binnenwerk.indd 100 23-2-2016 21:55:23

Chapter 5
100
Few attempts have been performed to define the concept of barriers to adaptation to climate change, to develop indicators and to distinguish barriers from non-barriers (see Biesbroek et al., 2013). In our study we identified and prioritized the relevant institutional preconditions for certain adaptation measures, and by doing so we reframed the concept of adaptation. The concept of adaptation was framed as a definable problem (here in terms of implementing a particular adaptation measure to climate change), which according to Biesbroek et al. (2013), is a constructive approach.
Another advantage of our study comes from the use of contextual knowledge. Many existing studies are theoretical and are not often tested in practice. We used stakeholder workshops and expert interviews with people from the case study area. This enhanced the practical value of our study by incorporating local knowledge from key stakeholders.
Institutional barriers, or constraints to adaptation have been perceived for a long time and treated as static concepts. However, Biesbroek et al. (2014) have shown that institutional barriers are in fact flexible mechanisms, or even organisms that evolve through time. Here we provide an assessment of institutional constraints based on importance ranks and the extent of current constraints, both of which could be used separately. For example, deriving scores for CIPs under future scenarios (e.g. up to 2050) would allow us to capture the dynamics of institutional constraints by exploring the future institutional setting. 5.5.2 Limitations and challenges We experienced some challenges in assigning scores to assess to which degree certain CIPs are constraining implementation of the measures. Unlike the interpretation of quantitative information to obtain the ranks, scores mainly depend on the researchers’ judgment of the interviews with stakeholders and experts. Misinterpretation of the information obtained in the interviews may lead to an incorrect score. Similar challenges were recognized by Gupta et al. (2010).
In some cases the ranking of CIPs overlapped with the scoring (i.e. the constraining aspect of the CIP). For example, the two CIPs, availability of resources and availability of information are closely related to the adaptation measures we assessed. Therefore, these CIPs were generally ranked and scored high in terms of currently constraining the adaptation measures. On the other hand, political continuity refers to the institutional setting exclusively, so the score related to this setting, while the rank referred specifically to the adaptation measure. Similar issues have been reported by Bergsma et al. (2012) and Biesbroek et al. (2013). To a certain extent, individual CIPs may be double counted, but this mostly occurs when CIPs are highly constraining. Given that the primary objective of our assessment was to identify the main constraints, this “double counting” is not a deficiency for the approach per se.
Institutional context
101
All values in this study, especially the values for constraint-ability (CA) and institutional feasibility (IF), remain indicative only: they cannot be associated with any statistical significance. Their purpose is to indicate relative feasibility of implementation of a particular adaptation measure compared to the other measures. 5.5.3 Institutional feasibility In general, our results on institutional feasibility of adaptation measures yielded similar findings to other studies focusing on barriers to adaptation (Biesbroek et al., 2013). Our findings are also comparable to those from studies of institutional aspects in water management in Spain (Avellá and García-Mollá, 2009) and irrigation management in Haiti (Boyer et al., 2011). Our and others’ results suggest that institutional setting is crucial in water management, especially for the coordination of roles and compromises among different stakeholders. Biesbroek et al. (2011) also found that among the most highly ranked barriers to climate change adaptation in the Netherlands - besides short term thinking of the politicians versus long term dynamics of climate change - are conflicting interests (corresponding to our heterogeneity of interests), lack of financial resources, and unclear division of tasks and responsibilities. The results of our study suggested that availability of resources (in particular financial resources) is potentially one of the most constraining CIPs for the implementation of adaptation measures in agriculture. Interestingly, the importance of financial resources as barriers to adaptation has been often contested (Biesbroek et al. 2011; Gupta et al. 2010; Theesfeld, 2010). In fact, several studies claim that the role of financial resources is generally overestimated and that efforts to create more adaptive capacity by generating more resources is most likely insufficient (Biesbroek et al. 2011; Gupta et al. 2010). Authors of these studies often downplay the discussion about resource constraints by claiming that better use of existing resources (not just financial) would reduce the need for more financial resources (Biesbroek et al., 2013; Burch, 2010).
In our case respondents ranked resources as the highest constraint for development of new varieties. This discrepancy in results between our study and previous research can be explained by the fact that we were referring to a specific adaptation measure for agriculture in Flevoland, while authors such as Biesbroek et al. (2011) were referring to climate change adaptation as a general concept. 5.5.4 Relevance for adaptation to climate change In general, the regional/sectoral adaptation measures assessed in this study are very important for the agricultural sector in Flevoland to overcome future climate challenges. This statement has been confirmed by stakeholders in the region during workshops and interviews. De Bruin et al. (2009) found that water management scored highest among adaptation measures to climate change in the Netherlands, based on importance, urgency and co-benefits. Choice of crop varieties and genotypes also received high scores in de Bruin et al.’s study. The choice of crop variety and
binnenwerk.indd 101 23-2-2016 21:55:23

Chapter 5
102
genotype was considered the most important adaptation strategy to climate change in the agricultural sector (Verhagen et al., 2002). Issues related to relocation of farms (i.e. abandoning of low-lying areas) received high institutional, social and technical complexity scores (de Bruin et al., 2009). Although this measure was named among important measures to respond to future climate challenges at stakeholder workshops during our research, the actual implementation might be severely constrained. Adaptation measures that were proposed for farm and crop level (see Appendix 5.A) were not considered in the institutional assessment in this study. However, structural measures such as farm diversification, farm size enlargement, farm intensification and change in specialization can also be upscaled to regional level priorities (see Chapter 2). In that case similar crucial institutional preconditions might constrain the implementation of these measures. In the end, a farmer as a stakeholder and a decision-maker is involved in implementation of measures from crop up to the regional level (see also Appendix 5.B). This type of analysis could be extended to include adaptation measures at farm and crop levels. Such an application is supportive of the assertion of Biesbroek et al. (2013) that multi-level perspectives in research on barriers to adaptation are needed. 5.5.5 Policy implications Heterogeneity or fragmentation of actors’ interests appeared to be the main institutional constraint for implementation of adaptation measures in agricultural Flevoland. This has implications for policy-making in the region and requires certain changes to reduce the impact of this institutional constraint. Although Flevoland (and the Netherlands in general) has extensive experience with the broad engagement of stakeholders through the so called polder model, this model does not always appear to be the most efficient for decision-making.
Relative to other countries where decision-making is predominantly top-down, the Netherlands has always opted for consultation and compromise when making decisions. Multi-level governance and multi-stakeholder platforms are not new concepts within Dutch policy-making, especially in water management and agriculture. Having its roots in water management, the polder model historically opted for engagement of different and contrasting groups of stakeholders, each with their own interests. Consequently, when proposing to introduce a controversial measure to improve water management (e.g. increasing the ground water level by 0.15 meter), there would be strong opposition. The discussion about decentralization of water management from the water board to the farmer has been around for a few decades already. The parties involved still have not reached consensus, as the model of decision-making has led to an endless sequence of meetings and still no final decision has been made. Frustration and lack of action predominate. Suggesting that a balance is needed between accounting for the heterogeneity of actors’ interests and making
Institutional context
103
decisions in a timely manner, one has to strive for the balance between legitimacy and efficiency. 5.6. Conclusions We proposed a framework for assessment of institutional preconditions for adaptation measures to climate change, based on a modified PICA (Theesfeld et al., 2010). Adjustments were made to most of the steps within PICA. Changes related to the classification of adaptation measures, selection of CIPs, assignment of indicators to each CIP, the ranking and scoring procedure and results’ interpretation. We applied our framework to adaptation measures at the regional/sectoral level for agriculture in Flevoland. The adaptation measures assessed were: (i) improvement of water management and irrigation facilities; (ii) relocation of farms from vulnerable areas; and (iii) development of new crop varieties that can cope with water stress, drought stress, heat waves and sprouting problems during storage.
Based on the ranking analysis, heterogeneity of actors’ interests and availability of resources were considered the two most important CIPs for the adaptation measures. These two CIPs were also found to be most constraining for implementation of the measures. Heterogeneity of actors’ interests is especially constraining for the relocation of farms, as this measure involves a large number of stakeholders with conflicting interests and there is no official policy support. This CIP is also potentially hindering implementation of water management and improvement of irrigation facilities. For development of new varieties the most constraining CIP was found to be the availability of resources.
Based on the institutional feasibility analysis, the implementation of water management and improvement of irrigation facilities will potentially face fewer institutional constraints compared to the other two measures. Our overall recommendation to the policy-makers in the region is to strive for a balance between the legitimacy and efficiency of decision making processes.
In general, the PICA approach – with some adjustments – is applicable for the institutional analysis of adaptation measures. The framework was only applied to one sector in one region. It is therefore recommended to conduct similar assessments in another institutional setting, in other regions or in other sectors to further test the method.
binnenwerk.indd 102 23-2-2016 21:55:24

Chapter 5
102
genotype was considered the most important adaptation strategy to climate change in the agricultural sector (Verhagen et al., 2002). Issues related to relocation of farms (i.e. abandoning of low-lying areas) received high institutional, social and technical complexity scores (de Bruin et al., 2009). Although this measure was named among important measures to respond to future climate challenges at stakeholder workshops during our research, the actual implementation might be severely constrained. Adaptation measures that were proposed for farm and crop level (see Appendix 5.A) were not considered in the institutional assessment in this study. However, structural measures such as farm diversification, farm size enlargement, farm intensification and change in specialization can also be upscaled to regional level priorities (see Chapter 2). In that case similar crucial institutional preconditions might constrain the implementation of these measures. In the end, a farmer as a stakeholder and a decision-maker is involved in implementation of measures from crop up to the regional level (see also Appendix 5.B). This type of analysis could be extended to include adaptation measures at farm and crop levels. Such an application is supportive of the assertion of Biesbroek et al. (2013) that multi-level perspectives in research on barriers to adaptation are needed. 5.5.5 Policy implications Heterogeneity or fragmentation of actors’ interests appeared to be the main institutional constraint for implementation of adaptation measures in agricultural Flevoland. This has implications for policy-making in the region and requires certain changes to reduce the impact of this institutional constraint. Although Flevoland (and the Netherlands in general) has extensive experience with the broad engagement of stakeholders through the so called polder model, this model does not always appear to be the most efficient for decision-making.
Relative to other countries where decision-making is predominantly top-down, the Netherlands has always opted for consultation and compromise when making decisions. Multi-level governance and multi-stakeholder platforms are not new concepts within Dutch policy-making, especially in water management and agriculture. Having its roots in water management, the polder model historically opted for engagement of different and contrasting groups of stakeholders, each with their own interests. Consequently, when proposing to introduce a controversial measure to improve water management (e.g. increasing the ground water level by 0.15 meter), there would be strong opposition. The discussion about decentralization of water management from the water board to the farmer has been around for a few decades already. The parties involved still have not reached consensus, as the model of decision-making has led to an endless sequence of meetings and still no final decision has been made. Frustration and lack of action predominate. Suggesting that a balance is needed between accounting for the heterogeneity of actors’ interests and making
Institutional context
103
decisions in a timely manner, one has to strive for the balance between legitimacy and efficiency. 5.6. Conclusions We proposed a framework for assessment of institutional preconditions for adaptation measures to climate change, based on a modified PICA (Theesfeld et al., 2010). Adjustments were made to most of the steps within PICA. Changes related to the classification of adaptation measures, selection of CIPs, assignment of indicators to each CIP, the ranking and scoring procedure and results’ interpretation. We applied our framework to adaptation measures at the regional/sectoral level for agriculture in Flevoland. The adaptation measures assessed were: (i) improvement of water management and irrigation facilities; (ii) relocation of farms from vulnerable areas; and (iii) development of new crop varieties that can cope with water stress, drought stress, heat waves and sprouting problems during storage.
Based on the ranking analysis, heterogeneity of actors’ interests and availability of resources were considered the two most important CIPs for the adaptation measures. These two CIPs were also found to be most constraining for implementation of the measures. Heterogeneity of actors’ interests is especially constraining for the relocation of farms, as this measure involves a large number of stakeholders with conflicting interests and there is no official policy support. This CIP is also potentially hindering implementation of water management and improvement of irrigation facilities. For development of new varieties the most constraining CIP was found to be the availability of resources.
Based on the institutional feasibility analysis, the implementation of water management and improvement of irrigation facilities will potentially face fewer institutional constraints compared to the other two measures. Our overall recommendation to the policy-makers in the region is to strive for a balance between the legitimacy and efficiency of decision making processes.
In general, the PICA approach – with some adjustments – is applicable for the institutional analysis of adaptation measures. The framework was only applied to one sector in one region. It is therefore recommended to conduct similar assessments in another institutional setting, in other regions or in other sectors to further test the method.
binnenwerk.indd 103 23-2-2016 21:55:24
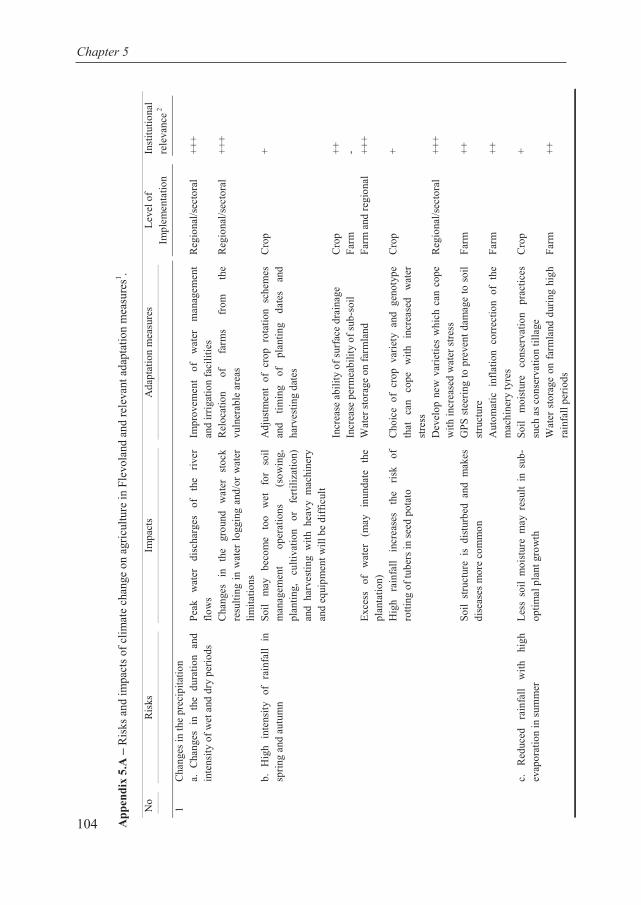
Institutional context
105
2W
arm
and
wet
con
ditio
ns d
urin
g su
mm
erIn
crea
se
the
risk
of
outb
reak
s of
ba
cter
ial
dise
ases
an
d pe
sts,
e.g.
Er
win
ia o
n se
ed p
otat
o
Cho
ice
of c
rop
varie
ty a
nd g
enot
ype
Cro
p+
Opt
imis
e nu
trien
t man
agem
ent
Cro
p++
Dev
elop
ne
w
varie
ties
whi
ch
are
resi
stan
t to
the
res
pect
ive
pest
s an
d di
seas
es
Reg
iona
l/sec
tora
l++
+
Fung
al in
fect
ion
in se
ed o
nion
Che
mic
al p
rote
ctio
nC
rop
++U
V-li
ght p
rote
ctio
nC
rop
++D
evel
op
new
va
rietie
s w
hich
ar
e re
sist
ant
to t
he r
espe
ctiv
e pe
sts
and
dise
ases
Reg
iona
l/sec
tora
l++
+
3H
eat w
ave
Seco
nd g
row
thPl
ant i
n w
ider
ridg
esC
rop/
farm
-Pl
ant a
nd h
arve
st e
arlie
rC
rop/
farm
+D
rip ir
rigat
ion
Cro
p/fa
rm+
Opt
imis
e cr
op c
over
Cro
p-
Dev
elop
hea
t res
ista
nt v
arie
ties
Reg
iona
l/sec
tora
l++
+4
War
m w
inte
rIn
crea
se th
e ris
k to
spr
outin
g pr
oble
ms
in st
orag
e (p
artic
ular
ly fo
r see
d po
tato
)D
evel
op n
ew v
arie
ties
whi
ch c
an c
ope
with
the
spro
utin
g pr
oble
mR
egio
nal/s
ecto
ral
+++
Air
cond
ition
ing
Cro
p/fa
rm+
Spro
utin
g co
ntro
l with
che
mic
als
Cro
p/fa
rm++
5Se
a le
vel r
ise
Incr
ease
the
risk
of in
unda
tion
and
risk
of lo
ss o
f ara
ble
land
Rel
ocat
ion
of
farm
s fr
om
the
vuln
erab
le a
reas
Reg
iona
l/sec
tora
l++
+
Cro
ps h
ave
to c
ope
with
hig
hsa
linity
du
e to
salin
izat
ion/
salt
intru
sion
Dev
elop
new
cro
p va
rietie
s th
at c
an
cope
with
hig
h sa
linity
Reg
iona
l/sec
tora
l++
+
Insu
ranc
eFa
rm++
6G
radu
al c
limat
e ch
ange
Cha
nge
in
cond
ition
s fo
r pr
imar
y pr
oduc
tion
Farm
div
ersi
ficat
ion
Farm
++
Farm
size
enl
arge
men
tFa
rm++
Farm
inte
nsifi
catio
nFa
rm++
Cha
nges
in sp
ecia
lizat
ion
Farm
++1 A
t cro
p le
vel,
econ
omic
ris
ks a
re m
uch
high
er fo
r po
tato
com
pare
d to
cro
ps s
uch
as s
ugar
bee
t and
whe
at (
Scha
ap e
t al.,
201
3), a
nd th
eref
ore
incl
uded
mea
sure
s w
ere
limite
d to
thes
e cr
ops.
2 Mor
e (+
) ind
icat
e hi
gher
rele
vanc
e of
inst
itutio
ns in
the
impl
emen
tatio
n of
the
adap
tatio
n m
easu
re, (
-) in
dica
tes n
o re
leva
nce
of in
stitu
tions
for a
par
ticul
ar m
easu
re. B
oth
+ an
d –
have
be
en a
ssig
ned
by th
e re
sear
cher
s
Chapter 5
104 App
endi
x 5.
A–
Ris
ks a
nd im
pact
s of c
limat
e ch
ange
on
agric
ultu
re in
Fle
vola
nd a
nd re
leva
nt a
dapt
atio
n m
easu
res1 .
No
Ris
ksIm
pact
sA
dapt
atio
n m
easu
res
Leve
l of
Impl
emen
tatio
nIn
stitu
tiona
l re
leva
nce2
1C
hang
es in
the
prec
ipita
tion
a. C
hang
es i
n th
e du
ratio
n an
d in
tens
ity o
f wet
and
dry
per
iods
Peak
w
ater
di
scha
rges
of
th
e riv
er
flow
sIm
prov
emen
t of
w
ater
m
anag
emen
t an
d irr
igat
ion
faci
litie
sR
egio
nal/s
ecto
ral
+++
Cha
nges
in
th
e gr
ound
w
ater
stoc
k re
sulti
ng in
wat
er lo
ggin
g an
d/or
wat
er
limita
tions
Rel
ocat
ion
of
farm
s fr
om
the
vuln
erab
le a
reas
Reg
iona
l/sec
tora
l++
+
b. H
igh
inte
nsity
of
rain
fall
in
sprin
g an
d au
tum
nSo
il m
ay
beco
me
too
wet
fo
r so
il m
anag
emen
t op
erat
ions
(s
owin
g,
plan
ting,
cu
ltiva
tion
or
ferti
lizat
ion)
an
d ha
rves
ting
with
hea
vy m
achi
nery
an
d eq
uipm
ent w
ill b
e di
ffic
ult
Adj
ustm
ent
of c
rop
rota
tion
sche
mes
an
d tim
ing
of
plan
ting
date
s an
d ha
rves
ting
date
s
Cro
p+
Incr
ease
abi
lity
of su
rfac
e dr
aina
geC
rop
++In
crea
se p
erm
eabi
lity
of su
b-so
ilFa
rm-
Exce
ss
of
wat
er
(may
in
unda
te
the
plan
tatio
n)W
ater
stor
age
on fa
rmla
ndFa
rm a
nd re
gion
al++
+
Hig
h ra
infa
ll in
crea
ses
the
risk
of
rotti
ng o
f tub
ers i
n se
ed p
otat
o C
hoic
e of
cro
p va
riety
and
gen
otyp
e th
at
can
cope
w
ithin
crea
sed
wat
er
stre
ss
Cro
p+
Dev
elop
new
var
ietie
s w
hich
can
cop
e w
ith in
crea
sed
wat
er st
ress
Reg
iona
l/sec
tora
l++
+
Soil
stru
ctur
e is
dis
turb
ed a
nd m
akes
di
seas
es m
ore
com
mon
GPS
ste
erin
g to
pre
vent
dam
age
to s
oil
stru
ctur
eFa
rm++
Aut
omat
ic i
nfla
tion
corr
ectio
n of
the
m
achi
nery
tyre
sFa
rm++
c.
Red
uced
ra
infa
ll w
ith
high
ev
apor
atio
n in
sum
mer
Less
soi
l m
oist
ure
may
res
ult
in s
ub-
optim
al p
lant
gro
wth
Soil
moi
stur
e co
nser
vatio
n pr
actic
es
such
as c
onse
rvat
ion
tilla
geC
rop
+
Wat
er s
tora
ge o
n fa
rmla
nd d
urin
g hi
gh
rain
fall
perio
dsFa
rm++
binnenwerk.indd 104 23-2-2016 21:55:26
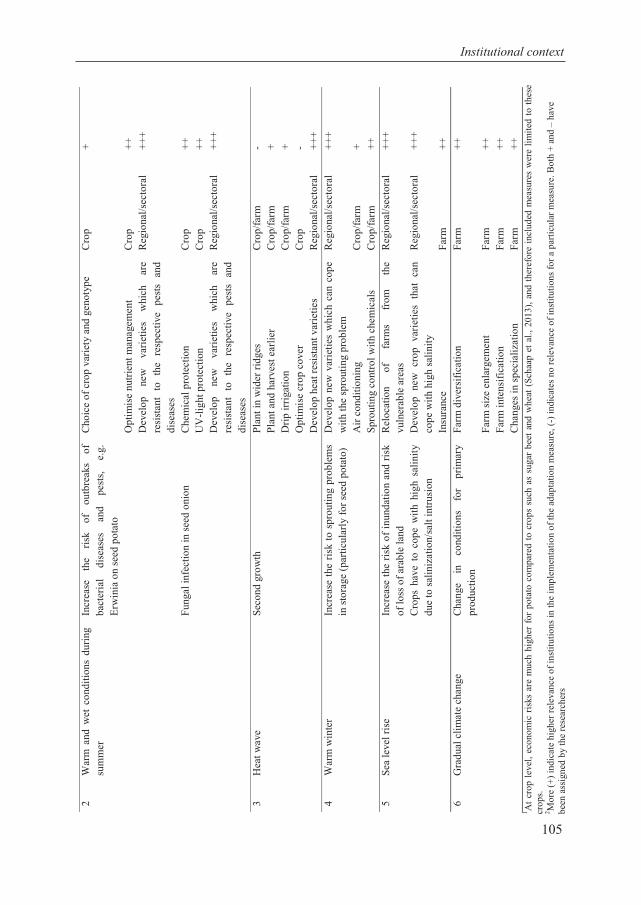
Institutional context
105
2W
arm
and
wet
con
ditio
ns d
urin
g su
mm
erIn
crea
se
the
risk
of
outb
reak
s of
ba
cter
ial
dise
ases
an
d pe
sts,
e.g.
Er
win
ia o
n se
ed p
otat
o
Cho
ice
of c
rop
varie
ty a
nd g
enot
ype
Cro
p+
Opt
imis
e nu
trien
t man
agem
ent
Cro
p++
Dev
elop
ne
w
varie
ties
whi
ch
are
resi
stan
t to
the
res
pect
ive
pest
s an
d di
seas
es
Reg
iona
l/sec
tora
l++
+
Fung
al in
fect
ion
in se
ed o
nion
Che
mic
al p
rote
ctio
nC
rop
++U
V-li
ght p
rote
ctio
nC
rop
++D
evel
op
new
va
rietie
s w
hich
ar
e re
sist
ant
to t
he r
espe
ctiv
e pe
sts
and
dise
ases
Reg
iona
l/sec
tora
l++
+
3H
eat w
ave
Seco
nd g
row
thPl
ant i
n w
ider
ridg
esC
rop/
farm
-Pl
ant a
nd h
arve
st e
arlie
rC
rop/
farm
+D
rip ir
rigat
ion
Cro
p/fa
rm+
Opt
imis
e cr
op c
over
Cro
p-
Dev
elop
hea
t res
ista
nt v
arie
ties
Reg
iona
l/sec
tora
l++
+4
War
m w
inte
rIn
crea
se th
e ris
k to
spr
outin
g pr
oble
ms
in st
orag
e (p
artic
ular
ly fo
r see
d po
tato
)D
evel
op n
ew v
arie
ties
whi
ch c
an c
ope
with
the
spro
utin
g pr
oble
mR
egio
nal/s
ecto
ral
+++
Air
cond
ition
ing
Cro
p/fa
rm+
Spro
utin
g co
ntro
l with
che
mic
als
Cro
p/fa
rm++
5Se
a le
vel r
ise
Incr
ease
the
risk
of in
unda
tion
and
risk
of lo
ss o
f ara
ble
land
Rel
ocat
ion
of
farm
s fr
om
the
vuln
erab
le a
reas
Reg
iona
l/sec
tora
l++
+
Cro
ps h
ave
to c
ope
with
hig
hsa
linity
du
e to
salin
izat
ion/
salt
intru
sion
Dev
elop
new
cro
p va
rietie
s th
at c
an
cope
with
hig
h sa
linity
Reg
iona
l/sec
tora
l++
+
Insu
ranc
eFa
rm++
6G
radu
al c
limat
e ch
ange
Cha
nge
in
cond
ition
s fo
r pr
imar
y pr
oduc
tion
Farm
div
ersi
ficat
ion
Farm
++
Farm
size
enl
arge
men
tFa
rm++
Farm
inte
nsifi
catio
nFa
rm++
Cha
nges
in sp
ecia
lizat
ion
Farm
++1 A
t cro
p le
vel,
econ
omic
ris
ks a
re m
uch
high
er fo
r po
tato
com
pare
d to
cro
ps s
uch
as s
ugar
bee
t and
whe
at (
Scha
ap e
t al.,
201
3), a
nd th
eref
ore
incl
uded
mea
sure
s w
ere
limite
d to
thes
e cr
ops.
2 Mor
e (+
) ind
icat
e hi
gher
rele
vanc
e of
inst
itutio
ns in
the
impl
emen
tatio
n of
the
adap
tatio
n m
easu
re, (
-) in
dica
tes n
o re
leva
nce
of in
stitu
tions
for a
par
ticul
ar m
easu
re. B
oth
+ an
d –
have
be
en a
ssig
ned
by th
e re
sear
cher
s
Chapter 5
104 App
endi
x 5.
A–
Ris
ks a
nd im
pact
s of c
limat
e ch
ange
on
agric
ultu
re in
Fle
vola
nd a
nd re
leva
nt a
dapt
atio
n m
easu
res1 .
No
Ris
ksIm
pact
sA
dapt
atio
n m
easu
res
Leve
l of
Impl
emen
tatio
nIn
stitu
tiona
l re
leva
nce2
1C
hang
es in
the
prec
ipita
tion
a. C
hang
es i
n th
e du
ratio
n an
d in
tens
ity o
f wet
and
dry
per
iods
Peak
w
ater
di
scha
rges
of
th
e riv
er
flow
sIm
prov
emen
t of
w
ater
m
anag
emen
t an
d irr
igat
ion
faci
litie
sR
egio
nal/s
ecto
ral
+++
Cha
nges
in
th
e gr
ound
w
ater
stoc
k re
sulti
ng in
wat
er lo
ggin
g an
d/or
wat
er
limita
tions
Rel
ocat
ion
of
farm
s fr
om
the
vuln
erab
le a
reas
Reg
iona
l/sec
tora
l++
+
b. H
igh
inte
nsity
of
rain
fall
in
sprin
g an
d au
tum
nSo
il m
ay
beco
me
too
wet
fo
r so
il m
anag
emen
t op
erat
ions
(s
owin
g,
plan
ting,
cu
ltiva
tion
or
ferti
lizat
ion)
an
d ha
rves
ting
with
hea
vy m
achi
nery
an
d eq
uipm
ent w
ill b
e di
ffic
ult
Adj
ustm
ent
of c
rop
rota
tion
sche
mes
an
d tim
ing
of
plan
ting
date
s an
d ha
rves
ting
date
s
Cro
p+
Incr
ease
abi
lity
of su
rfac
e dr
aina
geC
rop
++In
crea
se p
erm
eabi
lity
of su
b-so
ilFa
rm-
Exce
ss
of
wat
er
(may
in
unda
te
the
plan
tatio
n)W
ater
stor
age
on fa
rmla
ndFa
rm a
nd re
gion
al++
+
Hig
h ra
infa
ll in
crea
ses
the
risk
of
rotti
ng o
f tub
ers i
n se
ed p
otat
o C
hoic
e of
cro
p va
riety
and
gen
otyp
e th
at
can
cope
w
ithin
crea
sed
wat
er
stre
ss
Cro
p+
Dev
elop
new
var
ietie
s w
hich
can
cop
e w
ith in
crea
sed
wat
er st
ress
Reg
iona
l/sec
tora
l++
+
Soil
stru
ctur
e is
dis
turb
ed a
nd m
akes
di
seas
es m
ore
com
mon
GPS
ste
erin
g to
pre
vent
dam
age
to s
oil
stru
ctur
eFa
rm++
Aut
omat
ic i
nfla
tion
corr
ectio
n of
the
m
achi
nery
tyre
sFa
rm++
c.
Red
uced
ra
infa
ll w
ith
high
ev
apor
atio
n in
sum
mer
Less
soi
l m
oist
ure
may
res
ult
in s
ub-
optim
al p
lant
gro
wth
Soil
moi
stur
e co
nser
vatio
n pr
actic
es
such
as c
onse
rvat
ion
tilla
geC
rop
+
Wat
er s
tora
ge o
n fa
rmla
nd d
urin
g hi
gh
rain
fall
perio
dsFa
rm++
binnenwerk.indd 105 23-2-2016 21:55:27

Institutional context
107
boar
ds ca
n co
llect
thei
r ow
n ta
xes,
so if
the
boar
d ag
rees
on
thei
r inv
olve
men
t and
the
nece
ssity
of a
mea
sure
, it i
s pos
sibl
e to
get
fu
ndin
g th
roug
h th
eir o
wn
taxi
ng p
ower
in
addi
tion
to n
atio
nal f
undi
ng (p
olic
y-m
aker
M
inist
ry o
f Inf
rast
ruct
ure
and
Envi
ronm
ent)
.
4. P
oliti
cal c
ontin
uity
Scor
e =
0 N
eith
er ch
ange
s in
the
cabi
net n
or in
the
wat
er b
oard
hav
e af
fect
ed b
udge
t for
wat
er
man
agem
ent.
Budg
et a
lloca
tion
is d
rive
n by
pr
actic
al re
ason
s or n
eeds
(mem
ber f
arm
ers’
orga
niza
tion
LTO)
.
Scor
e =
0 So
far n
o ev
iden
ce (P
rovi
ncia
l ad
min
istra
tion,
mem
ber w
ater
boa
rd )
Scor
e =
1 N
o in
fluen
ce so
far o
bser
ved
(bre
edin
g ex
pert
at
a re
sear
ch in
stitu
te o
f the
uni
vers
ity).
But
any
mom
ent s
ome
inst
ruct
ions
cou
ld b
e se
nt
from
abo
ve (s
ecre
tary
of t
he p
rovi
ncia
l boa
rd
of fa
rmer
s’ or
gani
zatio
n).
5.H
eter
ogen
eity
/frag
men
tatio
n of
act
ors’
inte
rest
sSc
ore
= 3
Smal
l pos
sibi
lity
of c
onfli
ct w
ith o
ther
se
ctor
s (m
embe
r far
mer
s’ or
gani
zatio
n LT
O),
diffe
rent
use
rs d
ecid
e to
geth
er o
n th
e w
ater
m
anag
emen
t iss
ues (
farm
er, m
embe
r wat
er
boar
d).
Scor
e =
5 Ve
ry p
robl
emat
ic is
sue
due
to d
iffer
ent
inte
rest
s of p
artie
s inv
olve
d (P
rovi
ncia
l ad
min
istra
tion,
Gro
ot e
t al.,
200
6).
Scor
e =
3 Ri
valr
y ca
n co
me
from
com
petin
g co
mpa
nies
, bu
t the
y pu
rsue
thei
r goa
ls –
to o
btai
n a
bette
r va
riet
y (b
reed
ing
expe
rt a
t a re
sear
ch in
stitu
te
of th
e un
iver
sity)
.
6. E
xper
ienc
es w
ith
deve
lopi
ng a
nd in
trodu
cing
th
e m
easu
re
Scor
e =
1 N
L ha
s a p
rofo
und
reco
rd a
s to
achi
evem
ents
in w
ater
man
agem
ent (
Delta
Co
mm
issio
n). I
n ge
nera
l ind
eed,
but
no
wad
ays t
here
are
man
y ne
w te
chni
ques
, e.
g. w
ater
leve
l dri
ven
drai
nage
of c
limat
e-ad
aptiv
e dr
aina
ge, w
hich
peo
ple
here
are
le
ss fa
mili
ar w
ith (s
ecre
tary
of t
he p
rovi
ncia
l bo
ard
of fa
rmer
s’ or
gani
zatio
n).
Scor
e =
2 Th
ere
is so
me
expe
rien
ce in
the
past
, but
it
alw
ays r
emai
ns a
uni
que
case
(Pro
vinc
ial
adm
inist
ratio
n)
Scor
e =
0 N
L ha
s an
exce
llent
reco
rd in
bre
edin
g (P
lant
re
sear
ch In
tern
atio
nal P
RI o
f Wag
enin
gen
univ
ersit
y)
7. A
vaila
bilit
y of
info
rmat
ion
Scor
e =
1 In
form
atio
n on
the
stat
e of
wat
er re
sour
ces
for r
ural
farm
com
mun
ities
is a
cces
sibl
e (B
ergs
ma
et a
l. , 2
012)
. Som
e pa
rtic
ular
in
form
atio
n on
ada
ptat
ion
to c
limat
e ch
ange
m
ight
be
lack
ing
(fie
ld o
bser
vatio
ns)
Scor
e =
3 Li
ttle
info
rmat
ion
on re
loca
tion
is
avai
labl
e (G
root
et a
l., 2
006)
. Mig
ht b
e th
at
not a
ll fa
rmer
s hav
e ac
cess
to c
erta
in
(onl
ine)
pub
licat
ions
(fie
ld o
bser
vatio
ns).
Room
for t
he R
iver
pro
gram
me
disc
usse
s th
is is
sue.
Scor
e =
3 In
fo o
n cl
imat
e ch
ange
is so
met
imes
co
ntra
dict
ory
to re
ality
– p
roje
ctio
ns a
re to
o ex
trem
e (b
reed
ing
expe
rt a
t a re
sear
ch
inst
itute
of t
he u
nive
rsity
). In
form
atio
n on
loca
l va
riet
ies i
s not
alw
ays c
lear
(Gro
ot e
t al.,
20
06).
Chapter 5
106
App
endi
x 5.
B–
Scor
es p
er C
IP (s
core
s fro
m 0
no
cons
train
tsto
5 m
ajor
con
stra
ints
).
CIP
Mea
sure
1W
ater
man
agem
ent
Mea
sure
2R
eloc
atio
n of
farm
sM
easu
re 3
New
cro
p va
rietie
s 1.
Adm
inis
trativ
e le
vels
in
volv
ed in
the
impl
emen
tatio
n of
the
mea
sure
Scor
e =
3
Only
wat
er b
oard
and
farm
ers i
nvol
ved;
cl
ear d
istr
ibut
ion
of ta
sks (
mem
ber w
ater
bo
ard)
. The
wat
er b
oard
aim
s to
have
all
wat
er m
anag
emen
t cen
tral
ized
and
au
tom
atiz
ed, w
here
as m
any
farm
ers w
ould
pr
efer
to h
ave
a de
cent
raliz
ed sy
stem
, as
they
kno
w e
xact
ly w
hat i
s hap
peni
ng in
the
ield
(sec
reta
ry o
f the
pro
vinc
ial b
oard
of
farm
ers’
orga
niza
tion)
. In
NL
divi
sion
of
resp
onsi
bilit
ies b
etw
een
acto
rs in
wat
er
sect
or (f
arm
er-m
unic
ipal
ity-w
ater
boa
rd) i
s no
t alw
ays c
lear
( Ber
gsm
a et
al.,
2012
).
Scor
e =
4 N
o ev
iden
ce, b
ut g
iven
the
curr
ent
inst
itutio
nal s
ettin
g in
NL,
man
y la
yers
w
ould
be
invo
lved
in th
e pr
oces
s (i.e
. the
na
tiona
l and
pro
vinc
ial g
over
nmen
t, th
e w
ater
shed
) , e
spec
ially
if th
e ca
se g
oes t
o co
urt.
It is
not
cle
ar w
hich
gov
ernm
enta
l la
yer w
ould
take
the
initi
ativ
e fo
r thi
s in
terv
entio
nal m
easu
re. B
esid
es, t
he
resp
onsi
bilit
ies o
f diff
eren
t par
ties a
re n
ot
clea
rly
delin
eate
d (B
ergs
ma
et a
l., 2
012)
.
Scor
e =
3
Acto
rs in
clud
e fa
rmer
s, fa
rmer
org
aniz
atio
ns,
prod
uct b
oard
s, co
nsum
ers,
natio
nal
gove
rnm
ent,
EU a
nd re
sear
ch (G
root
et a
l., 20
06).
Depe
ndin
g on
the
size
of a
com
pany
, m
any
laye
rs w
ill b
e in
volv
ed, b
ut it
’s no
t hi
nder
ing
the
proc
ess (
bree
ding
exp
ert a
t a
rese
arch
inst
itute
of t
he u
nive
rsity
). D
iffer
ent
grou
ps ca
n ex
erci
se p
ress
ure
on th
e br
eede
rs;
Dutc
h co
nsum
er is
esp
ecia
lly v
ery
criti
cal
(sec
reta
ry o
f the
pro
vinc
ial b
oard
of f
arm
ers’
orga
niza
tion)
.
2. C
ontra
dict
ory
polic
y in
stru
men
ts a
nd ru
les
Scor
e =
1 Th
ere
are
no a
ctua
l con
trad
icto
ry p
olic
ies
(mem
ber f
arm
ers’
orga
niza
tion
LTO)
. The
re
gion
al g
over
nmen
t ado
pted
rule
s and
re
gula
tions
at h
ighe
r lev
els (
EU, n
atio
nal a
nd
prov
inci
al),
so n
o co
nlic
t. Ex
ampl
es o
f EU
legi
slat
ion
are
Wat
er F
ram
ewor
k Di
rect
ive,
th
e Bi
rds a
nd H
abita
ts D
irec
tive
and
CAP.
N
atio
nal l
egis
latio
n: th
e Du
tch
natio
nal
Wat
er P
lan
and
the
Dutc
h Sp
atia
l Pla
nnin
g Ac
t. Co
ntra
dict
ion
may
ari
se a
roun
d sp
ecii
c (a
lso
loca
tion
spec
iic)
wat
er m
anag
emen
t de
cisi
on ( w
orks
hop
FNP)
.
Scor
e =
1 N
o of
icia
l pol
icy
on re
loca
tion,
in N
L th
ere
is n
o fo
rmal
legi
slat
ion
that
obl
iges
act
ors
to in
clud
e ad
apta
tion
to th
eir a
ctiv
ities
(B
iesb
roek
et a
l., 2
011)
.
Scor
e =
4 GM
O po
licie
s may
seem
cons
trai
ning
now
, but
in
the
futu
re co
nsum
er p
refe
renc
es m
ight
ch
ange
(bre
edin
g ex
pert
at a
rese
arch
inst
itute
of
the
univ
ersit
y). I
nstit
utio
nal a
spec
ts in
clud
e na
tiona
l agr
icul
tura
l law
s, EU
CAP
, cro
ss-
com
plia
nce
mea
sure
s, pu
blic
ity a
nd th
e ca
pabi
lity
of th
e ag
ricu
ltura
l sec
tor t
o ad
just
to
the
chan
ges (
Groo
t et a
l., 2
006)
.
3. A
vaila
bilit
y of
reso
urce
sSc
ore
= 2
Budg
et is
ava
ilabl
e, b
ut a
dditi
onal
act
iviti
es
requ
ire
addi
tiona
l bud
get (
mem
ber w
ater
bo
ard)
. At t
he n
atio
nal l
evel
, fun
ding
for
mea
sure
s com
es fr
om th
e ge
nera
l rev
enue
(t
ax p
ayer
s) a
nd fo
r big
mea
sure
s fro
m th
e de
lta fu
nd. A
t the
regi
onal
leve
l, th
e w
ater
Scor
e =
3 Re
loca
tion
is n
ot in
clud
ed in
bu d
get
calc
ulat
ions
of t
he p
rovi
nce
or w
ater
bo
ard,
the
actu
al co
mpe
nsat
ion
will
hav
e to
com
e fr
om th
e st
ate
(far
mer
).
Scor
e =
3 Bu
dget
is su
icie
ntly
ava
ilabl
e, b
ut m
oney
is
neve
r eno
ugh
(bre
edin
g ex
pert
at a
rese
arch
in
stitu
te o
f the
uni
vers
ity).
binnenwerk.indd 106 23-2-2016 21:55:31

Institutional context
107
boar
ds ca
n co
llect
thei
r ow
n ta
xes,
so if
the
boar
d ag
rees
on
thei
r inv
olve
men
t and
the
nece
ssity
of a
mea
sure
, it i
s pos
sibl
e to
get
fu
ndin
g th
roug
h th
eir o
wn
taxi
ng p
ower
in
addi
tion
to n
atio
nal f
undi
ng (p
olic
y-m
aker
M
inist
ry o
f Inf
rast
ruct
ure
and
Envi
ronm
ent)
.
4. P
oliti
cal c
ontin
uity
Scor
e =
0 N
eith
er ch
ange
s in
the
cabi
net n
or in
the
wat
er b
oard
hav
e af
fect
ed b
udge
t for
wat
er
man
agem
ent.
Budg
et a
lloca
tion
is d
rive
n by
pr
actic
al re
ason
s or n
eeds
(mem
ber f
arm
ers’
orga
niza
tion
LTO)
.
Scor
e =
0 So
far n
o ev
iden
ce (P
rovi
ncia
l ad
min
istra
tion,
mem
ber w
ater
boa
rd )
Scor
e =
1 N
o in
fluen
ce so
far o
bser
ved
(bre
edin
g ex
pert
at
a re
sear
ch in
stitu
te o
f the
uni
vers
ity).
But
any
mom
ent s
ome
inst
ruct
ions
cou
ld b
e se
nt
from
abo
ve (s
ecre
tary
of t
he p
rovi
ncia
l boa
rd
of fa
rmer
s’ or
gani
zatio
n).
5.H
eter
ogen
eity
/frag
men
tatio
n of
act
ors’
inte
rest
sSc
ore
= 3
Smal
l pos
sibi
lity
of c
onfli
ct w
ith o
ther
se
ctor
s (m
embe
r far
mer
s’ or
gani
zatio
n LT
O),
diffe
rent
use
rs d
ecid
e to
geth
er o
n th
e w
ater
m
anag
emen
t iss
ues (
farm
er, m
embe
r wat
er
boar
d).
Scor
e =
5 Ve
ry p
robl
emat
ic is
sue
due
to d
iffer
ent
inte
rest
s of p
artie
s inv
olve
d (P
rovi
ncia
l ad
min
istra
tion,
Gro
ot e
t al.,
200
6).
Scor
e =
3 Ri
valr
y ca
n co
me
from
com
petin
g co
mpa
nies
, bu
t the
y pu
rsue
thei
r goa
ls –
to o
btai
n a
bette
r va
riet
y (b
reed
ing
expe
rt a
t a re
sear
ch in
stitu
te
of th
e un
iver
sity)
.
6. E
xper
ienc
es w
ith
deve
lopi
ng a
nd in
trodu
cing
th
e m
easu
re
Scor
e =
1 N
L ha
s a p
rofo
und
reco
rd a
s to
achi
evem
ents
in w
ater
man
agem
ent (
Delta
Co
mm
issio
n). I
n ge
nera
l ind
eed,
but
no
wad
ays t
here
are
man
y ne
w te
chni
ques
, e.
g. w
ater
leve
l dri
ven
drai
nage
of c
limat
e-ad
aptiv
e dr
aina
ge, w
hich
peo
ple
here
are
le
ss fa
mili
ar w
ith (s
ecre
tary
of t
he p
rovi
ncia
l bo
ard
of fa
rmer
s’ or
gani
zatio
n).
Scor
e =
2 Th
ere
is so
me
expe
rien
ce in
the
past
, but
it
alw
ays r
emai
ns a
uni
que
case
(Pro
vinc
ial
adm
inist
ratio
n)
Scor
e =
0 N
L ha
s an
exce
llent
reco
rd in
bre
edin
g (P
lant
re
sear
ch In
tern
atio
nal P
RI o
f Wag
enin
gen
univ
ersit
y)
7. A
vaila
bilit
y of
info
rmat
ion
Scor
e =
1 In
form
atio
n on
the
stat
e of
wat
er re
sour
ces
for r
ural
farm
com
mun
ities
is a
cces
sibl
e (B
ergs
ma
et a
l. , 2
012)
. Som
e pa
rtic
ular
in
form
atio
n on
ada
ptat
ion
to c
limat
e ch
ange
m
ight
be
lack
ing
(fie
ld o
bser
vatio
ns)
Scor
e =
3 Li
ttle
info
rmat
ion
on re
loca
tion
is
avai
labl
e (G
root
et a
l., 2
006)
. Mig
ht b
e th
at
not a
ll fa
rmer
s hav
e ac
cess
to c
erta
in
(onl
ine)
pub
licat
ions
(fie
ld o
bser
vatio
ns).
Room
for t
he R
iver
pro
gram
me
disc
usse
s th
is is
sue.
Scor
e =
3 In
fo o
n cl
imat
e ch
ange
is so
met
imes
co
ntra
dict
ory
to re
ality
– p
roje
ctio
ns a
re to
o ex
trem
e (b
reed
ing
expe
rt a
t a re
sear
ch
inst
itute
of t
he u
nive
rsity
). In
form
atio
n on
loca
l va
riet
ies i
s not
alw
ays c
lear
(Gro
ot e
t al.,
20
06).
Chapter 5
106
App
endi
x 5.
B–
Scor
es p
er C
IP (s
core
s fro
m 0
no
cons
train
tsto
5 m
ajor
con
stra
ints
).
CIP
Mea
sure
1W
ater
man
agem
ent
Mea
sure
2R
eloc
atio
n of
farm
sM
easu
re 3
New
cro
p va
rietie
s 1.
Adm
inis
trativ
e le
vels
in
volv
ed in
the
impl
emen
tatio
n of
the
mea
sure
Scor
e =
3
Only
wat
er b
oard
and
farm
ers i
nvol
ved;
cl
ear d
istr
ibut
ion
of ta
sks (
mem
ber w
ater
bo
ard)
. The
wat
er b
oard
aim
s to
have
all
wat
er m
anag
emen
t cen
tral
ized
and
au
tom
atiz
ed, w
here
as m
any
farm
ers w
ould
pr
efer
to h
ave
a de
cent
raliz
ed sy
stem
, as
they
kno
w e
xact
ly w
hat i
s hap
peni
ng in
the
ield
(sec
reta
ry o
f the
pro
vinc
ial b
oard
of
farm
ers’
orga
niza
tion)
. In
NL
divi
sion
of
resp
onsi
bilit
ies b
etw
een
acto
rs in
wat
er
sect
or (f
arm
er-m
unic
ipal
ity-w
ater
boa
rd) i
s no
t alw
ays c
lear
( Ber
gsm
a et
al.,
2012
).
Scor
e =
4 N
o ev
iden
ce, b
ut g
iven
the
curr
ent
inst
itutio
nal s
ettin
g in
NL,
man
y la
yers
w
ould
be
invo
lved
in th
e pr
oces
s (i.e
. the
na
tiona
l and
pro
vinc
ial g
over
nmen
t, th
e w
ater
shed
) , e
spec
ially
if th
e ca
se g
oes t
o co
urt.
It is
not
cle
ar w
hich
gov
ernm
enta
l la
yer w
ould
take
the
initi
ativ
e fo
r thi
s in
terv
entio
nal m
easu
re. B
esid
es, t
he
resp
onsi
bilit
ies o
f diff
eren
t par
ties a
re n
ot
clea
rly
delin
eate
d (B
ergs
ma
et a
l., 2
012)
.
Scor
e =
3
Acto
rs in
clud
e fa
rmer
s, fa
rmer
org
aniz
atio
ns,
prod
uct b
oard
s, co
nsum
ers,
natio
nal
gove
rnm
ent,
EU a
nd re
sear
ch (G
root
et a
l., 20
06).
Depe
ndin
g on
the
size
of a
com
pany
, m
any
laye
rs w
ill b
e in
volv
ed, b
ut it
’s no
t hi
nder
ing
the
proc
ess (
bree
ding
exp
ert a
t a
rese
arch
inst
itute
of t
he u
nive
rsity
). D
iffer
ent
grou
ps ca
n ex
erci
se p
ress
ure
on th
e br
eede
rs;
Dutc
h co
nsum
er is
esp
ecia
lly v
ery
criti
cal
(sec
reta
ry o
f the
pro
vinc
ial b
oard
of f
arm
ers’
orga
niza
tion)
.
2. C
ontra
dict
ory
polic
y in
stru
men
ts a
nd ru
les
Scor
e =
1 Th
ere
are
no a
ctua
l con
trad
icto
ry p
olic
ies
(mem
ber f
arm
ers’
orga
niza
tion
LTO)
. The
re
gion
al g
over
nmen
t ado
pted
rule
s and
re
gula
tions
at h
ighe
r lev
els (
EU, n
atio
nal a
nd
prov
inci
al),
so n
o co
nlic
t. Ex
ampl
es o
f EU
legi
slat
ion
are
Wat
er F
ram
ewor
k Di
rect
ive,
th
e Bi
rds a
nd H
abita
ts D
irec
tive
and
CAP.
N
atio
nal l
egis
latio
n: th
e Du
tch
natio
nal
Wat
er P
lan
and
the
Dutc
h Sp
atia
l Pla
nnin
g Ac
t. Co
ntra
dict
ion
may
ari
se a
roun
d sp
ecii
c (a
lso
loca
tion
spec
iic)
wat
er m
anag
emen
t de
cisi
on ( w
orks
hop
FNP)
.
Scor
e =
1 N
o of
icia
l pol
icy
on re
loca
tion,
in N
L th
ere
is n
o fo
rmal
legi
slat
ion
that
obl
iges
act
ors
to in
clud
e ad
apta
tion
to th
eir a
ctiv
ities
(B
iesb
roek
et a
l., 2
011)
.
Scor
e =
4 GM
O po
licie
s may
seem
cons
trai
ning
now
, but
in
the
futu
re co
nsum
er p
refe
renc
es m
ight
ch
ange
(bre
edin
g ex
pert
at a
rese
arch
inst
itute
of
the
univ
ersit
y). I
nstit
utio
nal a
spec
ts in
clud
e na
tiona
l agr
icul
tura
l law
s, EU
CAP
, cro
ss-
com
plia
nce
mea
sure
s, pu
blic
ity a
nd th
e ca
pabi
lity
of th
e ag
ricu
ltura
l sec
tor t
o ad
just
to
the
chan
ges (
Groo
t et a
l., 2
006)
.
3. A
vaila
bilit
y of
reso
urce
sSc
ore
= 2
Budg
et is
ava
ilabl
e, b
ut a
dditi
onal
act
iviti
es
requ
ire
addi
tiona
l bud
get (
mem
ber w
ater
bo
ard)
. At t
he n
atio
nal l
evel
, fun
ding
for
mea
sure
s com
es fr
om th
e ge
nera
l rev
enue
(t
ax p
ayer
s) a
nd fo
r big
mea
sure
s fro
m th
e de
lta fu
nd. A
t the
regi
onal
leve
l, th
e w
ater
Scor
e =
3 Re
loca
tion
is n
ot in
clud
ed in
bu d
get
calc
ulat
ions
of t
he p
rovi
nce
or w
ater
bo
ard,
the
actu
al co
mpe
nsat
ion
will
hav
e to
com
e fr
om th
e st
ate
(far
mer
).
Scor
e =
3 Bu
dget
is su
icie
ntly
ava
ilabl
e, b
ut m
oney
is
neve
r eno
ugh
(bre
edin
g ex
pert
at a
rese
arch
in
stitu
te o
f the
uni
vers
ity).
binnenwerk.indd 107 23-2-2016 21:55:34

Chapter 6
Synthesis
binnenwerk.indd 108 23-2-2016 21:55:34

Chapter 6
Synthesis
binnenwerk.indd 109 23-2-2016 21:55:34

Chapter 6
110
6.1 Introduction The overall objective of this thesis is to improve climate change impact and adaptation assessment of agricultural systems by focussing on farm level adaptation and the broader context it is embedded in. This thesis is an interdisciplinary study that assesses not only the process of adaptation to climate change for agricultural systems, but also the context in which this climate change adaptation takes place.
The research questions formulated in Section 1.2 of the General Introduction (Chapter 1) have been answered in respective Chapters of the thesis. Chapter 2 presented the framework to assess farm structural change in the Dutch province Flevoland under contrasting socio-economic and climate scenarios, and described how farms of the future in Flevoland may look like. Chapter 3 assessed important farmers’ objectives and how they relate to farmers’ currently implemented practices and to preferred adaptation options. Further, this Chapter discussed how farmers’ different objectives influence the choice for farm specific adaptation measures. Chapter 4 focused on crop and farm level adaptation to climate change, with assessment of impacts of both gradual climate change and extreme weather events on farm performance. It also revealed how different farmers’ objectives would influence preferences for different adaptation measures to climate change. Chapter 5 presented a framework to assess the feasibility of implementing adaptation measures from an institutional perspective. It further provided the empirical evidence on institutional constraints for adaptive capacity to respond to climate change challenges in the case study area.
Assessment of adaptation measures to climate change of agricultural systems was central in this thesis. Table 6.1 shows an inventory of main risks and impacts of climate change on arable farming in Flevoland and of the relevant adaptation measures. Adaptation measures to climate change for Dutch agriculture have been extensively documented in de Wit et al. (2009); Wolf et al. (2010); Schaap et al. (2013), and Reidsma et al. (2015), which are all related studies within the AgriAdapt project, of which this research was also part. In AgriAdapt, quantitative studies and participatory methods were combined to assess climate change impact and adaptation (Wolf et al. 2012). Other studies that assessed climate risks and adaptation for the Netherlands, i.e. de Groot et al. (2006) and de Bruin et al. (2009), have also been exploited. As to the crops, the focus was on seed and consumption potato and seed onion, which are the main agricultural commodities, from an economic point of view, in Flevoland. The main adaptation measures relevant for agriculture in Flevoland were classified based on the climate risks and impacts, and the level of implementation. Different adaptation measures were assessed in different Chapters of this thesis.
Synthesis
111
Tab
le 6
.1 –
Ris
ks a
nd im
pact
s of c
limat
e ch
ange
on
agric
ultu
re in
Fle
vola
nd a
nd re
leva
nt a
dapt
atio
n m
easu
res1 . S
ourc
e: d
e B
ruin
et a
l. (2
009)
; de
Gro
ot e
t al
. (20
06);
de W
it et
al.
(200
9); R
eids
ma
et a
l. (2
015)
; Sch
aap
et a
l. (2
013)
; Wol
f et a
l. (2
010)
and
this
thes
is.
No
retpahc sisehT noitatne
melpmi fo leveL
serusaem noitatpad
A stcap
mI sksi
R
1 G
radu
al c
limat
e ch
ange
C
hang
e in
co
nditi
ons
for
prim
ary
prod
uctio
n
Cha
nge
sow
ing
date
C
hang
e cu
ltiva
r C
rop
Cro
p
porC
noitagirrI
2 retpahC
mraF
noitacifisrevid mraF
2 retpah
C
mraF tne
megralne ezis mraF
2 retpah
C
mraF noitacifisnetni
mraF
4 dna 2 retpahC
mraF
)porc( noitazilaiceps ni segn ahC
noitatipicerp eht ni segnah
C 2
a.
Cha
nges
in
th
e du
ratio
n an
d in
tens
ity o
f wet
and
dry
per
iods
Pe
ak w
ater
dis
char
ges o
f the
rive
r flo
ws
Impr
ovem
ent
of
wat
er
man
agem
ent
and
irrig
atio
n fa
cilit
ies
Reg
iona
l/sec
tora
l C
hapt
er 5
gnitluser kcots retaw dnuorg eht ni segnah
C
in
wat
er lo
ggin
g an
d/or
wat
er li
mita
tions
R
eloc
atio
n of
far
ms
from
the
vul
nera
ble
area
s R
egio
nal/s
ecto
ral
Cha
pter
5
b.
Hig
h in
tens
ity o
f ra
infa
ll in
spr
ing
and
autu
mn
Soil
may
be
com
e to
o w
et
for
soil
man
agem
ent
oper
atio
ns (
sow
ing,
pla
ntin
g,
culti
vatio
n or
fer
tiliz
atio
n) a
nd h
arve
stin
g w
ith h
eavy
mac
hine
ry a
nd e
quip
men
t w
ill
be d
iffic
ult
Adj
ustm
ent
of c
rop
rota
tion
sche
mes
and
tim
ing
of
plan
ting
date
s an
d ha
rves
ting
date
s
Cro
p
porC
eganiard ecafrus fo ytiliba esaercnI
mraF lios-bus fo ytilibae
mrep esaercnI
eht etadnuni
yam(
retaw
fo ssecxE
plan
tatio
n)
Wat
er st
orag
e on
farm
land
Fa
rm
fo gnittor fo ksir eht sesaercni llafniar hgiH
tube
rs in
seed
pot
ato
C
hoic
e of
cro
p va
riety
and
gen
otyp
e th
at
can
cope
with
incr
ease
d w
ater
stre
ss
Cro
p
eiteirav wen poleve
D
s w
hich
can
cop
e w
ith
incr
ease
d w
ater
stre
ss
Reg
iona
l/sec
tora
l C
hapt
er 5
sekam
dna debrutsid
si erutcurts
lioS
di
seas
es m
ore
com
mon
G
PS s
teer
ing
to p
reve
nt d
amag
e to
soi
l st
ruct
ure
Farm
eht fo
noitcerroc noitalfni
citamotu
A
mac
hine
ry ty
res
Farm
c.
R
educ
ed
rain
fall
with
hi
gh
evap
orat
ion
in su
mm
er
Less
so
il m
oist
ure
may
re
sult
in
sub-
optim
al p
lant
gro
wth
So
il m
oist
ure
cons
erva
tion
prac
tices
such
as
cons
erva
tion
tilla
ge
Cro
p
hgih gnirud
dnalmraf
no egarots
retaW
ra
infa
ll pe
riods
Fa
rm
binnenwerk.indd 110 23-2-2016 21:55:35
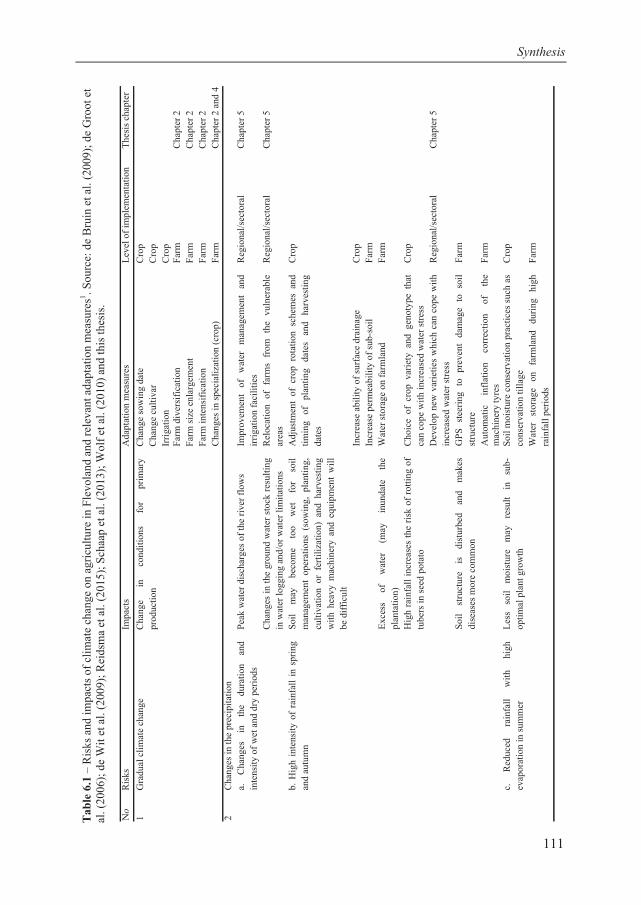
Chapter 6
110
6.1 Introduction The overall objective of this thesis is to improve climate change impact and adaptation assessment of agricultural systems by focussing on farm level adaptation and the broader context it is embedded in. This thesis is an interdisciplinary study that assesses not only the process of adaptation to climate change for agricultural systems, but also the context in which this climate change adaptation takes place.
The research questions formulated in Section 1.2 of the General Introduction (Chapter 1) have been answered in respective Chapters of the thesis. Chapter 2 presented the framework to assess farm structural change in the Dutch province Flevoland under contrasting socio-economic and climate scenarios, and described how farms of the future in Flevoland may look like. Chapter 3 assessed important farmers’ objectives and how they relate to farmers’ currently implemented practices and to preferred adaptation options. Further, this Chapter discussed how farmers’ different objectives influence the choice for farm specific adaptation measures. Chapter 4 focused on crop and farm level adaptation to climate change, with assessment of impacts of both gradual climate change and extreme weather events on farm performance. It also revealed how different farmers’ objectives would influence preferences for different adaptation measures to climate change. Chapter 5 presented a framework to assess the feasibility of implementing adaptation measures from an institutional perspective. It further provided the empirical evidence on institutional constraints for adaptive capacity to respond to climate change challenges in the case study area.
Assessment of adaptation measures to climate change of agricultural systems was central in this thesis. Table 6.1 shows an inventory of main risks and impacts of climate change on arable farming in Flevoland and of the relevant adaptation measures. Adaptation measures to climate change for Dutch agriculture have been extensively documented in de Wit et al. (2009); Wolf et al. (2010); Schaap et al. (2013), and Reidsma et al. (2015), which are all related studies within the AgriAdapt project, of which this research was also part. In AgriAdapt, quantitative studies and participatory methods were combined to assess climate change impact and adaptation (Wolf et al. 2012). Other studies that assessed climate risks and adaptation for the Netherlands, i.e. de Groot et al. (2006) and de Bruin et al. (2009), have also been exploited. As to the crops, the focus was on seed and consumption potato and seed onion, which are the main agricultural commodities, from an economic point of view, in Flevoland. The main adaptation measures relevant for agriculture in Flevoland were classified based on the climate risks and impacts, and the level of implementation. Different adaptation measures were assessed in different Chapters of this thesis.
Synthesis
111
T
able
6.1
– R
isks
and
impa
cts o
f clim
ate
chan
ge o
n ag
ricul
ture
in F
levo
land
and
rele
vant
ada
ptat
ion
mea
sure
s1 . Sou
rce:
de
Bru
in e
t al.
(200
9); d
e G
root
et
al. (
2006
); de
Wit
et a
l. (2
009)
; Rei
dsm
a et
al.
(201
5); S
chaa
p et
al.
(201
3); W
olf e
t al.
(201
0) a
nd th
is th
esis
. N
o retpahc sisehT
noitatnemelp
mi fo leveL serusae
m noitatpadA
stcapmI
sksiR
1
Gra
dual
clim
ate
chan
ge
Cha
nge
in
cond
ition
s fo
r pr
imar
y pr
oduc
tion
C
hang
e so
win
g da
te
Cha
nge
culti
var
Cro
p C
rop
por
C noitagirrI
2 retpah
C
mraF noitacifisrevid
mraF
2 retpahC
mraF
tnemegralne ezis
mraF
2 retpahC
mraF
noitacifisnetni mraF
4 dna 2 retpah
C
mraF )porc( noitazilaiceps ni segnah
C
noitatipicerp eht ni segnahC
2 a.
C
hang
es
in
the
dura
tion
and
inte
nsity
of w
et a
nd d
ry p
erio
ds
Peak
wat
er d
isch
arge
s of t
he ri
ver f
low
s Im
prov
emen
t of
w
ater
m
anag
emen
t an
d irr
igat
ion
faci
litie
s R
egio
nal/s
ecto
ral
Cha
pter
5
gnitluser kcots retaw dnuorg eht ni segnah
C
in
wat
er lo
ggin
g an
d/or
wat
er li
mita
tions
R
eloc
atio
n of
far
ms
from
the
vul
nera
ble
area
s R
egio
nal/s
ecto
ral
Cha
pter
5
b.
Hig
h in
tens
ity o
f ra
infa
ll in
spr
ing
and
autu
mn
Soil
may
be
com
e to
o w
et
for
soil
man
agem
ent
oper
atio
ns (
sow
ing,
pla
ntin
g,
culti
vatio
n or
fer
tiliz
atio
n) a
nd h
arve
stin
g w
ith h
eavy
mac
hine
ry a
nd e
quip
men
t w
ill
be d
iffic
ult
Adj
ustm
ent
of c
rop
rota
tion
sche
mes
and
tim
ing
of
plan
ting
date
s an
d ha
rves
ting
date
s
Cro
p
porC
eganiard ecafrus fo ytiliba esaercnI
mraF lios-bus fo ytilibae
mrep esaercnI
eht etadnuni
yam(
retaw
fo ssecxE
plan
tatio
n)
Wat
er st
orag
e on
farm
land
Fa
rm
fo gnittor fo ksir eht sesaercni llafniar hgiH
tube
rs in
seed
pot
ato
C
hoic
e of
cro
p va
riety
and
gen
otyp
e th
at
can
cope
with
incr
ease
d w
ater
stre
ss
Cro
p
eiteirav wen poleve
D
s w
hich
can
cop
e w
ith
incr
ease
d w
ater
stre
ss
Reg
iona
l/sec
tora
l C
hapt
er 5
sekam
dna debrutsid
si erutcurts
lioS
di
seas
es m
ore
com
mon
G
PS s
teer
ing
to p
reve
nt d
amag
e to
soi
l st
ruct
ure
Farm
eht fo
noitcerroc noitalfni
citamotu
A
mac
hine
ry ty
res
Farm
c.
R
educ
ed
rain
fall
with
hi
gh
evap
orat
ion
in su
mm
er
Less
so
il m
oist
ure
may
re
sult
in
sub-
optim
al p
lant
gro
wth
So
il m
oist
ure
cons
erva
tion
prac
tices
such
as
cons
erva
tion
tilla
ge
Cro
p
hgih gnirud
dnalmraf
no egarots
retaW
ra
infa
ll pe
riods
Fa
rm
binnenwerk.indd 111 23-2-2016 21:55:37

Chapter 6
112
Synthesis
113
The aims for this final Chapter are twofold. The first aim is to provide visions (or images) of the future of agriculture in Flevoland under contrasting, coupled socio-economic and climate change scenarios. Next, the methodological findings of the thesis will be discussed in the light of its contribution to research on adaptation of agricultural systems to climate change.
6.2 Images of the future of agriculture in Flevoland 6.2.1 General approach In Chapter 2 we defined the context of adaptation to future climate change for arable farming systems in Flevoland by assessing the contribution of different drivers to farm structural change in 2050. In the first step we identified current farm types and their distribution using a farm typology. Next, a historical analysis was performed to assess the impact of important drivers (technology, policy, market and climate change) on the farm structure. Input from stakeholders and literature review were also used to derive historical relationships between drivers and farm structural change. The outcome of this step was the relative contribution of each driver to the changes in each of the farm structural dimensions (orientation, size, intensity, specialization). In the next step, socio-economic and climate scenarios were downscaled to the regional level to explore effects of changes in the drivers and subsequent changes in farm dimensions and characteristics towards 2050. We first obtained the results on changes in farm dimensions at regional level. Subsequently, we downscaled these to the farm level using transition rules, resulting in scenarios of farm structural change. In addition, stakeholder input was used to detail the scenarios and envision the images of future farms in Flevoland (Section 2.2.3).
Contrary to a normative approach that explores the ability to achieve plausible, desired and relevant regional futures expressed by stakeholders (see e.g. Van Ittersum et al. (1998); Rounsevell and Metzger (2010); Waldhardt et al. (2010); Soliva et al. (2008)), the results of this thesis are reflecting the application of a positive approach. The projections are based on what can be expected, not on what is desired based on defined objectives. Grounded in historical data analysis, the results of Chapter 2 give projections on possible developments in drivers and in farm structural characteristics influenced by the drivers.
This analysis has been performed from the perspective of current knowledge and technology, which influenced the outcomes. Due to a long time horizon and the complex dynamics of different drivers of change, the future of agriculture around 2050 remains very uncertain. The findings of this thesis therefore reveal plausible future developments in terms of farm structural change in Flevoland. These may be similar to other regions in Northern Europe.
Chapter 6
112
Tab
le 6
.1(c
ontin
ued)
–R
isks
and
impa
cts
of c
limat
e ch
ange
on
agric
ultu
re in
Fle
vola
nd a
nd re
leva
nt a
dapt
atio
n m
easu
res1 .S
ourc
e: d
e B
ruin
et a
l. (2
009)
; de
Gro
ot e
t al.
(200
6); d
e W
it et
al.
(200
9); R
eids
ma
et a
l. (2
015)
; Sch
aap
et a
l. (2
013)
; Wol
f et a
l. (2
010)
and
this
thes
is.
Ris
ksIm
pact
sA
dapt
atio
n m
easu
res
Leve
l of i
mpl
emen
tatio
nTh
esis
cha
pter
3W
arm
an
d w
et
cond
ition
s du
ring
sum
mer
Incr
ease
the
ris
k of
out
brea
ks o
f ba
cter
ial
dise
ases
and
pes
ts,
e.g.
Erw
inia
on
seed
po
tato
Cho
ice
of c
rop
varie
ty a
nd g
enot
ype
Cro
p
Opt
imis
e nu
trien
t man
agem
ent
Cro
pD
evel
op n
ew v
arie
ties
whi
ch a
re r
esis
tant
to
the
resp
ectiv
e pe
sts a
nd d
isea
ses
Reg
iona
l/sec
tora
lC
hapt
er 5
Fung
al in
fect
ion
in se
ed o
nion
Che
mic
al p
rote
ctio
nC
rop
Cha
pter
4U
V-li
ght p
rote
ctio
nC
rop
Cha
pter
4D
evel
op n
ew v
arie
ties
whi
ch a
re r
esis
tant
to
the
resp
ectiv
e pe
sts a
nd d
isea
ses
Reg
iona
l/sec
tora
lC
hapt
er 5
4H
eat w
ave
Seco
nd g
row
thPl
ant i
n w
ider
ridg
esC
rop/
farm
Cha
pter
4Pl
ant a
nd h
arve
st e
arlie
rC
rop/
farm
Cha
pter
4D
rip ir
rigat
ion
Cro
p/fa
rmC
hapt
er 4
Opt
imis
e cr
op c
over
Cro
pC
hapt
er 4
Dev
elop
hea
t res
ista
nt v
arie
ties
Reg
iona
l/sec
tora
lC
hapt
er 5
5W
arm
win
ter
Incr
ease
the
ris
k to
spr
outin
g pr
oble
ms
in
stor
age
(par
ticul
arly
for s
eed
pota
to)
Dev
elop
new
var
ietie
s w
hich
can
cop
e w
ith
the
spro
utin
g pr
oble
mR
egio
nal/s
ecto
ral
Cha
pter
5
Air
cond
ition
ing
Cro
p/fa
rmC
hapt
er 4
Spro
utin
g co
ntro
l with
che
mic
als
Cro
p/fa
rmC
hapt
er 4
6Se
a le
vel r
ise
Incr
ease
the
ris
k of
inu
ndat
ion
and
risk
of
loss
of a
rabl
e la
ndR
eloc
atio
n of
far
ms
from
the
vul
nera
ble
area
sR
egio
nal/s
ecto
ral
Cha
pter
5
Cro
ps h
ave
to c
ope
with
hig
h sa
linity
due
to
salin
izat
ion/
salt
intru
sion
Dev
elop
new
cro
p va
rietie
s th
at c
an c
ope
with
hig
h sa
linity
Reg
iona
l/sec
tora
lC
hapt
er 5
Insu
ranc
eFa
rm
1 At c
rop
leve
l, ec
onom
ic ri
sks a
re m
uch
high
er fo
r pot
ato
com
pare
d to
cro
ps su
ch a
s sug
ar b
eet a
nd w
heat
(Sch
aap
et a
l. 20
13),
and
ther
efor
e in
clud
ed m
easu
res w
ere
limite
d to
thes
e cr
ops.
binnenwerk.indd 112 23-2-2016 21:55:37

Synthesis
113
The aims for this final Chapter are twofold. The first aim is to provide visions (or images) of the future of agriculture in Flevoland under contrasting, coupled socio-economic and climate change scenarios. Next, the methodological findings of the thesis will be discussed in the light of its contribution to research on adaptation of agricultural systems to climate change.
6.2 Images of the future of agriculture in Flevoland 6.2.1 General approach In Chapter 2 we defined the context of adaptation to future climate change for arable farming systems in Flevoland by assessing the contribution of different drivers to farm structural change in 2050. In the first step we identified current farm types and their distribution using a farm typology. Next, a historical analysis was performed to assess the impact of important drivers (technology, policy, market and climate change) on the farm structure. Input from stakeholders and literature review were also used to derive historical relationships between drivers and farm structural change. The outcome of this step was the relative contribution of each driver to the changes in each of the farm structural dimensions (orientation, size, intensity, specialization). In the next step, socio-economic and climate scenarios were downscaled to the regional level to explore effects of changes in the drivers and subsequent changes in farm dimensions and characteristics towards 2050. We first obtained the results on changes in farm dimensions at regional level. Subsequently, we downscaled these to the farm level using transition rules, resulting in scenarios of farm structural change. In addition, stakeholder input was used to detail the scenarios and envision the images of future farms in Flevoland (Section 2.2.3).
Contrary to a normative approach that explores the ability to achieve plausible, desired and relevant regional futures expressed by stakeholders (see e.g. Van Ittersum et al. (1998); Rounsevell and Metzger (2010); Waldhardt et al. (2010); Soliva et al. (2008)), the results of this thesis are reflecting the application of a positive approach. The projections are based on what can be expected, not on what is desired based on defined objectives. Grounded in historical data analysis, the results of Chapter 2 give projections on possible developments in drivers and in farm structural characteristics influenced by the drivers.
This analysis has been performed from the perspective of current knowledge and technology, which influenced the outcomes. Due to a long time horizon and the complex dynamics of different drivers of change, the future of agriculture around 2050 remains very uncertain. The findings of this thesis therefore reveal plausible future developments in terms of farm structural change in Flevoland. These may be similar to other regions in Northern Europe.
Chapter 6
112
Tab
le 6
.1(c
ontin
ued)
–R
isks
and
impa
cts
of c
limat
e ch
ange
on
agric
ultu
re in
Fle
vola
nd a
nd re
leva
nt a
dapt
atio
n m
easu
res1 .S
ourc
e: d
e B
ruin
et a
l. (2
009)
; de
Gro
ot e
t al.
(200
6); d
e W
it et
al.
(200
9); R
eids
ma
et a
l. (2
015)
; Sch
aap
et a
l. (2
013)
; Wol
f et a
l. (2
010)
and
this
thes
is.
Ris
ksIm
pact
sA
dapt
atio
n m
easu
res
Leve
l of i
mpl
emen
tatio
nTh
esis
cha
pter
3W
arm
an
d w
et
cond
ition
s du
ring
sum
mer
Incr
ease
the
ris
k of
out
brea
ks o
f ba
cter
ial
dise
ases
and
pes
ts,
e.g.
Erw
inia
on
seed
po
tato
Cho
ice
of c
rop
varie
ty a
nd g
enot
ype
Cro
p
Opt
imis
e nu
trien
t man
agem
ent
Cro
pD
evel
op n
ew v
arie
ties
whi
ch a
re r
esis
tant
to
the
resp
ectiv
e pe
sts a
nd d
isea
ses
Reg
iona
l/sec
tora
lC
hapt
er 5
Fung
al in
fect
ion
in se
ed o
nion
Che
mic
al p
rote
ctio
nC
rop
Cha
pter
4U
V-li
ght p
rote
ctio
nC
rop
Cha
pter
4D
evel
op n
ew v
arie
ties
whi
ch a
re r
esis
tant
to
the
resp
ectiv
e pe
sts a
nd d
isea
ses
Reg
iona
l/sec
tora
lC
hapt
er 5
4H
eat w
ave
Seco
nd g
row
thPl
ant i
n w
ider
ridg
esC
rop/
farm
Cha
pter
4Pl
ant a
nd h
arve
st e
arlie
rC
rop/
farm
Cha
pter
4D
rip ir
rigat
ion
Cro
p/fa
rmC
hapt
er 4
Opt
imis
e cr
op c
over
Cro
pC
hapt
er 4
Dev
elop
hea
t res
ista
nt v
arie
ties
Reg
iona
l/sec
tora
lC
hapt
er 5
5W
arm
win
ter
Incr
ease
the
ris
k to
spr
outin
g pr
oble
ms
in
stor
age
(par
ticul
arly
for s
eed
pota
to)
Dev
elop
new
var
ietie
s w
hich
can
cop
e w
ith
the
spro
utin
g pr
oble
mR
egio
nal/s
ecto
ral
Cha
pter
5
Air
cond
ition
ing
Cro
p/fa
rmC
hapt
er 4
Spro
utin
g co
ntro
l with
che
mic
als
Cro
p/fa
rmC
hapt
er 4
6Se
a le
vel r
ise
Incr
ease
the
ris
k of
inu
ndat
ion
and
risk
of
loss
of a
rabl
e la
ndR
eloc
atio
n of
far
ms
from
the
vul
nera
ble
area
sR
egio
nal/s
ecto
ral
Cha
pter
5
Cro
ps h
ave
to c
ope
with
hig
h sa
linity
due
to
salin
izat
ion/
salt
intru
sion
Dev
elop
new
cro
p va
rietie
s th
at c
an c
ope
with
hig
h sa
linity
Reg
iona
l/sec
tora
lC
hapt
er 5
Insu
ranc
eFa
rm
1 At c
rop
leve
l, ec
onom
ic ri
sks a
re m
uch
high
er fo
r pot
ato
com
pare
d to
cro
ps su
ch a
s sug
ar b
eet a
nd w
heat
(Sch
aap
et a
l. 20
13),
and
ther
efor
e in
clud
ed m
easu
res w
ere
limite
d to
thes
e cr
ops.
binnenwerk.indd 113 23-2-2016 21:55:37

Chapter 6
114
6.2.2 Scenarios of farm structural change We used two plausible contrasting scenarios regarding future climate and socio-economic change to assess future farm structural change. For assessing impacts of climate change towards 2050 we used scenarios from the Royal Dutch Meteorology Institute (KNMI) (van den Hurk et al. 2006). The G climate scenario assumes a moderate global temperature increase of 1°C by 2050, whereas the W scenario assumes a significant global temperature increase of 2°C by 2050. The climate change scenarios also differ in terms of atmospheric circulation. In Chapter 2 we did not consider the magnitude in change of atmospheric circulation in the W scenario. In Chapter 4 we used the W+ scenario, including change in atmospheric circulation resulting in drier summers and more extreme weather events. CO2 concentrations were assumed 478 mol CO2 mol-1 for the G scenario and 567 mol CO2 mol-1 for the W+ scenario in Chapter 4.
To account for possible future trends in socio-economic developments, we used scenarios A1 Global Economy and B2 Regional Communities from the commonly used Dutch WLO scenarios (van Drunen and Berkhout 2008). These scenarios are adapted from Westhoek et al. (2006) for the situation in the Netherlands, and are similar to the IPCC SRES scenarios (Nakicenovic and Swart 2000). Following suggestions of Henseler et al. (2009) we assume that the more economically and globally oriented A1 scenario goes with a significant temperature increase of 2°C by 2050, i.e. the W scenario. The more environmentally and regionally oriented B2 scenario is assumed to match with a moderate temperature increase of 1°C by 2050, represented by the G scenario.
Around 2050, different pathways of socio-economic development could lead to different futures for agriculture in Flevoland (Figure 6.1). In the A1 Global Economy scenario, agricultural area in Flevoland is expected to decrease, while the number of arable farms is projected to drop by one third (Table 6.2). Crop production on remaining arable farms will be impacted by climate change. While gradual climate change will have mostly positive effect on crop yields through both gradual temperature increase and an elevated CO2 level, an increase in frequency and severity of extreme weather events will have negative impacts on crop yields. Especially heat waves in summer and warm winters may cause large damage for production of high value crops (i.e. seed and consumption potatoes and seed onions), reducing the yields by 32-52% if no adaptation takes place (see Table 4.3).
Synthesis
115
Figure 6.1 – Images of future agriculture in two scenarios, A1 Global Economy and B2 Regional Communities (van der Kolk et al. 2007). Table 6.2 – Projected changes in the main features of agriculture in Flevoland in the two scenarios
(based on Table 2.5).
Main features A1 Global Economy B2 Regional Communities
Arable land Decrease (-13%) Less decrease compared to A1 (-8%)
Number of farm Large decrease (-35%) Less decrease compared to A1 (-13%)
Average farm area, ha Large increase (+34%) Decrease (-13%)
Area root/tuber crops, % UAA1 Large decrease (-36%) Decrease (-9%)
Area vegetables Large increase (+51%) Increase (+13%)
Area flower bulbs Large increase (+60%) Increase (+15%)
Entrepreneur oriented farms Large increase Large increase
Nature oriented farms Disappear Large increase 1UAA is utilized agricultural area
The main farm type in Flevoland in this scenario is projected to be “production
oriented – very large – medium intensive – diverse: other arable”, occupying 16% of utilized agricultural area in the province. Such a farm is a large scale, capital intensive holding with a farm size of 130 ha, as projected in Chapter 2. According to the stakeholders, the farm is expected to have a considerable share of rented land in the total utilized agricultural area (up to 75%). The farm is operating in close collaboration with neighbouring farms in terms of management operations and (partial) processing of the products. Technical advances on the farm are the attributes of precision
binnenwerk.indd 114 23-2-2016 21:55:38

Chapter 6
114
6.2.2 Scenarios of farm structural change We used two plausible contrasting scenarios regarding future climate and socio-economic change to assess future farm structural change. For assessing impacts of climate change towards 2050 we used scenarios from the Royal Dutch Meteorology Institute (KNMI) (van den Hurk et al. 2006). The G climate scenario assumes a moderate global temperature increase of 1°C by 2050, whereas the W scenario assumes a significant global temperature increase of 2°C by 2050. The climate change scenarios also differ in terms of atmospheric circulation. In Chapter 2 we did not consider the magnitude in change of atmospheric circulation in the W scenario. In Chapter 4 we used the W+ scenario, including change in atmospheric circulation resulting in drier summers and more extreme weather events. CO2 concentrations were assumed 478 mol CO2 mol-1 for the G scenario and 567 mol CO2 mol-1 for the W+ scenario in Chapter 4.
To account for possible future trends in socio-economic developments, we used scenarios A1 Global Economy and B2 Regional Communities from the commonly used Dutch WLO scenarios (van Drunen and Berkhout 2008). These scenarios are adapted from Westhoek et al. (2006) for the situation in the Netherlands, and are similar to the IPCC SRES scenarios (Nakicenovic and Swart 2000). Following suggestions of Henseler et al. (2009) we assume that the more economically and globally oriented A1 scenario goes with a significant temperature increase of 2°C by 2050, i.e. the W scenario. The more environmentally and regionally oriented B2 scenario is assumed to match with a moderate temperature increase of 1°C by 2050, represented by the G scenario.
Around 2050, different pathways of socio-economic development could lead to different futures for agriculture in Flevoland (Figure 6.1). In the A1 Global Economy scenario, agricultural area in Flevoland is expected to decrease, while the number of arable farms is projected to drop by one third (Table 6.2). Crop production on remaining arable farms will be impacted by climate change. While gradual climate change will have mostly positive effect on crop yields through both gradual temperature increase and an elevated CO2 level, an increase in frequency and severity of extreme weather events will have negative impacts on crop yields. Especially heat waves in summer and warm winters may cause large damage for production of high value crops (i.e. seed and consumption potatoes and seed onions), reducing the yields by 32-52% if no adaptation takes place (see Table 4.3).
Synthesis
115
Figure 6.1 – Images of future agriculture in two scenarios, A1 Global Economy and B2 Regional Communities (van der Kolk et al. 2007). Table 6.2 – Projected changes in the main features of agriculture in Flevoland in the two scenarios
(based on Table 2.5).
Main features A1 Global Economy B2 Regional Communities
Arable land Decrease (-13%) Less decrease compared to A1 (-8%)
Number of farm Large decrease (-35%) Less decrease compared to A1 (-13%)
Average farm area, ha Large increase (+34%) Decrease (-13%)
Area root/tuber crops, % UAA1 Large decrease (-36%) Decrease (-9%)
Area vegetables Large increase (+51%) Increase (+13%)
Area flower bulbs Large increase (+60%) Increase (+15%)
Entrepreneur oriented farms Large increase Large increase
Nature oriented farms Disappear Large increase 1UAA is utilized agricultural area
The main farm type in Flevoland in this scenario is projected to be “production
oriented – very large – medium intensive – diverse: other arable”, occupying 16% of utilized agricultural area in the province. Such a farm is a large scale, capital intensive holding with a farm size of 130 ha, as projected in Chapter 2. According to the stakeholders, the farm is expected to have a considerable share of rented land in the total utilized agricultural area (up to 75%). The farm is operating in close collaboration with neighbouring farms in terms of management operations and (partial) processing of the products. Technical advances on the farm are the attributes of precision
Synthesis
115
Figure 6.1 – Images of future agriculture in two scenarios, A1 Global Economy and B2 Regional Communities (van der Kolk et al. 2007). Table 6.2 – Projected changes in the main features of agriculture in Flevoland in the two scenarios
(based on Table 2.5).
Main features A1 Global Economy B2 Regional Communities
Arable land Decrease (-13%) Less decrease compared to A1 (-8%)
Number of farm Large decrease (-35%) Less decrease compared to A1 (-13%)
Average farm area, ha Large increase (+34%) Decrease (-13%)
Area root/tuber crops, % UAA1 Large decrease (-36%) Decrease (-9%)
Area vegetables Large increase (+51%) Increase (+13%)
Area flower bulbs Large increase (+60%) Increase (+15%)
Entrepreneur oriented farms Large increase Large increase
Nature oriented farms Disappear Large increase 1UAA is utilized agricultural area
The main farm type in Flevoland in this scenario is projected to be “production
oriented – very large – medium intensive – diverse: other arable”, occupying 16% of utilized agricultural area in the province. Such a farm is a large scale, capital intensive holding with a farm size of 130 ha, as projected in Chapter 2. According to the stakeholders, the farm is expected to have a considerable share of rented land in the total utilized agricultural area (up to 75%). The farm is operating in close collaboration with neighbouring farms in terms of management operations and (partial) processing of the products. Technical advances on the farm are the attributes of precision
binnenwerk.indd 115 23-2-2016 21:55:40

Chapter 6
116
agriculture, which contribute to high labour efficiency and productivity. Seed and ware potato remain important crops, but other high value crops such as tulips and vegetables increase in importance. The area of flower bulbs was projected to increase considerably in Chapter 2 (+60%; see Table 6.2). An increase of flower bulb area in Flevoland was a likewise outcome for cropping patterns adaptation simulations in the A1/W+ scenario in Reidsma et al. (2015). At the same time, consultations with stakeholders yielded an interesting remark on cultivation of sugar beet, which could disappear due to the high competition on the global sugar market and could be replaced by vegetables such as onions and carrots. However, sugar beet is expected to profit from both gradual warming and elevated CO2 concentrations (Angulo et al. 2013; Jones et al. 2003; Maracchi et al. 2005; Olesen and Bindi 2002; Wolf et al. 2012). Using a bio-economic farm model, Kanellopoulos et al. (2014) found that under the abolishment of the sugar beet quota, a substantial increase in production of sugar beet can be expected in the A1W scenario in Flevoland. What will finally happen, will largely depend on changes in prices, and these remain uncertain (Nelson et al. 2014).
The projected changes in quantitative features of agricultural systems under B2 Regional Communities scenario in 2050 are less drastic than in the A1 Global Economy scenario (Table 2), while at the same time many new developments are expected to take place in Flevoland. In general this scenario is characterized by a higher diversity in the farming landscape with a focus on local crops and markets, more nature conservation and provision of alternative functions to the society. Due to a moderate increase in temperature, the impacts of climate change (and especially of extreme weather events) on crop yields in the G scenario will be less damaging compared to the W+ scenario.
A typical farm in the B2 scenario is projected to be multifunctional with a projected farm size of 64 ha (Chapter 2). According to the stakeholders, this farm type will mostly produce organically. The output intensity is kept to the current level through strict environmental legislation aimed at limiting growth potential of agriculture. The share of rented land on the farm could vary between 50 and 75 %. Cooperation between neighbours is strongly supported by regional development policy. Technological progress is focused on environmentally friendly production means (environmentally beneficial technology) and development of biological crop varieties. The balance between consumer demand and production supply is regionally based. A farm becomes part of a local market chain (retail, direct sells from a farm, local supermarkets). Traditional crops dominate in the arable farm specialization: consumption potato, seed potato, winter wheat, and sugar beet, under the assumption that local (national) market supports sugar beet production in the Netherlands (and particularly in Flevoland).
Synthesis
117
6.2.3 Crop and farm level adaptation Farmers in Flevoland were found to have different objectives (Chapter 3), which could determine preferences for certain adaptation measures against future extreme events in different scenarios (Chapter 4). If the main objective of a farmer is improvement of gross margin of crops, cultivating high value crops in the W+ scenario remains the best option, although adaptation measures need to be adopted, which will slightly reduce gross margin compared to the gradual climate change scenarios and slightly increase gross margin compared to the current situation. A combination of planting in wider ridges (to reduce the impact of heat waves) and air conditioning (to reduce the impact of warm winters) for seed potato and chemical protection or UV-light protection (to reduce the impact of warm and wet conditions during summer) for seed onion were found to be the most profitable measures (see Table 4.6). In the G scenario the impacts of extreme events on crop yields are less severe, so the importance of crop level adaptation is less compared to the W+ scenario. If a farmer aims to improve gross margin of crops and organic matter simultaneously, switching from grass to winter wheat would be beneficial regarding both objectives.
Crop level adaptation of existing cropping systems (e.g. changes in varieties, planting times, irrigation and residue management) has been widely assessed and acknowledged to be effective against future climate challenges (Challinor et al. 2014). Wolf et al. (2012) assessed future climate change impacts for a number of arable crops in Flevoland with and without adaptation measures (change in sowing date and cultivar); see also Reidsma et al. (2015). They found that in the A1W scenario for consumption potato climate change resulted in 11% increase without adaptation, whereas with adaptation a 20% increase in yield was projected. For onion these figures were +26% and +42%, respectively. These yield benefits with adaptation are similar to the average across crops and regions according to Porter et al. (2014). However, these studies did not consider the impacts of and adaptation to extreme events. This thesis assessed the impacts of extreme events and showed that adaptation becomes more important when the impacts of extreme events are also considered (i.e. up to 67 % yield benefits from adaptation measures compared to no adaptation can be achieved if a combination of adaptation measures against different extreme events is used; see Table 4.5).
It should be noted that crop and farm level adaptation measures were assessed in this thesis keeping technology, prices and policy constant. When considering possible changes in prices or technological development, other options may become interesting. Prices of potatoes and of other crops may vary largely over time, influencing the relative profitability. In all scenarios and on all farms, gross margins of seed and consumption potato with adaptation were less than half of those of winter carrot (see Table 5.7). Prices thus need to change a lot to change this relative difference. Adaptation towards winter carrot would be most beneficial regarding gross margin for all farms, however, we did not assess the impacts of the extreme events on winter carrot. Even without crop level adaptation, the gross margins of seed onion are higher
binnenwerk.indd 116 23-2-2016 21:55:40

Chapter 6
116
agriculture, which contribute to high labour efficiency and productivity. Seed and ware potato remain important crops, but other high value crops such as tulips and vegetables increase in importance. The area of flower bulbs was projected to increase considerably in Chapter 2 (+60%; see Table 6.2). An increase of flower bulb area in Flevoland was a likewise outcome for cropping patterns adaptation simulations in the A1/W+ scenario in Reidsma et al. (2015). At the same time, consultations with stakeholders yielded an interesting remark on cultivation of sugar beet, which could disappear due to the high competition on the global sugar market and could be replaced by vegetables such as onions and carrots. However, sugar beet is expected to profit from both gradual warming and elevated CO2 concentrations (Angulo et al. 2013; Jones et al. 2003; Maracchi et al. 2005; Olesen and Bindi 2002; Wolf et al. 2012). Using a bio-economic farm model, Kanellopoulos et al. (2014) found that under the abolishment of the sugar beet quota, a substantial increase in production of sugar beet can be expected in the A1W scenario in Flevoland. What will finally happen, will largely depend on changes in prices, and these remain uncertain (Nelson et al. 2014).
The projected changes in quantitative features of agricultural systems under B2 Regional Communities scenario in 2050 are less drastic than in the A1 Global Economy scenario (Table 2), while at the same time many new developments are expected to take place in Flevoland. In general this scenario is characterized by a higher diversity in the farming landscape with a focus on local crops and markets, more nature conservation and provision of alternative functions to the society. Due to a moderate increase in temperature, the impacts of climate change (and especially of extreme weather events) on crop yields in the G scenario will be less damaging compared to the W+ scenario.
A typical farm in the B2 scenario is projected to be multifunctional with a projected farm size of 64 ha (Chapter 2). According to the stakeholders, this farm type will mostly produce organically. The output intensity is kept to the current level through strict environmental legislation aimed at limiting growth potential of agriculture. The share of rented land on the farm could vary between 50 and 75 %. Cooperation between neighbours is strongly supported by regional development policy. Technological progress is focused on environmentally friendly production means (environmentally beneficial technology) and development of biological crop varieties. The balance between consumer demand and production supply is regionally based. A farm becomes part of a local market chain (retail, direct sells from a farm, local supermarkets). Traditional crops dominate in the arable farm specialization: consumption potato, seed potato, winter wheat, and sugar beet, under the assumption that local (national) market supports sugar beet production in the Netherlands (and particularly in Flevoland).
Synthesis
117
6.2.3 Crop and farm level adaptation Farmers in Flevoland were found to have different objectives (Chapter 3), which could determine preferences for certain adaptation measures against future extreme events in different scenarios (Chapter 4). If the main objective of a farmer is improvement of gross margin of crops, cultivating high value crops in the W+ scenario remains the best option, although adaptation measures need to be adopted, which will slightly reduce gross margin compared to the gradual climate change scenarios and slightly increase gross margin compared to the current situation. A combination of planting in wider ridges (to reduce the impact of heat waves) and air conditioning (to reduce the impact of warm winters) for seed potato and chemical protection or UV-light protection (to reduce the impact of warm and wet conditions during summer) for seed onion were found to be the most profitable measures (see Table 4.6). In the G scenario the impacts of extreme events on crop yields are less severe, so the importance of crop level adaptation is less compared to the W+ scenario. If a farmer aims to improve gross margin of crops and organic matter simultaneously, switching from grass to winter wheat would be beneficial regarding both objectives.
Crop level adaptation of existing cropping systems (e.g. changes in varieties, planting times, irrigation and residue management) has been widely assessed and acknowledged to be effective against future climate challenges (Challinor et al. 2014). Wolf et al. (2012) assessed future climate change impacts for a number of arable crops in Flevoland with and without adaptation measures (change in sowing date and cultivar); see also Reidsma et al. (2015). They found that in the A1W scenario for consumption potato climate change resulted in 11% increase without adaptation, whereas with adaptation a 20% increase in yield was projected. For onion these figures were +26% and +42%, respectively. These yield benefits with adaptation are similar to the average across crops and regions according to Porter et al. (2014). However, these studies did not consider the impacts of and adaptation to extreme events. This thesis assessed the impacts of extreme events and showed that adaptation becomes more important when the impacts of extreme events are also considered (i.e. up to 67 % yield benefits from adaptation measures compared to no adaptation can be achieved if a combination of adaptation measures against different extreme events is used; see Table 4.5).
It should be noted that crop and farm level adaptation measures were assessed in this thesis keeping technology, prices and policy constant. When considering possible changes in prices or technological development, other options may become interesting. Prices of potatoes and of other crops may vary largely over time, influencing the relative profitability. In all scenarios and on all farms, gross margins of seed and consumption potato with adaptation were less than half of those of winter carrot (see Table 5.7). Prices thus need to change a lot to change this relative difference. Adaptation towards winter carrot would be most beneficial regarding gross margin for all farms, however, we did not assess the impacts of the extreme events on winter carrot. Even without crop level adaptation, the gross margins of seed onion are higher
binnenwerk.indd 117 23-2-2016 21:55:40

Chapter 6
118
than for other crops (apart from winter carrots), and therefore switching from seed onion to other crops is not interesting from a gross margin point of view. However, in the W+ scenario the gross margin of sugar beet and chicory do come closer to those of seed onion and potatoes for several farms, thus becoming better alternative options of adaptation at farm level.
The potential for crop substitution under climate change conditions has received much less attention than research on the effect of climate and its variability on a given crop (Eyshi Rezaei et al. 2015). Elsgaard et al. (2012) analysed the effect of temperature and precipitation on crop fractions of oats, wheat and maize for Europe, and assumed that the climatic factors explaining present spatial cropping patterns might also explain changes due to climate change until 2040. Based on this assumption they calculated that the proportion of oats will decline and that the proportion of maize will increase across Europe, while the fraction of wheat will increase in northern Europe. The results of this thesis also suggest that winter wheat will remain an important crop on arable farms in Flevoland, especially if farms would aim to improve organic matter on the farm.
In Chapter 2 we showed that adaptation to future climate change will take place in the context of other important drivers, most notably technology, policy and market development. Additionally, farm structural change will determine the future composition of different farm types in the region, with most likely different adaptation preferences. In this thesis we did not assess crop and farm level adaptation measures to climate change considering the influence of important non-climatic drivers, but such analysis was performed for Flevoland in Kanellopoulos et al. (2014) and Reidsma et al. (2015). Reidsma et al. (2015) also estimated average regional impacts of climate change and other important drivers based on future farm structural change from Chapter 2. For the A1 scenario it was assessed that the abolishment of sugar beet quota and changes of future prices of agricultural inputs and outputs caused a decrease in gross margins of smaller farms (in terms of economic size), while gross margin of larger farms increased. For the B2 scenario the future price ratios between inputs and outputs were shown to be the key factors for the viability of arable farms (Kanellopoulos et al. 2014; Reidsma et al. 2015). When farms do not have sufficient income from crop production, they might diversify and search for alternative sources of income. In Chapter 2 we projected an increase in entrepreneur oriented farm types and nature oriented farm types in the B2 scenario and the studies of Kanellopoulos et al. (2014) and Reidsma et al. (2015) confirm that this will be needed. 6.2.4 Regional level adaptation At the regional level, we performed an institutional analysis for the implementation of the following important measures for the agricultural sector in Flevoland to overcome future climate challenges: improvement of water management and irrigation facilities; relocation of farms and development of new crop varieties (Chapter 5). The adaptation measure ‘improvement of water management and irrigation facilities’ appeared to be
Synthesis
119
the most feasible to implement in Flevoland from an institutional perspective. The value of institutional feasibility for this measure, indicating to what extent the implementation of the adaptation measure is feasible from an institutional perspective, pointed at fewer institutional constraints compared to the other two measures. Relocation of farms was found to be the most difficult to implement, since its value for institutional feasibility potentially indicated more constraints. The relatively high institutional feasibility of improvement of water management and irrigation facilities was implicitly assumed in Chapter 4, by using potential instead of water limited yields when assessing impacts of gradual climate change.
The importance of the regional/sectoral adaptation measures to climate change assessed in this thesis has been confirmed by stakeholders in the region during workshops and interviews and by literature review. De Bruin et al. (2009) found that water management scored highest among adaptation measures to climate change in the Netherlands, based on importance, urgency and co-benefits. Choice of crop varieties and genotypes also received high scores in the study of de Bruin et al. (2009). The choice of crop variety and genotype was considered the most important adaptation strategy to climate change in the agricultural sector (Verhagen et al. 2002). Issues related to relocation of farms (i.e. abandoning of lowland areas) received high institutional, social and technical complexity scores (de Bruin et al., 2009). Although this measure was mentioned among important ones to respond to future climate challenges at stakeholder workshops during our research, the actual implementation might be severely constrained.
Heterogeneity or fragmentation of actors’ interests and availability of resources appeared to be the main institutional constraints for implementation of adaptation measures in agricultural Flevoland (Chapter 5). This finding can have implications for policy making in the region and requires certain changes to reduce the impact of these institutional constraints. We did not assess the future institutional context and thus we can only provide an indication of what could be expected in Flevoland given different socio-economic and climate scenario logic. When climate becomes more extreme in the W+ scenario, for example, we can expect more conflicts on the issue of farm relocation from the most vulnerable areas, but also more heated debates between the water board and farmers about water management. 6.2.5 Policy implications There is a need for better information to support adaptation planning over the next few decades since this is an appropriate time horizon for considering and implementing practical and policy options to deal with climate change. The results of this thesis indicate which areas of development in Flevoland can be (better) targeted by policies or regional and national action plans:
• Chapter 2 projects an increase in entrepreneur and nature oriented farms in Flevoland. Subsidies for landscape management and multifunctional agriculture
binnenwerk.indd 118 23-2-2016 21:55:41

Chapter 6
118
than for other crops (apart from winter carrots), and therefore switching from seed onion to other crops is not interesting from a gross margin point of view. However, in the W+ scenario the gross margin of sugar beet and chicory do come closer to those of seed onion and potatoes for several farms, thus becoming better alternative options of adaptation at farm level.
The potential for crop substitution under climate change conditions has received much less attention than research on the effect of climate and its variability on a given crop (Eyshi Rezaei et al. 2015). Elsgaard et al. (2012) analysed the effect of temperature and precipitation on crop fractions of oats, wheat and maize for Europe, and assumed that the climatic factors explaining present spatial cropping patterns might also explain changes due to climate change until 2040. Based on this assumption they calculated that the proportion of oats will decline and that the proportion of maize will increase across Europe, while the fraction of wheat will increase in northern Europe. The results of this thesis also suggest that winter wheat will remain an important crop on arable farms in Flevoland, especially if farms would aim to improve organic matter on the farm.
In Chapter 2 we showed that adaptation to future climate change will take place in the context of other important drivers, most notably technology, policy and market development. Additionally, farm structural change will determine the future composition of different farm types in the region, with most likely different adaptation preferences. In this thesis we did not assess crop and farm level adaptation measures to climate change considering the influence of important non-climatic drivers, but such analysis was performed for Flevoland in Kanellopoulos et al. (2014) and Reidsma et al. (2015). Reidsma et al. (2015) also estimated average regional impacts of climate change and other important drivers based on future farm structural change from Chapter 2. For the A1 scenario it was assessed that the abolishment of sugar beet quota and changes of future prices of agricultural inputs and outputs caused a decrease in gross margins of smaller farms (in terms of economic size), while gross margin of larger farms increased. For the B2 scenario the future price ratios between inputs and outputs were shown to be the key factors for the viability of arable farms (Kanellopoulos et al. 2014; Reidsma et al. 2015). When farms do not have sufficient income from crop production, they might diversify and search for alternative sources of income. In Chapter 2 we projected an increase in entrepreneur oriented farm types and nature oriented farm types in the B2 scenario and the studies of Kanellopoulos et al. (2014) and Reidsma et al. (2015) confirm that this will be needed. 6.2.4 Regional level adaptation At the regional level, we performed an institutional analysis for the implementation of the following important measures for the agricultural sector in Flevoland to overcome future climate challenges: improvement of water management and irrigation facilities; relocation of farms and development of new crop varieties (Chapter 5). The adaptation measure ‘improvement of water management and irrigation facilities’ appeared to be
Synthesis
119
the most feasible to implement in Flevoland from an institutional perspective. The value of institutional feasibility for this measure, indicating to what extent the implementation of the adaptation measure is feasible from an institutional perspective, pointed at fewer institutional constraints compared to the other two measures. Relocation of farms was found to be the most difficult to implement, since its value for institutional feasibility potentially indicated more constraints. The relatively high institutional feasibility of improvement of water management and irrigation facilities was implicitly assumed in Chapter 4, by using potential instead of water limited yields when assessing impacts of gradual climate change.
The importance of the regional/sectoral adaptation measures to climate change assessed in this thesis has been confirmed by stakeholders in the region during workshops and interviews and by literature review. De Bruin et al. (2009) found that water management scored highest among adaptation measures to climate change in the Netherlands, based on importance, urgency and co-benefits. Choice of crop varieties and genotypes also received high scores in the study of de Bruin et al. (2009). The choice of crop variety and genotype was considered the most important adaptation strategy to climate change in the agricultural sector (Verhagen et al. 2002). Issues related to relocation of farms (i.e. abandoning of lowland areas) received high institutional, social and technical complexity scores (de Bruin et al., 2009). Although this measure was mentioned among important ones to respond to future climate challenges at stakeholder workshops during our research, the actual implementation might be severely constrained.
Heterogeneity or fragmentation of actors’ interests and availability of resources appeared to be the main institutional constraints for implementation of adaptation measures in agricultural Flevoland (Chapter 5). This finding can have implications for policy making in the region and requires certain changes to reduce the impact of these institutional constraints. We did not assess the future institutional context and thus we can only provide an indication of what could be expected in Flevoland given different socio-economic and climate scenario logic. When climate becomes more extreme in the W+ scenario, for example, we can expect more conflicts on the issue of farm relocation from the most vulnerable areas, but also more heated debates between the water board and farmers about water management. 6.2.5 Policy implications There is a need for better information to support adaptation planning over the next few decades since this is an appropriate time horizon for considering and implementing practical and policy options to deal with climate change. The results of this thesis indicate which areas of development in Flevoland can be (better) targeted by policies or regional and national action plans:
• Chapter 2 projects an increase in entrepreneur and nature oriented farms in Flevoland. Subsidies for landscape management and multifunctional agriculture
binnenwerk.indd 119 23-2-2016 21:55:41

Chapter 6
120
remain necessary to support the entrepreneur and nature oriented farms, which next to primary production will also provide additional services to society.
• In Chapter 3, soil quality was found to be one of the important objectives for farmers in Flevoland. Improvement of soil structure should receive enough support in policies and regulations. Currently it is not very popular due to high (investment) costs and a long time horizon for the expected effects. Increase of organic matter in soils could lead to more carbon sequestration, which is also a very important climate change mitigation measure.
• Chapter 4 argues that next to applying crop level adaptation measures against extreme events, farmers may also shift to alternative crops. The province should facilitate “innovation labs” for new crops (and new varieties); and adapt water management to the new crops. Locally produced food should also fit the needs of local markets.
• Chapter 5 mentions an ongoing debate between farmers and water board regarding flexibility of water management on farms. The province should stimulate farm oriented water management, following the examples of already existing initiatives, such as water level driven drainage and household level water management. The available water should be used most effectively according to the farmers’ particular needs. 6.3 Methodological contribution to assessment of adaptation of agricultural systems to climate change
Overall, this thesis performed a prospective (using scenarios), multi-scale (taking into account the crop, farm and regional level), integrated (notably multi objective) and participatory assessment, abbreviated PIAAS (Participatory Integrated Assessment of Agricultural Systems, as used in Delmotte et al. (2013)). The assessment in this thesis particularly focused on adaptation of agricultural systems to climate change. The overview of different elements of PIAAS in the thesis is given in Table 6.3.
Below we address each of the aspects of PIAAS from the thesis, with the emphasis on climate change adaptation.
Synthesis
121
Table 6.3 – Elements of PIAAS (Participatory Integrated Assessment of Agricultural Systems) in
different Chapters of the thesis.
Chapter Research focus
Prospective Integrated Multi-scale
Participatory
Chapter 2 Farm structural change
Scenarios 2050 Farm typology accounting for different farmers objectives (dimension of orientation)
Farm, region
Development of future visions of arable farming with farmers, representatives of water board and local policy makers
Chapter 3 Farmers multiple objectives
Preferable adaptation options in current situation
Multiple objectives Farm Elicitation of weights for different objectives based on farmers’ input to assess farmers’ decision-making
Chapter 4 Crop and farm level adaptation
Scenarios 2050 Multiple objectives Crop, farm
Builds on the findings of Chapter 3
Chapter 5 Institutional context
Current institutional setting
Multiple barriers to adaptation (i.e. institutional, social, financial, and informational)
Region Assessment of institutional context through ranking of crucial institutional preconditions performed by representatives of water board, provincial government, farmers’ organizations and plant breeding experts
6.3.1 Prospective: development of scenarios In Chapter 2 we presented a method to assess farm structural change at regional and farm level towards 2050, under contrasting climate and socio-economic scenarios, which was not previously performed for such a long time horizon. The analysis shows that historical trends, consistent scenario assumptions and stakeholder input can be used to derive regional and farm level estimations of farm structural change and plausible images of arable farms towards 2050. The analysis of farm structural change developed in this thesis provides a better basis for assessment of impacts of and adaptation to climate change than the current farms. When climate change impacts will be strongly manifested, the adaptation measures should be proposed to the future farms that have evolved through structural changes.
We used coupled socio-economic and climate scenarios to place climate change in the context of other important drivers, similarly to other studies on the impacts of climate change on agricultural land use ((Audsley et al. 2006; Lehtonen et al. 2006; Rounsevell et al. 2003). These coupled scenarios have been criticized by Audsley et al. (2015), with the main argument being the impossibility to compare the impact of specific factors within these scenario sets. They further explain that whether the effects observed are due to the change in rainfall, temperature, population, oil price, crop breeding or any of the other parameters of the scenario, is a matter of speculation and the what-if questions by the reader cannot be answered. In this thesis we did assess the
binnenwerk.indd 120 23-2-2016 21:55:41
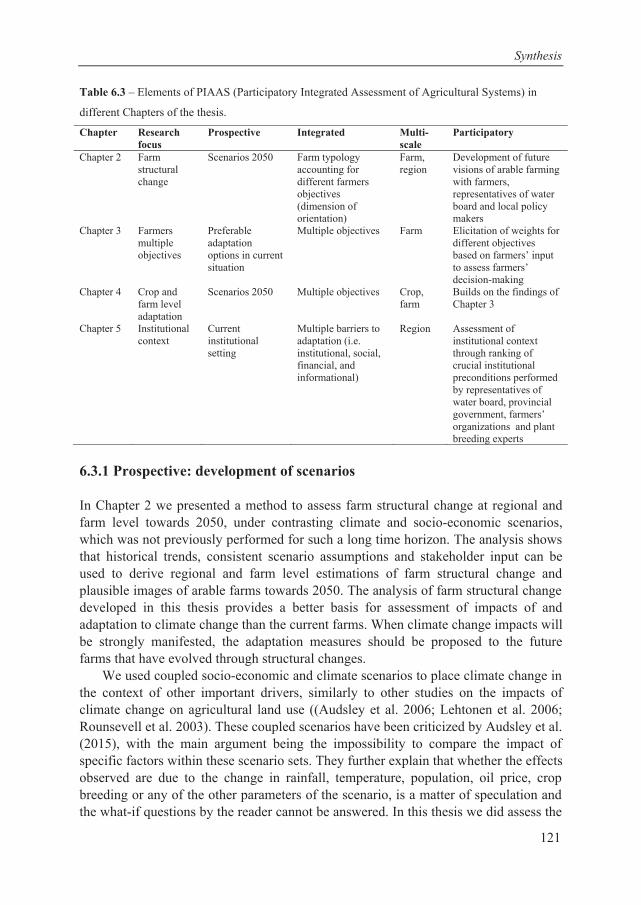
Chapter 6
120
remain necessary to support the entrepreneur and nature oriented farms, which next to primary production will also provide additional services to society.
• In Chapter 3, soil quality was found to be one of the important objectives for farmers in Flevoland. Improvement of soil structure should receive enough support in policies and regulations. Currently it is not very popular due to high (investment) costs and a long time horizon for the expected effects. Increase of organic matter in soils could lead to more carbon sequestration, which is also a very important climate change mitigation measure.
• Chapter 4 argues that next to applying crop level adaptation measures against extreme events, farmers may also shift to alternative crops. The province should facilitate “innovation labs” for new crops (and new varieties); and adapt water management to the new crops. Locally produced food should also fit the needs of local markets.
• Chapter 5 mentions an ongoing debate between farmers and water board regarding flexibility of water management on farms. The province should stimulate farm oriented water management, following the examples of already existing initiatives, such as water level driven drainage and household level water management. The available water should be used most effectively according to the farmers’ particular needs. 6.3 Methodological contribution to assessment of adaptation of agricultural systems to climate change
Overall, this thesis performed a prospective (using scenarios), multi-scale (taking into account the crop, farm and regional level), integrated (notably multi objective) and participatory assessment, abbreviated PIAAS (Participatory Integrated Assessment of Agricultural Systems, as used in Delmotte et al. (2013)). The assessment in this thesis particularly focused on adaptation of agricultural systems to climate change. The overview of different elements of PIAAS in the thesis is given in Table 6.3.
Below we address each of the aspects of PIAAS from the thesis, with the emphasis on climate change adaptation.
Synthesis
121
Table 6.3 – Elements of PIAAS (Participatory Integrated Assessment of Agricultural Systems) in
different Chapters of the thesis.
Chapter Research focus
Prospective Integrated Multi-scale
Participatory
Chapter 2 Farm structural change
Scenarios 2050 Farm typology accounting for different farmers objectives (dimension of orientation)
Farm, region
Development of future visions of arable farming with farmers, representatives of water board and local policy makers
Chapter 3 Farmers multiple objectives
Preferable adaptation options in current situation
Multiple objectives Farm Elicitation of weights for different objectives based on farmers’ input to assess farmers’ decision-making
Chapter 4 Crop and farm level adaptation
Scenarios 2050 Multiple objectives Crop, farm
Builds on the findings of Chapter 3
Chapter 5 Institutional context
Current institutional setting
Multiple barriers to adaptation (i.e. institutional, social, financial, and informational)
Region Assessment of institutional context through ranking of crucial institutional preconditions performed by representatives of water board, provincial government, farmers’ organizations and plant breeding experts
6.3.1 Prospective: development of scenarios In Chapter 2 we presented a method to assess farm structural change at regional and farm level towards 2050, under contrasting climate and socio-economic scenarios, which was not previously performed for such a long time horizon. The analysis shows that historical trends, consistent scenario assumptions and stakeholder input can be used to derive regional and farm level estimations of farm structural change and plausible images of arable farms towards 2050. The analysis of farm structural change developed in this thesis provides a better basis for assessment of impacts of and adaptation to climate change than the current farms. When climate change impacts will be strongly manifested, the adaptation measures should be proposed to the future farms that have evolved through structural changes.
We used coupled socio-economic and climate scenarios to place climate change in the context of other important drivers, similarly to other studies on the impacts of climate change on agricultural land use ((Audsley et al. 2006; Lehtonen et al. 2006; Rounsevell et al. 2003). These coupled scenarios have been criticized by Audsley et al. (2015), with the main argument being the impossibility to compare the impact of specific factors within these scenario sets. They further explain that whether the effects observed are due to the change in rainfall, temperature, population, oil price, crop breeding or any of the other parameters of the scenario, is a matter of speculation and the what-if questions by the reader cannot be answered. In this thesis we did assess the
binnenwerk.indd 121 23-2-2016 21:55:41

Chapter 6
122
contribution of different single drivers (i.e. technology, market, policy and climate change) to changes in dimensions of a farm typology (i.e. orientation, size, intensity and specialization), reflecting future farm structural change. For the quantitative analysis based on statistics we chose to work with one indicator per driver to assess the impact of each driver on farm structural change and to assess the impacts of scenario assumptions on a driver. Yet, scenarios are too complex and cannot be reflected by just one indicator per driver. Besides, in some cases the relationship between a driver and dimension was not confirmed by the statistical analyses, whereas literature review and stakeholder interactions suggested a relationship. Therefore we complemented the results based on the drivers with results based on the dimensions themselves and with literature review and stakeholders’ perspectives.
The approach used in this thesis (i.e. to assess climate change impacts and adaptation under coupled socio-economic and climate scenarios) is also followed in the most recent scenarios specifically developed for integrated impact assessments (van Vuuren and Carter 2014; van Vuuren et al. 2014). Also Wiebe et al. (2015) suggest that insight in sensitivity of climate change impacts to differences in socio-economic and emissions pathways allows assessing most efficient adaptation measures to climate change in respective combined scenarios.
At the same time, the approach that was applied in Chapter 2 in terms of socio-economic and climate scenario coupling has not been consistently applied throughout this thesis. When developing the scenarios for the assessment of future impacts of and adaptation to climate change at crop and farm levels considering extreme weather events (Chapter 4), I focused on climate change scenarios only. The assumptions regarding development of other important drivers (i.e. technology, market and policy) were left out of the study. This could have had implications for certain adaptation measures (i.e. future price changes may affect attractiveness for farmers to implement measures). Follow-up studies could perform assessment of crop and farm level adaptation measures to climate change in the future scenarios considering also non-climatic drives of change, which has partly been performed by Kanellopoulos et al. (2014) and Reidsma et al. (2015).
I did not apply scenarios to assess the future institutional context in Chapter 5, although a basis for future assessments through the analysis of the current institutional setting was provided. The framework for the assessment of institutional feasibility of adaptation measures to climate change, developed in Chapter 5, is rather flexible since it is based on importance ranks and scores for institutional constraints, both of which could be derived separately, also under future scenarios.
When discussing future dynamics of institutions, Lane and Montgomery (2014) refer to Williamson’s hierarchy (Williamson 2000), which suggests path dependency of institutions. Current institutions affect the relative power of interest groups, they determine the extent of networks, and they induce actors to invest in specialized capital. In effect, the presence of a given structure of institutions at one point in time will constrain the adoption of future institutions, policies, or technologies. Therefore,
Synthesis
123
the assessment of current institutions is crucial for understanding the future institutional context for adaptation to climate change. 6.3.2 Integrated: considering multiple objectives Chapter 3 presented a method to assess how farmers’ intentions and stated objectives are related to practical decision-making. The novelty of the approach developed in this thesis is in consideration of interrelated aspects of decision-making, as we assessed what farmers say (by deriving stated preferences in objectives from the ranking), what farmers actually do (by assessing farm current performance) and what farmers want (through selected alternative farm plans).
Janssen and van Ittersum (2007) stressed the need to better reflect actual farmer decision-making in bio-economic models. Potential heterogeneity in decision-making structure between different farms and farm types can have impact on the choice of adaptation options (Jakoby et al.2014). In previous integrated assessments for arable farms in Flevoland it was assumed that an average farm of a farm type has a single objective function (i.e. maximizing gross margin), thus no distinction has been made between objective functions of different farm types (Kanellopoulos et al. 2010; Reidsma et al. 2015). In positive mathematical programming other objectives are partly implicitly considered in the quadratic cost functions (Louhichi et al. 2010). In this thesis those other objectives were made explicit.
This thesis obtained three sets of weights for multiple objectives. However, not all weights were finally used in the follow-up study in Chapter 4. Weights recovered from the interviews would correspond to the farm plans that do not provide enough income to the farmers to be competitive. Due to a stated high priority for soil organic matter balance, such weights would correspond to farm plans with relatively high share of wheat and grass and a smaller share of high value crops, which would lead to low farm economic result. Weights recovered from current farm performance reflected the actual farmers’ decision-making and therefore appeared more suitable. However, these weights were related to the current conditions, which might change in the future (e.g. soil organic matter balance), and thus the performance weights for the objectives might change. Weights based on adaptation preferences seemed to be the best option when assessing future adaptation options to climate change.
Chapter 4 considered trade-offs between the most important objectives according to the weights derived from adaptation preferences of farmers in Chapter 3 (i.e. farm economic result and soil organic matter balance). Farm plans generated by the FarmDESIGN model were assessed accounting for possible improvement of farm performance on the most important objectives (i.e. farm economic result and soil organic matter balance). Different adaptation options (i.e. alternative farm plans including crop level adaptation measures) became interesting, depending on what objective a farmer prioritized most. Comparing the outcomes of bio-economic modelling studies using different sets of weights in extended utility functions will be useful to understand the importance of objectives for adaptation and is therefore a
binnenwerk.indd 122 23-2-2016 21:55:41

Chapter 6
122
contribution of different single drivers (i.e. technology, market, policy and climate change) to changes in dimensions of a farm typology (i.e. orientation, size, intensity and specialization), reflecting future farm structural change. For the quantitative analysis based on statistics we chose to work with one indicator per driver to assess the impact of each driver on farm structural change and to assess the impacts of scenario assumptions on a driver. Yet, scenarios are too complex and cannot be reflected by just one indicator per driver. Besides, in some cases the relationship between a driver and dimension was not confirmed by the statistical analyses, whereas literature review and stakeholder interactions suggested a relationship. Therefore we complemented the results based on the drivers with results based on the dimensions themselves and with literature review and stakeholders’ perspectives.
The approach used in this thesis (i.e. to assess climate change impacts and adaptation under coupled socio-economic and climate scenarios) is also followed in the most recent scenarios specifically developed for integrated impact assessments (van Vuuren and Carter 2014; van Vuuren et al. 2014). Also Wiebe et al. (2015) suggest that insight in sensitivity of climate change impacts to differences in socio-economic and emissions pathways allows assessing most efficient adaptation measures to climate change in respective combined scenarios.
At the same time, the approach that was applied in Chapter 2 in terms of socio-economic and climate scenario coupling has not been consistently applied throughout this thesis. When developing the scenarios for the assessment of future impacts of and adaptation to climate change at crop and farm levels considering extreme weather events (Chapter 4), I focused on climate change scenarios only. The assumptions regarding development of other important drivers (i.e. technology, market and policy) were left out of the study. This could have had implications for certain adaptation measures (i.e. future price changes may affect attractiveness for farmers to implement measures). Follow-up studies could perform assessment of crop and farm level adaptation measures to climate change in the future scenarios considering also non-climatic drives of change, which has partly been performed by Kanellopoulos et al. (2014) and Reidsma et al. (2015).
I did not apply scenarios to assess the future institutional context in Chapter 5, although a basis for future assessments through the analysis of the current institutional setting was provided. The framework for the assessment of institutional feasibility of adaptation measures to climate change, developed in Chapter 5, is rather flexible since it is based on importance ranks and scores for institutional constraints, both of which could be derived separately, also under future scenarios.
When discussing future dynamics of institutions, Lane and Montgomery (2014) refer to Williamson’s hierarchy (Williamson 2000), which suggests path dependency of institutions. Current institutions affect the relative power of interest groups, they determine the extent of networks, and they induce actors to invest in specialized capital. In effect, the presence of a given structure of institutions at one point in time will constrain the adoption of future institutions, policies, or technologies. Therefore,
Synthesis
123
the assessment of current institutions is crucial for understanding the future institutional context for adaptation to climate change. 6.3.2 Integrated: considering multiple objectives Chapter 3 presented a method to assess how farmers’ intentions and stated objectives are related to practical decision-making. The novelty of the approach developed in this thesis is in consideration of interrelated aspects of decision-making, as we assessed what farmers say (by deriving stated preferences in objectives from the ranking), what farmers actually do (by assessing farm current performance) and what farmers want (through selected alternative farm plans).
Janssen and van Ittersum (2007) stressed the need to better reflect actual farmer decision-making in bio-economic models. Potential heterogeneity in decision-making structure between different farms and farm types can have impact on the choice of adaptation options (Jakoby et al.2014). In previous integrated assessments for arable farms in Flevoland it was assumed that an average farm of a farm type has a single objective function (i.e. maximizing gross margin), thus no distinction has been made between objective functions of different farm types (Kanellopoulos et al. 2010; Reidsma et al. 2015). In positive mathematical programming other objectives are partly implicitly considered in the quadratic cost functions (Louhichi et al. 2010). In this thesis those other objectives were made explicit.
This thesis obtained three sets of weights for multiple objectives. However, not all weights were finally used in the follow-up study in Chapter 4. Weights recovered from the interviews would correspond to the farm plans that do not provide enough income to the farmers to be competitive. Due to a stated high priority for soil organic matter balance, such weights would correspond to farm plans with relatively high share of wheat and grass and a smaller share of high value crops, which would lead to low farm economic result. Weights recovered from current farm performance reflected the actual farmers’ decision-making and therefore appeared more suitable. However, these weights were related to the current conditions, which might change in the future (e.g. soil organic matter balance), and thus the performance weights for the objectives might change. Weights based on adaptation preferences seemed to be the best option when assessing future adaptation options to climate change.
Chapter 4 considered trade-offs between the most important objectives according to the weights derived from adaptation preferences of farmers in Chapter 3 (i.e. farm economic result and soil organic matter balance). Farm plans generated by the FarmDESIGN model were assessed accounting for possible improvement of farm performance on the most important objectives (i.e. farm economic result and soil organic matter balance). Different adaptation options (i.e. alternative farm plans including crop level adaptation measures) became interesting, depending on what objective a farmer prioritized most. Comparing the outcomes of bio-economic modelling studies using different sets of weights in extended utility functions will be useful to understand the importance of objectives for adaptation and is therefore a
binnenwerk.indd 123 23-2-2016 21:55:42

Chapter 6
124
recommendation for a follow-up study. Recently Kanellopoulos et al. (2015) developed an alternative method for multi-objective calibration, to use weights in future scenarios. They stated that such methods are also applicable without interactions with the decision maker (farmer). Although this will be a step forward compared to the often assumed objective of profit maximization in larger scale studies, it remains good to be aware that farmers perceive their objectives differently. 6.3.3 Multiscale: Adaptation at different levels This thesis considered adaptation measures at different levels of implementation - region, farm and crop - which enabled to assess cross-level interactions between the measures: farm and regional level (Chapter 2) and crop and farm level (Chapter 4).
Farm level adaptation generally received little attention in adaptation literature. The studies addressing farm level adaptation to climate change (e.g. Leclère et al. (2013); Klein et al. (2013); Troost and Berger (2014)) usually aggregate the results at a regional level and do not make impacts at farm level explicit. For example, Leclère et al. (2013) assessed farm level autonomous adaptation to climate change for EU-15 member states and showed that largest gains in crop gross margins were found when adopting crop management practices, rather than shifts in cropping patterns, which is also the case in the present study. In general the studies on farm level adaptation show that the adaptation allows farmers to largely benefit from the new possibilities offered by climate change, depending on the various crop responses to climate change.
Studies using bio-economic farm modelling (Janssen and van Ittersum, 2007) showed that an optimization technique can be used to evaluate different adaptation options at farm type and individual farm level and to assess the impacts of climatic, market, technological and policy changes (see e.g. Kanellopoulos et al. 2014). However, bio-economic models often use economic criteria to simulate farmers’ behaviour. Besides, often availability of capital is not taken into account as a constraint in assessments with bio-economic models, as well as farm specific variability in soil quality (Kanellopoulos et al. 2014).
In this thesis a model FarmDESIGN (Groot et al. 2012) was used, which has been developed to overcome the abovementioned limitations by coupling a bio-economic farm model that evaluates the productive, economic and environmental farm performance, to a multi-objective optimization algorithm that generates a large set of Pareto-optimal alternative farm configurations. The optimization aimed to maximize the operating profit and organic matter balance, and to minimize the labour requirement, risk and soil nitrogen losses. The model outcomes showed that trade-offs existed among various objectives, and at the same time identified a collection of alternative farm configurations that performed better for all four objectives when compared to the original farm plan. To improve climate change impact and adaptation research, farm level adaptation is needed to be better represented, as this is the level where management and decision making takes place. Both farming systems analysis and integrated assessment are needed for analysis of farm level adaptation.
Synthesis
125
Regional level adaptation was considered in the institutional analysis in Chapter 5. A method was developed to assess crucial institutional preconditions for adaptive capacity to respond to climate change challenges. The methodology is not scale dependent as it is based on stakeholder input and literature. Hence, the framework can be used to assess adaptation measures at other levels of implementation (e.g. crop, farm, nation) and in other socio-economic and bio-physical contexts, than those presented in this thesis.
6.3.4 Participatory: involvement of stakeholders The methodological framework of this thesis facilitated participatory research by creating space to discuss assumptions, methods developed for the assessment and results with the stakeholders. This thesis therefore widely used contextual knowledge (i.e. stakeholder workshops and interviews with farmers from the case study area; see also Table 6.3), which enhanced the practical value of the results.
The engagement of relevant stakeholders in any research activity on climate change adaptation is seen as a key element for generating solutions that are feasible, sustainable, legitimate and acceptable to those who have to implement and live with them (Rounsevell and Metzger 2010). In the context of adaptation to climate change and climate variability, assessments of agricultural systems require that researchers take farmers’ skills and knowledge seriously (Crane et al. (2011). According to Feola et al. (2015), while farmer behaviour is a key determinant of agricultural systems’ adaptability, too often research relies on theories and methods that do not capture the complexity of farmer behaviour. Finally, the role of decision-making by individual farmers is often studied in individual cases to determine its environmental, economic, and social effects. There have been few efforts to link across studies in a way that provides opportunities to better understand empirical farmer behaviour, design effective adaptation and sustainable agriculture policies, and be able to aggregate from case studies to a broader level. The research networks AgMIP and MACSUR have recently committed to address these challenges (see Bindi et al. 2015).
At the same time, in climate change adaptation research, highly complex computer models are often developed and used, which increases the challenge of translation of qualitative statements to quantitative model input and hinders the communication of results to the stakeholders (see Gramberger et al. 2015; Kok et al. 2015). In this thesis I deliberately chose to use a model (FarmDESIGN; Groot et al., 2012) developed to facilitate presentation and discussion of the simulation results with farmers. The model demonstrated the usefulness of multi-objective optimization in the design of mixed farming systems in several cases (Groot et al. 2012). Due to possibility of rapid inspection of the farm configurations (crops areas, animal numbers, manure application, etc.) associated with different performance levels, the model can support the learning and decision-making processes of farmers and advisers.
binnenwerk.indd 124 23-2-2016 21:55:42

Chapter 6
124
recommendation for a follow-up study. Recently Kanellopoulos et al. (2015) developed an alternative method for multi-objective calibration, to use weights in future scenarios. They stated that such methods are also applicable without interactions with the decision maker (farmer). Although this will be a step forward compared to the often assumed objective of profit maximization in larger scale studies, it remains good to be aware that farmers perceive their objectives differently. 6.3.3 Multiscale: Adaptation at different levels This thesis considered adaptation measures at different levels of implementation - region, farm and crop - which enabled to assess cross-level interactions between the measures: farm and regional level (Chapter 2) and crop and farm level (Chapter 4).
Farm level adaptation generally received little attention in adaptation literature. The studies addressing farm level adaptation to climate change (e.g. Leclère et al. (2013); Klein et al. (2013); Troost and Berger (2014)) usually aggregate the results at a regional level and do not make impacts at farm level explicit. For example, Leclère et al. (2013) assessed farm level autonomous adaptation to climate change for EU-15 member states and showed that largest gains in crop gross margins were found when adopting crop management practices, rather than shifts in cropping patterns, which is also the case in the present study. In general the studies on farm level adaptation show that the adaptation allows farmers to largely benefit from the new possibilities offered by climate change, depending on the various crop responses to climate change.
Studies using bio-economic farm modelling (Janssen and van Ittersum, 2007) showed that an optimization technique can be used to evaluate different adaptation options at farm type and individual farm level and to assess the impacts of climatic, market, technological and policy changes (see e.g. Kanellopoulos et al. 2014). However, bio-economic models often use economic criteria to simulate farmers’ behaviour. Besides, often availability of capital is not taken into account as a constraint in assessments with bio-economic models, as well as farm specific variability in soil quality (Kanellopoulos et al. 2014).
In this thesis a model FarmDESIGN (Groot et al. 2012) was used, which has been developed to overcome the abovementioned limitations by coupling a bio-economic farm model that evaluates the productive, economic and environmental farm performance, to a multi-objective optimization algorithm that generates a large set of Pareto-optimal alternative farm configurations. The optimization aimed to maximize the operating profit and organic matter balance, and to minimize the labour requirement, risk and soil nitrogen losses. The model outcomes showed that trade-offs existed among various objectives, and at the same time identified a collection of alternative farm configurations that performed better for all four objectives when compared to the original farm plan. To improve climate change impact and adaptation research, farm level adaptation is needed to be better represented, as this is the level where management and decision making takes place. Both farming systems analysis and integrated assessment are needed for analysis of farm level adaptation.
Synthesis
125
Regional level adaptation was considered in the institutional analysis in Chapter 5. A method was developed to assess crucial institutional preconditions for adaptive capacity to respond to climate change challenges. The methodology is not scale dependent as it is based on stakeholder input and literature. Hence, the framework can be used to assess adaptation measures at other levels of implementation (e.g. crop, farm, nation) and in other socio-economic and bio-physical contexts, than those presented in this thesis.
6.3.4 Participatory: involvement of stakeholders The methodological framework of this thesis facilitated participatory research by creating space to discuss assumptions, methods developed for the assessment and results with the stakeholders. This thesis therefore widely used contextual knowledge (i.e. stakeholder workshops and interviews with farmers from the case study area; see also Table 6.3), which enhanced the practical value of the results.
The engagement of relevant stakeholders in any research activity on climate change adaptation is seen as a key element for generating solutions that are feasible, sustainable, legitimate and acceptable to those who have to implement and live with them (Rounsevell and Metzger 2010). In the context of adaptation to climate change and climate variability, assessments of agricultural systems require that researchers take farmers’ skills and knowledge seriously (Crane et al. (2011). According to Feola et al. (2015), while farmer behaviour is a key determinant of agricultural systems’ adaptability, too often research relies on theories and methods that do not capture the complexity of farmer behaviour. Finally, the role of decision-making by individual farmers is often studied in individual cases to determine its environmental, economic, and social effects. There have been few efforts to link across studies in a way that provides opportunities to better understand empirical farmer behaviour, design effective adaptation and sustainable agriculture policies, and be able to aggregate from case studies to a broader level. The research networks AgMIP and MACSUR have recently committed to address these challenges (see Bindi et al. 2015).
At the same time, in climate change adaptation research, highly complex computer models are often developed and used, which increases the challenge of translation of qualitative statements to quantitative model input and hinders the communication of results to the stakeholders (see Gramberger et al. 2015; Kok et al. 2015). In this thesis I deliberately chose to use a model (FarmDESIGN; Groot et al., 2012) developed to facilitate presentation and discussion of the simulation results with farmers. The model demonstrated the usefulness of multi-objective optimization in the design of mixed farming systems in several cases (Groot et al. 2012). Due to possibility of rapid inspection of the farm configurations (crops areas, animal numbers, manure application, etc.) associated with different performance levels, the model can support the learning and decision-making processes of farmers and advisers.
binnenwerk.indd 125 23-2-2016 21:55:42

Chapter 6
126
6.4 Conclusions The present thesis assessed adaptation measures to climate change of arable agricultural systems at different levels of implementation, with a focus on the farm level. Besides empirical findings on the plausible future of agriculture in Flevoland under climate change scenarios and possible adaptation measures, this thesis also contributed methodologically to the portfolio of climate change impact and adaptation assessment. The main conclusions of the thesis are summarized below.
• Integrated assessment of important drives of change towards 2050 shows that next to climate change, other important drivers (i.e. technology, market, policy) form the context of adaptation of agricultural systems to climate change at regional and farm levels.
• Historical trends, consistent scenario assumptions and stakeholder input can be used to derive regional and farm level estimations of farm structural change and plausible images of arable farms towards 2050. When climate change impacts will be strongly manifested, the adaptation measures should be proposed to future farms that have evolved through structural changes. Our estimation of farm structural change provides a proper context for assessing impacts of and adaptation to climate change in 2050 at crop and farm level.
• Farmer’s stated preferences in objectives (i.e. what farmers say) were often not reflected in actual farming practices (i.e. what farmers do). Adaptation preferences of farmers (i.e. what farmers want) largely resembled their current performance (i.e. what they do), but generally involved a move towards stated preferences (i.e. what they say).
• Although farmers in Flevoland do have more objectives (i.e. maximization of farm economic result and soil organic matter, and minimization of gross margin variance, working hours and nitrogen balance), in practical decision-making they focus on economic result maximization, while for strategic decision-making they account for soil organic matter, which is indirectly related to long term economic results.
• Gradual climate change improves farm performance in terms of farm economic result in Flevoland by 2050. The degree of improvement varies per climate change scenario and per farm, depending on the cropping pattern. At the same time, extreme events cause a considerable damage to farm economic result unless adaptation measures against extreme events are adopted.
• A combination of crop and farm level adaptation appeared to be the best option in terms of improving both farm economic result and soil organic matter balance.
• From an institutional perspective, heterogeneity of actor’s interests and lack of resources appeared to be the most constraining crucial institutional preconditions (CIPs) for adaptation measures against climate change.
Synthesis
127
• The results of this thesis enrich the choice of adaptation measures by farmers, the design of public adaptation policies, regional action plans and extension activities.
binnenwerk.indd 126 23-2-2016 21:55:42

Chapter 6
126
6.4 Conclusions The present thesis assessed adaptation measures to climate change of arable agricultural systems at different levels of implementation, with a focus on the farm level. Besides empirical findings on the plausible future of agriculture in Flevoland under climate change scenarios and possible adaptation measures, this thesis also contributed methodologically to the portfolio of climate change impact and adaptation assessment. The main conclusions of the thesis are summarized below.
• Integrated assessment of important drives of change towards 2050 shows that next to climate change, other important drivers (i.e. technology, market, policy) form the context of adaptation of agricultural systems to climate change at regional and farm levels.
• Historical trends, consistent scenario assumptions and stakeholder input can be used to derive regional and farm level estimations of farm structural change and plausible images of arable farms towards 2050. When climate change impacts will be strongly manifested, the adaptation measures should be proposed to future farms that have evolved through structural changes. Our estimation of farm structural change provides a proper context for assessing impacts of and adaptation to climate change in 2050 at crop and farm level.
• Farmer’s stated preferences in objectives (i.e. what farmers say) were often not reflected in actual farming practices (i.e. what farmers do). Adaptation preferences of farmers (i.e. what farmers want) largely resembled their current performance (i.e. what they do), but generally involved a move towards stated preferences (i.e. what they say).
• Although farmers in Flevoland do have more objectives (i.e. maximization of farm economic result and soil organic matter, and minimization of gross margin variance, working hours and nitrogen balance), in practical decision-making they focus on economic result maximization, while for strategic decision-making they account for soil organic matter, which is indirectly related to long term economic results.
• Gradual climate change improves farm performance in terms of farm economic result in Flevoland by 2050. The degree of improvement varies per climate change scenario and per farm, depending on the cropping pattern. At the same time, extreme events cause a considerable damage to farm economic result unless adaptation measures against extreme events are adopted.
• A combination of crop and farm level adaptation appeared to be the best option in terms of improving both farm economic result and soil organic matter balance.
• From an institutional perspective, heterogeneity of actor’s interests and lack of resources appeared to be the most constraining crucial institutional preconditions (CIPs) for adaptation measures against climate change.
Synthesis
127
• The results of this thesis enrich the choice of adaptation measures by farmers, the design of public adaptation policies, regional action plans and extension activities.
binnenwerk.indd 127 23-2-2016 21:55:43

References
129
References Abildtrup J, Audsley E, Fekete-Farkas M, Giupponi C, Gylling M, Rosato P, Rounsevell M (2006) Socio-
economic scenario development for the assessment of climate change impacts on agricultural land use: a pairwise comparison approach. Environmental Science & Policy 9 (2):101-115.
Acosta LA, Klein RJ, Reidsma P, Metzger MJ, Rounsevell MD, Leemans R, Schröter D (2013) A Spatially Explicit Scenario-Driven Model of Adaptive Capacity to Global Change in Europe. Global Environmental Change 23 (5):1211-1224.
Adger WN, Arnell NW, Tompkins EL (2005) Successful adaptation to climate change across scales. Global Environmental Change 15:77-86.
Andersen E, Elbersen B, Godeschalk F, Verhoog D (2007) Farm management indicators and farm typologies as a basis for assessments in a changing policy environment. Journal of Environmental Management 82 (3):353-362.
Angulo C, Rötter R, Lock R, Enders A, Fronzek S, Ewert F (2013) Implication of crop model calibration strategies for assessing regional impacts of climate change in Europe. Agricultural and Forest Meteorology 170:32-46.
Anonymous (2009) Akkerbouw en Vollegrondsgroententeelt. Kwantitatieve informatie. Praktijkonderzoek Plant & Omgeving B.V., Wageningen.
Anonymous (2010) Communication from the Commission to the European parliament, the Council, the European Economic and Social Committee and the Committee of the Regions. The CAP towards 2020: Meeting the food, natural resources and territorial challenges of the future. Brussels.
Arts B, Leroy P, Tatenhove J (2006) Political Modernisation and Policy Arrangements: A Framework for Understanding Environmental Policy Change (Public Organization Review). Public Organization Review 6 (2):93-106.
Audsley E, Pearn KR, Simota C, Cojocaru G, Koutsidou E, Rounsevell MDA, Trnka M, Alexandrov V (2006) What can scenario modelling tell us about future European scale agricultural land use, and what not? Environmental Science & Policy 9 (2):148-162.
Audsley E, Trnka M, Sabaté S, Maspons J, Sanchez A, Sandars D, Balek J, Pearn K (2015) Interactively modelling land profitability to estimate European agricultural and forest land use under future scenarios of climate, socio-economics and adaptation. Climatic Change 128 (3-4):215-227.
Avellá L, García-Mollá M (2009) Institutional factors and technology adoption in irrigated farming in Spain: Impacts on water consumption. In: Albiac J, Dinar A (eds) The management of water quality and irrigation technologies. London.
Barlow KM, Christy BP, O’Leary GJ, Riffkin PA, Nuttall JG (2015) Simulating the impact of extreme heat and frost events on wheat crop production: A review. Field Crops Research 171:109-119.
Barraclough D, Smith P, Worrall F, Black HIJ, Bhogal A (2015) Is there an impact of climate change on soil carbon contents in England and Wales? Eur J Soil Sci 66 (3):451-462.
Bergsma E, Gupta J, Jong P (2012) Does individual responsibility increase the adaptive capacity of society? The case of local water management in the Netherlands (Climate Proofing Cities). Resources, Conservation and Recycling 64 (0):13-22.
Berkhout ED, Schipper RA, Kuyvenhoven A, Coulibaly O (2010) Does heterogeneity in goals and preferences affect efficiency? A case study of farm households in northern Nigeria. Agricultural Economics 41 (3-4):265-273.
binnenwerk.indd 128 23-2-2016 21:55:43

References
129
References Abildtrup J, Audsley E, Fekete-Farkas M, Giupponi C, Gylling M, Rosato P, Rounsevell M (2006) Socio-
economic scenario development for the assessment of climate change impacts on agricultural land use: a pairwise comparison approach. Environmental Science & Policy 9 (2):101-115.
Acosta LA, Klein RJ, Reidsma P, Metzger MJ, Rounsevell MD, Leemans R, Schröter D (2013) A Spatially Explicit Scenario-Driven Model of Adaptive Capacity to Global Change in Europe. Global Environmental Change 23 (5):1211-1224.
Adger WN, Arnell NW, Tompkins EL (2005) Successful adaptation to climate change across scales. Global Environmental Change 15:77-86.
Andersen E, Elbersen B, Godeschalk F, Verhoog D (2007) Farm management indicators and farm typologies as a basis for assessments in a changing policy environment. Journal of Environmental Management 82 (3):353-362.
Angulo C, Rötter R, Lock R, Enders A, Fronzek S, Ewert F (2013) Implication of crop model calibration strategies for assessing regional impacts of climate change in Europe. Agricultural and Forest Meteorology 170:32-46.
Anonymous (2009) Akkerbouw en Vollegrondsgroententeelt. Kwantitatieve informatie. Praktijkonderzoek Plant & Omgeving B.V., Wageningen.
Anonymous (2010) Communication from the Commission to the European parliament, the Council, the European Economic and Social Committee and the Committee of the Regions. The CAP towards 2020: Meeting the food, natural resources and territorial challenges of the future. Brussels.
Arts B, Leroy P, Tatenhove J (2006) Political Modernisation and Policy Arrangements: A Framework for Understanding Environmental Policy Change (Public Organization Review). Public Organization Review 6 (2):93-106.
Audsley E, Pearn KR, Simota C, Cojocaru G, Koutsidou E, Rounsevell MDA, Trnka M, Alexandrov V (2006) What can scenario modelling tell us about future European scale agricultural land use, and what not? Environmental Science & Policy 9 (2):148-162.
Audsley E, Trnka M, Sabaté S, Maspons J, Sanchez A, Sandars D, Balek J, Pearn K (2015) Interactively modelling land profitability to estimate European agricultural and forest land use under future scenarios of climate, socio-economics and adaptation. Climatic Change 128 (3-4):215-227.
Avellá L, García-Mollá M (2009) Institutional factors and technology adoption in irrigated farming in Spain: Impacts on water consumption. In: Albiac J, Dinar A (eds) The management of water quality and irrigation technologies. London.
Barlow KM, Christy BP, O’Leary GJ, Riffkin PA, Nuttall JG (2015) Simulating the impact of extreme heat and frost events on wheat crop production: A review. Field Crops Research 171:109-119.
Barraclough D, Smith P, Worrall F, Black HIJ, Bhogal A (2015) Is there an impact of climate change on soil carbon contents in England and Wales? Eur J Soil Sci 66 (3):451-462.
Bergsma E, Gupta J, Jong P (2012) Does individual responsibility increase the adaptive capacity of society? The case of local water management in the Netherlands (Climate Proofing Cities). Resources, Conservation and Recycling 64 (0):13-22.
Berkhout ED, Schipper RA, Kuyvenhoven A, Coulibaly O (2010) Does heterogeneity in goals and preferences affect efficiency? A case study of farm households in northern Nigeria. Agricultural Economics 41 (3-4):265-273.
binnenwerk.indd 129 23-2-2016 21:55:43

References
130
Berkhout ED, Schipper RA, Van Keulen H, Coulibaly O (2011) Heterogeneity in farmers' production decisions and its impact on soil nutrient use: Results and implications from northern Nigeria. Agricultural Systems 104 (1):63-74.
Berry PM, Rounsevell MDA, Harrison PA, Audsley E (2006) Assessing the vulnerability of agricultural land use and species to climate change and the role of policy in facilitating adaptation. Environmental Science & Policy 9 (2):189-204.
Biesbroek GR, Klostermann JM, Termeer CAM, Kabat P (2013) On the nature of barriers to climate change adaptation (Regional Environmental Change). Regional Environmental Change 13 (5):1119-1129.
Biesbroek GR, Termeer CJAM, Klostermann JEM, Kabat P (2014) Rethinking barriers to adaptation: Mechanism-based explanation of impasses in the governance of an innovative adaptation measure. Global Environmental Change 26 (0):108-118.
Biesbroek R, Klostermann J, Termeer C, Kabat P (2011) Barriers to climate change adaptation in the Netherlands. Climate Law 2 (2):181-199.
Bindi M, Olesen JE (2010) The responses of agriculture in Europe to climate change. Regional Environmental Change:1-8.
Bindi M, Palosuo T, Trnka M, Semenov M (2015) Modelling climate change impacts on crop production for food security. Climate Research 65:3-5.
Boyer M, Speelman S, Van Huylenbroeck G (2011) Institutional analysis of irrigation management in Haiti: a case study of three farmer managed schemes. Water Policy 13 (4):555.
Bradshaw B, Dolan H, Smit B (2004) Farm-level adaptation to climatic variability and change: crop diversification in the Canadian prairies. Climatic Change 67:119-141.
Bresser AHM (2005) Effecten van klimaatverandering in Nederland. Milieu en Natuur Planbureau, Bilthoven Britz W (2005) CAPRI Modelling System Documentation. Common Agricultural Policy Regional Impact
Analysis. Bonn, Germany. Brooks N, Adger WN, Kelly PM (2005) The determinants of vulnerability and adaptive capacity at the national
level and the implications for adaptation. Global Environmental Change Part A 15 (2):151-163. Burch S (2010) Transforming barriers into enablers of action on climate change: Insights from three municipal
case studies in British Columbia, Canada. Global Environmental Change 20 (2):287-297. Challinor A (2008) Towards the development of adaptation options using climate and crop yield forecasting at
seasonal to multi-decadal timescales. Environmental Science & Policy 12:453-465. Challinor AJ, Ewert F, Arnold S, Simelton E, Fraser E (2009) Crops and climate change: progress, trends, and
challenges in simulating impacts and informing adaptation. Journal of Experimental Botany 60 (10):2775-2789.
Challinor AJ, Watson J, Lobell DB, Howden SM, Smith DR, Chhetri N (2014) A meta-analysis of crop yield under climate change and adaptation. 4 (4):287-291.
Crane TA, Roncoli C, Hoogenboom G (2011) Adaptation to climate change and climate variability: The importance of understanding agriculture as performance. NJAS - Wageningen Journal of Life Sciences 57 (3–4):179-185.
Daniel F-J, Perraud D (2009) The multifunctionality of agriculture and contractual policies. A comparative analysis of France and the Netherlands. Journal of Environmental Management 90 (Supplement 2):S132-S138.
de Bruin K, Dellink RB, Ruijs A, Bolwidt L, van Buuren A, Graveland J, De Groot DS, Kuikman PJ, Reinhard S, Roetter RP, Tassone V, Verhagen A, Van Ierland EC (2009) Adapting to climate change in the
References
131
Netherlands: an inventory of climate adaptation options and ranking of alternatives. Climatic Change 95:23-45.
de Groot DS, P.J. Kuikman, M. Platteeuw, V. Tassone, J. Verhagen, Dijck SV-v (2006a) Climate adaptation in the Netherlands. Climate change scientific assessment and policy analysis. Netherlands Environmental Assessment Agency, Bilthoven.
de Groot RS, van Ierland EC, Kuikman PJ, Nillesen EEM, Platteeuw M, Tassone VC, Verhagen AJA, Verzandvoort-van Dijck S (2006b) Climate adaptation in the Netherlands. Climate change scientific assessment and policy analysis. Wageningen University, Group of Environmental Economics and Natural Resources, Wageningen, the Netherlands.
de Wit J, Swart D, Luijendijk E (2009) Klimaat en landbouw Noord-Nederland: ‘effecten van extremen’. Grontmij Nederland BV.
Delmotte S, Lopez-Ridaura S, Barbier J-M, Wery J (2013) Prospective and participatory integrated assessment of agricultural systems from farm to regional scales: Comparison of three modeling approaches. Journal of Environmental Management 129:493-502.
Dijksterhuis A, Aarts H (2010) Goals, Attention, and (Un)Consciousness. Annual Review of Psychology 61 (1):467-490.
Diogo V, Reidsma P, Schaap B, Koomen E (2014) Analysing Climate Change Impacts on Local Economic Performance of Dutch Agricultural Systems. Deltas in times of climate change, Rotterdam, The Netherlands (24–26 September, 2014).
Dockerty T, Lovett A, Appleton K, Bone A, Sünnenberg G (2006) Developing scenarios and visualisations to illustrate potential policy and climatic influences on future agricultural landscapes. Agriculture, Ecosystems & Environment 114 (1):103-120.
Dogliotti S, Rossing WAH, van Ittersum MK (2004) Systematic design and evaluation of crop rotations enhancing soil conservation, soil fertility and farm income: a case study for vegetable farms in South Uruguay. Agricultural Systems 80 (3):277-302.
Dogliotti S, Van Ittersum MK, Rossing WAH (2005) A method for exploring sustainable development options at farm scale: A case study for vegetable farms in South Uruguay. Agricultural Systems 86 (1):29-51.
Dokter H, Oppewal J (2009) Interview met minister Verburg: "Toeslagen verschuiven, maar ik weet niet hoeveel". Boerderij, vol 94.
Dury J, Schaller N, Garcia F, Reynaud A, Bergez JE (2012) Models to support cropping plan and crop rotation decisions. A review. Agronomy for Sustainable Development 32 (2):567-580.
Easterling W, Apps M (2005) Assessing the consequences of climate change for food and forest resources: A view from the IPCC. Climatic Change 70 (1-2):165-189.
Easterling WE (1996) Adapting North American agriculture to climate change in review. Agriculture and Forest Meteorology 80:1-53.
Easterling WE, Aggarwal PK, Batima P, Brander KM, Erda L, Howden SM, Kirilenko A, Morton J, Soussana J-F, Schmidhuber J, Tubiello FN (2007) Food, fibre and forest products. In: Climate Change 2007: Impacts, Adaptation and Vulnerability. Contribution of Working Group II to the Fourth Assessment Report of the Intergovernmental Panel on Climate Change. Cambridge University Press, Cambridge, pp 273-313.
Eitzinger J, Thaler S, Schmid E, Strauss F, Ferrise R, Moriondo M, Bindi M, Palosuo T, Roetter R, Kersebaum KC, Olesen JE, Patil RH, aylan L, Çaldag B, Çaylac O (2013) Sensitivities of crop models to extreme weather conditions during flowering period demonstrated for maize and winter wheat in Austria. The Journal of Agricultural Science 151 (06):813-835.
binnenwerk.indd 130 23-2-2016 21:55:43

References
130
Berkhout ED, Schipper RA, Van Keulen H, Coulibaly O (2011) Heterogeneity in farmers' production decisions and its impact on soil nutrient use: Results and implications from northern Nigeria. Agricultural Systems 104 (1):63-74.
Berry PM, Rounsevell MDA, Harrison PA, Audsley E (2006) Assessing the vulnerability of agricultural land use and species to climate change and the role of policy in facilitating adaptation. Environmental Science & Policy 9 (2):189-204.
Biesbroek GR, Klostermann JM, Termeer CAM, Kabat P (2013) On the nature of barriers to climate change adaptation (Regional Environmental Change). Regional Environmental Change 13 (5):1119-1129.
Biesbroek GR, Termeer CJAM, Klostermann JEM, Kabat P (2014) Rethinking barriers to adaptation: Mechanism-based explanation of impasses in the governance of an innovative adaptation measure. Global Environmental Change 26 (0):108-118.
Biesbroek R, Klostermann J, Termeer C, Kabat P (2011) Barriers to climate change adaptation in the Netherlands. Climate Law 2 (2):181-199.
Bindi M, Olesen JE (2010) The responses of agriculture in Europe to climate change. Regional Environmental Change:1-8.
Bindi M, Palosuo T, Trnka M, Semenov M (2015) Modelling climate change impacts on crop production for food security. Climate Research 65:3-5.
Boyer M, Speelman S, Van Huylenbroeck G (2011) Institutional analysis of irrigation management in Haiti: a case study of three farmer managed schemes. Water Policy 13 (4):555.
Bradshaw B, Dolan H, Smit B (2004) Farm-level adaptation to climatic variability and change: crop diversification in the Canadian prairies. Climatic Change 67:119-141.
Bresser AHM (2005) Effecten van klimaatverandering in Nederland. Milieu en Natuur Planbureau, Bilthoven Britz W (2005) CAPRI Modelling System Documentation. Common Agricultural Policy Regional Impact
Analysis. Bonn, Germany. Brooks N, Adger WN, Kelly PM (2005) The determinants of vulnerability and adaptive capacity at the national
level and the implications for adaptation. Global Environmental Change Part A 15 (2):151-163. Burch S (2010) Transforming barriers into enablers of action on climate change: Insights from three municipal
case studies in British Columbia, Canada. Global Environmental Change 20 (2):287-297. Challinor A (2008) Towards the development of adaptation options using climate and crop yield forecasting at
seasonal to multi-decadal timescales. Environmental Science & Policy 12:453-465. Challinor AJ, Ewert F, Arnold S, Simelton E, Fraser E (2009) Crops and climate change: progress, trends, and
challenges in simulating impacts and informing adaptation. Journal of Experimental Botany 60 (10):2775-2789.
Challinor AJ, Watson J, Lobell DB, Howden SM, Smith DR, Chhetri N (2014) A meta-analysis of crop yield under climate change and adaptation. 4 (4):287-291.
Crane TA, Roncoli C, Hoogenboom G (2011) Adaptation to climate change and climate variability: The importance of understanding agriculture as performance. NJAS - Wageningen Journal of Life Sciences 57 (3–4):179-185.
Daniel F-J, Perraud D (2009) The multifunctionality of agriculture and contractual policies. A comparative analysis of France and the Netherlands. Journal of Environmental Management 90 (Supplement 2):S132-S138.
de Bruin K, Dellink RB, Ruijs A, Bolwidt L, van Buuren A, Graveland J, De Groot DS, Kuikman PJ, Reinhard S, Roetter RP, Tassone V, Verhagen A, Van Ierland EC (2009) Adapting to climate change in the
References
131
Netherlands: an inventory of climate adaptation options and ranking of alternatives. Climatic Change 95:23-45.
de Groot DS, P.J. Kuikman, M. Platteeuw, V. Tassone, J. Verhagen, Dijck SV-v (2006a) Climate adaptation in the Netherlands. Climate change scientific assessment and policy analysis. Netherlands Environmental Assessment Agency, Bilthoven.
de Groot RS, van Ierland EC, Kuikman PJ, Nillesen EEM, Platteeuw M, Tassone VC, Verhagen AJA, Verzandvoort-van Dijck S (2006b) Climate adaptation in the Netherlands. Climate change scientific assessment and policy analysis. Wageningen University, Group of Environmental Economics and Natural Resources, Wageningen, the Netherlands.
de Wit J, Swart D, Luijendijk E (2009) Klimaat en landbouw Noord-Nederland: ‘effecten van extremen’. Grontmij Nederland BV.
Delmotte S, Lopez-Ridaura S, Barbier J-M, Wery J (2013) Prospective and participatory integrated assessment of agricultural systems from farm to regional scales: Comparison of three modeling approaches. Journal of Environmental Management 129:493-502.
Dijksterhuis A, Aarts H (2010) Goals, Attention, and (Un)Consciousness. Annual Review of Psychology 61 (1):467-490.
Diogo V, Reidsma P, Schaap B, Koomen E (2014) Analysing Climate Change Impacts on Local Economic Performance of Dutch Agricultural Systems. Deltas in times of climate change, Rotterdam, The Netherlands (24–26 September, 2014).
Dockerty T, Lovett A, Appleton K, Bone A, Sünnenberg G (2006) Developing scenarios and visualisations to illustrate potential policy and climatic influences on future agricultural landscapes. Agriculture, Ecosystems & Environment 114 (1):103-120.
Dogliotti S, Rossing WAH, van Ittersum MK (2004) Systematic design and evaluation of crop rotations enhancing soil conservation, soil fertility and farm income: a case study for vegetable farms in South Uruguay. Agricultural Systems 80 (3):277-302.
Dogliotti S, Van Ittersum MK, Rossing WAH (2005) A method for exploring sustainable development options at farm scale: A case study for vegetable farms in South Uruguay. Agricultural Systems 86 (1):29-51.
Dokter H, Oppewal J (2009) Interview met minister Verburg: "Toeslagen verschuiven, maar ik weet niet hoeveel". Boerderij, vol 94.
Dury J, Schaller N, Garcia F, Reynaud A, Bergez JE (2012) Models to support cropping plan and crop rotation decisions. A review. Agronomy for Sustainable Development 32 (2):567-580.
Easterling W, Apps M (2005) Assessing the consequences of climate change for food and forest resources: A view from the IPCC. Climatic Change 70 (1-2):165-189.
Easterling WE (1996) Adapting North American agriculture to climate change in review. Agriculture and Forest Meteorology 80:1-53.
Easterling WE, Aggarwal PK, Batima P, Brander KM, Erda L, Howden SM, Kirilenko A, Morton J, Soussana J-F, Schmidhuber J, Tubiello FN (2007) Food, fibre and forest products. In: Climate Change 2007: Impacts, Adaptation and Vulnerability. Contribution of Working Group II to the Fourth Assessment Report of the Intergovernmental Panel on Climate Change. Cambridge University Press, Cambridge, pp 273-313.
Eitzinger J, Thaler S, Schmid E, Strauss F, Ferrise R, Moriondo M, Bindi M, Palosuo T, Roetter R, Kersebaum KC, Olesen JE, Patil RH, aylan L, Çaldag B, Çaylac O (2013) Sensitivities of crop models to extreme weather conditions during flowering period demonstrated for maize and winter wheat in Austria. The Journal of Agricultural Science 151 (06):813-835.
binnenwerk.indd 131 23-2-2016 21:55:44
References
132
Elsgaard L, Børgesen CD, Olesen JE, Siebert S, Ewert F, Peltonen-Sainio P, Rötter RP, Skjelvåg AO (2012) Shifts in comparative advantages for maize, oat and wheat cropping under climate change in Europe. Food Additives & Contaminants: Part A 29 (10):1514-1526.
Engle NL (2011) Adaptive capacity and its assessment (Special Issue on The Politics and Policy of Carbon Capture and Storage). Global Environmental Change 21 (2):647-656.
Ewert F, C. Angulo, C. Rumbaur, R. Lock, A. Enders, M. Andenauer, T. Heckelei, M. van Ittersum, J. Wolf, R. Verburg, Roetter R (2011) Methodology report of Agri-ADAPT project. Part II Scenario development and assessment of the impacts of climate and market changes on crops in Europe. University of Bonn, Bonn.
Ewert F, Rounsevell MDA, Reginster I, Metzger MJ, Leemans R (2005) Future scenarios of European agricultural land use: I. Estimating changes in crop productivity. Agriculture, Ecosystems & Environment 107 (2-3):101-116.
Eyshi Rezaei E, Gaiser T, Siebert S, Ewert F (2015) Adaptation of crop production to climate change by crop substitution. Mitigation and Adaptation Strategies for Global Change 20 (7):1155-1174.
Feola G, Lerner AM, Jain M, Montefrio MJF, Nicholas KA (2015) Researching farmer behaviour in climate change adaptation and sustainable agriculture: Lessons learned from five case studies. Journal of Rural Studies 39:74-84.
Finger R, Calanca P (2011) Risk management strategies to cope with climate change in grassland production: an illustrative case study for the Swiss plateau. Regional Environmental Change 11 (4):935-949.
Gärdenäs AI, Ågren GI, Bird JA, Clarholm M, Hallin S, Ineson P, Kätterer T, Knicker H, Nilsson SI, Näsholm T, Ogle S, Paustian K, Persson T, Stendahl J (2011) Knowledge gaps in soil carbon and nitrogen interactions – From molecular to global scale. Soil Biology and Biochemistry 43 (4):702-717.
Giddens A (1981) Agency, Institution, and Time-Space Analysis. In: K. Knorr-Cetina AVC (ed) Advances in Social Theory and Methodology. Toward an Integration of Micro- and Macro-sociologies Routledge & Kegan Paul PLC, Boston, pp 161–174.
Gómez-Limón JA, Arriaza M, Riesgo L (2003) An MCDM analysis of agricultural risk aversion. European Journal of Operational Research 151 (3):569-585.
Gómez-Limón JA, Riesgo L, Arriaza M (2004) Multi-Criteria Analysis of Input Use in Agriculture. Journal of Agricultural Economics 55 (3):541-564.
Gramberger M, Zellmer K, Kok K, Metzger M (2015) Stakeholder integrated research (STIR): a new approach tested in climate change adaptation research. Climatic Change 128 (3-4):201-214.
Groot JCJ, Oomen GJM, Rossing WAH (2012) Multi-objective optimization and design of farming systems. Agricultural Systems 110 (0):63-77.
Groot JCJ, Rossing WAH (2011) Model-aided learning for adaptive management of natural resources: an evolutionary design perspective. Methods in Ecology and Evolution 2 (6):643-650.
Gupta J, Termeer C, Klostermann J, Meijerink S, van den Brink M, Jong P, Nooteboom S, Bergsma E (2010) The Adaptive Capacity Wheel: a method to assess the inherent characteristics of institutions to enable the adaptive capacity of society. Environmental Science & Policy 13 (6):459-471.
Hazell PBR, Norton RD (1986) Mathematical Programming for economic analysis in agriculture. Macmillan, New York.
Henseler M, Wirsig A, Herrmann S, Krimly T, Dabbert S (2009) Modeling the impact of global change on regional agricultural land use through an activity-based non-linear programming approach. Agricultural Systems 100 (1-3):31-42.
References
133
Hermans CML, Geijzendorffer IR, Ewert F, Metzger MJ, Vereijken PH, Woltjer GB, Verhagen A (2010) Exploring the future of European crop production in a liberalised market, with specific consideration of climate change and the regional competitiveness (Model-based Systems to Support Impact Assessment - Methods, Tools and Applications). Ecological Modelling 221 (18):2177-2187.
Holzkämper A, Klein T, Seppelt R, Fuhrer J (2015) Assessing the propagation of uncertainties in multi-objective optimization for agro-ecosystem adaptation to climate change. Environmental Modelling & Software 66 (0):27-35.
Howden MS, Soussana J-F, Tubiello FN, Chhetri N, Dunlop M, Meinke H (2007) Adapting agriculture to climate change. PNAS 104 (50):19691-19696.
Jager W, Janssen MA, De Vries HJM, De Greef J, Vlek CAJ (2000) Behaviour in commons dilemmas: Homo economicus and Homo psychologicus in an ecological-economic model. Ecological Economics 35 (3):357-379.
Janssen BH (1999) Nutrients in soil plant relationships I. Wageningen Agricultural university, Dept. Soil science and Plant Nutrition.
Janssen MA, Jager W (2001) Fashions, habits and changing preferences: Simulation of psychological factors affecting market dynamics. Journal of Economic Psychology 22 (6):745-772.
Janssen S, van Ittersum MK (2007) Assessing farm innovations and responses to policies: A review of bio-economic farm models. Agricultural Systems 94 (3):622-636.
Jones D (2011) A practical weight sensitivity algorithm for goal and multiple objective programming. European Journal of Operational Research 213 (1):238-245.
Jones PD, Lister DH, Jaggard KW, Pidgeon JD (2003) Future Climate Impact on the Productivity of Sugar Beet (Beta vulgaris L.) in Europe. Climatic Change 58 (1-2):93-108.
Jongeneel RA, Polman NBP, Slangen LHG (2008) Why are Dutch farmers going multifunctional? Land Use Policy 25 (1):81-94.
Kaiser HM, Riha SJ, Wilks DS, Rossiter DG, Sampath R (1993) A farm-level analysis of economic and agronomic impacts of gradual climate warming. American Journal of Agricultural Economics 75 (2):387-398.
Kanellopoulos A, Berentsen P, Heckelei T, Van Ittersum M, Lansink AO (2010) Assessing the Forecasting Performance of a Generic Bio-Economic Farm Model Calibrated With Two Different PMP Variants. Journal of Agricultural Economics 61 (2):274-294.
Kanellopoulos A, Gerdessen JC, Claassen GDH (2015) Compromise programming: Non-interactive calibration of utility-based metrics. European Journal of Operational Research 244 (2):519-524.
Kanellopoulos A, Reidsma P, Wolf J, van Ittersum MK (2014) Assessing climate change and associated socio-economic scenarios for arable farming in the Netherlands: An application of benchmarking and bio-economic farm modelling (Land, Climate and Resources 2020. Decision Support for Agriculture under Climate Change). European Journal of Agronomy 52, Part A (0):69-80.
Kanellopoulos A, Wolf J, Mandryk M, Reidsma P, Schaap B, Van Ittersum MK (2011) Assessing the adaptation of arable farmers to climate change using DEA and bio-economic modelling. Paper presented at the 5th World Congress of Conservation Agriculture incorporating 3rd Farming Systems Design Conference, September 2011 Brisbane, Australia.
Klein RJT, Midgley GF, Preston BL, Alam M, Berkhout FGH, Dow K, Shaw MR (2014a) Adaptation opportunities, constraints, and limits. In: Climate Change 2014: Impacts, Adaptation, and Vulnerability. Part A: Global and Sectoral Aspects. Contribution of Working Group II to the Fifth Assessment Report of
binnenwerk.indd 132 23-2-2016 21:55:44

References
132
Elsgaard L, Børgesen CD, Olesen JE, Siebert S, Ewert F, Peltonen-Sainio P, Rötter RP, Skjelvåg AO (2012) Shifts in comparative advantages for maize, oat and wheat cropping under climate change in Europe. Food Additives & Contaminants: Part A 29 (10):1514-1526.
Engle NL (2011) Adaptive capacity and its assessment (Special Issue on The Politics and Policy of Carbon Capture and Storage). Global Environmental Change 21 (2):647-656.
Ewert F, C. Angulo, C. Rumbaur, R. Lock, A. Enders, M. Andenauer, T. Heckelei, M. van Ittersum, J. Wolf, R. Verburg, Roetter R (2011) Methodology report of Agri-ADAPT project. Part II Scenario development and assessment of the impacts of climate and market changes on crops in Europe. University of Bonn, Bonn.
Ewert F, Rounsevell MDA, Reginster I, Metzger MJ, Leemans R (2005) Future scenarios of European agricultural land use: I. Estimating changes in crop productivity. Agriculture, Ecosystems & Environment 107 (2-3):101-116.
Eyshi Rezaei E, Gaiser T, Siebert S, Ewert F (2015) Adaptation of crop production to climate change by crop substitution. Mitigation and Adaptation Strategies for Global Change 20 (7):1155-1174.
Feola G, Lerner AM, Jain M, Montefrio MJF, Nicholas KA (2015) Researching farmer behaviour in climate change adaptation and sustainable agriculture: Lessons learned from five case studies. Journal of Rural Studies 39:74-84.
Finger R, Calanca P (2011) Risk management strategies to cope with climate change in grassland production: an illustrative case study for the Swiss plateau. Regional Environmental Change 11 (4):935-949.
Gärdenäs AI, Ågren GI, Bird JA, Clarholm M, Hallin S, Ineson P, Kätterer T, Knicker H, Nilsson SI, Näsholm T, Ogle S, Paustian K, Persson T, Stendahl J (2011) Knowledge gaps in soil carbon and nitrogen interactions – From molecular to global scale. Soil Biology and Biochemistry 43 (4):702-717.
Giddens A (1981) Agency, Institution, and Time-Space Analysis. In: K. Knorr-Cetina AVC (ed) Advances in Social Theory and Methodology. Toward an Integration of Micro- and Macro-sociologies Routledge & Kegan Paul PLC, Boston, pp 161–174.
Gómez-Limón JA, Arriaza M, Riesgo L (2003) An MCDM analysis of agricultural risk aversion. European Journal of Operational Research 151 (3):569-585.
Gómez-Limón JA, Riesgo L, Arriaza M (2004) Multi-Criteria Analysis of Input Use in Agriculture. Journal of Agricultural Economics 55 (3):541-564.
Gramberger M, Zellmer K, Kok K, Metzger M (2015) Stakeholder integrated research (STIR): a new approach tested in climate change adaptation research. Climatic Change 128 (3-4):201-214.
Groot JCJ, Oomen GJM, Rossing WAH (2012) Multi-objective optimization and design of farming systems. Agricultural Systems 110 (0):63-77.
Groot JCJ, Rossing WAH (2011) Model-aided learning for adaptive management of natural resources: an evolutionary design perspective. Methods in Ecology and Evolution 2 (6):643-650.
Gupta J, Termeer C, Klostermann J, Meijerink S, van den Brink M, Jong P, Nooteboom S, Bergsma E (2010) The Adaptive Capacity Wheel: a method to assess the inherent characteristics of institutions to enable the adaptive capacity of society. Environmental Science & Policy 13 (6):459-471.
Hazell PBR, Norton RD (1986) Mathematical Programming for economic analysis in agriculture. Macmillan, New York.
Henseler M, Wirsig A, Herrmann S, Krimly T, Dabbert S (2009) Modeling the impact of global change on regional agricultural land use through an activity-based non-linear programming approach. Agricultural Systems 100 (1-3):31-42.
References
133
Hermans CML, Geijzendorffer IR, Ewert F, Metzger MJ, Vereijken PH, Woltjer GB, Verhagen A (2010) Exploring the future of European crop production in a liberalised market, with specific consideration of climate change and the regional competitiveness (Model-based Systems to Support Impact Assessment - Methods, Tools and Applications). Ecological Modelling 221 (18):2177-2187.
Holzkämper A, Klein T, Seppelt R, Fuhrer J (2015) Assessing the propagation of uncertainties in multi-objective optimization for agro-ecosystem adaptation to climate change. Environmental Modelling & Software 66 (0):27-35.
Howden MS, Soussana J-F, Tubiello FN, Chhetri N, Dunlop M, Meinke H (2007) Adapting agriculture to climate change. PNAS 104 (50):19691-19696.
Jager W, Janssen MA, De Vries HJM, De Greef J, Vlek CAJ (2000) Behaviour in commons dilemmas: Homo economicus and Homo psychologicus in an ecological-economic model. Ecological Economics 35 (3):357-379.
Janssen BH (1999) Nutrients in soil plant relationships I. Wageningen Agricultural university, Dept. Soil science and Plant Nutrition.
Janssen MA, Jager W (2001) Fashions, habits and changing preferences: Simulation of psychological factors affecting market dynamics. Journal of Economic Psychology 22 (6):745-772.
Janssen S, van Ittersum MK (2007) Assessing farm innovations and responses to policies: A review of bio-economic farm models. Agricultural Systems 94 (3):622-636.
Jones D (2011) A practical weight sensitivity algorithm for goal and multiple objective programming. European Journal of Operational Research 213 (1):238-245.
Jones PD, Lister DH, Jaggard KW, Pidgeon JD (2003) Future Climate Impact on the Productivity of Sugar Beet (Beta vulgaris L.) in Europe. Climatic Change 58 (1-2):93-108.
Jongeneel RA, Polman NBP, Slangen LHG (2008) Why are Dutch farmers going multifunctional? Land Use Policy 25 (1):81-94.
Kaiser HM, Riha SJ, Wilks DS, Rossiter DG, Sampath R (1993) A farm-level analysis of economic and agronomic impacts of gradual climate warming. American Journal of Agricultural Economics 75 (2):387-398.
Kanellopoulos A, Berentsen P, Heckelei T, Van Ittersum M, Lansink AO (2010) Assessing the Forecasting Performance of a Generic Bio-Economic Farm Model Calibrated With Two Different PMP Variants. Journal of Agricultural Economics 61 (2):274-294.
Kanellopoulos A, Gerdessen JC, Claassen GDH (2015) Compromise programming: Non-interactive calibration of utility-based metrics. European Journal of Operational Research 244 (2):519-524.
Kanellopoulos A, Reidsma P, Wolf J, van Ittersum MK (2014) Assessing climate change and associated socio-economic scenarios for arable farming in the Netherlands: An application of benchmarking and bio-economic farm modelling (Land, Climate and Resources 2020. Decision Support for Agriculture under Climate Change). European Journal of Agronomy 52, Part A (0):69-80.
Kanellopoulos A, Wolf J, Mandryk M, Reidsma P, Schaap B, Van Ittersum MK (2011) Assessing the adaptation of arable farmers to climate change using DEA and bio-economic modelling. Paper presented at the 5th World Congress of Conservation Agriculture incorporating 3rd Farming Systems Design Conference, September 2011 Brisbane, Australia.
Klein RJT, Midgley GF, Preston BL, Alam M, Berkhout FGH, Dow K, Shaw MR (2014a) Adaptation opportunities, constraints, and limits. In: Climate Change 2014: Impacts, Adaptation, and Vulnerability. Part A: Global and Sectoral Aspects. Contribution of Working Group II to the Fifth Assessment Report of
binnenwerk.indd 133 23-2-2016 21:55:44

References
134
the Intergovernmental Panel on Climate Change. Cambridge University Press, Cambridge, United Kingdom and New York, NY, USA.899-943.
Klein T, Holzkämper A, Calanca P, Fuhrer J (2014b) Adaptation options under climate change for multifunctional agriculture: a simulation study for western Switzerland. Regional Environmental Change 14 (1):167-184.
Klein T, Holzkämper A, Calanca P, Seppelt R, Fuhrer J (2013) Adapting agricultural land management to climate change: a regional multi-objective optimization approach. Landscape Ecology 28 (10):2029-2047.
Kok K, Bärlund I, Flörke M, Holman I, Gramberger M, Sendzimir J, Stuch B, Zellmer K (2015) European participatory scenario development: strengthening the link between stories and models. Climatic Change 128 (3-4):187-200.
Koomen E, Kuhlman T, Groen J, Bouwman A (2005) Simulating the future of agricultural land use in the Netherlands. Tijdschrift voor Economische en Sociale Geografie 96 (2):218-224.
Lane L, Montgomery WD (2014) An institutional critique of new climate scenarios. Climatic Change 122 (3):447-458.
Leclère D, Jayet P-A, de Noblet-Ducoudré N (2013) Farm-level Autonomous Adaptation of European Agricultural Supply to Climate Change. Ecological Economics 87:1-14.
Lehmann N, Finger R, Klein T, Calanca P, Walter A (2013) Adapting crop management practices to climate change: Modeling optimal solutions at the field scale. Agricultural Systems 117 (0):55-65.
Lehtonen H, Peltola J, Sinkkonen M (2006) Co-effects of climate policy and agricultural policy on regional agricultural viability in Finland. Agricultural Systems 88 (2–3):472-493.
Louhichi K, Kanellopoulos A, Janssen S, Flichman G, Blanco M, Hengsdijk H, Heckelei T, Berentsen P, Lansink AO, Ittersum MV (2010) FSSIM, a bio-economic farm model for simulating the response of EU farming systems to agricultural and environmental policies. Agricultural Systems 103 (8):585-597.
Luo Z, Wang E, Zheng H, Baldock JA, Sun OJ, Shao Q (2015) Convergent modelling of past soil organic carbon stocks but divergent projections. Biogeosciences 12 (14):4373-4383.
Maracchi G, Sirotenko O, Bindi M (2005) Impacts of Present and Future Climate Variability on Agriculture and Forestry in the Temperate Regions: Europe. Climatic Change 70 (1-2):117-135.
Mayer DG, Rossing WAH, de Devoil P, Groot JCJ, McPhee MJ, Oltjen JW (2008) Optimal management of agricultural systems. Studies in Computational Intelligence, vol 92.
Meerburg BG, Korevaar H, Haubenhofer DK, Blom-Zandstra M, Keulen Hv (2009) The changing role of agriculture in Dutch society. Journal of Agricultural Science 147 (5):511-521.
Meinke H, Howden SM, Struik PC, Nelson R, Rodriguez D, Chapman SC (2009) Adaptation science for agriculture and natural resource management - urgency and theoretical basis. Current Opinion in Environmental Sustainability 1 (1):69-76.
Moore FC, Lobell DB (2014) Adaptation potential of European agriculture in response to climate change. Nature Climate Change 4 (7):610-614.
Moriondo M, Giannakopoulos C, Bindi M (2011) Climate change impact assessment: the role of climate extremes in crop yield simulation. Climatic Change 104 (3-4):679-701.
Moser SC, Ekstrom JA (2010) A framework to diagnose barriers to climate change adaptation. Proceedings of the National Academy of Sciences 107 (51):22026-22031.
Nakicenovic N, Swart R (2000) Emissions Scenarios. A Special Report of Working Group III of the Intergovernmental Panel on Climate Change. Cambridge University Press, Cambridge.
References
135
Nelson DR, Adger WN, Brown K (2007) Adaptation to Environmental Change: Contributions of a Resilience Framework. Annual Review of Environment and Resources 32 (1):395-419.
Nelson GC, Valin H, Sands RD, Havlík P, Ahammad H, Deryng D, Elliott J, Fujimori S, Hasegawa T, Heyhoe E, Kyle P, Von Lampe M, Lotze-Campen H, Mason d’Croz D, van Meijl H, van der Mensbrugghe D, Müller C, Popp A, Robertson R, Robinson S, Schmid E, Schmitz C, Tabeau A, Willenbockel D (2014) Climate change effects on agriculture: Economic responses to biophysical shocks. Proceedings of the National Academy of Sciences 111 (9):3274-3279.
Norby R (1994) Issues and perspectives for investigating root responses to elevated atmospheric carbon dioxide. In: Curtis P, O'Neill E, Teeri J, Zak D, Pregitzer K (eds) Belowground Responses to Rising Atmospheric CO2: Implications for Plants, Soil Biota, and Ecosystem Processes. Kluwer Academic Publishers, Dordrecht/Boston/London.
Nordström E-M, Romero C, Eriksson LO, Öhman K (2009) Aggregation of preferences in participatory forest planning with multiple criteria: an application to the urban forest in Lycksele, Sweden. Canadian Journal of Forest Research 39 (10):1979-1992.
North DC (1991) Institutions. Journal of Economic Perspectives 5 (1):97-112. O'Brien KL, Leichenko RM (2000) Double exposure: assessing the impacts of climate change within the context
of economic globalization. Global Environmental Change 10 (3):221-232. Ogle SM, Breidt FJ, Easter M, Williams S, Killian K, Paustian K (2010) Scale and uncertainty in modeled soil
organic carbon stock changes for US croplands using a process-based model. Global Change Biology 16 (2):810-822.
Olesen JE, Bindi M (2002) Consequences of climate change for European agricultural productivity, land use and policy. European Journal of Agronomy 16 (4):239-262.
Olesen JE, Trnka M, Kersebaum KC, Skjelvåg AO, Seguin B, Peltonen-Sainio P, Rossi F, Kozyra J, Micale F (2011) Impacts and adaptation of European crop production systems to climate change. European Journal of Agronomy 34 (2):96-112.
Paas W (2013) Impacts of climate and socio-economic change on economic viability and land use of dairy farms in ‘de Baakse Beek’, the Netherlands MSc thesis Wageningen university (Available online: edepot.wur.nl/264597).
Parry ML, O.F. Canziani, J.P. Palutikof, Linden PJvd, C.E. Hanson E (2007) Climate Change 2007: Impacts, Adaptation and Vulnerability. Contribution of Working Group II to the Fourth Assessment Report of the Intergovernmental Panel on Climate Change. Cambridge, UK.
Peltonen-Sainio P, Jauhiainen L, Trnka M, Olesen JE, Calanca P, Eckersten H, Eitzinger J, Gobin A, Kersebaum KC, Kozyra J, Kumar S, Marta AD, Micale F, Schaap B, Seguin B, Skjelvåg AO, Orlandini S (2010) Coincidence of variation in yield and climate in Europe. Agriculture, Ecosystems & Environment 139 (4):483-489.
Piorr A, Ungaro F, Ciancaglini A, Happe K, Sahrbacher A, Sattler C, Uthes S, Zander P (2009) Integrated assessment of future CAP policies: land use changes, spatial patterns and targeting. Environmental Science & Policy 12 (8):1122-1136.
Porter J, Xie L, Challinor A, Cochrane K, Howden M, Iqbal M, Lobell DB, Travasso M (2014) Food security and food production systems. Climate Change 2014: Impacts, Adaptation and Vulnerability (Part A: Global and Sectoral Aspects. Contribution of Working Group II to the Fifth Assessment Report of the Intergovernmental Panel on Climate Change), Cambridge UK.
binnenwerk.indd 134 23-2-2016 21:55:44

References
134
the Intergovernmental Panel on Climate Change. Cambridge University Press, Cambridge, United Kingdom and New York, NY, USA.899-943.
Klein T, Holzkämper A, Calanca P, Fuhrer J (2014b) Adaptation options under climate change for multifunctional agriculture: a simulation study for western Switzerland. Regional Environmental Change 14 (1):167-184.
Klein T, Holzkämper A, Calanca P, Seppelt R, Fuhrer J (2013) Adapting agricultural land management to climate change: a regional multi-objective optimization approach. Landscape Ecology 28 (10):2029-2047.
Kok K, Bärlund I, Flörke M, Holman I, Gramberger M, Sendzimir J, Stuch B, Zellmer K (2015) European participatory scenario development: strengthening the link between stories and models. Climatic Change 128 (3-4):187-200.
Koomen E, Kuhlman T, Groen J, Bouwman A (2005) Simulating the future of agricultural land use in the Netherlands. Tijdschrift voor Economische en Sociale Geografie 96 (2):218-224.
Lane L, Montgomery WD (2014) An institutional critique of new climate scenarios. Climatic Change 122 (3):447-458.
Leclère D, Jayet P-A, de Noblet-Ducoudré N (2013) Farm-level Autonomous Adaptation of European Agricultural Supply to Climate Change. Ecological Economics 87:1-14.
Lehmann N, Finger R, Klein T, Calanca P, Walter A (2013) Adapting crop management practices to climate change: Modeling optimal solutions at the field scale. Agricultural Systems 117 (0):55-65.
Lehtonen H, Peltola J, Sinkkonen M (2006) Co-effects of climate policy and agricultural policy on regional agricultural viability in Finland. Agricultural Systems 88 (2–3):472-493.
Louhichi K, Kanellopoulos A, Janssen S, Flichman G, Blanco M, Hengsdijk H, Heckelei T, Berentsen P, Lansink AO, Ittersum MV (2010) FSSIM, a bio-economic farm model for simulating the response of EU farming systems to agricultural and environmental policies. Agricultural Systems 103 (8):585-597.
Luo Z, Wang E, Zheng H, Baldock JA, Sun OJ, Shao Q (2015) Convergent modelling of past soil organic carbon stocks but divergent projections. Biogeosciences 12 (14):4373-4383.
Maracchi G, Sirotenko O, Bindi M (2005) Impacts of Present and Future Climate Variability on Agriculture and Forestry in the Temperate Regions: Europe. Climatic Change 70 (1-2):117-135.
Mayer DG, Rossing WAH, de Devoil P, Groot JCJ, McPhee MJ, Oltjen JW (2008) Optimal management of agricultural systems. Studies in Computational Intelligence, vol 92.
Meerburg BG, Korevaar H, Haubenhofer DK, Blom-Zandstra M, Keulen Hv (2009) The changing role of agriculture in Dutch society. Journal of Agricultural Science 147 (5):511-521.
Meinke H, Howden SM, Struik PC, Nelson R, Rodriguez D, Chapman SC (2009) Adaptation science for agriculture and natural resource management - urgency and theoretical basis. Current Opinion in Environmental Sustainability 1 (1):69-76.
Moore FC, Lobell DB (2014) Adaptation potential of European agriculture in response to climate change. Nature Climate Change 4 (7):610-614.
Moriondo M, Giannakopoulos C, Bindi M (2011) Climate change impact assessment: the role of climate extremes in crop yield simulation. Climatic Change 104 (3-4):679-701.
Moser SC, Ekstrom JA (2010) A framework to diagnose barriers to climate change adaptation. Proceedings of the National Academy of Sciences 107 (51):22026-22031.
Nakicenovic N, Swart R (2000) Emissions Scenarios. A Special Report of Working Group III of the Intergovernmental Panel on Climate Change. Cambridge University Press, Cambridge.
References
135
Nelson DR, Adger WN, Brown K (2007) Adaptation to Environmental Change: Contributions of a Resilience Framework. Annual Review of Environment and Resources 32 (1):395-419.
Nelson GC, Valin H, Sands RD, Havlík P, Ahammad H, Deryng D, Elliott J, Fujimori S, Hasegawa T, Heyhoe E, Kyle P, Von Lampe M, Lotze-Campen H, Mason d’Croz D, van Meijl H, van der Mensbrugghe D, Müller C, Popp A, Robertson R, Robinson S, Schmid E, Schmitz C, Tabeau A, Willenbockel D (2014) Climate change effects on agriculture: Economic responses to biophysical shocks. Proceedings of the National Academy of Sciences 111 (9):3274-3279.
Norby R (1994) Issues and perspectives for investigating root responses to elevated atmospheric carbon dioxide. In: Curtis P, O'Neill E, Teeri J, Zak D, Pregitzer K (eds) Belowground Responses to Rising Atmospheric CO2: Implications for Plants, Soil Biota, and Ecosystem Processes. Kluwer Academic Publishers, Dordrecht/Boston/London.
Nordström E-M, Romero C, Eriksson LO, Öhman K (2009) Aggregation of preferences in participatory forest planning with multiple criteria: an application to the urban forest in Lycksele, Sweden. Canadian Journal of Forest Research 39 (10):1979-1992.
North DC (1991) Institutions. Journal of Economic Perspectives 5 (1):97-112. O'Brien KL, Leichenko RM (2000) Double exposure: assessing the impacts of climate change within the context
of economic globalization. Global Environmental Change 10 (3):221-232. Ogle SM, Breidt FJ, Easter M, Williams S, Killian K, Paustian K (2010) Scale and uncertainty in modeled soil
organic carbon stock changes for US croplands using a process-based model. Global Change Biology 16 (2):810-822.
Olesen JE, Bindi M (2002) Consequences of climate change for European agricultural productivity, land use and policy. European Journal of Agronomy 16 (4):239-262.
Olesen JE, Trnka M, Kersebaum KC, Skjelvåg AO, Seguin B, Peltonen-Sainio P, Rossi F, Kozyra J, Micale F (2011) Impacts and adaptation of European crop production systems to climate change. European Journal of Agronomy 34 (2):96-112.
Paas W (2013) Impacts of climate and socio-economic change on economic viability and land use of dairy farms in ‘de Baakse Beek’, the Netherlands MSc thesis Wageningen university (Available online: edepot.wur.nl/264597).
Parry ML, O.F. Canziani, J.P. Palutikof, Linden PJvd, C.E. Hanson E (2007) Climate Change 2007: Impacts, Adaptation and Vulnerability. Contribution of Working Group II to the Fourth Assessment Report of the Intergovernmental Panel on Climate Change. Cambridge, UK.
Peltonen-Sainio P, Jauhiainen L, Trnka M, Olesen JE, Calanca P, Eckersten H, Eitzinger J, Gobin A, Kersebaum KC, Kozyra J, Kumar S, Marta AD, Micale F, Schaap B, Seguin B, Skjelvåg AO, Orlandini S (2010) Coincidence of variation in yield and climate in Europe. Agriculture, Ecosystems & Environment 139 (4):483-489.
Piorr A, Ungaro F, Ciancaglini A, Happe K, Sahrbacher A, Sattler C, Uthes S, Zander P (2009) Integrated assessment of future CAP policies: land use changes, spatial patterns and targeting. Environmental Science & Policy 12 (8):1122-1136.
Porter J, Xie L, Challinor A, Cochrane K, Howden M, Iqbal M, Lobell DB, Travasso M (2014) Food security and food production systems. Climate Change 2014: Impacts, Adaptation and Vulnerability (Part A: Global and Sectoral Aspects. Contribution of Working Group II to the Fifth Assessment Report of the Intergovernmental Panel on Climate Change), Cambridge UK.
binnenwerk.indd 135 23-2-2016 21:55:45
References
136
Prato T, Zeyuan Q, Pederson G, Fagre D, Bengtson L, Williams J (2010) Potential Economic Benefits of Adapting Agricultural Production Systems to Future Climate Change. Environmental Management 45 (3):577-589.
Reidsma P, Ewert F, Oude-Lansink A, Leemans R (2010) Adaptation to climate change and climate variability in European agriculture: The importance of farm level responses. European Journal of Agronomy 32 (1):91-102.
Reidsma P, Ewert F, Oude Lansink A (2007) Analysis of farm performance in Europe under different climatic and management conditions to improve understanding of adaptive capacity. Climatic Change 84 (3-4):403-422.
Reidsma P, Ewert F, Oude Lansink A, Leemans R (2009) Vulnerability and adaptation of European farmers: a multi-level analysis of yield and income responses to climate variability. Regional Environmental Change 9 (1):25-40.
Reidsma P, Tekelenburg T, van den Berg M, Alkemade R (2006) Impacts of land-use change on biodiversity: An assessment of agricultural biodiversity in the European Union. Agriculture, Ecosystems & Environment 114 (1):86-102.
Reidsma P, Wolf J, Kanellopoulos A, Schaap BF, Mandryk M, Verhagen J, Ittersum MKv (2015) Climate change impact and adaptation research requires integrated assessment and farming systems analysis: a case study in the Netherlands. Environmental Research Letters 10 (4).
Reijneveld A, van Wensem J, Oenema O (2009) Soil organic carbon contents of agricultural land in the Netherlands between 1984 and 2004. Geoderma 152 (3–4):231-238.
Reilly J (2002) Agriculture: The Potential Consequences of Climate Variability and Change for the United States. Cambridge University Press, Cambridge.
Renting H, Rossing WAH, Groot JCJ, Van der Ploeg JD, Laurent C, Perraud D, Stobbelaar DJ, Van Ittersum MK (2009) Exploring multifunctional agriculture. A review of conceptual approaches and prospects for an integrative transitional framework. Journal of Environmental Management 90 (Supplement 2):S112-S123.
Riedijk A, van Wilgenburg R, Koomen E, Borsboom-van Beurden J (2007) Integrated scenarios of socio-economic and climate change; a framework for the "Climate changes Spatial Planning" programme. Spinlab Reseach Memorandum SL-06. VU, MNP, Amsterdam.
Rienks W (2009) Landbouwatlas van Nederland. ROM3D, Hengevelde. Rodriguez D, Cox H, deVoil P, Power B (2014) A participatory whole farm modelling approach to understand
impacts and increase preparedness to climate change in Australia. Agricultural Systems 126:50-61. Roest A, Vermeij I, Jager JH, Everdingen WHv (2010) Definities en gegevens van multifunctionele landbouw in
databestanden. LEI, Den Haag. Romero C, Rehman T (2003) Multiple criteria analysis for agricultural decisions. Elsevier, Amsterdam, Original
Publication in 1989. Rounsevell MDA, Annetts JE, Audsley E, Mayr T, Reginster I (2003) Modelling the spatial distribution of
agricultural land use at the regional scale. Agriculture, Ecosystems & Environment 95 (2-3):465-479. Rounsevell MDA, Metzger MJ (2010) Developing qualitative scenario storylines for environmental change
assessment. WIREs Clim Change 1 (4):606-619. Rufino MC, Reidsma P, Nillesen EEM (2011) Comments to "Is an integrated farm more resilient against climate
change? A micro-econometric analysis of portfolio diversification in African agriculture". Food Policy 36 (3):452-454.
References
137
Schaap B, Blom-Zandstra G, Hermans T, Meerburg BG, Verhagen A (2011) Impact changes of climatic extremes on arable farming in the north of the Netherlands. Regional Environmental Change:1-11.
Schaap BF, Reidsma P, Verhagen J, Wolf J, van Ittersum MK (2013) Participatory design of farm level adaptation to climate risks in an arable region in The Netherlands. European Journal of Agronomy 48 (0):30-42.
Schleyer C, Theesfeld I, Hagedorn K, Aznar O, Callois JM (2007) Approach towards an operational tool to apply institutional analysis for the assessment of policy feasibility within SEAMLESS-IF. SEAMLESS integrated project, EU 6th Framework Programme, contract no. 010036-2.
Schütze N, Schmitz G (2010) OCCASION: New Planning Tool for Optimal Climate Change Adaption Strategies in Irrigation. Journal of Irrigation and Drainage Engineering 136 (12):836-846.
Seo SN (2010) Is an integrated farm more resilient against climate change? A micro-econometric analysis of portfolio diversification in African agriculture. Food Policy 35 (1):32-40.
Smit AB, Jager, J.H., Prins, H. (2004) Gevolgen van de hervorming van het Europese landbouwbeleid voor de landbouw in Noord-Nederland. LEI, Den Haag.
Smit B, Burton, I., Klein, R., Wandel, J. (2000) An atonomy of adaptation to climate change and variability. Climatic Change 45:223-251.
Smit B, Skinner MW (2002) Adaptation options in agriculture to climate change: a typology. Mitigation and Adaptation Strategies for Global Change 7 (1):85-114.
Smith JO, Smith P, Wattenbach M, Zaehle S, Hiederer R, Jones RJA, Montanarella L, Rounsevell MDA, Reginster I, Ewert F (2005) Projected changes in mineral soil carbon of European croplands and grasslands, 1990–2080. Global Change Biology 11 (12):2141-2152.
Smith P, Fang C, Dawson JJC, Moncrieff JB (2008) Impact of Global Warming on Soil Organic Carbon. In: Advances in Agronomy, vol Volume 97. Academic Press, pp 1-43.
Soliva R, Rønningen K, Bella I, Bezak P, Cooper T, Flø BE, Marty P, Potter C (2008) Envisioning upland futures: Stakeholder responses to scenarios for Europe's mountain landscapes. Journal of Rural Studies 24 (1):56-71.
Sterk B, van Ittersum MK, Leeuwis C, Rossing WAH, van Keulen H, van de Ven GWJ (2006) Finding niches for whole-farm design models – contradictio in terminis? Agricultural Systems 87 (2):211-228.
Sumpsi J, Amador F, Romero C (1997) On farmers' objectives: A multi-criteria approach. European Journal of Operational Research 96 (1):64-71.
Supit I, van Diepen CA, de Wit AJW, Wolf J, Kabat P, Baruth B, Ludwig F (2012) Assessing climate change effects on European crop yields using the Crop Growth Monitoring System and a weather generator. Agricultural and Forest Meteorology 164 (0):96-111.
Tebaldi C, Hayhoe K, Arblaster J, Meehl G (2006) Going to the Extremes. Climatic Change 79 (3-4):185-211. ten Berge HFM, van Ittersum MK, Rossing WAH, van de Ven GWJ, Schans J (2000) Farming options for The
Netherlands explored by multi-objective modelling. European Journal of Agronomy 13 (2-3):263-277. Termeer C, Biesbroek R, van der Brink M (2012) Institutions for adaptation to climate change. European
Political Science (11):41-53. Theesfeld I, Schleyer C, Aznar O (2010) The Procedure for Institutional Compatibility Assessment: Ex-ante
Policy Assessment from an Institutional Perspective. Journal of Institutional Economics 6 (3):377-399. Tittonell P, van Wijk MT, Rufino MC, Vrugt JA, Giller KE (2007) Analysing trade-offs in resource and labour
allocation by smallholder farmers using inverse modelling techniques: A case-study from Kakamega district, western Kenya. Agricultural Systems 95 (1-3):76-95.
binnenwerk.indd 136 23-2-2016 21:55:45

References
136
Prato T, Zeyuan Q, Pederson G, Fagre D, Bengtson L, Williams J (2010) Potential Economic Benefits of Adapting Agricultural Production Systems to Future Climate Change. Environmental Management 45 (3):577-589.
Reidsma P, Ewert F, Oude-Lansink A, Leemans R (2010) Adaptation to climate change and climate variability in European agriculture: The importance of farm level responses. European Journal of Agronomy 32 (1):91-102.
Reidsma P, Ewert F, Oude Lansink A (2007) Analysis of farm performance in Europe under different climatic and management conditions to improve understanding of adaptive capacity. Climatic Change 84 (3-4):403-422.
Reidsma P, Ewert F, Oude Lansink A, Leemans R (2009) Vulnerability and adaptation of European farmers: a multi-level analysis of yield and income responses to climate variability. Regional Environmental Change 9 (1):25-40.
Reidsma P, Tekelenburg T, van den Berg M, Alkemade R (2006) Impacts of land-use change on biodiversity: An assessment of agricultural biodiversity in the European Union. Agriculture, Ecosystems & Environment 114 (1):86-102.
Reidsma P, Wolf J, Kanellopoulos A, Schaap BF, Mandryk M, Verhagen J, Ittersum MKv (2015) Climate change impact and adaptation research requires integrated assessment and farming systems analysis: a case study in the Netherlands. Environmental Research Letters 10 (4).
Reijneveld A, van Wensem J, Oenema O (2009) Soil organic carbon contents of agricultural land in the Netherlands between 1984 and 2004. Geoderma 152 (3–4):231-238.
Reilly J (2002) Agriculture: The Potential Consequences of Climate Variability and Change for the United States. Cambridge University Press, Cambridge.
Renting H, Rossing WAH, Groot JCJ, Van der Ploeg JD, Laurent C, Perraud D, Stobbelaar DJ, Van Ittersum MK (2009) Exploring multifunctional agriculture. A review of conceptual approaches and prospects for an integrative transitional framework. Journal of Environmental Management 90 (Supplement 2):S112-S123.
Riedijk A, van Wilgenburg R, Koomen E, Borsboom-van Beurden J (2007) Integrated scenarios of socio-economic and climate change; a framework for the "Climate changes Spatial Planning" programme. Spinlab Reseach Memorandum SL-06. VU, MNP, Amsterdam.
Rienks W (2009) Landbouwatlas van Nederland. ROM3D, Hengevelde. Rodriguez D, Cox H, deVoil P, Power B (2014) A participatory whole farm modelling approach to understand
impacts and increase preparedness to climate change in Australia. Agricultural Systems 126:50-61. Roest A, Vermeij I, Jager JH, Everdingen WHv (2010) Definities en gegevens van multifunctionele landbouw in
databestanden. LEI, Den Haag. Romero C, Rehman T (2003) Multiple criteria analysis for agricultural decisions. Elsevier, Amsterdam, Original
Publication in 1989. Rounsevell MDA, Annetts JE, Audsley E, Mayr T, Reginster I (2003) Modelling the spatial distribution of
agricultural land use at the regional scale. Agriculture, Ecosystems & Environment 95 (2-3):465-479. Rounsevell MDA, Metzger MJ (2010) Developing qualitative scenario storylines for environmental change
assessment. WIREs Clim Change 1 (4):606-619. Rufino MC, Reidsma P, Nillesen EEM (2011) Comments to "Is an integrated farm more resilient against climate
change? A micro-econometric analysis of portfolio diversification in African agriculture". Food Policy 36 (3):452-454.
References
137
Schaap B, Blom-Zandstra G, Hermans T, Meerburg BG, Verhagen A (2011) Impact changes of climatic extremes on arable farming in the north of the Netherlands. Regional Environmental Change:1-11.
Schaap BF, Reidsma P, Verhagen J, Wolf J, van Ittersum MK (2013) Participatory design of farm level adaptation to climate risks in an arable region in The Netherlands. European Journal of Agronomy 48 (0):30-42.
Schleyer C, Theesfeld I, Hagedorn K, Aznar O, Callois JM (2007) Approach towards an operational tool to apply institutional analysis for the assessment of policy feasibility within SEAMLESS-IF. SEAMLESS integrated project, EU 6th Framework Programme, contract no. 010036-2.
Schütze N, Schmitz G (2010) OCCASION: New Planning Tool for Optimal Climate Change Adaption Strategies in Irrigation. Journal of Irrigation and Drainage Engineering 136 (12):836-846.
Seo SN (2010) Is an integrated farm more resilient against climate change? A micro-econometric analysis of portfolio diversification in African agriculture. Food Policy 35 (1):32-40.
Smit AB, Jager, J.H., Prins, H. (2004) Gevolgen van de hervorming van het Europese landbouwbeleid voor de landbouw in Noord-Nederland. LEI, Den Haag.
Smit B, Burton, I., Klein, R., Wandel, J. (2000) An atonomy of adaptation to climate change and variability. Climatic Change 45:223-251.
Smit B, Skinner MW (2002) Adaptation options in agriculture to climate change: a typology. Mitigation and Adaptation Strategies for Global Change 7 (1):85-114.
Smith JO, Smith P, Wattenbach M, Zaehle S, Hiederer R, Jones RJA, Montanarella L, Rounsevell MDA, Reginster I, Ewert F (2005) Projected changes in mineral soil carbon of European croplands and grasslands, 1990–2080. Global Change Biology 11 (12):2141-2152.
Smith P, Fang C, Dawson JJC, Moncrieff JB (2008) Impact of Global Warming on Soil Organic Carbon. In: Advances in Agronomy, vol Volume 97. Academic Press, pp 1-43.
Soliva R, Rønningen K, Bella I, Bezak P, Cooper T, Flø BE, Marty P, Potter C (2008) Envisioning upland futures: Stakeholder responses to scenarios for Europe's mountain landscapes. Journal of Rural Studies 24 (1):56-71.
Sterk B, van Ittersum MK, Leeuwis C, Rossing WAH, van Keulen H, van de Ven GWJ (2006) Finding niches for whole-farm design models – contradictio in terminis? Agricultural Systems 87 (2):211-228.
Sumpsi J, Amador F, Romero C (1997) On farmers' objectives: A multi-criteria approach. European Journal of Operational Research 96 (1):64-71.
Supit I, van Diepen CA, de Wit AJW, Wolf J, Kabat P, Baruth B, Ludwig F (2012) Assessing climate change effects on European crop yields using the Crop Growth Monitoring System and a weather generator. Agricultural and Forest Meteorology 164 (0):96-111.
Tebaldi C, Hayhoe K, Arblaster J, Meehl G (2006) Going to the Extremes. Climatic Change 79 (3-4):185-211. ten Berge HFM, van Ittersum MK, Rossing WAH, van de Ven GWJ, Schans J (2000) Farming options for The
Netherlands explored by multi-objective modelling. European Journal of Agronomy 13 (2-3):263-277. Termeer C, Biesbroek R, van der Brink M (2012) Institutions for adaptation to climate change. European
Political Science (11):41-53. Theesfeld I, Schleyer C, Aznar O (2010) The Procedure for Institutional Compatibility Assessment: Ex-ante
Policy Assessment from an Institutional Perspective. Journal of Institutional Economics 6 (3):377-399. Tittonell P, van Wijk MT, Rufino MC, Vrugt JA, Giller KE (2007) Analysing trade-offs in resource and labour
allocation by smallholder farmers using inverse modelling techniques: A case-study from Kakamega district, western Kenya. Agricultural Systems 95 (1-3):76-95.
binnenwerk.indd 137 23-2-2016 21:55:45
References
138
Tol RSJ (2005) Adaptation and mitigation: trade-offs in substance and methods. Environmental Science & Policy 8 (6):572-578.
Troost C, Berger T (2014) Dealing with Uncertainty in Agent-Based Simulation: Farm-Level Modeling of Adaptation to Climate Change in Southwest Germany. American Journal of Agricultural Economics.
Valbuena DF, Verburg PH, Bregt AK, Ligtenberg A (2010) An agent-based approach to model land-use change at a regional scale. Landscape Ecology 25 (2):185-199.
van Bruchem C, Silvis H (2008) Agrarische structuur, trends en beleid. Ontwikkelingen in Nederland vanaf 1950. Rapport 2008/060. LEI Wageningen UR, Den Haag.
van Calker KJ, Berentsen PBM, Giesen GWJ, Huirne RBM (2005) Identifying and ranking attributes that determine sustainability in Dutch dairy farming. Agriculture and Human Values 22 (1):53-63.
van den Hurk B, Klein Tank A, Lenderink G., van Ulden A, van Oldenborgh GJ, Kastman C, van den Brink H, Keller F, Bessembinder J, Burgers G, Komen G, Hazeleger W, Drijfhout S (2006) KNMI Climate Change Scenarios 2006 for the Netherlands. KNMI, De Bilt.
van der Kolk JWH, Korevaar H, Meulenkamp WJH, Boekhoff M, van der Maas AA, Olde Loohuis RJ, Rijk PJ (2007) Verkenning duurzame landbouw. Doorwerking van wereldbeelden in vier Nederlandse regio's. WOT Natuur & Milieu, Wageningen.
van der Ploeg JD, Laurent C, Blondeau F, Bonnafous P (2009) Farm diversity, classification schemes and multifunctionality. Journal of Environmental Management 90 (Supplement 2):S124-S131.
Van Diepen CA, Wolf J, Van Keulen H, Rappoldt C (1989) WOFOST, a simulation model of crop production. Soil Use and Management 5:16-25.
van Dorland R, Jansen, B., Dubelaar-Versluis, W (2008) De staat van het klimaat 2007. De Bilt/Wageningen. van Drunen M, Berkhout F (2008) Applying WLO for climate change. IVM Institute for Environmental Studies
Vriije Universiteit, Amsterdam. Van Ittersum MK, Rabbinge R, Van Latesteijn HC (1998) Exploratory land use studies and their role in strategic
policy making. Agricultural Systems 58 (3):309-330. Van Oort PAJ, Timmermans BGH, Meinke H, Van Ittersum MK (2012a) Key weather extremes affecting potato
production in The Netherlands. European Journal of Agronomy 37 (1):11-22. van Oort PAJ, Timmermans BGH, van Swaaij ACPM (2012b) Why farmers’ sowing dates hardly change when
temperature rises. European Journal of Agronomy 40 (0):102-111. van Vuuren D, Carter T (2014) Climate and socio-economic scenarios for climate change research and
assessment: reconciling the new with the old. Climatic Change 122 (3):415-429. van Vuuren D, Kriegler E, O’Neill B, Ebi K, Riahi K, Carter T, Edmonds J, Hallegatte S, Kram T, Mathur R,
Winkler H (2014) A new scenario framework for Climate Change Research: scenario matrix architecture. Climatic Change 122 (3):373-386.
Vandermeulen V, Gellynck X, Van Huylenbroeck G, Van Orshoven J, Bomans K (2009) Farmland for tomorrow in densely populated areas. Land Use Policy 26 (4):859-868.
Venema G, B. Doorneweert, K. Oltmer, M. Dolman, A. Breukers, L. van Staalduinen, A. Roest, Dekking A (2009) Wat noemen we verbrede landbouw? Verkenning van definities en informatiebehoeften. . LEI Wageningen UR, Den Haag.
Verhagen AE, Kuikman, P., Van Ierland, E., De Groot, D., Veraart, J., Martens, P., Amelung B, Daan, N. Huynen. M., Kramer, K., Szöny, J., Van Vliet, A., Van Walsum, P., and Westein E (2002) Climate change in the Netherlands. Consequences and adaptation options. Final report of the second phase of the Dutch National Research Programme on Global Air Pollution and Climate Change (NRP II), 1995-2001.
References
139
Waldhardt R, Bach M, Borresch R, Breuer L, Diekötter T, Frede HG, Gäth S, Ginzler O, Gottschalk T, Julich S, Krumpholz M, Kuhlmann F, Otte A, Reger B, Reiher W, Schmitz K, Schmitz PM, Sheridan P, Simmering D, Weist C, Wolters V, Zörner D (2010) Evaluating today's landscape multifunctionality and providing an alternative future: A normative scenario approach. Ecology and Society 15 (3).
Westhoek HJ, van den Berg M, Bakkes JA (2006) Scenario development to explore the future of Europe's rural areas. Agriculture, Ecosystems & Environment 114 (1):7-20.
White JW, Hoogenboom G, Kimball BA, Wall GW (2011) Methodologies for simulating impacts of climate change on crop production. Field Crops Research 124 (3):357-368.
Wiesmeier M, Hübner R, Dechow R, Maier H, Spörlein P, Geuß U, Hangen E, Reischl A, Schilling B, von Lützow M, Kögel-Knabner I (2014) Estimation of past and recent carbon input by crops into agricultural soils of southeast Germany. European Journal of Agronomy 61:10-23.
Williamson OE (2000) The New Institutional Economics: Taking Stock, Looking Ahead. Journal of Economic Literature 38 (3):595-613.
Wolf J, Mandryk M, Kanellopoulos A, Van Oort P, Schaap B, Reidsma P, Van Ittersum MK (2010) Methodologies for analyzing future farming systems and climate change impacts in Flevoland as applied within the AgriAdapt project. AgriAdapt project report no. 1. Wageningen university, Wageningen.
Wolf J, Mandryk M, Kanellopoulos A, van Oort P, Schaap B, Reidsma P, Van Ittersum MK (2011) Integrated assessment of adaptation to Climate change in Flevoland at the farm and regional level. AgriAdapt Project Reports no. 4&5, Wageningen UR, Wageningen.
Wolf J, Reidsma P, Schaap B, Mandryk M, Kanellopoulos A, Ewert F, Oort PAJv, Angulo C, Rumbaur C, Lock R, Enders A, Adenauer M, Heckelei T, Rotter PR, Fronzek S, Carter TR, Verhagen A, van Ittersum MK (2012) Assessing the adaptive capacity of agriculture in the Netherlands to the impacts of climate change under different market and policy scenarios (AgriADAPT project). Wageningen: Climate changes spatial planning (KvR 059/12):73 p.
Yohe G, Tol RSJ (2002) Indicators for social and economic coping capacity-moving toward a working definition of adaptive capacity. Global Environmental Change 12 (1):25-40.
Zhong B, Xu Y (2014) Predicting climate change effects on surface soil organic carbon of Louisiana, USA. Environmental Monitoring and Assessment 186 (10):6169-6192.
Zimmermann A, Heckelei T, Domínguez IP (2009) Modelling farm structural change for integrated ex-ante assessment: review of methods and determinants. Environmental Science & Policy 12 (5):601-618.
binnenwerk.indd 138 23-2-2016 21:55:46
References
138
Tol RSJ (2005) Adaptation and mitigation: trade-offs in substance and methods. Environmental Science & Policy 8 (6):572-578.
Troost C, Berger T (2014) Dealing with Uncertainty in Agent-Based Simulation: Farm-Level Modeling of Adaptation to Climate Change in Southwest Germany. American Journal of Agricultural Economics.
Valbuena DF, Verburg PH, Bregt AK, Ligtenberg A (2010) An agent-based approach to model land-use change at a regional scale. Landscape Ecology 25 (2):185-199.
van Bruchem C, Silvis H (2008) Agrarische structuur, trends en beleid. Ontwikkelingen in Nederland vanaf 1950. Rapport 2008/060. LEI Wageningen UR, Den Haag.
van Calker KJ, Berentsen PBM, Giesen GWJ, Huirne RBM (2005) Identifying and ranking attributes that determine sustainability in Dutch dairy farming. Agriculture and Human Values 22 (1):53-63.
van den Hurk B, Klein Tank A, Lenderink G., van Ulden A, van Oldenborgh GJ, Kastman C, van den Brink H, Keller F, Bessembinder J, Burgers G, Komen G, Hazeleger W, Drijfhout S (2006) KNMI Climate Change Scenarios 2006 for the Netherlands. KNMI, De Bilt.
van der Kolk JWH, Korevaar H, Meulenkamp WJH, Boekhoff M, van der Maas AA, Olde Loohuis RJ, Rijk PJ (2007) Verkenning duurzame landbouw. Doorwerking van wereldbeelden in vier Nederlandse regio's. WOT Natuur & Milieu, Wageningen.
van der Ploeg JD, Laurent C, Blondeau F, Bonnafous P (2009) Farm diversity, classification schemes and multifunctionality. Journal of Environmental Management 90 (Supplement 2):S124-S131.
Van Diepen CA, Wolf J, Van Keulen H, Rappoldt C (1989) WOFOST, a simulation model of crop production. Soil Use and Management 5:16-25.
van Dorland R, Jansen, B., Dubelaar-Versluis, W (2008) De staat van het klimaat 2007. De Bilt/Wageningen. van Drunen M, Berkhout F (2008) Applying WLO for climate change. IVM Institute for Environmental Studies
Vriije Universiteit, Amsterdam. Van Ittersum MK, Rabbinge R, Van Latesteijn HC (1998) Exploratory land use studies and their role in strategic
policy making. Agricultural Systems 58 (3):309-330. Van Oort PAJ, Timmermans BGH, Meinke H, Van Ittersum MK (2012a) Key weather extremes affecting potato
production in The Netherlands. European Journal of Agronomy 37 (1):11-22. van Oort PAJ, Timmermans BGH, van Swaaij ACPM (2012b) Why farmers’ sowing dates hardly change when
temperature rises. European Journal of Agronomy 40 (0):102-111. van Vuuren D, Carter T (2014) Climate and socio-economic scenarios for climate change research and
assessment: reconciling the new with the old. Climatic Change 122 (3):415-429. van Vuuren D, Kriegler E, O’Neill B, Ebi K, Riahi K, Carter T, Edmonds J, Hallegatte S, Kram T, Mathur R,
Winkler H (2014) A new scenario framework for Climate Change Research: scenario matrix architecture. Climatic Change 122 (3):373-386.
Vandermeulen V, Gellynck X, Van Huylenbroeck G, Van Orshoven J, Bomans K (2009) Farmland for tomorrow in densely populated areas. Land Use Policy 26 (4):859-868.
Venema G, B. Doorneweert, K. Oltmer, M. Dolman, A. Breukers, L. van Staalduinen, A. Roest, Dekking A (2009) Wat noemen we verbrede landbouw? Verkenning van definities en informatiebehoeften. . LEI Wageningen UR, Den Haag.
Verhagen AE, Kuikman, P., Van Ierland, E., De Groot, D., Veraart, J., Martens, P., Amelung B, Daan, N. Huynen. M., Kramer, K., Szöny, J., Van Vliet, A., Van Walsum, P., and Westein E (2002) Climate change in the Netherlands. Consequences and adaptation options. Final report of the second phase of the Dutch National Research Programme on Global Air Pollution and Climate Change (NRP II), 1995-2001.
References
139
Waldhardt R, Bach M, Borresch R, Breuer L, Diekötter T, Frede HG, Gäth S, Ginzler O, Gottschalk T, Julich S, Krumpholz M, Kuhlmann F, Otte A, Reger B, Reiher W, Schmitz K, Schmitz PM, Sheridan P, Simmering D, Weist C, Wolters V, Zörner D (2010) Evaluating today's landscape multifunctionality and providing an alternative future: A normative scenario approach. Ecology and Society 15 (3).
Westhoek HJ, van den Berg M, Bakkes JA (2006) Scenario development to explore the future of Europe's rural areas. Agriculture, Ecosystems & Environment 114 (1):7-20.
White JW, Hoogenboom G, Kimball BA, Wall GW (2011) Methodologies for simulating impacts of climate change on crop production. Field Crops Research 124 (3):357-368.
Wiesmeier M, Hübner R, Dechow R, Maier H, Spörlein P, Geuß U, Hangen E, Reischl A, Schilling B, von Lützow M, Kögel-Knabner I (2014) Estimation of past and recent carbon input by crops into agricultural soils of southeast Germany. European Journal of Agronomy 61:10-23.
Williamson OE (2000) The New Institutional Economics: Taking Stock, Looking Ahead. Journal of Economic Literature 38 (3):595-613.
Wolf J, Mandryk M, Kanellopoulos A, Van Oort P, Schaap B, Reidsma P, Van Ittersum MK (2010) Methodologies for analyzing future farming systems and climate change impacts in Flevoland as applied within the AgriAdapt project. AgriAdapt project report no. 1. Wageningen university, Wageningen.
Wolf J, Mandryk M, Kanellopoulos A, van Oort P, Schaap B, Reidsma P, Van Ittersum MK (2011) Integrated assessment of adaptation to Climate change in Flevoland at the farm and regional level. AgriAdapt Project Reports no. 4&5, Wageningen UR, Wageningen.
Wolf J, Reidsma P, Schaap B, Mandryk M, Kanellopoulos A, Ewert F, Oort PAJv, Angulo C, Rumbaur C, Lock R, Enders A, Adenauer M, Heckelei T, Rotter PR, Fronzek S, Carter TR, Verhagen A, van Ittersum MK (2012) Assessing the adaptive capacity of agriculture in the Netherlands to the impacts of climate change under different market and policy scenarios (AgriADAPT project). Wageningen: Climate changes spatial planning (KvR 059/12):73 p.
Yohe G, Tol RSJ (2002) Indicators for social and economic coping capacity-moving toward a working definition of adaptive capacity. Global Environmental Change 12 (1):25-40.
Zhong B, Xu Y (2014) Predicting climate change effects on surface soil organic carbon of Louisiana, USA. Environmental Monitoring and Assessment 186 (10):6169-6192.
Zimmermann A, Heckelei T, Domínguez IP (2009) Modelling farm structural change for integrated ex-ante assessment: review of methods and determinants. Environmental Science & Policy 12 (5):601-618.
binnenwerk.indd 139 23-2-2016 21:55:46

Summary
141
Summary Climate change has become an issue of concern during the last decades. In many regions of the world one can observe effects of changes in climatic conditions or climate variability on crop productivity, farmers’ income and land use. Also for the future of agriculture in the Netherlands climate change must be considered. To prevent the negative impacts and to take advantage of the opportunities arising from climate change, the agricultural sector needs to work on adaptation measures. In the literature, the vast majority of studies focused on field and crop level adaptation. Adaptation may, however, occur across different scales, and actual decisions in agriculture are made at the farm level. Impacts and adaptation should therefore certainly be assessed at farm level, and farm variability must be considered. Adaptation to climate change is embedded in a broader societal context, hence many factors can influence adaptation.
Against this background, the overall objective of this thesis was to improve climate change impact and adaptation assessment of agricultural systems by focussing on farm level adaptation and the broader context it is embedded in. This thesis is an interdisciplinary study that assesses not only adaptation to climate change for agricultural systems, but also the context in which this climate change adaptation takes place. The methods developed in this thesis are meant to be generic and not case study specific, but they were illustrated and applied for the Dutch province Flevoland, with large scale, intensive arable farming as the main type of agricultural activity.
In future, other important drivers (i.e. markets, technological change and policy)
will be impacting farming systems next to climate change. Due to these drivers current farms will evolve in time through structural changes. Chapter 2 therefore analysed the context of adaptation to future climate change for arable farming systems by assessing the contribution of different drivers to farm structural change. Scenario assumptions about changes in drivers - elaborated at global and European levels - were downscaled for Flevoland, to regional and farm type level to project impacts of drivers on farm structural change towards 2050. The estimated farm structural changes differed substantially between the two scenarios considered: A1 Global Economy and B2 Regional Communities. Around 2050 in the A1 scenario in Flevoland we may expect large scale farming systems specializing in intensive crops. In the B2 scenario there is still place for smaller farms. In general this scenario is characterized by a higher diversity in the farming landscape with focus on local crops and markets, more nature conservation and provision of alternative functions to the society. The analysis of farm structural change provides a proper context for assessing impacts of and adaptation to climate change in 2050 at crop and farm level in Flevoland.
Next to primarily economic objectives, farmers have other objectives (e.g. social,
environmental) influencing their management practices. Farm specific adaptation measures to climate change should therefore account for the differences in farm
binnenwerk.indd 140 23-2-2016 21:55:46

Summary
141
Summary Climate change has become an issue of concern during the last decades. In many regions of the world one can observe effects of changes in climatic conditions or climate variability on crop productivity, farmers’ income and land use. Also for the future of agriculture in the Netherlands climate change must be considered. To prevent the negative impacts and to take advantage of the opportunities arising from climate change, the agricultural sector needs to work on adaptation measures. In the literature, the vast majority of studies focused on field and crop level adaptation. Adaptation may, however, occur across different scales, and actual decisions in agriculture are made at the farm level. Impacts and adaptation should therefore certainly be assessed at farm level, and farm variability must be considered. Adaptation to climate change is embedded in a broader societal context, hence many factors can influence adaptation.
Against this background, the overall objective of this thesis was to improve climate change impact and adaptation assessment of agricultural systems by focussing on farm level adaptation and the broader context it is embedded in. This thesis is an interdisciplinary study that assesses not only adaptation to climate change for agricultural systems, but also the context in which this climate change adaptation takes place. The methods developed in this thesis are meant to be generic and not case study specific, but they were illustrated and applied for the Dutch province Flevoland, with large scale, intensive arable farming as the main type of agricultural activity.
In future, other important drivers (i.e. markets, technological change and policy)
will be impacting farming systems next to climate change. Due to these drivers current farms will evolve in time through structural changes. Chapter 2 therefore analysed the context of adaptation to future climate change for arable farming systems by assessing the contribution of different drivers to farm structural change. Scenario assumptions about changes in drivers - elaborated at global and European levels - were downscaled for Flevoland, to regional and farm type level to project impacts of drivers on farm structural change towards 2050. The estimated farm structural changes differed substantially between the two scenarios considered: A1 Global Economy and B2 Regional Communities. Around 2050 in the A1 scenario in Flevoland we may expect large scale farming systems specializing in intensive crops. In the B2 scenario there is still place for smaller farms. In general this scenario is characterized by a higher diversity in the farming landscape with focus on local crops and markets, more nature conservation and provision of alternative functions to the society. The analysis of farm structural change provides a proper context for assessing impacts of and adaptation to climate change in 2050 at crop and farm level in Flevoland.
Next to primarily economic objectives, farmers have other objectives (e.g. social,
environmental) influencing their management practices. Farm specific adaptation measures to climate change should therefore account for the differences in farm
binnenwerk.indd 141 23-2-2016 21:55:46

Summary
142
objectives. Chapter 3 consistently assessed the importance of farmers’ objectives from what farmers say (based on interviews), from what farmers actually do (by analysing current farm performance) and from what farmers want (through selected alternative farm plans). The objectives assessed included maximization of economic result and soil organic matter, and minimization of gross margin variation, working hours and nitrogen balance surplus. Among six arable farms surveyed, farmers’ stated preferences in objectives were often not reflected in realized farming practices. Adaptation preferences of farmers largely resembled their current performance, but generally involved a move towards stated preferences. The results of Chapter 3 suggest that although farmers in Flevoland do have more objectives, in practical decision-making they focus on economic result maximization, while for strategic decision-making they wish to account for soil organic matter which is indirectly related to long term income.
Chapter 4 built on the findings of Chapter 3 and focussed on assessment of
adaptation measures against future gradual climate change and an increased frequency of extreme events, considering farmers’ multiple objectives. First, the impacts of gradual climate change and extreme events on farm performance were assessed in terms of two important objectives identified in Chapter 3: maximization of economic result and of soil organic matter. The impacts of extreme events were investigated for high value crops in Flevoland, which are seed and consumption potato and seed onion. The results for selected arable farms in Flevoland suggest that gradual climate change by 2050 improves farm performance in terms of farm economic result. The degree of improvement varies per scenario and per farm, depending on the cropping pattern. At the same time, extreme events (such as heat wave in summers and warm winters) offset positive impacts of gradual climate change and - in a most severe scenario - they cause a considerable damage to farm economic result through associated yield losses. A neutral impact of future climate change on soil organic matter balance at the crop level was assumed, but soil organic matter balances could be affected by changes in the cropping patterns on a farm. Next, the importance of crop and farm level adaptation measures for the improvement of farm performance was assessed, considering farmers’ important objectives. Different prioritization in terms of objectives can influence preference for different adaptation measures at crop and farm level. If the main objective of the farmer is improvement of economic result, cultivating high value crops remains the best option, although adaptation measures to extreme events need to be adopted. Crop level adaptation measures can largely neutralize negative impacts of these extreme events, but some loss of gross margin of crops will still occur. If farms aim to prioritize economic result and soil organic matter simultaneously, shifting from grass and chicory to winter wheat is a good option, as it improves organic matter balance on the farm and as winter wheat has a relatively small negative effect from climate change on its gross margin. A combination of crop and farm level adaptation is needed for the surveyed farms in terms of improving both farm economic result and organic matter balance.
Summary
143
Besides at crop and farm level, adaptation for agricultural systems to climate change should also be considered at the regional level. At regional level, an enabling institutional environment is an important precondition for the implementation of adaptation measures. Chapter 5 developed a framework for the assessment of crucial institutional preconditions that facilitate the implementation of adaptation measures to climate change. The Procedure for Institutional Compatibility Assessment (PICA) was adopted and modified. In the framework, institutions are characterized by a set of crucial institutional preconditions (CIPs) and indicators linked to each CIP. CIPs refer to both institutional incentives and constraints for implementation of adaptation measures to climate change. Based on information from workshops, interviews and a literature review, a combination of ranking and scoring techniques was applied to assess institutional incentives and constraints for adaptation measures, together indicating the institutional feasibility of implementation of adaptation measures. From an institutional perspective, heterogeneity of actor’s interests and availability of resources appeared to be the most constraining crucial institutional preconditions (CIPs) for adaptation measures to be implemented against risks associated with climate change in Flevoland. Based on the institutional feasibility analysis, the implementation of water management and improvement of irrigation facilities was found to potentially face fewer institutional constraints compared to the other adaptation measures assessed in Chapter 5. The presented approach proved applicable for institutional analyses of adaptation measures for current and future climate challenges at different levels of implementation, but more applications are needed to test its validity and robustness.
Overall, this thesis performed a prospective (using scenarios), multi-scale (taking
into account crop, farm and regional level), integrated (notably multi-objective) and participatory assessment. The findings of the thesis allowed assessing plausible futures of agriculture in Flevoland around 2050 with insights in effective adaptation to climate change at different levels. Besides empirical findings, this thesis contributed methodologically to the portfolio of climate change impact and adaptation assessment. The following features have been elaborated in this thesis to better assess the context of farm level impact and adaptation: analysis of long term farm structural change, assessment of farmers’ multiple objectives, assessment of contribution of crop and farm level adaptation measures to improvement of farm performance on important objectives, and an analysis on institutional feasibility of implementation of adaptation measures.
binnenwerk.indd 142 23-2-2016 21:55:47
Summary
142
objectives. Chapter 3 consistently assessed the importance of farmers’ objectives from what farmers say (based on interviews), from what farmers actually do (by analysing current farm performance) and from what farmers want (through selected alternative farm plans). The objectives assessed included maximization of economic result and soil organic matter, and minimization of gross margin variation, working hours and nitrogen balance surplus. Among six arable farms surveyed, farmers’ stated preferences in objectives were often not reflected in realized farming practices. Adaptation preferences of farmers largely resembled their current performance, but generally involved a move towards stated preferences. The results of Chapter 3 suggest that although farmers in Flevoland do have more objectives, in practical decision-making they focus on economic result maximization, while for strategic decision-making they wish to account for soil organic matter which is indirectly related to long term income.
Chapter 4 built on the findings of Chapter 3 and focussed on assessment of
adaptation measures against future gradual climate change and an increased frequency of extreme events, considering farmers’ multiple objectives. First, the impacts of gradual climate change and extreme events on farm performance were assessed in terms of two important objectives identified in Chapter 3: maximization of economic result and of soil organic matter. The impacts of extreme events were investigated for high value crops in Flevoland, which are seed and consumption potato and seed onion. The results for selected arable farms in Flevoland suggest that gradual climate change by 2050 improves farm performance in terms of farm economic result. The degree of improvement varies per scenario and per farm, depending on the cropping pattern. At the same time, extreme events (such as heat wave in summers and warm winters) offset positive impacts of gradual climate change and - in a most severe scenario - they cause a considerable damage to farm economic result through associated yield losses. A neutral impact of future climate change on soil organic matter balance at the crop level was assumed, but soil organic matter balances could be affected by changes in the cropping patterns on a farm. Next, the importance of crop and farm level adaptation measures for the improvement of farm performance was assessed, considering farmers’ important objectives. Different prioritization in terms of objectives can influence preference for different adaptation measures at crop and farm level. If the main objective of the farmer is improvement of economic result, cultivating high value crops remains the best option, although adaptation measures to extreme events need to be adopted. Crop level adaptation measures can largely neutralize negative impacts of these extreme events, but some loss of gross margin of crops will still occur. If farms aim to prioritize economic result and soil organic matter simultaneously, shifting from grass and chicory to winter wheat is a good option, as it improves organic matter balance on the farm and as winter wheat has a relatively small negative effect from climate change on its gross margin. A combination of crop and farm level adaptation is needed for the surveyed farms in terms of improving both farm economic result and organic matter balance.
Summary
143
Besides at crop and farm level, adaptation for agricultural systems to climate change should also be considered at the regional level. At regional level, an enabling institutional environment is an important precondition for the implementation of adaptation measures. Chapter 5 developed a framework for the assessment of crucial institutional preconditions that facilitate the implementation of adaptation measures to climate change. The Procedure for Institutional Compatibility Assessment (PICA) was adopted and modified. In the framework, institutions are characterized by a set of crucial institutional preconditions (CIPs) and indicators linked to each CIP. CIPs refer to both institutional incentives and constraints for implementation of adaptation measures to climate change. Based on information from workshops, interviews and a literature review, a combination of ranking and scoring techniques was applied to assess institutional incentives and constraints for adaptation measures, together indicating the institutional feasibility of implementation of adaptation measures. From an institutional perspective, heterogeneity of actor’s interests and availability of resources appeared to be the most constraining crucial institutional preconditions (CIPs) for adaptation measures to be implemented against risks associated with climate change in Flevoland. Based on the institutional feasibility analysis, the implementation of water management and improvement of irrigation facilities was found to potentially face fewer institutional constraints compared to the other adaptation measures assessed in Chapter 5. The presented approach proved applicable for institutional analyses of adaptation measures for current and future climate challenges at different levels of implementation, but more applications are needed to test its validity and robustness.
Overall, this thesis performed a prospective (using scenarios), multi-scale (taking
into account crop, farm and regional level), integrated (notably multi-objective) and participatory assessment. The findings of the thesis allowed assessing plausible futures of agriculture in Flevoland around 2050 with insights in effective adaptation to climate change at different levels. Besides empirical findings, this thesis contributed methodologically to the portfolio of climate change impact and adaptation assessment. The following features have been elaborated in this thesis to better assess the context of farm level impact and adaptation: analysis of long term farm structural change, assessment of farmers’ multiple objectives, assessment of contribution of crop and farm level adaptation measures to improvement of farm performance on important objectives, and an analysis on institutional feasibility of implementation of adaptation measures.
binnenwerk.indd 143 23-2-2016 21:55:47

Samenvatting
145
Samenvatting Klimaatverandering is de afgelopen decennia een belangrijk maatschappelijk thema geworden. Wereldwijd zijn effecten van klimaatverandering op de productiviteit van gewassen, het inkomen van boeren en het landgebruik reeds zichtbaar geworden. Ook voor de toekomst van de landbouw in Nederland moet men rekening houden met deze problematiek. Om de negatieve effecten te voorkomen en om te profiteren van de mogelijkheden die klimaatverandering biedt, moet de agrarische sector aan adaptatiemaatregelen werken. Literatuuronderzoek laat zien dat de meeste recente studies gericht zijn op aanpassingen op veld- en gewasniveau. Adaptatie kan echter op verschillende schalen gebeuren, en feitelijke beslissingen in de landbouw worden uiteindelijk op bedrijfsniveau genomen. Effecten en adaptatie moeten daarom ook op bedrijfsniveau worden beoordeeld, en de variatie aan bedrijfstypen moet daarbij een rol spelen. Bovendien is adaptatie aan klimaatverandering ingebed in een bredere maatschappelijke context, en daarom wordt het door vele factoren beïnvloed.
Tegen deze achtergrond was de algemene doelstelling van dit proefschrift om de toetsing van de effecten van klimaatverandering op landbouwsystemen en adaptatie aan klimaatverandering van landbouwsystemen te verbeteren, door te focussen op het niveau van bedrijven en hun context. Dit proefschrift is een interdisciplinair onderzoek dat niet alleen adaptatie van landbouwsystemen aan klimaatverandering bestudeert, maar ook de context (markt, technologie, beleid, institutionele omgeving) waarin deze adaptatie plaatsvindt. De methoden die ontworpen zijn in dit proefschrift beogen generiek en niet case specifiek te zijn. De methoden werden geïllustreerd en toegepast voor de Nederlandse provincie Flevoland, met grootschalige en intensieve akkerbouw als de belangrijkste landbouwactiviteit.
In de toekomst zullen naast klimaatverandering andere belangrijke factoren (d.w.z. markt, technologie en beleid) de landbouwsystemen beïnvloeden. Gestuurd door deze factoren, zullen huidige landbouwbedrijven in de tijd evolueren door structurele aanpassingen. In dit verband werd in hoofdstuk 2 de context van adaptatie aan toekomstige klimaatverandering voor de akkerbouwsystemen geanalyseerd. Dit werd gedaan door het beoordelen van de bijdrage van de verschillende factoren (markt, technologie, beleid en klimaat) aan bedrijfsstructurele aanpassingen. Scenarioveronderstellingen over veranderingen in deze factoren - uitgewerkt op mondiaal en Europees niveau - werden vertaald naar Flevoland, op regionaal en bedrijfstype niveau. Hierdoor konden de effecten van de factoren op bedrijfsstructurele aanpassingen naar 2050 geprojecteerd worden. De geschatte aanpassingen verschillen aanzienlijk tussen de twee scenario's: Mondiale Markt (A1) en Zorgzame Regio (B2). In het A1 scenario kan men in Flevoland rond 2050 grootschalige landbouwbedrijven verwachten die gespecialiseerd zijn in intensieve teelten. In het B2 scenario is er nog plaats voor kleinere bedrijven. In het algemeen wordt dit laatste scenario gekenmerkt door een hogere diversiteit binnen het agrarisch
binnenwerk.indd 144 23-2-2016 21:55:47

Samenvatting
145
Samenvatting Klimaatverandering is de afgelopen decennia een belangrijk maatschappelijk thema geworden. Wereldwijd zijn effecten van klimaatverandering op de productiviteit van gewassen, het inkomen van boeren en het landgebruik reeds zichtbaar geworden. Ook voor de toekomst van de landbouw in Nederland moet men rekening houden met deze problematiek. Om de negatieve effecten te voorkomen en om te profiteren van de mogelijkheden die klimaatverandering biedt, moet de agrarische sector aan adaptatiemaatregelen werken. Literatuuronderzoek laat zien dat de meeste recente studies gericht zijn op aanpassingen op veld- en gewasniveau. Adaptatie kan echter op verschillende schalen gebeuren, en feitelijke beslissingen in de landbouw worden uiteindelijk op bedrijfsniveau genomen. Effecten en adaptatie moeten daarom ook op bedrijfsniveau worden beoordeeld, en de variatie aan bedrijfstypen moet daarbij een rol spelen. Bovendien is adaptatie aan klimaatverandering ingebed in een bredere maatschappelijke context, en daarom wordt het door vele factoren beïnvloed.
Tegen deze achtergrond was de algemene doelstelling van dit proefschrift om de toetsing van de effecten van klimaatverandering op landbouwsystemen en adaptatie aan klimaatverandering van landbouwsystemen te verbeteren, door te focussen op het niveau van bedrijven en hun context. Dit proefschrift is een interdisciplinair onderzoek dat niet alleen adaptatie van landbouwsystemen aan klimaatverandering bestudeert, maar ook de context (markt, technologie, beleid, institutionele omgeving) waarin deze adaptatie plaatsvindt. De methoden die ontworpen zijn in dit proefschrift beogen generiek en niet case specifiek te zijn. De methoden werden geïllustreerd en toegepast voor de Nederlandse provincie Flevoland, met grootschalige en intensieve akkerbouw als de belangrijkste landbouwactiviteit.
In de toekomst zullen naast klimaatverandering andere belangrijke factoren (d.w.z. markt, technologie en beleid) de landbouwsystemen beïnvloeden. Gestuurd door deze factoren, zullen huidige landbouwbedrijven in de tijd evolueren door structurele aanpassingen. In dit verband werd in hoofdstuk 2 de context van adaptatie aan toekomstige klimaatverandering voor de akkerbouwsystemen geanalyseerd. Dit werd gedaan door het beoordelen van de bijdrage van de verschillende factoren (markt, technologie, beleid en klimaat) aan bedrijfsstructurele aanpassingen. Scenarioveronderstellingen over veranderingen in deze factoren - uitgewerkt op mondiaal en Europees niveau - werden vertaald naar Flevoland, op regionaal en bedrijfstype niveau. Hierdoor konden de effecten van de factoren op bedrijfsstructurele aanpassingen naar 2050 geprojecteerd worden. De geschatte aanpassingen verschillen aanzienlijk tussen de twee scenario's: Mondiale Markt (A1) en Zorgzame Regio (B2). In het A1 scenario kan men in Flevoland rond 2050 grootschalige landbouwbedrijven verwachten die gespecialiseerd zijn in intensieve teelten. In het B2 scenario is er nog plaats voor kleinere bedrijven. In het algemeen wordt dit laatste scenario gekenmerkt door een hogere diversiteit binnen het agrarisch
binnenwerk.indd 145 23-2-2016 21:55:47

Samenvatting
146
landschap, met een focus op lokale gewassen en markten. Ook zal er meer ruimte zijn voor natuurbescherming en het bieden van alternatieve functies voor de samenleving. De analyse van de bedrijfsstructurele aanpassingen zorgt voor een juiste context voor het beoordelen van de effecten van en adaptatie aan klimaatverandering in Flevoland rond 2050 op gewas- en bedrijfsniveau.
Naast voornamelijk economische doelstellingen, hebben boeren ook andere
doelstellingen die hun bedrijfsvoering beïnvloeden (bijvoorbeeld op gebied van sociale en milieuaspecten). Bedrijfsspecifieke adaptatiemaatregelen aan klimaatverandering moeten daarom rekening houden met verschillende doelstellingen van boerenbedrijven. In hoofdstuk 3 werd het belang van boerenbedrijfsdoelstellingen onderzocht op basis van i) wat boeren zeggen (via interviews), ii) wat boeren werkelijk doen (door het analyseren van de huidige bedrijfsprestatie) en iii) wat boeren willen (door middel van geselecteerde alternatieve bedrijfsplannen). De volgende doelstellingen werden in het onderzoek opgenomen: maximalisering van economische resultaat en van het gehalte aan organische stof in de bodem, en minimalisering van de variatie van economisch resultaat, werktijden en stikstofoverschot. Onder de zes bestudeerde akkerbouwbedrijven werden de door de boeren aangegeven voorkeuren in doelstellingen (wat boeren zeggen) vaak niet in de praktijk gerealiseerd (wat boeren doen). Adaptatievoorkeuren van de boeren (wat boeren willen) leken grotendeels op hun huidige bedrijfsprestaties (wat boeren doen), maar tegelijkertijd betroffen de adaptatievoorkeuren een stap in de richting van de aangegeven voorkeuren (wat boeren zeggen). De resultaten van hoofdstuk 3 suggereren bovendien dat boeren in de praktijk beslissingen nemen gericht op het maximaliseren van economisch resultaat, ofschoon ze in de regel meerdere doelstellingen hebben. Dit terwijl ze ook vinden dat het organische stofgehalte een belangrijke overweging in de strategische besluitvorming is, hetgeen gerelateerd kan worden aan een inkomen op lange termijn.
Hoofdstuk 4 bouwt verder op de bevindingen van hoofdstuk 3 voort en is gericht
op de beoordeling van adaptatiemaatregelen tegen geleidelijke klimaatverandering en tegen een verhoogde frequentie van weerextremen in de toekomst, rekening houdend met meerdere doelstellingen van boeren. Eerst werden de effecten van de geleidelijke klimaatverandering en weerextremen op de bedrijfsprestaties beoordeeld in termen van de twee belangrijke doelstellingen uit hoofdstuk 3: maximalisatie van het economische resultaat en van de organische stof in de bodem. De effecten van weerextremen werden onderzocht voor hoogwaardige gewassen, namelijk poot- en consumptieaardappelen en zaaiuien. De resultaten voor de geselecteerde akkerbouwbedrijven in Flevoland suggereren dat geleidelijke klimaatverandering in 2050 de bedrijfsprestaties verbetert in termen van economisch resultaat. De mate van verbetering varieert per scenario en per bedrijf, afhankelijk van het gewaspatroon. Tegelijkertijd compenseren weerextremen (zoals een hittegolf in de zomer en warme winters) deze positieve effecten van een geleidelijke klimaatverandering weer en
Samenvatting
147
zorgen ze - in het meest extreme scenario – voor aanzienlijke opbrengstverliezen. Er werd aangenomen dat de balans van de organische stof in de bodem onder toekomstige klimaatverandering op gewasniveau onveranderd blijft, terwijl het op bedrijfsniveau zou kunnen worden beïnvloed door veranderingen in het gewaspatroon. Vervolgens werd het belang van adaptatiemaatregelen voor verbetering van de bedrijfsprestaties op beide niveaus geëvalueerd. Daarbij werden de verschillende doelstellingen van de boeren meegewogen, omdat prioritering van doelstellingen de voorkeur voor verschillende adaptatiemaatregelen op gewas- en bedrijfsniveau kunnen beïnvloeden. Als de belangrijkste doelstelling van de boer een verbetering van het economisch resultaat is, blijft de teelt van hoogwaardige gewassen de beste optie, hoewel adaptatiemaatregelen voor weerextremen moeten worden genomen. Adaptatiemaatregelen op gewasniveau kunnen de negatieve effecten van deze weerextremen grotendeels neutraliseren, maar verlies van een deel van de bruto winstmarge van de gewassen zal nog steeds optreden. Als de bedrijven naast het verbeteren van het economisch resultaat ook de organische stof in de bodem willen maximaliseren, is een verschuiving van gras en witlof naar wintertarwe een goede optie. Dit verbetert de balans van organische stof op het bedrijf, ofschoon er dan bij wintertarwe sprake is van een klein negatief effect op de bruto winstmarge. Een combinatie van aanpassingen op gewas- en bedrijfsniveau is dus nodig voor een verbetering van het bedrijfseconomisch resultaat en de organische stof balans.
Behalve op gewas- en bedrijfsniveau, moet aanpassing van landbouwsystemen aan
klimaatverandering ook op regionaal niveau geanalyseerd worden. Op regionaal niveau is een gunstige institutionele omgeving (wet- en regelgeving, beleid, sociale netwerken) een belangrijke voorwaarde voor de uitvoering van adaptatiemaatregelen. In hoofdstuk 5 wordt een kader geschetst voor de beoordeling van institutionele randvoorwaarden die de uitvoering van adaptatiemaatregelen aan klimaatverandering vergemakkelijken. De ‘Procedure for Institutional Compatibility Assessment’ (PICA) werd aangepast ten behoeve van dit onderzoek. In deze benadering worden instituties gekarakteriseerd door een aantal ‘crucial institutional preconditions’ (CIPs) met daaraan gekoppelde indicatoren. CIPs verwijzen naar een aantal institutionele prikkels en belemmeringen voor de toepassing van adaptatiemaatregelen. Informatie uit workshops, interviews en literatuuronderzoek werd gebruikt om relevante institutionele prikkels en belemmeringen te toetsten op basis van een combinatie van scoren en rangschikken van de CIPs. Deze methode geeft een indicatie van de institutionele haalbaarheid van de implementatie van adaptatiemaatregelen. Vanuit dit perspectief blijken ‘de heterogeniteit van de belangen van betrokken actoren’ en ‘de beperkte beschikbaarheid van hulpbronnen’ de meest belemmerende CIPs. Op basis van deze analyse werd vastgesteld dat waterbeheer en verbetering van irrigatie op minder institutionele weerstand stuit dan andere adaptatiemaatregelen (relocatie van boerenbedrijven en ontwikkeling van nieuwe gewasrassen). PICA blijkt inderdaad goed toepasbaar voor institutionele analyse van adaptatiemaatregelen voor huidige en toekomstige klimaatrisico’s op verschillende niveaus. De methode zou echter in meer
binnenwerk.indd 146 23-2-2016 21:55:47

Samenvatting
146
landschap, met een focus op lokale gewassen en markten. Ook zal er meer ruimte zijn voor natuurbescherming en het bieden van alternatieve functies voor de samenleving. De analyse van de bedrijfsstructurele aanpassingen zorgt voor een juiste context voor het beoordelen van de effecten van en adaptatie aan klimaatverandering in Flevoland rond 2050 op gewas- en bedrijfsniveau.
Naast voornamelijk economische doelstellingen, hebben boeren ook andere
doelstellingen die hun bedrijfsvoering beïnvloeden (bijvoorbeeld op gebied van sociale en milieuaspecten). Bedrijfsspecifieke adaptatiemaatregelen aan klimaatverandering moeten daarom rekening houden met verschillende doelstellingen van boerenbedrijven. In hoofdstuk 3 werd het belang van boerenbedrijfsdoelstellingen onderzocht op basis van i) wat boeren zeggen (via interviews), ii) wat boeren werkelijk doen (door het analyseren van de huidige bedrijfsprestatie) en iii) wat boeren willen (door middel van geselecteerde alternatieve bedrijfsplannen). De volgende doelstellingen werden in het onderzoek opgenomen: maximalisering van economische resultaat en van het gehalte aan organische stof in de bodem, en minimalisering van de variatie van economisch resultaat, werktijden en stikstofoverschot. Onder de zes bestudeerde akkerbouwbedrijven werden de door de boeren aangegeven voorkeuren in doelstellingen (wat boeren zeggen) vaak niet in de praktijk gerealiseerd (wat boeren doen). Adaptatievoorkeuren van de boeren (wat boeren willen) leken grotendeels op hun huidige bedrijfsprestaties (wat boeren doen), maar tegelijkertijd betroffen de adaptatievoorkeuren een stap in de richting van de aangegeven voorkeuren (wat boeren zeggen). De resultaten van hoofdstuk 3 suggereren bovendien dat boeren in de praktijk beslissingen nemen gericht op het maximaliseren van economisch resultaat, ofschoon ze in de regel meerdere doelstellingen hebben. Dit terwijl ze ook vinden dat het organische stofgehalte een belangrijke overweging in de strategische besluitvorming is, hetgeen gerelateerd kan worden aan een inkomen op lange termijn.
Hoofdstuk 4 bouwt verder op de bevindingen van hoofdstuk 3 voort en is gericht
op de beoordeling van adaptatiemaatregelen tegen geleidelijke klimaatverandering en tegen een verhoogde frequentie van weerextremen in de toekomst, rekening houdend met meerdere doelstellingen van boeren. Eerst werden de effecten van de geleidelijke klimaatverandering en weerextremen op de bedrijfsprestaties beoordeeld in termen van de twee belangrijke doelstellingen uit hoofdstuk 3: maximalisatie van het economische resultaat en van de organische stof in de bodem. De effecten van weerextremen werden onderzocht voor hoogwaardige gewassen, namelijk poot- en consumptieaardappelen en zaaiuien. De resultaten voor de geselecteerde akkerbouwbedrijven in Flevoland suggereren dat geleidelijke klimaatverandering in 2050 de bedrijfsprestaties verbetert in termen van economisch resultaat. De mate van verbetering varieert per scenario en per bedrijf, afhankelijk van het gewaspatroon. Tegelijkertijd compenseren weerextremen (zoals een hittegolf in de zomer en warme winters) deze positieve effecten van een geleidelijke klimaatverandering weer en
Samenvatting
147
zorgen ze - in het meest extreme scenario – voor aanzienlijke opbrengstverliezen. Er werd aangenomen dat de balans van de organische stof in de bodem onder toekomstige klimaatverandering op gewasniveau onveranderd blijft, terwijl het op bedrijfsniveau zou kunnen worden beïnvloed door veranderingen in het gewaspatroon. Vervolgens werd het belang van adaptatiemaatregelen voor verbetering van de bedrijfsprestaties op beide niveaus geëvalueerd. Daarbij werden de verschillende doelstellingen van de boeren meegewogen, omdat prioritering van doelstellingen de voorkeur voor verschillende adaptatiemaatregelen op gewas- en bedrijfsniveau kunnen beïnvloeden. Als de belangrijkste doelstelling van de boer een verbetering van het economisch resultaat is, blijft de teelt van hoogwaardige gewassen de beste optie, hoewel adaptatiemaatregelen voor weerextremen moeten worden genomen. Adaptatiemaatregelen op gewasniveau kunnen de negatieve effecten van deze weerextremen grotendeels neutraliseren, maar verlies van een deel van de bruto winstmarge van de gewassen zal nog steeds optreden. Als de bedrijven naast het verbeteren van het economisch resultaat ook de organische stof in de bodem willen maximaliseren, is een verschuiving van gras en witlof naar wintertarwe een goede optie. Dit verbetert de balans van organische stof op het bedrijf, ofschoon er dan bij wintertarwe sprake is van een klein negatief effect op de bruto winstmarge. Een combinatie van aanpassingen op gewas- en bedrijfsniveau is dus nodig voor een verbetering van het bedrijfseconomisch resultaat en de organische stof balans.
Behalve op gewas- en bedrijfsniveau, moet aanpassing van landbouwsystemen aan
klimaatverandering ook op regionaal niveau geanalyseerd worden. Op regionaal niveau is een gunstige institutionele omgeving (wet- en regelgeving, beleid, sociale netwerken) een belangrijke voorwaarde voor de uitvoering van adaptatiemaatregelen. In hoofdstuk 5 wordt een kader geschetst voor de beoordeling van institutionele randvoorwaarden die de uitvoering van adaptatiemaatregelen aan klimaatverandering vergemakkelijken. De ‘Procedure for Institutional Compatibility Assessment’ (PICA) werd aangepast ten behoeve van dit onderzoek. In deze benadering worden instituties gekarakteriseerd door een aantal ‘crucial institutional preconditions’ (CIPs) met daaraan gekoppelde indicatoren. CIPs verwijzen naar een aantal institutionele prikkels en belemmeringen voor de toepassing van adaptatiemaatregelen. Informatie uit workshops, interviews en literatuuronderzoek werd gebruikt om relevante institutionele prikkels en belemmeringen te toetsten op basis van een combinatie van scoren en rangschikken van de CIPs. Deze methode geeft een indicatie van de institutionele haalbaarheid van de implementatie van adaptatiemaatregelen. Vanuit dit perspectief blijken ‘de heterogeniteit van de belangen van betrokken actoren’ en ‘de beperkte beschikbaarheid van hulpbronnen’ de meest belemmerende CIPs. Op basis van deze analyse werd vastgesteld dat waterbeheer en verbetering van irrigatie op minder institutionele weerstand stuit dan andere adaptatiemaatregelen (relocatie van boerenbedrijven en ontwikkeling van nieuwe gewasrassen). PICA blijkt inderdaad goed toepasbaar voor institutionele analyse van adaptatiemaatregelen voor huidige en toekomstige klimaatrisico’s op verschillende niveaus. De methode zou echter in meer
binnenwerk.indd 147 23-2-2016 21:55:48

Samenvatting
148
onderzoek toegepast moeten worden om deze nader te kunnen valideren en de robuustheid ervan aan te tonen.
Dit proefschrift beschrijft een toetsing van klimaatonderzoek voor
landbouwsystemen die toekomstgericht is (op basis van scenario’s), niveau-overstijgend (van gewas tot bedrijf tot regio), geïntegreerd (rekening houdend met meerdere bedrijfsdoelstellingen) en participatief (focusgroepen en workshops met boeren). De bevindingen in dit proefschrift maken het mogelijk om aannemelijke toekomstperspectieven voor de landbouw in Flevoland rond 2050 te schetsen, rekening houdend met klimaatverandering. Naast empirische bevindingen, levert dit proefschrift een bijdrage aan de ontwikkeling van methoden voor onderzoek naar effecten van en adaptatie aan klimaatverandering. De volgende methoden zijn uitgewerkt met als doel om de context van het landbouwbedrijf en de opties voor klimaatadaptatie beter te evalueren: (i) analyse van bedrijfsstructurele aanpassingen op de lange termijn, (ii) inachtneming van de verschillende doelstellingen van boeren, (iii) beoordeling van de bijdrage van adaptatiemaatregelen op gewas- en bedrijfsniveau aan de verbetering van de bedrijfsprestaties, en (iv) analyse van de institutionele haalbaarheid van adaptatiemaatregelen.
149
Acknowledgements I would like to acknowledge a number of people whose input has been pivotal at different stages of my PhD project. First of all, I am grateful to my supervision team (Martin van Ittersum, Pytrik Reidsma and Bas Arts) for their guidance and support, especially in the final phase of my PhD. I appreciate the collaboration with fellow researchers within the AgriADAPT project, especially with Argyris Kanellopoulos, Ben Schaap, Joost Wolf and Jan Verhagen. I am thankful to Peter Prins for facilitation of stakeholder workshops in Flevoland. I would like to thank all farmers that kindly shared their farm data, ranked the objectives and discussed the alternative farm plans. I am also thankful to all interviewees for their help with ranking the crucial institutional preconditions and discussing the feasibility of implementation of adaptation measures to climate change. I am grateful to Jeroen Groot for the help with FarmDESIGN. I am also thankful to the MSc students Kiki Kartikasari and Domna Tzemi for their help with data collection. Merel, Mink and Renske, thank you for driving (with) me to Flevoland and assisting me during interviews. I would like to thank all colleagues at Plant Production Systems group and Centre for Crop Systems Analysis for the pleasant working environment. I received a lot of help from Bert Rijk, Bert Janssen, Maja Slingerland and Peter Leffelaar. Administrative assistance from Charlotte, Ria, Linda and Alex-Jan has been highly appreciated. A lot of credit goes to all fellow PhD candidates, especially those from Scaling and Governance program and from the PE&RC PhD Council and personally to Claudius van de Vijver. I would also like to acknowledge my colleagues at the Dutch Environmental Assessment Agency (PBL), especially Elke Stehfest and Rob Alkemade and everybody from PBL-Young. Finally, I would like to thank my family and friends for all their support and encouragement.
Maryia Mandryk, Wageningen, February 2016
binnenwerk.indd 148 23-2-2016 21:55:48

Samenvatting
148
onderzoek toegepast moeten worden om deze nader te kunnen valideren en de robuustheid ervan aan te tonen.
Dit proefschrift beschrijft een toetsing van klimaatonderzoek voor
landbouwsystemen die toekomstgericht is (op basis van scenario’s), niveau-overstijgend (van gewas tot bedrijf tot regio), geïntegreerd (rekening houdend met meerdere bedrijfsdoelstellingen) en participatief (focusgroepen en workshops met boeren). De bevindingen in dit proefschrift maken het mogelijk om aannemelijke toekomstperspectieven voor de landbouw in Flevoland rond 2050 te schetsen, rekening houdend met klimaatverandering. Naast empirische bevindingen, levert dit proefschrift een bijdrage aan de ontwikkeling van methoden voor onderzoek naar effecten van en adaptatie aan klimaatverandering. De volgende methoden zijn uitgewerkt met als doel om de context van het landbouwbedrijf en de opties voor klimaatadaptatie beter te evalueren: (i) analyse van bedrijfsstructurele aanpassingen op de lange termijn, (ii) inachtneming van de verschillende doelstellingen van boeren, (iii) beoordeling van de bijdrage van adaptatiemaatregelen op gewas- en bedrijfsniveau aan de verbetering van de bedrijfsprestaties, en (iv) analyse van de institutionele haalbaarheid van adaptatiemaatregelen.
149
Acknowledgements I would like to acknowledge a number of people whose input has been pivotal at different stages of my PhD project. First of all, I am grateful to my supervision team (Martin van Ittersum, Pytrik Reidsma and Bas Arts) for their guidance and support, especially in the final phase of my PhD. I appreciate the collaboration with fellow researchers within the AgriADAPT project, especially with Argyris Kanellopoulos, Ben Schaap, Joost Wolf and Jan Verhagen. I am thankful to Peter Prins for facilitation of stakeholder workshops in Flevoland. I would like to thank all farmers that kindly shared their farm data, ranked the objectives and discussed the alternative farm plans. I am also thankful to all interviewees for their help with ranking the crucial institutional preconditions and discussing the feasibility of implementation of adaptation measures to climate change. I am grateful to Jeroen Groot for the help with FarmDESIGN. I am also thankful to the MSc students Kiki Kartikasari and Domna Tzemi for their help with data collection. Merel, Mink and Renske, thank you for driving (with) me to Flevoland and assisting me during interviews. I would like to thank all colleagues at Plant Production Systems group and Centre for Crop Systems Analysis for the pleasant working environment. I received a lot of help from Bert Rijk, Bert Janssen, Maja Slingerland and Peter Leffelaar. Administrative assistance from Charlotte, Ria, Linda and Alex-Jan has been highly appreciated. A lot of credit goes to all fellow PhD candidates, especially those from Scaling and Governance program and from the PE&RC PhD Council and personally to Claudius van de Vijver. I would also like to acknowledge my colleagues at the Dutch Environmental Assessment Agency (PBL), especially Elke Stehfest and Rob Alkemade and everybody from PBL-Young. Finally, I would like to thank my family and friends for all their support and encouragement.
Maryia Mandryk, Wageningen, February 2016
binnenwerk.indd 149 23-2-2016 21:55:48

151
About the author Maryia Mandryk received academic training in geography at Belarusian State University, Minsk (2000-2005) and subsequently worked at Belarusian National Institute for Soil Science and Agrochemistry of the National Academy of Sciences. In 2008 she obtained her MSc degree in Environmental Sciences (Environmental Systems Analysis) at Wageningen university. After her internship at Alterra (WUR) with Centre Landscape Maryia worked for UNISCAPE – the European Network of Universities for the implementation of the European Landscape Convention. Maryia performed her PhD research on integrated assessment of adaptation to climate change in agriculture at Plant Production Systems group (Wageningen university) as a part of ‘Scaling and Governance’ strategic program and the AgriADAPT research project within the Dutch ‘Climate changes Spatial Planning’ program. Since 2013 Maryia has been working as researcher global environmental issues at PBL the Netherlands Environmental Assessment Agency. Maryia has been involved in the research projects Global Biodiversity Outlook-4, FOODSECURE and OpenNESS which focussed on the contribution of sectors to sustainable use and conservation of biodiversity, global food and nutrition security, and on operationalisation of natural capital and ecosystem services.
binnenwerk.indd 150 23-2-2016 21:55:48

151
About the author Maryia Mandryk received academic training in geography at Belarusian State University, Minsk (2000-2005) and subsequently worked at Belarusian National Institute for Soil Science and Agrochemistry of the National Academy of Sciences. In 2008 she obtained her MSc degree in Environmental Sciences (Environmental Systems Analysis) at Wageningen university. After her internship at Alterra (WUR) with Centre Landscape Maryia worked for UNISCAPE – the European Network of Universities for the implementation of the European Landscape Convention. Maryia performed her PhD research on integrated assessment of adaptation to climate change in agriculture at Plant Production Systems group (Wageningen university) as a part of ‘Scaling and Governance’ strategic program and the AgriADAPT research project within the Dutch ‘Climate changes Spatial Planning’ program. Since 2013 Maryia has been working as researcher global environmental issues at PBL the Netherlands Environmental Assessment Agency. Maryia has been involved in the research projects Global Biodiversity Outlook-4, FOODSECURE and OpenNESS which focussed on the contribution of sectors to sustainable use and conservation of biodiversity, global food and nutrition security, and on operationalisation of natural capital and ecosystem services.
binnenwerk.indd 151 23-2-2016 21:55:48

153
List of publications Mandryk, M., Reidsma, P., Ittersum, M.K. van (2012) Scenarios of long-term farm structural change for application in climate change impact assessment Landscape Ecology 27 (4). - p. 509 - 527. Mandryk, M., Reidsma, P., Kanellopoulos, A., Groot, J.C.J., Ittersum, M.K. van (2014) The role of farmers’ objectives in current farm practices and adaptation preferences: a case study in Flevoland, the Netherlands Regional Environmental Change 14 (4). - p. 1463 - 1478. Mandryk, M., Reidsma, P., Kartikasari, K., Ittersum, M.K. van, Arts, B.J.M. (2015) Institutional constraints for adaptive capacity to climate change in Flevoland’s agriculture Environmental Science & Policy 48 . - p. 147 - 162. Reidsma, P., Wolf, J., Kanellopoulos, A., Schaap, B.F., Mandryk, M., Verhagen, J., Ittersum, M.K. van (2015) Climate change impact and adaptation research requires integrated assessment and farming systems analysis: a case study in the Netherlands Environmental Research Letters 10 (4).
binnenwerk.indd 152 23-2-2016 21:55:48

153
List of publications Mandryk, M., Reidsma, P., Ittersum, M.K. van (2012) Scenarios of long-term farm structural change for application in climate change impact assessment Landscape Ecology 27 (4). - p. 509 - 527. Mandryk, M., Reidsma, P., Kanellopoulos, A., Groot, J.C.J., Ittersum, M.K. van (2014) The role of farmers’ objectives in current farm practices and adaptation preferences: a case study in Flevoland, the Netherlands Regional Environmental Change 14 (4). - p. 1463 - 1478. Mandryk, M., Reidsma, P., Kartikasari, K., Ittersum, M.K. van, Arts, B.J.M. (2015) Institutional constraints for adaptive capacity to climate change in Flevoland’s agriculture Environmental Science & Policy 48 . - p. 147 - 162. Reidsma, P., Wolf, J., Kanellopoulos, A., Schaap, B.F., Mandryk, M., Verhagen, J., Ittersum, M.K. van (2015) Climate change impact and adaptation research requires integrated assessment and farming systems analysis: a case study in the Netherlands Environmental Research Letters 10 (4).
binnenwerk.indd 153 23-2-2016 21:55:48

155
PE&RC Training and Education Statement With the training and education activities listed below the PhD candidate has complied with the requirements set by the C.T. de Wit Graduate School for Production Ecology and Resource Conservation (PE&RC) which comprises of a minimum total of 32 ECTS (= 22 weeks of activities) Review of literature (5.6 ECTS)
- Adaptation of arable farming systems to climate change and other future challenges; Scaling and Governance regular scientific meeting
Writing of project proposal (4 ECTS)
- Integrated assessment of adaptation of agricultural systems to climate change in the North of the Netherlands
Post-graduate courses (6.6 ECTS) - Scaling and governance; WUR (2009) - Introduction to bio-economic modelling: advanced bio-economic modelling; Mansholt
Graduate School (2009) - Agriculture and natural resources management: a multi-criteria approach; Mansholt
Graduate School (2010) - Introduction to R for statistical analysis; PE&RC (2010)
Deficiency, refresh, brush-up courses (3 ECTS)
- Quantitative analysis of land use systems; Qualus, WUR (2009)
Competence strengthening / skills courses (1.7 ECTS) - PhD Competence assessment; WGS, WUR (2009) - Scientific writing skills; CENTA, WUR (2012)
PE&RC Annual meetings, seminars and the PE&RC weekend (2.1 ECTS)
- PE&RC Weekend (2009) - PE&RC Day (2010) - PE&RC Weekend last years (2012) - SENSE Day (2015)
Discussion groups / local seminars / other scientific meetings (5 ECTS)
- Maths and Stats discussion group (2009) - Regular scientific meetings of Scaling and Governance project (2009-2010) - Scaling and Governance discussion group (2010) - WaCASA Meetings (2012-2013) - Contested agronomy seminar (2013)
International symposia, workshops and conferences (6.6 ECTS)
- Integrated Assessment of Agriculture and Sustainable Development: setting the agenda for science and policy; Egmond aan Zee, the Netherlands (2009)
- Scaling and Governance conference; Wageningen, the Netherlands (2010) - Final conference: climate changes special planning programme; Amersfoort, the
Netherlands (2011) - 12th Congress of the European Society of Agronomy; Helsinki, Finland (2012)
Supervision of MSc students
- A framework for assessment of institutional feasibility of climate adaptation: a case study on agriculture in Flevoland
- Assessment of differentiated farm performances of arable farms in Flevoland and in the Netherlands
binnenwerk.indd 154 23-2-2016 21:55:49

155
PE&RC Training and Education Statement With the training and education activities listed below the PhD candidate has complied with the requirements set by the C.T. de Wit Graduate School for Production Ecology and Resource Conservation (PE&RC) which comprises of a minimum total of 32 ECTS (= 22 weeks of activities) Review of literature (5.6 ECTS)
- Adaptation of arable farming systems to climate change and other future challenges; Scaling and Governance regular scientific meeting
Writing of project proposal (4 ECTS)
- Integrated assessment of adaptation of agricultural systems to climate change in the North of the Netherlands
Post-graduate courses (6.6 ECTS) - Scaling and governance; WUR (2009) - Introduction to bio-economic modelling: advanced bio-economic modelling; Mansholt
Graduate School (2009) - Agriculture and natural resources management: a multi-criteria approach; Mansholt
Graduate School (2010) - Introduction to R for statistical analysis; PE&RC (2010)
Deficiency, refresh, brush-up courses (3 ECTS)
- Quantitative analysis of land use systems; Qualus, WUR (2009)
Competence strengthening / skills courses (1.7 ECTS) - PhD Competence assessment; WGS, WUR (2009) - Scientific writing skills; CENTA, WUR (2012)
PE&RC Annual meetings, seminars and the PE&RC weekend (2.1 ECTS)
- PE&RC Weekend (2009) - PE&RC Day (2010) - PE&RC Weekend last years (2012) - SENSE Day (2015)
Discussion groups / local seminars / other scientific meetings (5 ECTS)
- Maths and Stats discussion group (2009) - Regular scientific meetings of Scaling and Governance project (2009-2010) - Scaling and Governance discussion group (2010) - WaCASA Meetings (2012-2013) - Contested agronomy seminar (2013)
International symposia, workshops and conferences (6.6 ECTS)
- Integrated Assessment of Agriculture and Sustainable Development: setting the agenda for science and policy; Egmond aan Zee, the Netherlands (2009)
- Scaling and Governance conference; Wageningen, the Netherlands (2010) - Final conference: climate changes special planning programme; Amersfoort, the
Netherlands (2011) - 12th Congress of the European Society of Agronomy; Helsinki, Finland (2012)
Supervision of MSc students
- A framework for assessment of institutional feasibility of climate adaptation: a case study on agriculture in Flevoland
- Assessment of differentiated farm performances of arable farms in Flevoland and in the Netherlands
binnenwerk.indd 155 23-2-2016 21:55:50

This research was funded through the IP/OP program ‘Scaling and Governance’ of Wageningen university and partly through the AgriADAPT project within the Dutch ‘Climate changes Spatial Planning’ program.
Cover design: Maarten Donders
Printed by: Proefschriftmaken.nl || Uitgeverij BOXPress
binnenwerk.indd 156 23-2-2016 21:55:50

This research was funded through the IP/OP program ‘Scaling and Governance’ of Wageningen university and partly through the AgriADAPT project within the Dutch ‘Climate changes Spatial Planning’ program.
Cover design: Maarten Donders
Printed by: Proefschriftmaken.nl || Uitgeverij BOXPress
binnenwerk.indd 157 23-2-2016 21:55:50
cover en uitnodiging.indd 1 22-2-2016 14:44:31