Embed Size (px)
Citation preview
Growing Healthier Planning for a healthier Clark County
Clark County Public Health Advisory Council and Clark County Public Health
April 2012
Table of Contents
Forward 1
Introduction 2
Growing healthier chapters Access to healthy food 5 Active transportation and land use 12 Parks and open spaces 19 Economic opportunity 24 Affordable, quality housing 30 Climate and human health 36 Environmental quality 43 Safety and social connections 49
Appendices A. Glossary 54 B. Policy comparison tables 59 C. Process, outreach, and survey results 79
1
Clark County Public Health has defined its mission as working together with the community to: o Prevent disease and injury o Promote healthier choices o Protect food, water and air o Prepare for emergencies. For many years the Public Health staff, the Public Health Advisory Council and Board of Health have sought ways to achieve this mission, but challenges remain. Despite the fact the United States spends more on health care, we have fallen behind other developed countries as gains in life expectancy have stagnated. We know that one cause of this decline is obesity, a major risk factor for chronic conditions such as diabetes, heart disease, and cancer. Two out of three adults in Clark County are now overweight or obese, and the current generation of young people could be the first in American history to live shorter, less healthy lives than their parents. The costs to our community, our economy, and our well-‐being make it critically important to understand how these and other chronic diseases become so entrenched. Our built environment, meaning the physical characteristics of the neighborhoods, towns, cities or rural areas in which we live, influences our health in countless ways. Research shows that our surroundings have a greater impact on our overall health than medical care. That’s why we’ve undertaken the development of a Health Element for the County Comprehensive Plan. The Growing Healthier Report identifies important changes to our built environment that will make healthy choices easier and increase opportunities for long, healthy lives. Our county will continue to grow over the coming twenty years that
Forward 1
Forward
2
this Comprehensive Plan update will cover, as we add over 140,000 new neighbors. This is an important opportunity for Clark County, a chance to change course and to build our communities so that they promote better health for us all. It is ultimately up to the community to choose how we grow, how we accommodate new development, and what value we place on promoting health. We hope this report provides you with information that will help guide those critical decisions. As you read the Growing Healthier Report and participate in the public discussion, do not hesitate to contact Clark County Public Health if you have questions, concerns, or need additional information. You can also visit Public Health’s Growing Healthier webpage at http://www.co.clark.wa.us/publichealth/community/growing_healthy/index.html to learn more or view background documents. Most importantly, you can become actively involved; these decisions will have long-‐term impacts on the type of community you live in, on your health and on the health of your family. Sandy Mathewson John Wiesman Oliver Orjiako
Introduction
Introduction 2
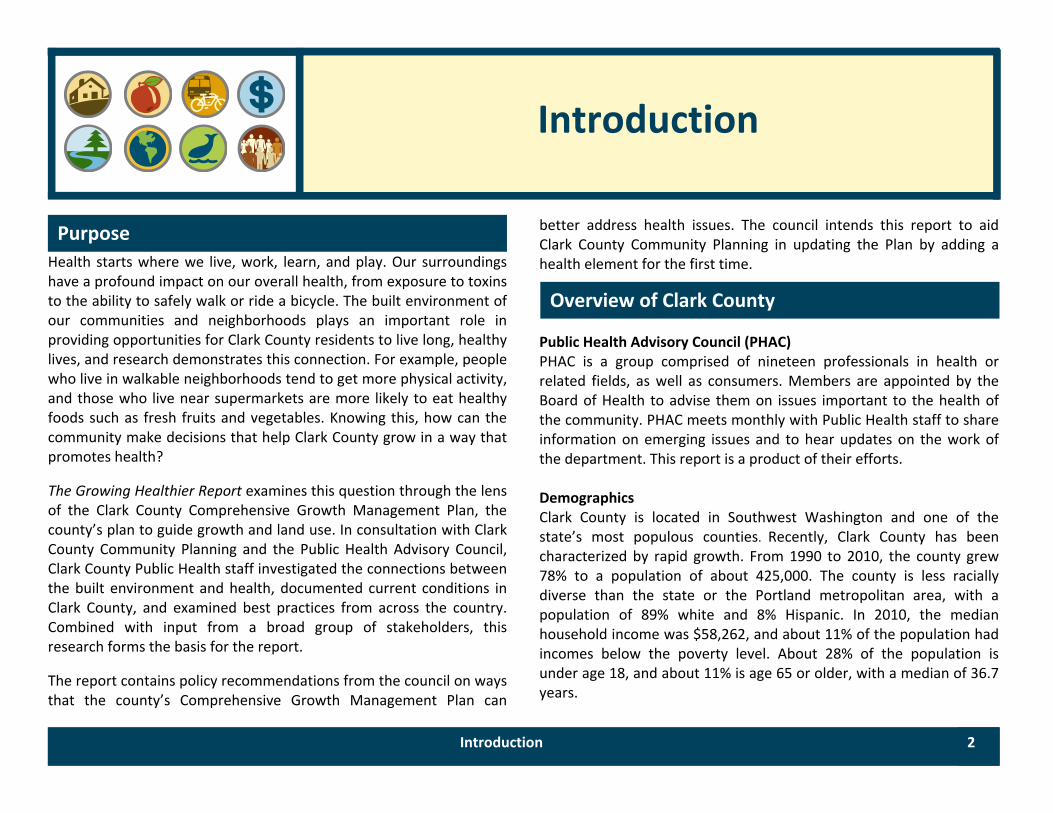
Health starts where we live, work, learn, and play. Our surroundings have a profound impact on our overall health, from exposure to toxins to the ability to safely walk or ride a bicycle. The built environment of our communities and neighborhoods plays an important role in providing opportunities for Clark County residents to live long, healthy lives, and research demonstrates this connection. For example, people who live in walkable neighborhoods tend to get more physical activity, and those who live near supermarkets are more likely to eat healthy foods such as fresh fruits and vegetables. Knowing this, how can the community make decisions that help Clark County grow in a way that promotes health?
he Growing HealthierT Report examines this question through the lens
from the council on ways
of the Clark County Comprehensive Growth Management Plan, the county’s plan to guide growth and land use. In consultation with Clark County Community Planning and the Public Health Advisory Council, Clark County Public Health staff investigated the connections between the built environment and health, documented current conditions in Clark County, and examined best practices from across the country. Combined with input from a broad group of stakeholders, this research forms the basis for the report.
he report contains policy recommendationsTthat the county’s Comprehensive Growth Management Plan can
better address health issues. The council intends this report to aid Clark County Community Planning in updating the Plan by adding a health element for the first time.
Public Health Advisory Council (PHAC) PHAC is a group comprised of nineteen professionals in health or related fields, as well as consumers. M
Overview of Clark County
Purpose
embers are appointed by the
. Recently, Clark County has been y rapid growth. From 1990 to 2010, the county grew
Board of Health to advise them on issues important to the health of the community. PHAC meets monthly with Public Health staff to share information on emerging issues and to hear updates on the work of the department. This report is a product of their efforts. Demographics Clark County is located in Southwest Washington and one of the tate’s most populous countiesscharacterized b78% to a population of about 425,000. The county is less racially diverse than the state or the Portland metropolitan area, with a population of 89% white and 8% Hispanic. In 2010, the median household income was $58,262, and about 11% of the population had incomes below the poverty level. About 28% of the population is under age 18, and about 11% is age 65 or older, with a median of 36.7 years.
Introduction 3
Disparities National data show disparities in health outcomes based on socioeconomic status, race and ethnicity, age, and geography. For example, life expectancy is lower in some zip codes, and African
omen are more likely to have low birth‐weight babies. u a determine
American wOften data are navail ble to whether the same disparities are present in Clark County. In this report, we describe disparities using the best available data.
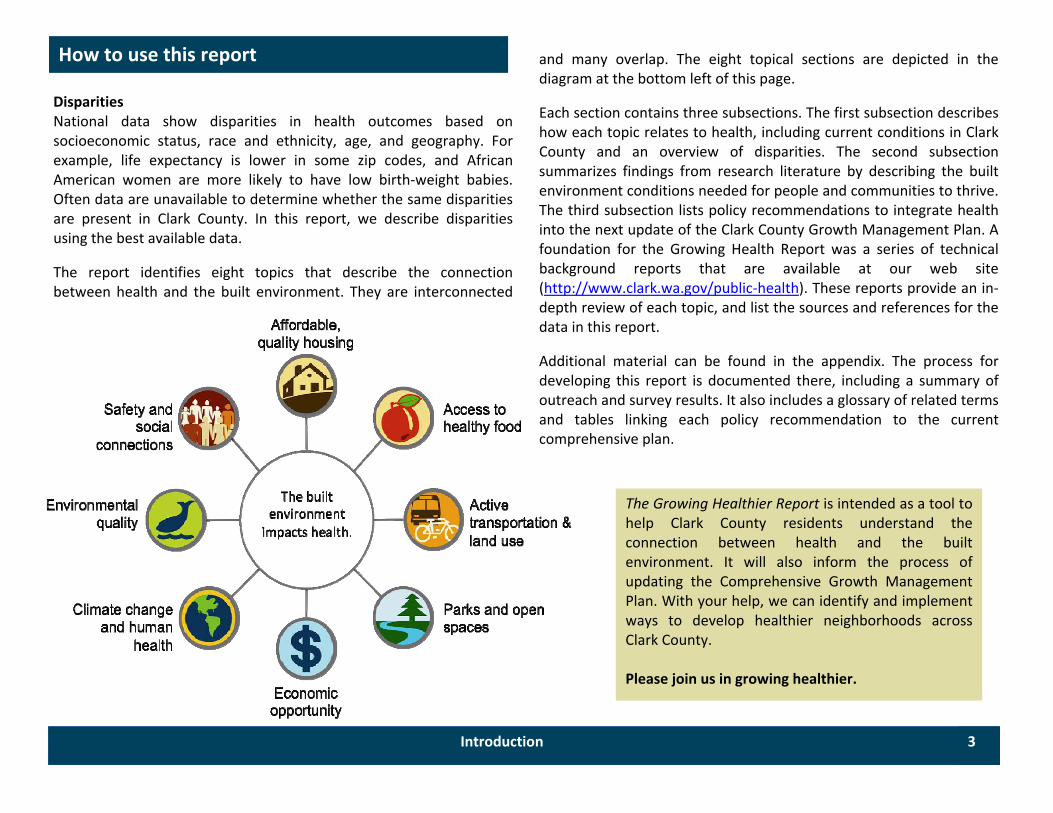
The report identifies eight topics that describe the connection between health and the built environment. They are interconnected
and many overlap. The eight topical sections are depicted in the diagram at the bottom left of this page.
literature by describing the built
Each section contains three subsections. The first subsection describes inhow each topic relates to health, including current conditions Clark
County and an overview of disparities. The second subsection ummarizes findings from research senvironment conditions needed for people and communities to thrive. The third subsection lists policy recommendations to integrate health into the next update of the Clark County Growth Management Plan. A foundation for the Growing Health Report was a series of technical background reports that are available at our web site (http://www.clark.wa.gov/public‐health). These reports provide an in‐depth review of each topic, and list the sources and references for the data in this report.
Additional material can be found in the appendix. The process for developing this report is documented there, including a summary of outreach and survey results. It also includes a glossary of related terms and tables linking each policy recommendation to the current comprehensive plan.
How to use this report
The Growing Healthier Report is intended as a tool to help Clark County residents understand the connection between health and the built environment. It will also inform the process of updating the Comprehensive Growth Management Plan. With your help, we can identify and implement ways to develop healthier neighborhoods across Clark County. Please join us in growing healthier.
Introduction 4
Acknowledgements Clark County Public Health is grateful for the contributions of many participants in creating The Growing Healthier Report. In addition to those listed below, we are thankful to all of our expert reviewers, county staff, and participants in the Growing Healthier Community Survey. Board of Health Marc Boldt, Chair Steve Stuart Tom Mielke Public Health Advisory Council Rainy Atkins Jonathan Avery, Vice Chair Betsy Brownfield Joan Caley Paul Childers Justin Clary Mark Collier Nicole Covrett Dr. Marilyn Darr Dr. Jeremy Diehl Dr. Dawn Doutrich Trevor Evers Joanne Huffman Laurie Lebowsky Sandra Mathewson, Chair Dr. Alan Melnick, Ex officio Justin Plummer Bob Richardson David Seabrook
Policy Oversight Group Colete Anderson Alan Melnick Oliver Orjiako Don Strick John Wiesman Project Staff Leads Jonnie Hyde Brendon Haggerty
Unless noted below, all photos in this report are from Clark County files. Cover page (upper right bicyclists): Wikimedia Commons; Page 15: Wikimedia Commons; Page 21: creoindustrialarts.com; Page 22: Laurie Lebowsky; Page 35: Wikimedia Commons; Page 39: AP Photo/Tony Gutierrez; Page 40: NASA; Page 45: Wikimedia Commons
Technical Advisory Committee
Melanie Payne
Jennifer Merte Tricia Mortell
Julie Grimm
Photos
What you eat affects your health Eating healthy foods lowers the risk of becoming overweight or obese, key risk factors for chronic diseases such as heart disease, diabetes, and cancer. A healthy diet includes fruits and vegetables, whole grains, low-‐fat dairy, and fresh meats, fish, or poultry.
How access to healthy food impacts health
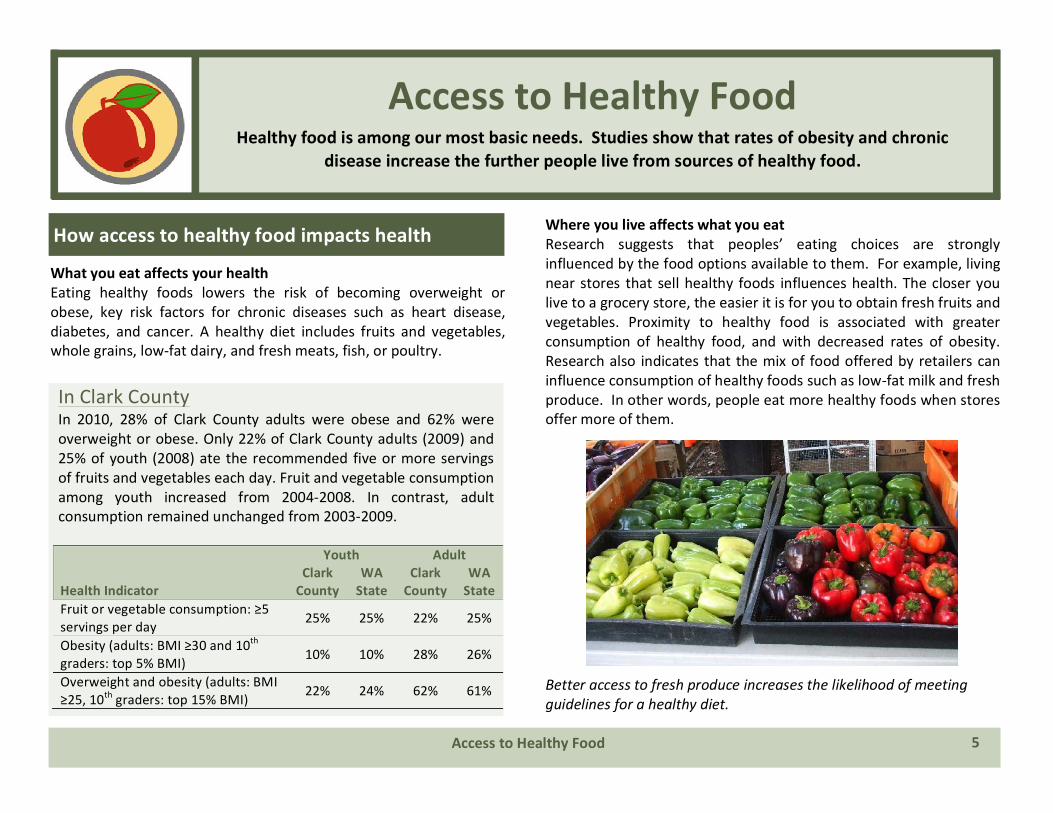
Healthy food is among our most basic needs. Studies show that rates of obesity and chronic disease increase the further people live from sources of healthy food.
Access to Healthy Food
Access to Healthy Food
In Clark County In 2010, 28% of Clark County adults were obese and 62% were overweight or obese. Only 22% of Clark County adults (2009) and 25% of youth (2008) ate the recommended five or more servings of fruits and vegetables each day. Fruit and vegetable consumption among youth increased from 2004-‐2008. In contrast, adult consumption remained unchanged from 2003-‐2009.
Youth Adult Health Indicator
Clark County
WA State
Clark County
WA State
Fruit or vegetable consumption: ≥5 servings per day 25% 25% 22% 25%
Obesity (adults: BMI ≥30 and 10th graders: top 5% BMI) 10% 10% 28% 26%
Overweight and obesity (adults: BMI ≥25, 10th graders: top 15% BMI) 22% 24% 62% 61%
5
Where you live affects what you eat Research suggests that peoples’ eating choices are strongly influenced by the food options available to them. For example, living near stores that sell healthy foods influences health. The closer you live to a grocery store, the easier it is for you to obtain fresh fruits and vegetables. Proximity to healthy food is associated with greater consumption of healthy food, and with decreased rates of obesity. Research also indicates that the mix of food offered by retailers can influence consumption of healthy foods such as low-‐fat milk and fresh produce. In other words, people eat more healthy foods when stores offer more of them.
Better access to fresh produce increases the likelihood of meeting guidelines for a healthy diet.
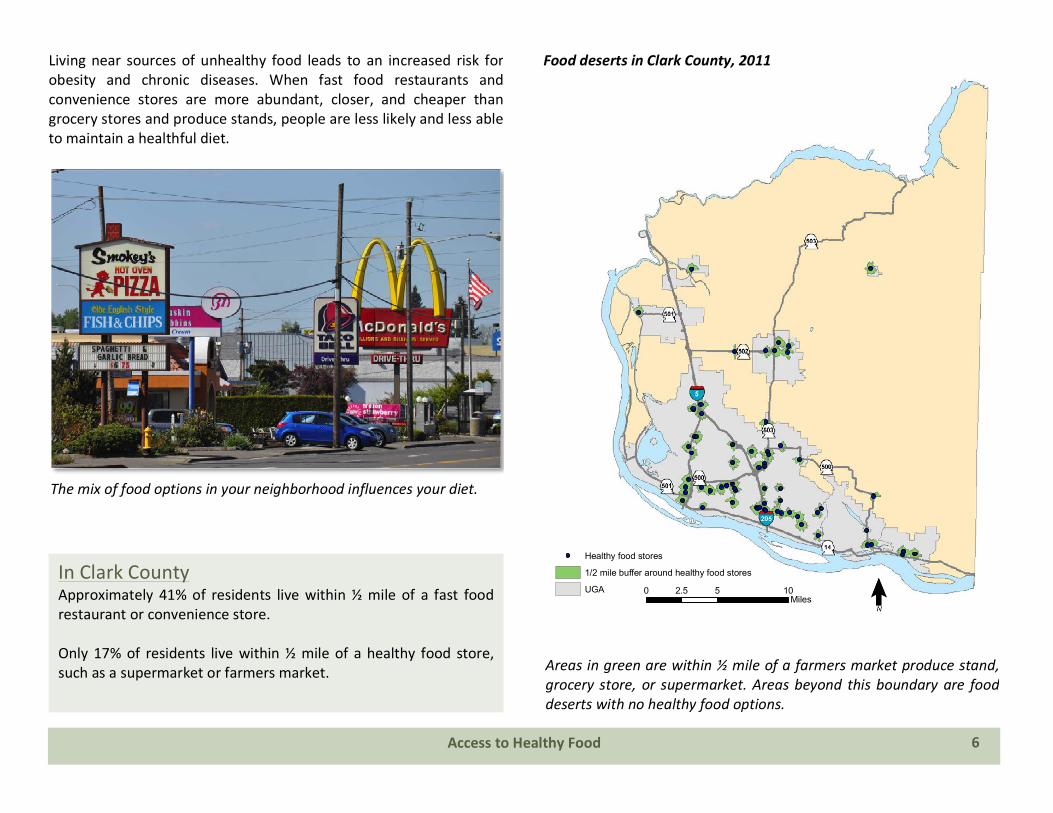
In Clark County Approximately 41% of residents live within ½ mile of a fast food restaurant or convenience store. Only 17% of residents live within ½ mile of a healthy food store, such as a supermarket or farmers market.
Living near sources of unhealthy food leads to an increased risk for obesity and chronic diseases. When fast food restaurants and convenience stores are more abundant, closer, and cheaper than grocery stores and produce stands, people are less likely and less able to maintain a healthful diet.
2 Access to Healthy Food
Areas in green are within ½ mile of a farmers market produce stand, grocery store, or supermarket. Areas beyond this boundary are food deserts with no healthy food options.
6
The mix of food options in your neighborhood influences your diet.
Food deserts in Clark County, 2011
0 5 102.5Miles
Healthy food stores
1/2 mile buffer around healthy food stores
UGA ¯ˉ
In Clark County The number of farms in Clark County increased from 1,175 in 1997 to 2,101 in 2007. During the same period, the average farm size shrunk from 62 acres to 37 acres, a 26% decrease. Clark County had seven farmers markets in operation in 2011.
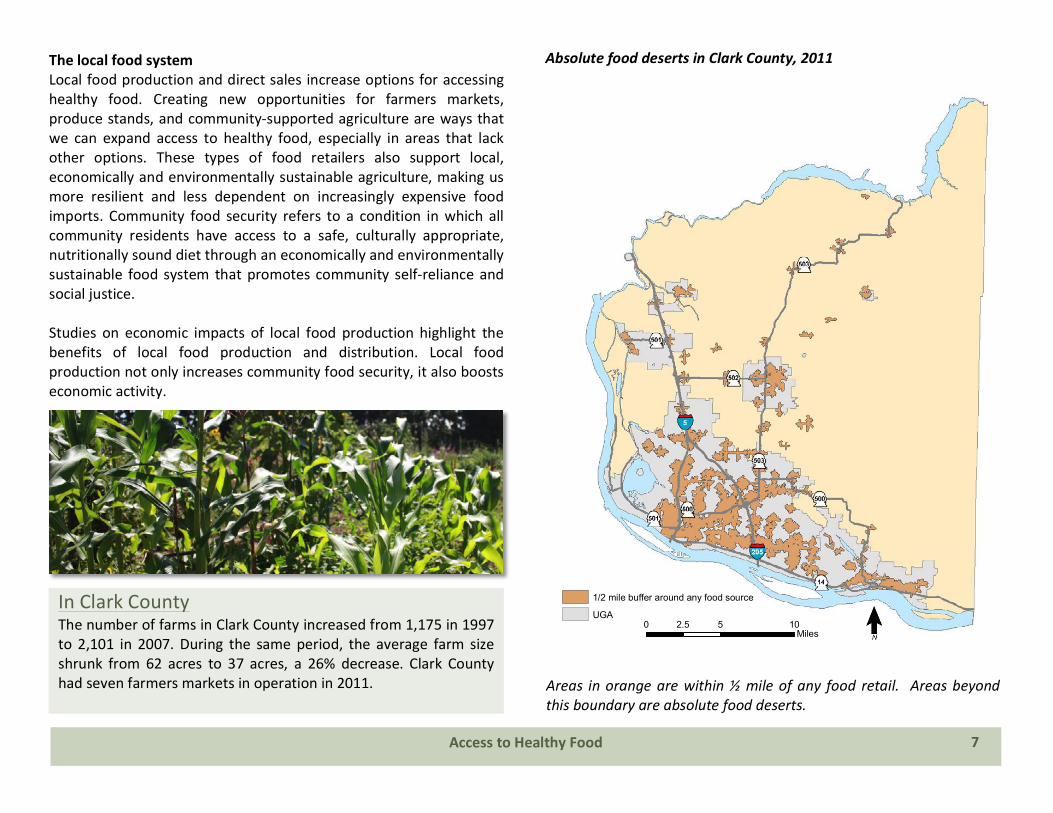
The local food system Local food production and direct sales increase options for accessing healthy food. Creating new opportunities for farmers markets, produce stands, and community-‐supported agriculture are ways that we can expand access to healthy food, especially in areas that lack other options. These types of food retailers also support local, economically and environmentally sustainable agriculture, making us more resilient and less dependent on increasingly expensive food imports. Community food security refers to a condition in which all community residents have access to a safe, culturally appropriate, nutritionally sound diet through an economically and environmentally sustainable food system that promotes community self-‐reliance and social justice. Studies on economic impacts of local food production highlight the benefits of local food production and distribution. Local food production not only increases community food security, it also boosts economic activity.
Areas in orange are within ½ mile of any food retail. Areas beyond this boundary are absolute food deserts.
Access to Healthy Food
7
Absolute food deserts in Clark County, 2011
0 5 102.5Miles
1/2 mile buffer around any food source
UGA ¯ˉ
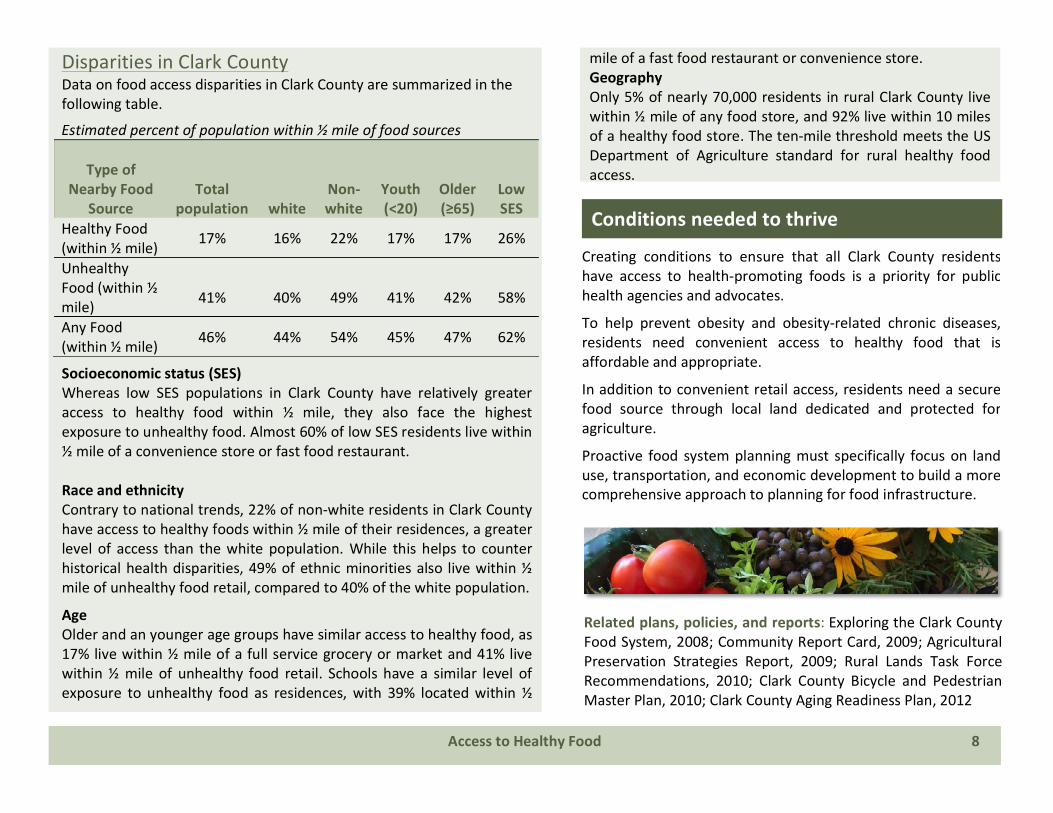
Creating conditions to ensure that all Clark County residents have access to health-‐promoting foods is a priority for public health agencies and advocates.
To help prevent obesity and obesity-‐related chronic diseases, residents need convenient access to healthy food that is affordable and appropriate.
In addition to convenient retail access, residents need a secure food source through local land dedicated and protected for agriculture.
Proactive food system planning must specifically focus on land use, transportation, and economic development to build a more comprehensive approach to planning for food infrastructure.
1
Disparities in Clark County Data on food access disparities in Clark County are summarized in the following table.
Socioeconomic status (SES) Whereas low SES populations in Clark County have relatively greater access to healthy food within ½ mile, they also face the highest exposure to unhealthy food. Almost 60% of low SES residents live within ½ mile of a convenience store or fast food restaurant. Race and ethnicity Contrary to national trends, 22% of non-‐white residents in Clark County have access to healthy foods within ½ mile of their residences, a greater level of access than the white population. While this helps to counter historical health disparities, 49% of ethnic minorities also live within ½ mile of unhealthy food retail, compared to 40% of the white population.
Age Older and an younger age groups have similar access to healthy food, as 17% live within ½ mile of a full service grocery or market and 41% live within ½ mile of unhealthy food retail. Schools have a similar level of exposure to unhealthy food as residences, with 39% located within ½
2
mile of a fast food restaurant or convenience store. Geography Only 5% of nearly 70,000 residents in rural Clark County live within ½ mile of any food store, and 92% live within 10 miles of a healthy food store. The ten-‐mile threshold meets the US Department of Agriculture standard for rural healthy food access.
Estimated percent of population within ½ mile of food sources
Type of Nearby Food
Source Total
population
white Non-‐white
Youth (<20)
Older (≥65)
Low SES
Healthy Food (within ½ mile) 17% 16% 22% 17% 17% 26%
Unhealthy Food (within ½ mile)
41%
40%
49%
41%
42%
58%
Any Food (within ½ mile) 46% 44% 54% 45% 47% 62%
3 Access to Healthy Food 8
Conditions needed to thrive
Related plans, policies, and reports: Exploring the Clark County Food System, 2008; Community Report Card, 2009; Agricultural Preservation Strategies Report, 2009; Rural Lands Task Force Recommendations, 2010; Clark County Bicycle and Pedestrian Master Plan, 2010; Clark County Aging Readiness Plan, 2012
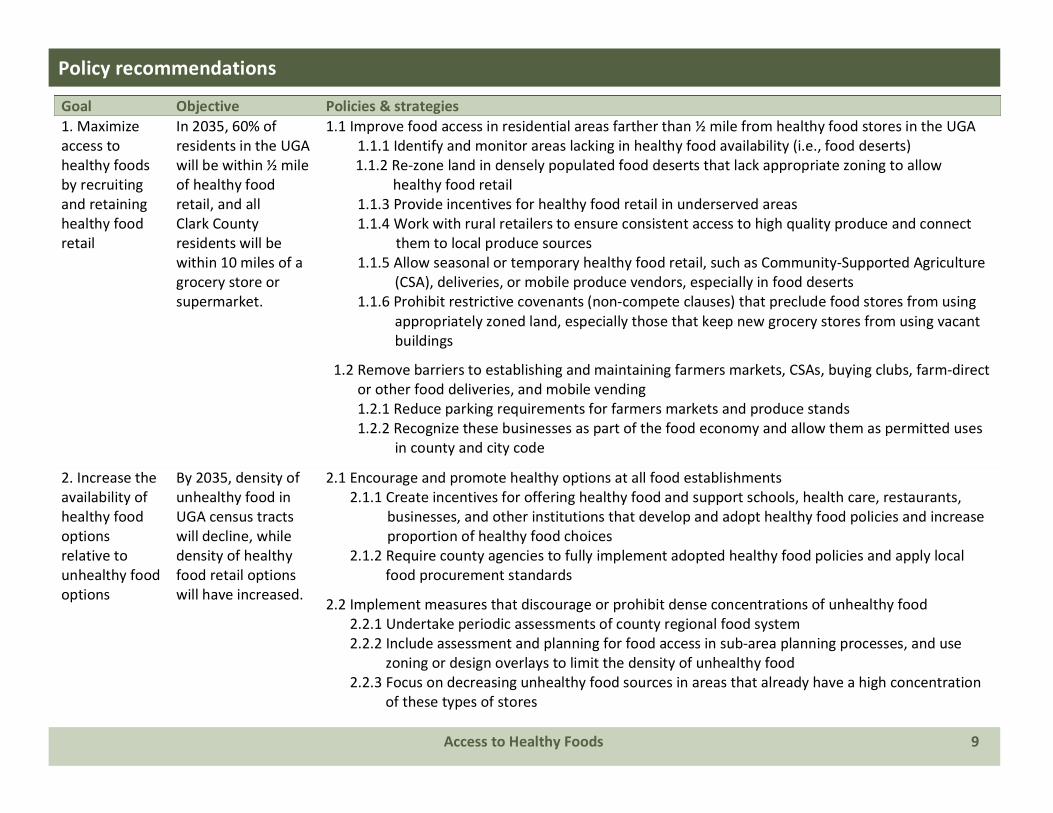
Goal Objective Policies & strategies 1. Maximize access to healthy foods by recruiting and retaining healthy food retail
In 2035, 60% of residents in the UGA will be within ½ mile of healthy food retail, and all Clark County residents will be within 10 miles of a grocery store or supermarket.
1.1 Improve food access in residential areas farther than ½ mile from healthy food stores in the UGA 1.1.1 Identify and monitor areas lacking in healthy food availability (i.e., food deserts) 1.1.2 Re-‐zone land in densely populated food deserts that lack appropriate zoning to allow
healthy food retail 1.1.3 Provide incentives for healthy food retail in underserved areas 1.1.4 Work with rural retailers to ensure consistent access to high quality produce and connect
them to local produce sources 1.1.5 Allow seasonal or temporary healthy food retail, such as Community-‐Supported Agriculture
(CSA), deliveries, or mobile produce vendors, especially in food deserts 1.1.6 Prohibit restrictive covenants (non-‐compete clauses) that preclude food stores from using
appropriately zoned land, especially those that keep new grocery stores from using vacant buildings
1.2 Remove barriers to establishing and maintaining farmers markets, CSAs, buying clubs, farm-‐direct or other food deliveries, and mobile vending 1.2.1 Reduce parking requirements for farmers markets and produce stands 1.2.2 Recognize these businesses as part of the food economy and allow them as permitted uses
in county and city code
2. Increase the availability of healthy food options relative to unhealthy food options
By 2035, density of unhealthy food in UGA census tracts will decline, while density of healthy food retail options will have increased.
2.1 Encourage and promote healthy options at all food establishments 2.1.1 Create incentives for offering healthy food and support schools, health care, restaurants,
businesses, and other institutions that develop and adopt healthy food policies and increase proportion of healthy food choices
2.1.2 Require county agencies to fully implement adopted healthy food policies and apply local food procurement standards
2.2 Implement measures that discourage or prohibit dense concentrations of unhealthy food 2.2.1 Undertake periodic assessments of county regional food system 2.2.2 Include assessment and planning for food access in sub-‐area planning processes, and use
zoning or design overlays to limit the density of unhealthy food 2.2.3 Focus on decreasing unhealthy food sources in areas that already have a high concentration
of these types of stores
Policy recommendations
Access to Healthy Foods 9
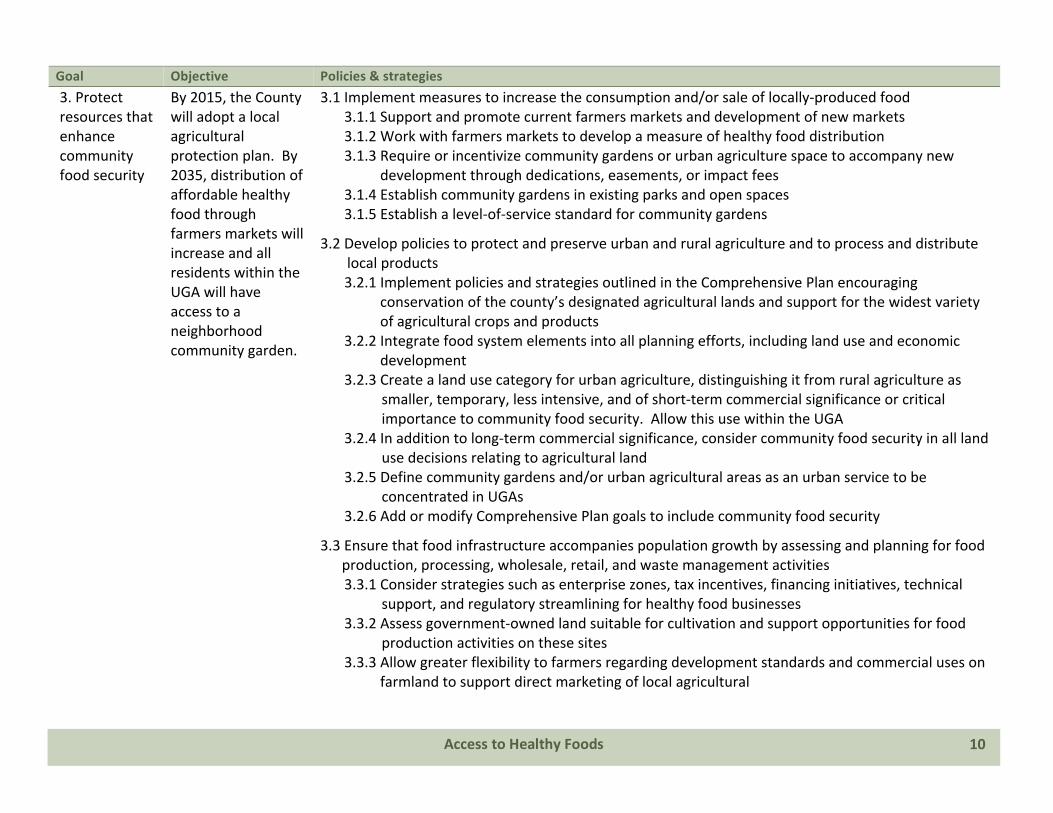
Goal Objective Policies & strategies 3. Protect resources that enhance community food security
By 2015, the County will adopt a local agricultural protection plan. By 2035, distribution of affordable healthy food through farmers markets will increase and all residents within the UGA will have access to a neighborhood community garden.
3.1 Implement measures to increase the consumption and/or sale of locally-‐produced food 3.1.1 Support and promote current farmers markets and development of new markets 3.1.2 Work with farmers markets to develop a measure of healthy food distribution 3.1.3 Require or incentivize community gardens or urban agriculture space to accompany new
development through dedications, easements, or impact fees 3.1.4 Establish community gardens in existing parks and open spaces 3.1.5 Establish a level-‐of-‐service standard for community gardens
3.2 Develop policies to protect and preserve urban and rural agriculture and to process and distribute local products 3.2.1 Implement policies and strategies outlined in the Comprehensive Plan encouraging
conservation of the county’s designated agricultural lands and support for the widest variety of agricultural crops and products
3.2.2 Integrate food system elements into all planning efforts, including land use and economic development
3.2.3 Create a land use category for urban agriculture, distinguishing it from rural agriculture as smaller, temporary, less intensive, and of short-‐term commercial significance or critical importance to community food security. Allow this use within the UGA
3.2.4 In addition to long-‐term commercial significance, consider community food security in all land use decisions relating to agricultural land
3.2.5 Define community gardens and/or urban agricultural areas as an urban service to be concentrated in UGAs
3.2.6 Add or modify Comprehensive Plan goals to include community food security
3.3 Ensure that food infrastructure accompanies population growth by assessing and planning for food production, processing, wholesale, retail, and waste management activities 3.3.1 Consider strategies such as enterprise zones, tax incentives, financing initiatives, technical
support, and regulatory streamlining for healthy food businesses 3.3.2 Assess government-‐owned land suitable for cultivation and support opportunities for food
production activities on these sites 3.3.3 Allow greater flexibility to farmers regarding development standards and commercial uses on
farmland to support direct marketing of local agricultural
Access to Healthy Foods 10
Access to Healthy Foods 11
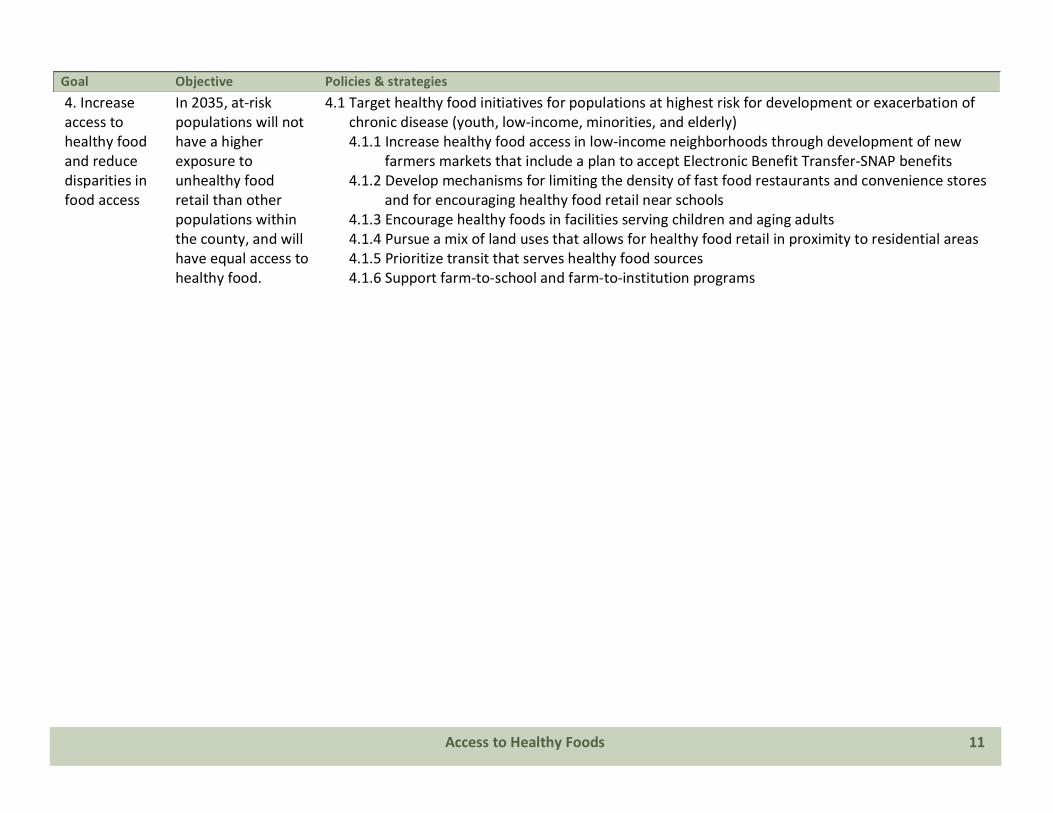
Goal Objective Policies & strategies 4. Increase access to healthy food and reduce disparities in food access
In 2035, at-‐risk populations will not have a higher exposure to unhealthy food retail than other populations within the county, and will have equal access to healthy food.
4.1 Target healthy food initiatives for populations at highest risk for development or exacerbation of chronic disease (youth, low-‐income, minorities, and elderly) 4.1.1 Increase healthy food access in low-‐income neighborhoods through development of new
farmers markets that include a plan to accept Electronic Benefit Transfer-‐SNAP benefits 4.1.2 Develop mechanisms for limiting the density of fast food restaurants and convenience stores
and for encouraging healthy food retail near schools 4.1.3 Encourage healthy foods in facilities serving children and aging adults 4.1.4 Pursue a mix of land uses that allows for healthy food retail in proximity to residential areas 4.1.5 Prioritize transit that serves healthy food sources 4.1.6 Support farm-‐to-‐school and farm-‐to-‐institution programs
Active Transportation and Land Use
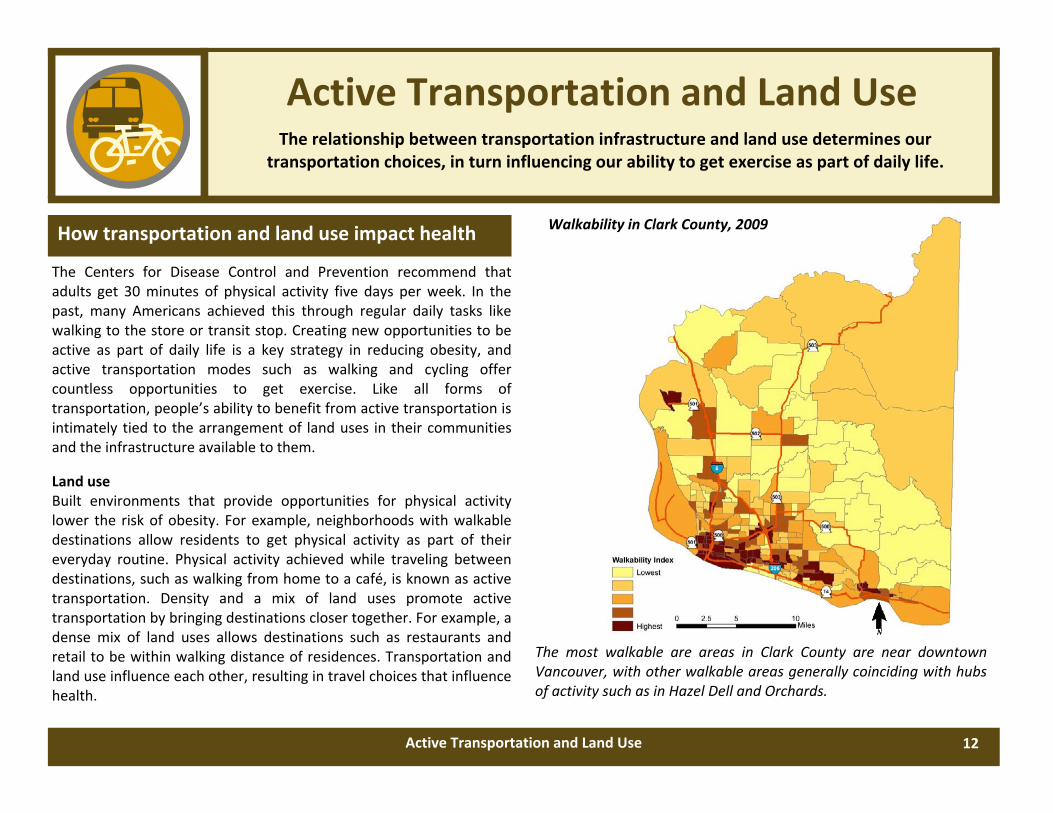
The Centers for Disease Control and Prevention recommend that adults get 30 minutes of physical activity five days per week. In the past, many Americans achieved this through regular daily tasks like walking to the store or transit stop. Creating new opportunities to be active as part of daily life is a key strategy in reducing obesity, and active transportation modes such as walking and cycling offer countless opportunities to get exercise. Like all forms of transportation, people’s ability to benefit from active transportation is intimately tied to the arrangement of land uses in their communities and the infrastructure available to them.
Land use Built environments that provide opportunities for physical activity lower the risk of obesity. For example, neighborhoods with walkable destinations allow residents to get physical activity as part of their everyday routine. Physical activity achieved while traveling between destinations, such as walking from home to a café, is known as active transportation. Density and a mix of land uses promote active transportation by bringing destinations closer together. For example, a dense mix of land uses allows destinations such as restaurants and retail to be within walking distance of residences. Transportation and land use influence each other, resulting in travel choices that influence health.
How transportation and land use impact health
The relationship between transportation infrastructure and land use determines our transportation choices, in turn influencing our ability to get exercise as part of daily life.
Active Transportation and Land Use 12
The most walkable are areas in Clark County are near downtown Vancouver, with other walkable areas generally coinciding with hubs of activity such as in Hazel Dell and Orchards.
Walkability in Clark County, 2009
Active Transportation and Land Use 13
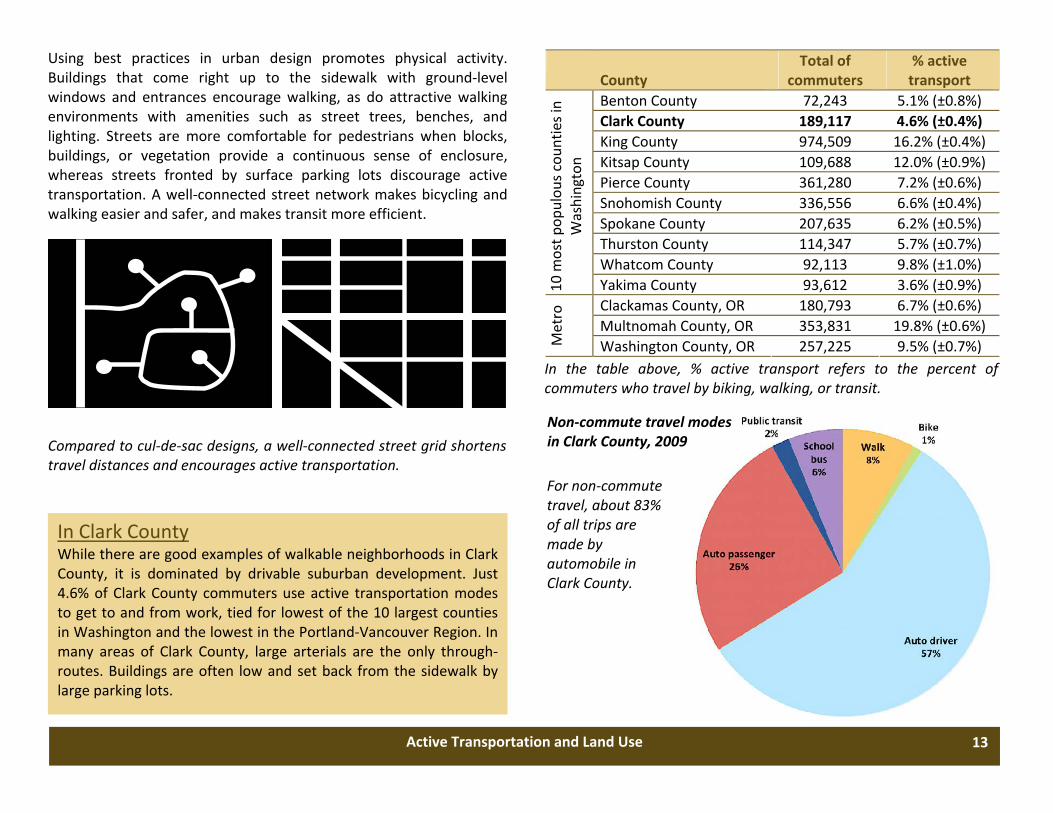
Using best practices in urban design promotes physical activity. Buildings that come right up to the sidewalk with ground‐level windows and entrances encourage walking, as do attractive walking environments with amenities such as street trees, benches, and lighting. Streets are more comfortable for pedestrians when blocks, buildings, or vegetation provide a continuous sense of enclosure, whereas streets fronted by surface parking lots discourage active transportation. A well‐connected street network makes bicycling and walking easier and safer, and makes transit more efficient.
In Clark County While there are good examples of walkable neighborhoods in Clark County, it is dominated by drivable suburban development. Just 4.6% of Clark County commuters use active transportation modes to get to and from work, tied for lowest of the 10 largest counties in Washington and the lowest in the Portland‐Vancouver Region. In many areas of Clark County, large arterials are the only through‐routes. Buildings are often low and set back from the sidewalk by large parking lots.
Total of commuters
% active County transport Benton County 72,243 5.1% (±0.8%)
10 m
ost p
opulou
s coun
ties in
Washington
Clark County 189,117 4.6% (±0.4%) King County 974,509 16.2% (±0.4%) Kitsap County 109,688 12.0% (±0.9%) Pierce County 361,280 7.2% (±0.6%) Snohomish County 336,556 6.6% (±0.4%) Spokane County 207,635 6.2% (±0.5%) Thurston County 114,347 5.7% (±0.7%) Whatcom County 92,113 9.8% (±1.0%) Yakima County 93,612 3.6% (±0.9%) Clackamas County, OR 180,793 6.7% (±0.6%) Multnomah County, OR 353,831 19.8% (±0.6%)
Metro
Washington County, OR 257,225 9.5% (±0.7%)
For non‐commute travel, about 83% of all trips are made by automobile in Clark County.
Non‐commute travel modes in Clark County, 2009
In the table above, % active transport refers to the percent of commuters who travel by biking, walking, or transit.
Compared to cul‐de‐sac designs, a well‐connected street grid shortens travel distances and encourages active transportation.
Auto‐dependent development reinforces sedentary lifestyles, and spending time driving is associated with a higher likelihood of obesity. Research shows that each additional hour per day spent in a car increases the odds of obesity by about 6%, while each additional half mile walked decreases the odds by about the same.
Active Transportation and Land Use 14
Infrastructure Greater perceived safety and comfort is associated with higher levels of active transportation. For example, the speed of traffic or lack of separation from traffic may deter some from cycling despite statistics demonstrating relatively safe streets. Research suggests that bike lanes and sidewalks on busy roads alone are unlikely to increase active transportation; a greater degree of comfort is required. This is especially true in urban areas, where 85% of Washington bicycle and pedestrian crashes take place. For those who feel unsafe on streets, separated sidewalks and trails can offer a more comfortable experience.
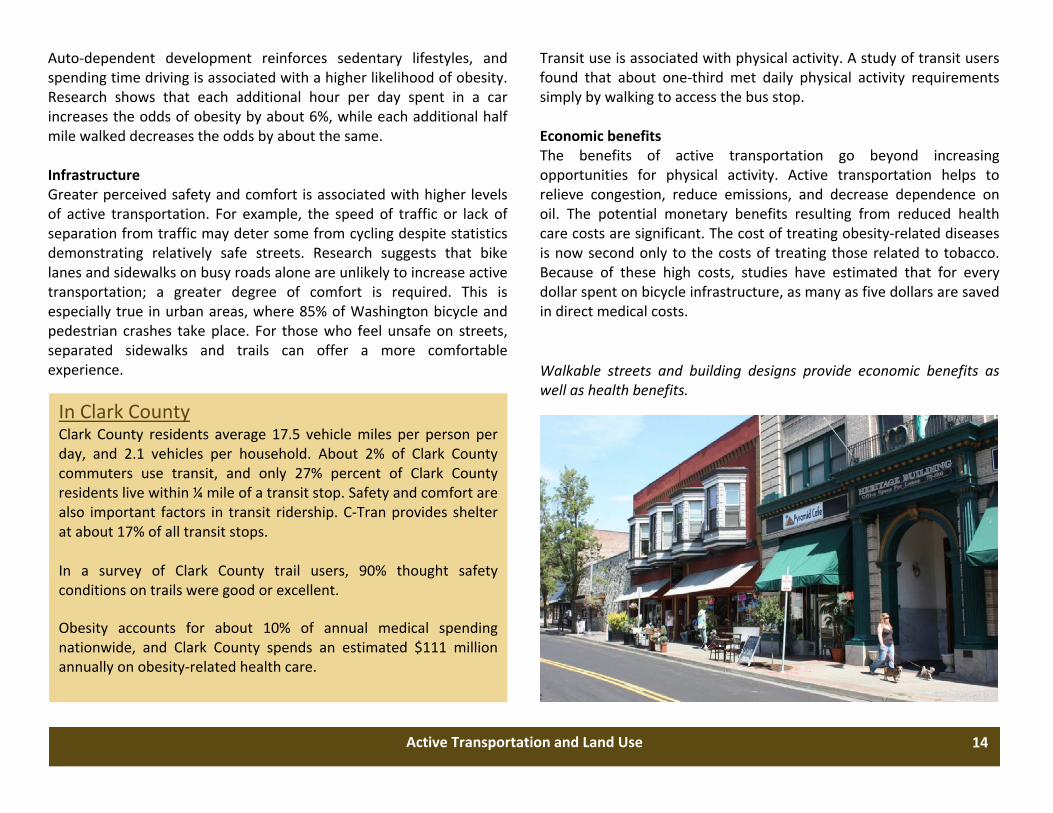
In Clark County Clark County residents average 17.5 vehicle miles per person per day, and 2.1 vehicles per household. About 2% of Clark County commuters use transit, and only 27% percent of Clark County residents live within ¼ mile of a transit stop. Safety and comfort are also important factors in transit ridership. C‐Tran provides shelter at about 17% of all transit stops. In a survey of Clark County trail users, 90% thought safety conditions on trails were good or excellent. Obesity accounts for about 10% of annual medical spending nationwide, and Clark County spends an estimated $111 million annually on obesity‐related health care.
Transit use is associated with physical activity. A study of transit users found that about one‐third met daily physical activity requirements simply by walking to access the bus stop.
Walkable streets and building designs provide economic benefits as well as health benefits.
The benefits of active transportation go beyond increasing opportunities for physical activity. Active transportation helps to relieve congestion, reduce emissions, and decrease dependence on oil. The potential monetary benefits resulting from reduced health care costs are significant. The cost of treating obesity‐related diseases is now second only to the costs of treating those related to tobacco. Because of these high costs, studies have estimated that for every dollar spent on bicycle infrastructure, as many as five dollars are saved in direct medical costs.
Economic benefits
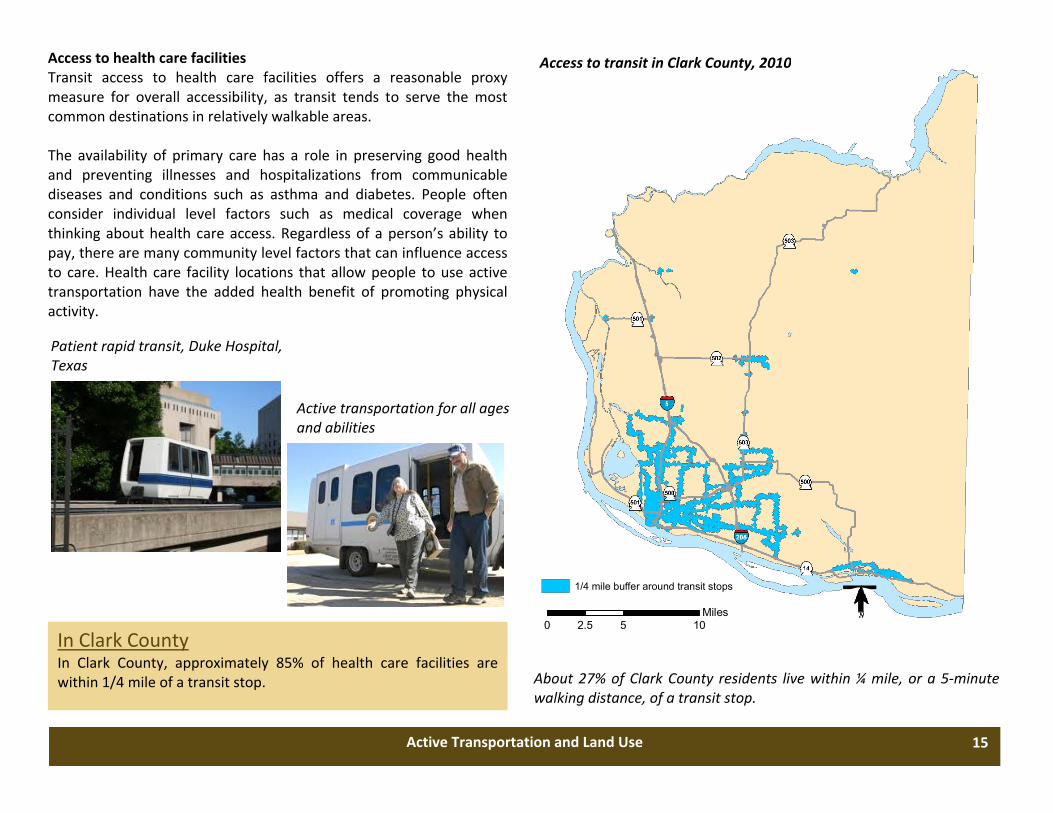
Access to health care facilities Transit access to health care facilities offers a reasonable proxy measure for overall accessibility, as transit tends to serve the most common destinations in relatively walkable areas. The availability of primary care has a role in preserving good health and preventing illnesses and hospitalizations from communicable diseases and conditions such as asthma and diabetes. People often consider individual level factors such as medical coverage when thinking about health care access. Regardless of a person’s ability to pay, there are many community level factors that can influence access to care. Health care facility locations that allow people to use active transportation have the added health benefit of promoting physical activity.
0 5 102.5Miles
1/4 mile buffer around transit stops
¯About 27% of Clark County residents live within ¼ mile, or a 5‐minute walking distance, of a transit stop.
Access to transit in Clark County, 2010
Patient rapid transit, Duke Hospital, Texas
Active transportation for all ages and abilities
In Clark County In Clark County, approximately 85% of health care facilities are within 1/4 mile of a transit stop.
Active Transportation and Land Use 15
Disparities in Clark County Socioeconomic status (SES) Approximately 4% of Clark County households do not own a vehicle and must rely on other modes of transportation. While the low SES population is more likely to ride transit compared with high SES, overall the rate of public transit use is low. There is a moderate significant correlation between the walkability index and poverty. Low SES households are more likely to live in walkable neighborhoods compared to high SES groups. This is likely because low‐income households tend to live in older housing located in older, more walkable areas of Vancouver. Race and ethnicity Approximately 31% of white residents live within walking distance of a transit stop compared with 38% of non‐white residents. There is a weak significant correlation between the walkability index and the percent of neighborhood population that is non‐white. Non‐whites are more likely to live in walkable neighborhoods compared to whites. Age About 31% of Clark County youth and 35% of residents aged 65 years and older live within ¼ mile of a transit stop. There is a weak correlation between residents aged 65 years and older and walkability in Clark County. Older adults are slightly more likely to live in walkable neighborhoods compared with persons younger than 20. Geography Public transit routes, common destinations, and active transportation infrastructure are more common in urbanized areas. Urban areas therefore offer more opportunities for active transportation than rural areas.
Conditions needed to thrive
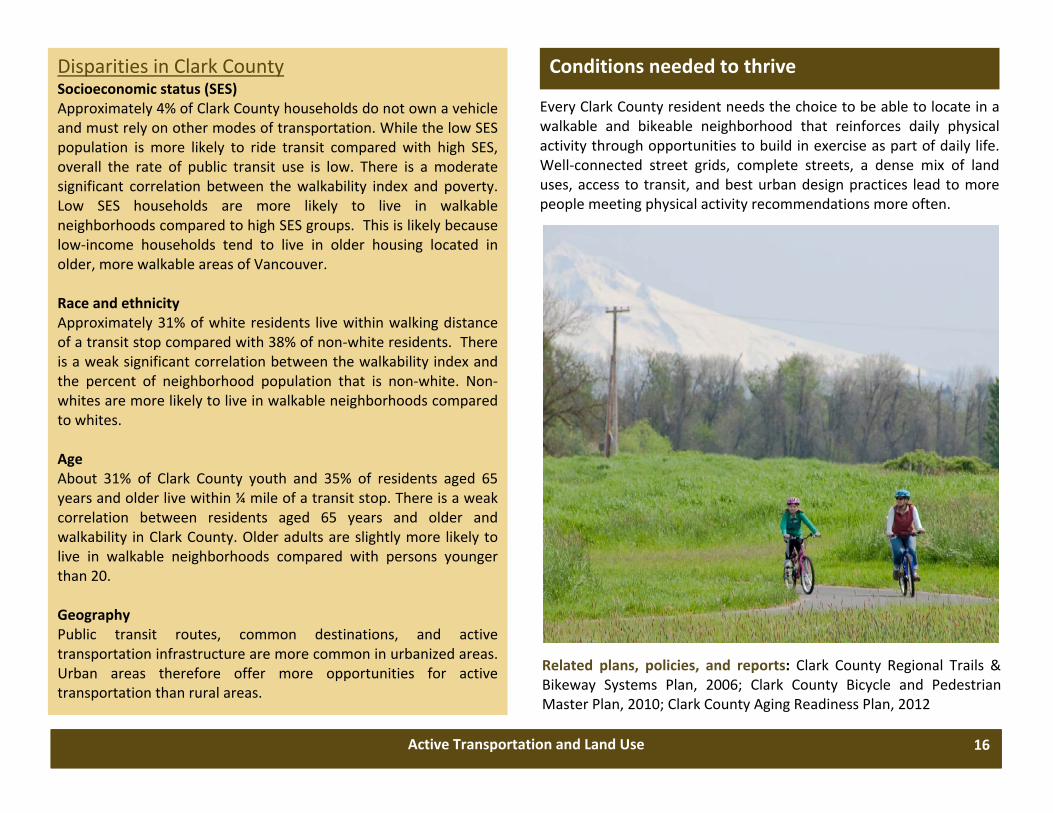
Every Clark County resident needs the choice to be able to locate in a walkable and bikeable neighborhood that reinforces daily physical activity through opportunities to build in exercise as part of daily life. Well‐connected street grids, complete streets, a dense mix of land uses, access to transit, and best urban design practices lead to more people meeting physical activity recommendations more often.
Related plans, policies, and reports: Clark County Regional Trails & Bikeway Systems Plan, 2006; Clark County Bicycle and Pedestrian Master Plan, 2010; Clark County Aging Readiness Plan, 2012
Active Transportation and Land Use 16
Policy recommendations
Active Transportation and Land Use 17
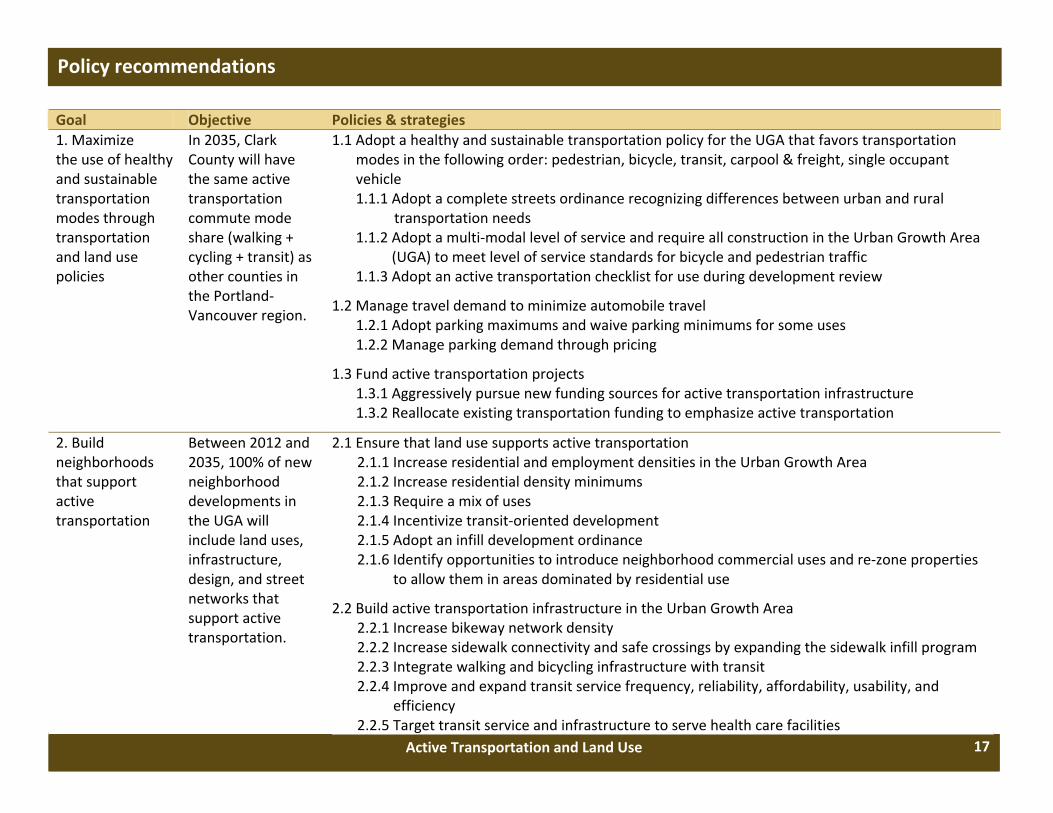
Goal Objective Policies & strategies 1. Maximize the use of healthy and sustainable transportation modes through transportation and land use policies
In 2035, Clark County will have the same active transportation commute mode share (walking + cycling + transit) as other counties in the Portland‐Vancouver region.
1.1 Adopt a healthy and sustainable transportation policy for the UGA that favors transportation modes in the following order: pedestrian, bicycle, transit, carpool & freight, single occupant vehicle 1.1.1 Adopt a complete streets ordinance recognizing differences between urban and rural
transportation needs 1.1.2 Adopt a multi‐modal level of service and require all construction in the Urban Growth Area
(UGA) to meet level of service standards for bicycle and pedestrian traffic 1.1.3 Adopt an active transportation checklist for use during development review
1.2 Manage travel demand to minimize automobile travel 1.2.1 Adopt parking maximums and waive parking minimums for some uses 1.2.2 Manage parking demand through pricing
1.3 Fund active transportation projects 1.3.1 Aggressively pursue new funding sources for active transportation infrastructure 1.3.2 Reallocate existing transportation funding to emphasize active transportation
2. Build neighborhoods that support active transportation
Between 2012 and 2035, 100% of new neighborhood developments in the UGA will include land uses, infrastructure, design, and street networks that support active transportation.
2.1 Ensure that land use supports active transportation 2.1.1 Increase residential and employment densities in the Urban Growth Area 2.1.2 Increase residential density minimums 2.1.3 Require a mix of uses 2.1.4 Incentivize transit‐oriented development 2.1.5 Adopt an infill development ordinance 2.1.6 Identify opportunities to introduce neighborhood commercial uses and re‐zone properties to allow them in areas dominated by residential use
2.2 Build active transportation infrastructure in the Urban Growth Area 2.2.1 Increase bikeway network density 2.2.2 Increase sidewalk connectivity and safe crossings by expanding the sidewalk infill program 2.2.3 Integrate walking and bicycling infrastructure with transit 2.2.4 Improve and expand transit service frequency, reliability, affordability, usability, and efficiency 2.2.5 Target transit service and infrastructure to serve health care facilities
18 Active Transportation and Land Use
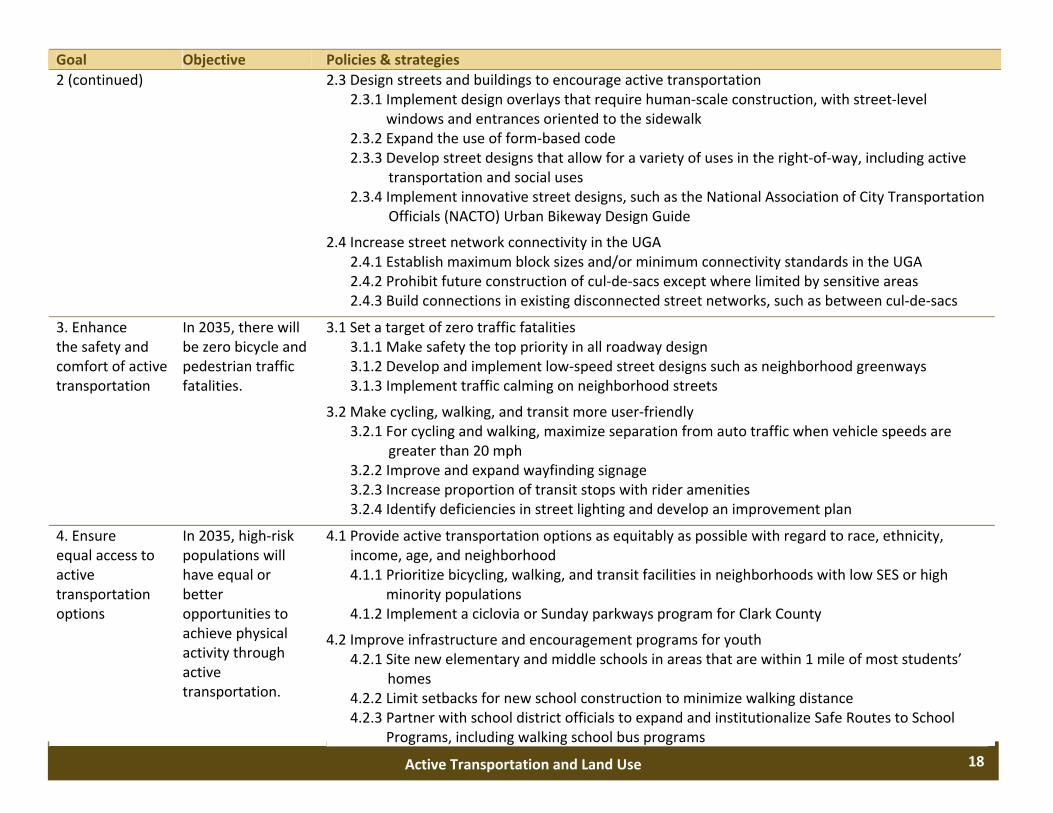
Goal Objective Policies & strategies 2 (continued) 2.3 Design streets and buildings to encourage active transportation
2.3.1 Implement design overlays that require human‐scale construction, with street‐level windows and entrances oriented to the sidewalk
2.3.2 Expand the use of form‐based code 2.3.3 Develop street designs that allow for a variety of uses in the right‐of‐way, including active
transportation and social uses 2.3.4 Implement innovative street designs, such as the National Association of City Transportation
Officials (NACTO) Urban Bikeway Design Guide
2.4 Increase street network connectivity in the UGA 2.4.1 Establish maximum block sizes and/or minimum connectivity standards in the UGA 2.4.2 Prohibit future construction of cul‐de‐sacs except where limited by sensitive areas 2.4.3 Build connections in existing disconnected street networks, such as between cul‐de‐sacs
3. Enhance the safety and comfort of active transportation
In 2035, there will be zero bicycle and pedestrian traffic fatalities.
3.1 Set a target of zero traffic fatalities 3.1.1 Make safety the top priority in all roadway design 3.1.2 Develop and implement low‐speed street designs such as neighborhood greenways 3.1.3 Implement traffic calming on neighborhood streets
3.2 Make cycling, walking, and transit more user‐friendly 3.2.1 For cycling and walking, maximize separation from auto traffic when vehicle speeds are
greater than 20 mph 3.2.2 Improve and expand wayfinding signage 3.2.3 Increase proportion of transit stops with rider amenities 3.2.4 Identify deficiencies in street lighting and develop an improvement plan
4. Ensure equal access to active transportation options
In 2035, high‐risk populations will have equal or better opportunities to achieve physical activity through active transportation.
4.1 Provide active transportation options as equitably as possible with regard to race, ethnicity, income, age, and neighborhood 4.1.1 Prioritize bicycling, walking, and transit facilities in neighborhoods with low SES or high
minority populations 4.1.2 Implement a ciclovia or Sunday parkways program for Clark County
4.2 Improve infrastructure and encouragement programs for youth 4.2.1 Site new elementary and middle schools in areas that are within 1 mile of most students’
homes 4.2.2 Limit setbacks for new school construction to minimize walking distance 4.2.3 Partner with school district officials to expand and institutionalize Safe Routes to School
Programs, including walking school bus programs
0 5 102.5Miles
Parks
1/2 mile buffer to park access
UGA ¯ˉ
Parks and Open Spaces Parks and open spaces are valued assets that provide residents with important health
options including opportunities for physical activity, social interaction, and contact with nature.
Parks and Physical Activity Being physically active reduces the risk of many diseases and improves wellbeing. Research shows that access to parks increases the likelihood of meeting physical activity recommendations. The number of parks nearby, their size, and their features or amenities can all influence the amount of physical activity people achieve. People who live close to parks are more likely to use them and be physically active, especially when they live near large parks or many smaller parks. Multi-‐use trails help people meet physical activity needs for both recreation and transportation purposes.
How parks and open spaces impact health
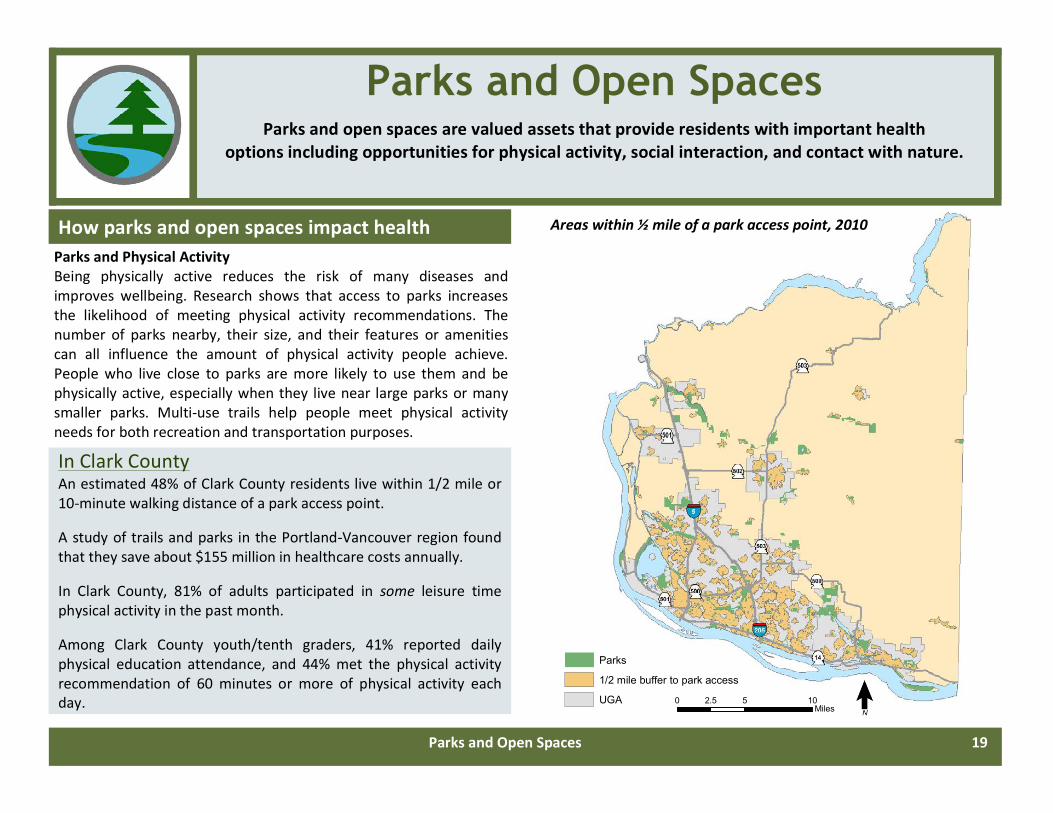
In Clark County An estimated 48% of Clark County residents live within 1/2 mile or 10-‐minute walking distance of a park access point.
A study of trails and parks in the Portland-‐Vancouver region found that they save about $155 million in healthcare costs annually.
In Clark County, 81% of adults participated in some leisure time physical activity in the past month.
Among Clark County youth/tenth graders, 41% reported daily physical education attendance, and 44% met the physical activity recommendation of 60 minutes or more of physical activity each day.
Parks and Open Spaces 19
Areas within ½ mile of a park access point, 2010
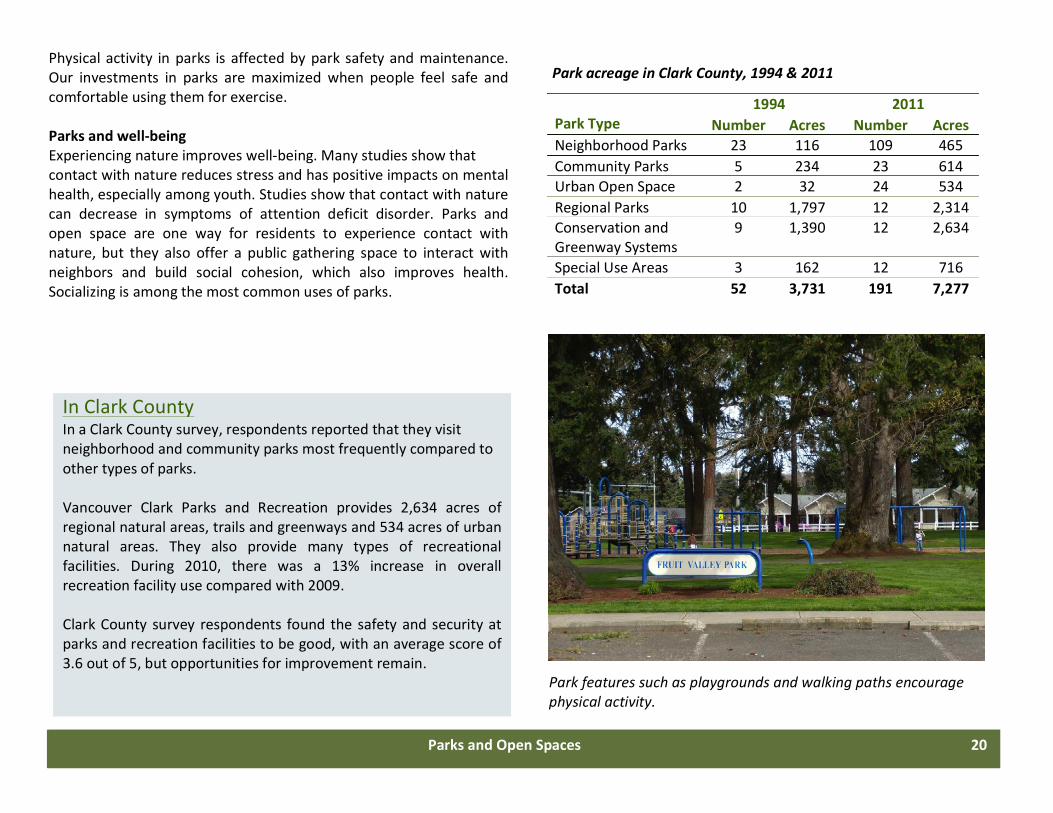
In Clark County In a Clark County survey, respondents reported that they visit neighborhood and community parks most frequently compared to other types of parks. Vancouver Clark Parks and Recreation provides 2,634 acres of regional natural areas, trails and greenways and 534 acres of urban natural areas. They also provide many types of recreational facilities. During 2010, there was a 13% increase in overall recreation facility use compared with 2009. Clark County survey respondents found the safety and security at parks and recreation facilities to be good, with an average score of 3.6 out of 5, but opportunities for improvement remain.
Parks and Open Spaces 20
Park Type
1994 2011 Number Acres Number Acres
Neighborhood Parks 23 116 109 465 Community Parks 5 234 23 614 Urban Open Space 2 32 24 534 Regional Parks 10 1,797 12 2,314 Conservation and Greenway Systems
9 1,390 12 2,634
Special Use Areas 3 162 12 716 Total 52 3,731 191 7,277
Park acreage in Clark County, 1994 & 2011
Park features such as playgrounds and walking paths encourage physical activity.
Physical activity in parks is affected by park safety and maintenance. Our investments in parks are maximized when people feel safe and comfortable using them for exercise. Parks and well-‐being Experiencing nature improves well-‐being. Many studies show that contact with nature reduces stress and has positive impacts on mental health, especially among youth. Studies show that contact with nature can decrease in symptoms of attention deficit disorder. Parks and open space are one way for residents to experience contact with nature, but they also offer a public gathering space to interact with neighbors and build social cohesion, which also improves health. Socializing is among the most common uses of parks.
Disparities in Clark County Socioeconomic status (SES) Nationally, residents in low-‐income neighborhoods experience more barriers to accessing parks than higher income residents. However, in Clark County a greater percent of low-‐income and non-‐white residents live within ½ mile of a park access point (56% and 54% respectively) compared to the county as a whole (48%), a positive indicator of health equity. Race and ethnicity Similar to the pattern of access for low-‐income neighborhoods in Clark County, access in areas with racial and ethnic minorities is exemplary compared to other areas of the country. Approximately 54% of non-‐white Clark County residents live within ½ mile of a park access point compared with 47% of white residents. At the county level, non-‐white residents have somewhat better access to parks than white residents. Age Age is not a barrier to access. People older than 65 and younger than 20 have similar access to parks as the county as a whole. Compared to the county-‐wide figure, the same percentage of these groups lives within ½ mile of a parks access point. Geography Outside the Urban Growth Area, only 4% of residents live within ½ mile of a park access point. In some respects, rural residents can still access opportunities for physical activity in other nearby open spaces, depending on how the land around them has developed. It is likely that park access in rural areas is dependent on vehicle access.
Parks and Open Spaces 21
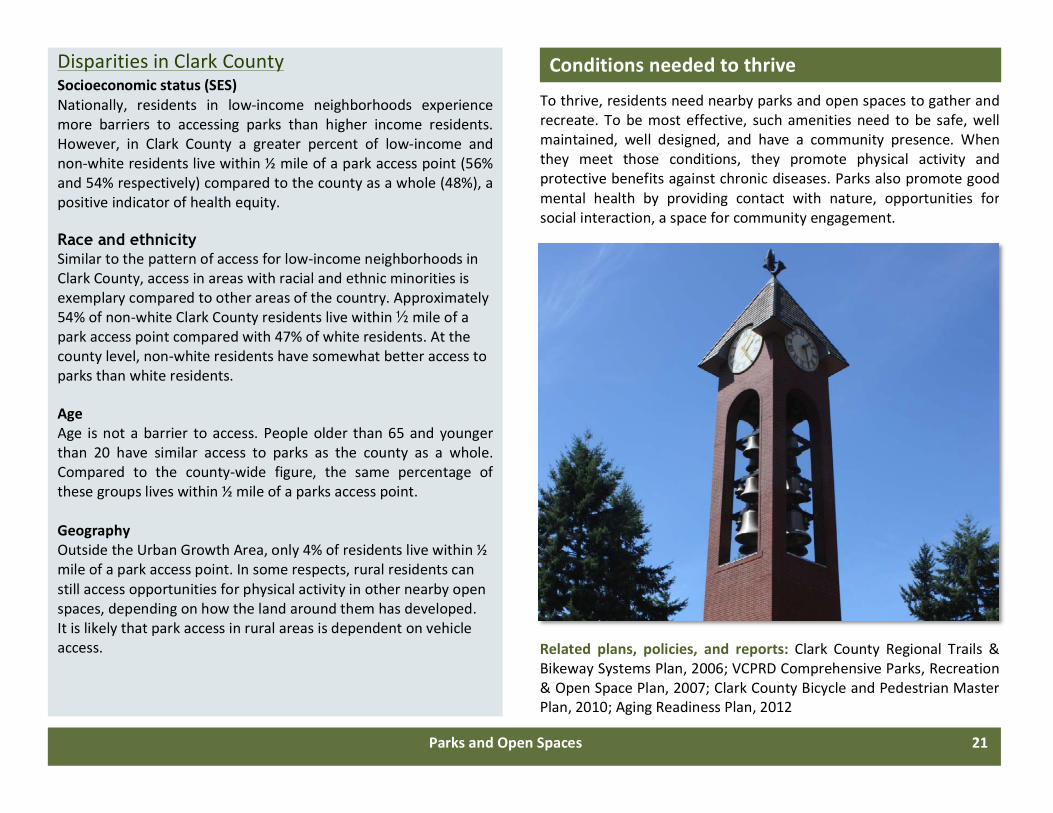
To thrive, residents need nearby parks and open spaces to gather and recreate. To be most effective, such amenities need to be safe, well maintained, well designed, and have a community presence. When they meet those conditions, they promote physical activity and protective benefits against chronic diseases. Parks also promote good mental health by providing contact with nature, opportunities for social interaction, a space for community engagement.
Conditions needed to thrive
Related plans, policies, and reports: Clark County Regional Trails & Bikeway Systems Plan, 2006; VCPRD Comprehensive Parks, Recreation & Open Space Plan, 2007; Clark County Bicycle and Pedestrian Master Plan, 2010; Aging Readiness Plan, 2012
Parks and Open Spaces 22
Policy recommendations
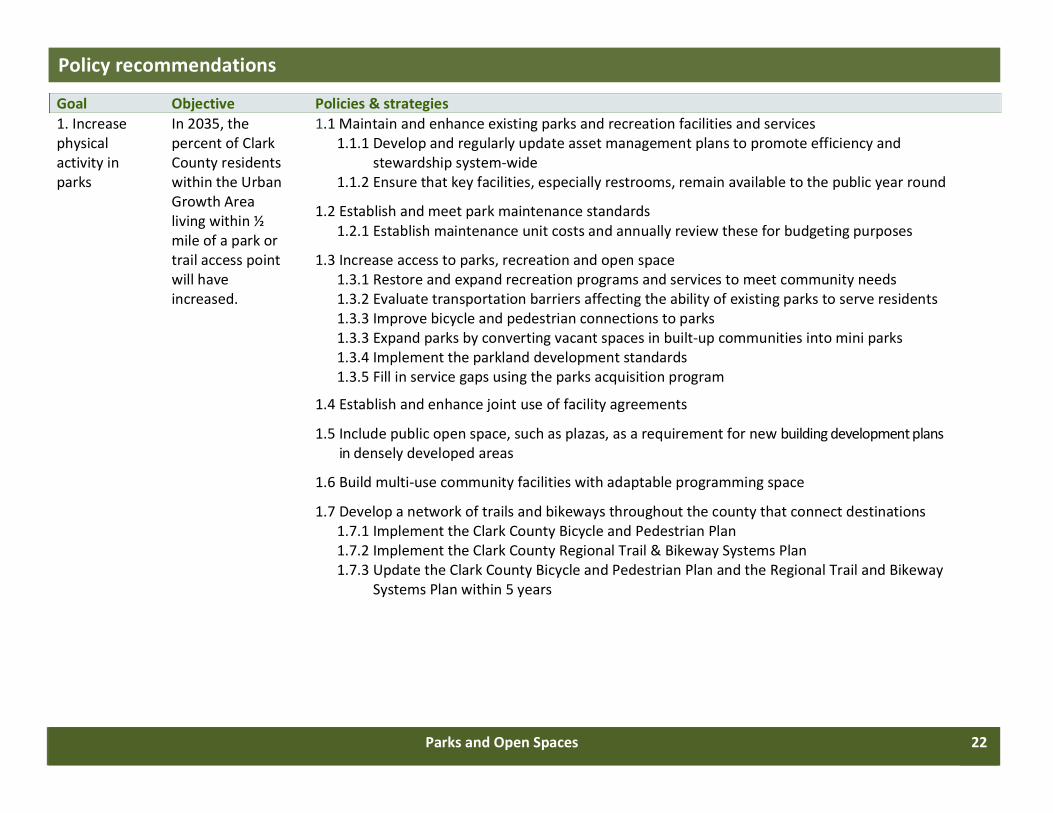
Goal Objective Policies & strategies 1. Increase physical activity in parks
In 2035, the percent of Clark County residents within the Urban Growth Area living within ½ mile of a park or trail access point will have increased.
1.1 Maintain and enhance existing parks and recreation facilities and services 1.1.1 Develop and regularly update asset management plans to promote efficiency and stewardship system-‐wide 1.1.2 Ensure that key facilities, especially restrooms, remain available to the public year round
1.2 Establish and meet park maintenance standards 1.2.1 Establish maintenance unit costs and annually review these for budgeting purposes
1.3 Increase access to parks, recreation and open space 1.3.1 Restore and expand recreation programs and services to meet community needs 1.3.2 Evaluate transportation barriers affecting the ability of existing parks to serve residents 1.3.3 Improve bicycle and pedestrian connections to parks 1.3.3 Expand parks by converting vacant spaces in built-‐up communities into mini parks 1.3.4 Implement the parkland development standards 1.3.5 Fill in service gaps using the parks acquisition program
1.4 Establish and enhance joint use of facility agreements
1.5 Include public open space, such as plazas, as a requirement for new building development plans in densely developed areas
1.6 Build multi-‐use community facilities with adaptable programming space
1.7 Develop a network of trails and bikeways throughout the county that connect destinations 1.7.1 Implement the Clark County Bicycle and Pedestrian Plan 1.7.2 Implement the Clark County Regional Trail & Bikeway Systems Plan 1.7.3 Update the Clark County Bicycle and Pedestrian Plan and the Regional Trail and Bikeway Systems Plan within 5 years
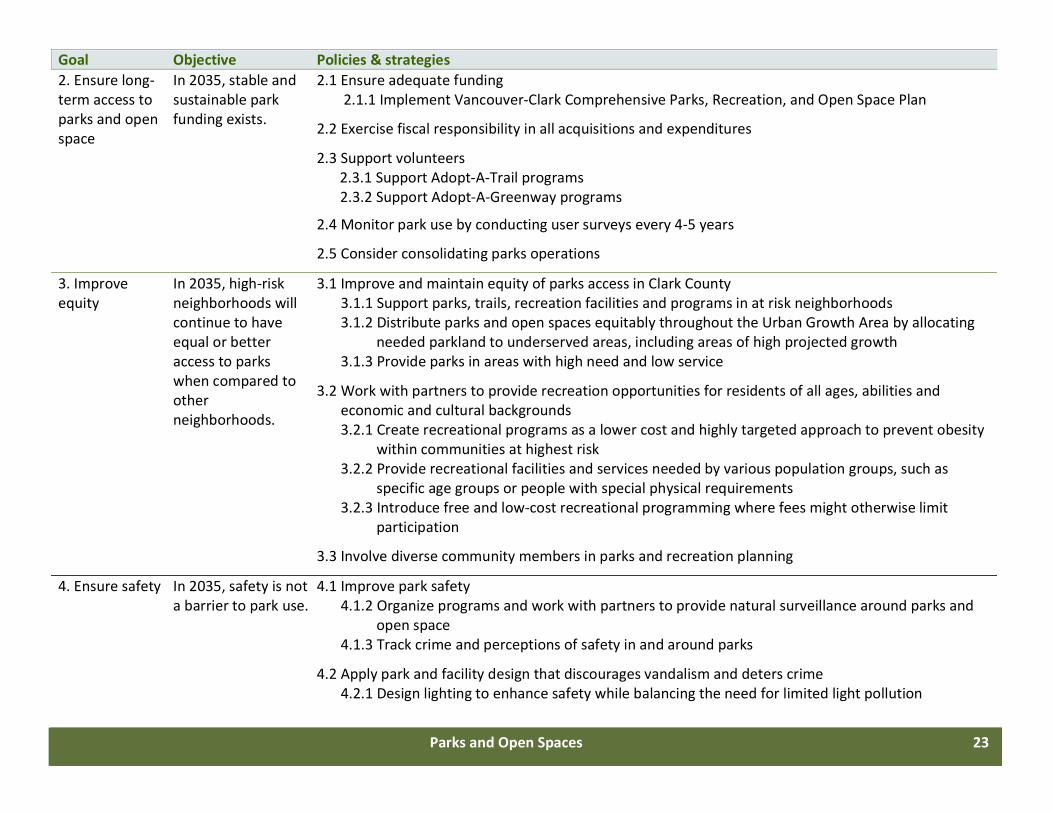
Goal Objective Policies & strategies 2. Ensure long-‐term access to parks and open space
In 2035, stable and sustainable park funding exists.
2.1 Ensure adequate funding 2.1.1 Implement Vancouver-‐Clark Comprehensive Parks, Recreation, and Open Space Plan
2.2 Exercise fiscal responsibility in all acquisitions and expenditures
2.3 Support volunteers 2.3.1 Support Adopt-‐A-‐Trail programs 2.3.2 Support Adopt-‐A-‐Greenway programs
2.4 Monitor park use by conducting user surveys every 4-‐5 years
2.5 Consider consolidating parks operations
3. Improve equity
In 2035, high-‐risk neighborhoods will continue to have equal or better access to parks when compared to other neighborhoods.
3.1 Improve and maintain equity of parks access in Clark County 3.1.1 Support parks, trails, recreation facilities and programs in at risk neighborhoods 3.1.2 Distribute parks and open spaces equitably throughout the Urban Growth Area by allocating
needed parkland to underserved areas, including areas of high projected growth 3.1.3 Provide parks in areas with high need and low service
3.2 Work with partners to provide recreation opportunities for residents of all ages, abilities and economic and cultural backgrounds 3.2.1 Create recreational programs as a lower cost and highly targeted approach to prevent obesity
within communities at highest risk 3.2.2 Provide recreational facilities and services needed by various population groups, such as
specific age groups or people with special physical requirements 3.2.3 Introduce free and low-‐cost recreational programming where fees might otherwise limit
participation
3.3 Involve diverse community members in parks and recreation planning
4. Ensure safety In 2035, safety is not a barrier to park use.
4.1 Improve park safety 4.1.2 Organize programs and work with partners to provide natural surveillance around parks and
open space 4.1.3 Track crime and perceptions of safety in and around parks
4.2 Apply park and facility design that discourages vandalism and deters crime 4.2.1 Design lighting to enhance safety while balancing the need for limited light pollution
Parks and Open Spaces 23
1
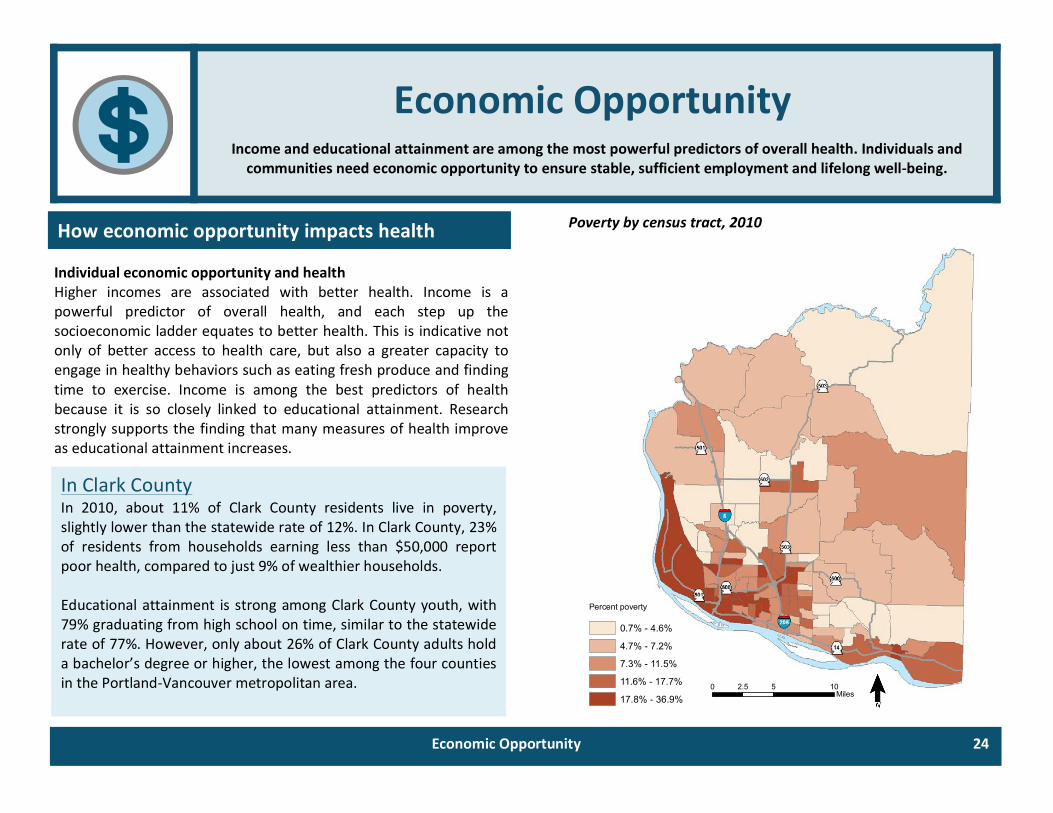
Individual economic opportunity and health Higher incomes are associated with better health. Income is a powerful predictor of overall health, and each step up the socioeconomic ladder equates to better health. This is indicative not only of better access to health care, but also a greater capacity to engage in healthy behaviors such as eating fresh produce and finding time to exercise. Income is among the best predictors of health because it is so closely linked to educational attainment. Research strongly supports the finding that many measures of health improve as educational attainment increases.
How economic opportunity impacts health
2
Income and educational attainment are among the most powerful predictors of overall health. Individuals and communities need economic opportunity to ensure stable, sufficient employment and lifelong well-‐being.
Economic Opportunity
In Clark County In 2010, about 11% of Clark County residents live in poverty, slightly lower than the statewide rate of 12%. In Clark County, 23% of residents from households earning less than $50,000 report poor health, compared to just 9% of wealthier households. Educational attainment is strong among Clark County youth, with 79% graduating from high school on time, similar to the statewide rate of 77%. However, only about 26% of Clark County adults hold a bachelor’s degree or higher, the lowest among the four counties in the Portland-‐Vancouver metropolitan area.
Economic Opportunity 24
0 5 102.5Miles
0.7% - 4.6%
4.7% - 7.2%
7.3% - 11.5%
11.6% - 17.7%
17.8% - 36.9% ¯ˉ
Percent poverty
Poverty by census tract, 2010
3
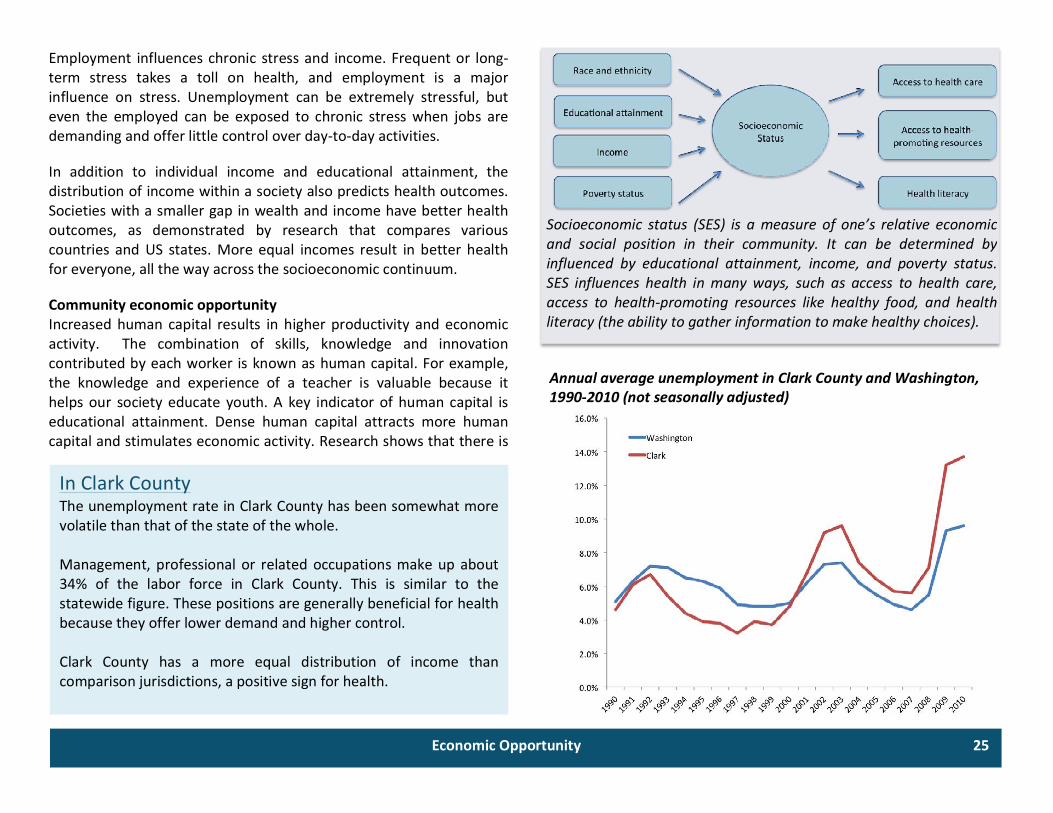
Employment influences chronic stress and income. Frequent or long-‐term stress takes a toll on health, and employment is a major influence on stress. Unemployment can be extremely stressful, but even the employed can be exposed to chronic stress when jobs are demanding and offer little control over day-‐to-‐day activities. In addition to individual income and educational attainment, the distribution of income within a society also predicts health outcomes. Societies with a smaller gap in wealth and income have better health outcomes, as demonstrated by research that compares various countries and US states. More equal incomes result in better health for everyone, all the way across the socioeconomic continuum. Community economic opportunity Increased human capital results in higher productivity and economic activity. The combination of skills, knowledge and innovation contributed by each worker is known as human capital. For example, the knowledge and experience of a teacher is valuable because it helps our society educate youth. A key indicator of human capital is educational attainment. Dense human capital attracts more human capital and stimulates economic activity. Research shows that there is
In Clark County The unemployment rate in Clark County has been somewhat more volatile than that of the state of the whole. Management, professional or related occupations make up about 34% of the labor force in Clark County. This is similar to the statewide figure. These positions are generally beneficial for health because they offer lower demand and higher control. Clark County has a more equal distribution of income than comparison jurisdictions, a positive sign for health.
Annual average unemployment in Clark County and Washington, 1990-‐2010 (not seasonally adjusted)
Economic Opportunity 25
Socioeconomic status (SES) is a measure of one’s relative economic and social position in their community. It can be determined by influenced by educational attainment, income, and poverty status. SES influences health in many ways, such as access to health care, access to health-‐promoting resources like healthy food, and health literacy (the ability to gather information to make healthy choices).
4
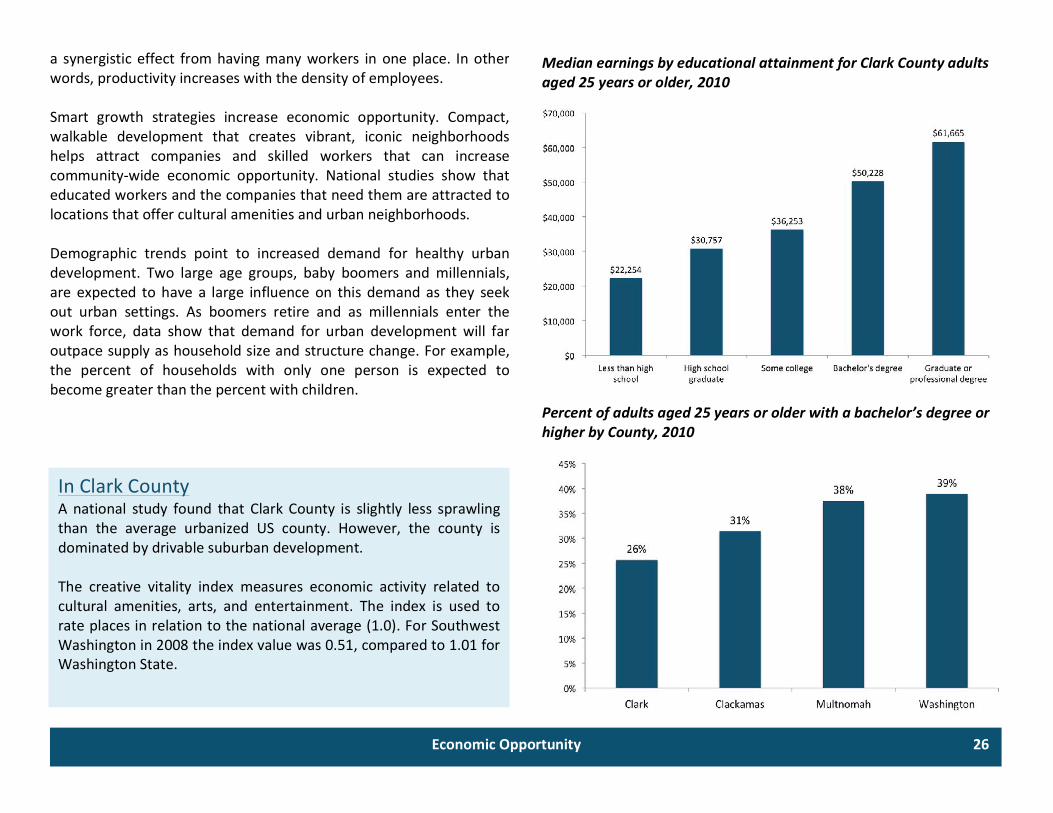
a synergistic effect from having many workers in one place. In other words, productivity increases with the density of employees. Smart growth strategies increase economic opportunity. Compact, walkable development that creates vibrant, iconic neighborhoods helps attract companies and skilled workers that can increase community-‐wide economic opportunity. National studies show that educated workers and the companies that need them are attracted to locations that offer cultural amenities and urban neighborhoods. Demographic trends point to increased demand for healthy urban development. Two large age groups, baby boomers and millennials, are expected to have a large influence on this demand as they seek out urban settings. As boomers retire and as millennials enter the work force, data show that demand for urban development will far outpace supply as household size and structure change. For example, the percent of households with only one person is expected to become greater than the percent with children.
5
Median earnings by educational attainment for Clark County adults aged 25 years or older, 2010
In Clark County A national study found that Clark County is slightly less sprawling than the average urbanized US county. However, the county is dominated by drivable suburban development. The creative vitality index measures economic activity related to cultural amenities, arts, and entertainment. The index is used to rate places in relation to the national average (1.0). For Southwest Washington in 2008 the index value was 0.51, compared to 1.01 for Washington State.
Economic Opportunity 26
Percent of adults aged 25 years or older with a bachelor’s degree or higher by County, 2010
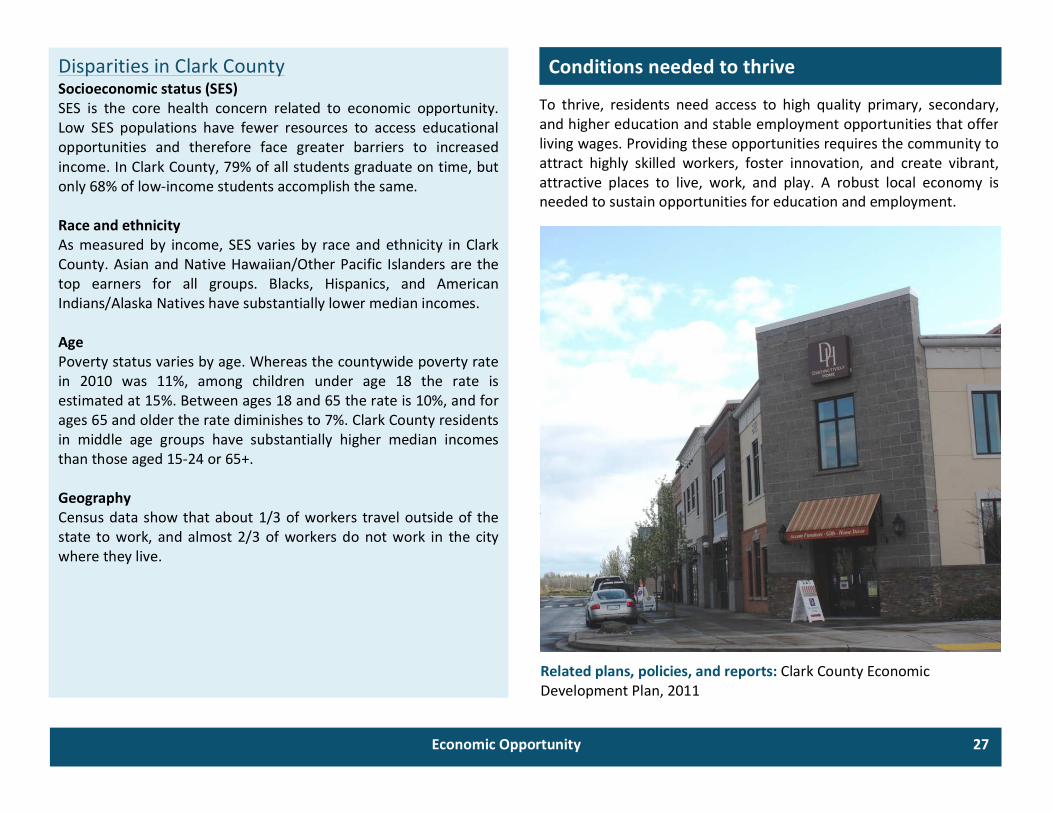
To thrive, residents need access to high quality primary, secondary, and higher education and stable employment opportunities that offer living wages. Providing these opportunities requires the community to attract highly skilled workers, foster innovation, and create vibrant, attractive places to live, work, and play. A robust local economy is needed to sustain opportunities for education and employment.
Economic Opportunity 27
Conditions needed to thrive Disparities in Clark County Socioeconomic status (SES) SES is the core health concern related to economic opportunity. Low SES populations have fewer resources to access educational opportunities and therefore face greater barriers to increased income. In Clark County, 79% of all students graduate on time, but only 68% of low-‐income students accomplish the same. Race and ethnicity As measured by income, SES varies by race and ethnicity in Clark County. Asian and Native Hawaiian/Other Pacific Islanders are the top earners for all groups. Blacks, Hispanics, and American Indians/Alaska Natives have substantially lower median incomes. Age Poverty status varies by age. Whereas the countywide poverty rate in 2010 was 11%, among children under age 18 the rate is estimated at 15%. Between ages 18 and 65 the rate is 10%, and for ages 65 and older the rate diminishes to 7%. Clark County residents in middle age groups have substantially higher median incomes than those aged 15-‐24 or 65+. Geography Census data show that about 1/3 of workers travel outside of the state to work, and almost 2/3 of workers do not work in the city where they live.
Related plans, policies, and reports: Clark County Economic Development Plan, 2011
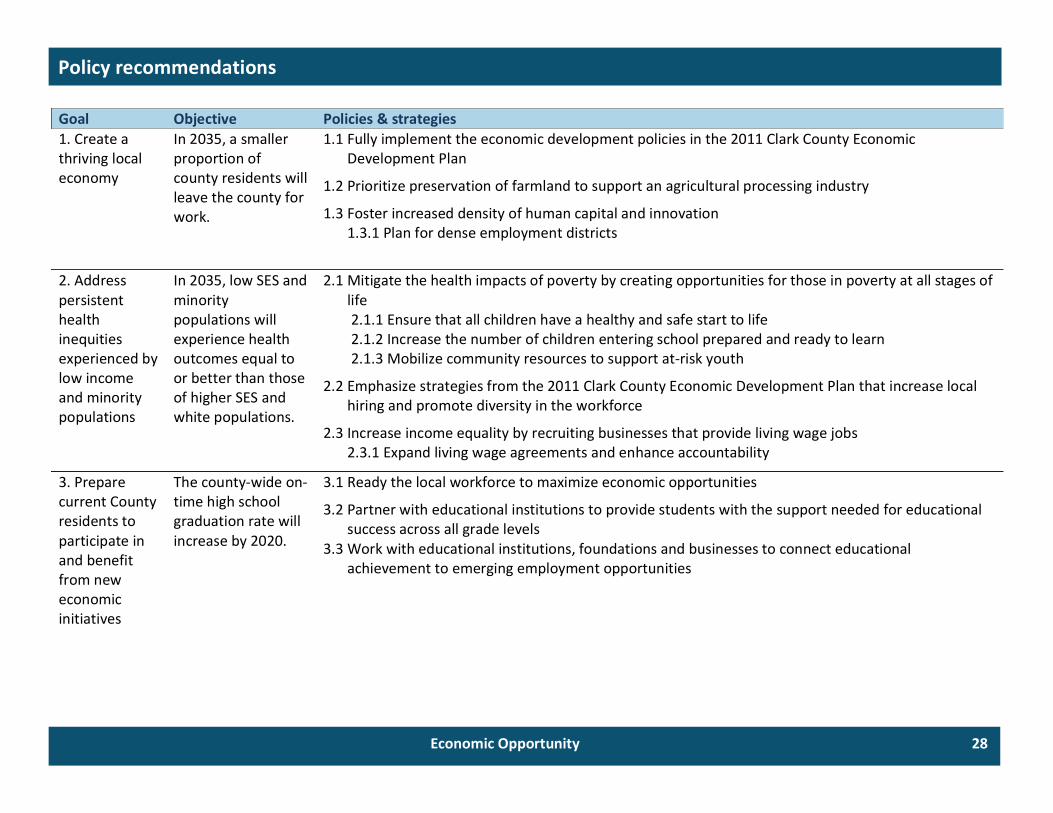
Goal Objective Policies & strategies 1. Create a thriving local economy
In 2035, a smaller proportion of county residents will leave the county for work.
1.1 Fully implement the economic development policies in the 2011 Clark County Economic Development Plan
1.2 Prioritize preservation of farmland to support an agricultural processing industry
1.3 Foster increased density of human capital and innovation 1.3.1 Plan for dense employment districts
2. Address persistent health inequities experienced by low income and minority populations
In 2035, low SES and minority populations will experience health outcomes equal to or better than those of higher SES and white populations.
2.1 Mitigate the health impacts of poverty by creating opportunities for those in poverty at all stages of life 2.1.1 Ensure that all children have a healthy and safe start to life 2.1.2 Increase the number of children entering school prepared and ready to learn 2.1.3 Mobilize community resources to support at-‐risk youth
2.2 Emphasize strategies from the 2011 Clark County Economic Development Plan that increase local hiring and promote diversity in the workforce
2.3 Increase income equality by recruiting businesses that provide living wage jobs 2.3.1 Expand living wage agreements and enhance accountability
3. Prepare current County residents to participate in and benefit from new economic initiatives
The county-‐wide on-‐time high school graduation rate will increase by 2020.
3.1 Ready the local workforce to maximize economic opportunities
3.2 Partner with educational institutions to provide students with the support needed for educational success across all grade levels
3.3 Work with educational institutions, foundations and businesses to connect educational achievement to emerging employment opportunities
Policy recommendations Economic Opportunity 28
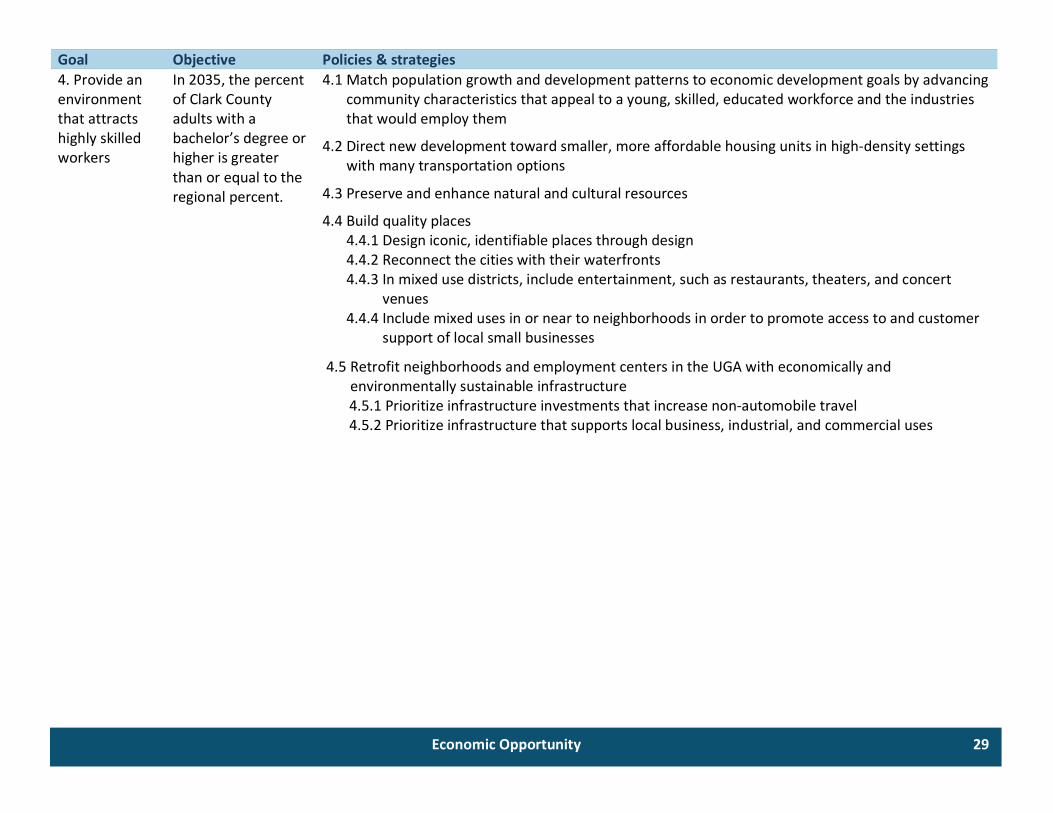
Goal Objective Policies & strategies 4. Provide an environment that attracts highly skilled workers
In 2035, the percent of Clark County adults with a bachelor’s degree or higher is greater than or equal to the regional percent.
4.1 Match population growth and development patterns to economic development goals by advancing community characteristics that appeal to a young, skilled, educated workforce and the industries that would employ them
4.2 Direct new development toward smaller, more affordable housing units in high-‐density settings with many transportation options
4.3 Preserve and enhance natural and cultural resources
4.4 Build quality places 4.4.1 Design iconic, identifiable places through design 4.4.2 Reconnect the cities with their waterfronts 4.4.3 In mixed use districts, include entertainment, such as restaurants, theaters, and concert
venues 4.4.4 Include mixed uses in or near to neighborhoods in order to promote access to and customer
support of local small businesses
4.5 Retrofit neighborhoods and employment centers in the UGA with economically and environmentally sustainable infrastructure 4.5.1 Prioritize infrastructure investments that increase non-‐automobile travel 4.5.2 Prioritize infrastructure that supports local business, industrial, and commercial uses
Economic Opportunity 29
1
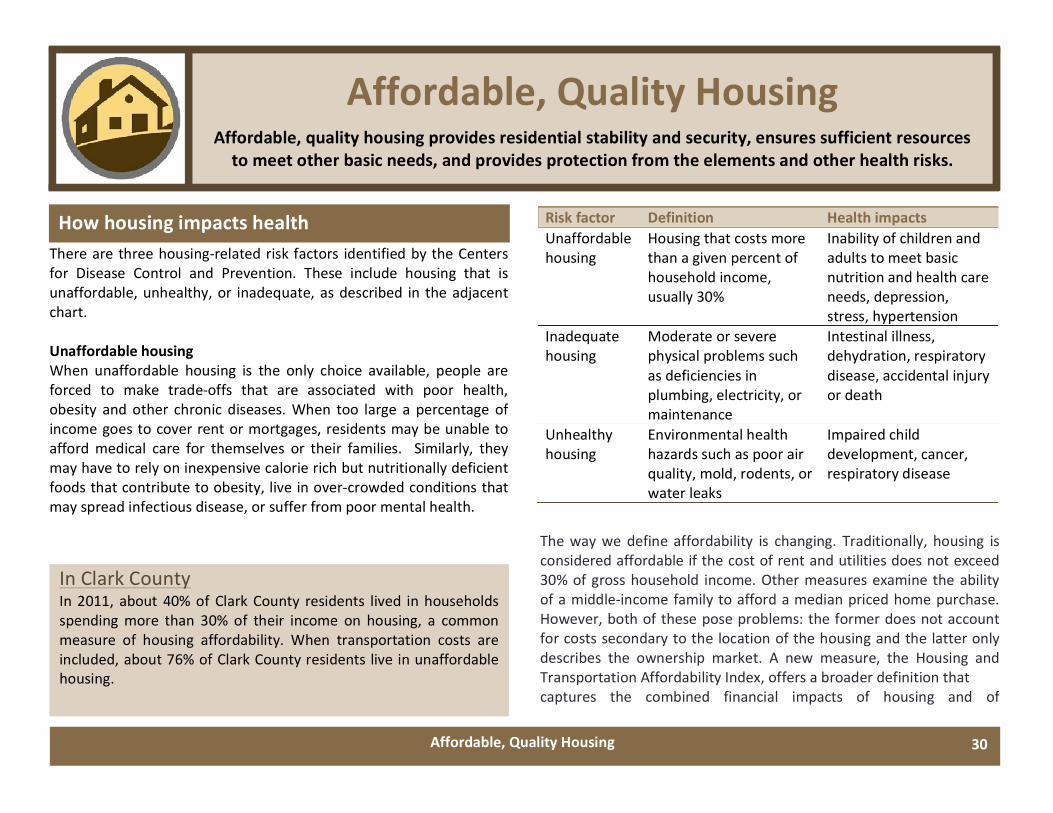
There are three housing-‐related risk factors identified by the Centers for Disease Control and Prevention. These include housing that is unaffordable, unhealthy, or inadequate, as described in the adjacent chart. Unaffordable housing When unaffordable housing is the only choice available, people are forced to make trade-‐offs that are associated with poor health, obesity and other chronic diseases. When too large a percentage of income goes to cover rent or mortgages, residents may be unable to afford medical care for themselves or their families. Similarly, they may have to rely on inexpensive calorie rich but nutritionally deficient foods that contribute to obesity, live in over-‐crowded conditions that may spread infectious disease, or suffer from poor mental health.
30
Affordable, Quality Housing Affordable, quality housing provides residential stability and security, ensures sufficient resources to meet other basic needs, and provides protection from the elements and other health risks.
Risk factor Definition Health impacts Unaffordable housing
Housing that costs more than a given percent of household income, usually 30%
Inability of children and adults to meet basic nutrition and health care needs, depression, stress, hypertension
Inadequate housing
Moderate or severe physical problems such as deficiencies in plumbing, electricity, or maintenance
Intestinal illness, dehydration, respiratory disease, accidental injury or death
Unhealthy housing
Environmental health hazards such as poor air quality, mold, rodents, or water leaks
Impaired child development, cancer, respiratory disease
2
The way we define affordability is changing. Traditionally, housing is considered affordable if the cost of rent and utilities does not exceed 30% of gross household income. Other measures examine the ability of a middle-‐income family to afford a median priced home purchase. However, both of these pose problems: the former does not account for costs secondary to the location of the housing and the latter only describes the ownership market. A new measure, the Housing and Transportation Affordability Index, offers a broader definition that captures the combined financial impacts of housing and of
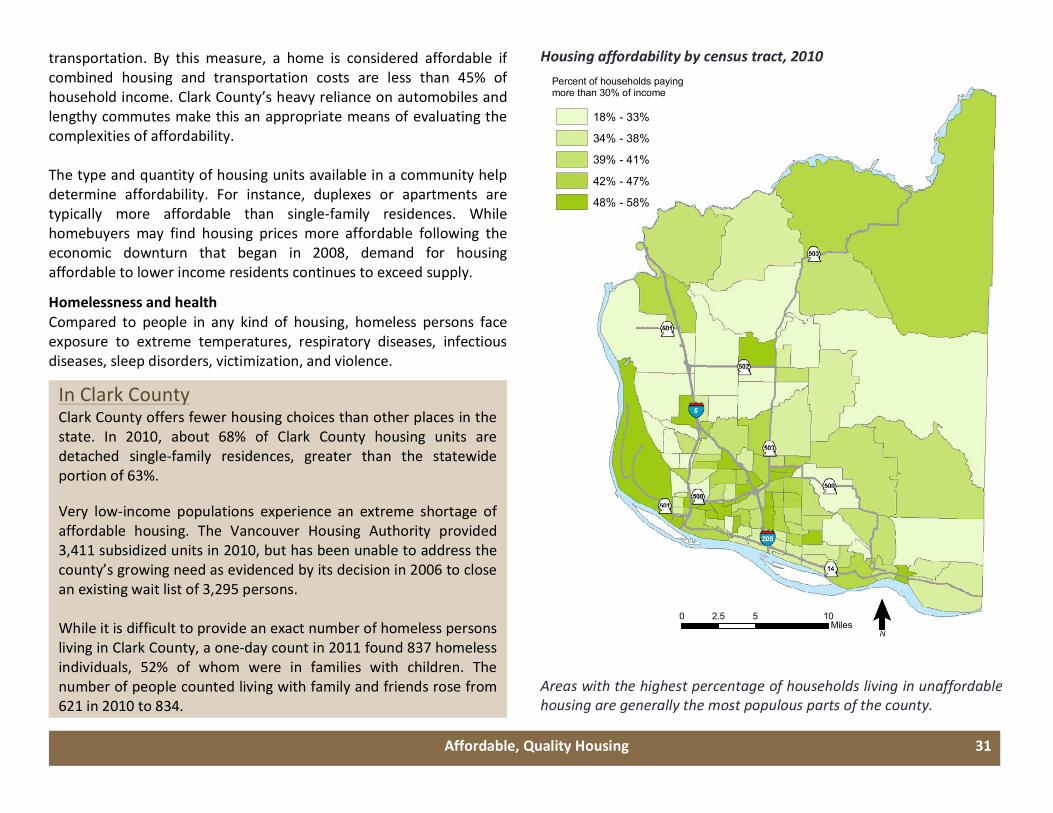
In Clark County In 2011, about 40% of Clark County residents lived in households spending more than 30% of their income on housing, a common measure of housing affordability. When transportation costs are included, about 76% of Clark County residents live in unaffordable housing.
How housing impacts health
Affordable, Quality Housing
31
3
transportation. By this measure, a home is considered affordable if combined housing and transportation costs are less than 45% of household income. Clark County’s heavy reliance on automobiles and lengthy commutes make this an appropriate means of evaluating the complexities of affordability. The type and quantity of housing units available in a community help determine affordability. For instance, duplexes or apartments are typically more affordable than single-‐family residences. While homebuyers may find housing prices more affordable following the economic downturn that began in 2008, demand for housing affordable to lower income residents continues to exceed supply.
Homelessness and health Compared to people in any kind of housing, homeless persons face exposure to extreme temperatures, respiratory diseases, infectious diseases, sleep disorders, victimization, and violence.
Affordable, Quality Housing
In Clark County Clark County offers fewer housing choices than other places in the state. In 2010, about 68% of Clark County housing units are detached single-‐family residences, greater than the statewide portion of 63%. Very low-‐income populations experience an extreme shortage of affordable housing. The Vancouver Housing Authority provided 3,411 subsidized units in 2010, but has been unable to address the county’s growing need as evidenced by its decision in 2006 to close an existing wait list of 3,295 persons. While it is difficult to provide an exact number of homeless persons living in Clark County, a one-‐day count in 2011 found 837 homeless individuals, 52% of whom were in families with children. The number of people counted living with family and friends rose from 621 in 2010 to 834.
0 5 102.5Miles
18% - 33%
34% - 38%
39% - 41%
42% - 47%
48% - 58%
¯ˉ
Percent of households payingmore than 30% of income
Housing affordability by census tract, 2010
Areas with the highest percentage of households living in unaffordable housing are generally the most populous parts of the county.
4
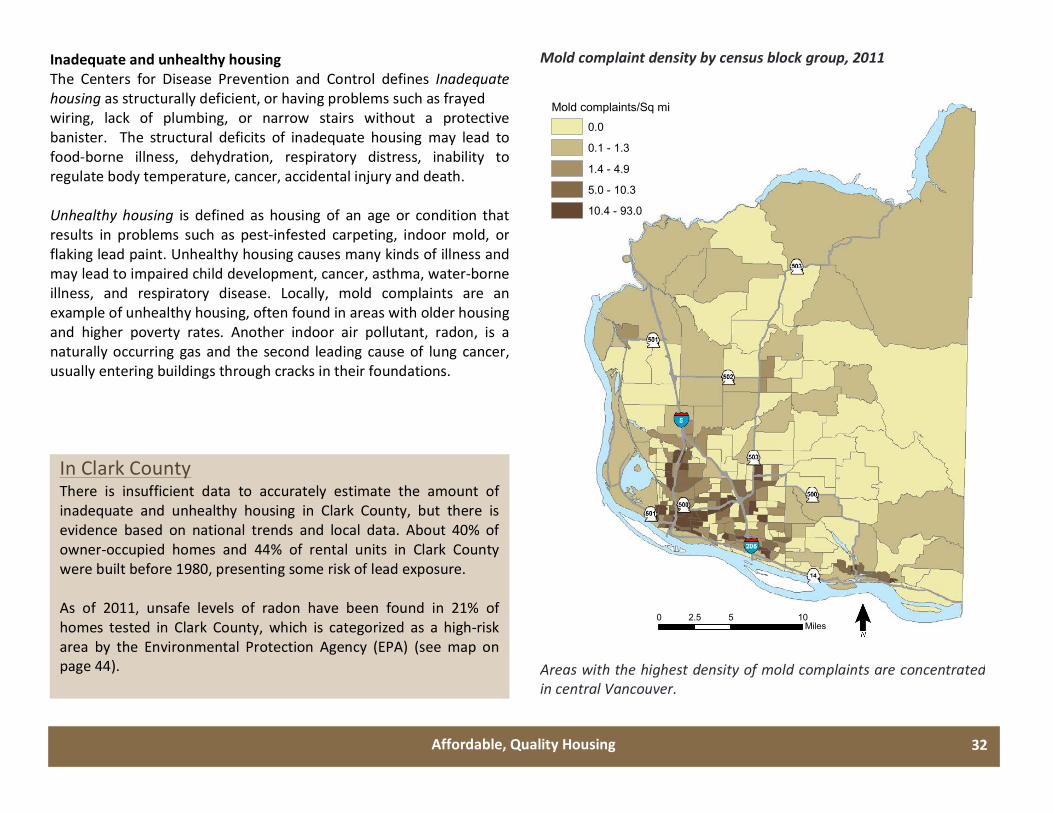
Inadequate and unhealthy housing The Centers for Disease Prevention and Control defines Inadequate housing as structurally deficient, or having problems such as frayed wiring, lack of plumbing, or narrow stairs without a protective banister. The structural deficits of inadequate housing may lead to food-‐borne illness, dehydration, respiratory distress, inability to regulate body temperature, cancer, accidental injury and death. Unhealthy housing is defined as housing of an age or condition that results in problems such as pest-‐infested carpeting, indoor mold, or flaking lead paint. Unhealthy housing causes many kinds of illness and may lead to impaired child development, cancer, asthma, water-‐borne illness, and respiratory disease. Locally, mold complaints are an example of unhealthy housing, often found in areas with older housing and higher poverty rates. Another indoor air pollutant, radon, is a naturally occurring gas and the second leading cause of lung cancer, usually entering buildings through cracks in their foundations.
In Clark County There is insufficient data to accurately estimate the amount of inadequate and unhealthy housing in Clark County, but there is evidence based on national trends and local data. About 40% of owner-‐occupied homes and 44% of rental units in Clark County were built before 1980, presenting some risk of lead exposure. As of 2011, unsafe levels of radon have been found in 21% of homes tested in Clark County, which is categorized as a high-‐risk area by the Environmental Protection Agency (EPA) (see map on page 44).
32
Mold complaint density by census block group, 2011
Areas with the highest density of mold complaints are concentrated in central Vancouver.
0 5 102.5Miles
Mold complaints/Sq mi
0.0
0.1 - 1.3
1.4 - 4.9
5.0 - 10.3
10.4 - 93.0
Affordable, Quality Housing
3
Disparities in Clark County Socioeconomic status Low-‐income populations have fewer housing choices and are therefore more likely to live in unaffordable, inadequate, or unhealthy housing. In Clark County, 81% of households earning less than $20,000 live in unaffordable housing. These conditions often overlap with minority status or physical disability. Less ability to afford housing is sometimes exacerbated by a lack of availability of housing types. In outlying cities of Clark County, single-‐family residences comprise over 75% of all housing units. Race and ethnicity Recent data on the proportion of income spent on housing by race is not available. However, it is clear that on average, racial and ethnic minorities have lower incomes and are disproportionately represented among those living in poverty. In Clark County, over 15% of the African American, Hispanic, and Native American population lives in poverty, compared to just 9% of non-‐Hispanic whites. Age Aging-‐friendly homes meeting universal design criteria are scarce in Clark County. The percent of households living in unaffordable housing decreases with age. Geography Dependence on automobiles can increase the proportion of income dedicated to housing and transportation combined. Areas outside of central Vancouver have limited transit service. Due to the lack of travel options and long travel distances, the housing + transportation index classifies many of these neighborhoods as unaffordable.
Affordable, Quality Housing 33
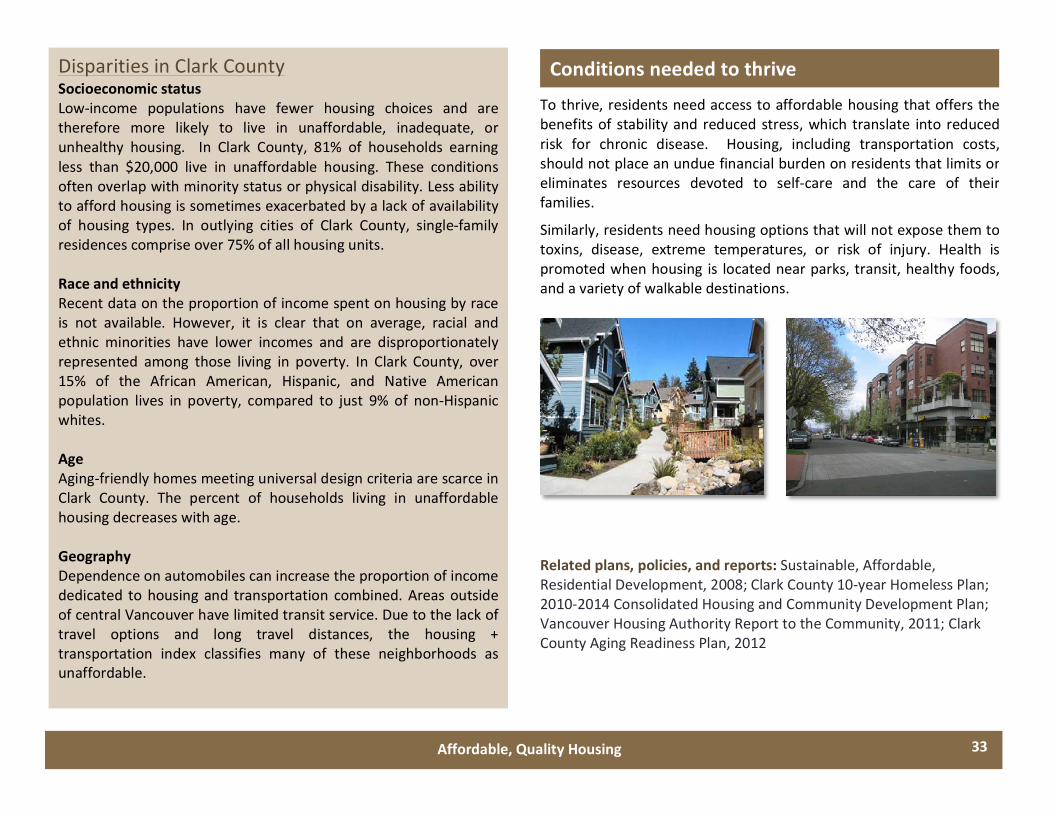
To thrive, residents need access to affordable housing that offers the benefits of stability and reduced stress, which translate into reduced risk for chronic disease. Housing, including transportation costs, should not place an undue financial burden on residents that limits or eliminates resources devoted to self-‐care and the care of their families.
Similarly, residents need housing options that will not expose them to toxins, disease, extreme temperatures, or risk of injury. Health is promoted when housing is located near parks, transit, healthy foods, and a variety of walkable destinations.
Conditions needed to thrive
Related plans, policies, and reports: Sustainable, Affordable, Residential Development, 2008; Clark County 10-‐year Homeless Plan; 2010-‐2014 Consolidated Housing and Community Development Plan; Vancouver Housing Authority Report to the Community, 2011; Clark County Aging Readiness Plan, 2012
4
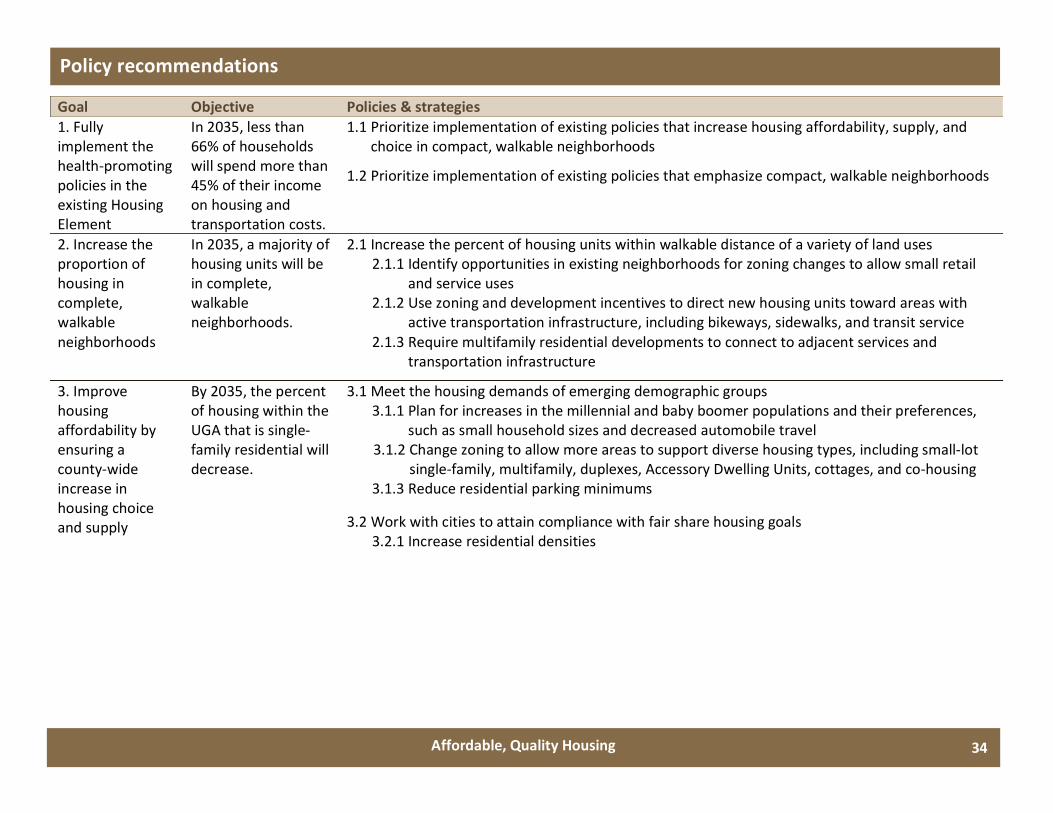
Goal Objective Policies & strategies 1. Fully implement the health-‐promoting policies in the existing Housing Element
In 2035, less than 66% of households will spend more than 45% of their income on housing and transportation costs.
1.1 Prioritize implementation of existing policies that increase housing affordability, supply, and choice in compact, walkable neighborhoods
1.2 Prioritize implementation of existing policies that emphasize compact, walkable neighborhoods
2. Increase the proportion of housing in complete, walkable neighborhoods
In 2035, a majority of housing units will be in complete, walkable neighborhoods.
2.1 Increase the percent of housing units within walkable distance of a variety of land uses 2.1.1 Identify opportunities in existing neighborhoods for zoning changes to allow small retail
and service uses 2.1.2 Use zoning and development incentives to direct new housing units toward areas with
active transportation infrastructure, including bikeways, sidewalks, and transit service 2.1.3 Require multifamily residential developments to connect to adjacent services and
transportation infrastructure
3. Improve housing affordability by ensuring a county-‐wide increase in housing choice and supply
By 2035, the percent of housing within the UGA that is single-‐family residential will decrease.
3.1 Meet the housing demands of emerging demographic groups 3.1.1 Plan for increases in the millennial and baby boomer populations and their preferences,
such as small household sizes and decreased automobile travel 3.1.2 Change zoning to allow more areas to support diverse housing types, including small-‐lot single-‐family, multifamily, duplexes, Accessory Dwelling Units, cottages, and co-‐housing
3.1.3 Reduce residential parking minimums
3.2 Work with cities to attain compliance with fair share housing goals 3.2.1 Increase residential densities
Affordable, Quality Housing 34
Policy recommendations
6 5
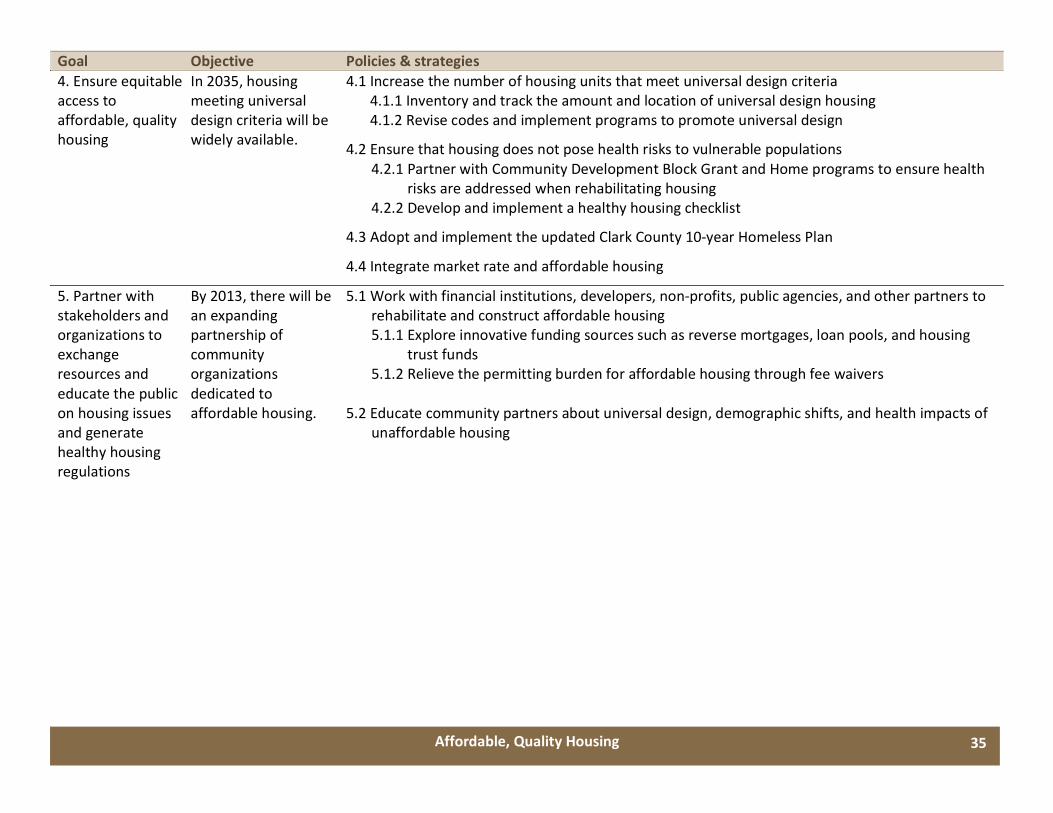
Goal Objective Policies & strategies 4. Ensure equitable access to affordable, quality housing
In 2035, housing meeting universal design criteria will be widely available.
4.1 Increase the number of housing units that meet universal design criteria 4.1.1 Inventory and track the amount and location of universal design housing 4.1.2 Revise codes and implement programs to promote universal design
4.2 Ensure that housing does not pose health risks to vulnerable populations 4.2.1 Partner with Community Development Block Grant and Home programs to ensure health risks are addressed when rehabilitating housing 4.2.2 Develop and implement a healthy housing checklist
4.3 Adopt and implement the updated Clark County 10-‐year Homeless Plan
4.4 Integrate market rate and affordable housing
5. Partner with stakeholders and organizations to exchange resources and educate the public on housing issues and generate healthy housing regulations
By 2013, there will be an expanding partnership of community organizations dedicated to affordable housing.
5.1 Work with financial institutions, developers, non-‐profits, public agencies, and other partners to rehabilitate and construct affordable housing 5.1.1 Explore innovative funding sources such as reverse mortgages, loan pools, and housing trust funds 5.1.2 Relieve the permitting burden for affordable housing through fee waivers 5.2 Educate community partners about universal design, demographic shifts, and health impacts of unaffordable housing
Affordable, Quality Housing 35
Climate Change and Human Health
Climate Change and Human Health
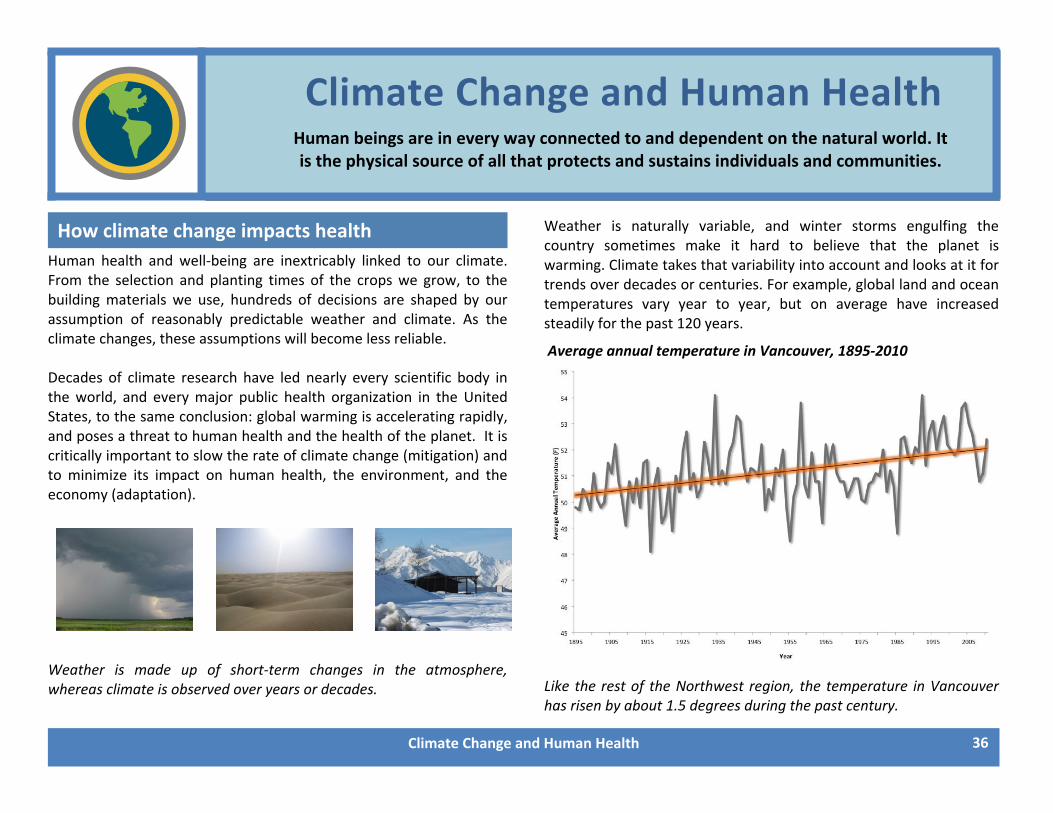
Human beings are in every way connected to and dependent on the natural world. It is the physical source of all that protects and sustains individuals and communities.
Human health and well‐being are inextricably linked to our climate. From the selection and planting times of the crops we grow, to the building materials we use, hundreds of decisions are shaped by our assumption of reasonably predictable weather and climate. As the climate changes, these assumptions will become less reliable. Decades of climate research have led nearly every scientific body in the world, and every major public health organization in the United States, to the same conclusion: global warming is accelerating rapidly, and poses a threat to human health and the health of the planet. It is critically important to slow the rate of climate change (mitigation) and to minimize its impact on human health, the environment, and the economy (adaptation). Weather is made up of short‐term changes in the atmosphere, whereas climate is observed over years or decades.
Weather is naturally variable, and winter storms engulfing the country sometimes make it hard to believe that the planet is warming. Climate takes that variability into account and looks at it for trends over decades or centuries. For example, global land and ocean temperatures vary year to year, but on average have increased steadily for the past 120 years.
Average annual temperature in Vancouver, 1895‐2010
Like the rest of the Northwest region, the temperature in Vancouver has risen by about 1.5 degrees during the past century.
How climate change impacts health
36
Climate Change and Human Health 37
The amount of carbon dioxide (CO2) in the atmosphere also varies, but is at its highest level in the last 800,000 years. Early projections of climate change underestimated both the speed of change and the severity of the impacts. Temperatures are rising, glaciers and ice sheets melting, and long‐term weather patterns are changing much faster than expected.
Extreme heat Extreme heat causes more weather‐related deaths in the United States than hurricanes, lightning, tornadoes, floods, and earthquakes combined. Every decade, the average temperature is expected to increase by another .5 degrees Fahrenheit, leading to longer, dryer, and more deadly summers. Extreme heat causes heat exhaustion and dehydration, especially among certain groups such as the elderly.
Deteriorating air quality Air quality is affected by hot, dry summers. This climate increases the risk of smog and the likelihood of pollution from wildfires. Small particles suspended in the air are a by‐product of fuel combustion, forest fires, allergens, and ground‐level ozone (smog), which will all increase due to warming temperatures. As these particles are inhaled into the lungs, they increase the risk of infant mortality, cancer, respiratory disease, asthma, heart attack, and stroke.
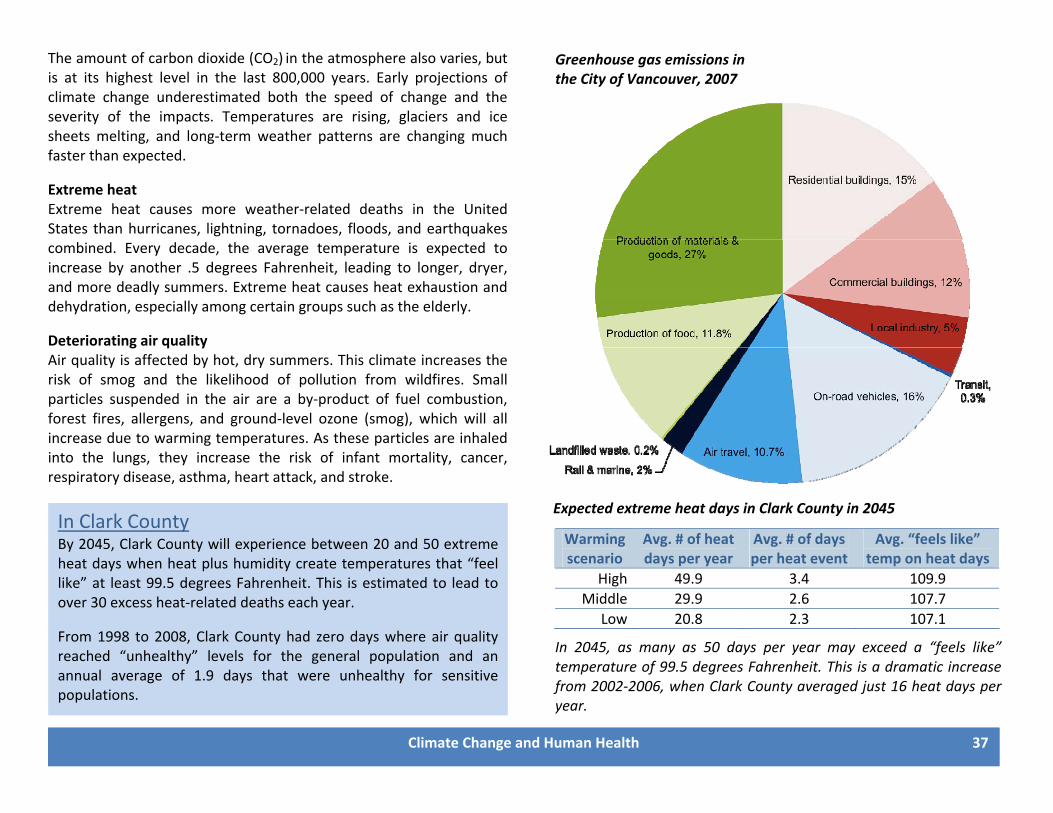
In Clark County By 2045, Clark County will experience between 20 and 50 extreme heat days when heat plus humidity create temperatures that “feel like” at least 99.5 degrees Fahrenheit. This is estimated to lead toover 30 excess heat‐related deaths each year.
From 1998 to 2008, Clark County had zero days where air quality reached “unhealthy” levels for the general population and an annual average of 1.9 days that were unhealthy for sensitive populations.
Expected extreme heat days in Clark County in 2045
Warming scenario
Avg. # of heat days per year
Avg. # of days per heat event
Avg. “feels like” temp on heat days
High 49.9 3.4 109.9 Middle 29.9 2.6 107.7
Low 20.8 2.3 107.1 In 2045, as many as 50 days per year may exceed a “feels like” temperature of 99.5 degrees Fahrenheit. This is a dramatic increase from 2002‐2006, when Clark County averaged just 16 heat days per year.
Greenhouse gas emissions in the City of Vancouver, 2007
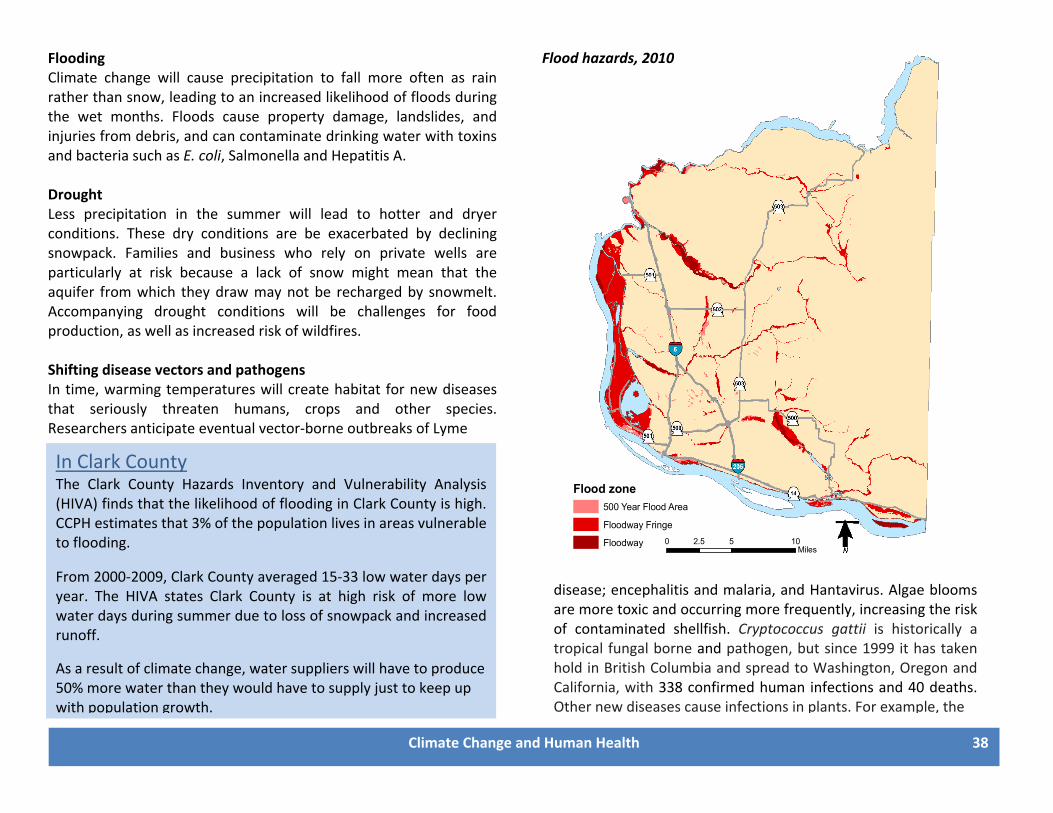
¯0 5 102.5Miles
Flood zone500 Year Flood Area
Floodway Fringe
Floodway
Flood hazards, 2010Flooding Climate change will cause precipitation to fall more often as rain rather than snow, leading to an increased likelihood of floods during the wet months. Floods cause property damage, landslides, and injuries from debris, and can contaminate drinking water with toxins and bacteria such as E. coli, Salmonella and Hepatitis A. Drought Less precipitation in the summer will lead to hotter and dryer conditions. These dry conditions are be exacerbated by declining snowpack. Families and business who rely on private wells are particularly at risk because a lack of snow might mean that the aquifer from which they draw may not be recharged by snowmelt. Accompanying drought conditions will be challenges for food production, as well as increased risk of wildfires. Shifting disease vectors and pathogens In time, warming temperatures will create habitat for new diseases that seriously threaten humans, crops and other species. Researchers anticipate eventual vector‐borne outbreaks of Lyme In Clark County The Clark County Hazards Inventory and Vulnerability Analysis (HIVA) finds that the likelihood of flooding in Clark County is high. CCPH estimates that 3% of the population lives in areas vulnerable to flooding.
From 2000‐2009, Clark County averaged 15‐33 low water days per year. The HIVA states Clark County is at high risk of more low water days during summer due to loss of snowpack and increased runoff. As a result of climate change, water suppliers will have to produce 50% more water than they would have to supply just to keep up with population growth.
disease; encephalitis and malaria, and Hantavirus. Algae blooms are more toxic and occurring more frequently, increasing the risk of contaminated shellfish. Cryptococcus gattii is historically a tropical fungal borne and pathogen, but since 1999 it has taken hold in British Columbia and spread to Washington, Oregon and California, with 338 confirmed human infections and 40 deaths. Other new diseases cause infections in plants. For example, the
38 Climate Change and Human Health
pine beetle has spread to the Western Cascades, where white bark trees declined 41 percent by the mid 2000’s, and nearly 80% of these trees in Mt. Rainer National Park have been infected. The spread of these organisms devastates healthy forests and increase the risks of fire.
Mental health Researchers observed an escalation in many mental health problems following major weather events such as Hurricane Katrina and the recent Australian drought. Following catastrophic weather events, increased instances of Post Traumatic Stress Disorder, depression, increased domestic violence, child abuse, and suicides can be expected. Uncertainty and anxiety about the future may increase the percent of Clark County residents with poor emotional health.
Dislocations and in‐migration People adversely impacted by climate change, from outside of and within the United States, may seek to migrate to the Pacific Northwest.
Exacerbating trends Clark County faces additional climate‐related risks. Nearly 90% of food consumed in Clark County in 2007 was imported from out
of state. Droughts, floods, and crop losses in food‐producing regions will limit food supply while increasing food costs. At the same time, declining oil reserves will eventually increase the cost of transportation, which will further increase the cost of food. The combined effects of increasing food and energy prices with Clark County’s current reliance on imports and automobiles will make adaptation difficult.
Disparities in Clark CountySocioeconomic status (SES) Because they have the fewest resources for adapting to a changing environment, those in lower socio‐economic brackets disproportionately suffer the health impacts of climate change. Obtaining needed resources such as food, medical care, transportation or affordable housing will become increasingly difficult in a time of dwindling resources and heightened global competition.
Age Under excessive heat stress, adults over 65, children, and infants under 1 year of age have shown greater sensitivity to all‐cause mortality. Extreme heat, and the air pollution that accompanies it, also disproportionately impact pregnant women and persons with respiratory or cardiovascular disease.
Geography People who live in rural areas or work outdoors may have greater risks of impacts from extreme heat and disease carrying vectors. People living near the coast or rivers risk exposure to extreme weather events such as flooding. Populations who rely on drinking water that originates in glacially fed aquifers are at risk of water shortages, while populations who rely on drinking water from river fed aquifers are at risk of salt‐water intrusion.
In Clark County Diseases such as Q fever, Lyme disease, Western Equine Encephalitis, and West Nile Virus are expected to spread in the Pacific Northwest. Clark County, which grew 23% in the last decade, can expect to be more affected than many other parts of the country, as weather here is relatively moderate. With the exception of Oregon, most in‐migration comes from states suffering from extreme heat, such as Texas, Arizona, and Florida.
Climate Change and Human Health 39
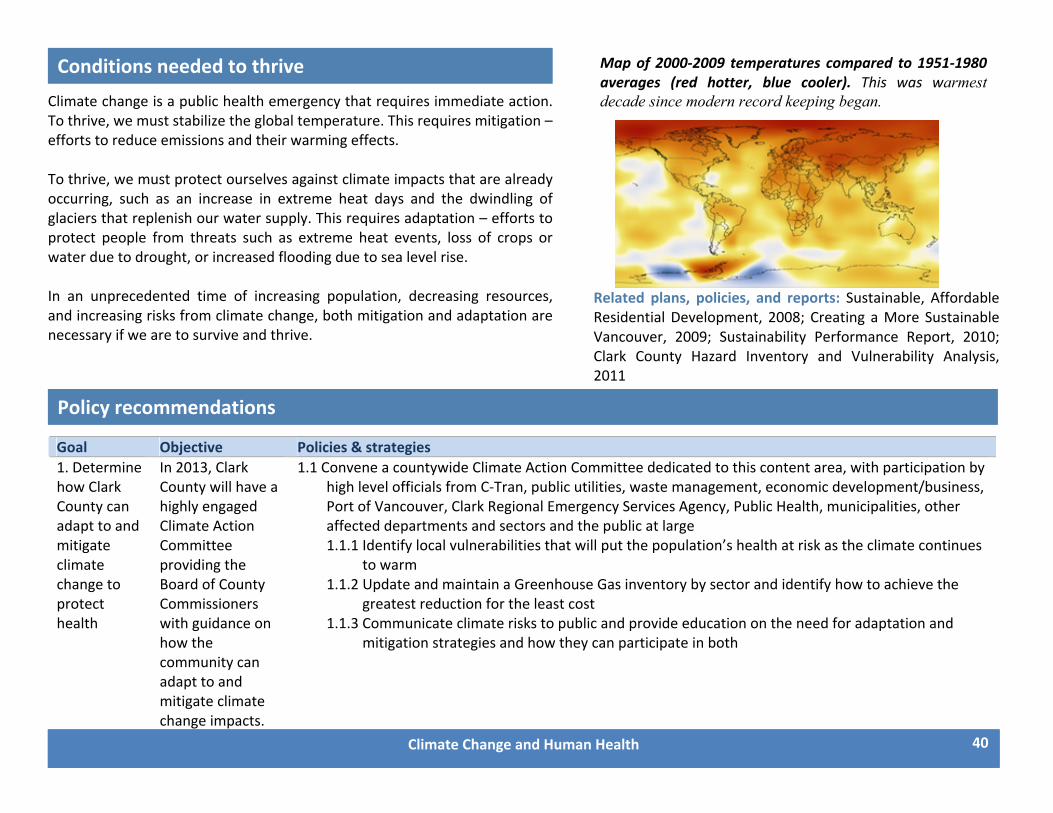
Climate change is a public health emergency that requires immediate action. To thrive, we must stabilize the global temperature. This requires mitigation –efforts to reduce emissions and their warming effects. To thrive, we must protect ourselves against climate impacts that are already occurring, such as an increase in extreme heat days and the dwindling of glaciers that replenish our water supply. This requires adaptation – efforts to protect people from threats such as extreme heat events, loss of crops or water due to drought, or increased flooding due to sea level rise. In an unprecedented time of increasing population, decreasing resources, and increasing risks from climate change, both mitigation and adaptation are necessary if we are to survive and thrive.
Goal Objective Policies & strategies 1. Determine how Clark County can adapt to and mitigate climate change to protect health
In 2013, Clark County will have a highly engaged Climate Action Committee providing the Board of County Commissioners with guidance on how the community can adapt to and mitigate climate change impacts.
1.1 Convene a countywide Climate Action Committee dedicated to this content area, with participation by high level officials from C‐Tran, public utilities, waste management, economic development/business, Port of Vancouver, Clark Regional Emergency Services Agency, Public Health, municipalities, other affected departments and sectors and the public at large 1.1.1 Identify local vulnerabilities that will put the population’s health at risk as the climate continues
to warm 1.1.2 Update and maintain a Greenhouse Gas inventory by sector and identify how to achieve the
greatest reduction for the least cost 1.1.3 Communicate climate risks to public and provide education on the need for adaptation and
mitigation strategies and how they can participate in both
Policy recommendations
Map of 2000‐2009 temperatures compared to 1951‐1980 averages (red hotter, blue cooler). This was warmest decade since modern record keeping began.
Related plans, policies, and reports: Sustainable, Affordable Residential Development, 2008; Creating a More Sustainable Vancouver, 2009; Sustainability Performance Report, 2010; Clark County Hazard Inventory and Vulnerability Analysis, 2011
Conditions needed to thrive
40 Climate Change and Human Health
Goal Objective Policies & strategies 2. Develop plans to mitigate climate change
By 2015, Clark County will be implementing strategies to: Decrease greenhouse gas emissions
Absorb CO2 Diversify and
distribute clean energy
2.1 Develop plans to decrease carbon emissions 2.1.1 Promote active transportation through improving the bike/pedestrian environment (e.g.
complete streets, compact development, additional miles of bikeways and sidewalks) 2.1.2 Promote vehicle efficiency through electric car charging stations and high‐efficiency fleets,
buses, and delivery vehicles 2.1.3 Encourage more local food production, processing, and distribution to reduce freight emissions 2.1.4 Retrofit existing buildings for energy efficiency 2.1.5 Implement aggressive energy efficiency codes for new construction 2.1.6 Increase telecommuting
2.2 Develop plans to absorb carbon dioxide 2.2.1 Preserve and plant trees 2.2.3 Encourage use of native plants 2.2.4 Restore and expand urban and rural forest
3. Conserve and preserve resources
By 2015, Clark County will be implementing strategies to sustain farmland and conserve water.
3.1 Maximize the percentage of energy used that comes from renewable sources 3.1.1 Support on‐site and district energy (heating, cooling and hot water) for buildings clusters 3.1.2 Design buildings to reduce heat absorption 3.1.3 Revise building codes and design guidelines to allow for and encourage passive solar design, green roofs, active solar and other renewable energy 3.2 Conserve finite resources 3.2.1 Reduce water use and increase efficiency through retrofitting incentives, educating and mandating conservation measures 3.2.2 Restore and retain all existing farmlands to assist with local food production 3.2.3 By ordinance, planning support, or incentives, restore and retain farms and protect agricultural lands from development 3.3 Decrease per‐capita energy consumption 3.3.1 Incentivize energy efficiency retrofits for existing buildings
41 Climate Change and Human Health
Goal Objective Policies & strategies 4. Prepare for climate change impacts by developing adaptation plans.
By 2015, Clark County will have assessed local risks, developed a response plan, initiated ordinances or other actions needed to prevent harm, and educated the public.
4.1 Protect the public’s health from climate change impacts 4.1.1 Decrease impervious surfaces that increase temperatures and generate water runoff 4.1.2 Identify areas at high risk for flooding, fire, and extreme temperatures and take preventive action to address the threat (e.g. expand flood plain boundaries) 4.1.3 Review and modify emergency response plans to anticipate and prepare for impacts of climate change, including extreme heat, flooding, contagion, and deteriorating air quality
42 Climate Change and Human Health
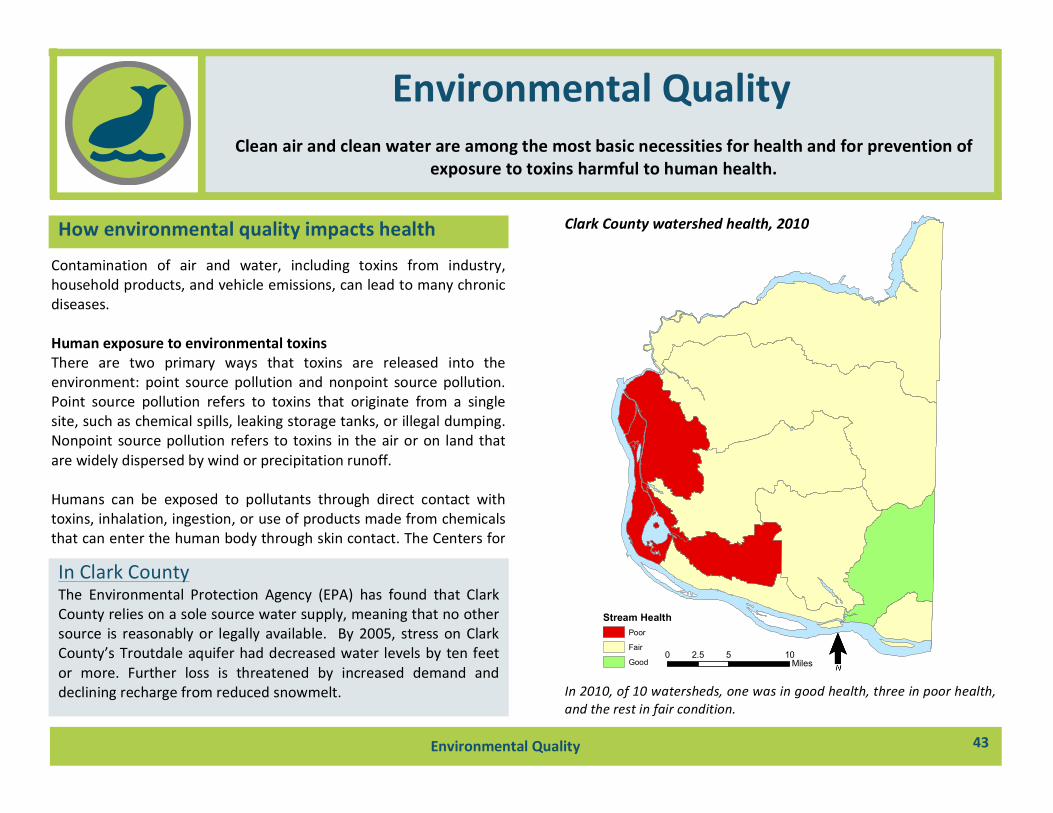
1
Contamination of air and water, including toxins from industry, household products, and vehicle emissions, can lead to many chronic diseases. Human exposure to environmental toxins There are two primary ways that toxins are released into the environment: point source pollution and nonpoint source pollution. Point source pollution refers to toxins that originate from a single site, such as chemical spills, leaking storage tanks, or illegal dumping. Nonpoint source pollution refers to toxins in the air or on land that are widely dispersed by wind or precipitation runoff. Humans can be exposed to pollutants through direct contact with toxins, inhalation, ingestion, or use of products made from chemicals that can enter the human body through skin contact. The Centers for
How environmental quality impacts health
Clean air and clean water are among the most basic necessities for health and for prevention of exposure to toxins harmful to human health.
Environmental Quality
Environmental Quality
In 2010, of 10 watersheds, one was in good health, three in poor health, and the rest in fair condition.
43
0 5 102.5Miles
Stream HealthPoor
Fair
Good ¯ˉ
Clark County watershed health, 2010
In Clark County The Environmental Protection Agency (EPA) has found that Clark County relies on a sole source water supply, meaning that no other source is reasonably or legally available. By 2005, stress on Clark County’s Troutdale aquifer had decreased water levels by ten feet or more. Further loss is threatened by increased demand and declining recharge from reduced snowmelt.
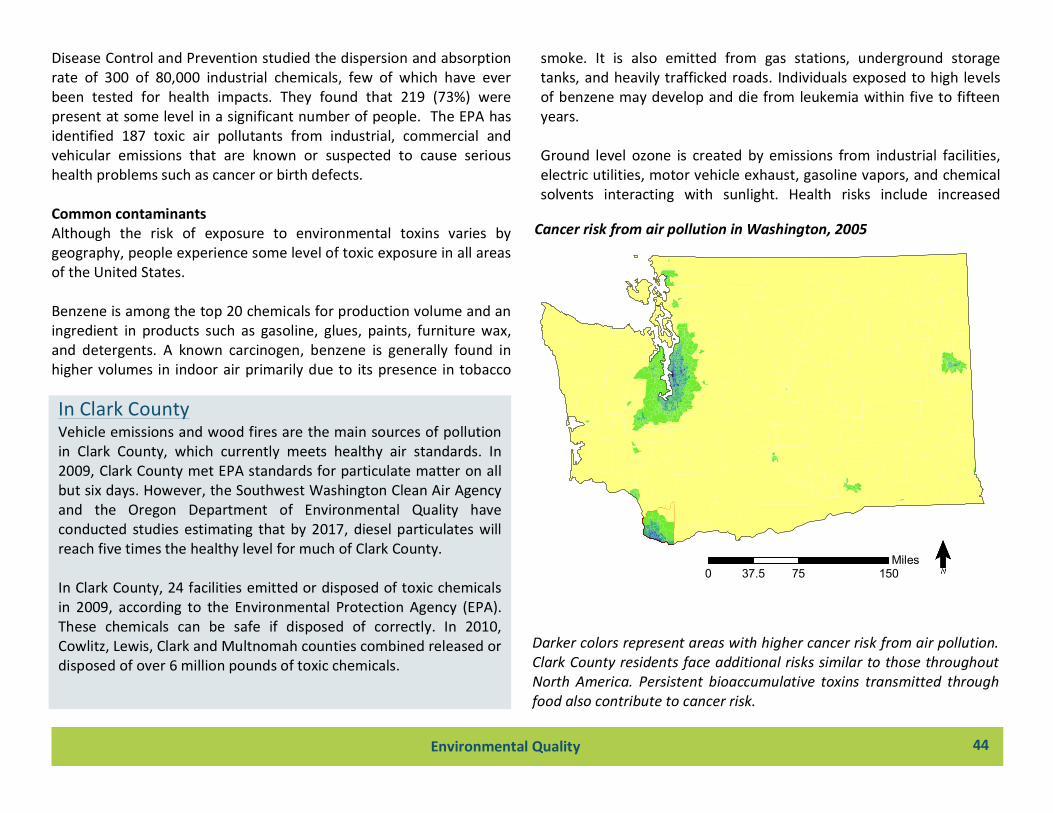
2
Disease Control and Prevention studied the dispersion and absorption rate of 300 of 80,000 industrial chemicals, few of which have ever been tested for health impacts. They found that 219 (73%) were present at some level in a significant number of people. The EPA has identified 187 toxic air pollutants from industrial, commercial and vehicular emissions that are known or suspected to cause serious health problems such as cancer or birth defects. Common contaminants Although the risk of exposure to environmental toxins varies by geography, people experience some level of toxic exposure in all areas of the United States. Benzene is among the top 20 chemicals for production volume and an ingredient in products such as gasoline, glues, paints, furniture wax, and detergents. A known carcinogen, benzene is generally found in higher volumes in indoor air primarily due to its presence in tobacco
Darker colors represent areas with higher cancer risk from air pollution. Clark County residents face additional risks similar to those throughout North America. Persistent bioaccumulative toxins transmitted through food also contribute to cancer risk.
Environmental Quality 44
0 75 15037.5Miles ¯ˉ
Cancer risk from air pollution in Washington, 2005
In Clark County Vehicle emissions and wood fires are the main sources of pollution in Clark County, which currently meets healthy air standards. In 2009, Clark County met EPA standards for particulate matter on all but six days. However, the Southwest Washington Clean Air Agency and the Oregon Department of Environmental Quality have conducted studies estimating that by 2017, diesel particulates will reach five times the healthy level for much of Clark County. In Clark County, 24 facilities emitted or disposed of toxic chemicals in 2009, according to the Environmental Protection Agency (EPA). These chemicals can be safe if disposed of correctly. In 2010, Cowlitz, Lewis, Clark and Multnomah counties combined released or disposed of over 6 million pounds of toxic chemicals.
3
smoke. It is also emitted from gas stations, underground storage tanks, and heavily trafficked roads. Individuals exposed to high levels of benzene may develop and die from leukemia within five to fifteen years. Ground level ozone is created by emissions from industrial facilities, electric utilities, motor vehicle exhaust, gasoline vapors, and chemical solvents interacting with sunlight. Health risks include increased
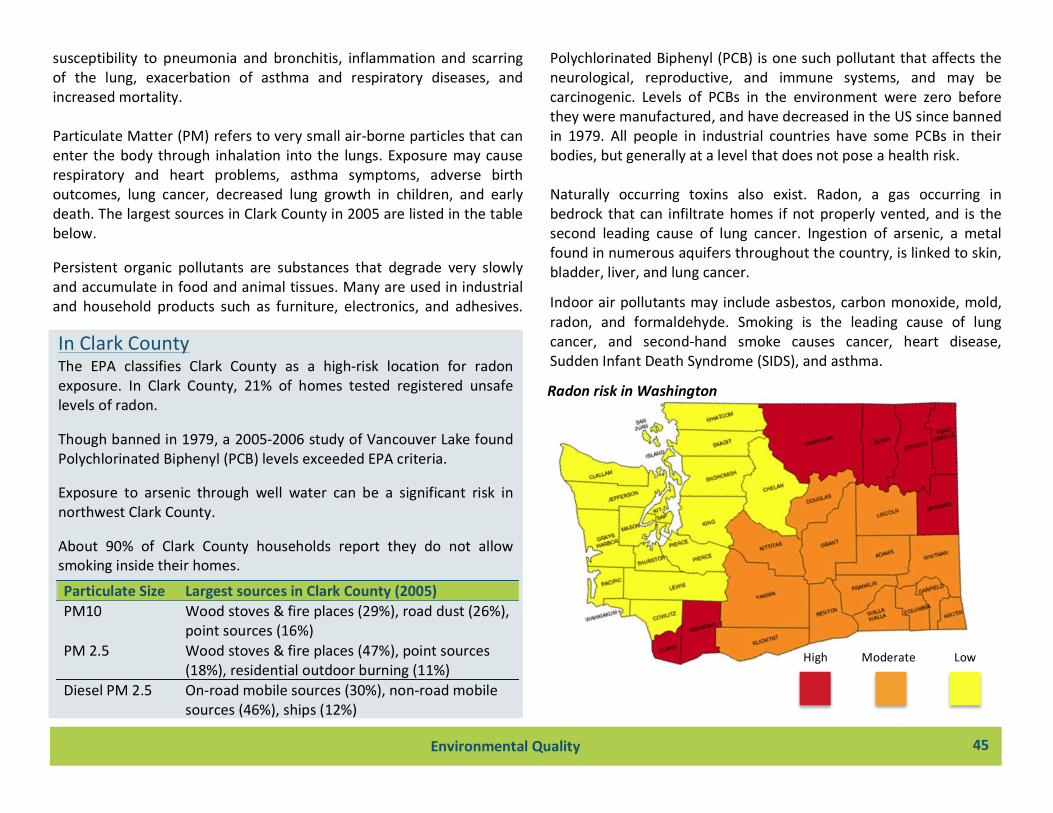
In Clark County The EPA classifies Clark County as a high-‐risk location for radon exposure. In Clark County, 21% of homes tested registered unsafe levels of radon.
Though banned in 1979, a 2005-‐2006 study of Vancouver Lake found Polychlorinated Biphenyl (PCB) levels exceeded EPA criteria. Exposure to arsenic through well water can be a significant risk in northwest Clark County. About 90% of Clark County households report they do not allow smoking inside their homes.
Environmental Quality 45
4
susceptibility to pneumonia and bronchitis, inflammation and scarring of the lung, exacerbation of asthma and respiratory diseases, and increased mortality. Particulate Matter (PM) refers to very small air-‐borne particles that can enter the body through inhalation into the lungs. Exposure may cause respiratory and heart problems, asthma symptoms, adverse birth outcomes, lung cancer, decreased lung growth in children, and early death. The largest sources in Clark County in 2005 are listed in the table below.
Persistent organic pollutants are substances that degrade very slowly and accumulate in food and animal tissues. Many are used in industrial and household products such as furniture, electronics, and adhesives.
5
Polychlorinated Biphenyl (PCB) is one such pollutant that affects the neurological, reproductive, and immune systems, and may be carcinogenic. Levels of PCBs in the environment were zero before they were manufactured, and have decreased in the US since banned in 1979. All people in industrial countries have some PCBs in their bodies, but generally at a level that does not pose a health risk. Naturally occurring toxins also exist. Radon, a gas occurring in bedrock that can infiltrate homes if not properly vented, and is the second leading cause of lung cancer. Ingestion of arsenic, a metal found in numerous aquifers throughout the country, is linked to skin, bladder, liver, and lung cancer.
Indoor air pollutants may include asbestos, carbon monoxide, mold, radon, and formaldehyde. Smoking is the leading cause of lung cancer, and second-‐hand smoke causes cancer, heart disease, Sudden Infant Death Syndrome (SIDS), and asthma.
Particulate Size Largest sources in Clark County (2005) PM10 Wood stoves & fire places (29%), road dust (26%),
point sources (16%) PM 2.5 Wood stoves & fire places (47%), point sources
(18%), residential outdoor burning (11%) Diesel PM 2.5 On-‐road mobile sources (30%), non-‐road mobile
sources (46%), ships (12%)
Radon risk in Washington
High Moderate Low
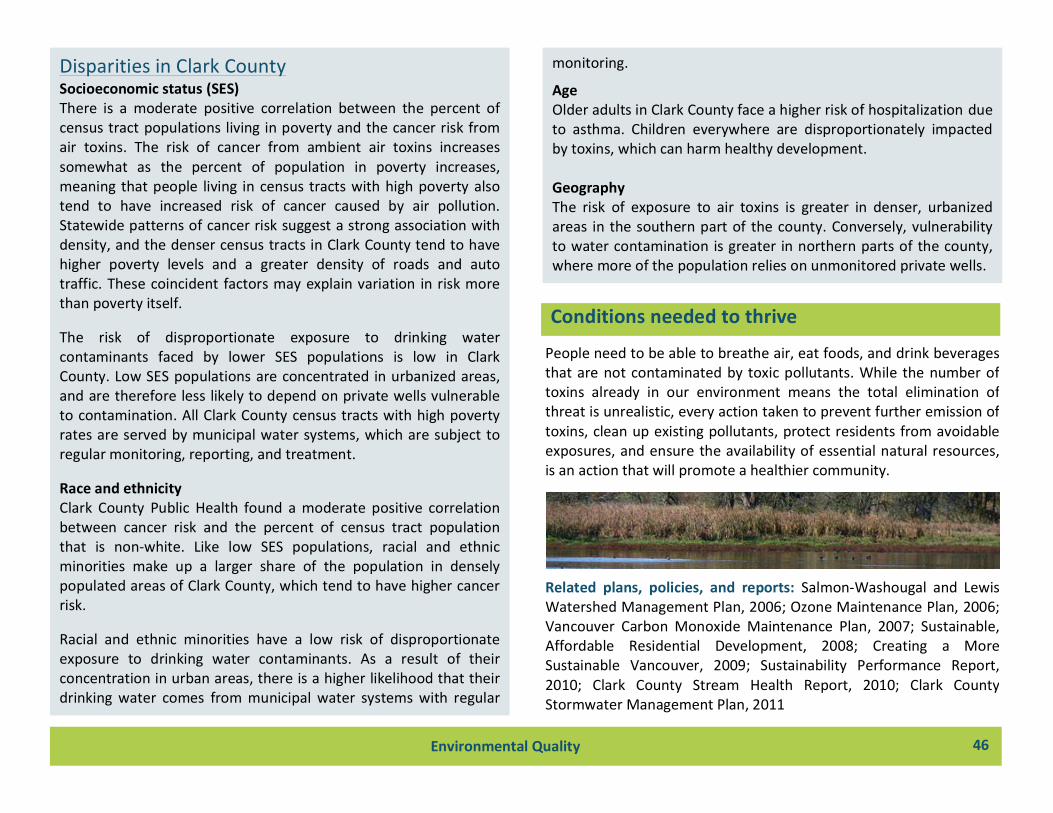
1
Disparities in Clark County Socioeconomic status (SES) There is a moderate positive correlation between the percent of census tract populations living in poverty and the cancer risk from air toxins. The risk of cancer from ambient air toxins increases somewhat as the percent of population in poverty increases, meaning that people living in census tracts with high poverty also tend to have increased risk of cancer caused by air pollution. Statewide patterns of cancer risk suggest a strong association with density, and the denser census tracts in Clark County tend to have higher poverty levels and a greater density of roads and auto traffic. These coincident factors may explain variation in risk more than poverty itself.
The risk of disproportionate exposure to drinking water contaminants faced by lower SES populations is low in Clark County. Low SES populations are concentrated in urbanized areas, and are therefore less likely to depend on private wells vulnerable to contamination. All Clark County census tracts with high poverty rates are served by municipal water systems, which are subject to regular monitoring, reporting, and treatment.
Race and ethnicity Clark County Public Health found a moderate positive correlation between cancer risk and the percent of census tract population that is non-‐white. Like low SES populations, racial and ethnic minorities make up a larger share of the population in densely populated areas of Clark County, which tend to have higher cancer risk.
Racial and ethnic minorities have a low risk of disproportionate exposure to drinking water contaminants. As a result of their concentration in urban areas, there is a higher likelihood that their drinking water comes from municipal water systems with regular
People need to be able to breathe air, eat foods, and drink beverages that are not contaminated by toxic pollutants. While the number of toxins already in our environment means the total elimination of threat is unrealistic, every action taken to prevent further emission of toxins, clean up existing pollutants, protect residents from avoidable exposures, and ensure the availability of essential natural resources, is an action that will promote a healthier community.
Environmental Quality 46
Conditions needed to thrive
2
monitoring.
Age Older adults in Clark County face a higher risk of hospitalization due to asthma. Children everywhere are disproportionately impacted by toxins, which can harm healthy development. Geography The risk of exposure to air toxins is greater in denser, urbanized areas in the southern part of the county. Conversely, vulnerability to water contamination is greater in northern parts of the county, where more of the population relies on unmonitored private wells.
Related plans, policies, and reports: Salmon-‐Washougal and Lewis Watershed Management Plan, 2006; Ozone Maintenance Plan, 2006; Vancouver Carbon Monoxide Maintenance Plan, 2007; Sustainable, Affordable Residential Development, 2008; Creating a More Sustainable Vancouver, 2009; Sustainability Performance Report, 2010; Clark County Stream Health Report, 2010; Clark County Stormwater Management Plan, 2011
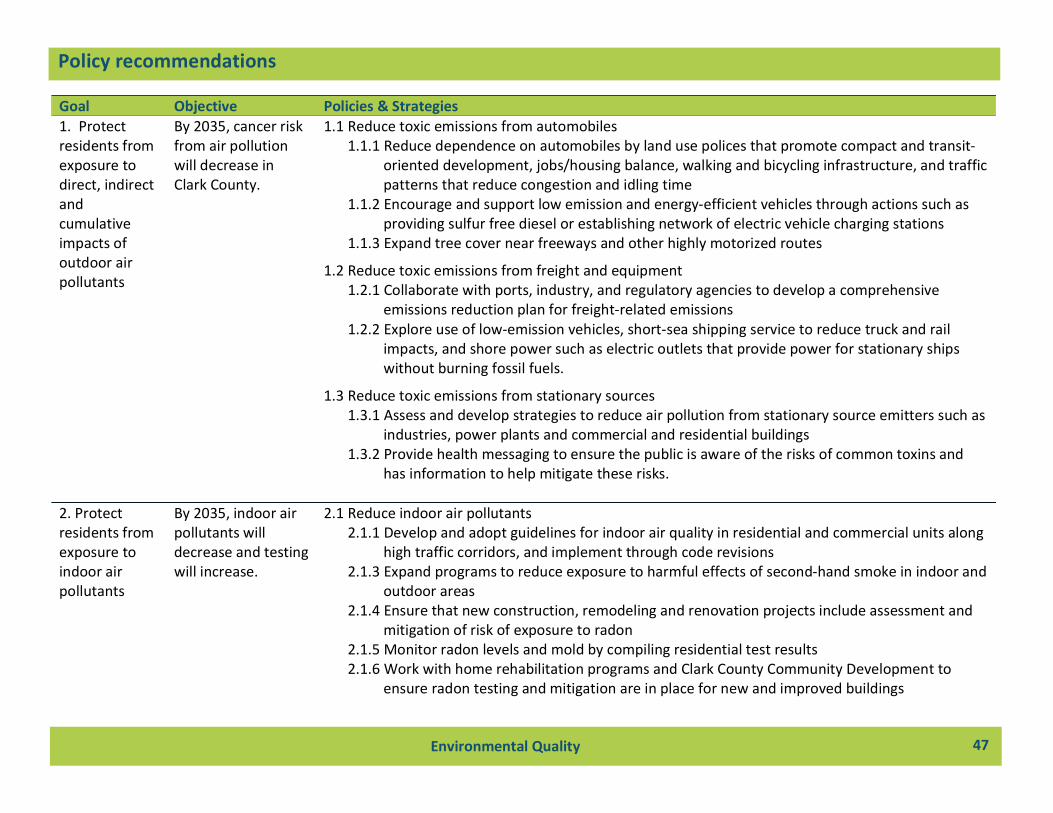
Goal Objective Policies & Strategies 1. Protect residents from exposure to direct, indirect and cumulative impacts of outdoor air pollutants
By 2035, cancer risk from air pollution will decrease in Clark County.
1.1 Reduce toxic emissions from automobiles 1.1.1 Reduce dependence on automobiles by land use polices that promote compact and transit-‐
oriented development, jobs/housing balance, walking and bicycling infrastructure, and traffic patterns that reduce congestion and idling time
1.1.2 Encourage and support low emission and energy-‐efficient vehicles through actions such as providing sulfur free diesel or establishing network of electric vehicle charging stations
1.1.3 Expand tree cover near freeways and other highly motorized routes
1.2 Reduce toxic emissions from freight and equipment 1.2.1 Collaborate with ports, industry, and regulatory agencies to develop a comprehensive
emissions reduction plan for freight-‐related emissions 1.2.2 Explore use of low-‐emission vehicles, short-‐sea shipping service to reduce truck and rail
impacts, and shore power such as electric outlets that provide power for stationary ships without burning fossil fuels.
1.3 Reduce toxic emissions from stationary sources 1.3.1 Assess and develop strategies to reduce air pollution from stationary source emitters such as
industries, power plants and commercial and residential buildings 1.3.2 Provide health messaging to ensure the public is aware of the risks of common toxins and
has information to help mitigate these risks.
2. Protect residents from exposure to indoor air pollutants
By 2035, indoor air pollutants will decrease and testing will increase.
2.1 Reduce indoor air pollutants 2.1.1 Develop and adopt guidelines for indoor air quality in residential and commercial units along
high traffic corridors, and implement through code revisions 2.1.3 Expand programs to reduce exposure to harmful effects of second-‐hand smoke in indoor and
outdoor areas 2.1.4 Ensure that new construction, remodeling and renovation projects include assessment and
mitigation of risk of exposure to radon 2.1.5 Monitor radon levels and mold by compiling residential test results 2.1.6 Work with home rehabilitation programs and Clark County Community Development to
ensure radon testing and mitigation are in place for new and improved buildings
Environmental Quality 47
Policy recommendations
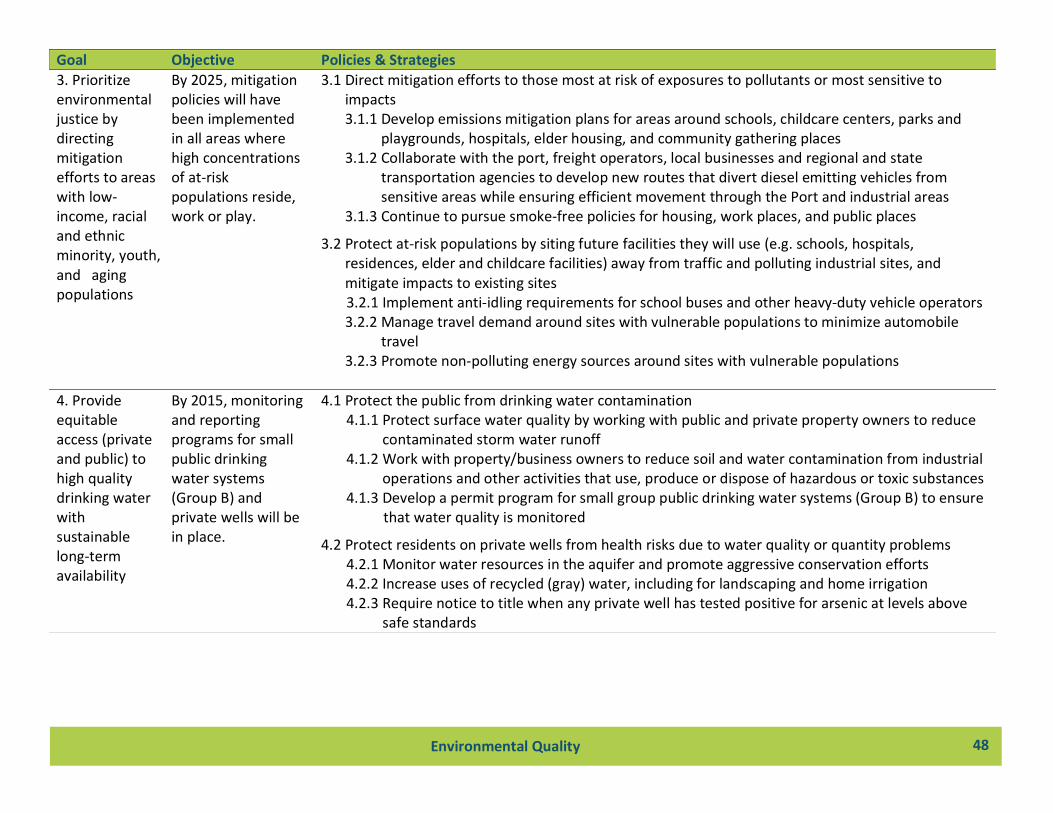
Goal Objective Policies & Strategies 3. Prioritize environmental justice by directing mitigation efforts to areas with low-‐income, racial and ethnic minority, youth, and aging populations
By 2025, mitigation policies will have been implemented in all areas where high concentrations of at-‐risk populations reside, work or play.
3.1 Direct mitigation efforts to those most at risk of exposures to pollutants or most sensitive to impacts 3.1.1 Develop emissions mitigation plans for areas around schools, childcare centers, parks and
playgrounds, hospitals, elder housing, and community gathering places 3.1.2 Collaborate with the port, freight operators, local businesses and regional and state
transportation agencies to develop new routes that divert diesel emitting vehicles from sensitive areas while ensuring efficient movement through the Port and industrial areas
3.1.3 Continue to pursue smoke-‐free policies for housing, work places, and public places
3.2 Protect at-‐risk populations by siting future facilities they will use (e.g. schools, hospitals, residences, elder and childcare facilities) away from traffic and polluting industrial sites, and mitigate impacts to existing sites
3.2.1 Implement anti-‐idling requirements for school buses and other heavy-‐duty vehicle operators 3.2.2 Manage travel demand around sites with vulnerable populations to minimize automobile
travel 3.2.3 Promote non-‐polluting energy sources around sites with vulnerable populations
4. Provide equitable access (private and public) to high quality drinking water with sustainable long-‐term availability
By 2015, monitoring and reporting programs for small public drinking water systems (Group B) and private wells will be in place.
4.1 Protect the public from drinking water contamination 4.1.1 Protect surface water quality by working with public and private property owners to reduce contaminated storm water runoff 4.1.2 Work with property/business owners to reduce soil and water contamination from industrial operations and other activities that use, produce or dispose of hazardous or toxic substances 4.1.3 Develop a permit program for small group public drinking water systems (Group B) to ensure
that water quality is monitored
4.2 Protect residents on private wells from health risks due to water quality or quantity problems 4.2.1 Monitor water resources in the aquifer and promote aggressive conservation efforts 4.2.2 Increase uses of recycled (gray) water, including for landscaping and home irrigation 4.2.3 Require notice to title when any private well has tested positive for arsenic at levels above safe standards
Environmental Quality 48
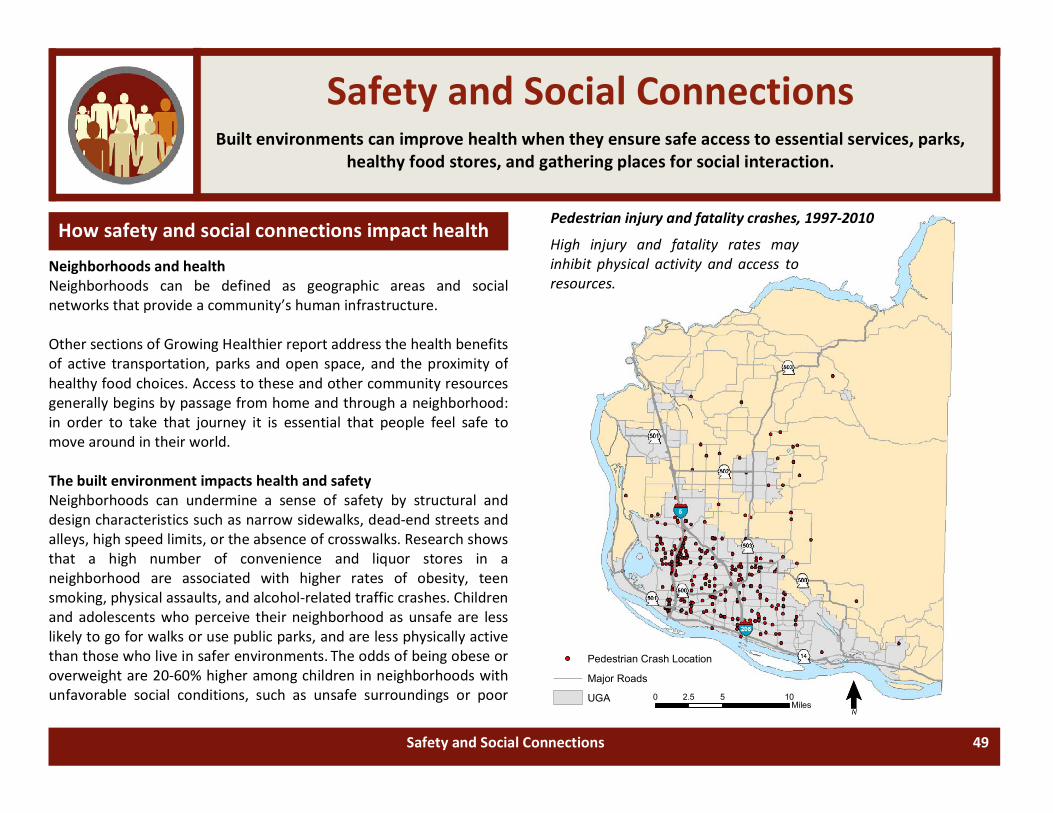
0 5 102.5Miles
Pedestrian Crash Location
Major Roads
UGA ¯ˉ
1
Neighborhoods and health Neighborhoods can be defined as geographic areas and social networks that provide a community’s human infrastructure. Other sections of Growing Healthier report address the health benefits of active transportation, parks and open space, and the proximity of healthy food choices. Access to these and other community resources generally begins by passage from home and through a neighborhood: in order to take that journey it is essential that people feel safe to move around in their world. The built environment impacts health and safety Neighborhoods can undermine a sense of safety by structural and design characteristics such as narrow sidewalks, dead-‐end streets and alleys, high speed limits, or the absence of crosswalks. Research shows that a high number of convenience and liquor stores in a neighborhood are associated with higher rates of obesity, teen smoking, physical assaults, and alcohol-‐related traffic crashes. Children and adolescents who perceive their neighborhood as unsafe are less likely to go for walks or use public parks, and are less physically active than those who live in safer environments. The odds of being obese or overweight are 20-‐60% higher among children in neighborhoods with unfavorable social conditions, such as unsafe surroundings or poor
Built environments can improve health when they ensure safe access to essential services, parks, healthy food stores, and gathering places for social interaction.
Safety and Social Connections
High injury and fatality rates may inhibit physical activity and access to resources.
Pedestrian injury and fatality crashes, 1997-‐2010 How safety and social connections impact health
Safety and Social Connections 49
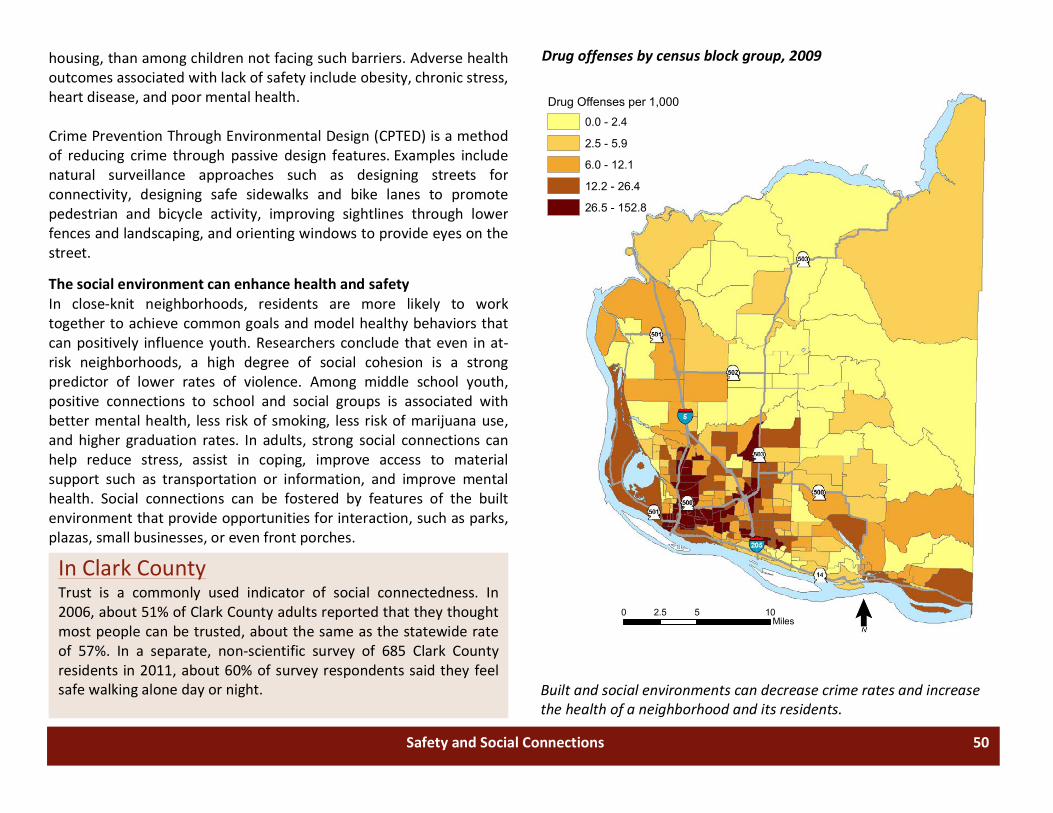
0 5 102.5Miles
Drug Offenses per 1,000 - 20090.0 - 2.4
2.5 - 5.9
6.0 - 12.1
12.2 - 26.4
26.5 - 152.8
2
housing, than among children not facing such barriers. Adverse health outcomes associated with lack of safety include obesity, chronic stress, heart disease, and poor mental health. Crime Prevention Through Environmental Design (CPTED) is a method of reducing crime through passive design features. Examples include natural surveillance approaches such as designing streets for connectivity, designing safe sidewalks and bike lanes to promote pedestrian and bicycle activity, improving sightlines through lower fences and landscaping, and orienting windows to provide eyes on the street.
The social environment can enhance health and safety In close-‐knit neighborhoods, residents are more likely to work together to achieve common goals and model healthy behaviors that can positively influence youth. Researchers conclude that even in at-‐risk neighborhoods, a high degree of social cohesion is a strong predictor of lower rates of violence. Among middle school youth, positive connections to school and social groups is associated with better mental health, less risk of smoking, less risk of marijuana use, and higher graduation rates. In adults, strong social connections can help reduce stress, assist in coping, improve access to material support such as transportation or information, and improve mental health. Social connections can be fostered by features of the built environment that provide opportunities for interaction, such as parks, plazas, small businesses, or even front porches.
In Clark County Trust is a commonly used indicator of social connectedness. In 2006, about 51% of Clark County adults reported that they thought most people can be trusted, about the same as the statewide rate of 57%. In a separate, non-‐scientific survey of 685 Clark County residents in 2011, about 60% of survey respondents said they feel safe walking alone day or night.
Drug offenses by census block group, 2009
Built and social environments can decrease crime rates and increase the health of a neighborhood and its residents.
Safety and Social Connections 50
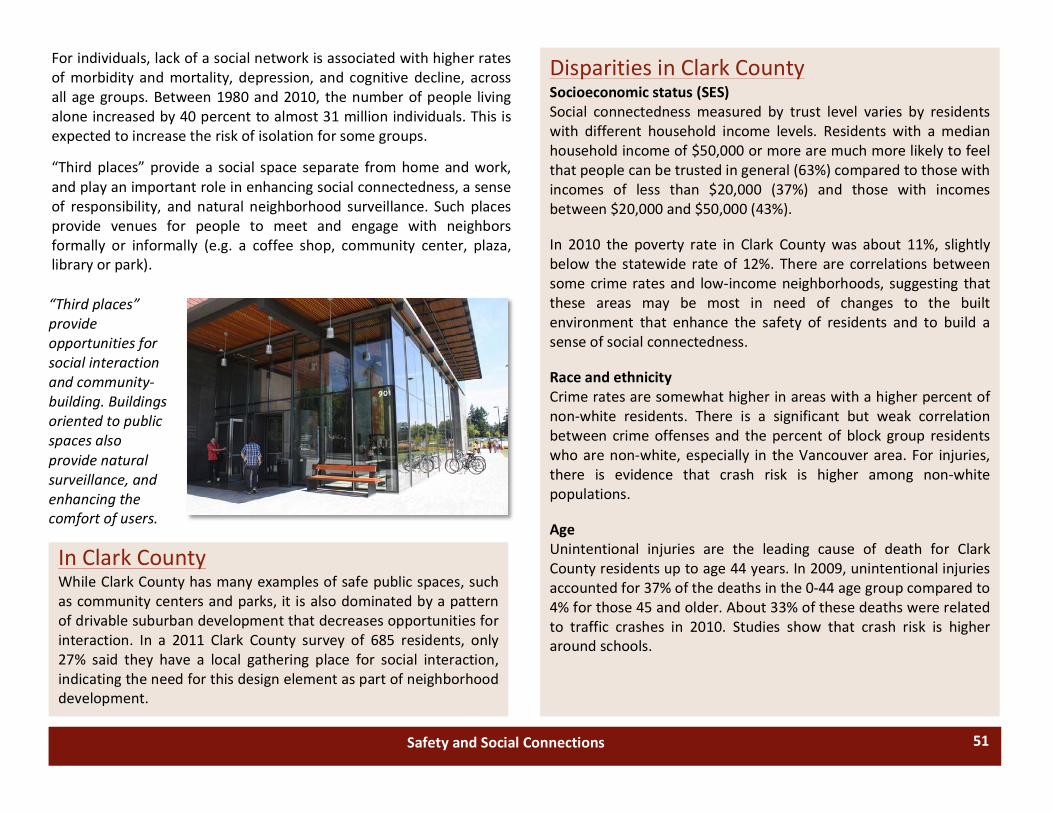
For individuals, lack of a social network is associated with higher rates of morbidity and mortality, depression, and cognitive decline, across all age groups. Between 1980 and 2010, the number of people living alone increased by 40 percent to almost 31 million individuals. This is expected to increase the risk of isolation for some groups.
“Third places” provide a social space separate from home and work, and play an important role in enhancing social connectedness, a sense of responsibility, and natural neighborhood surveillance. Such places provide venues for people to meet and engage with neighbors formally or informally (e.g. a coffee shop, community center, plaza, library or park).
Disparities in Clark County Socioeconomic status (SES) Social connectedness measured by trust level varies by residents with different household income levels. Residents with a median household income of $50,000 or more are much more likely to feel that people can be trusted in general (63%) compared to those with incomes of less than $20,000 (37%) and those with incomes between $20,000 and $50,000 (43%).
In 2010 the poverty rate in Clark County was about 11%, slightly below the statewide rate of 12%. There are correlations between some crime rates and low-‐income neighborhoods, suggesting that these areas may be most in need of changes to the built environment that enhance the safety of residents and to build a sense of social connectedness.
Race and ethnicity Crime rates are somewhat higher in areas with a higher percent of non-‐white residents. There is a significant but weak correlation between crime offenses and the percent of block group residents who are non-‐white, especially in the Vancouver area. For injuries, there is evidence that crash risk is higher among non-‐white populations.
Age Unintentional injuries are the leading cause of death for Clark County residents up to age 44 years. In 2009, unintentional injuries accounted for 37% of the deaths in the 0-‐44 age group compared to 4% for those 45 and older. About 33% of these deaths were related to traffic crashes in 2010. Studies show that crash risk is higher around schools.
In Clark County While Clark County has many examples of safe public spaces, such as community centers and parks, it is also dominated by a pattern of drivable suburban development that decreases opportunities for interaction. In a 2011 Clark County survey of 685 residents, only 27% said they have a local gathering place for social interaction, indicating the need for this design element as part of neighborhood development.
“Third places” provide opportunities for social interaction and community-‐ building. Buildings oriented to public spaces also provide natural surveillance, and enhancing the comfort of users.
Safety and Social Connections 51
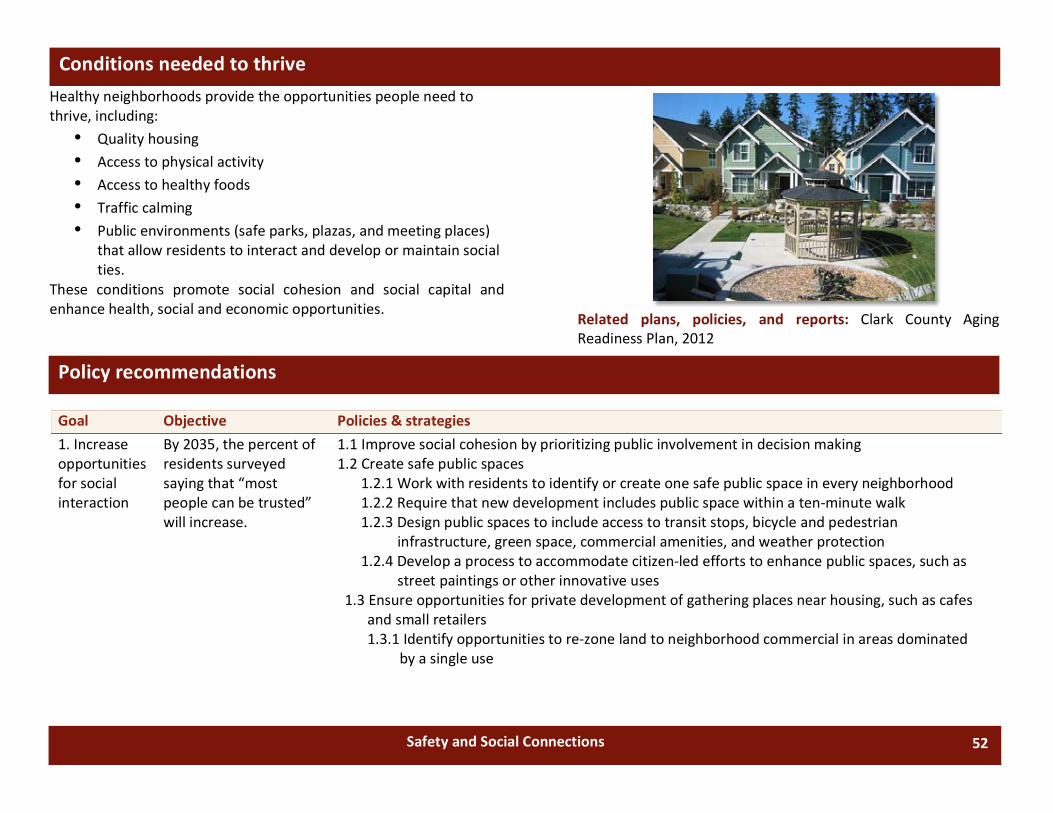
Healthy neighborhoods provide the opportunities people need to thrive, including:
• Quality housing • Access to physical activity • Access to healthy foods • Traffic calming • Public environments (safe parks, plazas, and meeting places)
that allow residents to interact and develop or maintain social ties.
These conditions promote social cohesion and social capital and enhance health, social and economic opportunities.
Goal Objective Policies & strategies 1. Increase opportunities for social interaction
By 2035, the percent of residents surveyed saying that “most people can be trusted” will increase.
1.1 Improve social cohesion by prioritizing public involvement in decision making 1.2 Create safe public spaces
1.2.1 Work with residents to identify or create one safe public space in every neighborhood 1.2.2 Require that new development includes public space within a ten-‐minute walk 1.2.3 Design public spaces to include access to transit stops, bicycle and pedestrian
infrastructure, green space, commercial amenities, and weather protection 1.2.4 Develop a process to accommodate citizen-‐led efforts to enhance public spaces, such as
street paintings or other innovative uses 1.3 Ensure opportunities for private development of gathering places near housing, such as cafes
and small retailers 1.3.1 Identify opportunities to re-‐zone land to neighborhood commercial in areas dominated by a single use
Conditions needed to thrive
Policy recommendations
Related plans, policies, and reports: Clark County Aging Readiness Plan, 2012
Safety and Social Connections 52
Goal Objective Policies & strategies 2. Ensure that safety is not a barrier to accessing health-‐supportive features of neighborhoods
By 2035, all neighborhoods will see a decrease in crime rates.
2.1 Build neighborhoods that discourage crime 2.1.1 Collaborate with law enforcement to apply Crime Prevention Through Environmental Design
(CPTED) principles to all new development projects 2.2.2 Increase natural surveillance by programming public spaces
2.2 Increase real and perceived safety in existing neighborhoods 2.2.1 Collaborate with law enforcement to organize neighborhood watch groups and community
policing efforts 2.2.2 Increase the safety and comfort of pedestrian and bicycle facilities by increasing separation
from fast moving vehicles, reducing crossing distances, and calming traffic 2.2.3 Allow and encourage temporary uses of vacant or unused property, including community
gardens, retail, and meeting space 2.2.4 Implement graffiti abatement and façade grant programs 2.2.5 Encourage and support property owners in maintaining and upgrading their property
2.3 Minimize neighborhood exposure to health impacts of alcohol, tobacco, and other harmful drugs 2.3.1 Establish buffers around schools and parks in which alcohol and tobacco sales are prohibited 2.3.2 Establish maximum densities for alcohol retail outlets 2.3.3 Continue to pursue tobacco-‐free policies for housing, workplaces, and public place
3. Strive for neighborhoods that are economically and culturally diverse
In 2035, the percent of population living in high poverty (> 20%) census tracts will be stable or decreasing.
3.1 Ensure that all neighborhoods are communities of opportunity 3.1.1 Diversify housing to provide for a range of incomes within neighborhoods 3.1.2 Mix subsidized housing units with market-‐rate housing
3.2 Prioritize sub-‐area planning in areas of high poverty 3.2.1 Intensify affordable housing efforts in these areas 3.2.2 Identify housing that poses health risks and coordinate efforts to resolve issues of inadequate
or unhealthy housing
Safety and Social Connections 53
Appendix A: GlossaryNote that items listed may be referenced in either Growing Healthier Report or Background Papers. Concepts that were explicitly defined in the Growing Healthier Report may not be repeated here.
Absolute food desert: An area farther than ½ mile from any food retailer.
Accessory Dwelling Unit (ADU): A self‐contained housing unit incorporated within a single‐family dwelling or accessory structure such as a garage on the same lot. It is a auxiliary or smaller than the main single‐family dwelling.
Agricultural districts/preservation areas: Legally recognized areas designed to maintain agricultural land uses. These areas may voluntarily enroll in programs and may receive special benefits and protection from regulation.
Aquifer: A water‐bearing geologic formation, sometimes confined between clay layers and sometimes on the surface. Aquifers are thesource of ground water for drinking and irrigation.
Built environment: Human‐made surroundings consisting of buildings, infrastructure, parks, and arrangement of land uses that form the physical character of a city and provide a setting for human activity Chronic disease: Sickness that is long‐lasting or recurrent. Examples include diabetes, asthma, and heart, kidney and lung disease. Ciclovia: The temporary closure of streets to motorized traffic to allow
bicycling, walking, running, and a variety of active and educational activities. Climate Action Plan: A description of the policies and measures that a local government will take to reduce greenhouse gas emissions and achieve its emissions reduction targets. Most plans include a timeline, a description of financing mechanisms, and an assignment of responsibility to departments and staff. In addition to direct greenhouse gas reduction measures, most plans incorporate adaptation and public awareness and education efforts as well. Climate change: Any long‐term significant change in the weather patterns of an area, which can occur naturally or by changes people have made to the land or atmosphere.
Community food security: In the broadest terms, community food security can be described as a prevention‐oriented concept that supports the development and enhancement of sustainable, community‐based strategies to improve access of low‐income households to healthful nutritious food supplies, to increase the self‐reliance of communities in providing for their own food needs, and to promote comprehensive responses to local food, farm, and nutrition issues.
Community‐Supported Agriculture (CSA): A partnership of mutual commitment between a farm and a community of supporters, which provides a direct link between the production and consumption of food.
Compact design: Refers to the act of constructing buildings vertically
54Appendix A: Glossary
rather than horizontally, and configuring them on a block or neighborhood scale that makes efficient use of land and resources, and is consistent with neighborhood character and scale. Compact building design reduces the footprint of new construction, thus preserving green space to absorb and filter rain water, reducingflooding and stormwater drainage needs, and lowering the amount of pollution washing into our streams, rivers and lakes. Compact design can contribute to sustaining transit ridership at levels necessary to make a viable transportation option.
Comprehensive Plan: Regional, state, or local documents that describe community visions for future growth. Comprehensive plans describe general plans and policies for how communities will grow and the tools that are used to guide land use decisions, and give general, long‐range recommendations for community growth. Typical elements include, land use, housing, transportation, environment, economic development, and community facilities.
Density: The average number of people, families, or housing units on one unit of land. Density is also expressed as dwelling units per acre.
Density bonus: Allows developers to build in specified areas at densities that are higher than normally allowed in return for agreeing to design features or building characteristics with public benefits. Design standards: Design standards or guidelines can serve as a community's desire to control its appearance, from within and without, through a series of standards that govern site planning policies, densities, building heights, traffic and lighting.
Determinants of health: The social and economic environment, the physical environment, and the person’s individual characteristics and behaviors. To a large extent, these factors all have considerable impacts on health, whereas the more commonly considered factors
such as access and use of health care services often have less of an impact.
Disparities: Differences in health outcomes, access to resources, or access to opportunity based on race, ethnicity, geography, gender, socioeconomic status, or other factors.
District energy: A district energy system consists of a central plant that produces steam, hot water, or chilled water, to provide space heating, domestic hot water heating, and air conditioning. The water or steam is delivered through a network of pre‐insulated buried pipes to a clustered community of commercial, industrial, and/or residential customers. As a result, individual buildings don't need their own boilers, furnaces, and cooling systems saving money and energy. When designed with a combined heat and power plant the system can also provide electricity.
Environmental justice: The principle that all people have a right to be protected from environmental pollution and to live in and enjoy a clean and healthful environment. Environmental justice is the equal protection and meaningful involvement of all people with respect to the development, implementation, and enforcement of environmental laws, regulations, and policies and the equitable distribution of environmental benefits.
Environmental Protection Agency (EPA): The federal body charged with responsibility for natural resource protection and oversight of the release of toxins and other threats to the environment.
Extreme heat: generally refers to a percentage of the highest heat days during a given time period, and usually taking humidity into account.
Extremely low income: defined by the US Department of Housing and Urban Development as households earning 30 percent or less of the
Appendix A: Glossary 55
median income for the county.
Flood hazard area: The total stream and adjacent area periodically covered by overflow from the stream channel. Flood hazard areascontain 1) the floodway which is the channel itself and portions of the immediately adjacent overbank that carry the major portion of flood flow, and 2) the flood fringe beyond it which is inundated to a lesser degree. Flood plain: The land adjacent to a water body, stream, river, lake or ocean that experiences occasional flooding.
Global warming: An ongoing increase in the average temperature of the Earth’s surface in recent decades resulting primarily from human activities, principally the burning of fossil fuels, that release greenhouse gases. An increase in global temperatures is expected to raise sea levels, increase the frequency and intensity of storms, and alter the amount and pattern of precipitation andagricultural yields, among other effects.
Green building or green design: Building design that yields environmental benefits, such as savings in energy, building materials, and water consumption, or reduced waste generation.
Greenhouse gas (GHG): Heat‐trapping gases that exist in the atmosphere of Earth and cause the greenhouse effect. Some greenhouse gases occur naturally, while others result from human activities such as the burning of fossil fuels. Greenhouse gases include carbon dioxide, methane, nitrous oxide, and ozone
Groundwater: All water below the surface of the land. It is found in the porous spaces of bedrock or soil, and it reachesthe land surface through springs or wells.
Growth management: A term that encompasses a whole range of
policies designed to control, guide, or mitigate the effects of growth. Human capital: People’s knowledge, skills, health, or values in the workplace. They are called human capital because they cannot be separated from the person. Economists view education, training, and health as the most important investments in human capital.
Inclusionary zoning: A system that requires a minimum percentage of lower and moderate income housing to be provided in new developments. Inclusionary programs are based on mandatory requirements or development incentives, such as density bonuses.
Infill development: Projects that use vacant or underutilized land in previously developed areas for buildings, parking, and other uses. Infrastructure: Water and sewer lines, roads, urban transit lines, schools and other public facilities needed to support developed areas.
Land use: The manner in which a parcel of land is used or occupied, including the activities and buildings that occupy it.
Leadership in Energy and Environmental Design (LEED): A Green Building Rating System that is a nationally accepted benchmark for the design, construction, and operation of high performance green buildings. Administered by the U.S. Green Building Council, LEED promotes a whole‐building approach to sustainability by recognizing performance in five key areas of human and environmental health: sustainable site development, water savings, energy efficiency, materials selection, and indoor environmental quality. Loan pools: Loans acquired by the FDIC from failed financial institutions that are generally sold in pools through sealed bid sale or English outcry auction.
Low income: defined by the US Department of Housing and Urban Development as households earning 80 percent or lower than e th56
56Appendix A: Glossary
median income of the county where a person lives.
Mixed‐use development: Development that includes multiple land uses within one building, on one parcel, or on adjacent parcels. A common example is residential buildings with ground‐floor retail.
Modal split: The percentage of travelers using each mode of transportation.
Non‐point source pollution: Pollution that cannot be identified as coming from a specific source and thus cannot be controlled through the issuing of permits. Storm water runoff and some deposits from the air fall into this category.
Open space: Undeveloped land or land that is used for recreation. Farmland, cemeteries, golf courses, and natural habitats (forests, fields, wetlands etc.) are included in this category.
Quality of life or livability: Aspects of the economic, social and physical environment that make a community a desirable place in which to live or do business. Quality of life factors include those such as climate and natural features, access to schools, housing, employment opportunities, medical facilities, cultural and recreational amenities, and public services.
Rehabilitation: The reconditioning of buildings to improve their structural integrity, energy efficiency, healthfulness, visual appeal, or other physical characteristics.
Reverse mortgage: A type of home loan in which the owner converts a portion of the equity of a home into cash. The equity built up over years of making mortgage payments is paid to the owner.
Runoff: Water that flows off the surface of the land, ultimately into streams and water bodies, without being absorbed into the soil.
Smart growth: Well‐planned development that protects open space and farmland, revitalizes communities, keeps housing affordable and provides more transportation choices. Socioeconomic status (SES):An economic and sociological combined total measure of a person's work experience and of an individual's or family’s economic and social position in relation to others, based on income, education, and occupation.
Sprawl: Development patterns in which rural land is converted to urban/suburban uses more quickly than needed to house new residents and support new businesses, and people become more dependent on automobiles. Sprawl is characterized by low‐density residential development, rigid separation between residential and commercial uses, residential and commercial development in rural areas away from urban centers, minimal support for non‐motorized transportation methods, and a lack of integrated transportation and land use planning.
Streetscape: The space between the buildings on either side of a street that defines its character. The elements of a streetscape include: building frontage/façade; landscaping (trees, yards, bushes, plantings, etc.); sidewalks; street paving; street furniture (benches, kiosks, trash receptacles, fountains, etc.); signs; awnings; and street lighting.
Traditional neighborhood: A development pattern that reflects historic settlement patterns and town planning concepts such as gridded, narrow streets, reduced front and side setbacks, and an orientation of streets and neighborhoods around a pedestrian oriented town center.
Transit nodes: Stops along a public transportation route where people board and disembark, often where one or more routes
Appendix A: Glossary 57
References
Becker, G.S. Human Capital. In The Concise Encyclopedia of Economics. http://www.econlib.org/library/Enc/HumanCapital.html
Bike Walk Kansas City. http://bikewalkkc.org/ciclovia/about
Federal Deposit Insurance Corporation. Loan Sales FAQs. http://www.fdic.gov/buying/loan/loan/index.html
National Housing Trust Fund, National Low Income Housing Coalition. http://nlihc.org/issues/nhtf?id=40
Robert Wood Johnson Health System Glossary. http://www.rwjhamilton.org/Pages/Glossary.aspx
Smart Growth Smart Energy Toolkit, Massachusetts State. www.mass.gov/envir/smart_growth_toolkit/pages/glossary.html
TRACE R&D Web Site, University of Wisconsin‐Madison. http://trace.wisc.edu/docs/whats_ud/whats_ud.htm
United States Department of Agriculture. http://www.ers.usda.gov/publications/
United States Department of Housing and Urban Development. Frequently Asked Questions about HUD’s Reverse Mortgages. http://portal.hud.gov/hudportal/HUD?src=/program_offices/housing/sfh/hecm/rmtopten
World Health Organization. Health Impact Assessments: The determinants of health. http://www.who.int/hia/evidence/doh/en/
58Appendix A: Glossary
intersect with each other. These sites can provide ideal locations for
Universal design: The two major components of universal design
USGS (United States Geological Survey): A federal agency that
A): An area defined by land use policy within
The geographic area that drains into a specific body of
areas and
mixed‐use development as well as transit‐oriented development.
Trust fund: An arrangement whereby property is held by an individual,board, or public body for the benefit of others. Such arrangements are used to build, preserve, or rehabilitate housing, which is then offered at a lower cost to low‐income households.
include (1) designing products so that they are flexible enough that they can be directly used (without requiring any assistive technologies or modifications) by people with the widest range of abilities and circumstances as is commercially practical given current materials, technologies, and knowledge; and designing products so that they are compatible with the assistive technologies that might be used by those who cannot efficiently access and use the products directly. This term is often used to describe housing or public infrastructure designed to accommodate disabled people.
provides mapping of topography, aquifer levels, and areas where aquifers are recharged.
Urban Growth Area (UGwhich urban development patterns and urban services are intended. Outside of this area, lower densities and agricultural preservation are expected.
Watershed:water. A watershed may contain several sub‐watersheds.
Zoning: Classification of land in a community into differentdistricts. Zoning is a legislative process that regulates building dimensions, density, design, placement and use within each district.
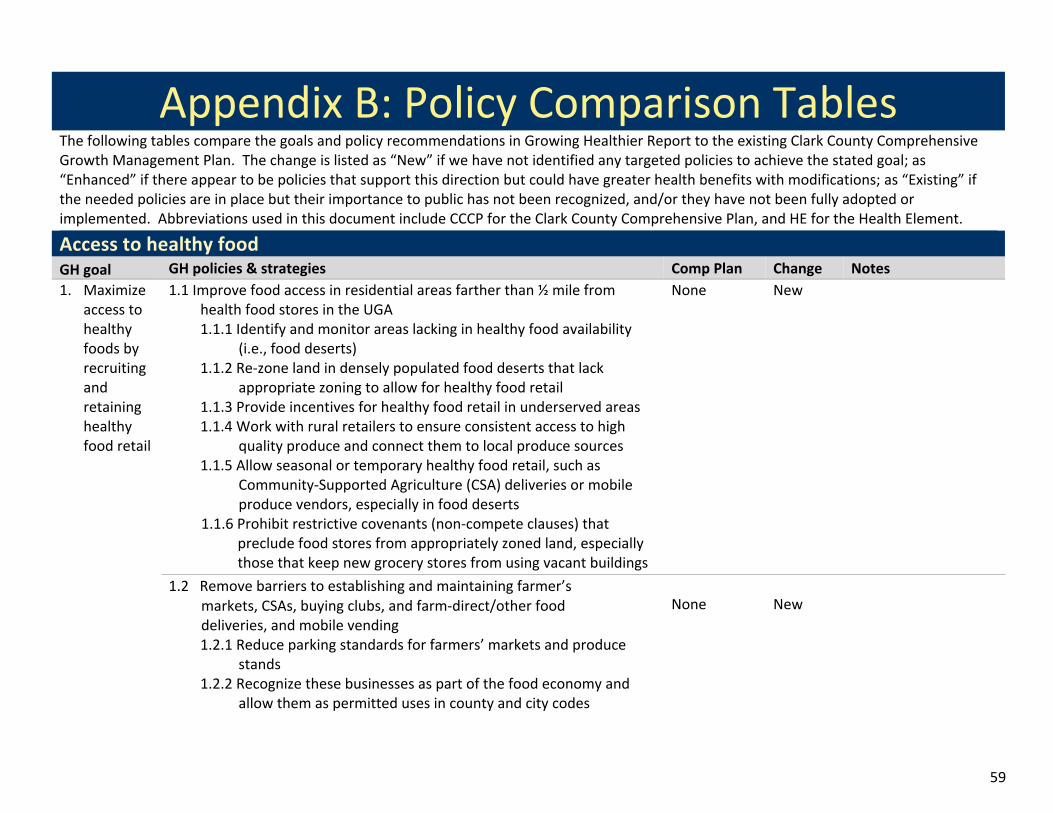
59
Appendix B: Policy Comparison Tables The following tables compare the goals and policy recommendations in Growing Healthier Report to the existing Clark County Comprehensive Growth Management Plan. The change is listed as “New” if we have not identified any targeted policies to achieve the stated goal; as “Enhanced” if there appear to be policies that support this direction but could have greater health benefits with modifications; as “Existing” if the needed policies are in place but their importance to public has not been recognized, and/or they have not been fully adopted or implemented. Abbreviations used in this document include CCCP for the Clark County Comprehensive Plan, and HE for the Health Element.
Access to healthy food GH goal GH policies & strategies Comp Plan Change Notes 1. Maximize
access to healthy foods by recruiting and retaining healthy food retail
1.1 Improve food access in residential areas farther than ½ mile from health food stores in the UGA 1.1.1 Identify and monitor areas lacking in healthy food availability
(i.e., food deserts) 1.1.2 Re-‐zone land in densely populated food deserts that lack
appropriate zoning to allow for healthy food retail 1.1.3 Provide incentives for healthy food retail in underserved areas 1.1.4 Work with rural retailers to ensure consistent access to high
quality produce and connect them to local produce sources 1.1.5 Allow seasonal or temporary healthy food retail, such as
Community-‐Supported Agriculture (CSA) deliveries or mobile produce vendors, especially in food deserts
1.1.6 Prohibit restrictive covenants (non-‐compete clauses) that preclude food stores from appropriately zoned land, especially those that keep new grocery stores from using vacant buildings
1.2 Remove barriers to establishing and maintaining farmer’s markets, CSAs, buying clubs, and farm-‐direct/other food deliveries, and mobile vending
1.2.1 Reduce parking standards for farmers’ markets and produce stands
1.2.2 Recognize these businesses as part of the food economy and allow them as permitted uses in county and city codes
None None
New New
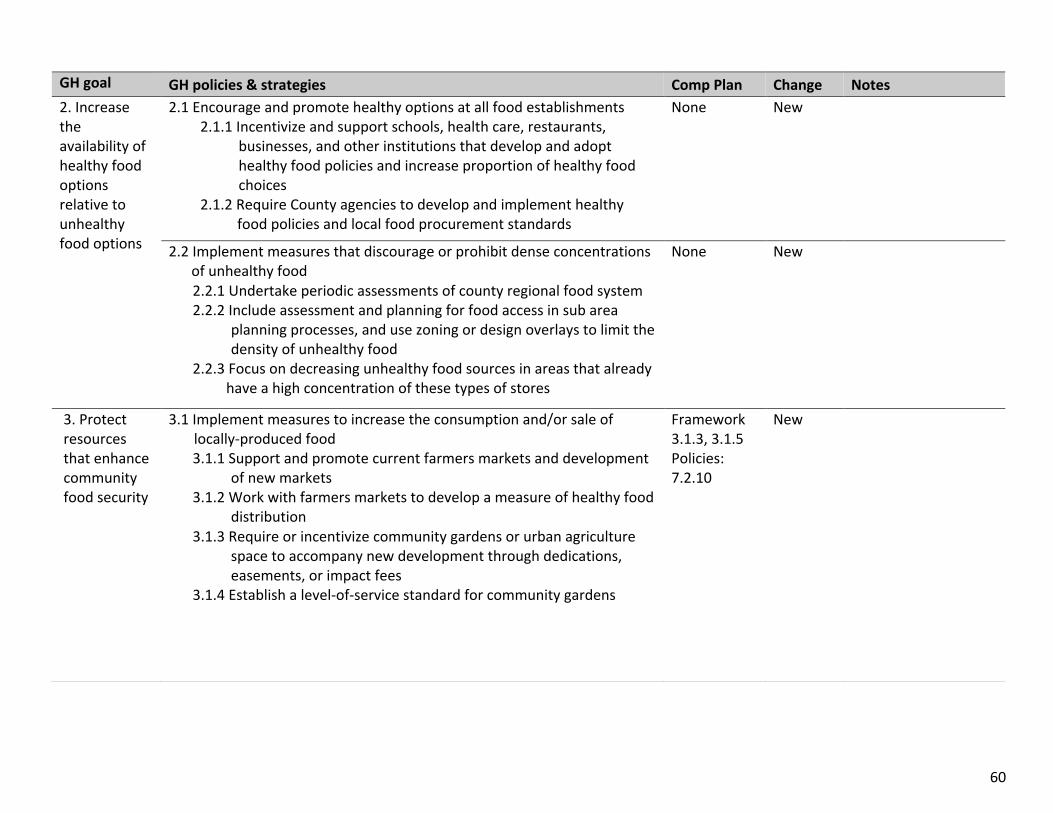
60
GH goal GH policies & strategies Comp Plan Change Notes 2. Increase the availability of healthy food options relative to unhealthy food options
2.1 Encourage and promote healthy options at all food establishments 2.1.1 Incentivize and support schools, health care, restaurants,
businesses, and other institutions that develop and adopt healthy food policies and increase proportion of healthy food choices
2.1.2 Require County agencies to develop and implement healthy food policies and local food procurement standards
None New
2.2 Implement measures that discourage or prohibit dense concentrations of unhealthy food 2.2.1 Undertake periodic assessments of county regional food system 2.2.2 Include assessment and planning for food access in sub area
planning processes, and use zoning or design overlays to limit the density of unhealthy food
2.2.3 Focus on decreasing unhealthy food sources in areas that already have a high concentration of these types of stores
None New
3. Protect resources that enhance community food security
3.1 Implement measures to increase the consumption and/or sale of locally-‐produced food
3.1.1 Support and promote current farmers markets and development of new markets
3.1.2 Work with farmers markets to develop a measure of healthy food distribution
3.1.3 Require or incentivize community gardens or urban agriculture space to accompany new development through dedications, easements, or impact fees
3.1.4 Establish a level-‐of-‐service standard for community gardens
Framework 3.1.3, 3.1.5 Policies: 7.2.10
New
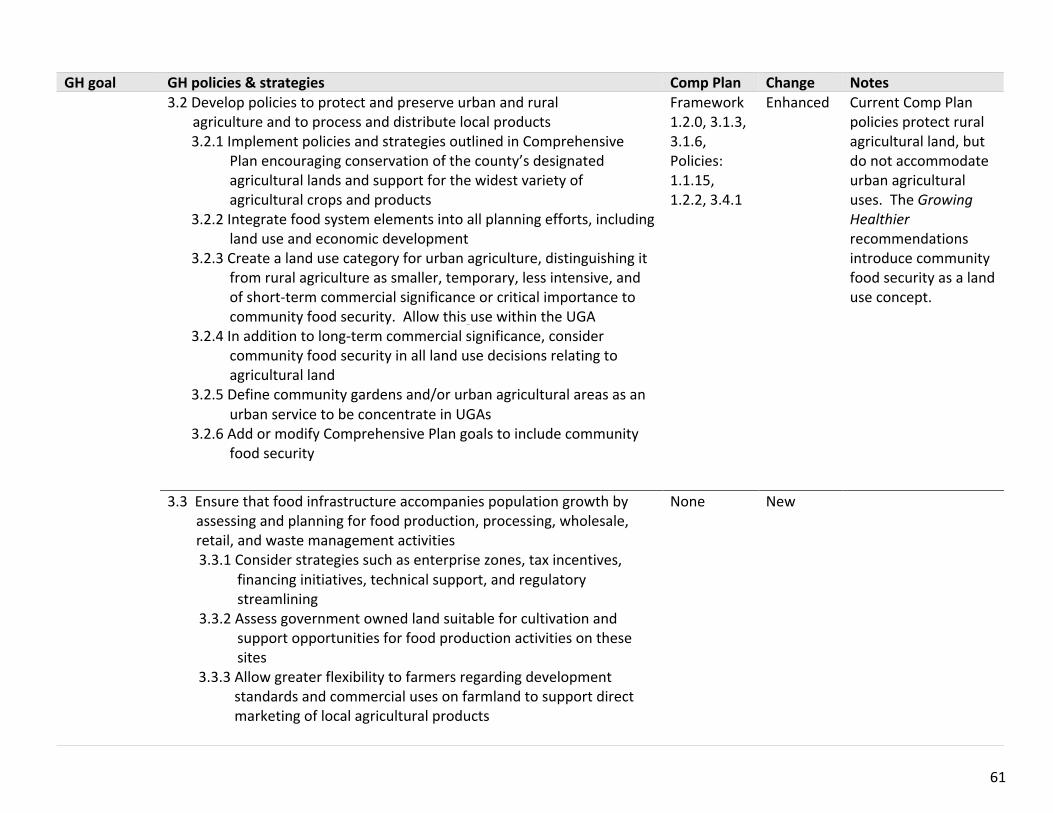
61
GH goal GH policies & strategies Comp Plan Change Notes
3.2 Develop policies to protect and preserve urban and rural agriculture and to process and distribute local products
3.2.1 Implement policies and strategies outlined in Comprehensive Plan encouraging conservation of the county’s designated agricultural lands and support for the widest variety of agricultural crops and products
3.2.2 Integrate food system elements into all planning efforts, including land use and economic development
3.2.3 Create a land use category for urban agriculture, distinguishing it from rural agriculture as smaller, temporary, less intensive, and of short-‐term commercial significance or critical importance to community food security. Allow this use within the UGA
3.2.4 In addition to long-‐term commercial significance, consider community food security in all land use decisions relating to agricultural land
3.2.5 Define community gardens and/or urban agricultural areas as an urban service to be concentrate in UGAs
3.2.6 Add or modify Comprehensive Plan goals to include community food security
Framework1.2.0, 3.1.3, 3.1.6, Policies: 1.1.15, 1.2.2, 3.4.1
Enhanced Current Comp Plan policies protect rural agricultural land, but do not accommodate urban agricultural uses. The Growing Healthier recommendations introduce community food security as a land use concept.
3.3 Ensure that food infrastructure accompanies population growth by assessing and planning for food production, processing, wholesale, retail, and waste management activities 3.3.1 Consider strategies such as enterprise zones, tax incentives,
financing initiatives, technical support, and regulatory streamlining
3.3.2 Assess government owned land suitable for cultivation and support opportunities for food production activities on these sites
3.3.3 Allow greater flexibility to farmers regarding development standards and commercial uses on farmland to support direct marketing of local agricultural products
None
New
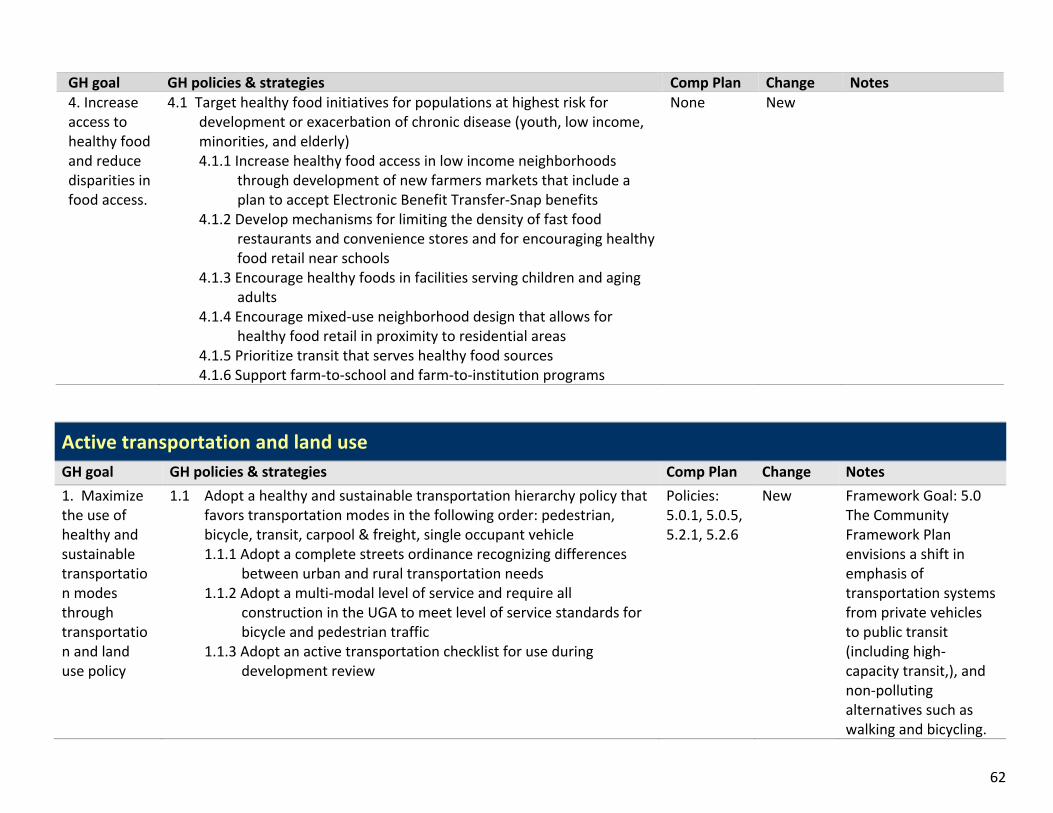
62
Active transportation and land use GH goal GH policies & strategies Comp Plan Change Notes 1. Maximize the use of healthy and sustainable transportation modes through transportation and land use policy
1.1 Adopt a healthy and sustainable transportation hierarchy policy that favors transportation modes in the following order: pedestrian, bicycle, transit, carpool & freight, single occupant vehicle 1.1.1 Adopt a complete streets ordinance recognizing differences
between urban and rural transportation needs 1.1.2 Adopt a multi-‐modal level of service and require all
construction in the UGA to meet level of service standards for bicycle and pedestrian traffic
1.1.3 Adopt an active transportation checklist for use during development review
Policies: 5.0.1, 5.0.5, 5.2.1, 5.2.6
New
Framework Goal: 5.0 The Community Framework Plan envisions a shift in emphasis of transportation systems from private vehicles to public transit (including high-‐capacity transit,), and non-‐polluting alternatives such as walking and bicycling.
GH goal GH policies & strategies Comp Plan Change Notes 4. Increase access to healthy food and reduce disparities in food access.
4.1 Target healthy food initiatives for populations at highest risk for development or exacerbation of chronic disease (youth, low income, minorities, and elderly) 4.1.1 Increase healthy food access in low income neighborhoods
through development of new farmers markets that include a plan to accept Electronic Benefit Transfer-‐Snap benefits
4.1.2 Develop mechanisms for limiting the density of fast food restaurants and convenience stores and for encouraging healthy food retail near schools
4.1.3 Encourage healthy foods in facilities serving children and aging adults
4.1.4 Encourage mixed-‐use neighborhood design that allows for healthy food retail in proximity to residential areas
4.1.5 Prioritize transit that serves healthy food sources 4.1.6 Support farm-‐to-‐school and farm-‐to-‐institution programs
None New
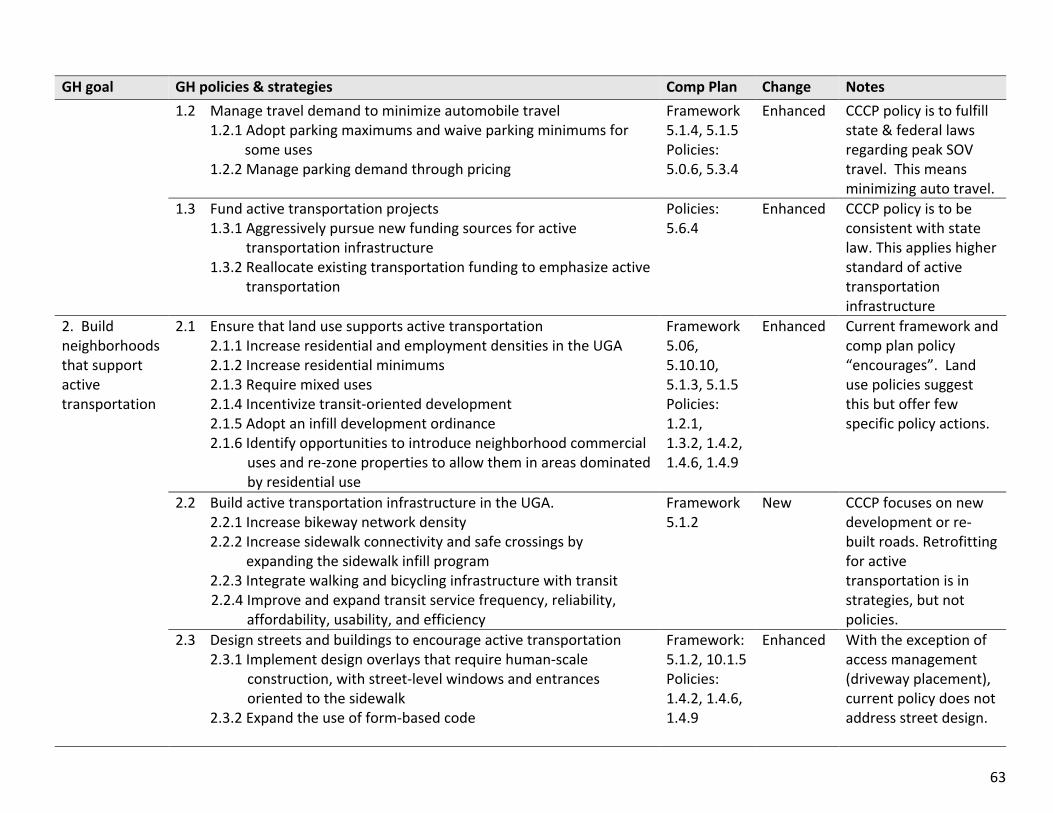
63
GH goal GH policies & strategies Comp Plan Change Notes 1.2 Manage travel demand to minimize automobile travel
1.2.1 Adopt parking maximums and waive parking minimums for some uses
1.2.2 Manage parking demand through pricing
Framework5.1.4, 5.1.5 Policies: 5.0.6, 5.3.4
Enhanced CCCP policy is to fulfill state & federal laws regarding peak SOV travel. This means minimizing auto travel.
1.3 Fund active transportation projects 1.3.1 Aggressively pursue new funding sources for active
transportation infrastructure 1.3.2 Reallocate existing transportation funding to emphasize active
transportation
Policies: 5.6.4
Enhanced CCCP policy is to be consistent with state law. This applies higher standard of active transportation infrastructure
2. Build neighborhoods that support active transportation
2.1 Ensure that land use supports active transportation 2.1.1 Increase residential and employment densities in the UGA 2.1.2 Increase residential minimums 2.1.3 Require mixed uses 2.1.4 Incentivize transit-‐oriented development 2.1.5 Adopt an infill development ordinance 2.1.6 Identify opportunities to introduce neighborhood commercial
uses and re-‐zone properties to allow them in areas dominated by residential use
Framework5.06, 5.10.10, 5.1.3, 5.1.5 Policies: 1.2.1, 1.3.2, 1.4.2, 1.4.6, 1.4.9
Enhanced Current framework and comp plan policy “encourages”. Land use policies suggest this but offer few specific policy actions.
2.2 Build active transportation infrastructure in the UGA. 2.2.1 Increase bikeway network density 2.2.2 Increase sidewalk connectivity and safe crossings by expanding the sidewalk infill program 2.2.3 Integrate walking and bicycling infrastructure with transit 2.2.4 Improve and expand transit service frequency, reliability,
affordability, usability, and efficiency
Framework5.1.2
New CCCP focuses on new development or re-‐built roads. Retrofitting for active transportation is in strategies, but not policies.
2.3 Design streets and buildings to encourage active transportation 2.3.1 Implement design overlays that require human-‐scale
construction, with street-‐level windows and entrances oriented to the sidewalk
2.3.2 Expand the use of form-‐based code
Framework: 5.1.2, 10.1.5 Policies: 1.4.2, 1.4.6, 1.4.9
Enhanced With the exception of access management (driveway placement), current policy does not address street design.
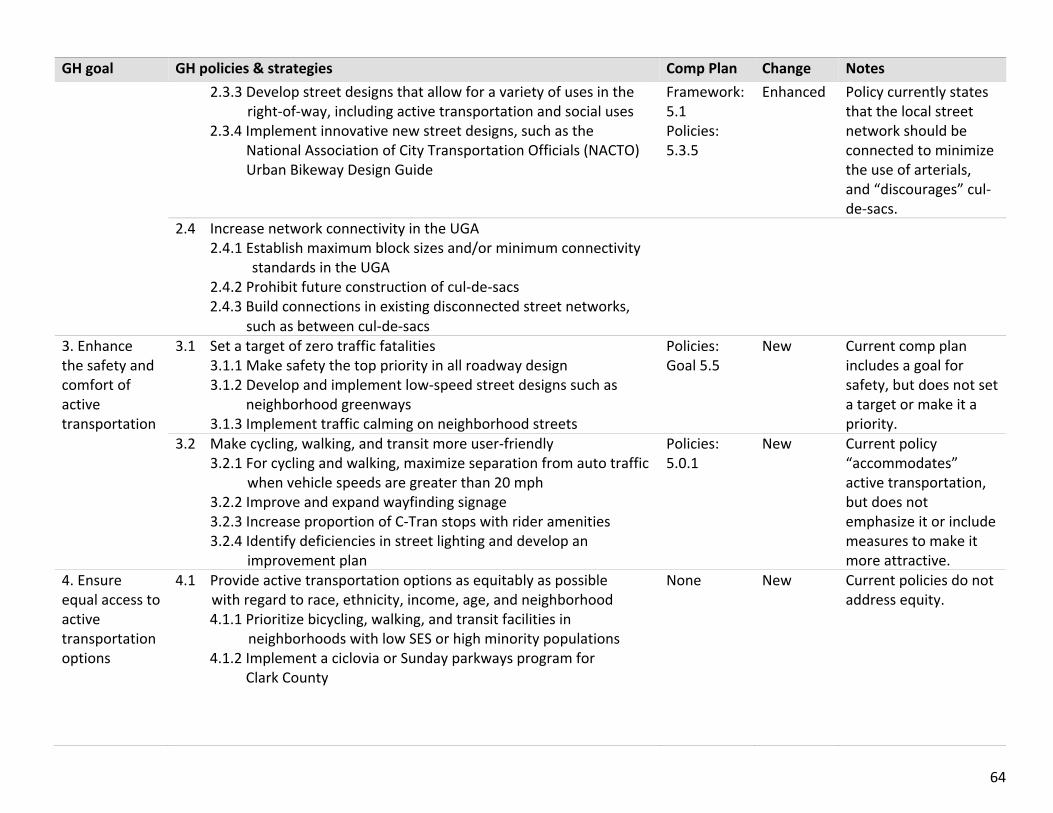
64
GH goal GH policies & strategies Comp Plan Change Notes 2.3.3 Develop street designs that allow for a variety of uses in the
right-‐of-‐way, including active transportation and social uses 2.3.4 Implement innovative new street designs, such as the
National Association of City Transportation Officials (NACTO) Urban Bikeway Design Guide
Framework: 5.1 Policies: 5.3.5
Enhanced Policy currently states that the local street network should be connected to minimize the use of arterials, and “discourages” cul-‐de-‐sacs.
2.4 Increase network connectivity in the UGA 2.4.1 Establish maximum block sizes and/or minimum connectivity
standards in the UGA 2.4.2 Prohibit future construction of cul-‐de-‐sacs 2.4.3 Build connections in existing disconnected street networks,
such as between cul-‐de-‐sacs
3. Enhance the safety and comfort of active transportation
3.1 Set a target of zero traffic fatalities 3.1.1 Make safety the top priority in all roadway design 3.1.2 Develop and implement low-‐speed street designs such as
neighborhood greenways 3.1.3 Implement traffic calming on neighborhood streets
Policies: Goal 5.5
New Current comp plan includes a goal for safety, but does not set a target or make it a priority.
3.2 Make cycling, walking, and transit more user-‐friendly 3.2.1 For cycling and walking, maximize separation from auto traffic
when vehicle speeds are greater than 20 mph 3.2.2 Improve and expand wayfinding signage 3.2.3 Increase proportion of C-‐Tran stops with rider amenities 3.2.4 Identify deficiencies in street lighting and develop an
improvement plan
Policies: 5.0.1
New Current policy “accommodates” active transportation, but does not emphasize it or include measures to make it more attractive.
4. Ensure equal access to active transportation options
4.1 Provide active transportation options as equitably as possible with regard to race, ethnicity, income, age, and neighborhood
4.1.1 Prioritize bicycling, walking, and transit facilities in neighborhoods with low SES or high minority populations
4.1.2 Implement a ciclovia or Sunday parkways program for Clark County
None
New Current policies do not address equity.
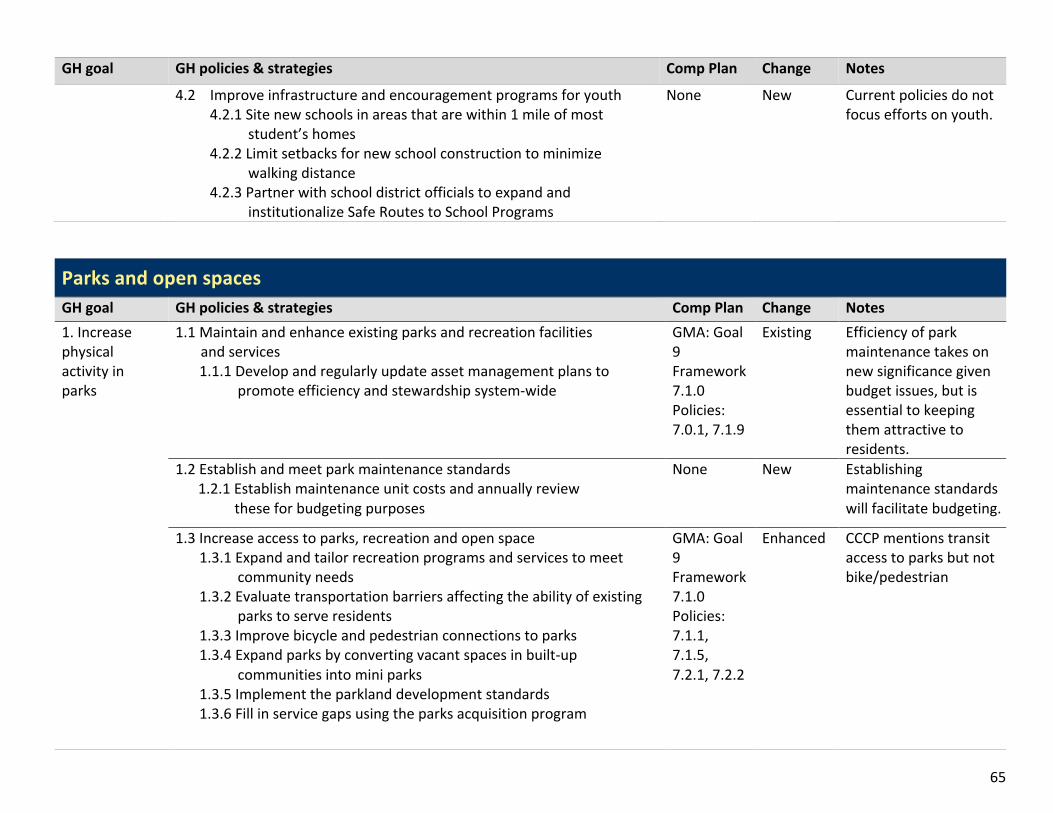
65
GH goal GH policies & strategies Comp Plan Change Notes
4.2 Improve infrastructure and encouragement programs for youth 4.2.1 Site new schools in areas that are within 1 mile of most
student’s homes 4.2.2 Limit setbacks for new school construction to minimize
walking distance 4.2.3 Partner with school district officials to expand and
institutionalize Safe Routes to School Programs
None
New Current policies do not focus efforts on youth.
Parks and open spaces GH goal GH policies & strategies Comp Plan Change Notes 1. Increase physical activity in parks
1.1 Maintain and enhance existing parks and recreation facilities and services
1.1.1 Develop and regularly update asset management plans to promote efficiency and stewardship system-‐wide
GMA: Goal 9 Framework7.1.0 Policies: 7.0.1, 7.1.9
Existing
Efficiency of park maintenance takes on new significance given budget issues, but is essential to keeping them attractive to residents.
1.2 Establish and meet park maintenance standards 1.2.1 Establish maintenance unit costs and annually review these for budgeting purposes
None New Establishing maintenance standards will facilitate budgeting.
1.3 Increase access to parks, recreation and open space 1.3.1 Expand and tailor recreation programs and services to meet
community needs 1.3.2 Evaluate transportation barriers affecting the ability of existing
parks to serve residents 1.3.3 Improve bicycle and pedestrian connections to parks 1.3.4 Expand parks by converting vacant spaces in built-‐up
communities into mini parks 1.3.5 Implement the parkland development standards 1.3.6 Fill in service gaps using the parks acquisition program
GMA: Goal 9 Framework7.1.0 Policies: 7.1.1, 7.1.5, 7.2.1, 7.2.2
Enhanced CCCP mentions transit access to parks but not bike/pedestrian
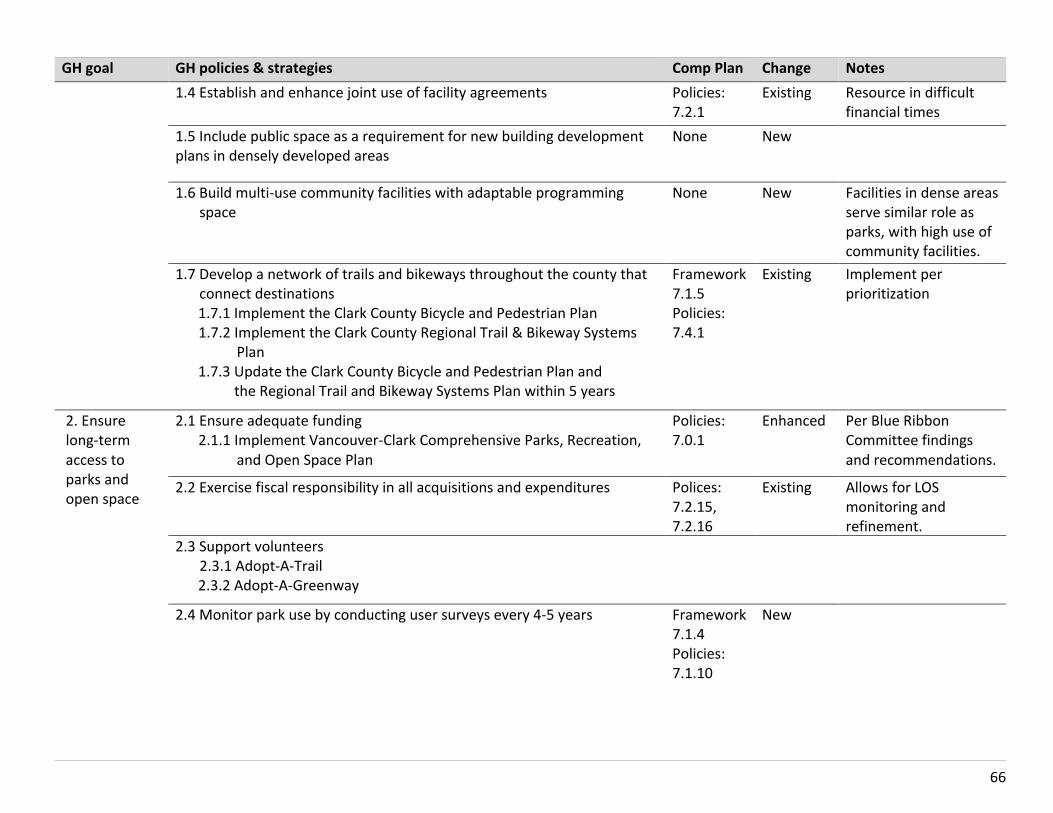
66
GH goal GH policies & strategies Comp Plan Change Notes 1.4 Establish and enhance joint use of facility agreements Policies:
7.2.1 Existing Resource in difficult
financial times 1.5 Include public space as a requirement for new building development plans in densely developed areas
None New
1.6 Build multi-‐use community facilities with adaptable programming space
None New Facilities in dense areas serve similar role as parks, with high use of community facilities.
1.7 Develop a network of trails and bikeways throughout the county that connect destinations 1.7.1 Implement the Clark County Bicycle and Pedestrian Plan 1.7.2 Implement the Clark County Regional Trail & Bikeway Systems
Plan 1.7.3 Update the Clark County Bicycle and Pedestrian Plan and the Regional Trail and Bikeway Systems Plan within 5 years
Framework7.1.5 Policies: 7.4.1
Existing Implement per prioritization
2. Ensure long-‐term access to parks and open space
2.1 Ensure adequate funding 2.1.1 Implement Vancouver-‐Clark Comprehensive Parks, Recreation,
and Open Space Plan
Policies: 7.0.1
Enhanced
Per Blue Ribbon Committee findings and recommendations.
2.2 Exercise fiscal responsibility in all acquisitions and expenditures Polices: 7.2.15, 7.2.16
Existing Allows for LOS monitoring and refinement.
2.3 Support volunteers 2.3.1 Adopt-‐A-‐Trail
2.3.2 Adopt-‐A-‐Greenway
2.4 Monitor park use by conducting user surveys every 4-‐5 years Framework7.1.4 Policies: 7.1.10
New
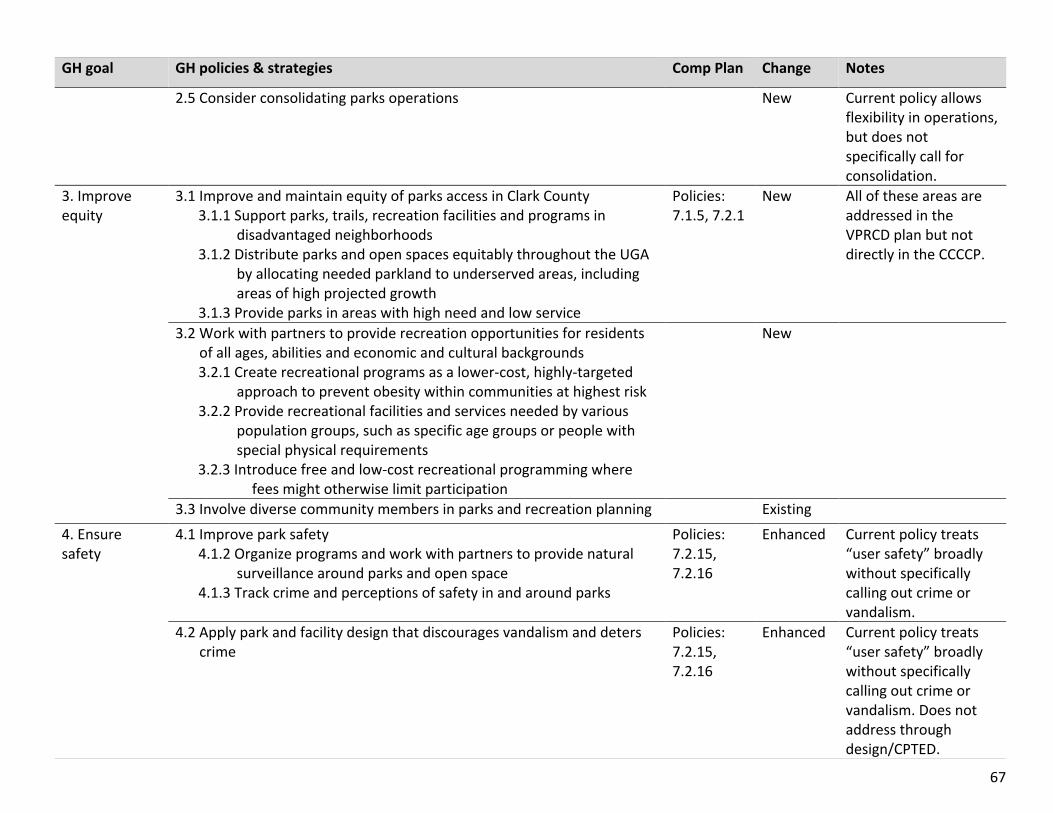
67
GH goal GH policies & strategies Comp Plan Change Notes
2.5 Consider consolidating parks operations New
Current policy allows flexibility in operations, but does not specifically call for consolidation.
3. Improve equity
3.1 Improve and maintain equity of parks access in Clark County 3.1.1 Support parks, trails, recreation facilities and programs in
disadvantaged neighborhoods 3.1.2 Distribute parks and open spaces equitably throughout the UGA
by allocating needed parkland to underserved areas, including areas of high projected growth
3.1.3 Provide parks in areas with high need and low service
Policies: 7.1.5, 7.2.1
New
All of these areas are addressed in the VPRCD plan but not directly in the CCCCP.
3.2 Work with partners to provide recreation opportunities for residents of all ages, abilities and economic and cultural backgrounds 3.2.1 Create recreational programs as a lower-‐cost, highly-‐targeted
approach to prevent obesity within communities at highest risk 3.2.2 Provide recreational facilities and services needed by various
population groups, such as specific age groups or people with special physical requirements
3.2.3 Introduce free and low-‐cost recreational programming where fees might otherwise limit participation
New
3.3 Involve diverse community members in parks and recreation planning Existing 4. Ensure safety
4.1 Improve park safety 4.1.2 Organize programs and work with partners to provide natural
surveillance around parks and open space 4.1.3 Track crime and perceptions of safety in and around parks
Policies: 7.2.15, 7.2.16
Enhanced
Current policy treats “user safety” broadly without specifically calling out crime or vandalism.
4.2 Apply park and facility design that discourages vandalism and deters crime
Policies: 7.2.15, 7.2.16
Enhanced Current policy treats “user safety” broadly without specifically calling out crime or vandalism. Does not address through design/CPTED.
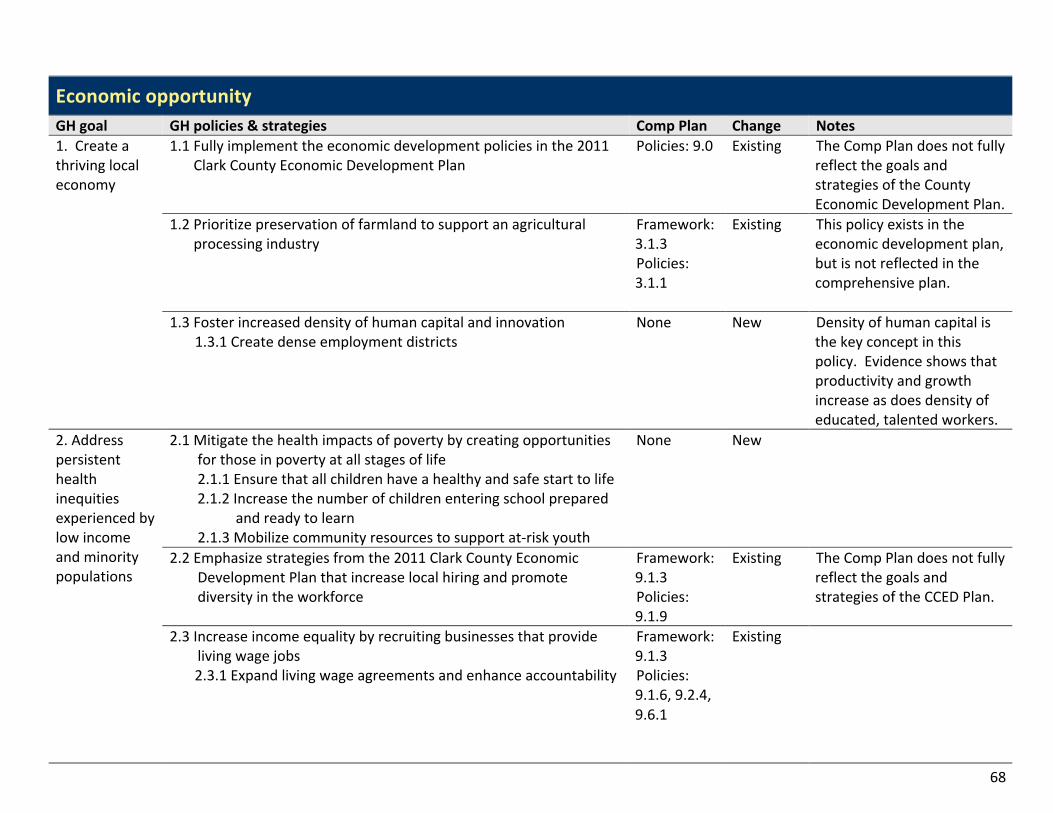
68
Economic opportunity GH goal GH policies & strategies Comp Plan Change Notes 1. Create a thriving local economy
1.1 Fully implement the economic development policies in the 2011 Clark County Economic Development Plan
Policies: 9.0
Existing The Comp Plan does not fully reflect the goals and strategies of the County Economic Development Plan.
1.2 Prioritize preservation of farmland to support an agricultural processing industry
Framework: 3.1.3 Policies: 3.1.1
Existing This policy exists in the economic development plan, but is not reflected in the comprehensive plan.
1.3 Foster increased density of human capital and innovation 1.3.1 Create dense employment districts
None New Density of human capital is the key concept in this policy. Evidence shows that productivity and growth increase as does density of educated, talented workers.
2. Address persistent health inequities experienced by low income and minority populations
2.1 Mitigate the health impacts of poverty by creating opportunities for those in poverty at all stages of life 2.1.1 Ensure that all children have a healthy and safe start to life 2.1.2 Increase the number of children entering school prepared
and ready to learn 2.1.3 Mobilize community resources to support at-‐risk youth
None New
2.2 Emphasize strategies from the 2011 Clark County Economic Development Plan that increase local hiring and promote diversity in the workforce
Framework: 9.1.3 Policies: 9.1.9
Existing The Comp Plan does not fully reflect the goals and strategies of the CCED Plan.
2.3 Increase income equality by recruiting businesses that provide living wage jobs
2.3.1 Expand living wage agreements and enhance accountability
Framework: 9.1.3 Policies: 9.1.6, 9.2.4, 9.6.1
Existing
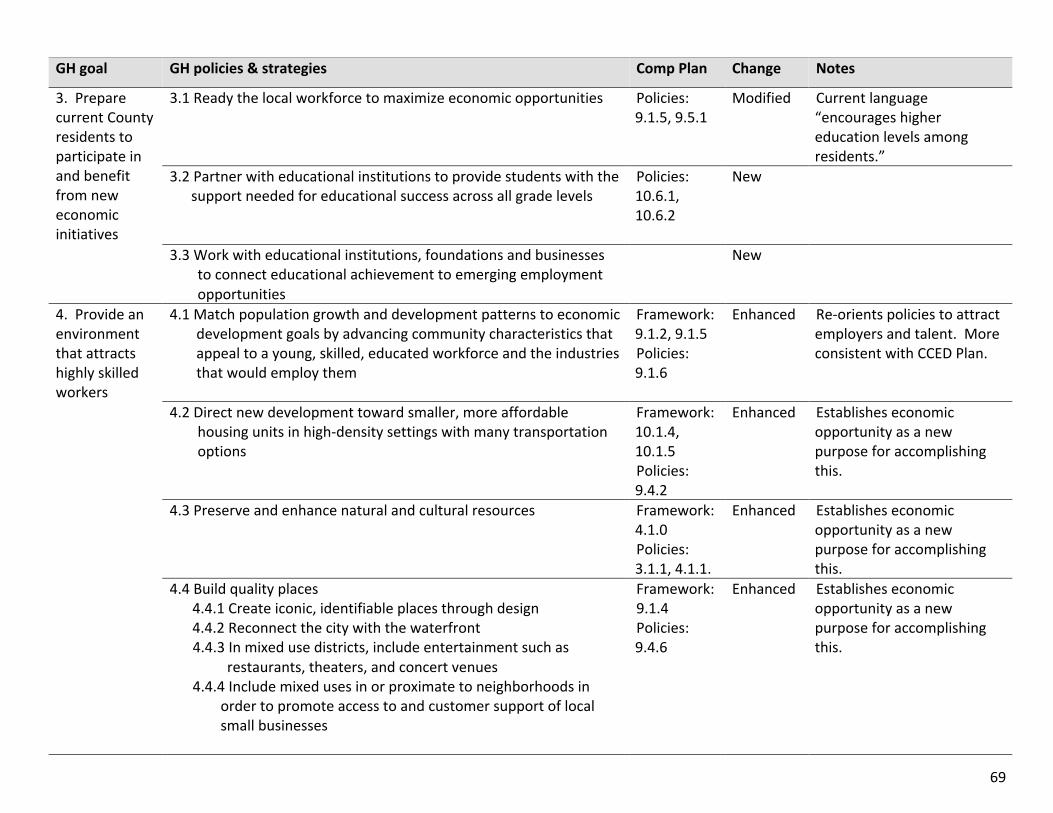
69
GH goal GH policies & strategies Comp Plan Change Notes
3. Prepare current County residents to participate in and benefit from new economic initiatives
3.1 Ready the local workforce to maximize economic opportunities Policies: 9.1.5, 9.5.1
Modified Current language “encourages higher education levels among residents.”
3.2 Partner with educational institutions to provide students with the support needed for educational success across all grade levels
Policies: 10.6.1, 10.6.2
New
3.3 Work with educational institutions, foundations and businesses to connect educational achievement to emerging employment opportunities
New
4. Provide an environment that attracts highly skilled workers
4.1 Match population growth and development patterns to economic development goals by advancing community characteristics that appeal to a young, skilled, educated workforce and the industries that would employ them
Framework: 9.1.2, 9.1.5 Policies: 9.1.6
Enhanced Re-‐orients policies to attract employers and talent. More consistent with CCED Plan.
4.2 Direct new development toward smaller, more affordable housing units in high-‐density settings with many transportation options
Framework: 10.1.4, 10.1.5 Policies: 9.4.2
Enhanced Establishes economic opportunity as a new purpose for accomplishing this.
4.3 Preserve and enhance natural and cultural resources Framework: 4.1.0 Policies: 3.1.1, 4.1.1.
Enhanced Establishes economic opportunity as a new purpose for accomplishing this.
4.4 Build quality places 4.4.1 Create iconic, identifiable places through design 4.4.2 Reconnect the city with the waterfront 4.4.3 In mixed use districts, include entertainment such as
restaurants, theaters, and concert venues 4.4.4 Include mixed uses in or proximate to neighborhoods in
order to promote access to and customer support of local small businesses
Framework: 9.1.4 Policies: 9.4.6
Enhanced Establishes economic opportunity as a new purpose for accomplishing this.
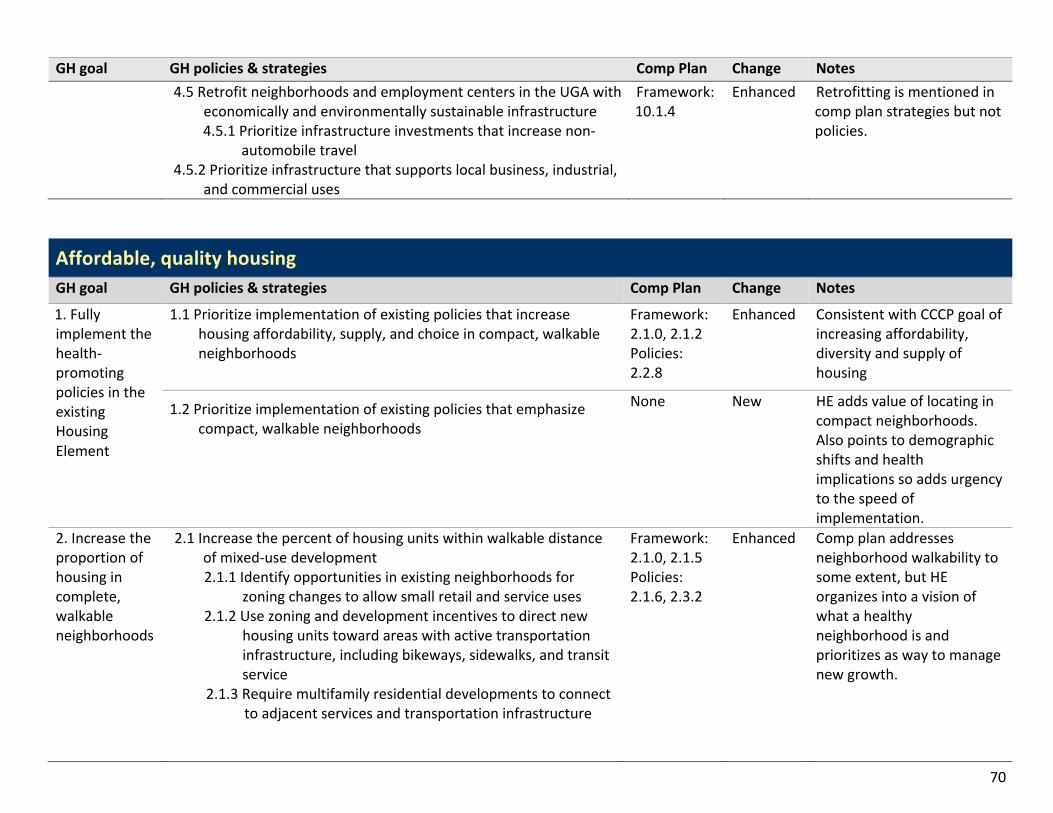
70
GH goal GH policies & strategies Comp Plan Change Notes 4.5 Retrofit neighborhoods and employment centers in the UGA with
economically and environmentally sustainable infrastructure 4.5.1 Prioritize infrastructure investments that increase non-‐
automobile travel 4.5.2 Prioritize infrastructure that supports local business, industrial,
and commercial uses
Framework: 10.1.4
Enhanced Retrofitting is mentioned in comp plan strategies but not policies.
Affordable, quality housing GH goal GH policies & strategies Comp Plan Change Notes
1. Fully implement the health-‐promoting policies in the existing Housing Element
1.1 Prioritize implementation of existing policies that increase housing affordability, supply, and choice in compact, walkable neighborhoods
Framework: 2.1.0, 2.1.2 Policies: 2.2.8
Enhanced
Consistent with CCCP goal of increasing affordability, diversity and supply of housing
1.2 Prioritize implementation of existing policies that emphasize compact, walkable neighborhoods
None New
HE adds value of locating in compact neighborhoods. Also points to demographic shifts and health implications so adds urgency to the speed of implementation.
2. Increase the proportion of housing in complete, walkable neighborhoods
2.1 Increase the percent of housing units within walkable distance of mixed-‐use development 2.1.1 Identify opportunities in existing neighborhoods for
zoning changes to allow small retail and service uses 2.1.2 Use zoning and development incentives to direct new
housing units toward areas with active transportation infrastructure, including bikeways, sidewalks, and transit service
2.1.3 Require multifamily residential developments to connect to adjacent services and transportation infrastructure
Framework: 2.1.0, 2.1.5 Policies: 2.1.6, 2.3.2
Enhanced Comp plan addresses neighborhood walkability to some extent, but HE organizes into a vision of what a healthy neighborhood is and prioritizes as way to manage new growth.
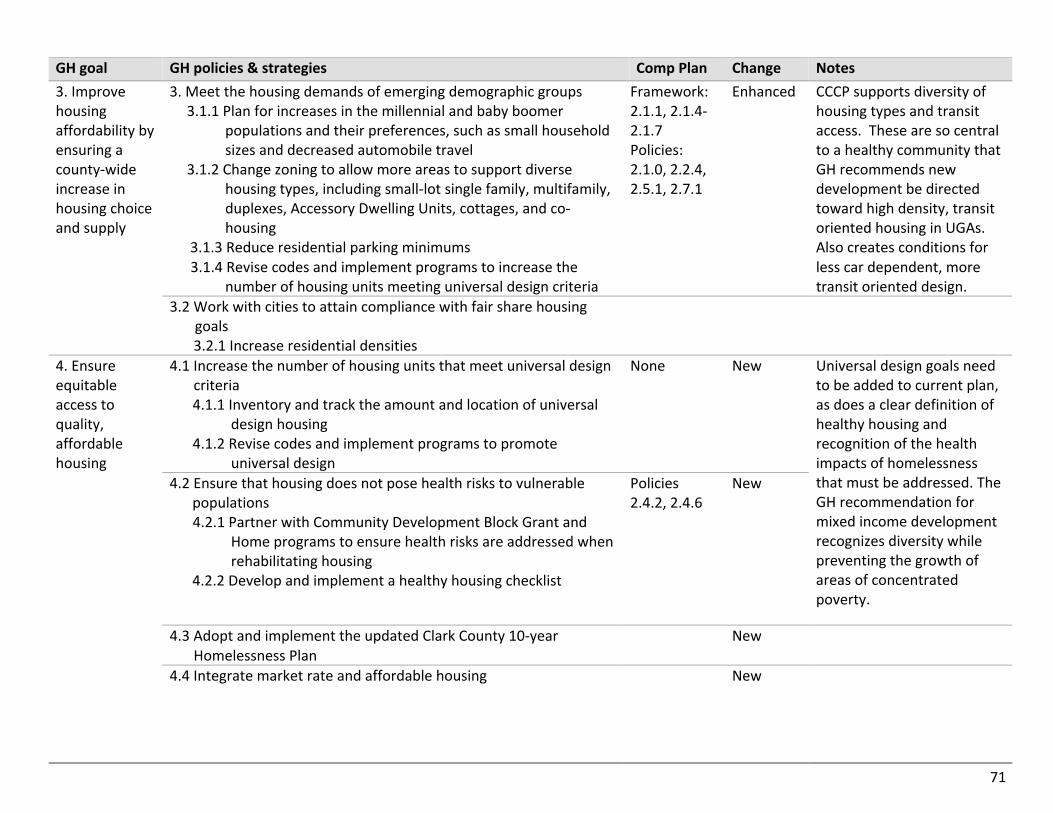
71
GH goal GH policies & strategies Comp Plan Change Notes 3. Improve housing affordability by ensuring a county-‐wide increase in housing choice and supply
3. Meet the housing demands of emerging demographic groups 3.1.1 Plan for increases in the millennial and baby boomer
populations and their preferences, such as small household sizes and decreased automobile travel
3.1.2 Change zoning to allow more areas to support diverse housing types, including small-‐lot single family, multifamily, duplexes, Accessory Dwelling Units, cottages, and co-‐housing
3.1.3 Reduce residential parking minimums 3.1.4 Revise codes and implement programs to increase the
number of housing units meeting universal design criteria
Framework: 2.1.1, 2.1.4-‐2.1.7 Policies: 2.1.0, 2.2.4, 2.5.1, 2.7.1
Enhanced
CCCP supports diversity of housing types and transit access. These are so central to a healthy community that GH recommends new development be directed toward high density, transit oriented housing in UGAs. Also creates conditions for less car dependent, more transit oriented design.
3.2 Work with cities to attain compliance with fair share housing goals
3.2.1 Increase residential densities
4. Ensure equitable access to quality, affordable housing
4.1 Increase the number of housing units that meet universal design criteria 4.1.1 Inventory and track the amount and location of universal
design housing 4.1.2 Revise codes and implement programs to promote
universal design
None New Universal design goals need to be added to current plan, as does a clear definition of healthy housing and recognition of the health impacts of homelessness that must be addressed. The GH recommendation for mixed income development recognizes diversity while preventing the growth of areas of concentrated poverty.
4.2 Ensure that housing does not pose health risks to vulnerable populations 4.2.1 Partner with Community Development Block Grant and
Home programs to ensure health risks are addressed when rehabilitating housing
4.2.2 Develop and implement a healthy housing checklist
Policies 2.4.2, 2.4.6
New
4.3 Adopt and implement the updated Clark County 10-‐year Homelessness Plan
New
4.4 Integrate market rate and affordable housing
New
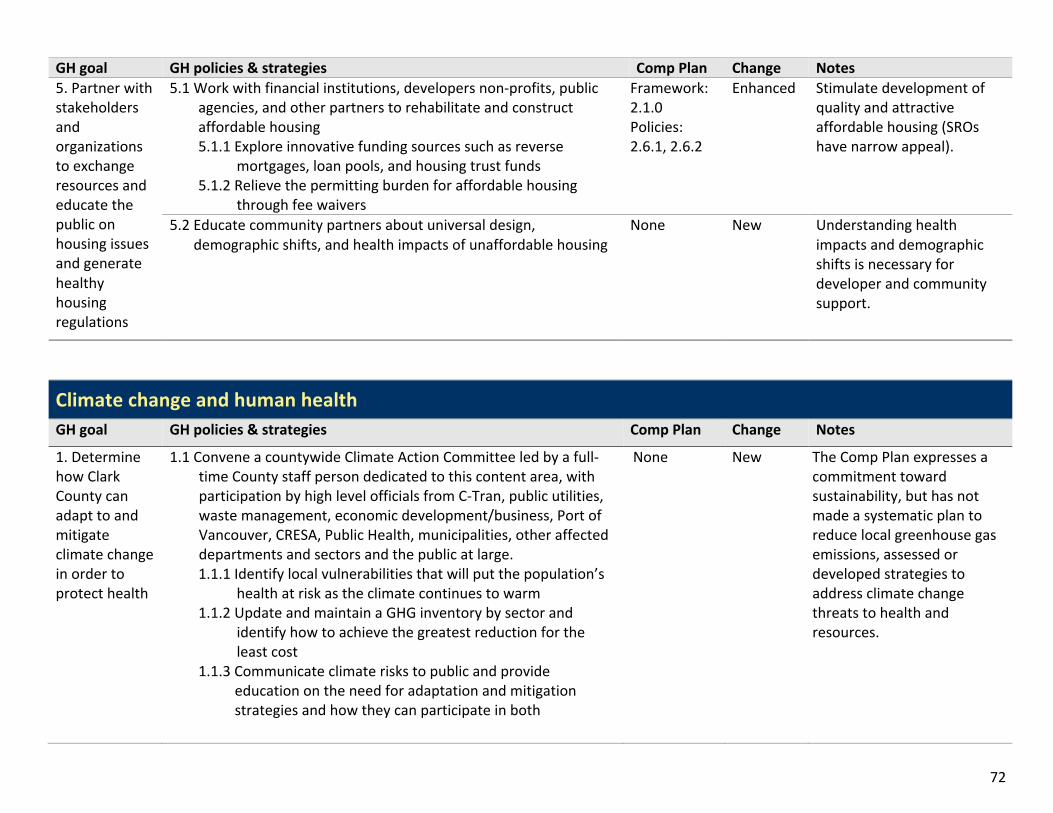
72
GH goal GH policies & strategies Comp Plan Change Notes 5. Partner with stakeholders and organizations to exchange resources and educate the public on housing issues and generate healthy housing regulations
5.1 Work with financial institutions, developers non-‐profits, public agencies, and other partners to rehabilitate and construct affordable housing 5.1.1 Explore innovative funding sources such as reverse
mortgages, loan pools, and housing trust funds 5.1.2 Relieve the permitting burden for affordable housing
through fee waivers
Framework: 2.1.0 Policies: 2.6.1, 2.6.2
Enhanced
Stimulate development of quality and attractive affordable housing (SROs have narrow appeal).
5.2 Educate community partners about universal design, demographic shifts, and health impacts of unaffordable housing
None New Understanding health impacts and demographic shifts is necessary for developer and community support.
Climate change and human health GH goal GH policies & strategies Comp Plan Change Notes
1. Determine how Clark County can adapt to and mitigate climate change in order to protect health
1.1 Convene a countywide Climate Action Committee led by a full-‐time County staff person dedicated to this content area, with participation by high level officials from C-‐Tran, public utilities, waste management, economic development/business, Port of Vancouver, CRESA, Public Health, municipalities, other affected departments and sectors and the public at large. 1.1.1 Identify local vulnerabilities that will put the population’s
health at risk as the climate continues to warm 1.1.2 Update and maintain a GHG inventory by sector and
identify how to achieve the greatest reduction for the least cost
1.1.3 Communicate climate risks to public and provide education on the need for adaptation and mitigation strategies and how they can participate in both
None New The Comp Plan expresses a commitment toward sustainability, but has not made a systematic plan to reduce local greenhouse gas emissions, assessed or developed strategies to address climate change threats to health and resources.
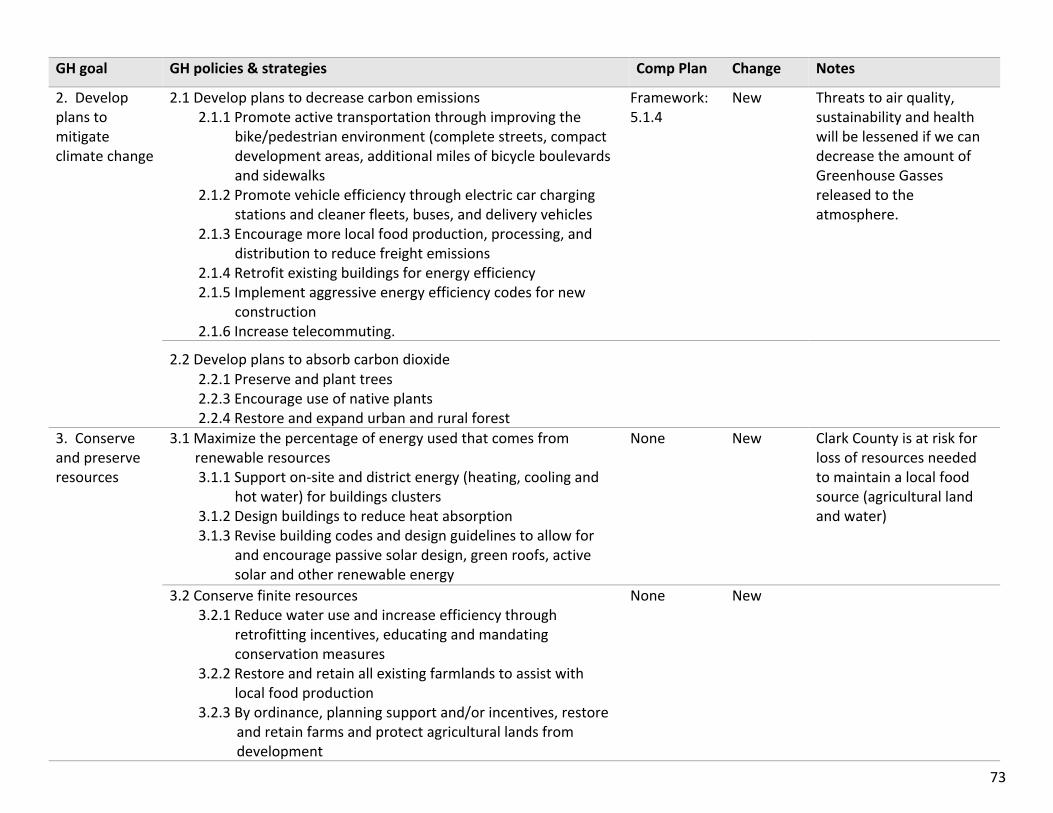
73
GH goal GH policies & strategies Comp Plan Change Notes
2. Develop plans to mitigate climate change
2.1 Develop plans to decrease carbon emissions 2.1.1 Promote active transportation through improving the
bike/pedestrian environment (complete streets, compact development areas, additional miles of bicycle boulevards and sidewalks
2.1.2 Promote vehicle efficiency through electric car charging stations and cleaner fleets, buses, and delivery vehicles
2.1.3 Encourage more local food production, processing, and distribution to reduce freight emissions
2.1.4 Retrofit existing buildings for energy efficiency 2.1.5 Implement aggressive energy efficiency codes for new
construction 2.1.6 Increase telecommuting.
Framework: 5.1.4
New Threats to air quality, sustainability and health will be lessened if we can decrease the amount of Greenhouse Gasses released to the atmosphere.
2.2 Develop plans to absorb carbon dioxide 2.2.1 Preserve and plant trees 2.2.3 Encourage use of native plants 2.2.4 Restore and expand urban and rural forest
3. Conserve and preserve resources
3.1 Maximize the percentage of energy used that comes from renewable resources
3.1.1 Support on-‐site and district energy (heating, cooling and hot water) for buildings clusters
3.1.2 Design buildings to reduce heat absorption 3.1.3 Revise building codes and design guidelines to allow for
and encourage passive solar design, green roofs, active solar and other renewable energy
None New Clark County is at risk for loss of resources needed to maintain a local food source (agricultural land and water)
3.2 Conserve finite resources 3.2.1 Reduce water use and increase efficiency through
retrofitting incentives, educating and mandating conservation measures
3.2.2 Restore and retain all existing farmlands to assist with local food production
3.2.3 By ordinance, planning support and/or incentives, restore and retain farms and protect agricultural lands from development
None New
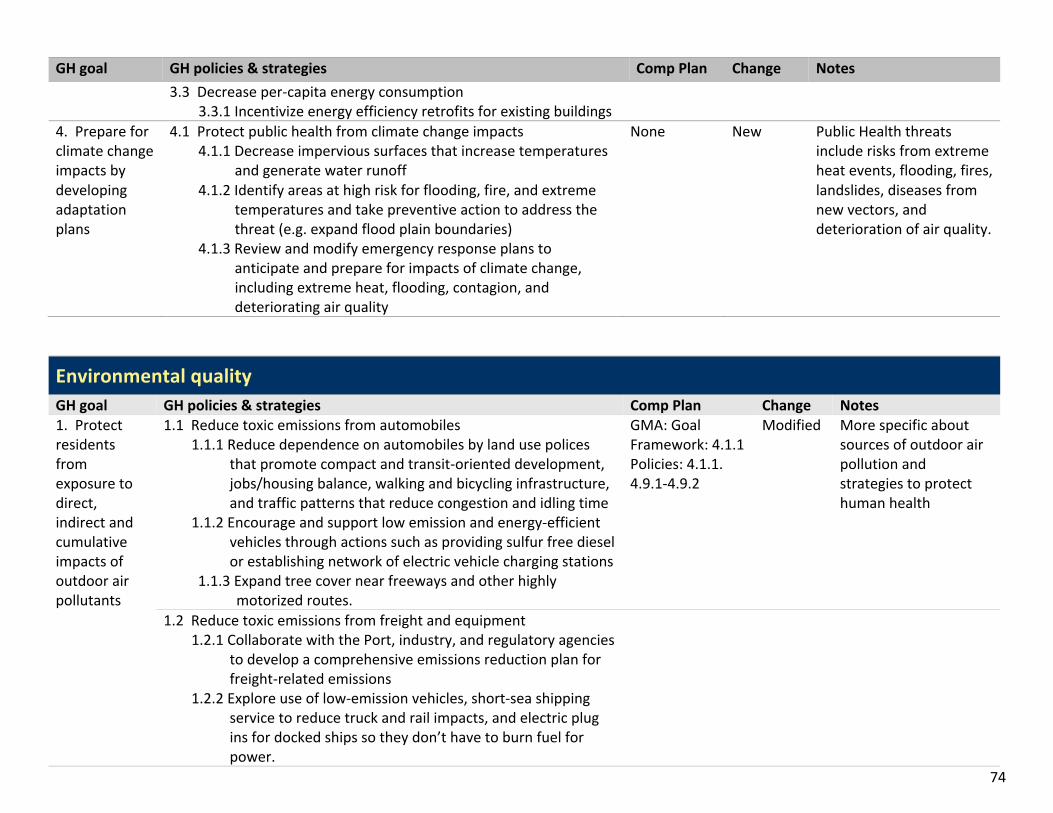
74
GH goal GH policies & strategies Comp Plan Change Notes 3.3 Decrease per-‐capita energy consumption
3.3.1 Incentivize energy efficiency retrofits for existing buildings
4. Prepare for climate change impacts by developing adaptation plans
4.1 Protect public health from climate change impacts 4.1.1 Decrease impervious surfaces that increase temperatures
and generate water runoff 4.1.2 Identify areas at high risk for flooding, fire, and extreme
temperatures and take preventive action to address the threat (e.g. expand flood plain boundaries)
4.1.3 Review and modify emergency response plans to anticipate and prepare for impacts of climate change, including extreme heat, flooding, contagion, and deteriorating air quality
None New Public Health threats include risks from extreme heat events, flooding, fires, landslides, diseases from new vectors, and deterioration of air quality.
Environmental quality GH goal GH policies & strategies Comp Plan Change Notes 1. Protect residents from exposure to direct, indirect and cumulative impacts of outdoor air pollutants
1.1 Reduce toxic emissions from automobiles 1.1.1 Reduce dependence on automobiles by land use polices
that promote compact and transit-‐oriented development, jobs/housing balance, walking and bicycling infrastructure, and traffic patterns that reduce congestion and idling time
1.1.2 Encourage and support low emission and energy-‐efficient vehicles through actions such as providing sulfur free diesel or establishing network of electric vehicle charging stations
1.1.3 Expand tree cover near freeways and other highly motorized routes.
GMA: Goal Framework: 4.1.1 Policies: 4.1.1. 4.9.1-‐4.9.2
Modified More specific about sources of outdoor air pollution and strategies to protect human health
1.2 Reduce toxic emissions from freight and equipment 1.2.1 Collaborate with the Port, industry, and regulatory agencies
to develop a comprehensive emissions reduction plan for freight-‐related emissions
1.2.2 Explore use of low-‐emission vehicles, short-‐sea shipping service to reduce truck and rail impacts, and electric plug ins for docked ships so they don’t have to burn fuel for power.
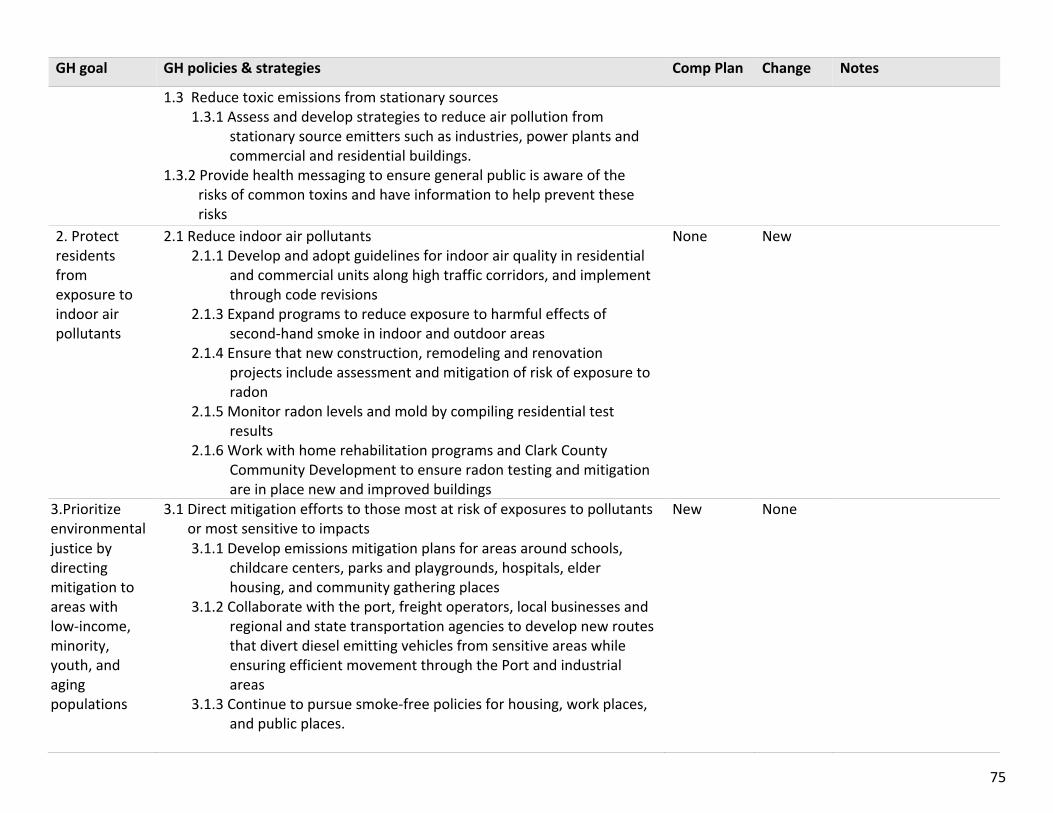
75
GH goal GH policies & strategies Comp Plan Change Notes
1.3 Reduce toxic emissions from stationary sources 1.3.1 Assess and develop strategies to reduce air pollution from
stationary source emitters such as industries, power plants and commercial and residential buildings.
1.3.2 Provide health messaging to ensure general public is aware of the risks of common toxins and have information to help prevent these risks
2. Protect residents from exposure to indoor air pollutants
2.1 Reduce indoor air pollutants 2.1.1 Develop and adopt guidelines for indoor air quality in residential
and commercial units along high traffic corridors, and implement through code revisions
2.1.3 Expand programs to reduce exposure to harmful effects of second-‐hand smoke in indoor and outdoor areas
2.1.4 Ensure that new construction, remodeling and renovation projects include assessment and mitigation of risk of exposure to radon
2.1.5 Monitor radon levels and mold by compiling residential test results
2.1.6 Work with home rehabilitation programs and Clark County Community Development to ensure radon testing and mitigation are in place new and improved buildings
None New
3.Prioritize environmental justice by directing mitigation to areas with low-‐income, minority, youth, and aging populations
3.1 Direct mitigation efforts to those most at risk of exposures to pollutants or most sensitive to impacts 3.1.1 Develop emissions mitigation plans for areas around schools,
childcare centers, parks and playgrounds, hospitals, elder housing, and community gathering places
3.1.2 Collaborate with the port, freight operators, local businesses and regional and state transportation agencies to develop new routes that divert diesel emitting vehicles from sensitive areas while ensuring efficient movement through the Port and industrial areas
3.1.3 Continue to pursue smoke-‐free policies for housing, work places, and public places.
New None
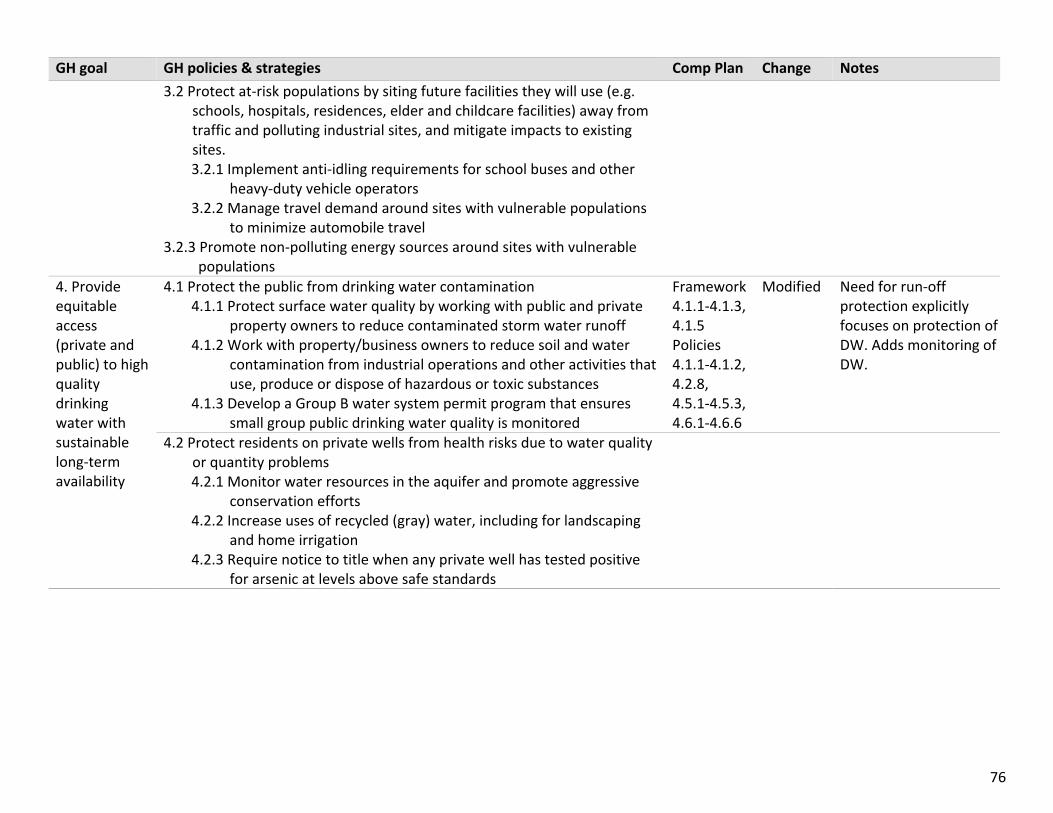
76
GH goal GH policies & strategies Comp Plan Change Notes 3.2 Protect at-‐risk populations by siting future facilities they will use (e.g.
schools, hospitals, residences, elder and childcare facilities) away from traffic and polluting industrial sites, and mitigate impacts to existing sites. 3.2.1 Implement anti-‐idling requirements for school buses and other
heavy-‐duty vehicle operators 3.2.2 Manage travel demand around sites with vulnerable populations
to minimize automobile travel 3.2.3 Promote non-‐polluting energy sources around sites with vulnerable
populations
4. Provide equitable access (private and public) to high quality drinking water with sustainable long-‐term availability
4.1 Protect the public from drinking water contamination 4.1.1 Protect surface water quality by working with public and private
property owners to reduce contaminated storm water runoff 4.1.2 Work with property/business owners to reduce soil and water
contamination from industrial operations and other activities that use, produce or dispose of hazardous or toxic substances
4.1.3 Develop a Group B water system permit program that ensures small group public drinking water quality is monitored
Framework 4.1.1-‐4.1.3, 4.1.5 Policies 4.1.1-‐4.1.2, 4.2.8, 4.5.1-‐4.5.3, 4.6.1-‐4.6.6
Modified
Need for run-‐off protection explicitly focuses on protection of DW. Adds monitoring of DW.
4.2 Protect residents on private wells from health risks due to water quality or quantity problems 4.2.1 Monitor water resources in the aquifer and promote aggressive
conservation efforts 4.2.2 Increase uses of recycled (gray) water, including for landscaping
and home irrigation 4.2.3 Require notice to title when any private well has tested positive
for arsenic at levels above safe standards
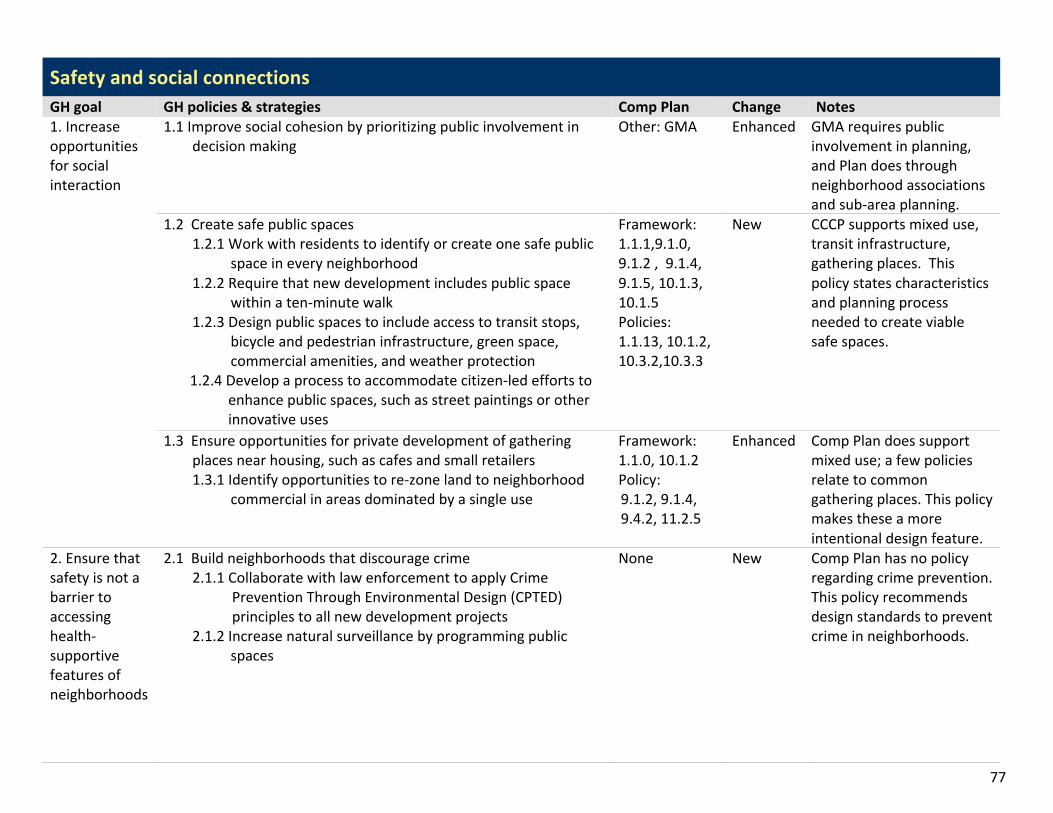
77
Safety and social connections GH goal GH policies & strategies Comp Plan Change Notes 1. Increase opportunities for social interaction
1.1 Improve social cohesion by prioritizing public involvement in decision making
Other: GMA Enhanced GMA requires public involvement in planning, and Plan does through neighborhood associations and sub-‐area planning.
1.2 Create safe public spaces 1.2.1 Work with residents to identify or create one safe public
space in every neighborhood 1.2.2 Require that new development includes public space
within a ten-‐minute walk 1.2.3 Design public spaces to include access to transit stops,
bicycle and pedestrian infrastructure, green space, commercial amenities, and weather protection
1.2.4 Develop a process to accommodate citizen-‐led efforts to enhance public spaces, such as street paintings or other innovative uses
Framework: 1.1.1,9.1.0, 9.1.2 , 9.1.4, 9.1.5, 10.1.3, 10.1.5 Policies: 1.1.13, 10.1.2, 10.3.2,10.3.3
New CCCP supports mixed use, transit infrastructure, gathering places. This policy states characteristics and planning process needed to create viable safe spaces.
1.3 Ensure opportunities for private development of gathering places near housing, such as cafes and small retailers 1.3.1 Identify opportunities to re-‐zone land to neighborhood
commercial in areas dominated by a single use
Framework: 1.1.0, 10.1.2 Policy: 9.1.2, 9.1.4, 9.4.2, 11.2.5
Enhanced Comp Plan does support mixed use; a few policies relate to common gathering places. This policy makes these a more intentional design feature.
2. Ensure that safety is not a barrier to accessing health-‐supportive features of neighborhoods
2.1 Build neighborhoods that discourage crime 2.1.1 Collaborate with law enforcement to apply Crime Prevention Through Environmental Design (CPTED) principles to all new development projects 2.1.2 Increase natural surveillance by programming public
spaces
None New Comp Plan has no policy regarding crime prevention. This policy recommends design standards to prevent crime in neighborhoods.
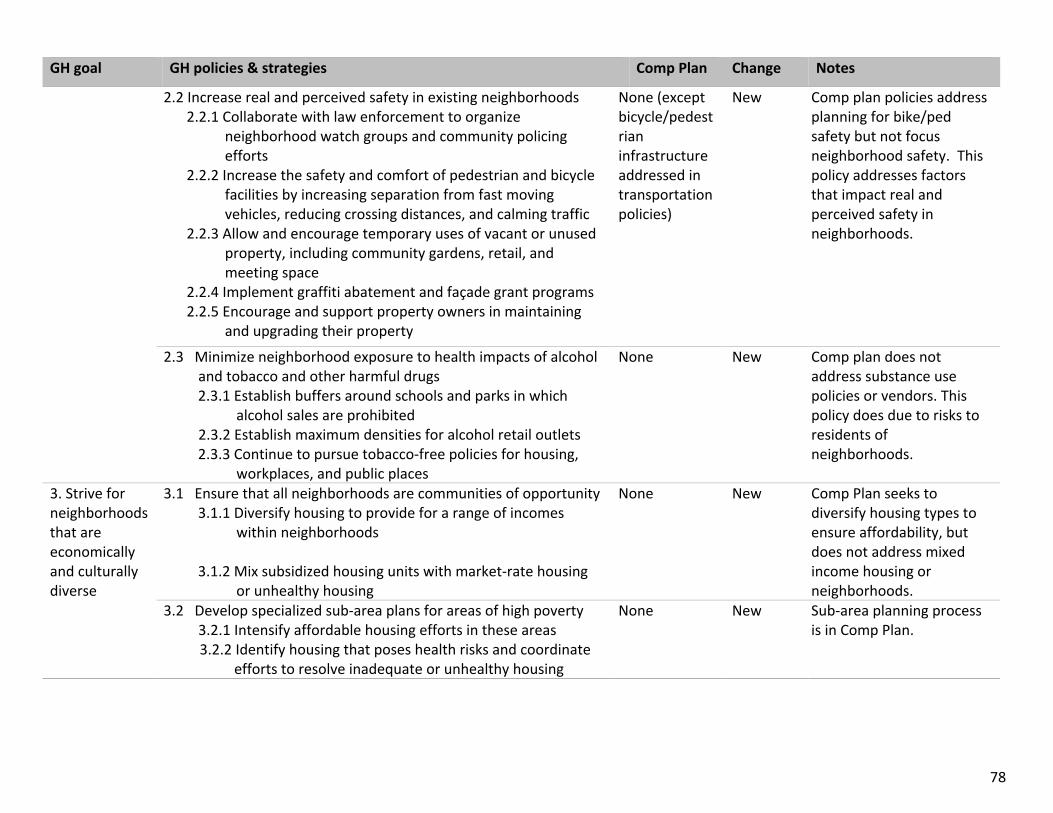
78
GH goal GH policies & strategies Comp Plan Change Notes
2.2 Increase real and perceived safety in existing neighborhoods 2.2.1 Collaborate with law enforcement to organize
neighborhood watch groups and community policing efforts
2.2.2 Increase the safety and comfort of pedestrian and bicycle facilities by increasing separation from fast moving vehicles, reducing crossing distances, and calming traffic
2.2.3 Allow and encourage temporary uses of vacant or unused property, including community gardens, retail, and meeting space
2.2.4 Implement graffiti abatement and façade grant programs 2.2.5 Encourage and support property owners in maintaining
and upgrading their property
None (except bicycle/pedestrian infrastructure addressed in transportation policies)
New Comp plan policies address planning for bike/ped safety but not focus neighborhood safety. This policy addresses factors that impact real and perceived safety in neighborhoods.
2.3 Minimize neighborhood exposure to health impacts of alcohol and tobacco and other harmful drugs 2.3.1 Establish buffers around schools and parks in which
alcohol sales are prohibited 2.3.2 Establish maximum densities for alcohol retail outlets 2.3.3 Continue to pursue tobacco-‐free policies for housing,
workplaces, and public places
None New Comp plan does not address substance use policies or vendors. This policy does due to risks to residents of neighborhoods.
3. Strive for neighborhoods that are economically and culturally diverse
3.1 Ensure that all neighborhoods are communities of opportunity 3.1.1 Diversify housing to provide for a range of incomes
within neighborhoods 3.1.2 Mix subsidized housing units with market-‐rate housing
or unhealthy housing
None New Comp Plan seeks to diversify housing types to ensure affordability, but does not address mixed income housing or neighborhoods.
3.2 Develop specialized sub-‐area plans for areas of high poverty 3.2.1 Intensify affordable housing efforts in these areas
3.2.2 Identify housing that poses health risks and coordinate efforts to resolve inadequate or unhealthy housing
None New Sub-‐area planning process is in Comp Plan.
Appendix C: Process, Outreach, and Survey Results
Appendix C: Process, Outreach, and Survey Results
1
Culminating several years of learning about disparities, the built environment, and determinants of health, in 2010 the Public Health Advisory Council (PHAC) advised the Clark County Board of Health (BOH) to approve the initiation of work on a health element for the comprehensive plan. Later that year, the BOH responded by formally charging Clark County Public Health (CCPH) with completing this work, stipulating that it be done in partnership with the Community Planning Department and that the PHAC serve as the citizen advisory committee. For nearly 18 months, this group of approximately 20 professionals and consumers met monthly to identify priorities and contribute to the development of policy recommendations. This work is in many ways a new area of practice for both Public Health and Community Planning. A 2011 survey by the American Planning Association found that just 27% of responding jurisdictions had comprehensive plans that explicitly address health, and identified only 23 examples of adopted comprehensive plans with stand-‐alone health elements. In this respect, each new health element is a model that contributes to a relatively small pool of examples. It is our hope that the process and products of this planning process will be instructive to other jurisdictions endeavoring to complete a health element for their own plans. This appendix describes the planning process and outreach, and survey efforts associated with the Growing Healthier Report.
Process An internal advisory committee of six CCPH staff members began meeting in December of 2010 and conducted an analysis of the existing Comprehensive Plan. This work was supervised by the
2
agency’s Healthy Communities Manager and carried out with the help of a team led by the Project Coordinator (an Urban Planner). Other committee members included two epidemiologists and the Chronic Disease Manager. Beginning in 2011, a policy oversight group comprised of staff and directors from Public Health and Community Planning began monthly coordination meetings, and staff began researching the environmental determinants of health. Public and policy maker outreach took place in late spring and summer to converse with the community about the project. The PHAC reviewed health and built environment data, gave input on topic areas to research, reviewed documents and received monthly progress updates, provided input, and helped communicate healthy planning concepts to community members and elected officials. The eight background reports that serve as the basis for this report are each organized into two main sections: a literature review summarizing national research and best practices, and a current conditions report describing Clark County’s built environment, other health determinants, and health outcome data (disparities were a particular focus). These reports were made available as technical background documents, and were summarized in The Growing Healthier Report and used to inform the development of policy recommendations. CCPH staff developed policy recommendations in consultation with PHAC members, local experts, and other stakeholders. The graphic on the following page illustrates the inputs and products from the planning process. Other inputs included the findings from a Health Impact Assessment on the City of Vancouver Comprehensive Plan, and a 2011 Community Planning document called the Aging
79
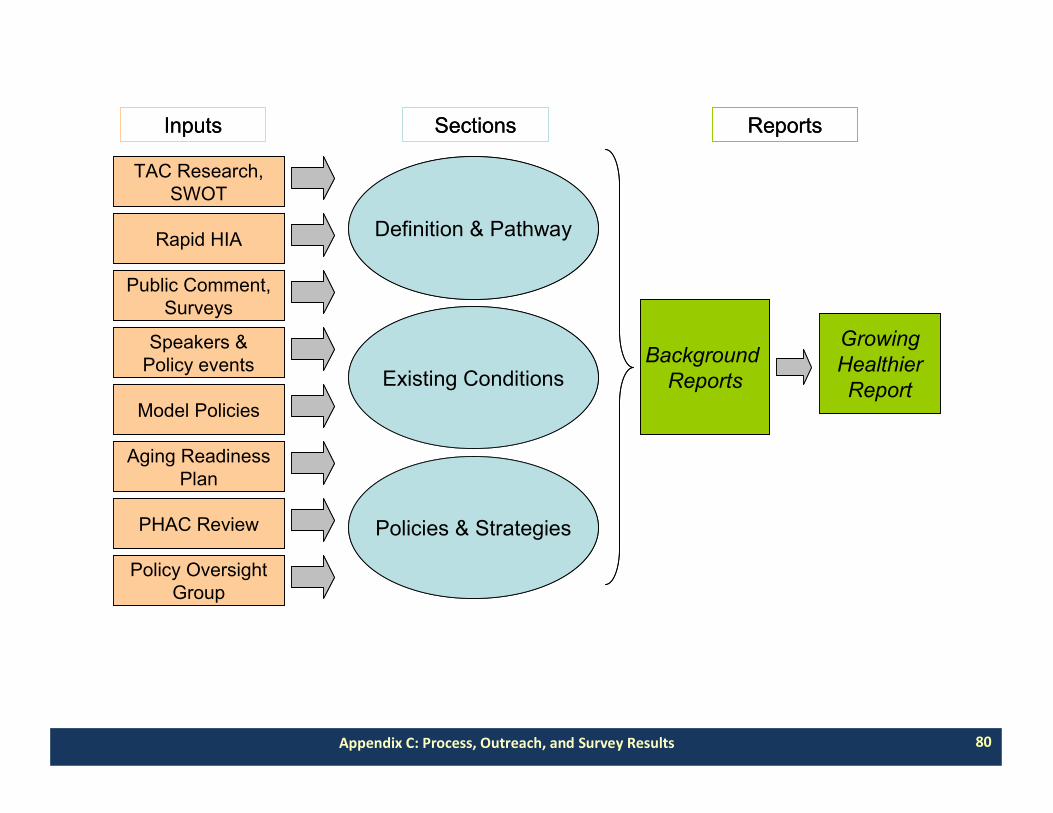
Appendix C: Process, Outreach, and Survey Results
Definition & Pathway
Policies & Strategies
Existing Conditions
TAC Research,SWOT
Rapid HIA
Public Comment,Surveys
Speakers &Policy events
Model Policies
Aging ReadinessPlan
GrowingHealthierReport
Background Reports
Inputs Sections Reports
PHAC Review
Policy OversightGroup
Definition & Pathway
Policies & Strategies
Existing Conditions
TAC Research,SWOT
Rapid HIA
Public Comment,Surveys
Speakers &Policy events
Model Policies
Aging ReadinessPlan
GrowingHealthierReport
Background Reports
Inputs Sections Reports
PHAC Review
Policy OversightGroup
80
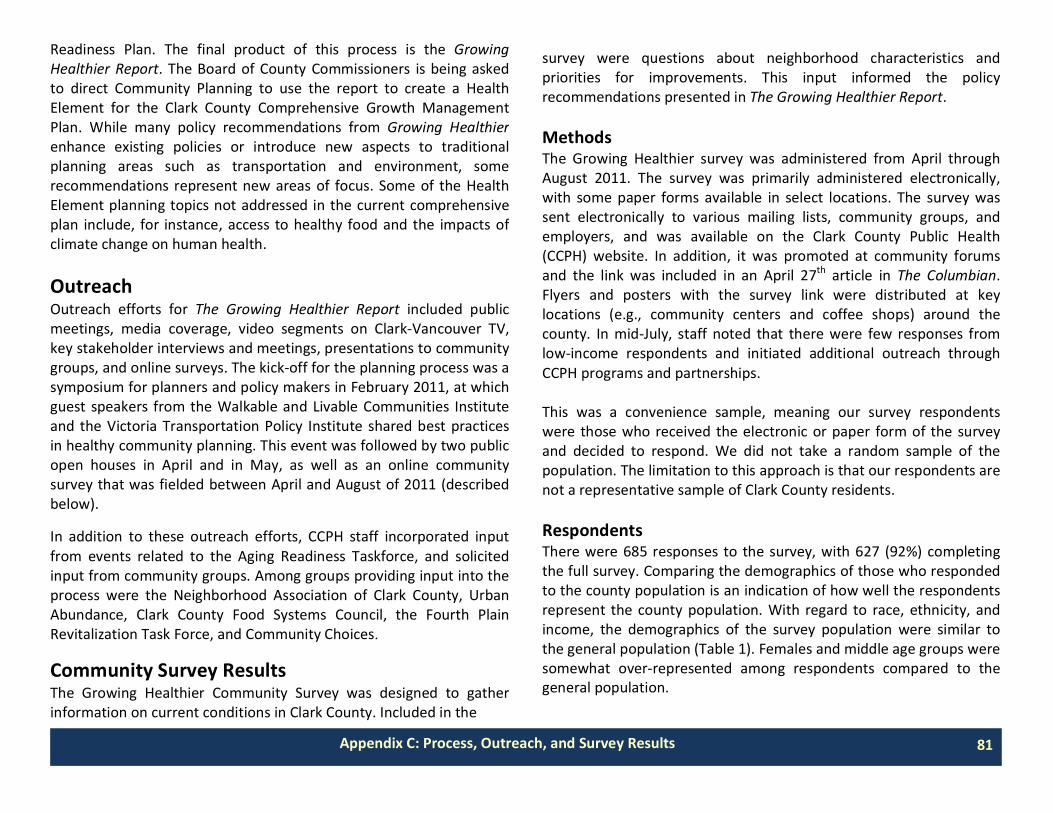
3
Readiness Plan. The final product of this process is the Growing Healthier Report. The Board of County Commissioners is being asked to direct Community Planning to use the report to create a Health Element for the Clark County Comprehensive Growth Management Plan. While many policy recommendations from Growing Healthier enhance existing policies or introduce new aspects to traditional planning areas such as transportation and environment, some recommendations represent new areas of focus. Some of the Health Element planning topics not addressed in the current comprehensive plan include, for instance, access to healthy food and the impacts of climate change on human health. Outreach Outreach efforts for The Growing Healthier Report included public meetings, media coverage, video segments on Clark-‐Vancouver TV, key stakeholder interviews and meetings, presentations to community groups, and online surveys. The kick-‐off for the planning process was a symposium for planners and policy makers in February 2011, at which guest speakers from the Walkable and Livable Communities Institute and the Victoria Transportation Policy Institute shared best practices in healthy community planning. This event was followed by two public open houses in April and in May, as well as an online community survey that was fielded between April and August of 2011 (described below).
In addition to these outreach efforts, CCPH staff incorporated input from events related to the Aging Readiness Taskforce, and solicited input from community groups. Among groups providing input into the process were the Neighborhood Association of Clark County, Urban Abundance, Clark County Food Systems Council, the Fourth Plain Revitalization Task Force, and Community Choices.
Community Survey Results The Growing Healthier Community Survey was designed to gather information on current conditions in Clark County. Included in the
Appendix C: Process, Outreach, and Survey Results
4
survey were questions about neighborhood characteristics and priorities for improvements. This input informed the policy recommendations presented in The Growing Healthier Report. Methods The Growing Healthier survey was administered from April through August 2011. The survey was primarily administered electronically, with some paper forms available in select locations. The survey was sent electronically to various mailing lists, community groups, and employers, and was available on the Clark County Public Health (CCPH) website. In addition, it was promoted at community forums and the link was included in an April 27th article in The Columbian. Flyers and posters with the survey link were distributed at key locations (e.g., community centers and coffee shops) around the county. In mid-‐July, staff noted that there were few responses from low-‐income respondents and initiated additional outreach through CCPH programs and partnerships. This was a convenience sample, meaning our survey respondents were those who received the electronic or paper form of the survey and decided to respond. We did not take a random sample of the population. The limitation to this approach is that our respondents are not a representative sample of Clark County residents. Respondents There were 685 responses to the survey, with 627 (92%) completing the full survey. Comparing the demographics of those who responded to the county population is an indication of how well the respondents represent the county population. With regard to race, ethnicity, and income, the demographics of the survey population were similar to the general population (Table 1). Females and middle age groups were somewhat over-‐represented among respondents compared to the general population.
81
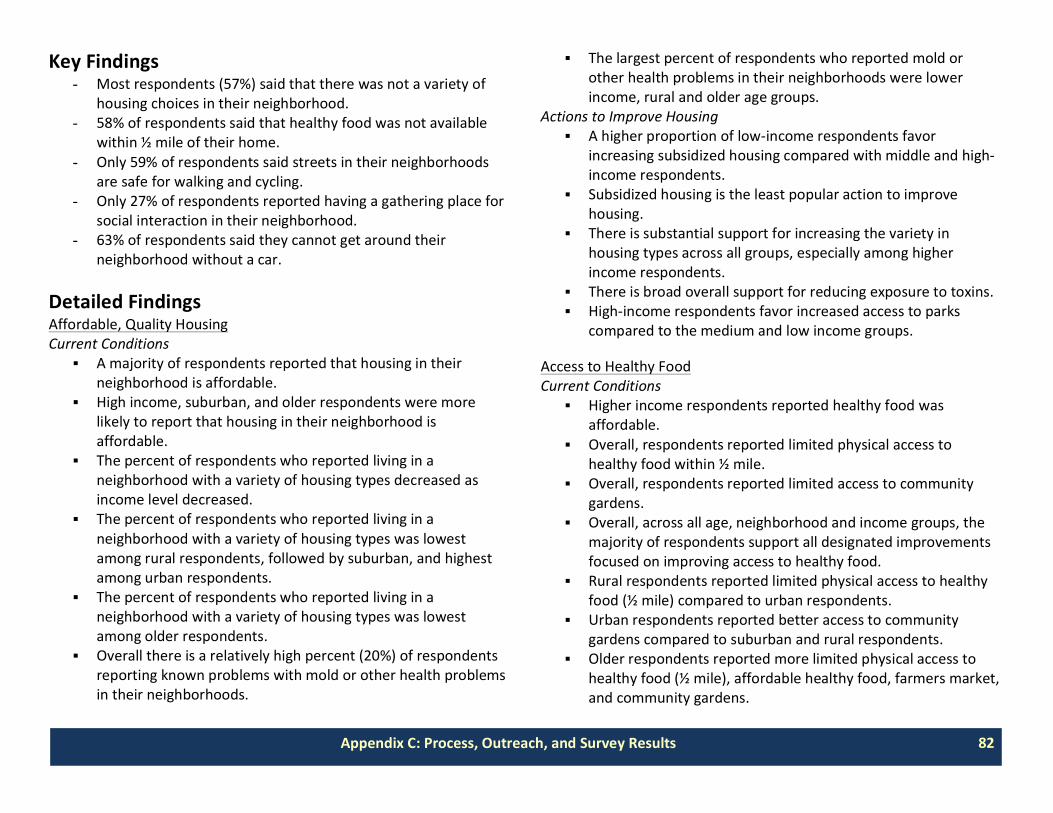
Appendix C: Process, Outreach, and Survey Results
1
Key Findings - Most respondents (57%) said that there was not a variety of
housing choices in their neighborhood. - 58% of respondents said that healthy food was not available
within ½ mile of their home. - Only 59% of respondents said streets in their neighborhoods
are safe for walking and cycling. - Only 27% of respondents reported having a gathering place for
social interaction in their neighborhood. - 63% of respondents said they cannot get around their
neighborhood without a car. Detailed Findings Affordable, Quality Housing Current Conditions
A majority of respondents reported that housing in their neighborhood is affordable.
High income, suburban, and older respondents were more likely to report that housing in their neighborhood is affordable.
The percent of respondents who reported living in a neighborhood with a variety of housing types decreased as income level decreased.
The percent of respondents who reported living in a neighborhood with a variety of housing types was lowest among rural respondents, followed by suburban, and highest among urban respondents.
The percent of respondents who reported living in a neighborhood with a variety of housing types was lowest among older respondents.
Overall there is a relatively high percent (20%) of respondents reporting known problems with mold or other health problems in their neighborhoods.
2
The largest percent of respondents who reported mold or other health problems in their neighborhoods were lower income, rural and older age groups.
Actions to Improve Housing A higher proportion of low-‐income respondents favor
increasing subsidized housing compared with middle and high-‐income respondents.
Subsidized housing is the least popular action to improve housing.
There is substantial support for increasing the variety in housing types across all groups, especially among higher income respondents.
There is broad overall support for reducing exposure to toxins. High-‐income respondents favor increased access to parks
compared to the medium and low income groups. Access to Healthy Food Current Conditions
Higher income respondents reported healthy food was affordable.
Overall, respondents reported limited physical access to healthy food within ½ mile.
Overall, respondents reported limited access to community gardens.
Overall, across all age, neighborhood and income groups, the majority of respondents support all designated improvements focused on improving access to healthy food.
Rural respondents reported limited physical access to healthy food (½ mile) compared to urban respondents.
Urban respondents reported better access to community gardens compared to suburban and rural respondents.
Older respondents reported more limited physical access to healthy food (½ mile), affordable healthy food, farmers market, and community gardens.
82
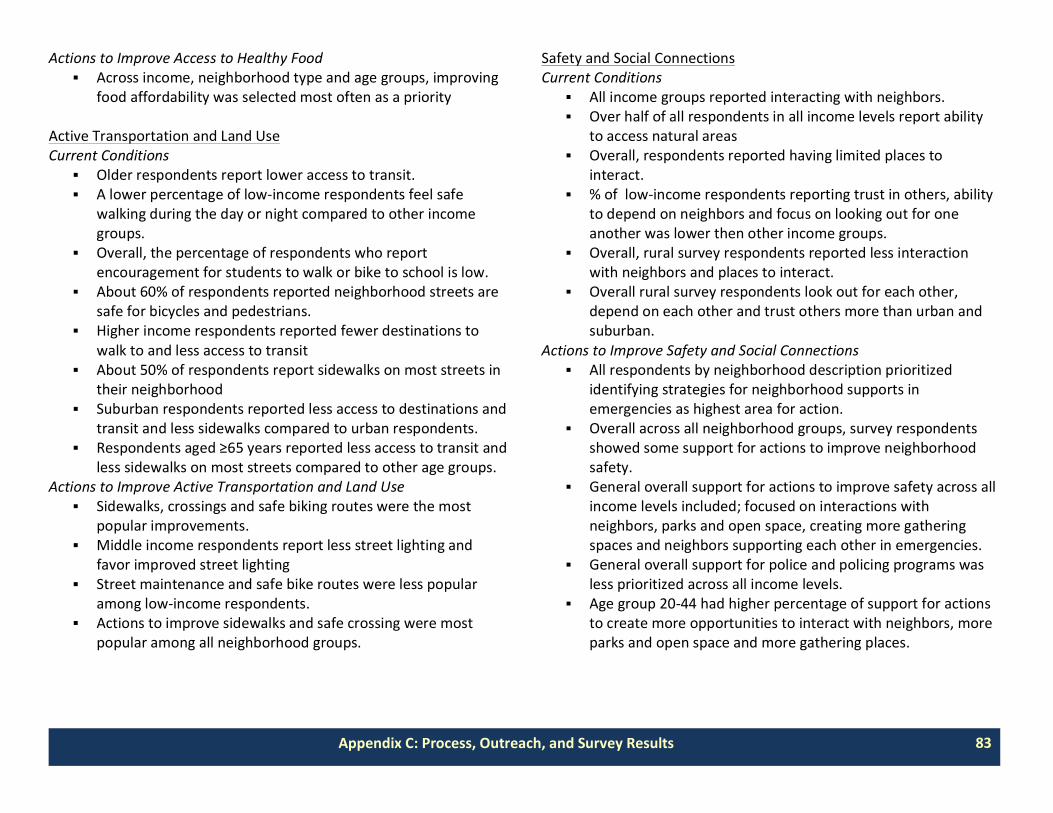
3
Actions to Improve Access to Healthy Food Across income, neighborhood type and age groups, improving
food affordability was selected most often as a priority Active Transportation and Land Use Current Conditions
Older respondents report lower access to transit. A lower percentage of low-‐income respondents feel safe
walking during the day or night compared to other income groups.
Overall, the percentage of respondents who report encouragement for students to walk or bike to school is low.
About 60% of respondents reported neighborhood streets are safe for bicycles and pedestrians.
Higher income respondents reported fewer destinations to walk to and less access to transit
About 50% of respondents report sidewalks on most streets in their neighborhood
Suburban respondents reported less access to destinations and transit and less sidewalks compared to urban respondents.
Respondents aged ≥65 years reported less access to transit and less sidewalks on most streets compared to other age groups.
Actions to Improve Active Transportation and Land Use Sidewalks, crossings and safe biking routes were the most
popular improvements. Middle income respondents report less street lighting and
favor improved street lighting Street maintenance and safe bike routes were less popular
among low-‐income respondents. Actions to improve sidewalks and safe crossing were most
popular among all neighborhood groups.
Appendix C: Process, Outreach, and Survey Results
4
Safety and Social Connections Current Conditions
All income groups reported interacting with neighbors. Over half of all respondents in all income levels report ability
to access natural areas Overall, respondents reported having limited places to
interact. % of low-‐income respondents reporting trust in others, ability
to depend on neighbors and focus on looking out for one another was lower then other income groups.
Overall, rural survey respondents reported less interaction with neighbors and places to interact.
Overall rural survey respondents look out for each other, depend on each other and trust others more than urban and suburban.
Actions to Improve Safety and Social Connections All respondents by neighborhood description prioritized
identifying strategies for neighborhood supports in emergencies as highest area for action.
Overall across all neighborhood groups, survey respondents showed some support for actions to improve neighborhood safety.
General overall support for actions to improve safety across all income levels included; focused on interactions with neighbors, parks and open space, creating more gathering spaces and neighbors supporting each other in emergencies.
General overall support for police and policing programs was less prioritized across all income levels.
Age group 20-‐44 had higher percentage of support for actions to create more opportunities to interact with neighbors, more parks and open space and more gathering places.
83
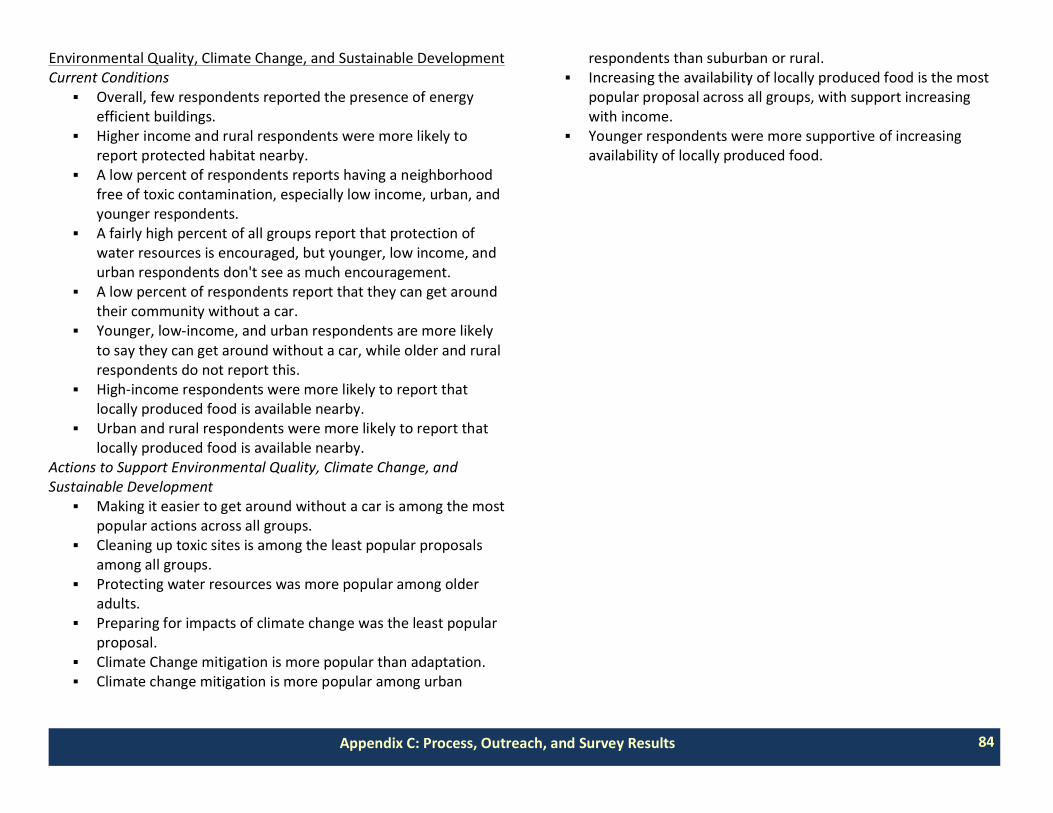
5
Environmental Quality, Climate Change, and Sustainable Development Current Conditions
Overall, few respondents reported the presence of energy efficient buildings.
Higher income and rural respondents were more likely to report protected habitat nearby.
A low percent of respondents reports having a neighborhood free of toxic contamination, especially low income, urban, and younger respondents.
A fairly high percent of all groups report that protection of water resources is encouraged, but younger, low income, and urban respondents don't see as much encouragement.
A low percent of respondents report that they can get around their community without a car.
Younger, low-‐income, and urban respondents are more likely to say they can get around without a car, while older and rural respondents do not report this.
High-‐income respondents were more likely to report that locally produced food is available nearby.
Urban and rural respondents were more likely to report that locally produced food is available nearby.
Actions to Support Environmental Quality, Climate Change, and Sustainable Development
Making it easier to get around without a car is among the most popular actions across all groups.
Cleaning up toxic sites is among the least popular proposals among all groups.
Protecting water resources was more popular among older adults.
Preparing for impacts of climate change was the least popular proposal.
Climate Change mitigation is more popular than adaptation. Climate change mitigation is more popular among urban
Appendix C: Process, Outreach, and Survey Results
6
respondents than suburban or rural. Increasing the availability of locally produced food is the most
popular proposal across all groups, with support increasing with income.
Younger respondents were more supportive of increasing availability of locally produced food.
84