Embed Size (px)
Citation preview

2016 Agricultural Crop Report
Kings County

Onions The unassuming onion is in nearly every home around the globe. Onions are so well ingrained in our lives, that it’s possible to be reacquainted with their various forms throughout the day. For example, onions are in the salsa of your breakfast burrito. Visit a cafe for lunch and have a bowl of onion soup or try the onion rings. For dinner, a vegetable curry or stir fry can feel incomplete without onions. They could even be a character of your child's bedtime story. For people who are allergic or who may actually dislike onions, their challenge is avoiding onions! The onion's extensive presence originated in central Asia and was first cultivated about 5,000 years ago. They then spread to the Middle East and Africa. Considered an object of worship, Egyptians incorporated onions into the mummification process. The Greeks, Romans, and Indians used them as remedies for the heart, vision, dog bites, and to fortify athletes. The Romans extended the vegetable's reach into Europe when they carried it along their journeys to England and Germany. During the bleak Dark and Middle Ages, the onion was a main food source. With the advent of overseas exploration and discovery of the New World, the onion established itself among native people and colonists completing its dispersal around the globe. In Kings County, onions are generally harvested in summer and early fall. The majority of the onion plant grows above the soil. In the field, maturity is indicated when the onion tops lie down. Onions are then lifted from the soil and are cured in the field for several days to a week to allow them to dry and form a protective outer layer surrounding the bulb. Once cured, onions are harvested and loaded onto trucks where they are delivered to onion packing and processing facilities. Onions are sold whole after undergoing sizing and grading and are one of California's top three crops in fresh market vegetable production. Onions meant for processing are automatically peeled, sliced, and then turned into various processed forms that many may recognize and use on a daily basis. Thanks to its ability to grow in multiple soil types, onions are one of the few vegetables that has a global presence - both geographically and in our culture by way of food. Onions are high in vitamin C and a good source of fiber. They are considered an integral vegetable in many recipes and exist in almost every ethnic cuisine. Because of its culinary flexibility, onions may be eaten in any meal. Onions can be sliced, diced, and chopped. They can be further processed into paste, flakes, powder, oil, pickles, sauce, and multiple other variations. Onions can be eaten raw, roasted, grilled, pickled, caramelized or cooked in any number of ways to meet a wide range of preferences. Another aspect of onions that many people around the world can relate to is onion tears. Onions contain sulfur, an agent that contributes to their flavor. When onions are cut, the sulfuric compounds are released into the air and when it comes into contact with our eyes, it irritates them enough to produce tears. Of course, there are numerous tips and tricks to prevent crying onion tears. Who hasn't tried chilling their onions before chopping them? Chewing a piece of bread while dicing? Or even slicing them when they are submerged under water? Remember, the root end of the onion has the highest concentration of these sulphuric compounds, so avoid cutting this area until the end. Despite making us cry, onions are very highly valued vegetables. Their universal character makes them possible to be grown internationally and even further ingratiate themselves into local cuisines due to their satisfying flavor and easy ability to be manipulated for cooking. For these reasons and many more, one can assume onions will continue to remain a staple worldwide.
680 N Campus Drive, Suite B / Hanford, California 93230 / (559) 582-3211, Ext. 2831 FAX (559) 582-5251 / e-mail: [email protected] / web site: countyofkings.com
Department of Agriculture / Measurement Standards
June 20, 2017
Secretary Karen Ross California Department of Food and Agriculture and The Honorable Board of Supervisors County of Kings, California It is my privilege to submit to you the 2016 Annual Agricultural Crop Report for the County of Kings. This report contains statistical information on the acreage, yield and gross values in accordance with Sections 2272 and 2279 of the California Food and Agricultural Code. The numbers in this report are gross values and do not represent net income or loss to producers. The gross value of all agricultural crops and products produced during 2016 in Kings County was $2,002,192,000. This represents a decrease of $18,860,000 (0.9%) from the 2015 value. Livestock and Poultry had the largest increase in value at $19,081,000 (7.5%) due primarily to an increase in poultry production (chickens). Fruit and Nut Crops increased in value $11,812,000 (2.3%) due mainly to the pistachio production rebounding from poor production the previous year. Seed Crops increased $4,424,000 (102.5%) due mainly to an increase in acreage and production of alfalfa seed. Apiary Products also increased in value $1,081,000 (11.5%) due primarily to higher pollination prices. Vegetable Crops had the largest decrease in value at $20,031,000 (10.2%) due primarily to less processing tomato acreage as well as a lower price. Field Crops decreased in value $19,931,000 (5.1%) due primarily to lower prices for the majority of the commodities. Livestock and Poultry Products decreased $15,296,000 (2.3%) due to lower milk prices. Milk continues to be the top commodity with a value of $636,909,000 in 2016. My thanks and appreciation is extended to the many producers and organizations who contributed information for this report. This report was compiled and prepared by Janet Eckles, Agricultural and Standards Inspector, Sonya Hernandez, Agricultural and Standards Inspector and Steve Schweizer, Deputy Agricultural Commissioner/Sealer, with assistance from Randall Bray, Agricultural and Standards Aide. Respectfully Submitted,
Tim Niswander
TIM NISWANDER Agricultural Commissioner
Sealer of Weights and Measures
3
Cover Story...................................................................................................................................... 1
Summary Letter............................................................................................................................... 2
Table of Contents............................................................................................................................ 3
County Administration/Ag Commissioner-Sealer Personnel..................................................... 4
Field Crops...................................................................................................................................... 5
Fruit & Nut Crops............................................................................................................................ 7
Seed Crops...................................................................................................................................... 9
Vegetable Crops.............................................................................................................................. 9
Livestock & Poultry......................................................................................................................... 10
Livestock & Poultry Products........................................................................................................ 11
Apiary Products.............................................................................................................................. 12
5 Year Comparison of Acreage and Crop Value........................................................................... 13
Top 10 Commodities....................................................................................................................... 14
Sustainable Agriculture Report..................................................................................................... 15
Export Commodities and Trade Partners..................................................................................... 17
Top Export Countries..................................................................................................................... 18
Organic Production........................................................................................................................ 19
Certified Farmer's Market............................................................................................................... 19
Land Use.......................................................................................................................................... 20
Weights & Measures....................................................................................................................... 21
Kings County General Information................................................................................................ 22
Kings County Rainfall..................................................................................................................... 23
Table Of Contents

4
Kings County Board of Supervisors
Joe A. Neves District I Richard Valle District II
Doug Verboon District III Craig Pedersen District IV
Richard Fagundes District V
County Administrative Officer
Larry Spikes
Agricultural Commissioner - Sealer of Weights and Measures
Tim Niswander
Deputy Agricultural Commissioner - SealersJimmy Hook Rusty Lantsberger Steve Schweizer
Agricultural and Standards Inspectors
Tom Chambers Janet Eckles Vince Evans Mario Gutierrez Sonya Hernandez
Michael Leoni Garen Oliveira Bruce Perez Jason Perez
Rafael Perla Alfredo Prieto Lynda Schrumpf Robert Torrez Shanna Vickers
Agricultural and Standards Aides
Randall Bray Garrett Roe
Executive Secretary
Jennifer Rios
Account Clerk Office Assistants
Julie Henderson Chelsey Huckabay Sue Shanahan
County Administration Ag Commissioner - Sealer Personnel

5
Field Crops
Alfalfa, Hay 2016 27,485 7.69 211,360 Ton $142.00 $30,013,000
2015 38,890 7.48 290,897 Ton $182.00 $52,943,000
Alfalfa, Silage 2016 3,046 4.13 12,580 Ton $34.40 $433,000
2015 635 4.81 3,054 Ton $38.90 $119,000
Alfalfa, Silage All Year 2016 1,137 30.18 34,315 Ton $23.10 $793,000
2015 2,251 38.60 86,889 Ton $38.50 $3,345,000
Alfalfa, Stubble a/ 2016 Ton
2015 9,723 Ton $25.00 $243,000
Barley, Silage a/ 2016 Ton
2015 5,965 12.42 74,085 Ton $41.50 $3,075,000
Corn, Silage 2016 44,962 25.25 1,135,291 Ton $40.10 $45,525,000
2015 42,194 25.96 1,095,356 Ton $52.60 $57,616,000
Cotton, Acala - Lint b/ 2016 8,535 3.64 31,067 Bale $427.00 $13,266,000
2015 4,727 3.43 16,214 Bale $487.00 $7,896,000
Cotton, Acala - Seed 2016 13,442 Ton $292.50 $3,932,000
2015 7,015 Ton $411.00 $2,883,000
Cotton Pima - Lint b/ 2016 80,540 3.20 257,728 Bale $683.00 $176,028,000
2015 65,015 3.07 199,596 Bale $687.00 $137,122,000
Cotton Pima - Seed 2016 111,512 Ton $255.00 $28,436,000
2015 86,360 Ton $340.00 $29,362,000
Oat, Hay 2016 892 3.01 2,685 Ton $62.00 $166,000
2015 1,323 3.12 4,128 Ton $111.00 $458,000
Oat, Silage a/ 2016 Ton
2015 815 10.50 8,558 Ton $97.20 $832,000
Pasture Range 2016 311,816 Ton $11.25 $3,508,000
2015 312,330 Ton $8.03 $2,508,000
Harvested Production Value Crop Year Acres Per Acre Total Unit Per Unit Total

6
a/ Currently included in "Other"b/ 495 lbs. = 1 balec/ Includes alfalfa stubble, barley hay, barley silage, beans-dry, corn-grain, corn - human consumption, forage, hay-other, oat silage, pasture irrigated, ryegrass, safflower, sorghum grain, sudan hay, sudan silage, sugar beets-silage, triticale grain, and wheat straw.
Field Crops
Sorghum, Silage 2016 12,412 17.97 223,044 Ton $27.80 $6,201,000
2015 15,310 18.11 277,264 Ton $35.80 $9,926,000
Triticale, Silage 2016 2,198 16.01 35,190 Ton $24.20 $852,000
2015 3,045 13.64 41,534 Ton $40.90 $1,699,000
Wheat, Grain 2016 23,527 2.51 59,053 Ton $223.00 $13,169,000
2015 22,681 3.14 71,218 Ton $259.00 $18,445,000
Wheat, Hay 2016 1,985 3.87 7,682 Ton $86.00 $661,000
2015 562 3.89 2,186 Ton $75.80 $166,000
Wheat, Silage 2016 42,818 17.00 727,906 Ton $29.60 $21,546,000
2015 44,583 17.17 765,490 Ton $41.10 $31,462,000
Other c/ 2016 60,937 $23,071,000
2015 58,238 $27,431,000
Total 2016 622,290 $367,600,000
2015 628,287 $387,531,000
Harvested Production Value Crop Year Acres Per Acre Total Unit Per Unit Total

7
Fruit & Nut Crops
Almonds 2016 23,131 1.07 24,750 Ton $4,820.00 $119,295,000
2015 21,455 1.03 22,099 Ton $7,570.00 $167,289,000
Almond Hulls 2016 49,500 Ton $73.63 $3,645,000
2015 44,198 Ton $126.00 $5,569,000
Almond Shells 2016 12,375 Ton $5.77 $71,000
2015 11,050 Ton $23.50 $260,000
Apricots 2016 780 11.36 8,861 Ton $1,530.00 $13,557,000
2015 877 7.33 6,428 Ton $1,690.00 $10,863,000
Cherries 2016 1,371 2.88 3,948 Ton $4,410.00 $17,411,000
2015 1,678 3.11 5,219 Ton $5,230.00 $27,295,000
Grapes, Raisin 2016 1,696 2.43 4,121 Ton $1,430.00 $5,893,000
2015 2,103 3.71 7,802 Ton $1,750.00 $13,654,000
Grapes, Table 2016 824 13.48 11,108 Ton $1,550.00 $17,217,000
2015 865 15.68 13,563 Ton $1,370.00 $18,581,000
Grapes, Wine 2016 3,730 13.63 50,840 Ton $286.00 $14,540,000
2015 3,328 12.20 40,602 Ton $261.00 $10,597,000
Grapes, Total 2016 6,250 $37,650,000
2015 6,296 $42,832,000
Nectarines 2016 1,497 10.52 15,748 Ton $1,380.00 $21,732,000
2015 1,653 10.63 17,571 Ton $1,250.00 $21,964,000
Peaches, Cling 2016 703 18.20 12,795 Ton $499.00 $6,385,000
2015 852 18.78 16,001 Ton $513.00 $8,209,000
Peaches, Freestone 2016 1,889 11.23 21,213 Ton $1,200.00 $25,456,000
2015 2,058 11.89 24,470 Ton $1,090.00 $26,672,000
Peaches, Total 2016 2,592 $31,841,000
2015 2,910 $34,881,000
Harvested Production Value Crop Year Acres Per Acre Total Unit Per Unit Total

8
Fruit & Nut Crops
Pistachios 2016 21,859 1.90 41,532 Ton $4,300.00 $178,588,000
2015 20,373 0.68 13,854 Ton $6,190.00 $85,756,000
Plums 2016 2,144 7.75 16,616 Ton $1,410.00 $23,429,000
2015 2,138 8.05 17,211 Ton $1,250.00 $21,514,000
Walnuts 2016 14,972 2.01 30,094 Ton $1,870.00 $56,276,000
2015 14,853 2.11 31,340 Ton $1,770.00 $55,472,000
Other a/ 2016 4,050 $21,618,000
2015 4,660 $39,606,000
TOTAL 2016 78,646 $525,113,000
2015 76,893 $513,301,000
Harvested Production Value Crop Year Acres Per Acre Total Unit Per Unit Total
a/ Includes apples, blueberries, cherry-plums, firewood, kiwifruit, oranges, olives, pecans, persimmons, pluots, pomegranates, prunes, quince, strawberries, and tangerines.

9
Seed Crops a/ 2016 6,039 LBS $8,739,000
2015 4,790 LBS $4,315,000
Tomatoes, Processed 2016 29,750 56.68 1,686,230 TON $70.70 $119,216,000
2015 31,029 54.99 1,706,285 TON $77.20 $131,725,000
Other a/ 2016 9,730 $56,617,000
2015 9,528 $64,139,000
TOTAL 2016 39,480 $175,833,000
2015 40,557 $195,864,000
Seed Crops
a/ Includes asparagus, bell peppers, broccoli, cabbage, cantaloupe, carrots, corn sweet, garlic fresh, garlic processed, miscellaneous melons, onions fresh, onions processed, radicchio, squash, tomatoes fresh, tomato transplants, and watermelons.
Harvested Value Crop Year Acres Total Unit Per Unit Total
Harvested Production Value Crop Year Acres Per Acre Total Unit Per Unit Total
a/ Includes alfalfa certified, asparagus, broccoli, cabbage, carrot, corn, cotton certified, flower, lettuce, and onion.
Vegetable Crops
10
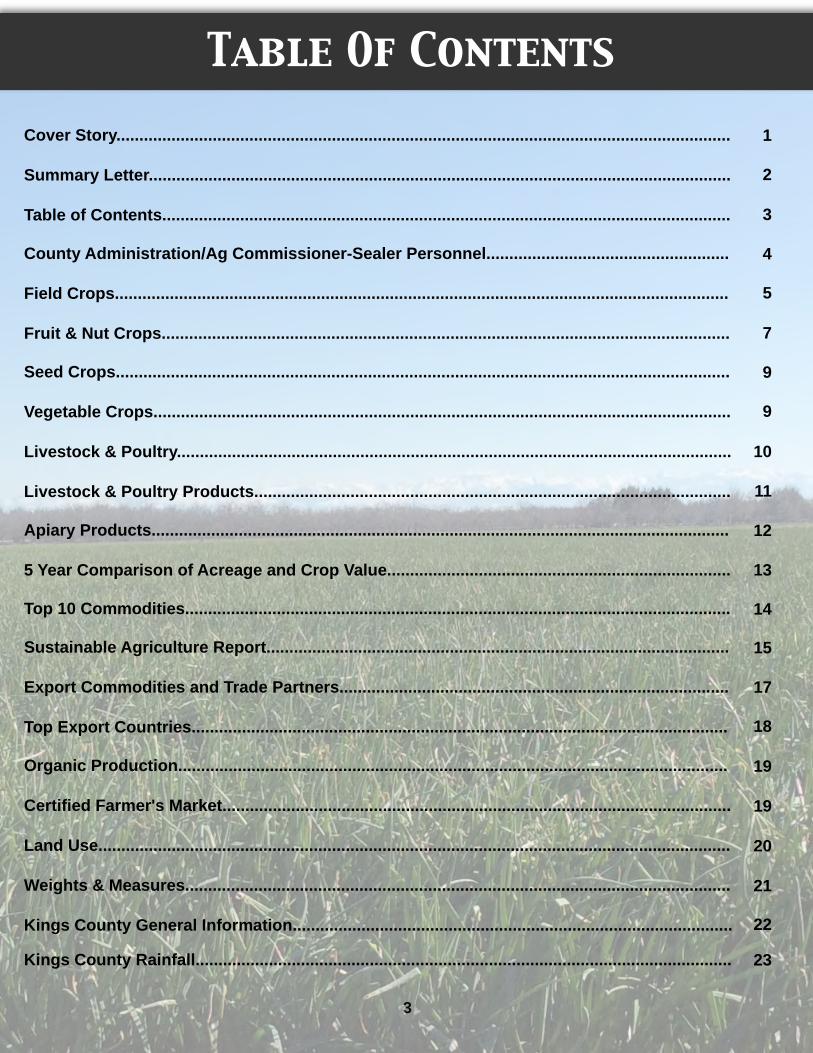
Cattle and Calves
All 420,000 425,000
Dairy Cows 2 Years and Over 180,000 185,000
Cattle and Calves on Feed 5,400 5,700
Other 234,600 234,300
Sheep and Lambs 8,645 10,025
Goats 9,741 16,544
Hogs and Pigs 523 218
Turkeys 1,099,386 1,043,880
Inventories of Livestock & Poultry
Livestock & Poultry
Cattle and Calves a/ 2016 215,398 Head $1022.00 $220,137,000
2015 221,878 Head $1020.00 $226,316,000
Turkeys 2016 1,099,386 33,023,533 Lb. $0.75 $24,768,000
2015 1,043,880 32,845,782 Lb. $0.85 $27,919,000
Other b/ 2016 5,272,590 $29,286,000
2015 27,158 $875,000
TOTAL 2016 6,587,374 $274,191,000
2015 1,292,916 $255,110,000
a/ Includes breeding stock value in total.b/ Includes chickens, ducks, goats, hogs, pigs, sheep, and lambs.
December, 2016 December, 2015 Item Number of Head Number of Head
Number of Total Value Item Year Head Liveweight Unit Per Unit Total

11
Livestock & Poultry Products
Manure 2016 761,319 Ton $4.30 $3,274,000
2015 625,258 Ton $6.00 $3,752,000
Milk, Market 2016 42,698,475 Cwt. $14.80 $631,937,000
2015 42,691,126 Cwt. $15.20 $648,905,000
Milk, Mfg. 2016 17,881 Cwt. $16.05 $287,000
2015 32,452 Cwt. $17.20 $558,000
Milk, Goats 2016 128,710 Cwt. $36.40 $4,685,000
2015 62,330 Cwt. $35.90 $2,238,000
Milk Total 2016 42,845,066 Cwt. $636,909,000
2015 42,785,908 Cwt. $651,701,000
Wool a/ 2016 50,800 Lb. $1.50 $76,000
2015 66,217 Lb. $1.54 $102,000
TOTAL 2016 $640,259,000
2015 $655,555,000
a/ Price does not include wool incentive
Total Value Item Year Production Unit Per Unit Total

12
Apiary Products
Kings County is ranked:• 9th among California counties in agricultural production• 1st among California counties in the production of cotton lint and cottonseed• 3rd among California counties in the production of milk and cream, nectarines, plums.• 4th among California counties in the production of tomatoes (processing), cherries, turkeys, apricots, and wheat.• 5th among California counties in the production of silage, pistachios and peaches.
Information is based on 2015 County Agricultural Commissioners' Crop Reports
Total Value PerItem Year Production Unit Unit Total
Honey 2016 251,848 Lb. $2.12 $534,000
2015 182,988 Lb. $1.91 $350,000
Beeswax 2016 2,735 Lb. $2.36 $6,450
2015 4,148 Lb. $2.89 $12,000
Pollination, Seed Alfalfa 2016 7,435 Colonies $60.00 $446,100
2015 6,176 Colonies $60.00 $371,000
Pollination, Tree Fruit & Nuts a/ 2016 51,027 Colonies $183.33 $9,355,000
2015 48,049 Colonies $176.00 $8,457,000
Pollination, Melons 2016 305 Colonies $38.00 $11,600
2015 573 Colonies $35.00 $20,100
Pollination, Vegetable Seed 2016 1,729 Colonies $60.00 $104,000
2015 2,767 Colonies $60.00 $166,000
TOTAL 2016 $10,457,000
2015 $9,376,000
Agricultural Quick Facts
a/ Includes almonds, cherries, pluots, pomegranates, and plums.

13
5 Year Comparison ofAcreage and Crop Values
Apiary Products $10,457,000 $9,376,000 $8,483,000 $7,801,000 $6,972,000
Field CropsAcreage
$367,600,000622,290
$387,531,000628,287
$486,219,000592,831
$591,715,000687,709
$634,944,000715,383
Fruit & Nut CropsAcreage
$525,113,00078,646
$513,301,00076,893
$569,018,00076,783
$513,872,00073,964
$412,643,00068,019
Livestock and Poultry $274,191,000 $255,110,000 $207,013,000 $213,050,000 $265,548,000
Livestock and Poultry Products $640,259,000 $655,555,000 $973,040,000 $777,477,000 $704,865,000
Seed CropsAcreage
$8,739,0006,039
$4,315,0004,790
$8,680,0004,539
$10,274,0009,840
$5,858,0001,079
Vegetable CropsAcreage
$175,833,00039,480
$195,864,00040,557
$219,293,00047,210
$152,989,00048,945
$184,184,00047,802
TOTAL $2,002,192,000 $2,021,052,000 $2,471,746,000 $2,267,178,000 $2,215,014,000
Corn, Silage 25.25 Tons 19.60 Tons
Cotton 3.64 Bales 1.92 Bales
Walnuts 2.01 Tons 1.20 Tons
Wheat 2.51 Tons 1.20 Tons
AGRICULTURAL EFFICIENCY...Production Per Acre Comparison for Miscellaneous Crops
2016 & 1966
2016 2015 2014 2013 2012
2016 1966 Crop Production/Acre Unit Production/Acre Unit
*Revised

14
Milk, Total 1 $636,909,000 1 1 4
Cotton, All 2 $221,662,000 3 2 1
Cattle & Calves 3 $220,137,000 2 3 2
Pistachios 4 $178,588,000 6 6 N/A
Almonds, All 5 $123,011,000 4 4 28
Tomatoes, Processed 6 $119,216,000 5 5 N/A
Walnuts 7 $56,276,000 9 7 15
Corn, Silage 8 $45,525,000 7 8 17
Grapes, All 9 $37,650,000 10 10 9
Peaches, All 10 $31,841,000 11 12 7
Top 10 Commodities
Crop Rank Dollar Value
2016 2015 2014 1966 Crop Rank Dollar Value Rank Rank Rank
Cotton, Total 1 $28,373,000Cattle & Calves 2 $22,071,000Barley, Total 3 $17,409,000Milk, Total 4 $16,575,000Alfalfa, Total 5 $13,368,000Safflower, Total 6 $5,593,000Peaches 7 $3,100,000Melons 8 $2,865,800Grapes, Total 9 $2,844,000Corn, Total 10 $2,840,000
Total $115,038,800
A Look Back, 50 Years Ago.....1966 Kings County's Top 10 Commodities

15
Glassy Winged Nursery/Citrus Inspections 702 Shipments InspectedSharpshooter
Gypsy Moth Household Goods 3 Shipments InspectedLymantria dispar Shipments
Various Pests Truck Shipments 64,158 Units Inspected
Crops Activity Scope of Program
Export Commodities Phytosanitary Certification 1,436 Issued
Export Seed Field Inspections 35 Sites / 3104 Acres
County Biological ControlPest Agent/Mechanism Scope of Program
Puncture Vine Stem Mining WeevilTribulus terrestris Microlarinus lypriformis Generally Distributed
Seed Head Weevil Microlarinus lareynil Generally Distributed
Yellow Starthistle Seed Head WeevilCentaurea solstitialis Bangastemus orientalis Generally Distributed
Gall Fly Urophora sirunaseva Generally Distributed
Hairy Weevil Eustenopus villosus Generally Distributed
Ash Whitefly Parasitic WaspSiphoninus phillyreae Encarsia partenopea Generally Distributed
Red Gum Lerp Psyllid Parasitic WaspGlycaspis brimblecombei Psyllaephagus bliteus Generally Distributed
Silverleaf Whitefly Parasitic WaspBemisia argentifolii Eretmocerus sp. (M95104) Generally Distributed
Eretmocerus sp. (M95012) Generally Distributed
County Pest ExclusionPest Agent/Mechanism Scope of Program
Sustainable Agriculture Report

16
Pest Number of TrapsNumber of Servicings Type of Trap
All Purpose Fruit Fly 117 1,078 Champ
Asian Citrus Psyllid 212 3,435 Yellow Panel
European Corn Borer 13 160 Pherocon II
European Grape Vine Moth 581 6,927 Delta
European Pine Shoot Moth 6 39 Pherocon II
Glassy Wing Sharpshooter 67 943 Yellow Panel
Gypsy Moth 82 618 Delta
Japanese Beetle 82 618 Japanese Beetle
Light Brown Apple Moth 152 2,247 Jackson
Mediterranean Fruit Fly 152 2,247 Jackson
Melon Fly 76 730 Jackson
Mexican Fruit Fly 100 2,680 McPhail
Oriental Fruit Fly 152 2,247 Jackson
TOTAL 1,792 23,969
Sustainable Agriculture Report
Pink Bollworm Mechanical/HostPectinophora gossypiella Free Period 83,375 Acres
Alligatorweed Visual InspectionAlternanthera philoxeriodes Mechanical/Chemical 66 Sites Treated
County Pest EradicationPest Agent/Mechanism Scope of Program
County Pest Detection
Until 2016 Kings County was free from the Asian Citrus Psyllid (ACP) even though the surrounding counties were dealing with this pest and the disease it carries, Huanglongbing aka Citrus Greening Disease. This year ACP was detected in Kingsburg, Hanford, Stratford, and Kettleman City through residential trapping or visual surveys.

17
Export CommoditiesCommodities Grown and Exported From
Kings County
Alfalfa Seed Cotton PistachiosAlmonds Cotton Seed PlumsApricots Garlic Seed PluotsAprium Grapes PomegranatesAsparagus Seed Kiwi Rye SeedBlueberry Nectarines Sudan Grass SeedCherry Onion Seed Walnuts
Peaches
Export Trade Partnersof Kings County in 2016
Argentina Fiji Jordan PhilippinesAustralia France Korea, Republic of Saudi ArabiaBahrain French Polynesia Luxembourg SingaporeBrazil Germany Malaysia SpainCanada Greece Mexico SwitzerlandChile Hong Kong Morocco TaiwanChina Indonesia Netherlands ThailandCosta Rica Israel New Zealand United Arab EmiratesDominican Republic Italy Panama United KingdomEgypt Japan Peru Uruguay
Vietnam
POUNDS EXPORTED
18
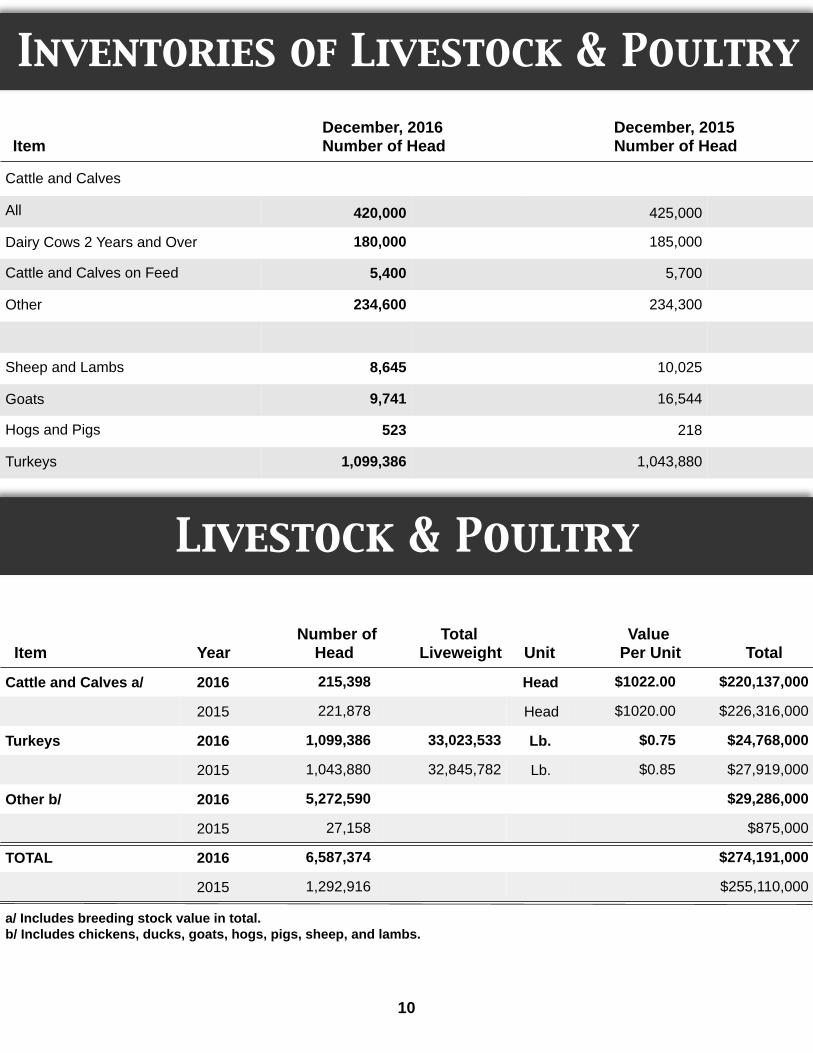
Taiwan
Japan
Korea, Republic of
China
Mexico
Australia
Hong Kong
Canada
United Kingdom
France
Other
0% 8% 15% 23% 30%
27%5%
6%7%
8%9%
12%12%
15%20%
23%
Export Partners
Fairs And Expositions
Percentage of Total Export Certificates Issued 2016
Kings County Fairgrounds!
Phone 559-584-3318
Fax 559-584-0192
801 S. 10th AveHanford, CA 93230

19
On 26,472 acres, Kings County growers produced more than 70 organic crops including various nuts, fruits, vegetables, flowers, citrus and field crops. These crop values are included in their respective commodity groups.
In 2016, there were 35 organic producers and 7 organic handlers registered in Kings County, including 4 new registrations. In addition, all registered organic producers were third-party certified.
2016 saw the passage of the California Organic Food and Farming Act. Sponsored by the industry, the law updates the State Organic Program (SOP) including streamlining the registration process, updating the SOP registration fee schedule, and revising the makeup of the state advisory committee. The law went into effect on January 1, 2017.
In 2016, Kings County had 24 certified producers growing nearly 100 different commodities. Direct marketing and Certified Farmers' Markets are statewide programs that provide producers opportunities to sell the products they have grown directly to consumers. In turn, consumers have the benefit of fresh, seasonal produce and an opportunity to gather as a community.
Organic Production
Certified Farmers Market
Thursday Night Market Place
Irwin Street, Hanford
Thursdays, Weekly
May to September
5:30 PM to 9 PM
20
Land Use
Land Use Summary
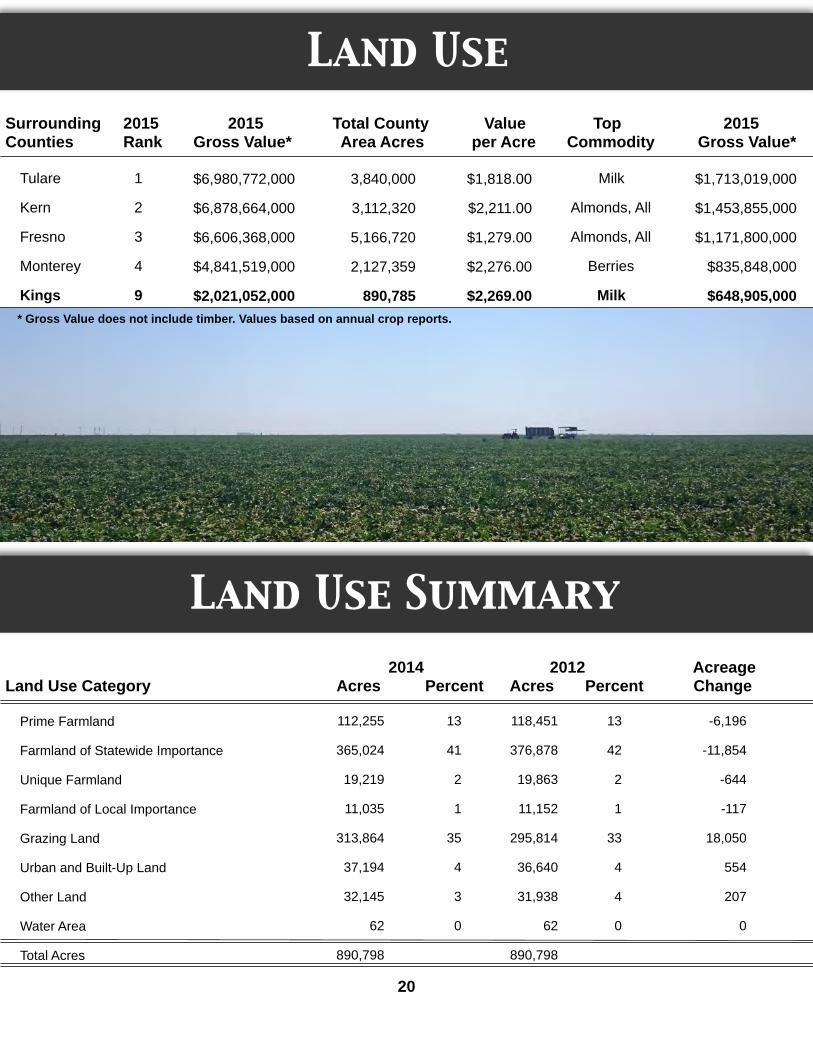
Prime Farmland 112,255 13 118,451 13 -6,196
Farmland of Statewide Importance 365,024 41 376,878 42 -11,854
Unique Farmland 19,219 2 19,863 2 -644
Farmland of Local Importance 11,035 1 11,152 1 -117
Grazing Land 313,864 35 295,814 33 18,050
Urban and Built-Up Land 37,194 4 36,640 4 554
Other Land 32,145 3 31,938 4 207
Water Area 62 0 62 0 0
Total Acres 890,798 890,798
* Gross Value does not include timber. Values based on annual crop reports.
Surrounding 2015 2015 Total County Value Top 2015Counties Rank Gross Value* Area Acres per Acre Commodity Gross Value*
2014 2012 Acreage Land Use Category Acres Percent Acres Percent Change
Tulare 1 $6,980,772,000 3,840,000 $1,818.00 Milk $1,713,019,000
Kern 2 $6,878,664,000 3,112,320 $2,211.00 Almonds, All $1,453,855,000
Fresno 3 $6,606,368,000 5,166,720 $1,279.00 Almonds, All $1,171,800,000
Monterey 4 $4,841,519,000 2,127,359 $2,276.00 Berries $835,848,000
Kings 9 $2,021,052,000 890,785 $2,269.00 Milk $648,905,000

21
Weights & Measures
In Kings County, weights and measures inspectors work to preserve equity in the marketplace. Using specialized and accurate equipment, they perform a multitude of inspections of commercial
devices and commodities that touch the lives of people everyday.
In 2016, the Kings County Department of Measurement Standards:
• Verified 289 devices for Service Agencies• Inspected 1,530 devices including:
• 150 Counter Scales• 13 Livestock & Animal Scales• 80 Vehicle Scales• 1,287 Retail Motor Fuel Meters (gas pumps) as well as checking for petroleum advertising
and labeling compliance• Verified scanned prices of 2,201 packages and made 137 test purchases in Quantity Control• Performed 18 weighmaster audits
We, in partnership with the California Department of Food and Agriculture, serve the people of California by preserving and defending the measurement standards essential in providing the
citizens a basis of value comparison and fair competition in the marketplace.
22
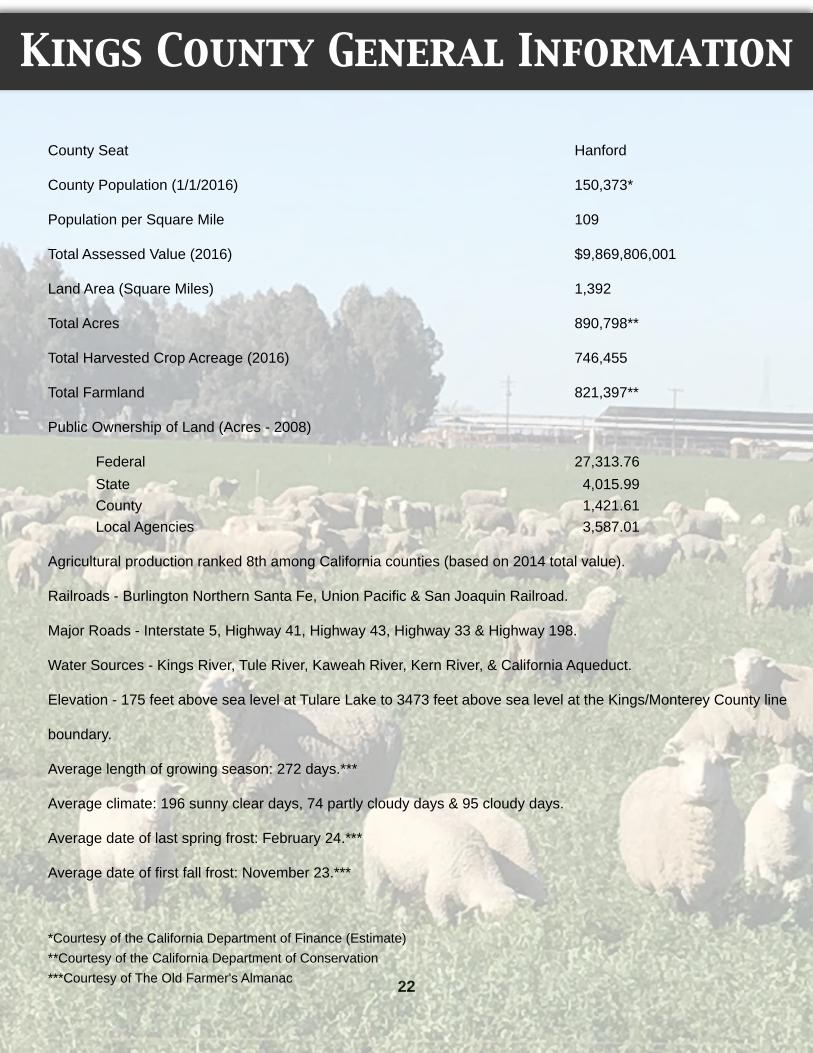
County Seat Hanford
County Population (1/1/2016) 150,373*
Population per Square Mile 109
Total Assessed Value (2016) $9,869,806,001
Land Area (Square Miles) 1,392
Total Acres 890,798**
Total Harvested Crop Acreage (2016) 746,455
Total Farmland 821,397**
Public Ownership of Land (Acres - 2008)
Federal 27,313.76State 4,015.99County 1,421.61Local Agencies 3,587.01
Agricultural production ranked 8th among California counties (based on 2014 total value).
Railroads - Burlington Northern Santa Fe, Union Pacific & San Joaquin Railroad.
Major Roads - Interstate 5, Highway 41, Highway 43, Highway 33 & Highway 198.
Water Sources - Kings River, Tule River, Kaweah River, Kern River, & California Aqueduct.
Elevation - 175 feet above sea level at Tulare Lake to 3473 feet above sea level at the Kings/Monterey County line
boundary.
Average length of growing season: 272 days.***
Average climate: 196 sunny clear days, 74 partly cloudy days & 95 cloudy days.
Average date of last spring frost: February 24.***
Average date of first fall frost: November 23.***
*Courtesy of the California Department of Finance (Estimate)**Courtesy of the California Department of Conservation***Courtesy of The Old Farmer's Almanac
Kings County General Information
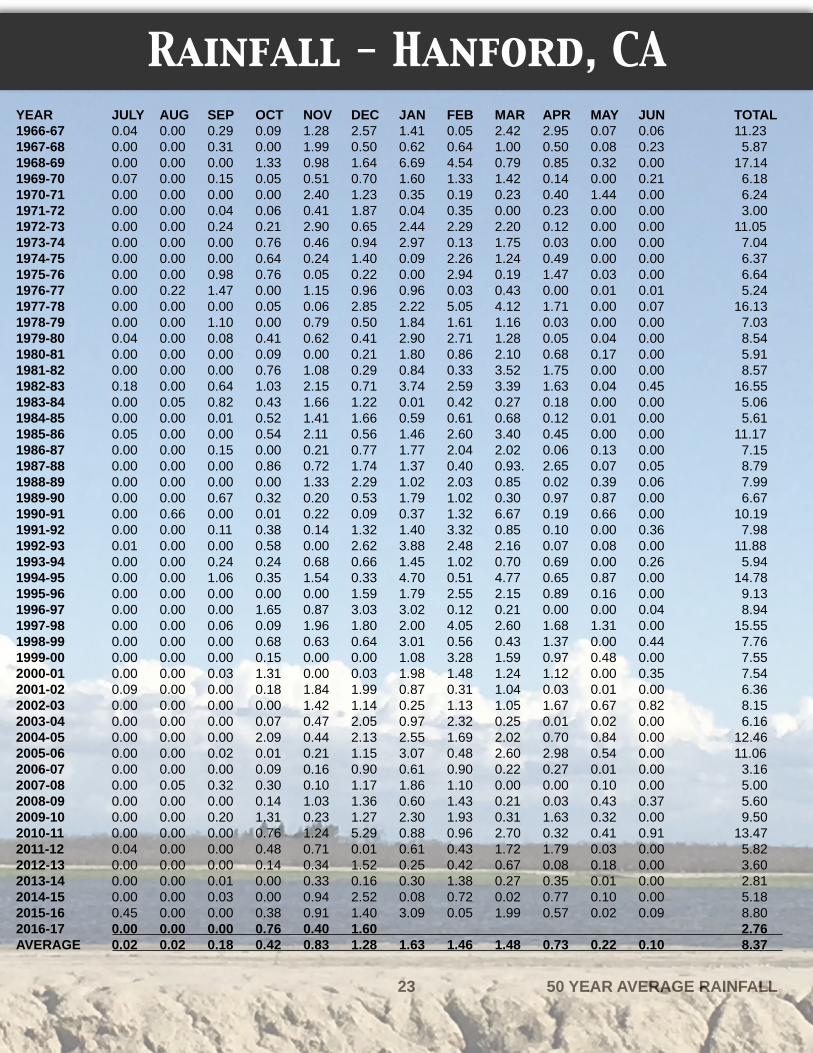
23 50 YEAR AVERAGE RAINFALL
YEAR JULY AUG SEP OCT NOV DEC JAN FEB MAR APR MAY JUN TOTAL1966-67 0.04 0.00 0.29 0.09 1.28 2.57 1.41 0.05 2.42 2.95 0.07 0.06 11.231967-68 0.00 0.00 0.31 0.00 1.99 0.50 0.62 0.64 1.00 0.50 0.08 0.23 5.871968-69 0.00 0.00 0.00 1.33 0.98 1.64 6.69 4.54 0.79 0.85 0.32 0.00 17.141969-70 0.07 0.00 0.15 0.05 0.51 0.70 1.60 1.33 1.42 0.14 0.00 0.21 6.181970-71 0.00 0.00 0.00 0.00 2.40 1.23 0.35 0.19 0.23 0.40 1.44 0.00 6.241971-72 0.00 0.00 0.04 0.06 0.41 1.87 0.04 0.35 0.00 0.23 0.00 0.00 3.001972-73 0.00 0.00 0.24 0.21 2.90 0.65 2.44 2.29 2.20 0.12 0.00 0.00 11.051973-74 0.00 0.00 0.00 0.76 0.46 0.94 2.97 0.13 1.75 0.03 0.00 0.00 7.041974-75 0.00 0.00 0.00 0.64 0.24 1.40 0.09 2.26 1.24 0.49 0.00 0.00 6.371975-76 0.00 0.00 0.98 0.76 0.05 0.22 0.00 2.94 0.19 1.47 0.03 0.00 6.641976-77 0.00 0.22 1.47 0.00 1.15 0.96 0.96 0.03 0.43 0.00 0.01 0.01 5.241977-78 0.00 0.00 0.00 0.05 0.06 2.85 2.22 5.05 4.12 1.71 0.00 0.07 16.131978-79 0.00 0.00 1.10 0.00 0.79 0.50 1.84 1.61 1.16 0.03 0.00 0.00 7.031979-80 0.04 0.00 0.08 0.41 0.62 0.41 2.90 2.71 1.28 0.05 0.04 0.00 8.541980-81 0.00 0.00 0.00 0.09 0.00 0.21 1.80 0.86 2.10 0.68 0.17 0.00 5.911981-82 0.00 0.00 0.00 0.76 1.08 0.29 0.84 0.33 3.52 1.75 0.00 0.00 8.571982-83 0.18 0.00 0.64 1.03 2.15 0.71 3.74 2.59 3.39 1.63 0.04 0.45 16.551983-84 0.00 0.05 0.82 0.43 1.66 1.22 0.01 0.42 0.27 0.18 0.00 0.00 5.061984-85 0.00 0.00 0.01 0.52 1.41 1.66 0.59 0.61 0.68 0.12 0.01 0.00 5.611985-86 0.05 0.00 0.00 0.54 2.11 0.56 1.46 2.60 3.40 0.45 0.00 0.00 11.171986-87 0.00 0.00 0.15 0.00 0.21 0.77 1.77 2.04 2.02 0.06 0.13 0.00 7.151987-88 0.00 0.00 0.00 0.86 0.72 1.74 1.37 0.40 0.93. 2.65 0.07 0.05 8.791988-89 0.00 0.00 0.00 0.00 1.33 2.29 1.02 2.03 0.85 0.02 0.39 0.06 7.991989-90 0.00 0.00 0.67 0.32 0.20 0.53 1.79 1.02 0.30 0.97 0.87 0.00 6.671990-91 0.00 0.66 0.00 0.01 0.22 0.09 0.37 1.32 6.67 0.19 0.66 0.00 10.191991-92 0.00 0.00 0.11 0.38 0.14 1.32 1.40 3.32 0.85 0.10 0.00 0.36 7.981992-93 0.01 0.00 0.00 0.58 0.00 2.62 3.88 2.48 2.16 0.07 0.08 0.00 11.881993-94 0.00 0.00 0.24 0.24 0.68 0.66 1.45 1.02 0.70 0.69 0.00 0.26 5.941994-95 0.00 0.00 1.06 0.35 1.54 0.33 4.70 0.51 4.77 0.65 0.87 0.00 14.781995-96 0.00 0.00 0.00 0.00 0.00 1.59 1.79 2.55 2.15 0.89 0.16 0.00 9.131996-97 0.00 0.00 0.00 1.65 0.87 3.03 3.02 0.12 0.21 0.00 0.00 0.04 8.941997-98 0.00 0.00 0.06 0.09 1.96 1.80 2.00 4.05 2.60 1.68 1.31 0.00 15.551998-99 0.00 0.00 0.00 0.68 0.63 0.64 3.01 0.56 0.43 1.37 0.00 0.44 7.761999-00 0.00 0.00 0.00 0.15 0.00 0.00 1.08 3.28 1.59 0.97 0.48 0.00 7.552000-01 0.00 0.00 0.03 1.31 0.00 0.03 1.98 1.48 1.24 1.12 0.00 0.35 7.542001-02 0.09 0.00 0.00 0.18 1.84 1.99 0.87 0.31 1.04 0.03 0.01 0.00 6.362002-03 0.00 0.00 0.00 0.00 1.42 1.14 0.25 1.13 1.05 1.67 0.67 0.82 8.152003-04 0.00 0.00 0.00 0.07 0.47 2.05 0.97 2.32 0.25 0.01 0.02 0.00 6.162004-05 0.00 0.00 0.00 2.09 0.44 2.13 2.55 1.69 2.02 0.70 0.84 0.00 12.462005-06 0.00 0.00 0.02 0.01 0.21 1.15 3.07 0.48 2.60 2.98 0.54 0.00 11.062006-07 0.00 0.00 0.00 0.09 0.16 0.90 0.61 0.90 0.22 0.27 0.01 0.00 3.162007-08 0.00 0.05 0.32 0.30 0.10 1.17 1.86 1.10 0.00 0.00 0.10 0.00 5.002008-09 0.00 0.00 0.00 0.14 1.03 1.36 0.60 1.43 0.21 0.03 0.43 0.37 5.602009-10 0.00 0.00 0.20 1.31 0.23 1.27 2.30 1.93 0.31 1.63 0.32 0.00 9.502010-11 0.00 0.00 0.00 0.76 1.24 5.29 0.88 0.96 2.70 0.32 0.41 0.91 13.472011-12 0.04 0.00 0.00 0.48 0.71 0.01 0.61 0.43 1.72 1.79 0.03 0.00 5.822012-13 0.00 0.00 0.00 0.14 0.34 1.52 0.25 0.42 0.67 0.08 0.18 0.00 3.602013-14 0.00 0.00 0.01 0.00 0.33 0.16 0.30 1.38 0.27 0.35 0.01 0.00 2.812014-15 0.00 0.00 0.03 0.00 0.94 2.52 0.08 0.72 0.02 0.77 0.10 0.00 5.182015-16 0.45 0.00 0.00 0.38 0.91 1.40 3.09 0.05 1.99 0.57 0.02 0.09 8.802016-17 0.00 0.00 0.00 0.76 0.40 1.60 2.76AVERAGE 0.02 0.02 0.18 0.42 0.83 1.28 1.63 1.46 1.48 0.73 0.22 0.10 8.37
Rainfall - Hanford, CA