Embed Size (px)
Citation preview
February 2015
Working paper
FROMTHECRADLETOTHEGRAVE:THEEFFECTOFFAMILYBACKGROUNDONTHECAREERPATH
OFITALIANMEN
RaitanoMicheleDipartimentodiEconomiaeDiritto
UniversityLaSapienza
VonaFrancescoOFCE–SciencesPoandSKEMABusinessSchool
2015‐05
1
FromtheCradletotheGrave:TheeffectoffamilybackgroundonthecareerpathofItalianmen
Raitano Michele (Dipartimento di Economia e Diritto, University La Sapienza) and Vona Francesco (OFCE SciencesPo and SKEMA Business School)
Abstract
This paper investigates the influence of parental education on the returns to experience ofItalianmen using a new longitudinal dataset that contains detailed information on individualworking histories. Our favourite panel estimates indicate that an additional year of parentaleducationincreasessons'weeklywagesby11.7%aftertwentyyearsofexperienceandthat71%ofthiseffectemergesduringthecareer.Weshowthatthiseffectholdsirrespectiveofindividualabilities, and it appears the result of both a glass ceiling effect, due to the complementaritybetweenparental education and son’s abilities, and a parachute effect, associatedwith familylabourmarketconnections.
Keywords:IntergenerationalInequality;ParentalEducation;Experience‐Earningsprofiles;HumanCapital.
JELcodes:J62;J24;J31.
2
1.INTRODUCTION
Intergenerational inequality in socio‐economic attainments has usually been studied
throughthelensofhumancapitaltheory.Alargebodyofempiricalresearchhasmade
this view prominent, showing that parental characteristics play a crucial role in the
formationofthevariousskillsonwhichlabourmarketsuccessdepends(e.g.,Beckerand
Tomes, 1979 and 1986). Thanks to the availability of new datasets that link parents’
characteristics to their children’s labour market outcomes, recent research has
broadenedthisviewandindicatedtheexistenceofother,moredirectchannelsthrough
whichparentsmayinfluencetheirchildren’soutcomes,suchas jobreferrals,nepotism
andthetransmissionofemployers(e.g.,Magruder,2010;CorakandPiraino,2011).
Thispapercontributesto thisgrowing literaturebyanalysingthe lifelong incidenceof
parentalbackgroundonchildren’searningsforcohortsofItalianmenwhoenteredthe
labourmarket between1975 and 2000. Italy is an intriguing country for research on
intergenerational inequality: on theonehand, it has oneof the lowest levels of social
mobilityamongdevelopedcountries(Corak,2013);ontheotherhand,ithasatuition‐
freeandratheregalitarianeducationalsystem(Checchietal.,1999).Inaddition,Italyis
wellknownasa countrywhere family connectionshavea considerableeffectonboth
jobfindingratesandtheprobabilityofachievingprestigiousoccupations(particularlyin
liberal professions; Pellizzari et al., 2011; Aina and Nicoletti, 2014). In recent
comparisonsacrossEUcountries,therelativelylowsocialmobilityofItalyandSpainis
partiallyalsoexplainedbyaparachuteeffect,whichensuresawagepremiumtowell‐off
individualswhoendupinlow‐andmedium‐paidoccupations(RaitanoandVona,2015).
To investigate the direct influence of parental background on children’s experience‐
earnings profiles and the mechanisms shaping this influence, this paper resorts to a
uniquelongitudinaldatasetthatcontainsinformationonfamilybackground,educational
attainmentanddetailedindividualworkinghistories.Theimpressivelengthofourpanel
allows us to estimate the direct influence of parental background conditional on
effective experience levels, individual abilities and education.The first contributionof
this paper is the use of panel data techniques to unravel the crucial importance of
parental background on workers’ experience‐earning profile. Our favourite estimate
showsthataftertwentyyearsofexperience,thedirecteffectofparentalbackgroundon
3
children’searningis11.7%,and71%ofthiseffectisformedduringtheworker’scareer
ratherthanbeingdependentonpre‐labourmarketconditions.
However, standard panel data techniques are not enough to disentanglewhether the
direct influenceofparentalbackgroundonexperience‐earningprofilespassesthrough
better unobservable skills and thus learning capacities or through family ties used in
findingbetter jobsor ingettingpromotionswithin thesame job.Wepropose to solve
this identification problem using the very general theoretical claim (which is also
empirically well grounded; Cunha and Heckman, 2007) that parental background
children’s idiosyncraticabilitiesindependentofbackgroundarecomplementaryinputs
in the formation of individual skills and learning capacity. Operating under this
assumptionandusingquantileregressionfixedeffects,weexpecttoobserveastronger
parentalbackgroundeffectinthetopoftheabilitydistribution,i.e.,aglassceilingeffect.
In addition,weexpect toobserve that steeper experience‐earningprofiles forwell‐off
childrenareprimarilyconcentratedwithinthegroupofhighlyeducatedworkers,where
such ability‐background complementarity is magnified. The fact that we observe the
coexistenceofaglassceilingeffectatthetopoftheabilitydistributionandaparachute
effectatthebottom(i.e., forpeopledescendingtheeducational ladderrelativetotheir
parents) gives empirical substance to the claim that family connections matter in
misallocating talents in the Italian labour market. Although this evidence is not
conclusive absent an exogenous shock that asymmetrically affects abilities and family
connections,ourresearchopensanewavenuetoidentifythemechanismthroughwhich
parentalbackgroundinfluenceschildren’slifelongoutcomes.
Itisworthnotingthatourpaperdiffersfrompreviousresearchthatattemptstoidentify
the influence of family connections in finding good jobs: we do not resort to self‐
reported measures of relatives’ help. Instead, we combine the simple theoretical
assumptionofability‐backgroundcomplementaritywiththepossibilitytoconditionour
estimatestoindividualabilitiestodisentangletheglassceilingandparachuteeffects.
Theremainderofthepaperisorganisedasfollows.Thenextsectionpresentsthemain
advantages of our dataset to study the lifelong influence of parental background on
children’searnings.Section3presentspreliminaryevidenceofhowthepointestimates
of the parental background effect keeps increasing along the career path. Section 4
sketches in detail the empirical strategy and the conceptual framework used to
4
disentangle the two mechanisms at work. Section 5 discusses the main results, and
Section6brieflyconcludes.
2.DATA
Theavailabilityofalongitudinaldatasettrackingalargeportionofworkinghistoriesfor
individualswithdifferent familybackgrounds represents the essential requirement to
investigatetheroleplayedbyeducationandparentalbackgroundinshapingreturnsto
experience.A recentlybuiltdataset calledAD‐SILCsatisfies this essential requirement
becauseittracksItalianworkersforanaverageof15.2yearsandcontainsinformation
aboutchildren’sandparents’education.AD‐SILCistheresultofamatchbetweentheIT‐
SILC 2005 cross‐sectional sample (i.e., the Italian version of the 2005 wave of the
European Union Statistics on Income and Living Conditions ‐ EU‐SILC) and the
administrative longitudinal records provided by the Italian National Social Security
Institute (INPS).1In particular, the cross‐sectional variables collected in the IT‐SILC
2005havebeenenrichedby the individual social security recordssince theirentry in
thelabourmarketupto2009.Inanutshell,thisnewdatasetenrichestheverydetailed
informationonworkinghistoriesthatcanbeobtainedfromthesocialsecurityarchives
(e.g.,earningsandworkers’status)withtime‐invariantcharacteristicsrelatedtofamily
backgroundandeducation.
For the purpose of this study, AD‐SILC has other remarkable strengths. First and
foremost,ourdataallowforaprecisereconstructionofworkers’effectiveexperience.As
shownbyBlauandKahn(2013),relyingoneffectiveratherthanonpotentialexperience
oronsurveydataresponsesiscrucialtocorrectlyanalysethereturnstohumancapital
accumulation.2Moreindetail,becausealltypesofworkersareobligedtoenrolinsocial
security,wecanreconstructalltheindividualworkinghistories,distinguishingbetween
inactivity periods and changes in employment status (e.g., employment, self‐
employment, and unemployment). Thus, our panel is free from any attrition, and it
1IT‐SILC2005hasbeenmergedwiththeseveralarchivesmanagedbyINPSthatcollectinformationforalltypes of workers: private employees, public employees, parasubordinate workers (i.e., individualsformally acting as self‐employed workers but usually working as employees), farmers and all self‐employedcategories(i.e.,craftsmen,dealersandthevariousgroupsofprofessionals).2Potential experience is computed as the difference between the year of the last graduation and theworker’s age, under the assumption that there are no career interruptions. In addition, potentialexperienceismeasuredinyearsratherthaninweeks.
5
allowsustocomputeeffectiveexperienceasthesumoftheweeksspentworkingasa
privateemployee,apublicemployeeoraself‐employedworker.3Inaddition, the INPS
archivesidentifythefirmforwhichanindividualworks,thusallowingustoobservejob‐
to‐job transitions, firmchangesand firm tenure. Ingeneral,AD‐SILCallows fora fine‐
grained decomposition of working histories into several detailed episodes. This
advantage will be exploited to disentangle the mechanisms through which parental
educationaffectstheexperience‐earningprofile.
To the best of our knowledge, AD‐SILC is one of the few datasets available
internationally that combines detailed information on working histories and family
characteristics. Similar data are primarily available for highly mobile Scandinavian
countries and partially for the UK, as the population sampled in the National Child
Development Survey and in the British Cohort Study are getting older (Gregg et al.,
2014),butnotfortherelativelyimmobileMediterraneancountries.
Our primary estimation sample is selected to minimise the influence of confounding
factorsthatarelikelytoaffectourestimatesofthereturnstoexperienceandeducation.
Firstofall,weconsideronlymalestoovercomedifficultiesassociatedwiththedifferent
labour supply behaviours across genders. Second, we use only private employees
because incomesearnedbyothercategoriesare likely tobereportedwithsubstantial
measurement error. Unlike private employees’ earnings, self‐employed incomes are
plagued by underreporting and truncation in the administrative archives, whereas
reliableearningsforpublicemployeesandparasubordinateworkershavebeenavailable
in INPS archives only since 1996. However, it is worth recalling that periods spent
workingaspublicemployees,parasubordinatesandself‐employedworkersareincluded
inthecomputationofeffectiveexperience,whichcanbeconsideredasufficientstatistic
oftheentireworkhistory.
In this paper,we use the cohorts ofmaleswho entered the labourmarket as private
employeesbetween1975and2000andobservetheirworkingcareeruptotheendof
2009.4We identify the entry year as the first year with a private employment spell
lastingatleast13weeksandatanagenoyoungerthan15andnohigherthan34.For
3ConsistentwiththeItalianrulesaboutcontractualseniority,effectiveexperienceiscomputedincludingweeks spent receiving sickness or parental allowances or being temporarily suspended by the firmwithoutbeingfired(receivingtheso‐calledCassaIntegrazioneallowance).4Note that possible periods spent working as a public employee or a self‐employed before 1975 areincludedinthecomputationofindividualexperience.
6
each year,we considerworkers aged 15‐64.We exclude from the sample individuals
who do not have Italian citizenship because the retrospective dataset has
underrepresented immigrants in past years (the panel is developed starting from the
residentpopulationin2005).
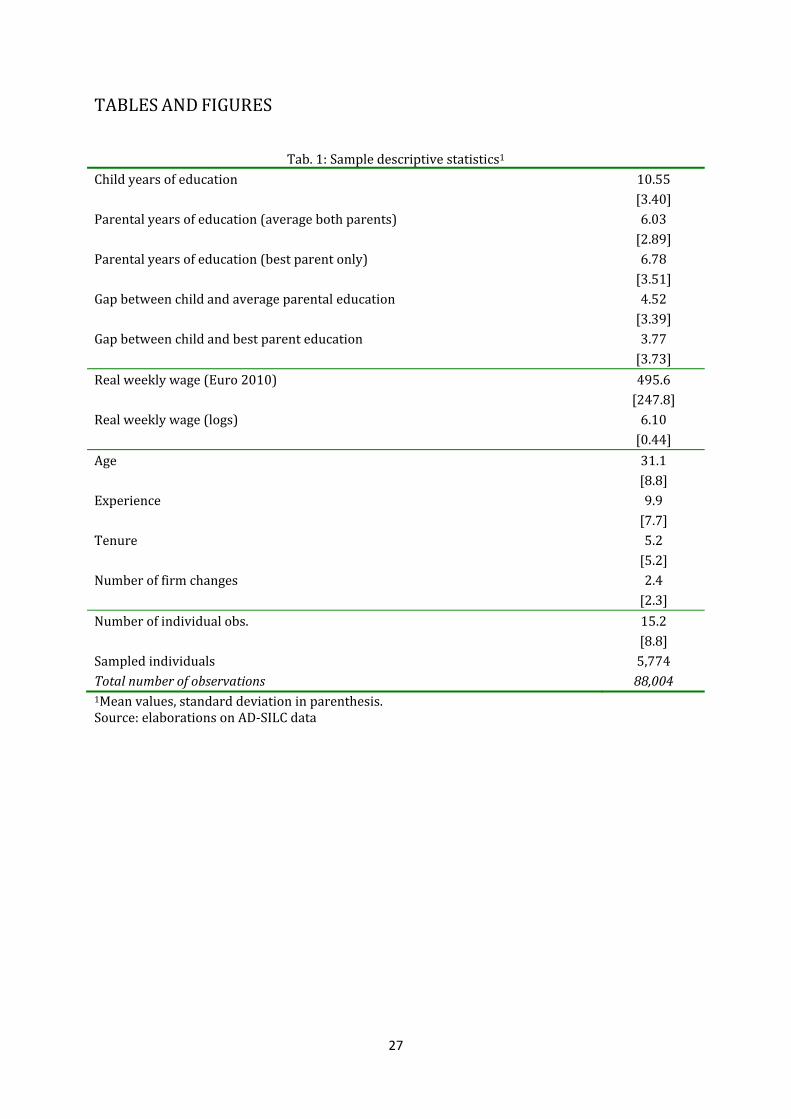
The final sample is composed of 88,000 longitudinal observations concerning 5,774
individuals. Table 1 shows that the longitudinal size of the sample is remarkable: the
mediannumberofindividualobservationsis16,while75%ofthesampleisfollowedfor
at least8years,and90%is followedforat least5years.Giventhesmallaveragefirm
size, Italian workers experience substantial mobility across firms throughout their
career: themean value of the number of firm changes experiencedby the individuals
trackedinoursampleis2.4.Asaconsequence,tenureinaspecificfirmissignificantly
lowerthanthetotalexperienceinthelabourmarket(onaverage,5.2vs.9.9).
Ourmainvariablesof interestaremeasuredas follows.Thedependentvariable is the
logofgrossweeklywages fromprivateemployment (includingpersonal incometaxes
andemployees’socialinsurancecontributions),computedbydividingthetotalearnings
ofthelongestworkingepisodeasaprivateemployeeinayearfortherelatedworking
weeks.Wagesareconvertedto2010constantpricesusingtheconsumerpriceindex.To
reduce the effect of outliers, the top 0.5% and the bottom 1% of the weekly wage
distributionineachyeararedropped.Weuseweeklywagesratherthanannualwages
because they are a better proxy of aworker’s productivity. In addition, usingweekly
wages depurates from the influence of family background on labour supply decisions
andontheprobabilityofbeingunemployed,thusallowingouranalysistobefocusedon
heterogeneityinthereturnstoexperiencedependingonfamilybackground.
FollowingHudson and Sessions (2011),we use the average years of education of the
father and themother as proxy of family background. Because ameasure of parental
earnings is absent in the EU‐SILC, education is usually considered the best proxy of
parental characteristics (e.g., Chevalier et al., 2013). Although this proxy is less
informative than parental income, it is the bestway to capture both parental earning
potentialandtheparentalcapacity to transferhumancapital.Educationalattainments
areconvertedtoyearsofeducationtobeparsimoniousandestimateasinglecoefficient.
Oursampleconfirmsthatinthelastcentury,Italyexperiencedaclearimprovementin
itspopulation’seducationalattainment(Checchietal.,2013).Comparedtotheaverage
7
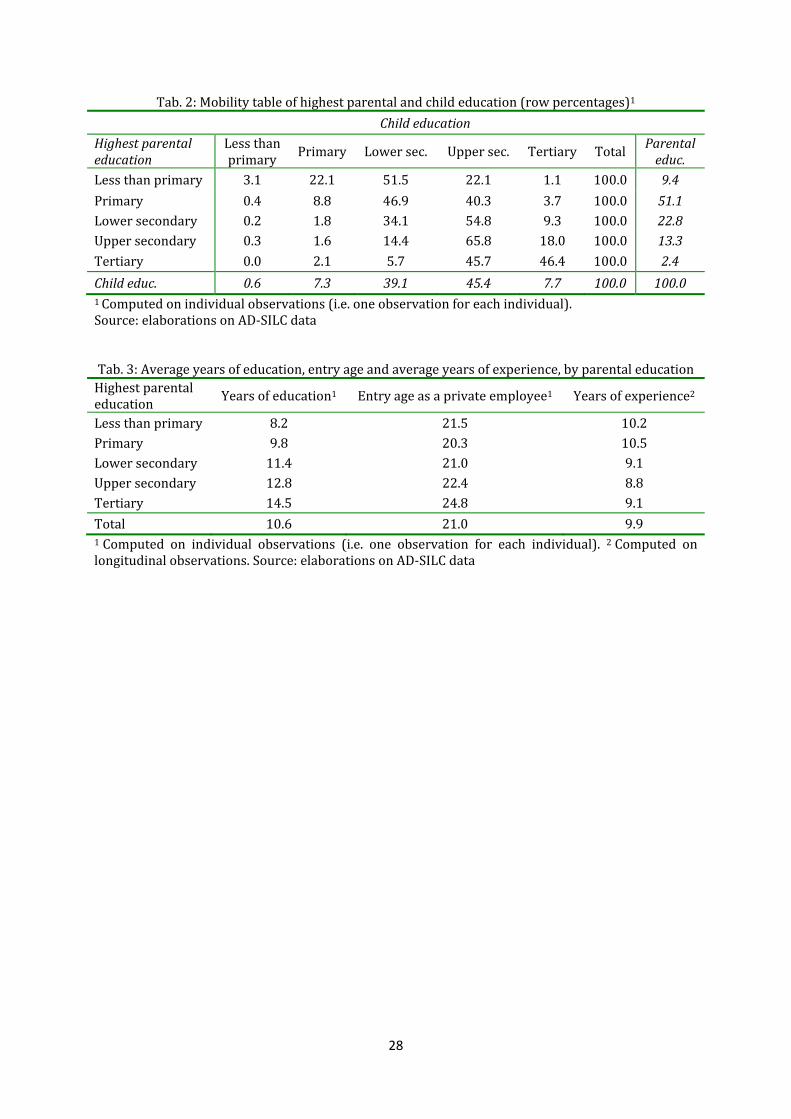
parental education, sons’ education increased by 4.52 years (Table 1). Looking at the
marginaldistributionofthehighestparentaldegreeinTable2,60.5%achievedatmost
a primary degree, whereas only 13.3% and 2.4% attained, respectively, an upper
secondaryandatertiarydegree.Conversely,theshareofthosehavingattainedatmosta
primarydegreewasreducedto7.9%inthechildren’sgeneration,whereasthesharesof
uppersecondaryandtertiarygraduatesrose,respectively,to45.4%and7.7%.However,
inspiteoftheincreaseineducationalattainment,theassociationbetweenparentaland
children education remains large. Indeed, Table 2 shows that children’s education is
highlycorrelatedwiththeirparents’education.
Table3presents thedescriptivestatisticsonthecareerstepsofchildrenwithparents
withdifferenteducation.Becausechildren’syearsofeducationsteadily increaseswith
parentaleducation(Column1),thosecomingfromaworsebackgroundenterthelabour
market,onaverage,atalowerage(Column2).However,worse‐offchildrenexperience
more frequent employment interruptions, as highlighted by the fact that the gap in
effective years of experience in the labourmarket ismuch lower than the gap in the
entry age. For instance, children of tertiary graduates start to work, on average, 4.5
years later than children of primary educated parents, but the corresponding mean‐
distanceineffectiveexperienceshrinksto1.4years.
3.EARNINGSGROWTHBYPARENTALBACKGROUND
Aswidelyrecognisedinboththeoreticalandempiricalliterature,individualwagesgrow
with labour market experience, and most importantly for the aims of this paper,
experience‐earning profiles are steeper for highly skilledworkers.5A large fraction of
thissteeperprofile isexplainedbyendogenousworkers’mobilityandisbecause,over
theircareer,high‐abilityworkersaremore likelytobematchedwithmoreproductive
firms.Likewise,asteeperexperience‐earningsprofileforhighlyskilledworkersreflects
differences in learning capacity between skilled and unskilled workers and the
cumulativenatureofskillformationalongthelifecycle.
Parental background can cause returns to experience to be highly correlated with
unobservableworkerskillsandtheconnectionsuseful to findagood job.However, to5SeeRubinsteinandWeiss(2006)foraliteraturereviewofthetheoreticalmechanismandtheempiricalevidenceandmethods.
8
the best of our knowledge, andwith the exception of the short paper of Hudson and
Sessions(2011),nostudieshavedirectlyinvestigatedtheeffectofparentalbackground
ontheshapeoftheexperience‐earningsprofile.
In theempirical literatureon intergenerational inequality (Bjorklundand Jantti,2009;
Blanden,2013),thisissuehasbeenaddressedindirectlybyassessingthepotentiallife‐
cycle bias in the estimate of the intergenerational elasticity β between children’s and
parents’ incomes. In particular, it has been shown that an estimation bias is likely to
emergebecause theassociationbetweenchildren’scurrentand lifetime incomevaries
overthelifecyclewhenreliablemeasuresoflifetimeincomesaredifficulttoretrievefor
both generations (Haider and Solon, 2006;Grawe, 2006).6Theusual rule of thumb to
solvethisproblemistochooseanageforwhichthedifferencebetweenthecurrentand
lifetime income isminimised,which is approximately 40 years formales (Haider and
Solon, 2006). However, Nybom and Stuhler (2011) have recently shown that
approximating lifetime earnings based on annual earnings at a certain age does not
remove the lifecycle bias because idiosyncratic deviations from average profiles are
correlated with family background. Therefore, as heterogeneity in income profiles is
intrinsicallydependentonfamilybackground,theageatwhichthegapbetweenannual
and lifetime earnings is minimised crucially depends on family background itself,
makingitexceedinglydifficulttoreducethebiasintheβ.
Thispaperseekstofillthisgapintheliteratureanddirectlyinvestigatestheinfluenceof
parental background on returns to experience. Before carrying out proper panel
estimates (see next sections), it is interesting to provide a preliminary descriptive
pictureof the associationbetween children’s earnings andparental backgroundalong
the career path. As stated in Section 2, our dataset does not record information on
parents’ incomes; thus, the β elasticity cannot be properly estimated. However, we
mimic these estimates using parents’ education as proxy of background.We let the β
dependonexperiencebyrunningasetofOLSestimatesatthedifferentyearsoflabour
marketexperience.Moreprecisely,weuseourpooledpanelandestimateforeachlevel
ofexperiencethesimplerelation:
6Heterogeneityinearningsgrowthacrossindividualsisusuallyconsideredtobeduetotheheterogeneityinhumancapitalinvestment.Indeed,theestimatesoftheintergenerationalelasticitieswouldbebiasedifyoung children were observed because earnings profiles are steeper for more educated children andchildren’seducationisassociatedtoparentalbackground.
9
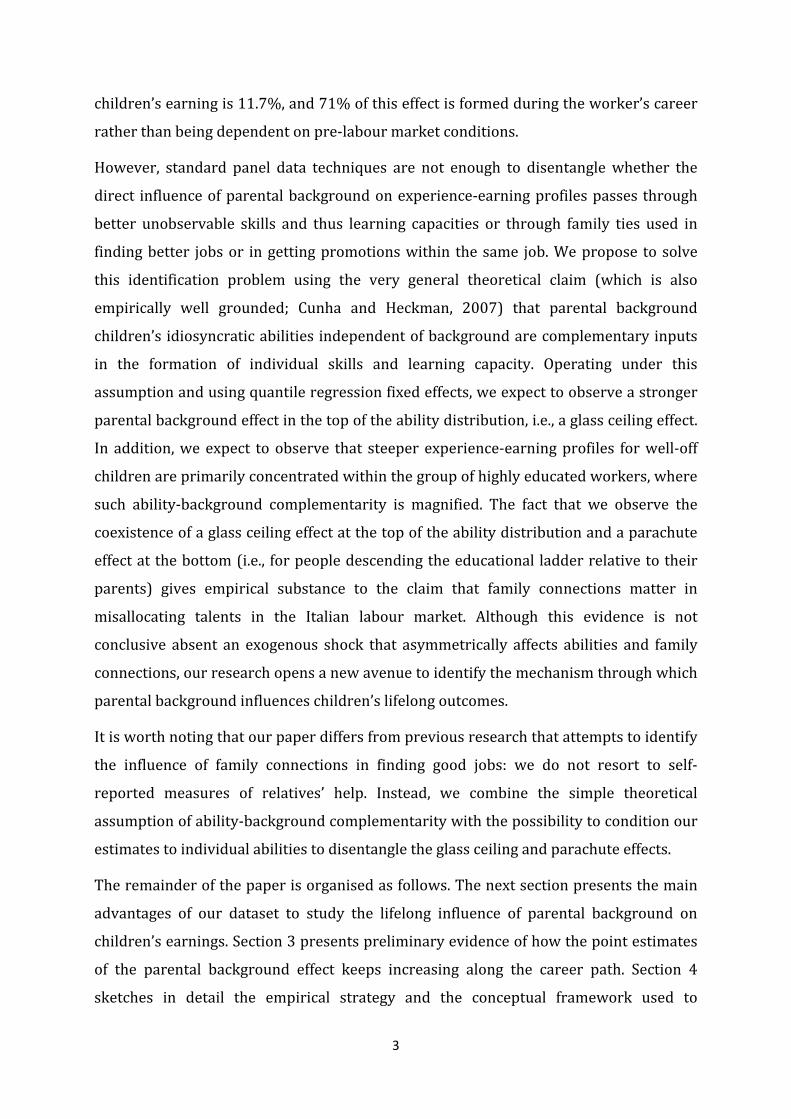
log α β ∙ _ δ ε ;∀ 1, 25 (eq.1)
wherelog is log of gross weekly wage, _ is parents’ average years of
educationandδ isadummythatequalsoneiftheindividual ihasreachedexperience
levelxatyeart.
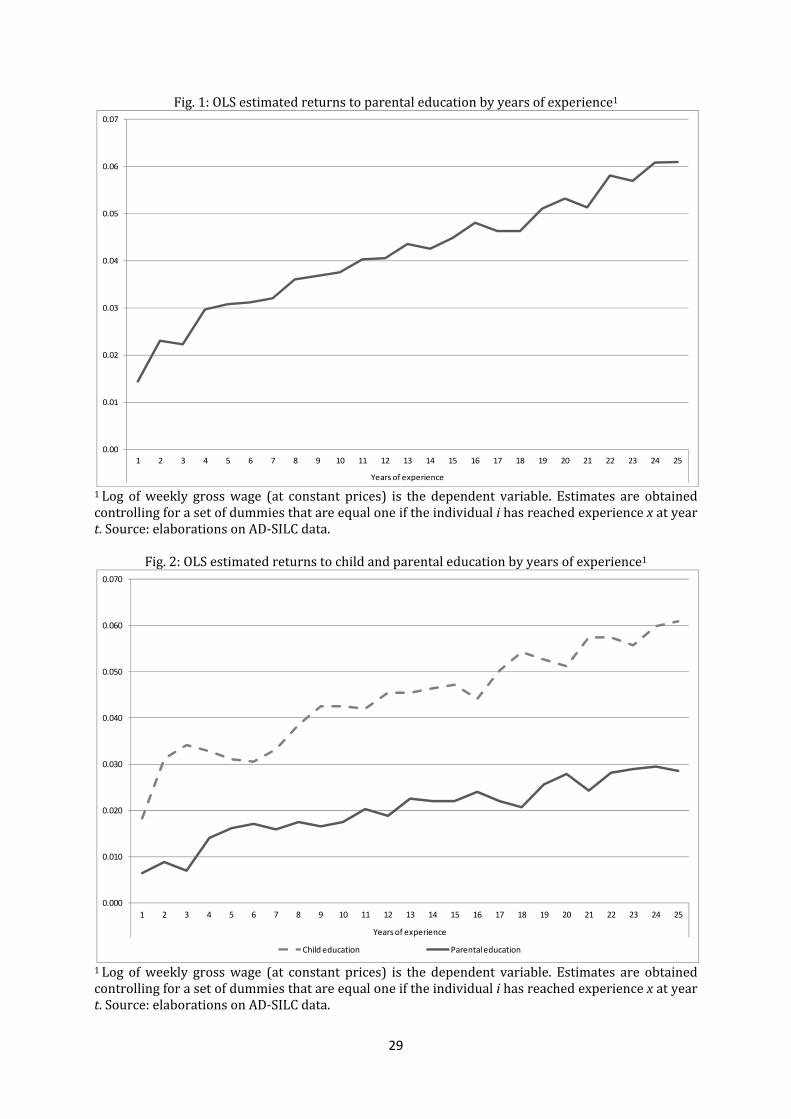
Figure 1 presents the estimates of equation (1) for each experience level. This figure
clearlyshowsthat:1.parentalbackgroundisassociatedwithsignificantlyhigherweekly
wages,and2.theestimatedβincreasessteadilywithsons’experience.Remarkably,this
second finding indicates that the influence of parental background never declines or
stabilises around a certain value. Rather, it continues to grow during the sons’ entire
career.Thecumulativenatureofskillformationcanaccountforthispatternaslongas
children’s education is strongly dependent on their parents’ education (Hertz et al.,
2007).
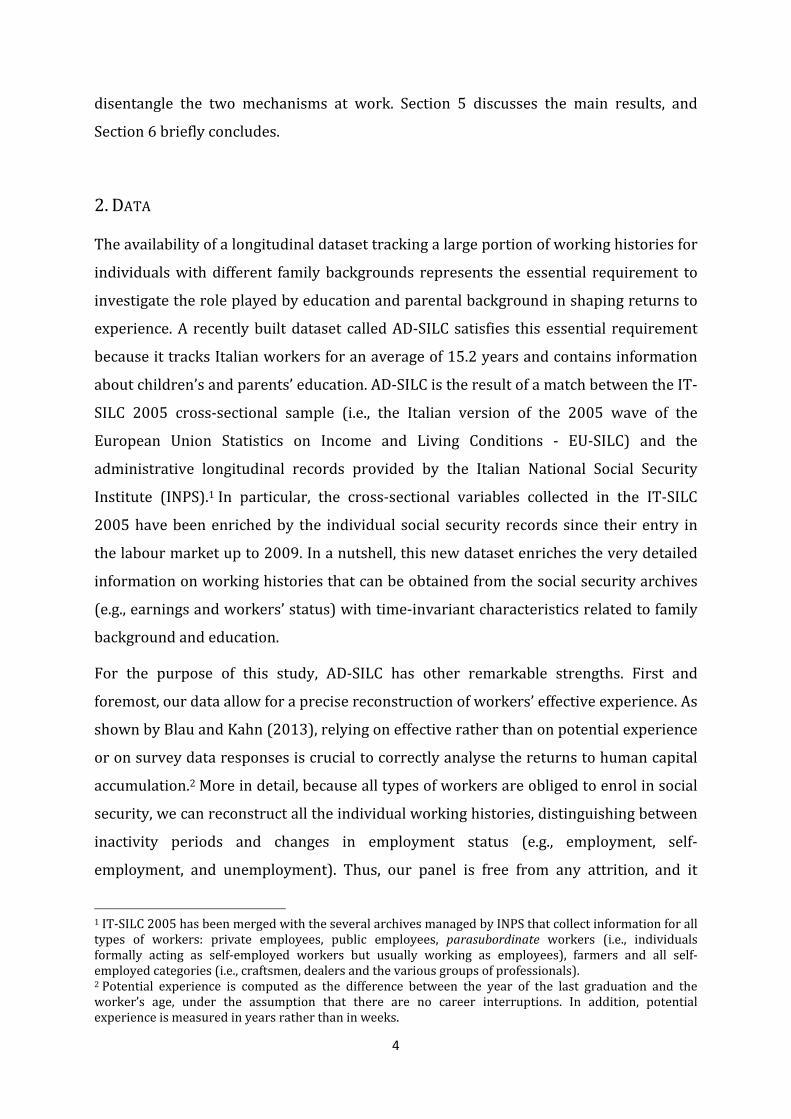
Toprovidepreliminaryinsightsonthishypothesis,Figure2presentstheresultsofthe
same regression augmented for the sons’ owneducation, alsomeasured in years.The
main result is that the β keeps increasing with children’s experience, although at a
slowerpace thanthatshown inFigure1.Alsonote that in thiscase, theβsarealways
statistically significant. Returns to children’s education also increasewith experience,
confirming the key role of cumulative skill formation (Cunha andHeckman, 2007). In
turn, the emergence of a direct effect of parental background when controlling for
children’seducationisadistinctfeatureofallunequalEuropeancountriesasopposedto
more equal ones (Raitano and Vona, 2015). This direct influence is more difficult to
explain and requires further analyses to disentangle whether it depends on
unobservableabilitiesorothermechanisms.
In sum, our preliminary evidence is consistent with the hypothesis of an irreducible
heterogeneity in earning profiles, as dependent on both parents’ and children’s
education(NybomandStuhler,2011). Innextsection,wepresentasimpleconceptual
framework to guide structured empirical analyses capable to shed some light on the
mechanisms underpinning this persistent influence of parental education on sons’
earnings.
10
4.CONCEPTUALFRAMEWORKANDEMPIRICALSTRATEGY
Human capital accumulation is usually considered the main channel through which
parental backgroundinfluenceslifetimeearnings(BeckerandTomes,1979and1986;
Solon, 2004). Parental background is likely to affect human capital accumulation
through different channels (e.g., educational choices, peer effects, different schooling
quality;Benabou,1996;Dustmann,2004;Bratsbergetal.,2007)whose influencemay
bemediatedbyon‐goingeducationalpolicies(Schuetzetal.,2008).Tobesure,notonly
dowell‐offchildrenremainlongeratschoolonaverage(Hertzetal.,2007),buttheyalso
outperformotherchildrenintestscoresatagivenschoollevel(FuchsandWoessmann,
2007) and benefitmore from extra‐schooling activities (Duncan andMurnane, 2011).
More important, the cumulativeness in skill formation makes early‐age investments
crucial (Cunha and Heckman, 2007) and thus increases the likelihood that well‐off
parentshaveapersistentinfluenceontheirchildren’slabourmarketoutcomesthrough
abetterlearningcapacity.Thisearlylifeinfluenceisparticularlyimportantforcognitive
skills onwhich labourmarket success strongly depends. In addition to core cognitive
skills,parentalbackgroundcanaffectchildren’slabourmarketoutcomesinotherways.
Indeed, well‐off parents transfer to their children soft skills and a network of social
relations that could prove extremely useful in finding good jobs and reducing the
unemploymentrisk.
Theempiricalidentificationofthemechanismsthroughwhichparentalbackgroundcan
affectchildren’slabourmarketdynamicsandearningsisexceedinglydifficult,butitcan
befacilitatedthroughtheuseofasimpleillustrativeequationgoverningtheprocessof
skill formation.Under a quite general assumption, such an equation helps distinguish
between the two empirically unobservable components through which parental
backgroundcaninfluencechildren’searnings:additionalcognitiveabilitiesvs.network
andsocialrelations.
Letusassumethatindividualskills, ,areanadditivefunctionoffamilybackground, ,
and of an idiosyncratic ability shock orthogonal to background, . A general way to
writesuchaskillproductionfunctionis:
(eq.2)
11
where , , areparameterscapturingtheintensityof,respectively,apurebackground
effect,anabilityeffectandthebackgroundeffectconditionalonchildren’sability.Inline
with leading researchon skill formation (e.g., CunhaandHeckman,2007),Equation1
assumes that and are complements in the production function of skills and thus
thattheautonomouseffectofparentalbackgroundonskillsismagnifiedinpresenceof
highly idiosyncratic abilities. When allowing skills to influence earnings dynamically
throughlearningandjobchanges,thewageofindividualiattimetcanbewrittenas:
1 (eq.3)
wherelabourmarketexperience isinteractedwiththethreecomponentsoftheskill
vector. The coefficients denoted with “1” capture the influence of skills on earning
potential, whereas the coefficients denoted with “2” capture the influence along the
workingcareer.The latter typicallyoccurs throughon‐the‐job learningand(voluntary
andinvoluntary)jobchanges.
OurexpectationsonthesignofthecoefficientsinEquation(3)arethefollowing.First,
thepureabilityeffectsarereasonablyexpectedtobepositiveandsignificant.Second,we
shouldexpecttoobserveastrongcomplementaritybetweenabilityandbackgroundin
the accumulation of cognitive skills (Cunha andHeckman, 2007). This implies that
and arebothexpectedtobepositiveandsignificant.Third,undertheassumptionof
complementarity between background and ability, we should expect the autonomous
background effects and to be near zero and statistically insignificant unless
parentalbackgroundexertsastrong influenceonearningsthrough familyconnections
andinheritedsocialcapital.
In Southern European countries, family ties and networks often play a major role
(Checchietal.,1999;Guell etal.,2007), affecting theprobabilityof findingagood job
andother labourmarket outcomes (Granovetter, 2005).For instance, familynetworks
canensuregoodjobstolow‐abilityindividuals,eventhosewithpoorlevelsofschooling
or abilities (Raitano and Vona, 2015). As a result, the autonomous effect of parents'
educationonchildren’searningsislikelytobepositiveandparticularlystrongalongthe
workers’career(i.e., 0).7
7Theliteratureontheinfluenceoffamilynetworksinthelabourmarketsisgrowingfast(e.g.,Pellizzari,2010;Magruder,2009;KramarzandNordstromSkans,2013;AinaandNicoletti,2014;CorakandPiraino,2011;Marcenaro Gutierrez et al., 2014). However, this literature usually focuses on the probability of
12
The direct empirical counterpart of Equation (2) is the empiricalmodel proposed by
HudsonandSessions (2011),whichhas theadvantageofallowing the impactofwork
experience to explicitly depend on parental education. We estimate the following
Mincerianequation:
log _ (eq.4)
wherelog is the log of weeklywages8, is a standard error term, is a set of
usual controls in wage equations9, and is a third‐order polynomial in effective
experience(measuredinweeks),i.e.,∑ .Ourmaincoefficientofinterestisthatof
the interaction between parental background and experience, . This coefficient
captures the labourmarket effect of parental background,while reflects the better
earningpotentialofwell‐offchildren,independentlyoftheirexperience.
ThestructureofourdataallowsustoexpanduponHudsonandSessions’specification
in two important ways. First, our very accuratemeasurement of effective experience
greatlyreducesthemeasurementerrorbiasthataffectstheestimatesoftheinteraction
betweenexperienceandparents’education.Second,wecanexploitthepaneldimension
to include individual effects . The inclusion of individual effects mitigate the usual
concernthattheinfluenceofunobservableskillsmayresultinabiasedestimationof
because these unobservable skills are likely to be correlated with lifetime earning
potentialandparents’education.
As a further departure from Hudson and Sessions’ specification, we also estimate
Equation(4)includingchildren’seducationandaninteractiontermbetweenchildren’s
educationandexperience.Thisallowsustodistinguishbetweenadirecteffectandan
indirecteffectofparents’education,actingthroughformaleducation.Becauseweexpect
children’s education tobemore strongly correlatedwitheffectiveworkers’ skills than
parents’ education, this augmented version of Eq. 4 represents a starting point to
interpretourcoefficientsofinterest.Alternatively,wedistinguishbetweenfathers’and
mothers’ educationunder the assumption that the former ismore strongly correlatedfindingagood job throughself‐reported familyhelp,whereas in thispaper,we investigate theeffectoffamilybackgroundonearnings.8IntheAppendix,weshowthatourresultsholdusingannualearningsasthedependentvariable.9Inthebaselinemodel,thevectorXcontainsthefollowingvariables:age,agesquared,numberofweeksworkedintheyear,dummyforpart‐timeworkintheweek,regionaldummies,cohortdummiesandyeardummies.Inaugmentedspecifications,wealsoincludesectordummiesandthelogoffirmsize(availableinthedatasetsince1987),tenureandotherproxiesofworkerhistory(i.e.,whitecollardummy,periodsspentreceivingunemploymentsubsidiesorbeingtemporarilysuspendedbytheemployer).
13
with family networks and labourmarket nepotism and the latterwith abilities (Chen
and Feng, 2009). However, although these augmented specifications offer interesting
insights, it appears difficult to believe that individual abilities are fully captured by
eithermothers’orchildren’seducation.
AlongthelinesproposedbyRaitanoandVona(2015),afirstdirectapproachtoaddress
these issues consists of using thedifference in the educational attainments ofparents
andsonstobuildgroupswithdifferentability‐backgroundcombinations.Theideaisto
use intergenerational educational mobility to distinguish between two types of
background‐related effects. The first type emerges because there is complementarity
between ability and parental background, and it implies thatwell‐off children should
have a better endowment of unobservable skills in correspondence to high levels of
education (aglassceilingeffect).Thesecond type isassociatedwith insurance for the
childrenofwell‐educatedparentswhofailinachievingahighqualification(aparachute
effect).Ourpartialidentificationcomesfromthefactthataglassceilingeffectislikelyto
depend on both family networks and abilities (see, e.g., Macmillan et al., 2013).
Conversely, it ishardtobelievethattheparachuteeffectcanbeassociatedwithbetter
abilities; hence, in this case, familynetworks shouldbeofparamount importance.We
implementthisideabyestimatingthefollowingequation:
log 1 1 1 1 …
(eq.5)
wherebothj(forparents)andi(forchildren)havethreemodalities:loweducation(L),
middle education (M) andhigheducation (H).Wehencedistinguishnineparent‐child
pairs (HH, HM, HL, MH, MM, ML, LH, LM, and LL) and allow the experience‐earning
profiles to be pair specific. For sons, the three groups are tertiary qualifications (H),
uppersecondaryqualification(M)andlessthanuppersecondaryqualifications(L).To
define the three correspondent groups for parents, observe that the mean education
attainmentchangeddramaticallybetweenthetwogenerations,reflectingbothchanges
in the economic structure and reforms in compulsory education (see Table 2).
Consistently,weconsiderashighlyeducatedthoseparentswhohaveatleastanupper
secondary degree. Lower secondary graduates represent themiddle group, and those
withprimaryeducationrepresentthelowestgroup.
14
Letusmakea fewexamples tounderstandhowthesegroupscanprovide insight into
thesignandthemagnitudeoftheeffectsmentionedinEquation2.ChildrenwithLHand
MH substantially improve with parent outcomes, and thus, they should have high
idiosyncratic abilities and low . For the group HH, instead, ability‐background
complementarity is expected tobemagnified. Finally, fordownwardmovers (i.e.,HM,
HL, ML), it is primarily parental background that should matter. A reward for
downwardmoverscomparedtostayersisthenlikelytoreflectbetterparentalnetworks
ratherthanindividualabilities.
A secondandmore conventional approach todisentangle the twobackground‐related
effectsconsistsofconditioningtheestimatedcoefficientsonability.Quantileregressions
allow the effects of interest to vary depending on individual abilities. We estimate
Equation(3)usingthequantilefixedeffectapproachproposedbyCanay(2011).Using
this approach, not only is our main effect of interest (i.e., ) allowed to depend on
abilities, butwe canalso account for time‐invariantunobservable skills.Although this
specification does not consent to directly recollecting the structural coefficients of
Equation(2),itprovidesindirectevidenceoftheimportanceofthevariousmechanisms
atwork.Thecoefficientsassociatedwiththepolynomialinexperiencefullycapturethe
interaction between idiosyncratic abilities and experience. In turn, the estimated
coefficient ; is thesumof thestructuralparameters and . Inspectingtheshape
ofthefunction ; ,wecaninfertherelativemagnitude(andthestatisticalsignificance)
ofthesetwocoefficients.Ifapositiveandsignificant ; isobservedincorrespondence
tolowvaluesof ,itislikelythatfamilyconnectionsensureaparachutetolow‐ability
individuals with good family background. If ; is increasing with , a glass ceiling
effect for high‐ability individuals with good background gradually emerge along the
careerpath.Recallthatifnetworksmatter,theireffectsshouldbedisplayedparticularly
during the working career, and hence, ; is expected to be positive and significant
alongtheentireabilitydistribution.
Inthefinalstepofourempiricalanalysis,weinvestigatewhetherthebulkoftheeffectof
parental educationon theearning‐experienceprofiledependson learning‐by‐doingas
opposed to endogenous job mobility. This exercise represents another way to
disentanglethemechanismsatwork.Bywayofexample,ifwell‐offchildrencanbenefit
from better connections, they are either more likely to find better jobs during their
15
career or to reduce the harmful consequences of involuntary displacement. However,
ourdatadonotallowustodistinguishbetweenvoluntaryandinvoluntaryjobchanges
by exploiting some source of exogenous worker displacements, such as firm closure
(DustmannandMeghir,2005),andthus,theresultofthisexerciseshouldbeinterpreted
withcaution.Bearing inmind these limitations,were‐estimateEquation(4) including
the interactionsofparentalbackgroundwithexperience,numberof firmchanges and
previous unemployment spells. The new interactions of parents’ education with past
unemployment and number of firm changes allow us to distinguish the influence of
parents’educationonthejobopportunitiesfacedafteraninvoluntarychangeandaftera
voluntarychange,respectively.
5.ESTIMATIONRESULTS
Theorganisationoftheresultssectionreflectsthetwogoalsofthispaper.Thefirstpart
is devoted to providing new evidence of the relationship between parental education
and experience. Ourmain novelty is the use of panel data techniques to unravel the
crucial importance of family background onworkers’ experience‐earning profile. Our
estimatesquestionthereliabilityofempiricalspecificationsthatneglecttheinfluenceof
familybackgroundalongtheworkers’entirecareer.Thesecondpart isnovel inthatit
representsthefirstattempttodisentanglethemechanismsthatleadtoapositiveeffect
ofparentalbackgroundonexperience‐earningprofiles.Tofocusonthemainmessageof
the paper, we will present tables with only the coefficients of parental background
variables.10
5.1INFLUENCEOFPARENTS’EDUCATIONALONGTHECAREERPATH
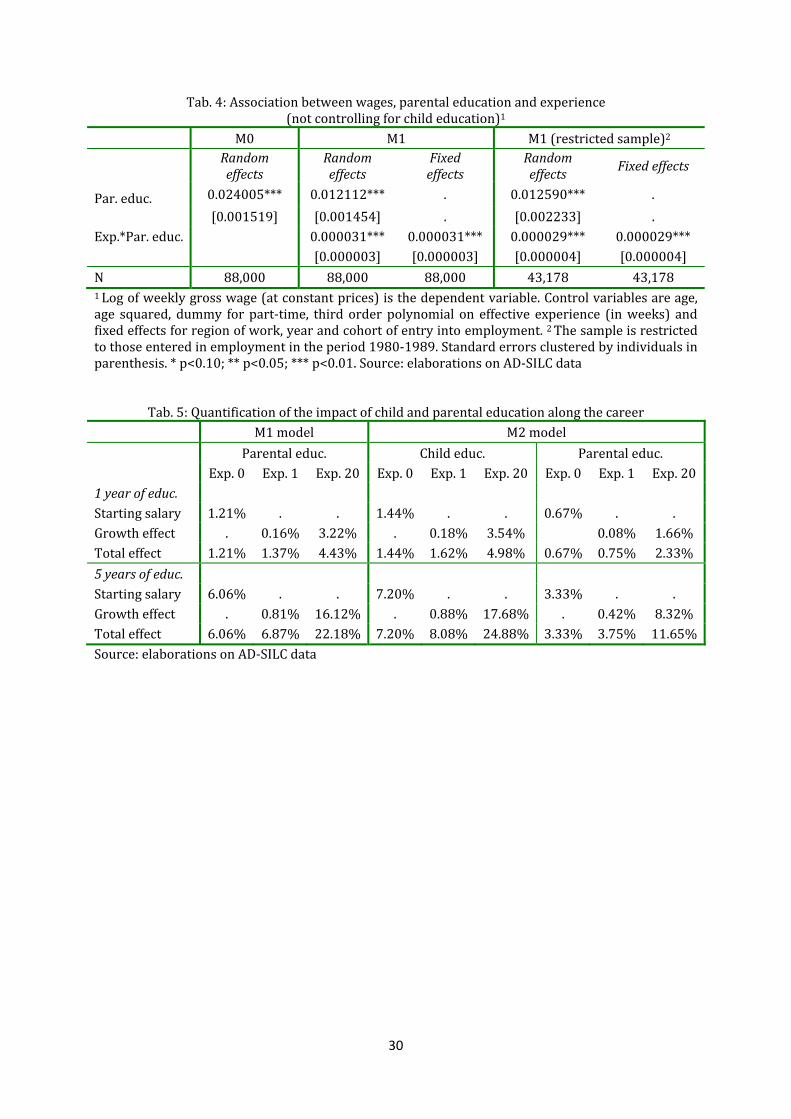
Table4reports theestimatesofEquation(3).Column1presentsasimplebenchmark
model that is estimatedwithout including the interaction betweenparents’ education
andexperience.WeestimateEquation(3)usingeitherarandom(Column2)orafixed
(Column3)effectmodel.Theformerapproachallowsustorecollectthetime‐invariant
effectofparents’educationandtocompareitwiththeeffectofparents’educationafter
labour market entry. The latter approach is more general in that it relaxes the
assumption of independence between covariates and individual effects. For these
10Resultsforothercovariatescanbeprovidedbytheauthorsuponrequest.
16
reasons,wewill keep comparing theREand theFEmodel throughout this section. In
columns4and5,werestrictourestimatestothecohortofpeoplewhostartedtowork
in the decade 1980‐1989 (and had at least twenty years of experience in 2009). This
restriction reassures us that the results arenot drivenby young individualswith low
experiencelevels.
Thefirstnotableresultisthatparents’educationhasasubstantialandsignificanteffect
on the experience‐earning profiles of Italian males. The effect is particularly stable
across specification, decreasing by only 6.5%when considering the restricted cohort.
The point estimate is quite large; a 1 year increase in both experience and parents’
education generates a 0.16% earning advantage, which corresponds to 13.2% of the
autonomous effect of parental background (see Table 5).11However, the relative
magnitudeof the twoeffects changesas experience grows. Inpanel 1 ofTable5, it is
evidentthata5‐yearincreaseinparentaleducationleadstoa22.2%earningsincrease
when the child reaches 20 years of experience. Of this effect, only 27.3% can be
attributedtothetime‐invariantcomponentoftheparentaleducationeffect.
The second result is that the autonomous effect of parents’ education on the earning
potential remains positive and statistically significant at a conventional level when
including the interaction between parents’ education and experience. This result
corroborates our claim that parental background plays a role on both phases of the
children’slife‐cycle,pre‐andpost‐labourmarketentry.
Lessobvious isthethirdresult,whichemergesfromthecomparisonoftheFEandRE
model.Remarkably,boththeFEandtheREmodeldelivernearlyidenticalestimatesof
the effect of parents’ education on the earnings profile. This has two important
implications. On the one hand, individual effects are uncorrelated with experience,
irrespective of the estimator used (FE vs. RE). On the other hand, the RE and the FE
modelareequivalentinestimatingourmaineffectsofinterest.Therefore,theREmodel
can be safely used in comparing the magnitude of the parental background effect at
differentstagesoftheworkingcareer.
Thissetofresultshastwoimportantimplicationsfortheliteratureonintergenerational
incomeelasticityandsocialmobility ingeneral.First, itraisesseriousconcernsonthe
reliabilityofempiricalmodels thatassumethe influenceofparentalbackground tobe11Recallthatexperienceismeasuredinweeks.
17
independentoflabourmarkethistories.Second,itlendssupporttothefindingofNybom
andStuhler(2011) that life‐cyclebiases inestimationsof intergenerationalelasticities
are unlikely to beminimised in correspondence to any specific point of the working
careerbecausedeviationsfromaverageprofilesarecorrelatedwithfamilybackground.
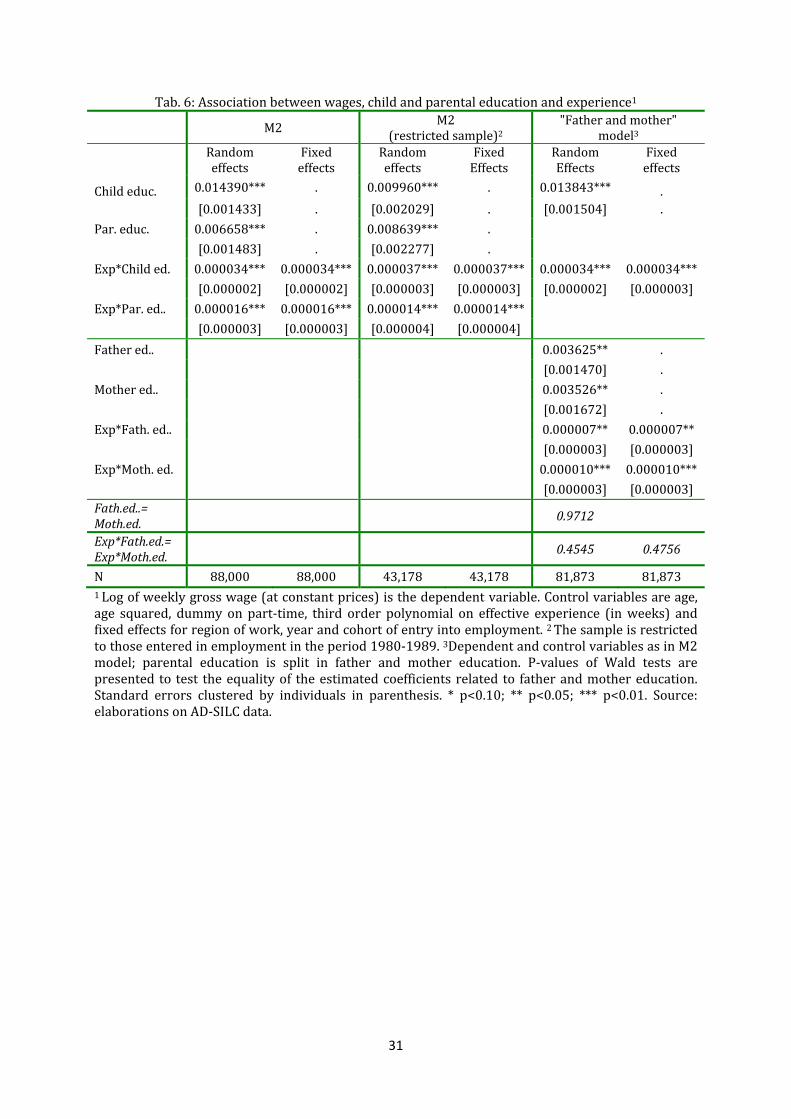
ThefirstfourColumnsofTable6replicatetheanalysisofTable4,includingamongthe
covariatesson'seducationandtheinteractionbetweenson'seducationandexperience.
This allows us to distinguish between a direct and an indirect effect of parents’
educationonearnings.Noteworthyisthatthedirecteffectsofparentaleducationhalve
but remain positive and statistically significant at the 99% levelwhenwe control for
formal education. In addition, returns to experience are significantlyhigher forhighly
educated sons. The quantifications presented in Table 5 highlight that a one‐year
increase inbothchildren’sandparents’education leadstoasizeablewage increaseof
7.3% (5% for children’s education vs. 2.3% for parents’ education), whereas the
correspondingincreaseestimatedinModel1forparentaleducationis4.4%.
InlasttwocolumnsofTable6,wedistinguishbetweenmothers’andfathers’influence
ontheirchildren’searnings.Recentliteraturesuggeststhatfathers’educationstandsfor
familytiesusefultofindagoodjob;thus,itisacandidateproxyfor ineq.2.Mothers’
educationappearstobeagoodproxyofchildren’sunobservableabilityoncecontrolling
for formal education (e.g., Altonji and Dunn, 1996). Our results indicate that both
fathers’ and mothers’ educational attainments have a significant effect on children’s
working careers, and no significant differences among paternal and maternal
coefficients emerge. The paternal and maternal effects are significant for earning
potentialand inmakingreturnstoexperiencesteeper. Inspiteof its intrinsic interest,
the extent to which this exercise is capable of identifying network and background‐
related ability effects is limited because it hinges upon the strong assumption of a
perfectcorrespondencebetweenpaternalandmaternalinfluences,ontheonehand,and
thesetwomechanisms,ontheother.
As a corollary of this first set of results, it isworth noticing the size of the estimated
effects is very robust to the inclusion of additional individual and sectorial controls,
interacting both parents’ and children’s educationwith the third‐order polynomial in
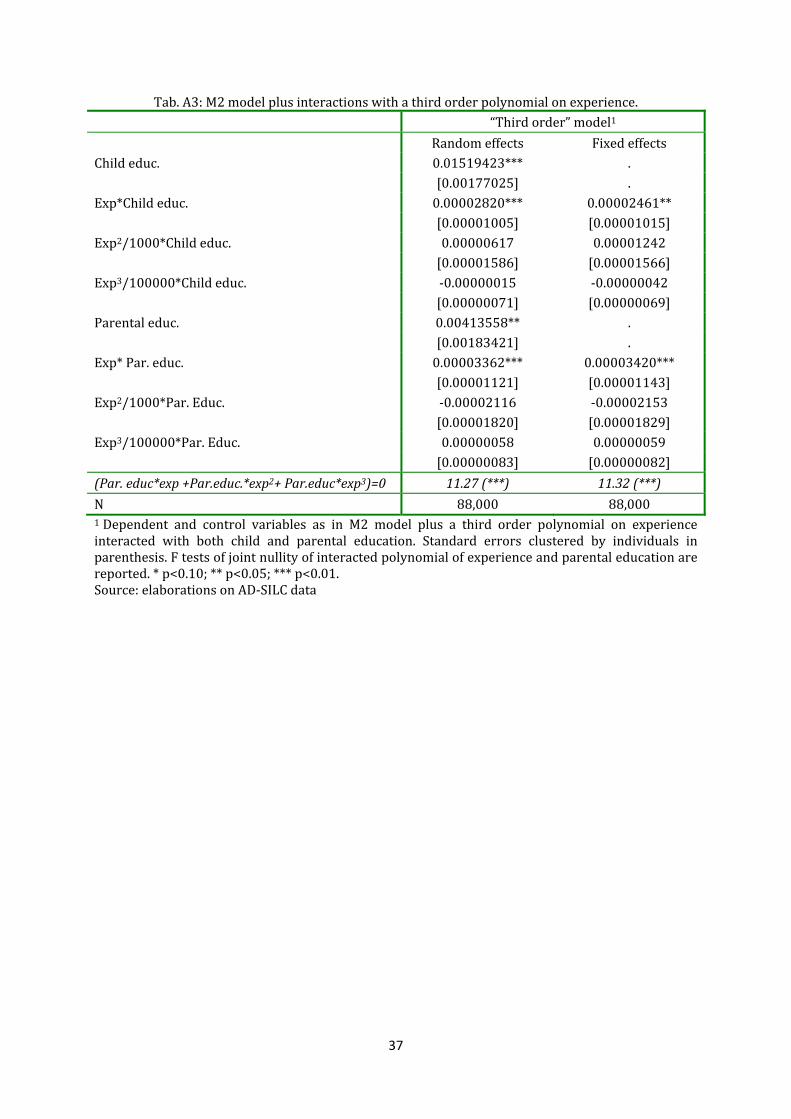
experienceorusingannualearningsasadependentvariable.Tables1A,2Aand3A in
theAppendixcontaintheseresultsinfulldetail.
18
5.2DISENTANGLINGTHEMECHANISMS
Thesecondpartofthissectionseekstodisentanglethesourcesofthelifetimeeffectof
parents’ education more rigorously. Following our empirical strategy, we report the
estimationresultsforEquation4inTable7.Estimatedcoefficientsarereportedforboth
theFEandtheREmodels,whichagainareverysimilar.TheresultscontainedinTable7
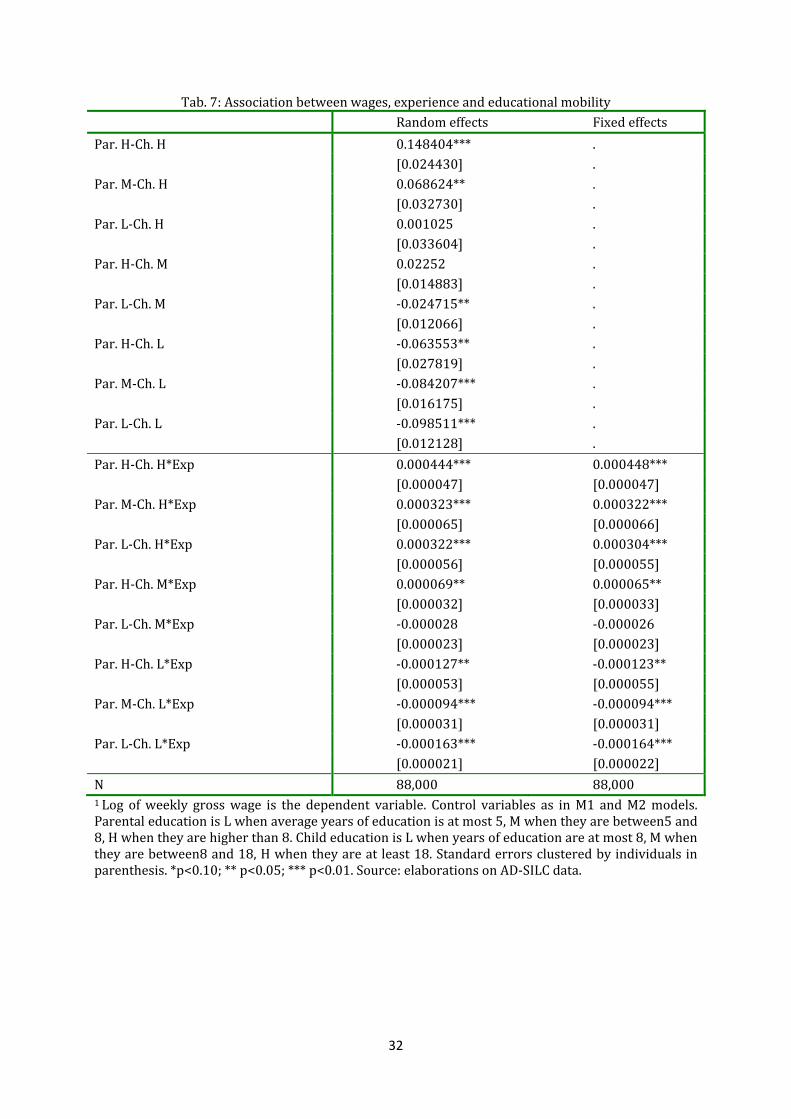
clearly indicatetheco‐existenceofaparachuteandaglassceilingeffect.Furthermore,
remarkably,bothcomponentsof theparentalbackgroundeffectareactive indifferent
phasesofthechildren’scareer.
Letusfirstobservewhathappensforhighlyeducatedsonswheretheglassceilingeffect
emerges. Highly educated sons with highly educated parents (HH) earn significantly
morethanhighlyeducatedsonsfromlessadvantagedfamilybackgroundsparents, i.e.,
those with middle (MH) or lower parental education (LH); this group shows not
significantadvantagewithrespecttothereferencegroupMM.TheadvantageoftheHH
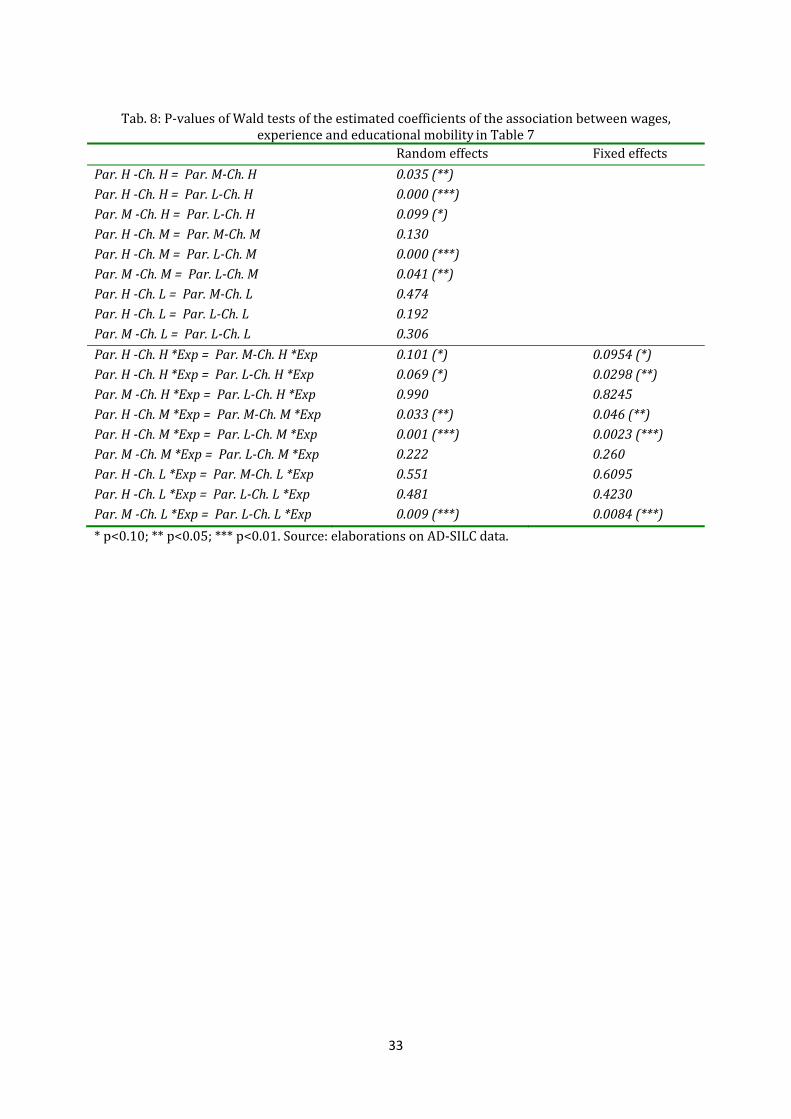
groupovertheothertwogroupsisstatisticallysignificant,asshownbytheWaldtestsin
Table 8. The overall magnitude of the glass ceiling effect is large: at twenty years of
experience, the HH group had earned 20.6 and 27.4 percentage points more than,
respectively,theMHandLHgroup.Theemergenceofaglassceilingeffectisinlinewith
the existence of a complementarity between parental background and ability, which
previous research has shown to be widespread across eight European countries
representativeofdifferentwelfareregimes(RaitanoandVona,2015).
Theparachuteeffect isobserved incorrespondenceofbothmiddle (M)and lower (L)
educationallevels,anditisclearlyamplifiedalongtheworkingcareer.Thewell‐offsons
stillgainasignificantearningadvantageovertheworse‐offsons,inspiteofthefactthat
they achieve a lower (adjusted for structural change) educational level than their
parents.Inthegroupofhighschoolgraduates,forinstance,theearningadvantageofHM
at twenty years of experience is 14.7 percentage points with respect to LM and 9.4
percentagepointswithrespecttoreferencegroupMM.Notethatthetwocorresponding
effects at zero experience were considerably smaller: 4.7 and 2.3 percentage points,
respectively. The parachute effect emerges even for sons with primary or lower
secondaryeducation.There, sonsof less educatedparents (LL) experienceanearning
penaltyofapproximately8percentagepointsafter twentyyearsofworkcomparedto
sonswithmoreeducatedparents(MLandHL).Therefore,althoughtheparachuteeffect
19
seemsslightlysmallerthantheglassceilingeffect,itstillcreatesasubstantialwedgein
thecareerprospectsofindividualswithdifferentparentalbackgrounds.
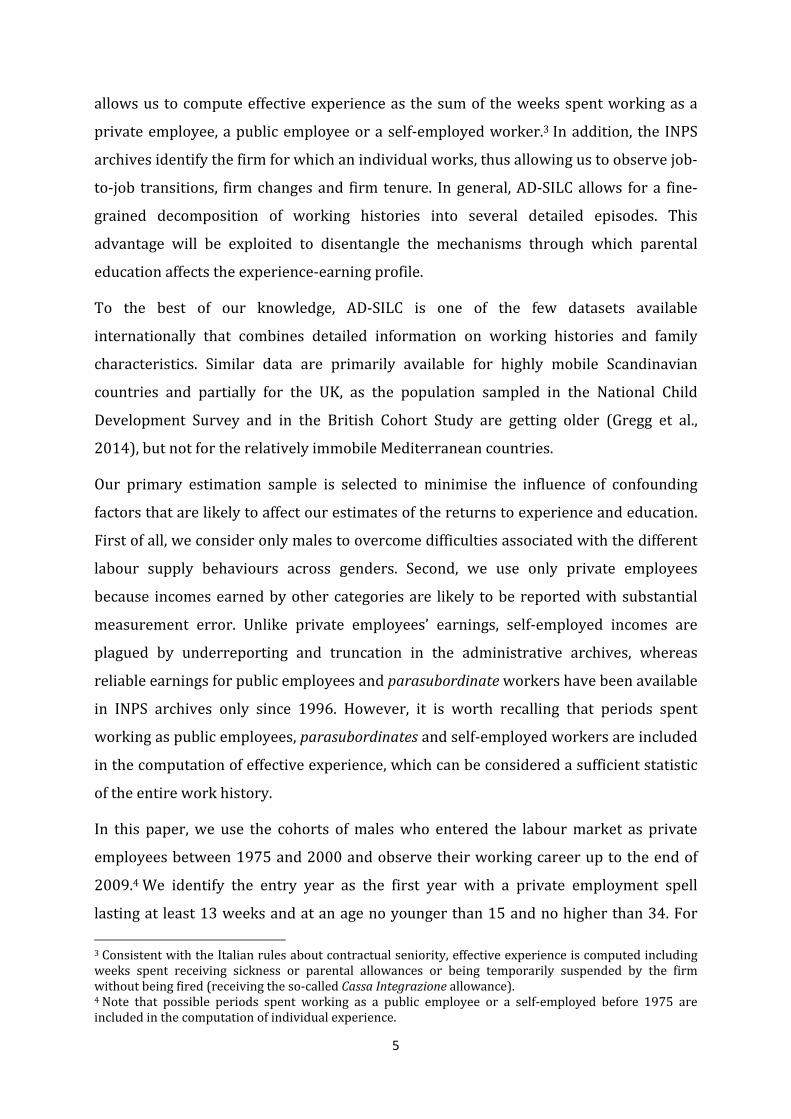
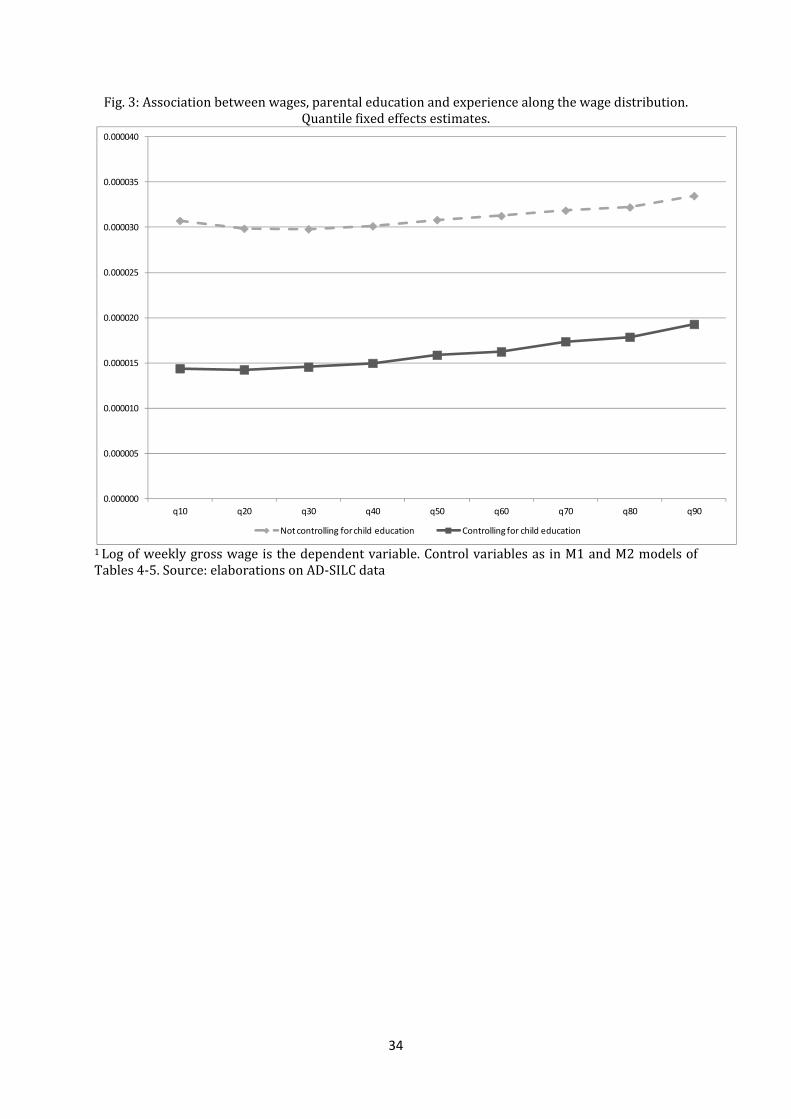
Figure3displaystheresultsofthequantilefixedeffectregressions,whichrepresenta
more conventional method to disentangle the different mechanisms at work. We
estimatebothModel1andModel2tocomparehowtheinclusionofchildren’seducation
affects the coefficients of parents’ education along the ability distribution. The results
fullyconfirmourpreviousfindings.InbothModels,returnstoexperiencearesteeperfor
well‐offchildrenwithhighabilities.However,theestimatedcoefficientsarestatistically
significantalongtheentiredistribution,suggestingthatparents'educationalsohasan
influence on the earning prospects of low‐ability individuals. In line with previous
findings, the relative size of the parental education effect is reducedbyhalfwhenwe
includetheinteractionbetweenexperienceandchildren’seducation.Notethatforboth
models, the effects at the median are perfectly in line with those estimated using
standardpaneldatatechniques.Overall,wefindclearsupportforourmainfindingofa
widespreadeffectofparents’educationon theearning‐experienceprofile, irrespective
ofsons’abilities.
A finalcaveat is inorderatthispoint.Althoughtheresultsof thissub‐sectionindicate
family connections as main candidate explanation to account for the influence of
parentalbackgroundatthebottomoftheabilitydistribution,wecannotfullydischarge
the roleplayedbyoccupation‐specific skills in the transmissionofoccupational status
acrossgenerations.12However,wecanbeconfidentthatthisrolehasaminorinfluence
at least on the parachute effect. First, we do not consider self‐employedworkers for
whomthetransmissionofoccupational‐specificskillsandexperienceplaysamajorrole.
Second,theparachuteeffectoccursbydefinitioninlow‐andmedium‐paidoccupations
wherehumancapital(includedspecifichumancapital)isrelativelylessimportant.Asa
result, although the glass ceiling effect may partially capture the intergenerational
transfer of specific skills in certain occupations, the same is difficult to say for the
intergenerational influence at the bottom of the ability distribution, where those
performinglow‐paidoccupationsarearguablyconcentrated.
12IntheEU‐SILC,wehaveinformationonthemaintwo‐digitISCOoccupationperformedbybothparents(20intotal).However,suchdetailedoccupationalcategoriesareavailableforsonsonlyin2005andthusareunreliabletoidentifythemainjobperformedthroughoutthecareer.
20
Afurtherwaytoinvestigatetheavenuesthroughwhichparentalbackgroundimproves
children’slifetimeprospectsistodecomposetheworkers’historiesintothreedifferent
events:unemploymentspells, firmchangesand totalworkexperience.Unemployment
spells are defined as periods of consecutive unemployment longer than threemonths
andarehenceaproxyof involuntarydisplacement(oursampleiscomposedofprime‐
agemen,whotypicallyhavehighparticipationrates),whereasjob‐to‐jobchangesarea
proxy of voluntary job changes. We then enrich our basic specification of Model 2,
including the interaction of parents’ education with, respectively, the number of job
changesandadummywhenanunemploymentspelloccurs.Arguably,awell‐connected
parentis likelytobemoresuccessful inhelpinghis/hersontofindabetter jobrather
thantoensurebettercareerprospectswithinthesamejob.Therefore,theinfluenceof
family networks should bewell‐approximated by the interaction between job change
andparentalbackground.Inturn,oncedepuratedfromthesenewterms,theinteraction
betweenparents’educationandexperiencecanbeinterpretedasaproxyofon‐the‐job
learning.
Table9showsadescriptivepictureofthewayinwhichparentalbackgroundinfluences
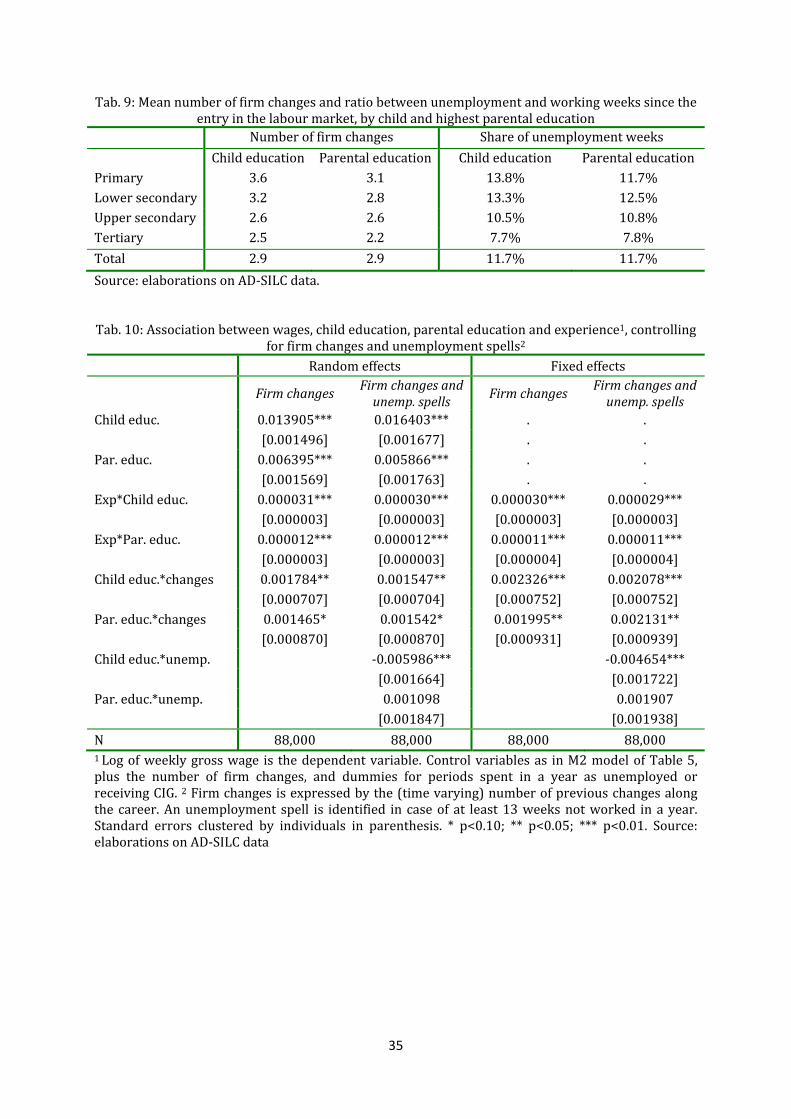
these two labourmarket outcomes. Thenumber of firm changes depends onparents’
andchildren’seducation;itishigherforlesseducatedchildfromdisadvantagedfamily
backgrounds. The same pattern can be observed for the share of weeks in
unemployment since the entry in the labourmarket,which is considerably higher for
less educated individuals from disadvantaged backgrounds (Columns 3‐4). One can
henceconcludethatasexpected,parentalbackgroundaffectschildren’sprobabilitiesof
beingunemployedandoffindinganewjob.
Table10lendssupporttothisinterpretation.InColumns1(RE)and3(FE),thepositive
interactionbetweenthenumberoffirmchangesandparentalbackgroundindicatesthat
well‐off children change firms less frequently, but at the same time, they have more
success in findingbetter jobs.Thesameresultholds forchildren’seducation,and it is
likelytoreflectthebetteroutsideoptionsofhigh‐abilityindividuals.Notably,theusual
interaction term between experience and parents’ education decreases by only 25%
withrespecttoourpreviousestimates.Thisfindingimpliesthatbothanendogenousjob
change effect and a learning effect are active in shaping the steeper returns to
experienceofwell‐offsons.Theinclusionoftheinteractionbetweentheunemployment
21
dummy and experience discards the importance of this additional channel. Whereas
childrenofparentswithhigher educationhave ahigher likelihoodof being employed
conditionalontheirowneducation,thisconditiondoesnotsignificantlyaffectthewage
gainsor losses that followa longperiodoutof theworkforce.Theoppositecannotbe
said for children’s own education, which worsen the wage losses associated with an
unemploymentspell.13
Overall, this additional empirical exercise indicates that job‐to‐job transitions are an
important channel of intergenerational persistency. This evidence is clearly not
conclusiveontherelativeimportanceoffamilynetworksandlearningintheprocessof
intergenerational transmission.However,whencombinedwith theprevious resultsof
thissection,wecanbemoreconfidentininterpretingthepositivejobchangeeffectfor
well‐offsonsasdependent,atleastpartially,onfamilynetworksratherthanuniquelyon
unobservableabilities.
6.CONCLUSIONS
Thispaperprovidesnewevidenceontheinfluenceofparentalbackgroundalongtheir
sons’workingcareer.Wefindthatparentalbackgroundcontinuestoexertasignificant
directinfluenceonsons’earningsaftertwenty‐fiveyearsoftheircareerandevenwhen
weconditionourestimatestoboththeobservableandunobservablecharacteristicsof
sons. Our favourite point estimates indicate that the parental background effect at
twenty years of experience ranges between 11.7% (when controlling for sons’
education) and 22.2%. More than 2/3 of this effect is formed on the labour market
rather than being dependent on an initial advantage. We also show that parental
backgroundshiftsupwardtheexperience‐earningsprofilesthroughtwomechanisms:a
glass ceiling effect for high‐ability individuals, due to the complementarity between
background and son's idiosyncratic abilities, and a parachute effect for low‐ability
individuals,associatedwithbetterlabourmarketconnections.
Whereastheglassceilingeffectis,toacertainextent,anunavoidableconsequenceofthe
processofskill formation, theparachuteeffectmay indicateadistortion in theway in
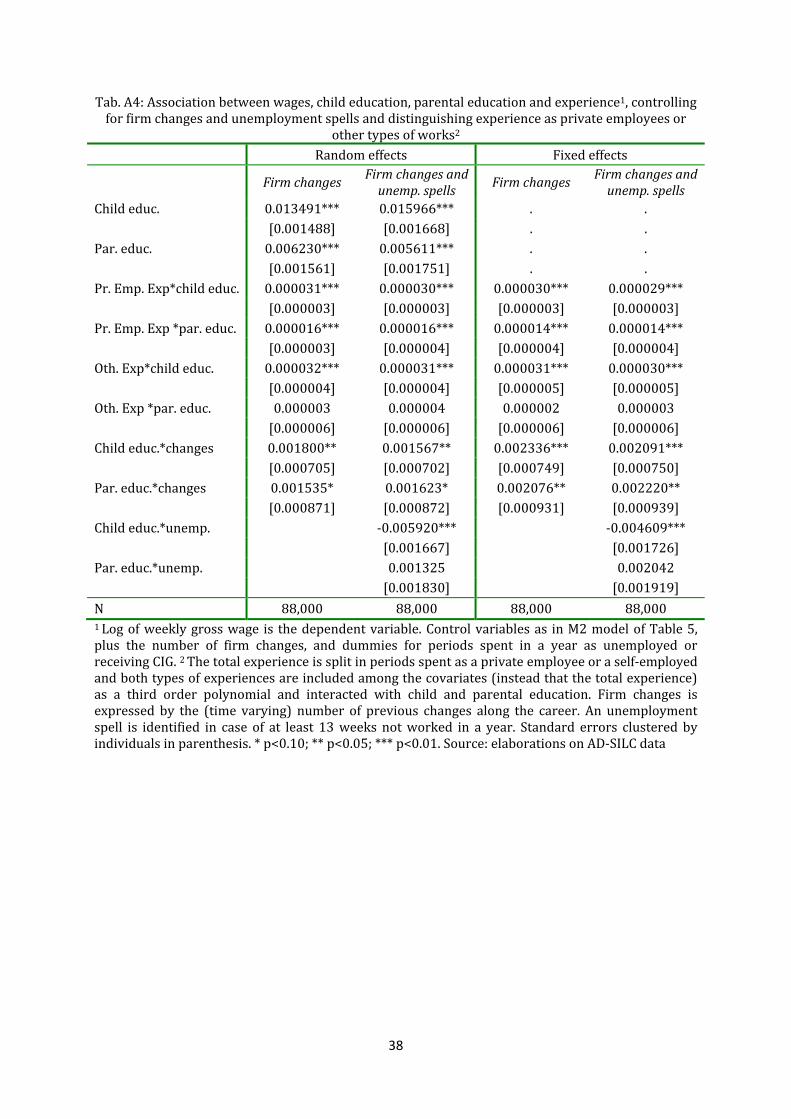
13Ourfindingsdonotchangeifwedistinguishexperiencesasprivateemployeesorothertypesofwork(e.g., self‐employed or public employees) and interact both types of experiences with children’s andparents’education(seeTableA.4intheAppendix).
22
whichtheItalianlabourmarketallocatestalentstojobs.Theperceivedunfairnessthat
results from this imperfect functioning of the labour market can discourage human
capital investments of disadvantaged children, and thus, it is likely to have harmful
consequences for economic growth. Future research is required to investigate these
channels in greater detail, for example, exploiting labour and product market
liberalisations that have arguably changed sectorial quasi‐rents and thus returns to
abilitiesasopposedtofamilyconnections.
23
REFERENCES
AinaC.,NicolettiC. (2014), "The intergenerational transmissionof liberalprofessions:
nepotismversusabilities",UniversityofYorkDiscussionPapersinEconomics,n.14.
Altonji J., Dunn T. (1996), "The Effects of Family Characteristics on the Return to
Education",TheReviewofEconomicsandStatistics,vol.78(4),pp.692‐704.
BeckerG., TomesN. (1979), “An equilibrium theoryof thedistributionof incomeand
intergenerationalmobility”,JournalofPoliticalEconomy,vol.87(6),pp. 1153‐89.
BeckerG.,TomesN.(1986),“Humancapitalandtheriseandfalloffamilies”,Journalof
LaborEconomics,vol.43(3),pp.S1‐S39.
Benabou R. (1996), “Equity and effectiveness in human capital investment: the local
connection”,ReviewofEconomicStudies,63,pp.37–64.
BjorklundA.,JanttiM.(2009),“IntergenerationalIncomeMobilityandtheRoleofFamily
Background”,inSalverdaW.,NolanB.,SmeedingT.(eds.),OxfordHandbookofEconomic
Inequality,OxfordUniversityPress.
BlandenJ.(2013),“Cross‐countryrankingsinintergenerationalmobility:acomparison
of approaches from economics and sociology”, JournalofEconomicSurveys, vol. 27(1),
pp.38‐73.
BlauF.,KahnL. (2013),"TheFeasibilityandImportanceofAddingMeasuresofActual
Experience to Cross‐Sectional Data Collection," JournalofLaborEconomics, vol. 31(1),
pp.S17‐S58.
BratsbergB.,RøedK.,RaaumO.,NaylorR., JänttiM.,ErikssonT.,ÖsterbackaE.(2007),
“Nonlinearities in intergenerational earningsmobility: consequences for cross‐country
comparisons”,EconomicJournal,vol.117,pp.C72‐92.
Canay I. A. (2011), "A simple approach to quantile regression for panel data,"
EconometricsJournal,vol.14,pp.368‐386.
Checchi D., Ichino A., Rustichini A. (1999), “More equal but less mobile?: Education
financing and intergenerational mobility in Italy and in the US”,Journal of Public
Economics,vol.74(3),pp.351‐393.
24
ChecchiD.,FiorioC.,LeonardiM.(2013),"Intergenerationalpersistenceofeducational
attainmentinItaly,"EconomicsLetters,vol.118(1),pages229‐232.
Chen Y, Feng S. (2009), " Parental Education and Wages: Evidence from China", IZA
DiscussionPaper,n.4218.
ChevalierA.,HarmonC.,O’SullivanV.,WalkerI(2013),"Theimpactofparentalincome
and education on the schooling of their children" IZAJournalofLaborEconomics, vol.
2(1),pp.1‐22.
Corak M. (2013), "Income Inequality, Equality of Opportunity, and Intergenerational
Mobility",JournalofEconomicPerspectives,vol.27(3),pp.79‐102.
CorakM.,PirainoP.(2011),“Theintergenerationaltransmissionofemployers”,Journal
ofLaborEconomics,vol.29(1),pp.37‐68.
CunhaF.,Heckman J. (2007), “TheTechnologyofSkillFormation”,AmericanEconomic
Review97(2),31‐47.
DuncanG.,MurnaneR.(2011),"Introduction:TheAmericanDream,ThenandNow",in
Duncan G., Murnane R. (eds.), Whither Opportunity? Rising Inequality, Schools, and
Children'sLifeChances,RussellSage,NewYork.
DustmannC.(2004),"Parentalbackground,secondaryschooltrackchoice,andwages,"
OxfordEconomicPapers,vol.56(2),pp.209‐230.
DustmannC.,MeghirC.(2005),"Wages,ExperienceandSeniority,"ReviewofEconomic
Studies,vol.72(1),pp.77‐108.
FuchsT.,WößmannL. (2007), "Whataccounts for internationaldifferences in student
performance? A re‐examination using PISA data,"EmpiricalEconomics, vol. 32(2), pp.
433‐464.
GranovetterM.(2005),“TheImpactofSocialStructureonEconomicOutcomes”,Journal
ofEconomicPerspectives,19,pp.33‐50.
GraweN.(2006),"Lifecyclebiasinestimatesofintergenerationalearningspersistence",
LabourEconomics,vol.13(5),pp.551‐570.
Gregg P., Macmillan L., Vittori C. (2014), "Moving Towards Estimating Lifetime
IntergenerationalEconomicMobilityintheUK",DoQSSWorkingPapers,14‐12.
25
Guell M., Rodriguez‐Mora J., Telmer C. (2007), “Intergenerational mobility and the
informativecontentofsurnames”,CEPRDiscussionPapersn.6316.
HaiderS.,SolonG.(2006),“Life‐cyclevariationintheassociationbetweencurrentand
lifetimeearnings”,AmericanEconomicReview,vol.96(4),pp.1308‐1320.
HertzT., JayasunderaT.,PirainoP.,SelcukS.,SmithN.,VeraschanginaA., (2007), “The
inheritanceofeducational inequality: internationalcomparisonsandfifty‐yeartrends”,
TheB.E.JournalofEconomicAnalysisandPolicy,vol.7,n.2.
HudsonJ.,SessionsJ.(2011),“Parentaleducation,labormarketexperienceandearnings:
newwineinanoldbottle?”,EconomicsLetters,vol.113,pp.111‐115.
KramarzF.,NordströmSkansO. (2013), "WhenStrongTiesareStrong:Networksand
YouthLaborMarketEntry",CEPRDiscussionPapers,n.9620.
MacmillanL.,TylerC.,VignolesA. (2013), "Whogets theTop Jobs?The roleof family
backgroundandnetworksinrecentgraduates'accesstohighstatusprofessions",DoQSS
WorkingPapers,13‐15
Magruder, J. (2010), "Intergenerational Networks, Unemployment, and Persistent
InequalityinSouthAfrica,"AmericanEconomicJournal:AppliedEconomics,vol.2(1),pp.
62‐85MarcenaroGutierrezO.,MicklewrightJ.,VignolesA.(2014),"SocialMobilityand
theImportanceofNetworks:EvidenceforBritain",IZADiscussionPapers,n.8380.
Nybom M., Stuhler J. (2011), "Heterogeneous Income Profiles and Life‐Cycle Bias in
IntergenerationalMobilityEstimation",IZADiscussionPapers,n.5697.
Pellizzari M. (2010), “Do friends and relatives really help in getting a good job?”,
IndustrialandLaborRelationsReview,vol.63(3),pp.494‐510.
PellizzariM.,BassoG.,CataniaA.,LabartinoG.,MalacrinoD.,MontiP.(2011),Familyties
inlicensedprofessionsinItaly,AreportfortheFondazioneRodolfoDebenedetti,Milan.
RaitanoM.,VonaF.(2015),“Measuringthelinkbetweenintergenerationaloccupational
mobility and earnings: evidence from 8 European Countries”, Journal of Economic
Inequality,vol.13,n.1,pp.83‐102.
RubinsteinY.,WeissY. (2006), "Post SchoolingWageGrowth: Investment, Search and
Learning", in Hanushek E., Welch F. (eds.), Handbook of theEconomics ofEducation,
Elsevier.

26
Schutz G., Ursprung H., Woessmann L. (2008) “Education policy and equality of
opportunity”,Kyklos,vol.61(2),pp.279‐308.
SolonG.(2004),“Amodelofintergenerationalmobilityvariationovertimeandplace”,
inCorakM.(eds),GenerationalIncomeMobilityinNorthAmericaandEurope,Cambridge
UniversityPress.
27
TABLESANDFIGURES
Tab.1:Sampledescriptivestatistics1
Childyearsofeducation 10.55[3.40]
Parentalyearsofeducation(averagebothparents) 6.03[2.89]
Parentalyearsofeducation(bestparentonly) 6.78[3.51]
Gapbetweenchildandaverageparentaleducation 4.52[3.39]
Gapbetweenchildandbestparenteducation 3.77[3.73]
Realweeklywage(Euro2010) 495.6[247.8]
Realweeklywage(logs) 6.10[0.44]
Age 31.1[8.8]
Experience 9.9[7.7]
Tenure 5.2[5.2]
Numberoffirmchanges 2.4[2.3]
Numberofindividualobs. 15.2[8.8]
Sampledindividuals 5,774Totalnumberofobservations 88,0041Meanvalues,standarddeviationinparenthesis.Source:elaborationsonAD‐SILCdata
28
Tab.2:Mobilitytableofhighestparentalandchildeducation(rowpercentages)1
ChildeducationHighestparentaleducation
Lessthanprimary
Primary Lowersec. Uppersec. Tertiary TotalParentaleduc.
Lessthanprimary 3.1 22.1 51.5 22.1 1.1 100.0 9.4
Primary 0.4 8.8 46.9 40.3 3.7 100.0 51.1Lowersecondary 0.2 1.8 34.1 54.8 9.3 100.0 22.8Uppersecondary 0.3 1.6 14.4 65.8 18.0 100.0 13.3Tertiary 0.0 2.1 5.7 45.7 46.4 100.0 2.4
Childeduc. 0.6 7.3 39.1 45.4 7.7 100.0 100.01Computedonindividualobservations(i.e.oneobservationforeachindividual).Source:elaborationsonAD‐SILCdata
Tab.3:Averageyearsofeducation,entryageandaverageyearsofexperience,byparentaleducationHighestparentaleducation
Yearsofeducation1 Entryageasaprivateemployee1 Yearsofexperience2
Lessthanprimary 8.2 21.5 10.2Primary 9.8 20.3 10.5Lowersecondary 11.4 21.0 9.1Uppersecondary 12.8 22.4 8.8Tertiary 14.5 24.8 9.1
Total 10.6 21.0 9.91Computed on individual observations (i.e. one observation for each individual). 2Computed onlongitudinalobservations.Source:elaborationsonAD‐SILCdata
29
Fig.1:OLSestimatedreturnstoparentaleducationbyyearsofexperience1
1Log ofweekly grosswage (at constant prices) is the dependent variable. Estimates are obtainedcontrollingforasetofdummiesthatareequaloneiftheindividualihasreachedexperiencexatyeart.Source:elaborationsonAD‐SILCdata.
Fig.2:OLSestimatedreturnstochildandparentaleducationbyyearsofexperience1
1Log ofweekly grosswage (at constant prices) is the dependent variable. Estimates are obtainedcontrollingforasetofdummiesthatareequaloneiftheindividualihasreachedexperiencexatyeart.Source:elaborationsonAD‐SILCdata.
0.00
0.01
0.02
0.03
0.04
0.05
0.06
0.07
1 2 3 4 5 6 7 8 9 10 11 12 13 14 15 16 17 18 19 20 21 22 23 24 25
Years of experience
0.000
0.010
0.020
0.030
0.040
0.050
0.060
0.070
1 2 3 4 5 6 7 8 9 10 11 12 13 14 15 16 17 18 19 20 21 22 23 24 25
Years of experience
Child education Parental education
30
Tab.4:Associationbetweenwages,parentaleducationandexperience(notcontrollingforchildeducation)1
M0 M1 M1(restrictedsample)2
Randomeffects
Randomeffects
Fixedeffects
Randomeffects
Fixedeffects
Par.educ. 0.024005*** 0.012112*** . 0.012590*** .
[0.001519] [0.001454] . [0.002233] .Exp.*Par.educ. 0.000031*** 0.000031*** 0.000029*** 0.000029***
[0.000003] [0.000003] [0.000004] [0.000004]
N 88,000 88,000 88,000 43,178 43,1781Logofweeklygrosswage(atconstantprices)isthedependentvariable.Controlvariablesareage,age squared, dummy forpart‐time, third order polynomial on effective experience (inweeks) andfixedeffectsforregionofwork,yearandcohortofentryintoemployment.2Thesampleisrestrictedtothoseenteredinemploymentintheperiod1980‐1989.Standarderrorsclusteredbyindividualsinparenthesis.*p<0.10;**p<0.05;***p<0.01.Source:elaborationsonAD‐SILCdata
Tab.5:QuantificationoftheimpactofchildandparentaleducationalongthecareerM1model M2model
Parentaleduc. Childeduc. Parentaleduc.Exp.0 Exp.1 Exp.20 Exp.0 Exp.1 Exp.20 Exp.0 Exp.1 Exp.20
1yearofeduc.Startingsalary 1.21% . . 1.44% . . 0.67% . .Growtheffect . 0.16% 3.22% . 0.18% 3.54% 0.08% 1.66%Totaleffect 1.21% 1.37% 4.43% 1.44% 1.62% 4.98% 0.67% 0.75% 2.33%
5yearsofeduc.Startingsalary 6.06% . . 7.20% . . 3.33% . .Growtheffect . 0.81% 16.12% . 0.88% 17.68% . 0.42% 8.32%Totaleffect 6.06% 6.87% 22.18% 7.20% 8.08% 24.88% 3.33% 3.75% 11.65%Source:elaborationsonAD‐SILCdata
31
Tab.6:Associationbetweenwages,childandparentaleducationandexperience1
M2M2
(restrictedsample)2"Fatherandmother"
model3
Randomeffects
Fixedeffects
Randomeffects
FixedEffects
RandomEffects
Fixedeffects
Childeduc. 0.014390*** . 0.009960*** . 0.013843*** .[0.001433] . [0.002029] . [0.001504] .
Par.educ. 0.006658*** . 0.008639*** .
[0.001483] . [0.002277] .
Exp*Childed. 0.000034*** 0.000034*** 0.000037*** 0.000037*** 0.000034*** 0.000034***
[0.000002] [0.000002] [0.000003] [0.000003] [0.000002] [0.000003]
Exp*Par.ed.. 0.000016*** 0.000016*** 0.000014*** 0.000014***
[0.000003] [0.000003] [0.000004] [0.000004]
Fathered.. 0.003625** .
[0.001470] .
Mothered.. 0.003526** .
[0.001672] .
Exp*Fath.ed.. 0.000007** 0.000007**
[0.000003] [0.000003]
Exp*Moth.ed. 0.000010*** 0.000010***
[0.000003] [0.000003]Fath.ed..=Moth.ed.
0.9712
Exp*Fath.ed.=Exp*Moth.ed.
0.4545 0.4756
N 88,000 88,000 43,178 43,178 81,873 81,8731Logofweeklygrosswage(atconstantprices)isthedependentvariable.Controlvariablesareage,age squared, dummy on part‐time, third order polynomial on effective experience (inweeks) andfixedeffectsforregionofwork,yearandcohortofentryintoemployment.2Thesampleisrestrictedtothoseenteredinemploymentintheperiod1980‐1989.3DependentandcontrolvariablesasinM2model; parental education is split in father and mother education. P‐values of Wald tests arepresented to test theequalityof theestimatedcoefficients related to fatherandmothereducation.Standard errors clustered by individuals in parenthesis. * p<0.10; ** p<0.05; *** p<0.01. Source:elaborationsonAD‐SILCdata.
32
Tab.7:Associationbetweenwages,experienceandeducationalmobility
1Log ofweekly grosswage is the dependent variable. Control variables as inM1 andM2models.ParentaleducationisLwhenaverageyearsofeducationisatmost5,Mwhentheyarebetween5and8,Hwhentheyarehigherthan8.ChildeducationisLwhenyearsofeducationareatmost8,Mwhentheyarebetween8and18,Hwhentheyareatleast18.Standarderrorsclusteredbyindividualsinparenthesis.*p<0.10;**p<0.05;***p<0.01.Source:elaborationsonAD‐SILCdata.
Randomeffects Fixedeffects
Par.H‐Ch.H 0.148404*** .[0.024430] .
Par.M‐Ch.H 0.068624** .[0.032730] .
Par.L‐Ch.H 0.001025 .[0.033604] .
Par.H‐Ch.M 0.02252 .[0.014883] .
Par.L‐Ch.M ‐0.024715** .[0.012066] .
Par.H‐Ch.L ‐0.063553** .[0.027819] .
Par.M‐Ch.L ‐0.084207*** .[0.016175] .
Par.L‐Ch.L ‐0.098511*** .[0.012128] .
Par.H‐Ch.H*Exp 0.000444*** 0.000448***[0.000047] [0.000047]
Par.M‐Ch.H*Exp 0.000323*** 0.000322***[0.000065] [0.000066]
Par.L‐Ch.H*Exp 0.000322*** 0.000304***[0.000056] [0.000055]
Par.H‐Ch.M*Exp 0.000069** 0.000065**[0.000032] [0.000033]
Par.L‐Ch.M*Exp ‐0.000028 ‐0.000026[0.000023] [0.000023]
Par.H‐Ch.L*Exp ‐0.000127** ‐0.000123**[0.000053] [0.000055]
Par.M‐Ch.L*Exp ‐0.000094*** ‐0.000094***[0.000031] [0.000031]
Par.L‐Ch.L*Exp ‐0.000163*** ‐0.000164***[0.000021] [0.000022]
N 88,000 88,000
33
Tab.8:P‐valuesofWaldtestsoftheestimatedcoefficientsoftheassociationbetweenwages,
experienceandeducationalmobilityinTable7
*p<0.10;**p<0.05;***p<0.01.Source:elaborationsonAD‐SILCdata.
Randomeffects Fixedeffects
Par.H‐Ch.H=Par.M‐Ch.H 0.035(**) Par.H‐Ch.H=Par.L‐Ch.H 0.000(***) Par.M‐Ch.H=Par.L‐Ch.H 0.099(*) Par.H‐Ch.M=Par.M‐Ch.M 0.130 Par.H‐Ch.M=Par.L‐Ch.M 0.000(***) Par.M‐Ch.M=Par.L‐Ch.M 0.041(**) Par.H‐Ch.L=Par.M‐Ch.L 0.474 Par.H‐Ch.L=Par.L‐Ch.L 0.192 Par.M‐Ch.L=Par.L‐Ch.L 0.306
Par.H‐Ch.H*Exp=Par.M‐Ch.H*Exp 0.101(*) 0.0954(*)Par.H‐Ch.H*Exp=Par.L‐Ch.H*Exp 0.069(*) 0.0298(**)Par.M‐Ch.H*Exp=Par.L‐Ch.H*Exp 0.990 0.8245Par.H‐Ch.M*Exp=Par.M‐Ch.M*Exp 0.033(**) 0.046(**)Par.H‐Ch.M*Exp=Par.L‐Ch.M*Exp 0.001(***) 0.0023(***)Par.M‐Ch.M*Exp=Par.L‐Ch.M*Exp 0.222 0.260Par.H‐Ch.L*Exp=Par.M‐Ch.L*Exp 0.551 0.6095Par.H‐Ch.L*Exp=Par.L‐Ch.L*Exp 0.481 0.4230Par.M‐Ch.L*Exp=Par.L‐Ch.L*Exp 0.009(***) 0.0084(***)
34
Fig.3:Associationbetweenwages,parentaleducationandexperiencealongthewagedistribution.Quantilefixedeffectsestimates.
1Logofweeklygrosswageisthedependentvariable.ControlvariablesasinM1andM2modelsofTables4‐5.Source:elaborationsonAD‐SILCdata
0.000000
0.000005
0.000010
0.000015
0.000020
0.000025
0.000030
0.000035
0.000040
q10 q20 q30 q40 q50 q60 q70 q80 q90
Not controlling for child education Controlling for child education
35
Tab.9:Meannumberoffirmchangesandratiobetweenunemploymentandworkingweekssincetheentryinthelabourmarket,bychildandhighestparentaleducation
Numberoffirmchanges Shareofunemploymentweeks
Childeducation Parentaleducation Childeducation ParentaleducationPrimary 3.6 3.1 13.8% 11.7%Lowersecondary 3.2 2.8 13.3% 12.5%Uppersecondary 2.6 2.6 10.5% 10.8%Tertiary 2.5 2.2 7.7% 7.8%
Total 2.9 2.9 11.7% 11.7%
Source:elaborationsonAD‐SILCdata.
Tab.10:Associationbetweenwages,childeducation,parentaleducationandexperience1,controllingforfirmchangesandunemploymentspells2
Randomeffects Fixedeffects
Firmchanges
Firmchangesandunemp.spells
FirmchangesFirmchangesandunemp.spells
Childeduc. 0.013905*** 0.016403*** . .[0.001496] [0.001677] . .
Par.educ. 0.006395*** 0.005866*** . .[0.001569] [0.001763] . .
Exp*Childeduc. 0.000031*** 0.000030*** 0.000030*** 0.000029***[0.000003] [0.000003] [0.000003] [0.000003]
Exp*Par.educ. 0.000012*** 0.000012*** 0.000011*** 0.000011***[0.000003] [0.000003] [0.000004] [0.000004]
Childeduc.*changes 0.001784** 0.001547** 0.002326*** 0.002078***[0.000707] [0.000704] [0.000752] [0.000752]
Par.educ.*changes 0.001465* 0.001542* 0.001995** 0.002131**[0.000870] [0.000870] [0.000931] [0.000939]
Childeduc.*unemp. ‐0.005986*** ‐0.004654***[0.001664] [0.001722]
Par.educ.*unemp. 0.001098 0.001907[0.001847] [0.001938]
N 88,000 88,000 88,000 88,0001Logofweeklygrosswage is thedependentvariable.Controlvariablesas inM2modelofTable5,plus the number of firm changes, and dummies for periods spent in a year as unemployed orreceivingCIG.2Firmchangesisexpressedbythe(timevarying)numberofpreviouschangesalongthecareer.Anunemployment spell is identified in caseofat least13weeksnotworked inayear.Standard errors clustered by individuals in parenthesis. * p<0.10; ** p<0.05; *** p<0.01. Source:elaborationsonAD‐SILCdata
36
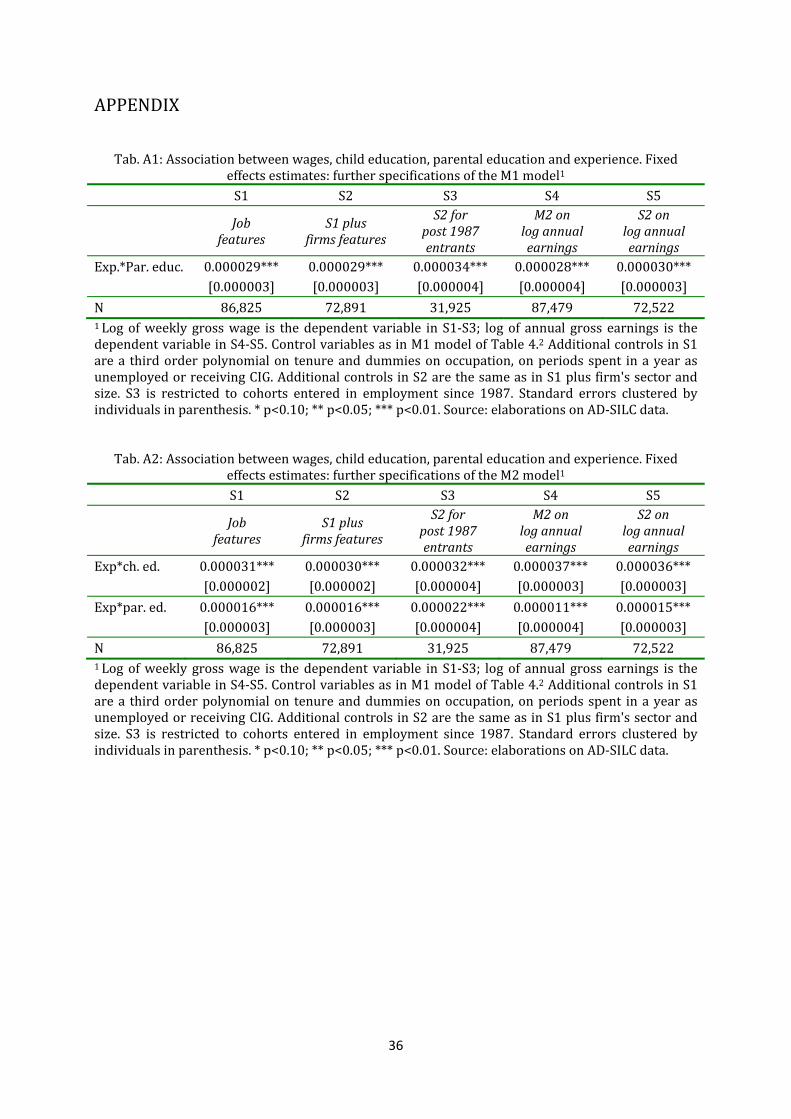
APPENDIX
Tab.A1:Associationbetweenwages,childeducation,parentaleducationandexperience.Fixed
effectsestimates:furtherspecificationsoftheM1model1S1 S2 S3 S4 S5
Job
featuresS1plus
firmsfeatures
S2forpost1987entrants
M2onlogannualearnings
S2onlogannualearnings
Exp.*Par.educ. 0.000029*** 0.000029*** 0.000034*** 0.000028*** 0.000030***[0.000003] [0.000003] [0.000004] [0.000004] [0.000003]
N 86,825 72,891 31,925 87,479 72,5221Logofweekly grosswage is thedependent variable in S1‐S3; logof annual gross earnings is thedependentvariableinS4‐S5.ControlvariablesasinM1modelofTable4.2AdditionalcontrolsinS1area thirdorderpolynomialon tenureanddummiesonoccupation,onperiodsspent inayearasunemployedorreceivingCIG.AdditionalcontrolsinS2arethesameasinS1plusfirm'ssectorandsize. S3 is restricted to cohorts entered in employment since 1987. Standard errors clustered byindividualsinparenthesis.*p<0.10;**p<0.05;***p<0.01.Source:elaborationsonAD‐SILCdata.
Tab.A2:Associationbetweenwages,childeducation,parentaleducationandexperience.Fixedeffectsestimates:furtherspecificationsoftheM2model1S1 S2 S3 S4 S5
Job
featuresS1plus
firmsfeatures
S2forpost1987entrants
M2onlogannualearnings
S2onlogannualearnings
Exp*ch.ed. 0.000031*** 0.000030*** 0.000032*** 0.000037*** 0.000036***[0.000002] [0.000002] [0.000004] [0.000003] [0.000003]
Exp*par.ed. 0.000016*** 0.000016*** 0.000022*** 0.000011*** 0.000015***[0.000003] [0.000003] [0.000004] [0.000004] [0.000003]
N 86,825 72,891 31,925 87,479 72,5221Logofweekly grosswage is thedependent variable in S1‐S3; logof annual gross earnings is thedependentvariableinS4‐S5.ControlvariablesasinM1modelofTable4.2AdditionalcontrolsinS1area thirdorderpolynomialon tenureanddummiesonoccupation,onperiodsspent inayearasunemployedorreceivingCIG.AdditionalcontrolsinS2arethesameasinS1plusfirm'ssectorandsize. S3 is restricted to cohorts entered in employment since 1987. Standard errors clustered byindividualsinparenthesis.*p<0.10;**p<0.05;***p<0.01.Source:elaborationsonAD‐SILCdata.
37
Tab.A3:M2modelplusinteractionswithathirdorderpolynomialonexperience.
“Thirdorder”model1
Randomeffects FixedeffectsChildeduc. 0.01519423*** .
[0.00177025] .Exp*Childeduc. 0.00002820*** 0.00002461**
[0.00001005] [0.00001015]Exp2/1000*Childeduc. 0.00000617 0.00001242
[0.00001586] [0.00001566]Exp3/100000*Childeduc. ‐0.00000015 ‐0.00000042
[0.00000071] [0.00000069]Parentaleduc. 0.00413558** .
[0.00183421] .Exp*Par.educ. 0.00003362*** 0.00003420***
[0.00001121] [0.00001143]Exp2/1000*Par.Educ. ‐0.00002116 ‐0.00002153
[0.00001820] [0.00001829]Exp3/100000*Par.Educ. 0.00000058 0.00000059
[0.00000083] [0.00000082]
(Par.educ*exp+Par.educ.*exp2+Par.educ*exp3)=0 11.27(***) 11.32(***)
N 88,000 88,0001Dependent and control variables as in M2 model plus a third order polynomial on experienceinteracted with both child and parental education. Standard errors clustered by individuals inparenthesis.Ftestsofjointnullityofinteractedpolynomialofexperienceandparentaleducationarereported.*p<0.10;**p<0.05;***p<0.01.Source:elaborationsonAD‐SILCdata
38
Tab.A4:Associationbetweenwages,childeducation,parentaleducationandexperience1,controllingforfirmchangesandunemploymentspellsanddistinguishingexperienceasprivateemployeesor
othertypesofworks2
Randomeffects Fixedeffects
Firmchanges Firmchangesand
unemp.spellsFirmchanges Firmchangesand
unemp.spellsChildeduc. 0.013491*** 0.015966*** . .
[0.001488] [0.001668] . .Par.educ. 0.006230*** 0.005611*** . .
[0.001561] [0.001751] . .Pr.Emp.Exp*childeduc. 0.000031*** 0.000030*** 0.000030*** 0.000029***
[0.000003] [0.000003] [0.000003] [0.000003]Pr.Emp.Exp*par.educ. 0.000016*** 0.000016*** 0.000014*** 0.000014***
[0.000003] [0.000004] [0.000004] [0.000004]Oth.Exp*childeduc. 0.000032*** 0.000031*** 0.000031*** 0.000030***
[0.000004] [0.000004] [0.000005] [0.000005]Oth.Exp*par.educ. 0.000003 0.000004 0.000002 0.000003
[0.000006] [0.000006] [0.000006] [0.000006]Childeduc.*changes 0.001800** 0.001567** 0.002336*** 0.002091***
[0.000705] [0.000702] [0.000749] [0.000750]Par.educ.*changes 0.001535* 0.001623* 0.002076** 0.002220**
[0.000871] [0.000872] [0.000931] [0.000939]Childeduc.*unemp. ‐0.005920*** ‐0.004609***
[0.001667] [0.001726]Par.educ.*unemp. 0.001325 0.002042
[0.001830] [0.001919]
N 88,000 88,000 88,000 88,0001Logofweeklygrosswage is thedependentvariable.Controlvariablesas inM2modelofTable5,plus the number of firm changes, and dummies for periods spent in a year as unemployed orreceivingCIG.2Thetotalexperienceissplitinperiodsspentasaprivateemployeeoraself‐employedandbothtypesofexperiencesareincludedamongthecovariates(insteadthatthetotalexperience)as a third order polynomial and interacted with child and parental education. Firm changes isexpressed by the (time varying) number of previous changes along the career. An unemploymentspell is identified in case of at least 13weeks notworked in a year. Standard errors clustered byindividualsinparenthesis.*p<0.10;**p<0.05;***p<0.01.Source:elaborationsonAD‐SILCdata