Embed Size (px)
Citation preview

Mathematics Grade 7 – Academic 1
PUBLIC SCHOOLS OF EDISON TOWNSHIP
DIVISION OF CURRICULUM AND INSTRUCTION
Course Name: Mathematics Grade 7 - Academic
Length of Course: Term
Elective/Required: Required
Schools: Middle Schools
Eligibility: Grade 7
Credit Value: (High School Only) N/A
Date Approved: August, 2016

Mathematics Grade 7 – Academic 2
TABLE OF CONTENTS
Introduction 3
Statement of Purpose 4
Scope & Sequence 5
Unit 1: Number System 6
Unit 2: Expressions & Equations 10
Unit 3: Ratios & Proportional Relationships 14
Unit 4: Geometry 17
Unit 5: Statistics and Probability 21

Mathematics Grade 7 – Academic 3
INTRODUCTION
The 7th grade math class will focus on developing understanding of and applying proportional relationships; developing understanding of operations with rational numbers and working with expressions and linear equations; solving problems involving scale drawings and informal geometric constructions, and working with two- and three-dimensional shapes to solve problems involving area, surface area, and volume; and continue to develop understanding of statistical thinking by drawing inferences about populations based on samples.
This curriculum guide is standards based which reflects the Common Core State Standards for Mathematics, the Mathematical Practices that are expected to be used in teaching mathematics K-12 are as follows and infused throughout the guide:
Make sense of problems and persevere in solving them. Use appropriate tools strategically. Reason abstractly and quantitatively. Construct viable arguments and critique the reasoning of others. Model with mathematics. Attend to precision. Look for and make use of structure. Look for and express regularity in repeated reasoning.

Mathematics Grade 7 – Academic 4
STATEMENT OF PURPOSE
The purpose of the revision was to further integrate the practice standards as well as incorporate technology in a meaningful way to enhance instruction and learning.
Learning mathematics with understanding is essential to enable students to problem solve. Students learn mathematics by doing not just by listening and memorizing. When mathematical facts are connected, taught in a contextual setting, applied to real world application and infuse technology knowledge is more likely retained.
The primary resource for this course is Holt McDougal Mathematics Grade 7 Common Core Edition, ©2012, Houghton Mifflin Harcourt Publishing Company.
This curriculum guide was revised/updated by: Melissa Bienvenue Krystina Kingston
Coordinated by:
Jennifer Martins - Supervisor of Math
Mathematics Grade 7 - Academic 5
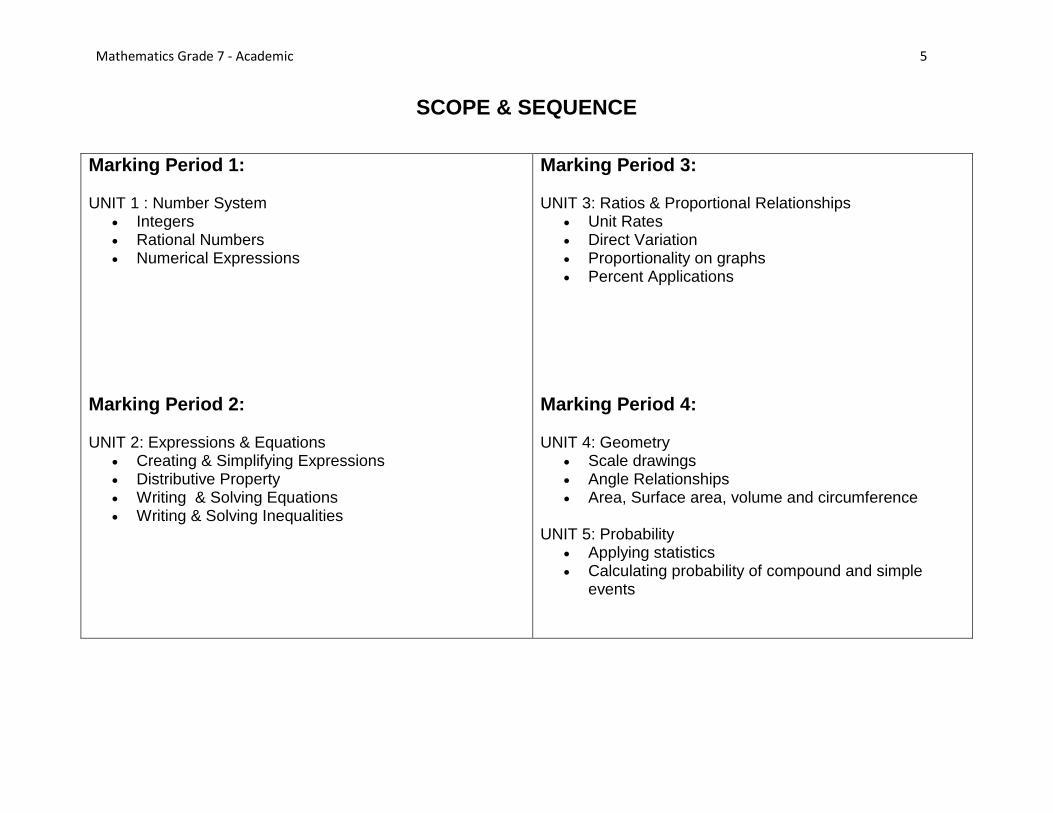
SCOPE & SEQUENCE
Marking Period 1:
UNIT 1 : Number System
Integers Rational Numbers Numerical Expressions
Marking Period 2:
UNIT 2: Expressions & Equations
Creating & Simplifying Expressions Distributive Property Writing & Solving Equations Writing & Solving Inequalities
Marking Period 3:
UNIT 3: Ratios & Proportional Relationships
Unit Rates Direct Variation Proportionality on graphs Percent Applications
Marking Period 4:
UNIT 4: Geometry
Scale drawings Angle Relationships Area, Surface area, volume and circumference
UNIT 5: Probability
Applying statistics Calculating probability of compound and simple
events

Mathematics Grade 7 - Academic 6
UNIT 1: Expand students’ understanding of and conceptual understanding of the Number System involving rational numbers with an emphasis on problem solving and real-world applications of fractional operations.
Essential Questions Enduring Understandings
What are the types of rational numbers? What kinds of problems can be solved by adding/subtracting the different types of rational numbers?
Which models and relationships help make sense of multiplying and
dividing positive and negative rational numbers? When multiplying and dividing integers, how do you determine the sign?
When is it most helpful to use each representation - fractions, decimals,
percents?
Rational numbers are positive and negative numbers including decimals, and zero. Positive and negative rational numbers can be used in real life application when dealing with temperature, height above or below sea level, money earned or spent, etc..
Repeated addition can represent the operation of multiplication which can also be modeled on a number line. The inverse operations of multiplication and division establish a pattern for the products and quotients.
Fractions are used in part to whole comparisons. Percents can be used to compare fractions with different denominators by converting the fractions first to percents. Decimals are useful when comparing the fractional form of a number to the decimal form. Decimals are often useful when calculating with money, measurements, and weights.
Core Content Instructional Actions Technology
Resources
Objectives Alignment to CCSS Recommend Activities/Strategies
Assessment Check
Points
Combine opposite quantities to make zero.
Interpret sums of rational
numbers.
Relate the addition of rational numbers to the number line.
Express the distance between
numbers on the number line as the absolute value of their
CCSS.MATH.CONTENT.7.NS.A.1 Apply and extend previous understandings of addition and subtraction to add and subtract rational numbers; represent addition and subtraction on a horizontal or vertical number line diagram. o 7.NS.A.1.A Describe
situations in which opposite quantities combine to make 0. For example, a hydrogen atom has 0 charge because its two constituents are
Adding Integers Using a Number Line - LearnZillion video using a number line to add integers
Adding Integers Activity - evaluating using a number line
Adding Integers Using Counters - LearnZillion video using counters to add integers
Weather Extremes - making sense of
KaHoot!! - review of adding integers
My.hrw.com
Challenge Practice
Lesson Quizzes
Homework Check
“Ready to Go On” Quesitons
Mid-Chapter Quizzes
Chapter Reviews
Interactive practice quizzes
Learn Zillion
my.hrw.com Learn Zillion
Yummy Math

Mathematics Grade 7 - Academic 7
UNIT 1: Number System (cont.) Core Content Instructional Actions Technology
Resources
Objectives Alignment to CCSS Recommend Activities/Strategies
Assessment Check
Points
difference.
Apply additive inverses to solve subtraction problems.
Solve problems involving multiplication of rational numbers.
Interpret products of rational
numbers.
oppositely charged. o 7.NS.A.1.B Understand p + q
as the number located a distance |q| from p, in the positive or negative direction depending on whether q is positive or negative. Show that a number and its opposite have a sum of 0 (are additive inverses). Interpret sums of rational numbers by describing real-world contexts.
o 7.NS.A.1.C Understand subtraction of rational numbers as adding the additive inverse, p - q = p+ (-q). Show that the distance between two rational numbers on the number line is the absolute value of their difference, and apply this principle in real-world contexts.
o 7.NS.A.1.D Apply properties of operations as strategies to add and subtract rational numbers.
CCSS.MATH.CONTENT.7.NS.A.2 Apply and extend previous understandings of multiplication and division and of fractions to multiply and divide rational numbers.
signed numbers and absolute value Blendspace – Adding Integer Resources – a collection of resources for adding integer FunBrain - SuperBrain
Level - practicing +/- integers on number line
Deflategate - making sense of negative numbers on the number line
Temp Change in Boston Temperature Changes USA
- problem solving with positive and negative numbers
Formative Assessment digital tools: Socrative Padlet Pear Deck Nearpod
Teacher made Google Form
Blendspace Insidemathematics
FunBrain
Yummy Math

Mathematics Grade 7 - Academic 8
UNIT 1: Number System (cont.) Core Content Instructional Actions Technology
Resources
Objectives Alignment to CCSS Recommend Activities/Strategies
Assessment Check
Points
Solve problems involving the division of rational numbers.
Interpret quotients of rational
numbers.
Convert rational numbers to
decimals.
Identify a rational number as a terminating or repeating decimal.
Solve numerical problems with rational numbers by using the four operations.
Solve word problems that involve
rational numbers and the four operations.
o 7.NS.A.2.A Understand that multiplication is extended from fractions to rational numbers by requiring that operations continue to satisfy the properties of operations, particularly the distributive property, leading to products such as (-1)(-1) = 1 and the rules for multiplying signed numbers. Interpret products of rational numbers by describing real-world contexts.
o 7.NS.A.2.B Understand that integers can be divided, provided that the divisor is not zero, and every quotient of integers (with non-zero divisor) is a rational number. If p and q are integers, then -(p/q) = (-p)/q = p/(-q). Interpret quotients of rational numbers by describing real-world contexts.
o 7.NS.A.2.C Apply properties of operations as strategies to multiply and divide rational numbers.
o 7.NS.A.2.D Convert a rational number to a decimal using long division; know that the decimal form of a rational number terminates in 0s or
Blueberry Surprise - multiplying and dividing fractions
Yummy Math

Mathematics Grade 7 - Academic 9
UNIT 1: Number System (cont.) Core Content Instructional Actions Technology
Resources
Objectives Alignment to CCSS Recommend Activities/Strategies
Assessment Check
Points
eventually repeats.
CCSS.MATH.CONTENT.7.NS.A.3 Solve real-world and mathematical problems involving the four operations with rational numbers. Computations with rational numbers extend the rules for manipulating fractions to complex fractions.
Instructional Adjustments: Modifications/Student difficulties/Common errors: Appropriate accommodations and/or modifications as determined by 504’s and IEP’s: shortened assignments, extended time, copy of class notes or access to notes on chromebook, preferential seating, oral reminders, etc. Ask students to restate information, directions, and assignments. Emphasize:
Understanding that negative and subtraction are the same
Confusing the rules between all the operation

Mathematics Grade 7 - Academic 10
UNIT 2: Expand students’ understanding of Expressions and Equations involving linear expressions, equations, and inequalities with rational coefficients emphasizing problem solving in a real-world setting.
Essential Questions Enduring Understandings
Does rewriting an expression help you to determine if expressions are equivalent?
When is it useful to model a relationship with an equation? How does rewriting an equation help you think about the relationship in a new way?
How can you represent relationships in situations in which equations do not work?
Properties - such as the distributive property - can be used to simplify mathematical expression and to create equivalent expressions.
Modeling problems can make problems easier to understand.
Inequalities represent situations which are not balanced and have more than one solution.
Core Content Instructional Actions Technology
Resources
Objectives Alignment to CCSS Recommend Activities/Strategies
Assessment Check
Points
Combine like terms with rational coefficients.
Apply the distributive property to factor linear expressions.
Expand linear expressions
using the distributive property.
CCSS.MATH.CONTENT.7.EE.A.1
Apply properties of operations as strategies to add, subtract, factor, and expand linear expressions with rational coefficients.
CCSS.MATH.CONTENT.7.EE.A.2 Understand that rewriting an expression in different forms in a problem context can shed light on the problem and how the quantities in it are related.For example, a + 0.05a = 1.05a means that "increase by 5%" is the same as "multiply by 1.05." Solve real-life and mathematical problems using numerical and algebraic expressions and equations.
Combining Like Terms Activity- Students can identify and combine like terms
Blendspace- Distributive Property & Combining Like Terms Resources - A collection of resources for distributive Property & Combining Like Terms
Students will practice using the distributive property and combining like terms to simplify expressions
Blendspace - Rewriting Expressions - A collection of resources for re-writing expressions
Combining Like Terms Game My.hrw.com
Challenge Practice
Lesson Quizzes
Homework Check
“Ready to Go On” Quesitons
Mid-Chapter Quizzes
Chapter Reviews
Interactive practice quizzes
Formative Assessment digital tools: Socrative
Blendspace
Insidemathematics
Mathematics Grade 7 - Academic 11
UNIT 2: Expressions and Equations (cont.)
Core Content Instructional Actions Technology
Resources
Objectives Alignment to CCSS Recommend Activities/Strategies
Assessment Check
Points
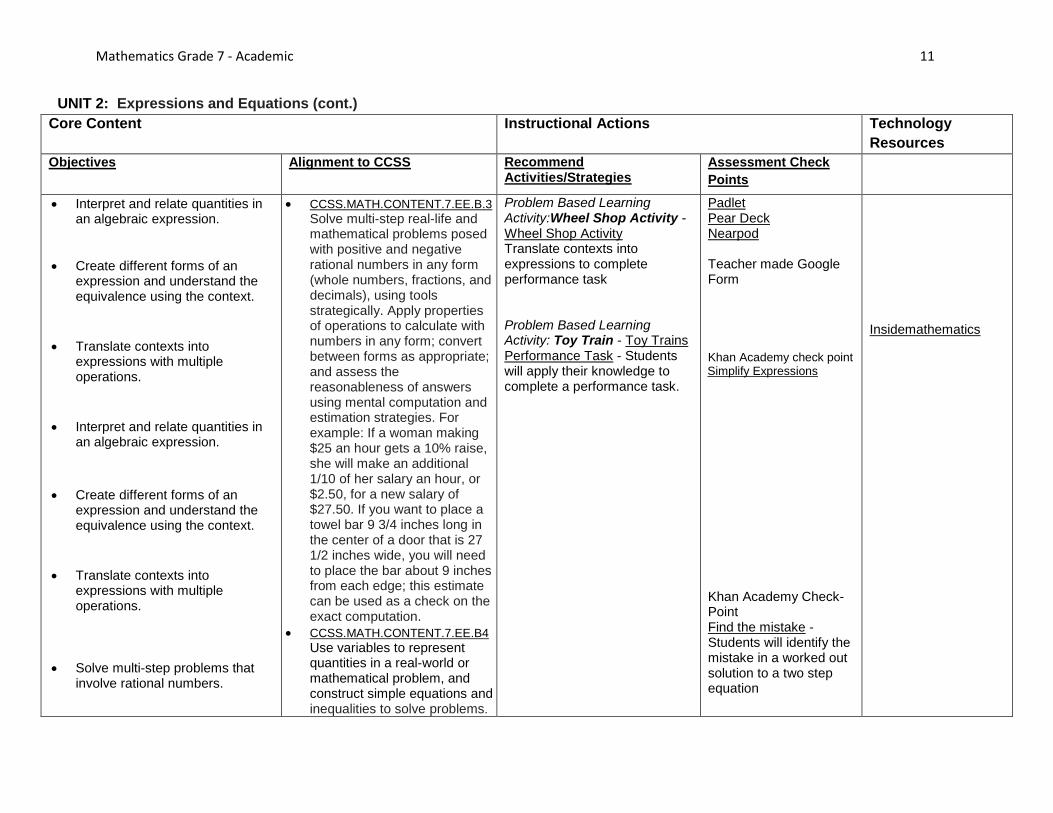
Interpret and relate quantities in an algebraic expression.
Create different forms of an expression and understand the equivalence using the context.
Translate contexts into
expressions with multiple operations.
Interpret and relate quantities in
an algebraic expression.
Create different forms of an
expression and understand the equivalence using the context.
Translate contexts into
expressions with multiple operations.
Solve multi-step problems that involve rational numbers.
CCSS.MATH.CONTENT.7.EE.B.3
Solve multi-step real-life and mathematical problems posed with positive and negative rational numbers in any form (whole numbers, fractions, and decimals), using tools strategically. Apply properties of operations to calculate with numbers in any form; convert between forms as appropriate; and assess the reasonableness of answers using mental computation and estimation strategies. For example: If a woman making $25 an hour gets a 10% raise, she will make an additional 1/10 of her salary an hour, or $2.50, for a new salary of $27.50. If you want to place a towel bar 9 3/4 inches long in the center of a door that is 27 1/2 inches wide, you will need to place the bar about 9 inches from each edge; this estimate can be used as a check on the exact computation.
CCSS.MATH.CONTENT.7.EE.B4
Use variables to represent quantities in a real-world or mathematical problem, and construct simple equations and inequalities to solve problems.
Problem Based Learning Activity:Wheel Shop Activity - Wheel Shop Activity Translate contexts into expressions to complete performance task Problem Based Learning Activity: Toy Train - Toy Trains Performance Task - Students will apply their knowledge to complete a performance task.
Padlet Pear Deck Nearpod Teacher made Google Form
Khan Academy check point
Simplify Expressions
Khan Academy Check-Point Find the mistake - Students will identify the mistake in a worked out solution to a two step equation
Insidemathematics

Mathematics Grade 7 - Academic 12
UNIT 2: Expressions and Equations (cont.)
Core Content Instructional Actions Technology
Resources
Objectives Alignment to CCSS Recommend Activities/Strategies
Assessment Check
Points
Model real-world contexts with algebraic expressions.
Assess the reasonableness of
solutions to multi-step real-world problems.
Compare algebraic solutions to
arithmetic solutions.
Interpret the solution to an equation
Solve word problems that involve multi-step equations.
Solve problems that involve multi step equations.
Graph the solution to a multi-step
inequality.
Interpret the solution to a
multi-step inequality.
Solve multi-step inequalities.
Solve word problems that
involve multi-step inequalities.
by reasoning about the quantities.
o 7.EE.B.4.A Solve word problems leading to equations of the form px + q = r and p(x + q) = r, where p, q, and r are specific rational numbers. Solve equations of these forms fluently. Compare an algebraic solution to an arithmetic solution, identifying the sequence of the operations used in each approach. For example, the perimeter of a rectangle is 54 cm. Its length is 6 cm. What is its width?
o 7.EE.B.4.B Solve word problems leading to inequalities of the form px + q > r or px + q <r, where p, q, and r are specific rational numbers. Graph the solution set of the inequality and interpret it in the context of the problem. For example: As a salesperson, you are paid $50 per week plus $3 per sale. This week you want your pay to be at least $100. Write an inequality for the number of sales you need to make, and describe the solutions.
Blendspace - Inequalities Resources- A collection of resources for solving inequalities
Inequality activity - Solving Inequalities with Inverse Operations
Blendspace
LearnZillion

Mathematics Grade 7 - Academic 13
UNIT 2: Expressions and Equations (cont.)
Instructional Adjustments: Modifications/Student difficulties/Common errors
Appropriate accommodations and/or modifications as determined by 504’s and IEP’s: shortened assignments, extended time, copy of class notes or access to notes on chromebook, preferential seating, oral reminders, etc. Ask students to restate information, directions, and assignments. Emphasize:
Performing the distributive property in an expression or equation
Seeing the connections between fractions, decimals and percents
Understanding inequalities and the solution being included or not being included

Mathematics Grade 7 - Academic 14
UNIT 3: Expand students’ comprehension of Ratios and Proportional Relationships emphasizing proportional relationships and applying concepts to real world application.
Essential Questions Enduring Understandings
What is a rate? What kinds of real world relationships are rates?
What is the constant of proportionality? How can you distinguish
relationships that are proportional from relationships that are not proportional?
When is it most convenient to use percents?
A rate is the ratio between two different quantities that have units (related quantities). Real-world relationships that are rates include unit price, scale models, recipe measurements, etc.
The constant value of the ratio of two proportional quantities is the constant of proportionality. The constant of proportionality tells you that two quantities are proportional which can translate to the coordinate plane by the following: o the ratio of each y-value to its corresponding x-value is the same throughout
the corresponding table o the graph showing the relationship between two quantities is a straight line
that passes through the origin, and o the equation can be written in the form y = mx.
It is most convenient to use percents when making comparisons.
Core Content Instructional Actions Technology
Resources
Objectives Alignment to CCSS Recommend Activities/Strategies
Assessment Check
Points
Compute unit rates with ratios made up of fractions.
Apply concept of unit rate to
problem solve.
Discover whether ratios are proportional by using a table or a graph.
CCSS.MATH.CONTENT.7.RP.A.1 Compute unit rates associated with ratios of fractions, including ratios of lengths, areas and other quantities measured in like or different units. For example, if a person walks 1/2 mile in each 1/4 hour, compute the unit rate as the complex fraction 1/2/1/4 miles per hour, equivalently 2 miles per hour.
CCSS.MATH.CONTENT.7.RP.A.2 Recognize and represent proportional relationships
Paper Pool - Students deepen their understanding of proportions and ratios. Problem Based Learning Activity: Dueling Discounts - 3 Act Math Task Students apply their knowledge of unit rate to solve a real world problem
My.hrw.com
Challenge Practice
Lesson Quizzes
Homework Check
“Ready to Go On” Quesitons
Mid-Chapter Quizzes
Chapter Reviews
Formative Assessment digital tools: Socrative Padlet Pear Deck
Illuminations
Dan Meyer Spreadsheet of 3 Act Math Tasks

Mathematics Grade 7 - Academic 15
UNIT 3: Ratios and Proportional Relationships
Core Content Instructional Actions Technology
Resources
Objectives Alignment to CCSS Recommend Activities/Strategies
Assessment Check
Points
Identify the constant of proportionality.
Relate the constant of
proportionality to unit rate.
Use equations to represent
proportional relationships.
Understand what the points
on a graph of a proportional relationship mean in terms of the context.
Recognize what (1, r) on a graph represents, where r is the unit rate.
between quantities. o 7.RP.A.2.A Decide whether
two quantities are in a proportional relationship, e.g., by testing for equivalent ratios in a table or graphing on a coordinate plane and observing whether the graph is a straight line through the origin.
o 7.RP.A.2.B Identify the constant of proportionality (unit rate) in tables, graphs, equations, diagrams, and verbal descriptions of proportional relationships.
o 7.RP.A.2.C Represent proportional relationships by equations. For example, if total cost t is proportional to the number n of items purchased at a constant price p, the relationship between the total cost and the number of items can be expressed as t = pn.
o 7.RP.A.2.D Explain what a point (x, y) on the graph of a proportional relationship means in terms of the situation, with special attention to the points (0, 0) and (1, r) where r is the unit rate.
CCSS.MATH.CONTENT.7.RP.A.3
Use proportional relationships
Discovering Proportional relationship Activity - students will explore and investigate proportional relationships
Graduation - 3 Act Task - Students apply concepts of proportions to problem solve.
Nearpod
Teacher made Google Form Khan Academy Check-Point Ratios and Proportions-
KaHoot - Solving Proportions check point
BetterLessons
Act Math Tasks
Better Lessons

Mathematics Grade 7 - Academic 16
UNIT 3: Ratios and Proportional Relationships
Core Content Instructional Actions Technology
Resources
Objectives Alignment to CCSS Recommend Activities/Strategies
Assessment Check
Points
Solve multi-step percent word problems that include tax, discount, commission, and simple interest.
Find the solution to multi-
step ratio word problems.
Solve problems that involve
percent error.
to solve multistep ratio and percent problems. Examples: simple interest, tax, markups and markdowns, gratuities and commissions, fees, percent increase and decrease, percent error
Math at the Mall - students apply discount, tax & tip while shopping at the mall Simple Interest - brainpop Simple Interest activity
Khan Academy BrainPOP
Instructional Adjustments: Modifications/Student difficulties/Common errors
Appropriate accommodations and/or modifications as determined by 504’s and IEP’s: shortened assignments, extended time, copy of class notes or access to notes on chromebook, preferential seating, oral reminders, etc. Ask students to restate information, directions, and assignments. Emphasize:
Understanding what a proportional relationship is
Multi-step process of tax, tip, discount
Different forms of a percent i.e. 7% as 0.07 or 1.07
Using proportions vs multiplying when finding tax, tip, discount

Mathematics Grade 7 - Academic 17
UNIT 4: Expand students’ understanding of Geometry to incorporate scale drawings, constructions, relationships between two- and three-dimensional figures, circles, angles, area, surface area, and volume with a strong emphasis on real world application.
Essential Questions Enduring Understandings
How to best describe relationships between the angles formed by intersecting lines? Are some relationships more useful than others in certain situations?
By definition, what is a circle?
What information do you need to know to be able to draw a
unique figure?
How can three dimensional objects be measured? Are there
some measurements that are more useful in specific situations than others?
Angle relationships are characterized by their measures. They can occur in pairs such as adjacent, complementary, supplementary and vertical.
A circle is a “set of points” each equidistant from a fixed point - the center - that all lie in the same plane. The radius determines the length of the diameter, the circumference, and the area all of which can be used to describe the size of a circle.
Needed information to draw a unique figure includes: side lengths or height of the figure, the relationship of the sides to each other, angle relationships and the direction the figure is facing.
Three-dimensional figures can be measured by their surface area and volume. Surface area is more useful when you want to know how much of the surface of the figure you can cover. Volume is more useful when you want to know how much space it takes up or how much space is inside it.
Core Content Instructional Actions Technology
Resources
Objectives Alignment to CCSS Recommend Activities/Strategies
Assessment Check
Points
Identify corresponding sides of scaled geometric figures.
Compute scale factor when given an actual figure and a scale drawing or multiple scale drawings.
Compute lengths and areas of scaled drawings from actual figures.
Compute lengths and areas of actual figures from scale drawings.
CCSS.MATH.CONTENT.7.G.A.1 Solve problems involving scale drawings of geometric figures, including computing actual lengths and areas from a scale drawing and reproducing a scale drawing at a different scale.
Scale Drawing - BrainPop
My.hrw.com
Challenge Practice
Lesson Quizzes
Homework Check
“Ready to Go On” Questions
Mid-Chapter Quizzes
Chapter Reviews
Interactive practice quizzes
Formative Assessment digital tools:
BrainPOP

Mathematics Grade 7 - Academic 18
UNIT 4: Geometry (cont.)
Core Content Instructional Actions Technology
Resources
Objectives Alignment to CCSS Recommend Activities/Strategies
Assessment Check
Points
Classify pairs of angles as supplementary, complementary, adjacent, or vertical.
Solve problems involving supplementary, complementary, adjacent or vertical angles.
Understand attributes of triangles and other geometric figures.
Construct triangles and parallelograms using the appropriate tools.
Identify unique and non-unique triangles.
Understand parallel and perpendicular planes.
Identify and analyze the plane sections of rectangular prisms.
Identify and analyze the plane sections of rectangular pyramids.
Construct specified plane sections when given a figure.
CCSS.MATH.CONTENT.7.G.B.5 Use facts about supplementary, complementary, vertical, and adjacent angles in a multi-step problem to write and solve simple equations for an unknown angle in a figure.
CCSS.MATH.CONTENT.7.G.A.2 Draw (freehand, with ruler and protractor, and with technology) geometric shapes with given conditions. Focus on constructing triangles from three measures of angles or sides, noticing when the conditions determine a unique triangle, more than one triangle, or no triangle. CCSS.MATH.CONTENT.7.G.A.3 Describe the two-dimensional figures that result from slicing three-dimensional figures, as in plane sections of right rectangular prisms and right rectangular pyramids.
CCSS.MATH.CONTENT.7.G.B.6 Solve real-world and mathematical problems involving
Complementary/Supplementary
Video & Resources - Khan Academy
Complementary/Supplementary
Practice - practice for identifying Complementary/Supplementary
Practice - practice finding angle measure
Angle Sums - exploring the interior
angles of polygons
Draw Geometric Shapes with given conditions - construct triangles given specific angle measurements
Socrative Padlet Pear Deck Nearpod
Teacher made Google Form
Kahoot – classifying angles
Quizzizz - Complementary, Supplementary, Vertical & adjacent
Kahoot - triangle attributes
Kahoot - parallel and perpendicular lines
Khan Academy xpmath
Math Games
Illuminations LearnZillion

Mathematics Grade 7 - Academic 19
UNIT 4: Geometry (cont.)
Core Content Instructional Actions Technology
Resources
Objectives Alignment to CCSS Recommend Activities/Strategies
Assessment Check
Points
Solve problems involving the area of basic polygons and composite figures.
Solve word problems involving volume.
Solve problems involving the volume of prisms and composite figures.
Solve problems involving the surface area of prisms and composite figures.
Identify parts of a circle.
Solve problems that involve the circumference of a circle.
Relate the circumference of a circle to its area.
Solve problems that involve the area of a circle.
area, volume and surface area of two- and three-dimensional objects composed of triangles, quadrilaterals, polygons, cubes, and right prisms.
CCSS.MATH.CONTENT.7.G.B.4 Know the formulas for the area and circumference of a circle and use them to solve problems; give an informal derivation of the relationship between the circumference and area of a circle.
Sand Under the Swing Set Connecting concept of volume of a prism to real world problem. Problem Based Learning Activity: Painting A Room - 3 ACT task figuring out the number of gallons of paint to paint the room
The Ratio of Circumference to Diameter - discover the formula for circumference
Discovering Pi - using Geogebra to
record observations between
circumference and diameter
Relationship between Circumference & Diameter - using Geogebra to record observations between circumference and diameter
Illustrative Mathematics
Act Math Tasks
Illuminations
GeoGebra
GeoGebra

Mathematics Grade 7 - Academic 20
UNIT 4: Geometry (cont.)
Core Content Instructional Actions Technology
Resources
Objectives Alignment to CCSS Recommend Activities/Strategies
Assessment Check
Points
Pizza Crusts - performance task to
calculate area and perimeters of
squares and rectangles and
find circumference and area of a
circle. Students must find
dimensions of rectangles that have a
given area and work from area to
circumference of a pizza.
inside mathematics
Instructional Adjustments: Modifications/Student difficulties/Common errors
Appropriate accommodations and/or modifications as determined by 504’s and IEP’s: shortened assignments, extended time, copy of class notes or access to notes on chromebook, preferential seating, oral reminders, etc. Ask students to restate information, directions, and assignments. Emphasize:
Using the correct measurements for the appropriate pieces of the formulas in a composite figure
Circles - radius & diameter - the difference between the 2
Surface Area - using nets and visualizing the 3D object

Mathematics Grade 7 - Academic 21
UNIT 5: Expand students’ knowledge of Statistics and Probability to include making inferences about populations and probability models as well as apply concepts to real world application.
Essential Questions Enduring Understandings
How can you draw conclusions about the characteristics of a large group?
Suppose you want to compare the characteristics of two groups of
people or things. How can you draw conclusions about the groups without checking every member of each group?
How do you measure probability? Can probability be used to
predict future events? How confident can you be in your predictions?
How do you measure the probability of more than one event?
Collecting a representative sample of a larger group - population - you are studying, valid inferences about the entire group.
If the researcher writes a clear statistical question, he or she can properly divide the entire population into multiple groups.
The probability of an event can be described on a scale from impossible to certain using words or a number. You can use theoretical or experimental probability to determine how likely an event is to occur and make decisions about how often the event will occur in a related situation.
If more than one event is involved, probability can be found by representing the sample space for compound events using a variety of methods (tree diagrams, tables, organized lists, and simulations). Theoretical probability can be used to find the relative likelihood of multiple events.
Core Content Instructional Actions Technology
Resources
Objectives Alignment to CCSS Recommend Activities/Strategies
Assessment Check
Points
Analyze a statistical question and determine the population under investigation.
Discern between populations and samples and identify each for a given context.
Identify representative samples using probabilistic reasoning.
Understand that sample statistics are used to make inferences about a
CCSS.MATH.CONTENT.7.SP.A.1 Understand that statistics can be used to gain information about a population by examining a sample of the population; generalizations about a population from a sample are valid only if the sample is representative of that population. Understand that random sampling tends to produce representative samples and support valid inferences.
CCSS.MATH.CONTENT.7.SP.A.2 Use data from a random sample
Pick A Pocket Activity: Pick A Pocket Activity - students will use statistics concepts including average, measures of center, measures of dispersion, the distribution of data, and the interpretation of data sets.
My.hrw.com
Challenge Practice
Lesson Quizzes
Homework Check
“Ready to Go On” Questions
Mid-Chapter Quizzes
Chapter Reviews
Interactive practice quizzes
inside mathematics

Mathematics Grade 7 - Academic 22
UNIT 5: Statistics and Probability (cont.)
Core Content Instructional Actions Technology
Resources
Objectives Alignment to CCSS Recommend Activities/Strategies
Assessment Check
Points
population characteristic.
Investigate the validity of inferences made from representative and nonrepresentative samples.
Generate random samples from a given population.
Use sample statistics to make inferences about a population.
Understand and interpret variability in multiple samples of the same size.
Use measures of variability (IQR and MAD) to judge accuracy of multiple samples of different sizes.
Visually compare 2 data sets (dot plots or box plots).
Numerically compare 2 data sets using measures of center (mean and median) and measures of variability (IQR and MAD).
Relate differences in means between 2 data sets to the variability (MAD).
to draw inferences about a population with an unknown characteristic of interest. Generate multiple samples (or simulated samples) of the same size to gauge the variation in estimates or predictions. For example, estimate the mean word length in a book by randomly sampling words from the book; predict the winner of a school election based on randomly sampled survey data. Gauge how far off the estimate or prediction might be. Draw informal comparative inferences about two populations.
CCSS.MATH.CONTENT.7.SP.B.3 Informally assess the degree of visual overlap of two numerical data distributions with similar variabilities, measuring the difference between the centers by expressing it as a multiple of a measure of variability. For example, the mean height of players on the basketball team is 10 cm greater than the mean height of players on the soccer team, about twice the variability (mean absolute deviation) on either team; on a dot plot, the separation between the two distributions of heights is noticeable.
Through the Grapevine Activity: Through the Grapevine - students use concepts of statistics including measures of centerand representation, proportional reasoning, analyze trends in data sets, and design their own survey.
Probability Videos & Activities - Khan Academy
Formative Assessment digital tools: Socrative Padlet Pear Deck Nearpod Teacher Made Google Form
Kahoot - sample statistic
Kahoot - measures of variability
Khan Academy
Mathematics Grade 7 - Academic 23
UNIT 5: Statistics and Probability (cont.)
Core Content Instructional Actions Technology
Resources
Objectives Alignment to CCSS Recommend Activities/Strategies
Assessment Check
Points
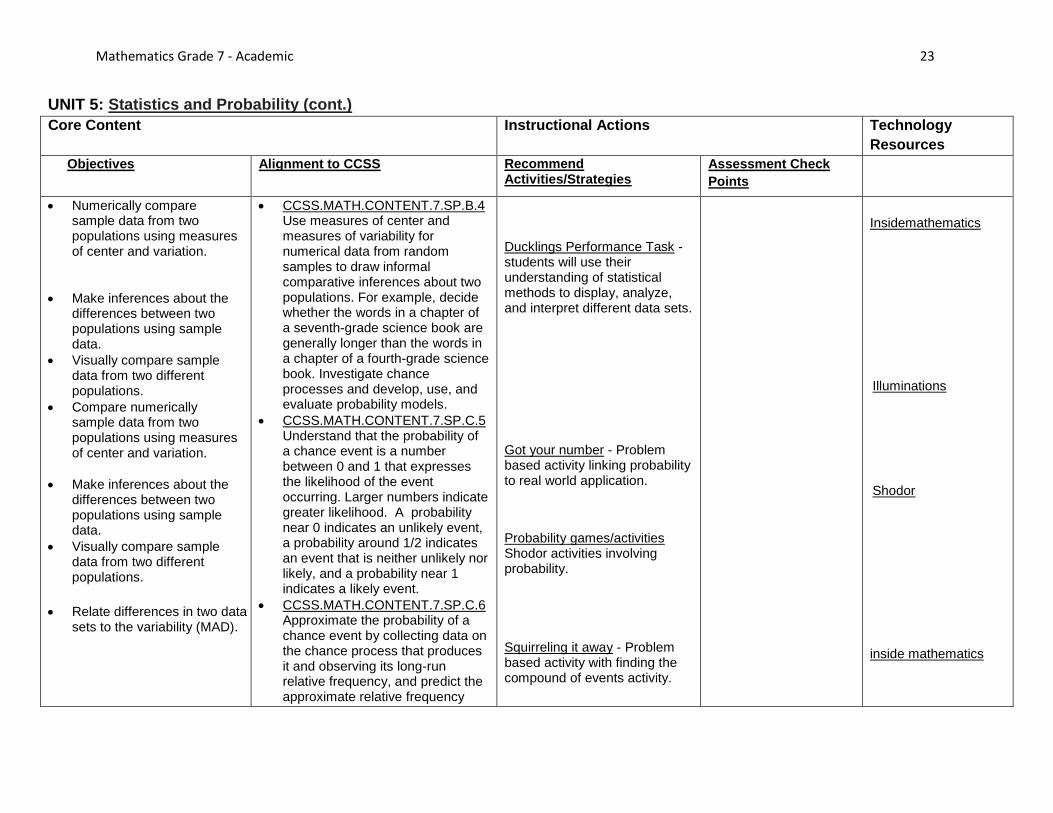
Numerically compare sample data from two populations using measures of center and variation.
Make inferences about the differences between two populations using sample data.
Visually compare sample data from two different populations.
Compare numerically sample data from two populations using measures of center and variation.
Make inferences about the differences between two populations using sample data.
Visually compare sample data from two different populations.
Relate differences in two data
sets to the variability (MAD).
CCSS.MATH.CONTENT.7.SP.B.4 Use measures of center and measures of variability for numerical data from random samples to draw informal comparative inferences about two populations. For example, decide whether the words in a chapter of a seventh-grade science book are generally longer than the words in a chapter of a fourth-grade science book. Investigate chance processes and develop, use, and evaluate probability models.
CCSS.MATH.CONTENT.7.SP.C.5 Understand that the probability of a chance event is a number between 0 and 1 that expresses the likelihood of the event occurring. Larger numbers indicate greater likelihood. A probability near 0 indicates an unlikely event, a probability around 1/2 indicates an event that is neither unlikely nor likely, and a probability near 1 indicates a likely event.
CCSS.MATH.CONTENT.7.SP.C.6 Approximate the probability of a chance event by collecting data on the chance process that produces it and observing its long-run relative frequency, and predict the approximate relative frequency
Ducklings Performance Task - students will use their understanding of statistical methods to display, analyze, and interpret different data sets.
Got your number - Problem based activity linking probability to real world application.
Probability games/activities Shodor activities involving probability.
Squirreling it away - Problem based activity with finding the compound of events activity.
Insidemathematics
Illuminations
Shodor
inside mathematics

Mathematics Grade 7 - Academic 24
UNIT 5: Statistics and Probability (cont.)
Core Content Instructional Actions Technology
Resources
Objectives Alignment to CCSS Recommend Activities/Strategies
Assessment Check
Points
Describe the likelihood of chance events as impossible, likely, unlikely, or certain.
Understand that all probabilities are represented by a number from 0 to 1.
Calculate simple probabilities.
Know that the probability of an unlikely event is closer to 0 and a likely event is closer to 1.
Understand that the sum of
the probabilities of all possible outcomes is equal to 1.
Understand statistical experiments and explain the difference between observed and possible outcomes.
Find the relative frequency of an event.
Understand that relative frequencies approach theoretical probability as
given the probability. For example, when rolling a number cube 600 times, predict that a 3 or 6 would be rolled roughly 200 times, but probably not exactly 200 times.
CCSS.MATH.CONTENT.7.SP.C.7 Develop a probability model and use it to find probabilities of events. Compare probabilities from a model to observed frequencies; if the agreement is not good, explain possible sources of the discrepancy. o 7.SP.C.7.A Develop a uniform
probability model by assigning equal probability to all outcomes, and use the model to determine probabilities of events. For example, if a student is selected at random from a class, find the probability that Jane will be selected and the probability that a girl will be selected.
o 7.SP.C.7.B Develop a probability model (which may not be uniform) by observing frequencies in data generated from a chance process. For example, find the approximate
Fair Game Performance Task - students will use understanding of probabilities to represent the sample space for simple and compound events, and use the probability to estimate probability of future outcomes.
Extra Point or 2-Point Conversion - Students will use experimental probability to make conclusions
Insidemathematics
Yummy Math

Mathematics Grade 7 - Academic 25
UNIT 5: Statistics and Probability (cont.)
Core Content Instructional Actions Technology
Resources
Objectives Alignment to CCSS Recommend Activities/Strategies
Assessment Check
Points
trial number increases.
Use the relative frequency to make predictions.
Find the relative frequency of an event.
Understand that relative frequencies approach theoretical probability as trial number increases.
Determine the sample space for simple events.
Identify the favorable outcomes in a sample space.
Distinguish uniform and nonuniform probability models.
Calculate probabilities of events containing one or more outcome(s).
Use theoretical probabilities to make predictions.
Use relative frequencies to make a probability model.
probability that a spinning penny will land heads up or that a tossed paper cup will land open-end down. Do the outcomes for the spinning penny appear to be equally likely based on the observed frequencies?
CCSS.MATH.CONTENT.7.SP.C.8Find probabilities of compound events using organized lists, tables, tree diagrams, and simulation. o 7.SP.C.8.A Understand that,
just as with simple events, the probability of a compound event is the fraction of outcomes in the sample space for which the compound event occurs. 7.SP.C.8.B Represent sample spaces for compound events using methods such as organized lists, tables and tree diagrams. For an event described in everyday language (e.g., "rolling double sixes"), identify the outcomes in the sample space which compose the event.
o 7.SP.C.8.C Design and use a simulation to generate frequencies for compound
Odds of Winning the Triple Crown - Students will calculate probability of compound events to identify probability of winning the triple crown.
Yummy Math
Mathematics Grade 7 - Academic 26
UNIT 5: Statistics and Probability (cont.)
Core Content Instructional Actions Technology
Resources
Objectives Alignment to CCSS Recommend Activities/Strategies
Assessment Check
Points
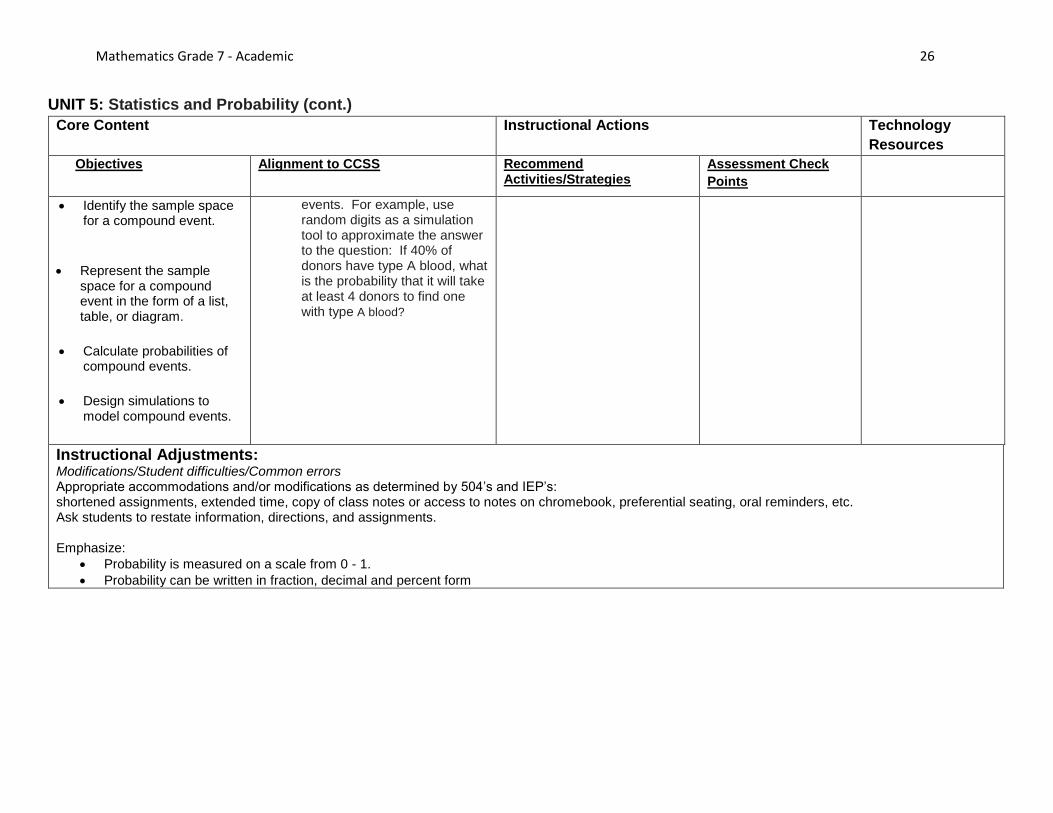
Identify the sample space for a compound event.
Represent the sample
space for a compound event in the form of a list, table, or diagram.
Calculate probabilities of
compound events.
Design simulations to
model compound events.
events. For example, use random digits as a simulation tool to approximate the answer to the question: If 40% of donors have type A blood, what is the probability that it will take at least 4 donors to find one with type A blood?
Instructional Adjustments: Modifications/Student difficulties/Common errors
Appropriate accommodations and/or modifications as determined by 504’s and IEP’s: shortened assignments, extended time, copy of class notes or access to notes on chromebook, preferential seating, oral reminders, etc. Ask students to restate information, directions, and assignments.
Emphasize:
Probability is measured on a scale from 0 - 1.
Probability can be written in fraction, decimal and percent form