Embed Size (px)
Citation preview
Course name: AP Calculus BCRevised: Aug 11, 2009
Course Description: In AP Calculus BC, students will explore four main ideas from calculus: limits, derivatives, indefinite integrals, and definite integrals. Problems will be approached using a balance of multiple representations including: graphically, numerically, analytically/algebraically, and verbally. Wherever practical, concepts will be applied to analyze real-world situations.
Graphing calculators and/or computers will be used on a regular basis to help solve problems, experiment, interpret results, and support conclusions.
Students will learn to communicate mathematics through the use of a math journal and having time each day to work cooperatively in groups to exchange ideas and approaches and to reflect on homework assignments.
A variety of assessments will be used to including paper based tests and quizzes, homework, group and individual laboratory work. In order to prepare students for the AP exam, tests and quizzes will contain questions similar to those that appear on the AP exam in terms of content, difficulty, and structure.
Primary text(s) and other major resources:Calculus of a single variable Larson, Hostetler, and Edwards(D.C. Heath and Company, 1994)
Page 1 of 20
o unit number & title Objectives(specific skills and knowledge students will have)
Essential Concepts AssessmentStudents must show proficiency with
MLR skills and knowledge in assessments marked Essential in
order to progress to the next course level.
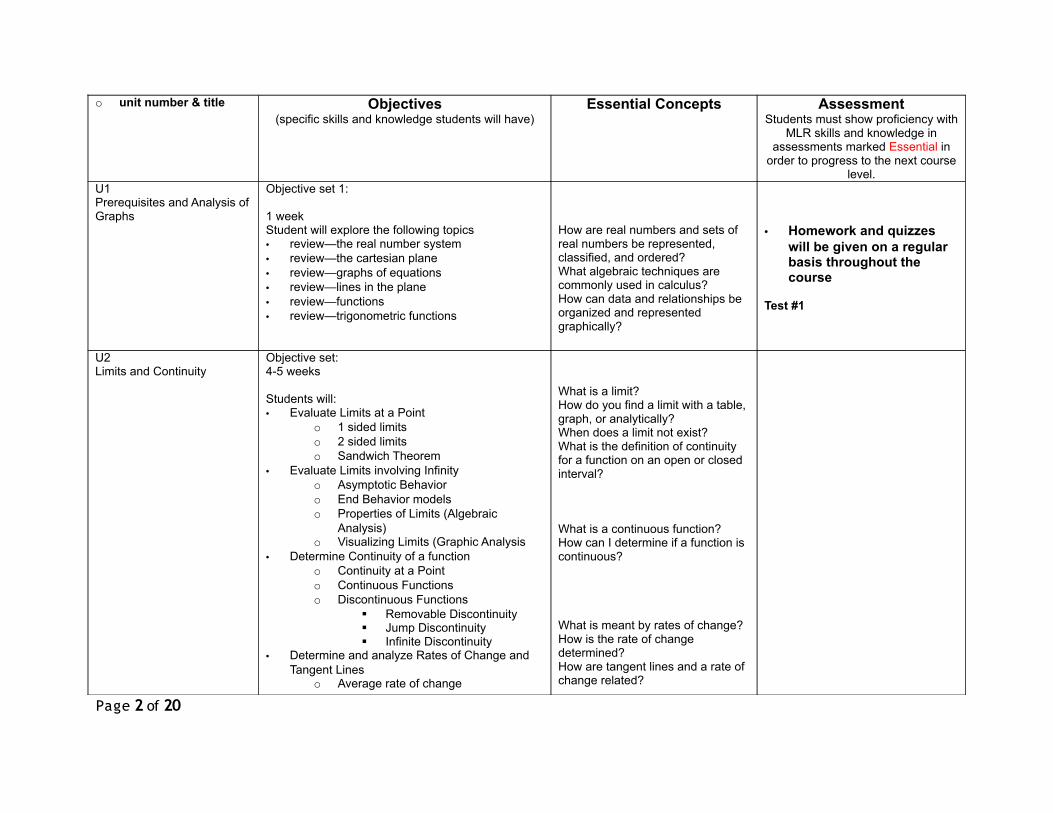
U1Prerequisites and Analysis of Graphs
Objective set 1:
1 weekStudent will explore the following topics• review—the real number system• review—the cartesian plane• review—graphs of equations• review—lines in the plane• review—functions• review—trigonometric functions
How are real numbers and sets of real numbers be represented, classified, and ordered?What algebraic techniques are commonly used in calculus?How can data and relationships be organized and represented graphically?
• Homework and quizzes will be given on a regular basis throughout the course
Test #1
U2Limits and Continuity
Objective set:4-5 weeks
Students will:• Evaluate Limits at a Point
o 1 sided limitso 2 sided limitso Sandwich Theorem
• Evaluate Limits involving Infinityo Asymptotic Behavioro End Behavior modelso Properties of Limits (Algebraic
Analysis)o Visualizing Limits (Graphic Analysis
• Determine Continuity of a functiono Continuity at a Pointo Continuous Functionso Discontinuous Functions
Removable Discontinuity Jump Discontinuity Infinite Discontinuity
• Determine and analyze Rates of Change and Tangent Lines
o Average rate of change
What is a limit?How do you find a limit with a table, graph, or analytically?When does a limit not exist?What is the definition of continuity for a function on an open or closed interval?
What is a continuous function?How can I determine if a function is continuous?
What is meant by rates of change?How is the rate of change determined?How are tangent lines and a rate of change related?
Page 2 of 20
o unit number & title Objectives(specific skills and knowledge students will have)
Essential Concepts AssessmentStudents must show proficiency with
MLR skills and knowledge in assessments marked Essential in
order to progress to the next course level.
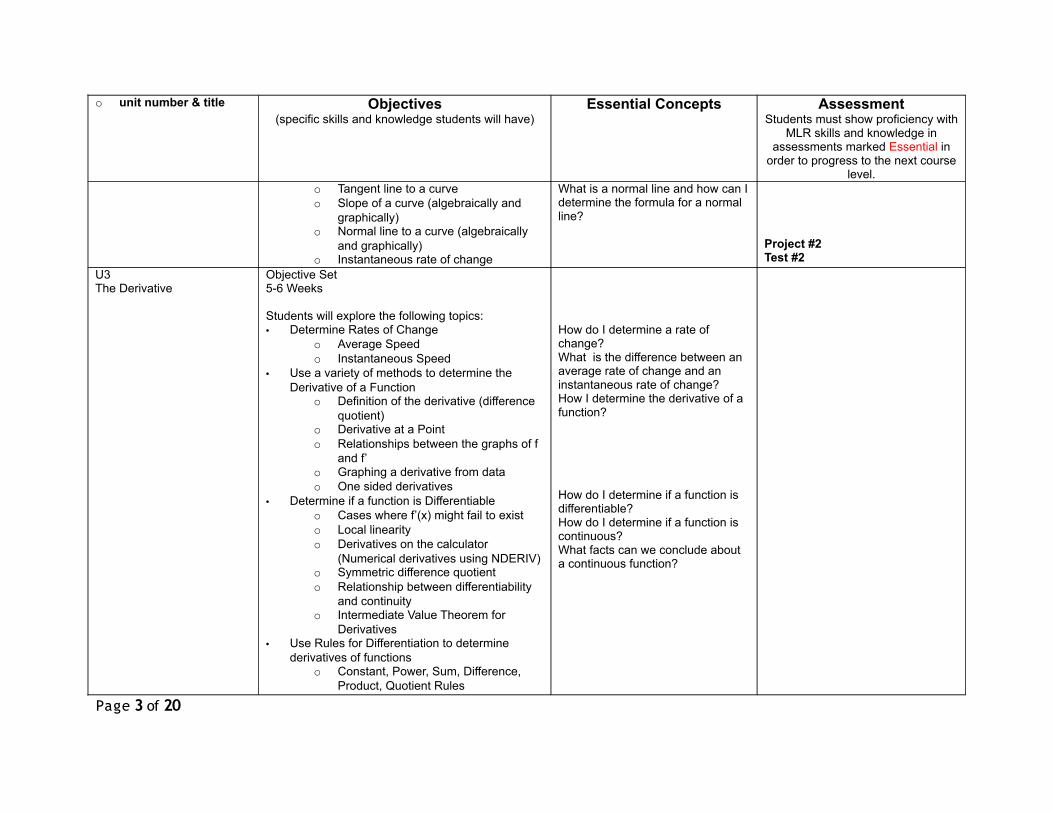
o Tangent line to a curveo Slope of a curve (algebraically and
graphically)o Normal line to a curve (algebraically
and graphically)o Instantaneous rate of change
What is a normal line and how can I determine the formula for a normal line?
Project #2Test #2
U3The Derivative
Objective Set5-6 Weeks
Students will explore the following topics:• Determine Rates of Change
o Average Speedo Instantaneous Speed
• Use a variety of methods to determine the Derivative of a Function
o Definition of the derivative (difference quotient)
o Derivative at a Pointo Relationships between the graphs of f
and f’o Graphing a derivative from datao One sided derivatives
• Determine if a function is Differentiableo Cases where f’(x) might fail to existo Local linearityo Derivatives on the calculator
(Numerical derivatives using NDERIV)o Symmetric difference quotiento Relationship between differentiability
and continuityo Intermediate Value Theorem for
Derivatives• Use Rules for Differentiation to determine
derivatives of functionso Constant, Power, Sum, Difference,
Product, Quotient Rules
How do I determine a rate of change?What is the difference between an average rate of change and an instantaneous rate of change?How I determine the derivative of a function?
How do I determine if a function is differentiable?How do I determine if a function is continuous?What facts can we conclude about a continuous function?
Page 3 of 20
o unit number & title Objectives(specific skills and knowledge students will have)
Essential Concepts AssessmentStudents must show proficiency with
MLR skills and knowledge in assessments marked Essential in
order to progress to the next course level.
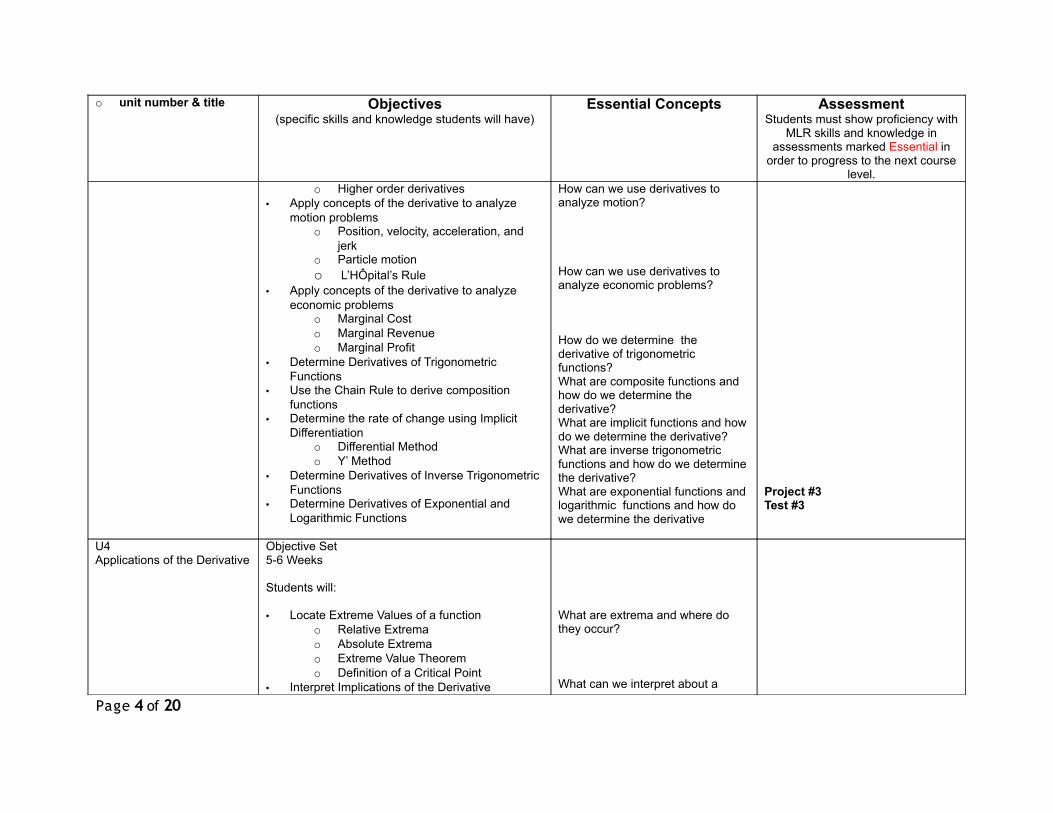
o Higher order derivatives• Apply concepts of the derivative to analyze
motion problemso Position, velocity, acceleration, and
jerko Particle motiono L’HÔpital’s Rule
• Apply concepts of the derivative to analyze economic problems
o Marginal Costo Marginal Revenueo Marginal Profit
• Determine Derivatives of Trigonometric Functions
• Use the Chain Rule to derive composition functions
• Determine the rate of change using Implicit Differentiation
o Differential Methodo Y’ Method
• Determine Derivatives of Inverse Trigonometric Functions
• Determine Derivatives of Exponential and Logarithmic Functions
How can we use derivatives to analyze motion?
How can we use derivatives to analyze economic problems?
How do we determine the derivative of trigonometric functions?What are composite functions and how do we determine the derivative?What are implicit functions and how do we determine the derivative?What are inverse trigonometric functions and how do we determine the derivative?What are exponential functions and logarithmic functions and how do we determine the derivative
Project #3Test #3
U4Applications of the Derivative
Objective Set5-6 Weeks
Students will:
• Locate Extreme Values of a functiono Relative Extremao Absolute Extremao Extreme Value Theoremo Definition of a Critical Point
• Interpret Implications of the Derivative
What are extrema and where do they occur?
What can we interpret about a
Page 4 of 20
o unit number & title Objectives(specific skills and knowledge students will have)
Essential Concepts AssessmentStudents must show proficiency with
MLR skills and knowledge in assessments marked Essential in
order to progress to the next course level.
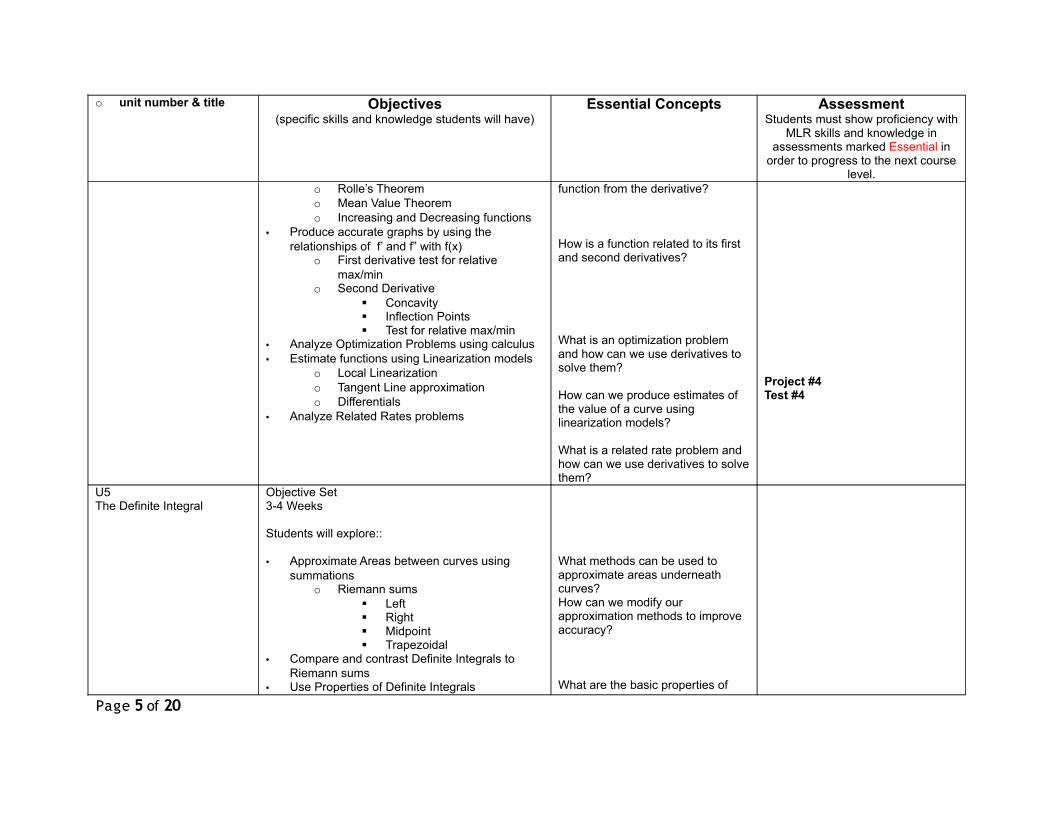
o Rolle’s Theoremo Mean Value Theoremo Increasing and Decreasing functions
• Produce accurate graphs by using the relationships of f’ and f” with f(x)
o First derivative test for relative max/min
o Second Derivative Concavity Inflection Points Test for relative max/min
• Analyze Optimization Problems using calculus• Estimate functions using Linearization models
o Local Linearizationo Tangent Line approximationo Differentials
• Analyze Related Rates problems
function from the derivative?
How is a function related to its first and second derivatives?
What is an optimization problem and how can we use derivatives to solve them?
How can we produce estimates of the value of a curve using linearization models?
What is a related rate problem and how can we use derivatives to solve them?
Project #4Test #4
U5The Definite Integral
Objective Set3-4 Weeks
Students will explore::
• Approximate Areas between curves using summations
o Riemann sums Left Right Midpoint Trapezoidal
• Compare and contrast Definite Integrals to Riemann sums
• Use Properties of Definite Integrals
What methods can be used to approximate areas underneath curves?How can we modify our approximation methods to improve accuracy?
What are the basic properties of
Page 5 of 20
o unit number & title Objectives(specific skills and knowledge students will have)
Essential Concepts AssessmentStudents must show proficiency with
MLR skills and knowledge in assessments marked Essential in
order to progress to the next course level.
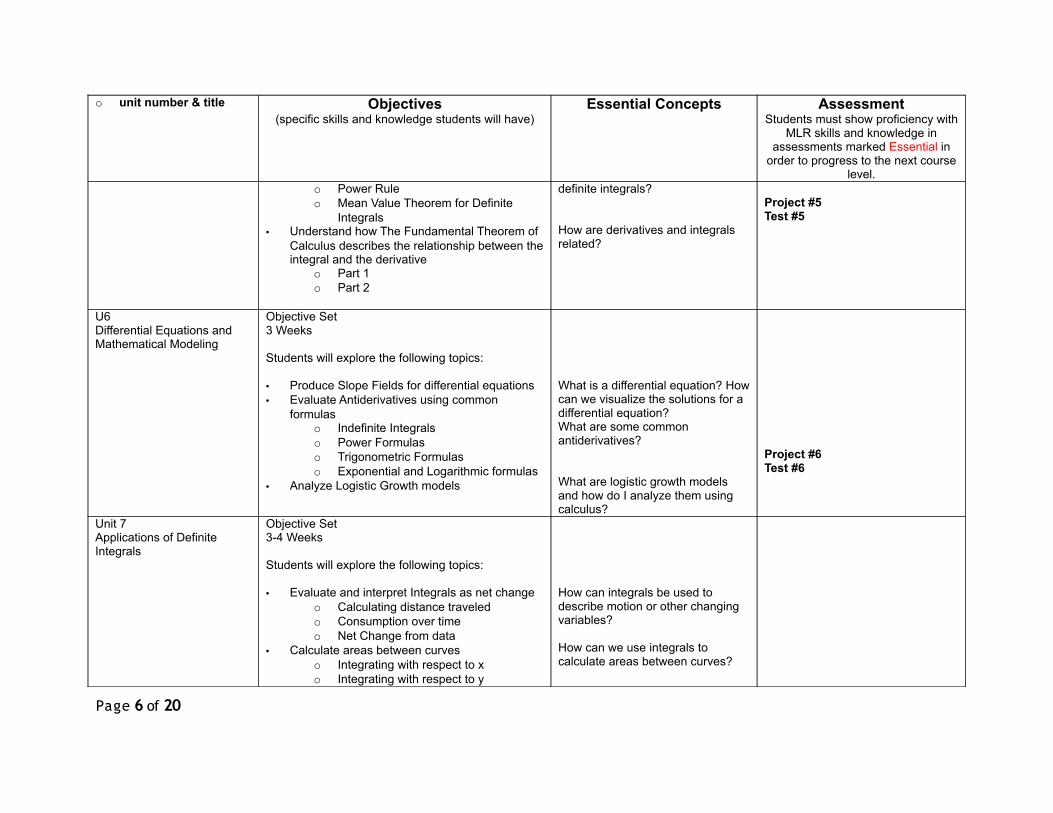
o Power Ruleo Mean Value Theorem for Definite
Integrals• Understand how The Fundamental Theorem of
Calculus describes the relationship between the integral and the derivative
o Part 1o Part 2
definite integrals?
How are derivatives and integrals related?
Project #5Test #5
U6Differential Equations and Mathematical Modeling
Objective Set3 Weeks
Students will explore the following topics:
• Produce Slope Fields for differential equations• Evaluate Antiderivatives using common
formulaso Indefinite Integralso Power Formulaso Trigonometric Formulaso Exponential and Logarithmic formulas
• Analyze Logistic Growth models
What is a differential equation? How can we visualize the solutions for a differential equation?What are some common antiderivatives?
What are logistic growth models and how do I analyze them using calculus?
Project #6Test #6
Unit 7Applications of Definite Integrals
Objective Set3-4 Weeks
Students will explore the following topics:
• Evaluate and interpret Integrals as net changeo Calculating distance traveledo Consumption over timeo Net Change from data
• Calculate areas between curveso Integrating with respect to xo Integrating with respect to y
How can integrals be used to describe motion or other changing variables?
How can we use integrals to calculate areas between curves?
Page 6 of 20
o unit number & title Objectives(specific skills and knowledge students will have)
Essential Concepts AssessmentStudents must show proficiency with
MLR skills and knowledge in assessments marked Essential in
order to progress to the next course level.
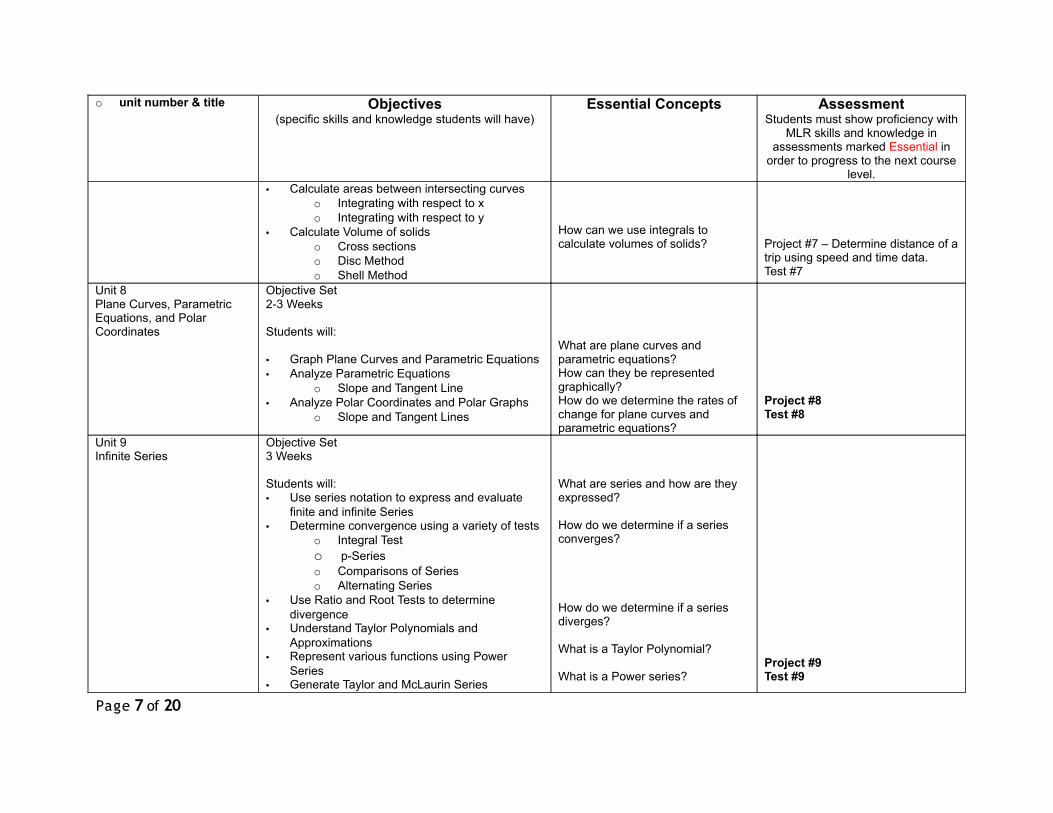
• Calculate areas between intersecting curveso Integrating with respect to xo Integrating with respect to y
• Calculate Volume of solidso Cross sectionso Disc Methodo Shell Method
How can we use integrals to calculate volumes of solids? Project #7 – Determine distance of a
trip using speed and time data.Test #7
Unit 8Plane Curves, Parametric Equations, and Polar Coordinates
Objective Set2-3 Weeks
Students will:
• Graph Plane Curves and Parametric Equations• Analyze Parametric Equations
o Slope and Tangent Line• Analyze Polar Coordinates and Polar Graphs
o Slope and Tangent Lines
What are plane curves and parametric equations?How can they be represented graphically?How do we determine the rates of change for plane curves and parametric equations?
Project #8Test #8
Unit 9Infinite Series
Objective Set3 Weeks
Students will:• Use series notation to express and evaluate
finite and infinite Series• Determine convergence using a variety of tests
o Integral Testo p-Serieso Comparisons of Serieso Alternating Series
• Use Ratio and Root Tests to determine divergence
• Understand Taylor Polynomials and Approximations
• Represent various functions using Power Series
• Generate Taylor and McLaurin Series
What are series and how are they expressed?
How do we determine if a series converges?
How do we determine if a series diverges?
What is a Taylor Polynomial?
What is a Power series?Project #9Test #9
Page 7 of 20
o unit number & title Objectives(specific skills and knowledge students will have)
Essential Concepts AssessmentStudents must show proficiency with
MLR skills and knowledge in assessments marked Essential in
order to progress to the next course level.
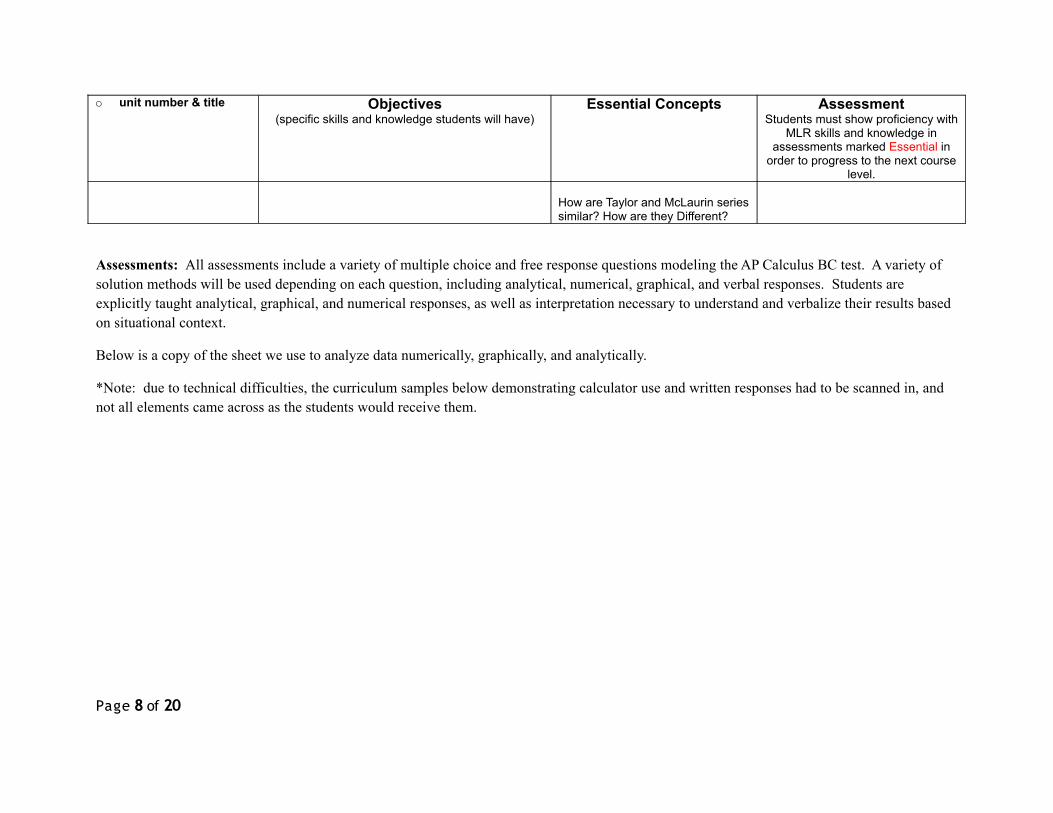
How are Taylor and McLaurin series similar? How are they Different?
Assessments: All assessments include a variety of multiple choice and free response questions modeling the AP Calculus BC test. A variety of solution methods will be used depending on each question, including analytical, numerical, graphical, and verbal responses. Students are explicitly taught analytical, graphical, and numerical responses, as well as interpretation necessary to understand and verbalize their results based on situational context.
Below is a copy of the sheet we use to analyze data numerically, graphically, and analytically.
*Note: due to technical difficulties, the curriculum samples below demonstrating calculator use and written responses had to be scanned in, and not all elements came across as the students would receive them.
Page 8 of 20
Page 9 of 20
Page 10 of 20
Page 11 of 20
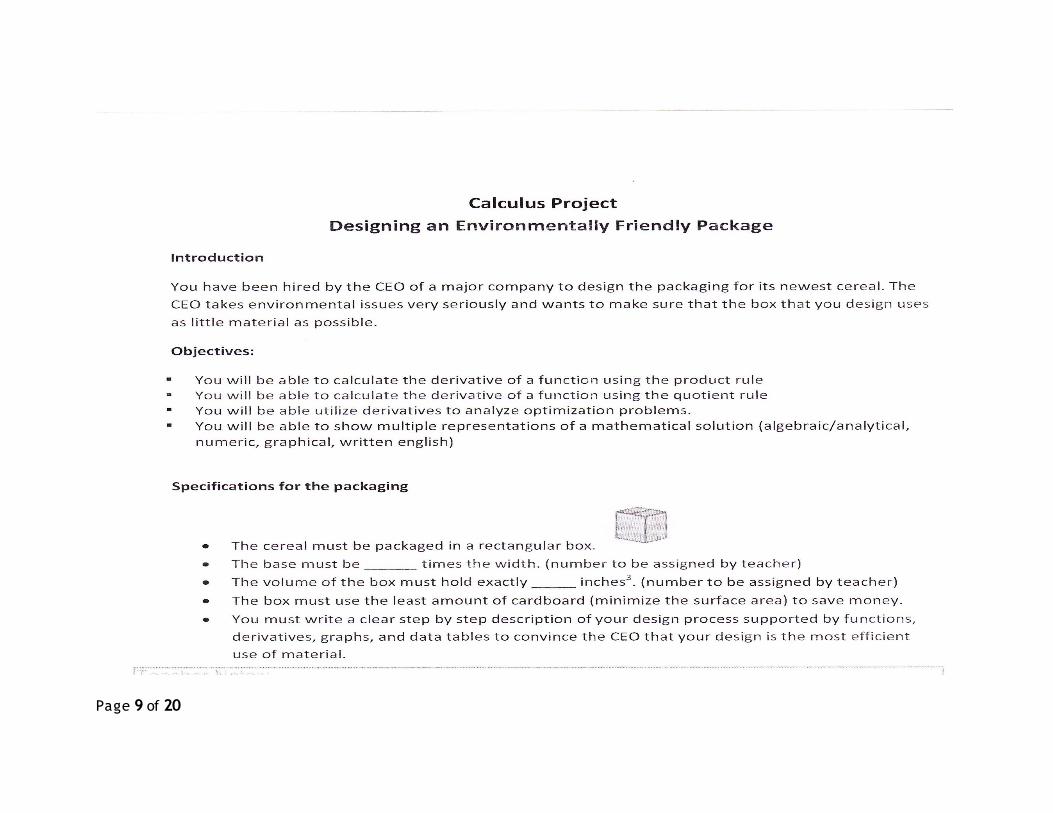
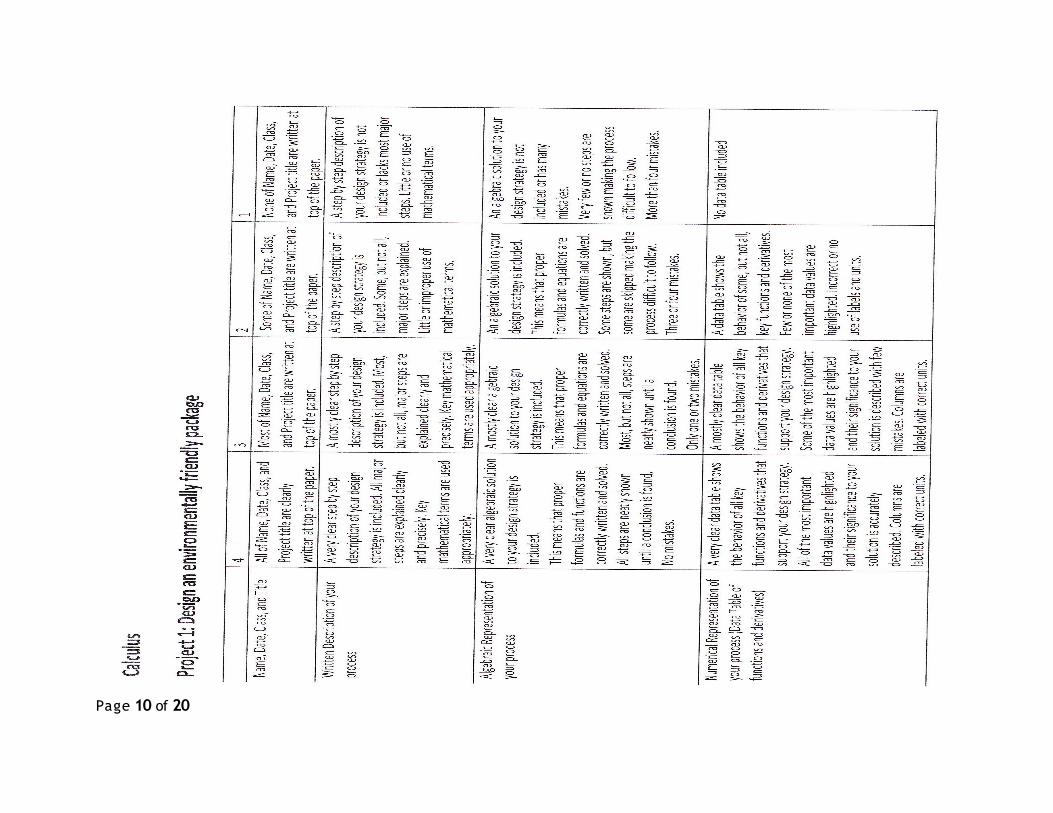
Calculus
Project - Optimize our Zoo Using Functions (Revised)
Introduction:
You have been hired by the local community to advise them on how to best design their new zoo. They have limited materials to use and they want to ensure that they get the most out of the materials. You will need to examine their requirements, determine the best way to meet the requirements, and make a scale model or map of your proposed design.
Objectives:
1. You will be able to model real situations with functions.
2. You will be able to represent functions algebraically, numerically (data table), and graphically.
3. You will be able to use proportions to produce a map to scale.
Zoo Requirements:
1. Gorilla
a. We have ______ feet of fence to use for the gorilla cage.
Page 12 of 20
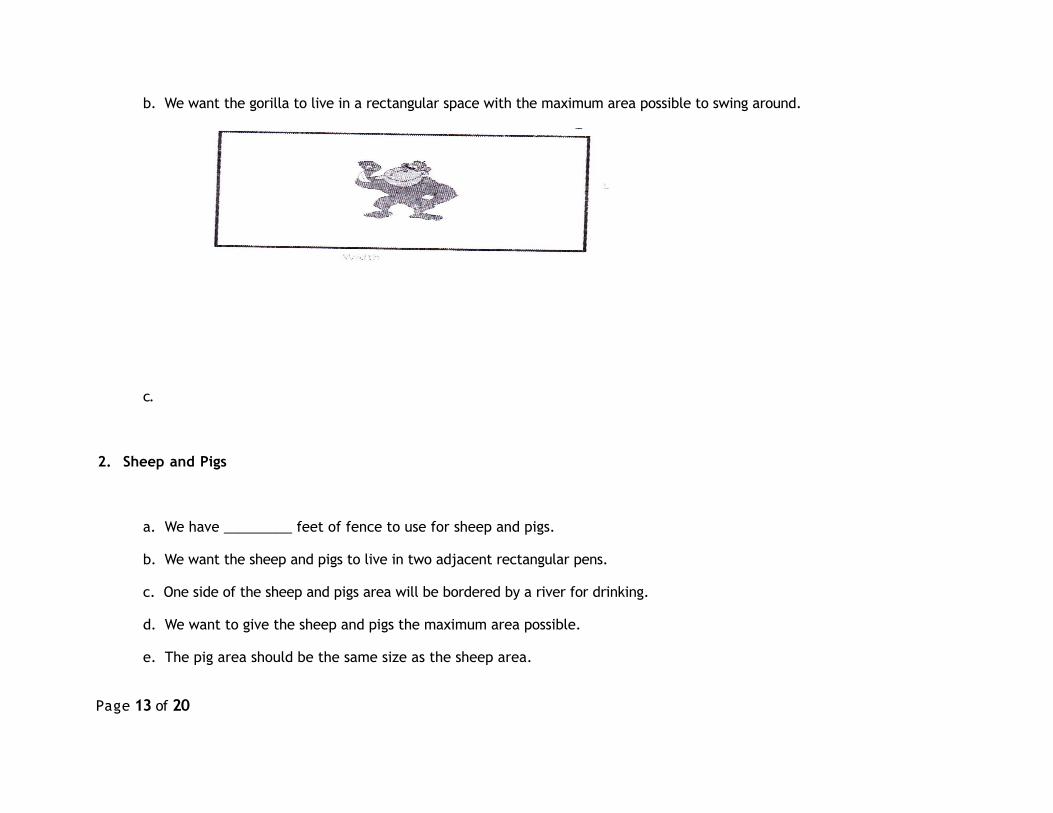
b. We want the gorilla to live in a rectangular space with the maximum area possible to swing around.
c.
2. Sheep and Pigs
a. We have _________ feet of fence to use for sheep and pigs.
b. We want the sheep and pigs to live in two adjacent rectangular pens.
c. One side of the sheep and pigs area will be bordered by a river for drinking.
d. We want to give the sheep and pigs the maximum area possible.
e. The pig area should be the same size as the sheep area.
Page 13 of 20
3. Lions, Tigers, and Bears
a. We have __________ feet of fence to use for lions, tigers, and bears.
b. The animals will live in one rectangular area divided into three equal parts.
c. We want the lions, tigers, and bears to live in the maximum area possible.
Page 14 of 20

4. Shark Aquarium
a. We want a rectangular aquarium with the left, right, front, back, and bottom made of clear glass so people can see the sharks.
b. The top is open (no glass used for top).
c. The length should be ________ times the width.
d. The tank should hold a volume of ________
e. We want to minimize the amount of glass we use because the material is very expensive.
Page 15 of 20
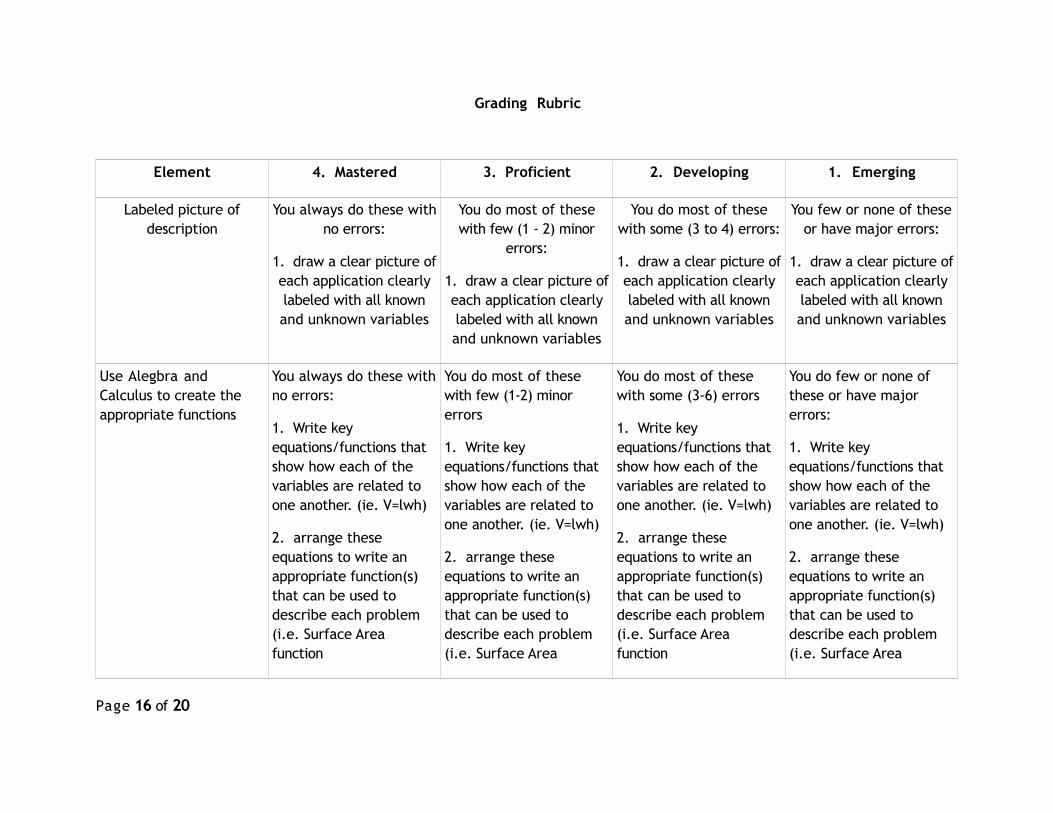
Grading Rubric
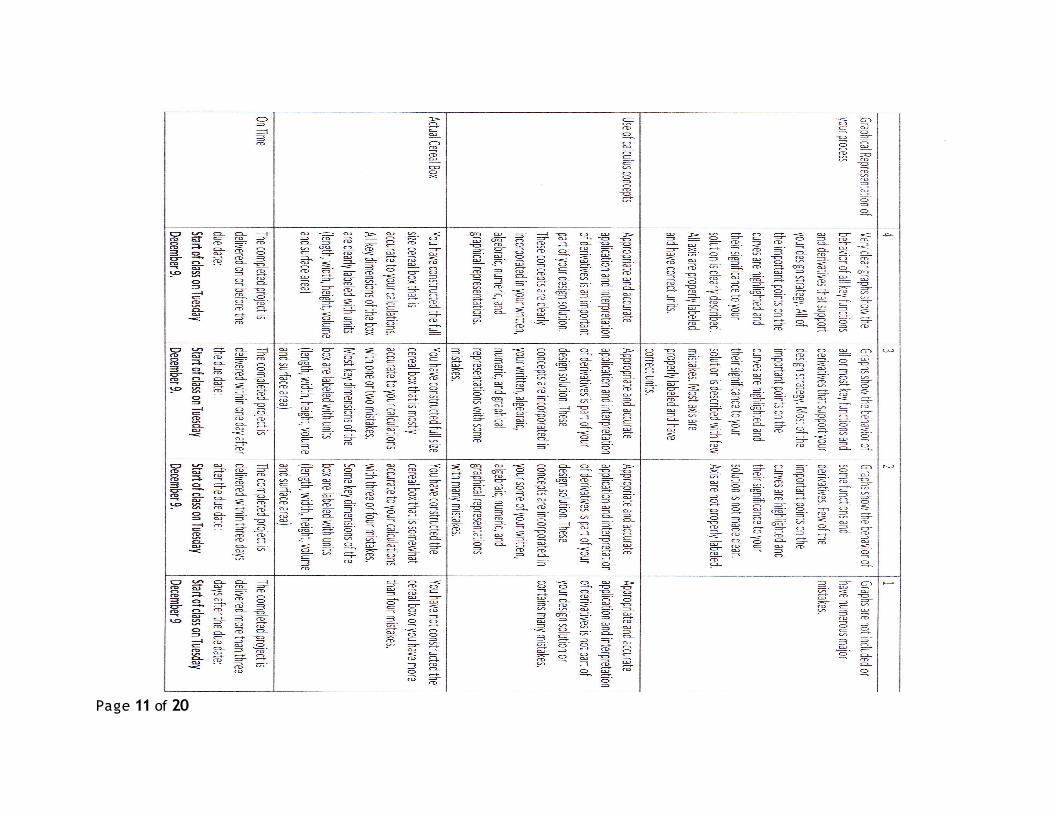
Element 4. Mastered 3. Proficient 2. Developing 1. Emerging
Labeled picture of description
You always do these with no errors:
1. draw a clear picture of each application clearly labeled with all known and unknown variables
You do most of these with few (1 - 2) minor
errors:
1. draw a clear picture of each application clearly labeled with all known and unknown variables
You do most of these with some (3 to 4) errors:
1. draw a clear picture of each application clearly labeled with all known and unknown variables
You few or none of these or have major errors:
1. draw a clear picture of each application clearly labeled with all known and unknown variables
Use Alegbra and Calculus to create the appropriate functions
You always do these with no errors:
1. Write key equations/functions that show how each of the variables are related to one another. (ie. V=lwh)
2. arrange these equations to write an appropriate function(s) that can be used to describe each problem (i.e. Surface Area function
You do most of these with few (1-2) minor errors
1. Write key equations/functions that show how each of the variables are related to one another. (ie. V=lwh)
2. arrange these equations to write an appropriate function(s) that can be used to describe each problem (i.e. Surface Area
You do most of these with some (3-6) errors
1. Write key equations/functions that show how each of the variables are related to one another. (ie. V=lwh)
2. arrange these equations to write an appropriate function(s) that can be used to describe each problem (i.e. Surface Area function
You do few or none of these or have major errors:
1. Write key equations/functions that show how each of the variables are related to one another. (ie. V=lwh)
2. arrange these equations to write an appropriate function(s) that can be used to describe each problem (i.e. Surface Area
Page 16 of 20
Element 4. Mastered 3. Proficient 2. Developing 1. Emerging
function function
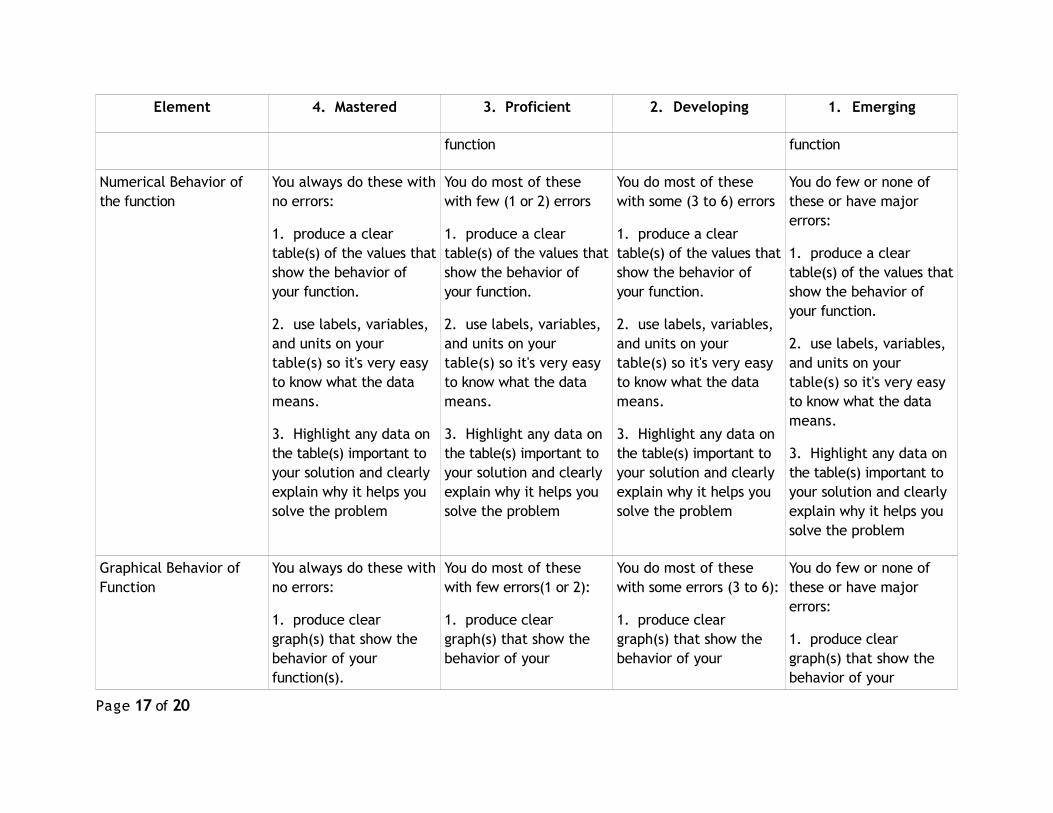
Numerical Behavior of the function
You always do these with no errors:
1. produce a clear table(s) of the values that show the behavior of your function.
2. use labels, variables, and units on your table(s) so it's very easy to know what the data means.
3. Highlight any data on the table(s) important to your solution and clearly explain why it helps you solve the problem
You do most of these with few (1 or 2) errors
1. produce a clear table(s) of the values that show the behavior of your function.
2. use labels, variables, and units on your table(s) so it's very easy to know what the data means.
3. Highlight any data on the table(s) important to your solution and clearly explain why it helps you solve the problem
You do most of these with some (3 to 6) errors
1. produce a clear table(s) of the values that show the behavior of your function.
2. use labels, variables, and units on your table(s) so it's very easy to know what the data means.
3. Highlight any data on the table(s) important to your solution and clearly explain why it helps you solve the problem
You do few or none of these or have major errors:
1. produce a clear table(s) of the values that show the behavior of your function.
2. use labels, variables, and units on your table(s) so it's very easy to know what the data means.
3. Highlight any data on the table(s) important to your solution and clearly explain why it helps you solve the problem
Graphical Behavior of Function
You always do these with no errors:
1. produce clear graph(s) that show the behavior of your function(s).
You do most of these with few errors(1 or 2):
1. produce clear graph(s) that show the behavior of your
You do most of these with some errors (3 to 6):
1. produce clear graph(s) that show the behavior of your
You do few or none of these or have major errors:
1. produce clear graph(s) that show the behavior of your
Page 17 of 20

Element 4. Mastered 3. Proficient 2. Developing 1. Emerging
2. Use labels, variables, and units on your graph(s) so it's very easy to know what the curve means.
3. Highlight any point(s) on the curve that is important to your solution and clearly explain why it helps you solve the problem.
function(s).
2. Use labels, variables, and units on your graph(s) so it's very easy to know what the curve means.
3. Highlight any point(s) on the curve that is important to your solution and clearly explain why it helps you solve the problem.
function(s).
2. Use labels, variables, and units on your graph(s) so it's very easy to know what the curve means.
3. Highlight any point(s) on the curve that is important to your solution and clearly explain why it helps you solve the problem.
function(s).
2. Use labels, variables, and units on your graph(s) so it's very easy to know what the curve means.
3. Highlight any point(s) on the curve that is important to your solution and clearly explain why it helps you solve the problem.
Solve the Problem You always do these with no errors:
1. Clearly interpret all the information from your graphs, tables, and algebra to solve the problem.
2. The solution could be one number or a set of numbers so labels and units are used to clarify.
3. If possible, a picture
You do most of these with few (1 or 2) errors.
1. Clearly interpret all the information from your graphs, tables, and algebra to solve the problem.
2. The solution could be one number or a set of numbers so labels and units are used to clarify.
3. If possible, a picture
You do most of these with some (3 to 6) errors:
1. Clearly interpret all the information from your graphs, tables, and algebra to solve the problem.
2. The solution could be one number or a set of numbers so labels and units are used to clarify.
3. If possible, a picture
You do few or none of these or have major errors:
1. Clearly interpret all the information from your graphs, tables, and algebra to solve the problem.
2. The solution could be one number or a set of numbers so labels and units are used to clarify.
Page 18 of 20
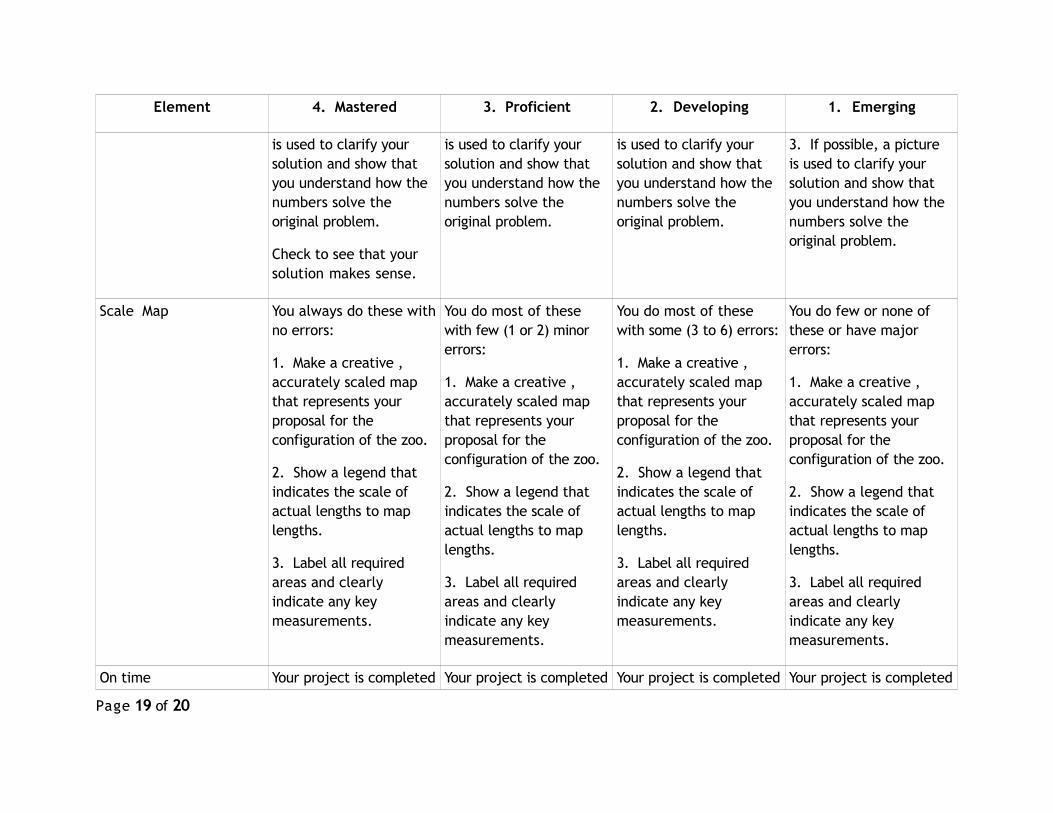
Element 4. Mastered 3. Proficient 2. Developing 1. Emerging
is used to clarify your solution and show that you understand how the numbers solve the original problem.
Check to see that your solution makes sense.
is used to clarify your solution and show that you understand how the numbers solve the original problem.
is used to clarify your solution and show that you understand how the numbers solve the original problem.
3. If possible, a picture is used to clarify your solution and show that you understand how the numbers solve the original problem.
Scale Map You always do these with no errors:
1. Make a creative , accurately scaled map that represents your proposal for the configuration of the zoo.
2. Show a legend that indicates the scale of actual lengths to map lengths.
3. Label all required areas and clearly indicate any key measurements.
You do most of these with few (1 or 2) minor errors:
1. Make a creative , accurately scaled map that represents your proposal for the configuration of the zoo.
2. Show a legend that indicates the scale of actual lengths to map lengths.
3. Label all required areas and clearly indicate any key measurements.
You do most of these with some (3 to 6) errors:
1. Make a creative , accurately scaled map that represents your proposal for the configuration of the zoo.
2. Show a legend that indicates the scale of actual lengths to map lengths.
3. Label all required areas and clearly indicate any key measurements.
You do few or none of these or have major errors:
1. Make a creative , accurately scaled map that represents your proposal for the configuration of the zoo.
2. Show a legend that indicates the scale of actual lengths to map lengths.
3. Label all required areas and clearly indicate any key measurements.
On time Your project is completed Your project is completed Your project is completed Your project is completed
Page 19 of 20
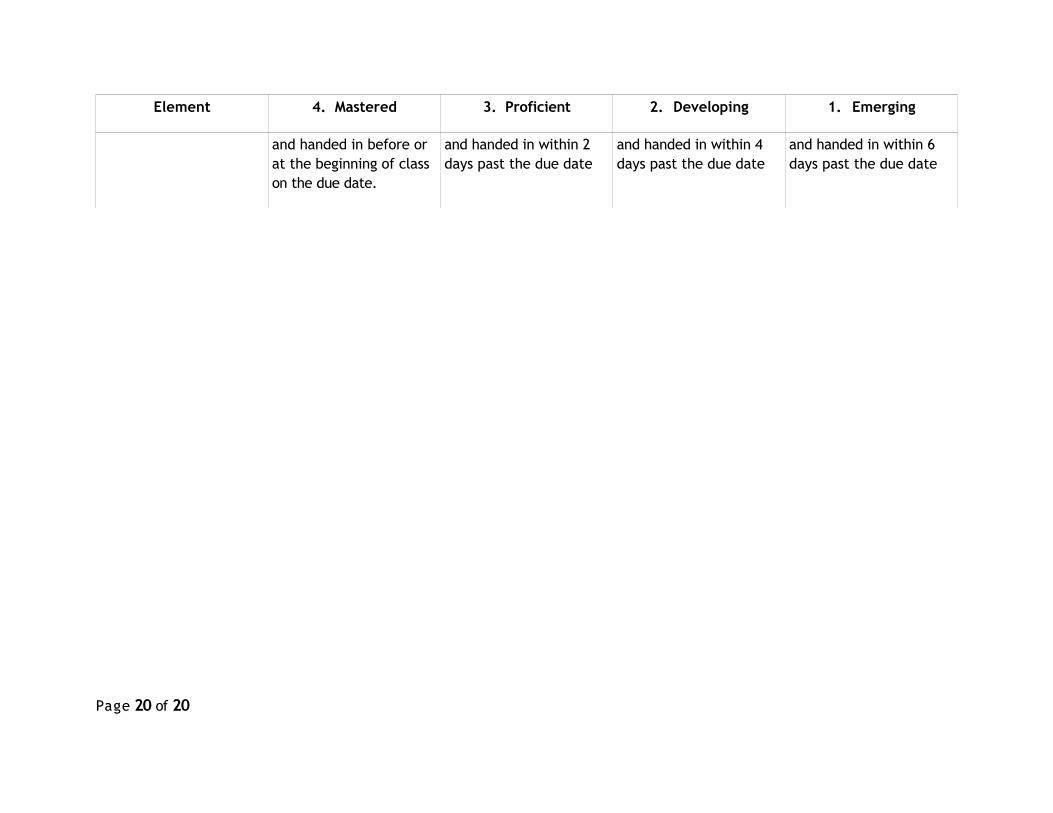
Element 4. Mastered 3. Proficient 2. Developing 1. Emerging
and handed in before or at the beginning of class on the due date.
and handed in within 2 days past the due date
and handed in within 4 days past the due date
and handed in within 6 days past the due date
Page 20 of 20