Embed Size (px)
Citation preview
Course: MGT 745 Strategic Planning, at
Francis Marion University, Florence, South Carolina
a case project by an MBA Student In Dr. David’s Spring 2017 Class
(written permission is required from Dr. David for any use of this material)
Table of Contents Page
Introduction 1Old Vision Statement 1Old Mission Statement 1Revised Vision Statement 2Revised Mission Statement 2Industry Overview 2Competitor Overview 3Competitive Profile Matrix (CPM) 4Current Financial Position 4Company Valuation 5Key Financial Ratios 6 Liquidity, Leverage, Activity Ratios 6 Profitability, Growth Ratios 7 Graph: Current and Quick Ratio 8 Graph: Debt to Equity and Net Margin Percent 9 Graph: Return on Assets and Return on Equity 10 Graph: Fixed Asset Turnover and Inventory Turnover 11 Graph: Earnings per Share 12External Factor Evaluation (EFE) Matrix 12Internal Factor Evaluation (IFE) Matrix 14SWOT Matrix 15 SO Strategy 16 WO Strategy 16 ST Strategy 17 WT Strategy 17Strategic Position and Action Evaluation (SPACE) Matrix 18Boston Consulting Group (BCG) Matrix: Automotive and Financial Division 19Boston Consulting Group (BCG): Ford Automotive Sectors 20Internal - External (IE) Matrix 21Grand Strategy Matrix 22Quantitative Strategic Planning (QSPM) Matrix 23Perceptual Map: Truck Comparisons 25Perceptual Map: Mid-Size Comparisons 25Perceptual Map: Manufacturer Comparisons 26Organizational Chart: Old vs Revised 27Company Valuations: Ford vs GM and Toyota 28Recommendations 29EPS/EBIT Analysis 30Income Statement and Balance Sheet 2014 and 2015 313-Year Projected Income Statement and Balance Sheet 32Notes to Projected Income Statement and Balance Sheet 33Statement of Projected Retained Earnings 34Historical Ratios 35Executive Summary 36
1
Introduction
Ford Motor Company
Henry Ford and his investors formed the Ford Motor Company in 1903 and introduced the Model T in 1908. Ford Motor Company was incorporated in Delaware in 1919. Ford Motor Company pioneered the modern-day assembly line allowing them to produce over half of the vehicles on the road.
Ford Motor Company is a global automotive and mobility company with headquarters in Dearborn, Michigan. The Ford core includes designing, manufacturing, marketing, financing, and servicing a full line of Ford cars, trucks, SUVs, and electrified vehicles. Ford also holds the Lincoln line of luxury vehicles. The future of Ford is in the pursuit of emerging opportunities in international markets notably and through Ford Smart Mobility. Ford aims to be a leader in connectivity, mobility, autonomous vehicles, the customer experience, and data and analytics. Additionally, Ford provides financial services through Ford Motor Credit Company LLC.
Ford is divided into two major business divisions, Automotive and Financial.
The Automotive sector deals in vehicles primarily under two brand names, Ford and Lincoln. This sector sells and provides ongoing maintenance and repair services to fleet customers and markets its products through distributors and dealers domestically and abroad. It is divided into 5 sectors: North America, South America, Middle East and Africa, Europe, and Asia Pacific.
The Financial Services sector, offers various automotive financing plans to include retail sale contracts for vehicles, leases options, wholesale financing, lending, and insurance services to commercial and retail consumers.
Old Vision Statement:
People working together as a lean, global enterprise to make people’s lives better through automotive and mobility leadership.
Old Mission Statement:
Ford. One Team. One Plan. One Goal
One Team: “People working together as a lean, global enterprise for automotive leadership, as measured by: Customer, Employee, Dealer, Investor, Supplier, Union/Council, and Community Satisfaction.”
One Plan: “Aggressively restructure to operate profitably at the current demand and changing model mix; Accelerate development of new products our customers want and value; Finance our plan and improve our balance sheet; Work together effectively as one team.”
One Goal: “An exciting viable Ford delivering profitable growth for all.”
2
Revised Vision Statement:
Ford Motor Company will be the global automotive industry leader through innovations in automotive transportation and service to its customers, employees, and the environment.
Revised Mission Statement:
Ford Motor Company strives to become the global automotive industry (3) leader delivering quality innovations to transportation (2) that meet the needs of our customers (1). Ford Motor Company is dedicated to adapting the latest technology (4, 7) to facilitate change and social connectivity through transportation (6). Our highly-trained professionals (9) support our efforts for continued growth and profitability (5) while keeping our promise of environmental responsibility and sustainability in our communities (6,8).
(1) Customers (6) Philosophy (2) Product or services (7) Self-Concept (distinctive competence)(3) Markets (8) Public image (4) Technology (9) Employees (5) Survival, growth and profitability
Industry Overview
2015 was another banner year for automobile manufacturers. U.S. industry leader General Motors was up 5% with competitors Ford and Toyota up 5.3% and Chrysler up 7.3% from 2014. There was very little market shift with no automaker gaining or losing more than 0.2% of market share from 2014. Domestic sales were led by a 55.7% growth in sales for trucks spurred by low interest rates and low gas prices. Despite trucks holding the top three best-selling vehicles in 2015, sales of small SUVs no lead the industry in market share. The combination of increasing employment, growth of the personal income, and low interest rates along with lower energy costs, has strengthened consumer spending and kept market momentum steady.
Global automotive markets also showed strong results in China and Europe but slower movement in Indonesian and Russian markets. India had strong growth at 6% in 2015 and is expected to eclipse that by a projected 9% in 2016. Forecasts for growth in these markets range from 2% – 5% through 2018. South America fell dramatically in 2015, losing 20% as a region and 22% for Brazil. Major automakers continue to invest heavily in emerging markets vying for increased market share and capitalizing on a forecasted global economic growth of 3%.
Shifts in the global emerging markets along with industry trends in consumer demand, expanded regulation for safety and fuel economy, and the use of integrated technology, will be top priorities when preparing strategic initiatives. Companies will need to navigate short term changes to build market share and profitability while also positioning themselves for success 3, 5, and 10 years from now.
The automotive industry is becoming increasingly competitive with brand loyalty and differentiation waning as the gap in vehicle quality, choice, and price becomes increasingly smaller. Automakers will need to embrace innovation and change to attract new and old customers while maintaining efficiencies and profitability year after year.
3
Competitor Overview
General Motors Company (GM)
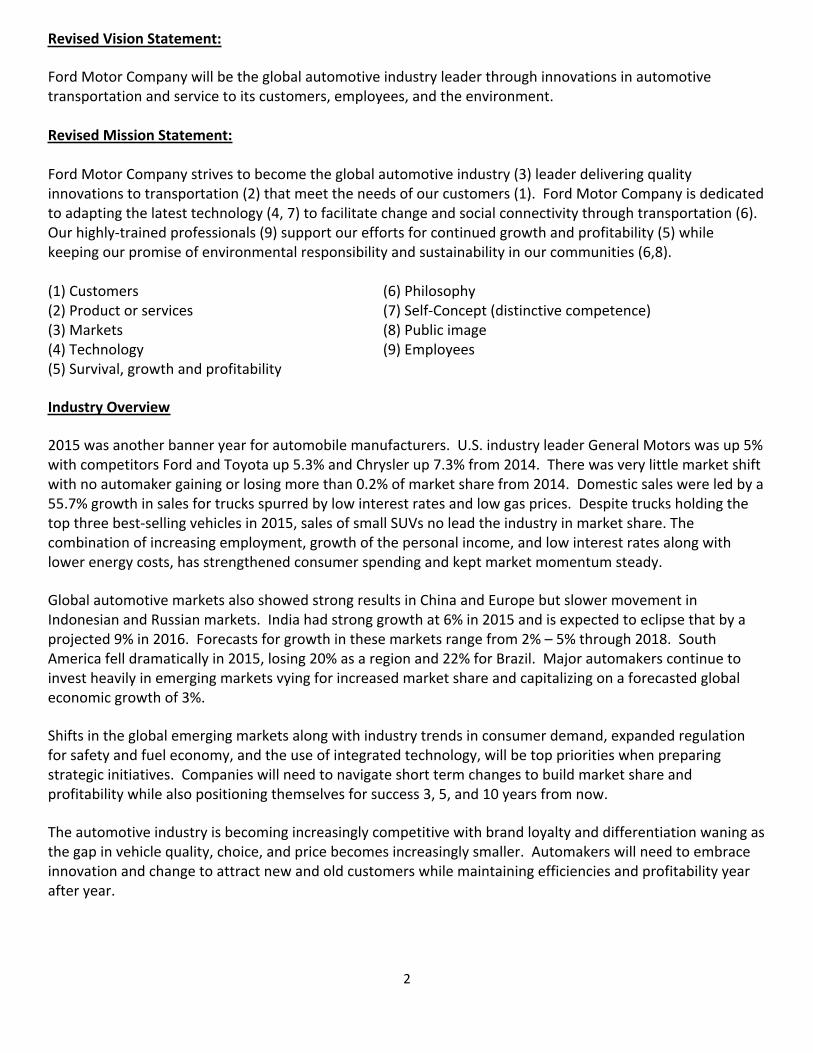
General Motors, headquartered in Detroit, Michigan, is considered to be the largest of the “Big Three” within the automotive industry which includes Ford Motor Company and Chrysler Corporation. GM designs, manufactures, markets, and distributes vehicles and parts, and sells financial services to both commercial and retail consumers domestically and globally. The current company, General Motors Company LLC ("new GM"), was formed in 2009 following the bankruptcy of General Motors Corporation ("old GM"). The new company purchased the majority of the assets of the old GM, including the brand "General Motors". GM has a total employment over 215,000 and over 400 facilities globally. GM posted solid financial results off of record sales of over 9.9 million units globally and was the industry sales leader in the U.S., North and South America, and China. Globally, GM achieved a market share of 10.8% vs Toyota’s 11%. GM, its subsidiaries, and joint venture produce brands Buick, Cadillac, Chevrolet, Baojun, GMC, Holden, Jiefang, Opel, Vauxhall, and Wuling.
Toyota Motor Corporation
The Toyota Motor Corporation was incorporated in 1937 and is one the leaders in the automotive industry. Toyota operates under three major brands Toyota, the luxury line Lexus, and Scion. Toyota is the world's market leader in sales of hybrid electric vehicles, and one of the largest companies to encourage the mass-market adoption of hybrid vehicles across the globe. As of July 2014, Toyota was the largest listed company in Japan by market capitalization. Toyota has surpassed North American sales to overcome Chrysler and emerge as a strong competitor to General Motors and Ford. In 2015, domestic market share was third (14.3%) with GM first (17.7%) and Ford second (14.7%). Globally, they are expanding into emerging markets and growing in market share as they drive sales of the Toyota brand. Toyota was the industry leader in market share with 11.2%, overcoming GM at 10.8%.
4
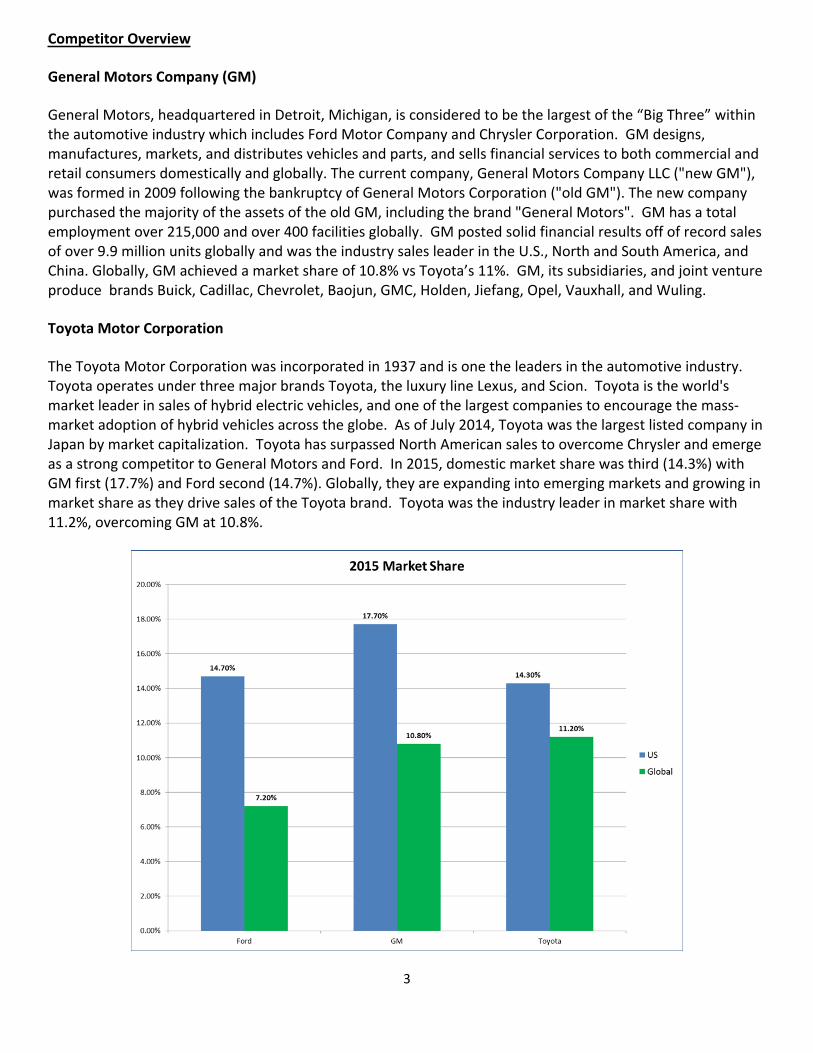
Customer loyalty and product quality have been the critical mainstays for success to date, however, the strategy will shift given new industry trends and successes in emerging markets. All three are fairly close in total score giving further evidence to the competitive nature of the market. Ford’s relative strengths and weaknesses to date compared to competitors is presented below.
Competitive Profile Matrix
Critical Success Factors Weight Rating Score Rating Score Rating Score
Advertising 0.05 3 0.15 4 0.20 2 0.10Customer Loyalty 0.15 3 0.45 2 0.30 4 0.60Customer Service 0.10 3 0.30 2 0.20 4 0.40Employee Loyalty 0.04 4 0.16 3 0.12 2 0.08Financial Health 0.10 2 0.20 4 0.40 3 0.30Global Expansion 0.10 3 0.30 4 0.40 2 0.20Management 0.02 4 0.08 2 0.04 3 0.06Manufacturing Plants 0.02 2 0.04 4 0.08 3 0.06Market Share 0.10 3 0.30 4 0.40 2 0.20Price Competitiveness 0.09 3 0.27 2 0.18 4 0.36Product Quality 0.15 3 0.45 2 0.30 4 0.60R&D Technology 0.06 3 0.18 4 0.24 2 0.12Social Responsibility 0.02 4 0.08 3 0.06 2 0.04
Total 1.00 2.96 2.92 3.12
FORD GMC TOYOTA
Current Financial Position
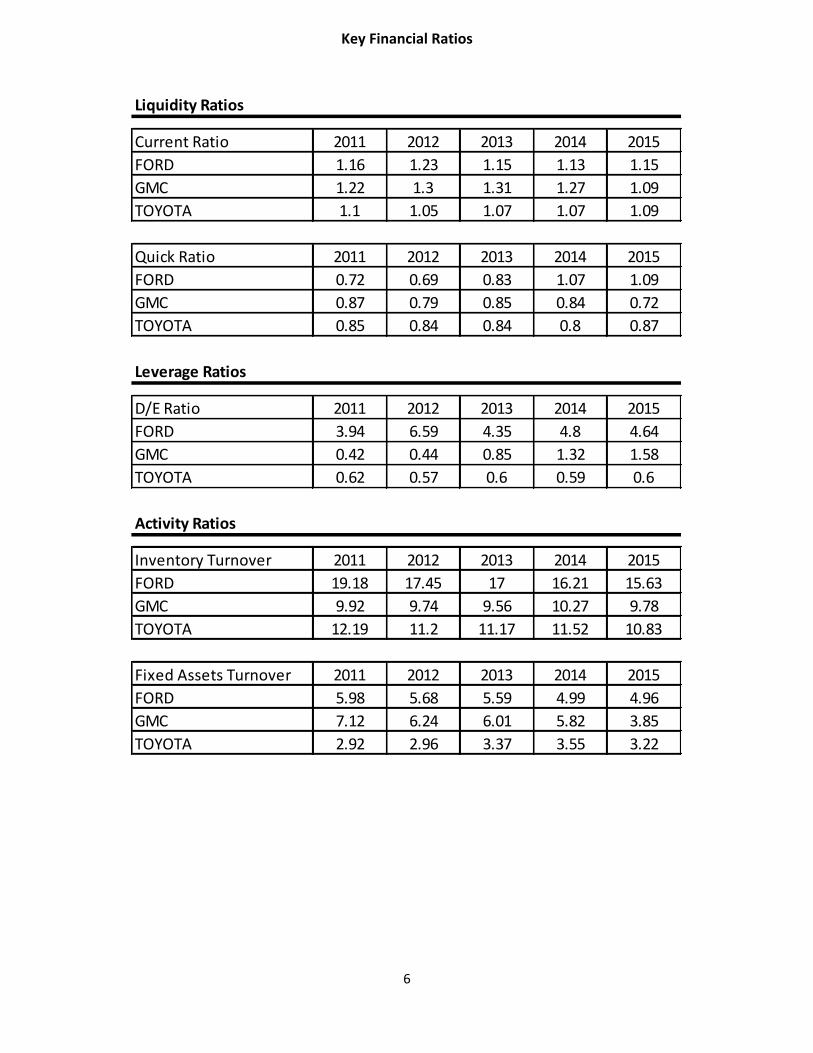
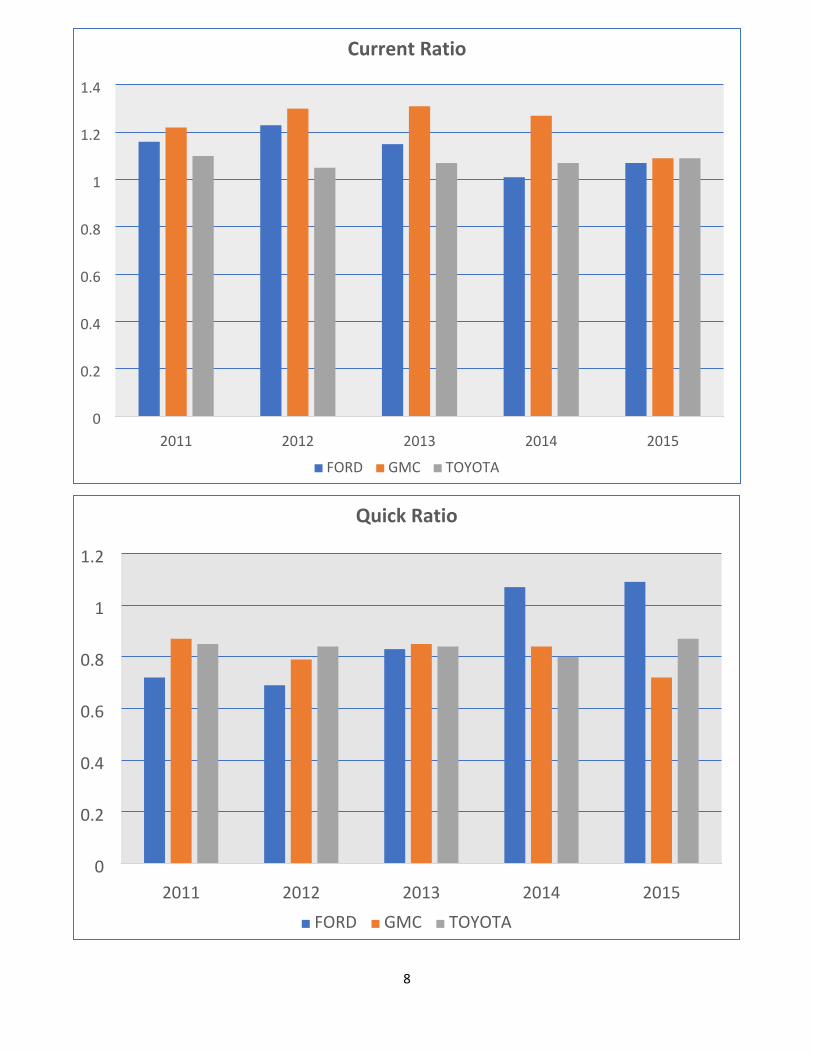
Ford remains competitive in their financial position relative to peers General Motors and Toyota. Despite a decline in their current ratio from 2012, the current ratio has grown since 2014 and is close to its peers. Contrast this with stable growth in the quick ratio from 2012 that exceeds GM and remains competitive with Toyota. Ford is managing short term liabilities and providing a positive and stable position with which to increase presence and improve market share in key markets.
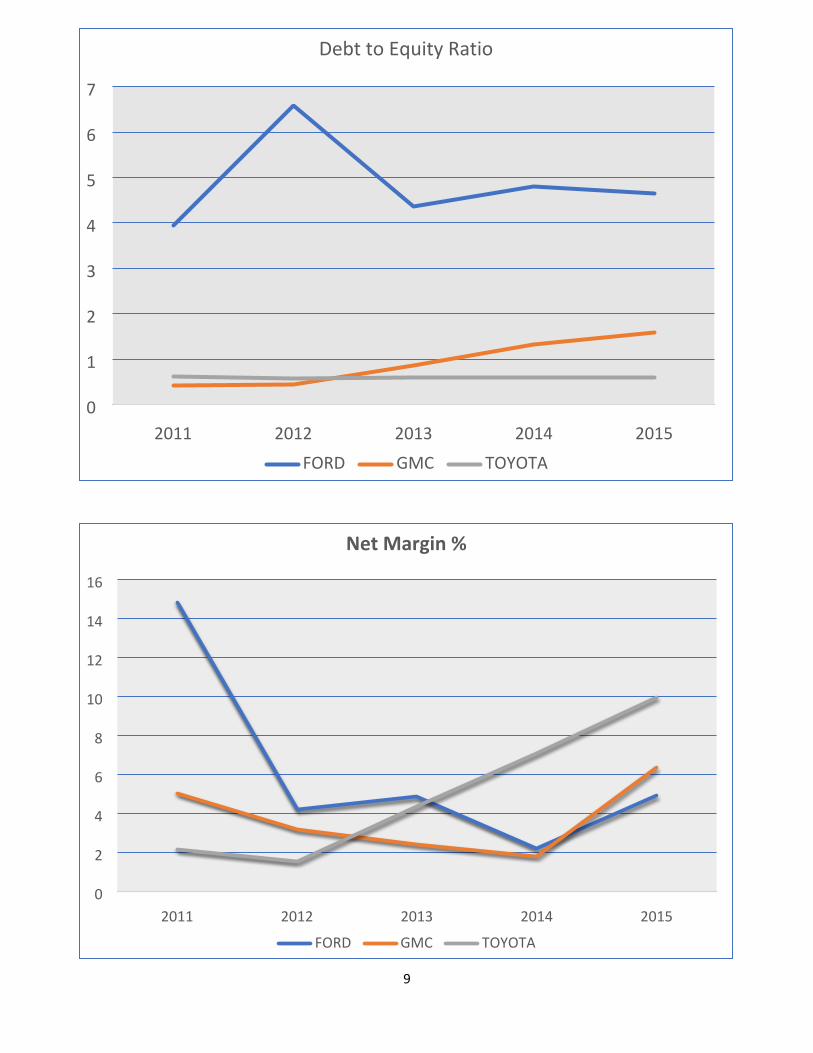
Ford’s debt to equity ratio appears off balance relative to GM (showing nearly 3 times as much), however, this debt is largely due to its growing finance division which holds 90% of long term debt. This long term debt is used to offer loans at higher interest rates through the finance division creating a positive return on revenues since 2012 and averaging $7.8 billion in revenue each year since 2011.
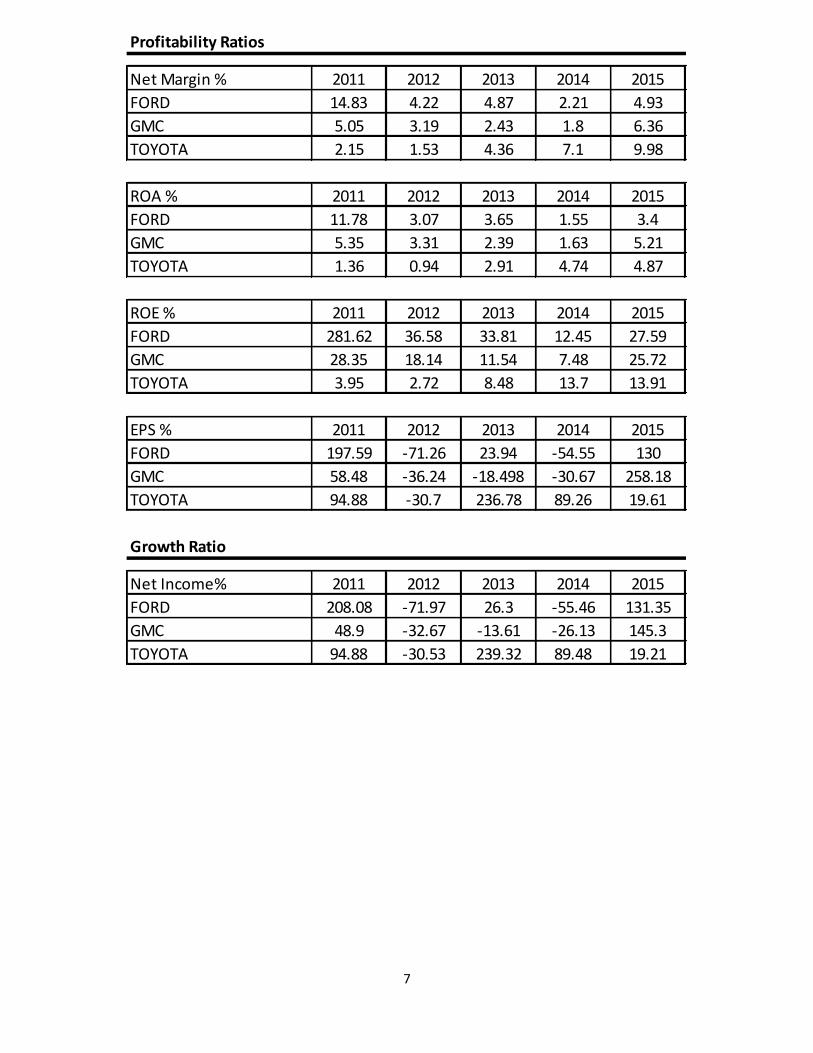
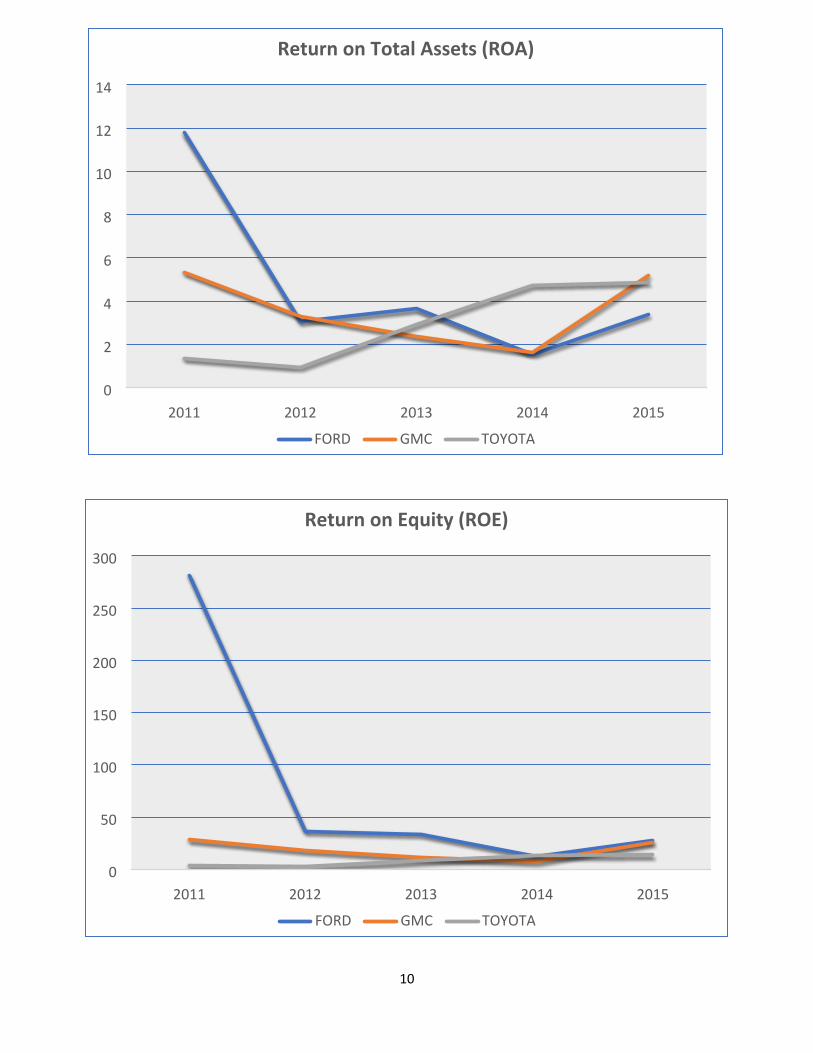
Net Margin has rebounded from the year over year decline from 2013 to 2014 and is showing value of 4.93. Similarly, return on assets and return on equity ratios improved over 2014 by 109% and 122% respectively. These profitability ratios demonstrate that Ford is making significant business improvements that are stable and conducive to growth.
5
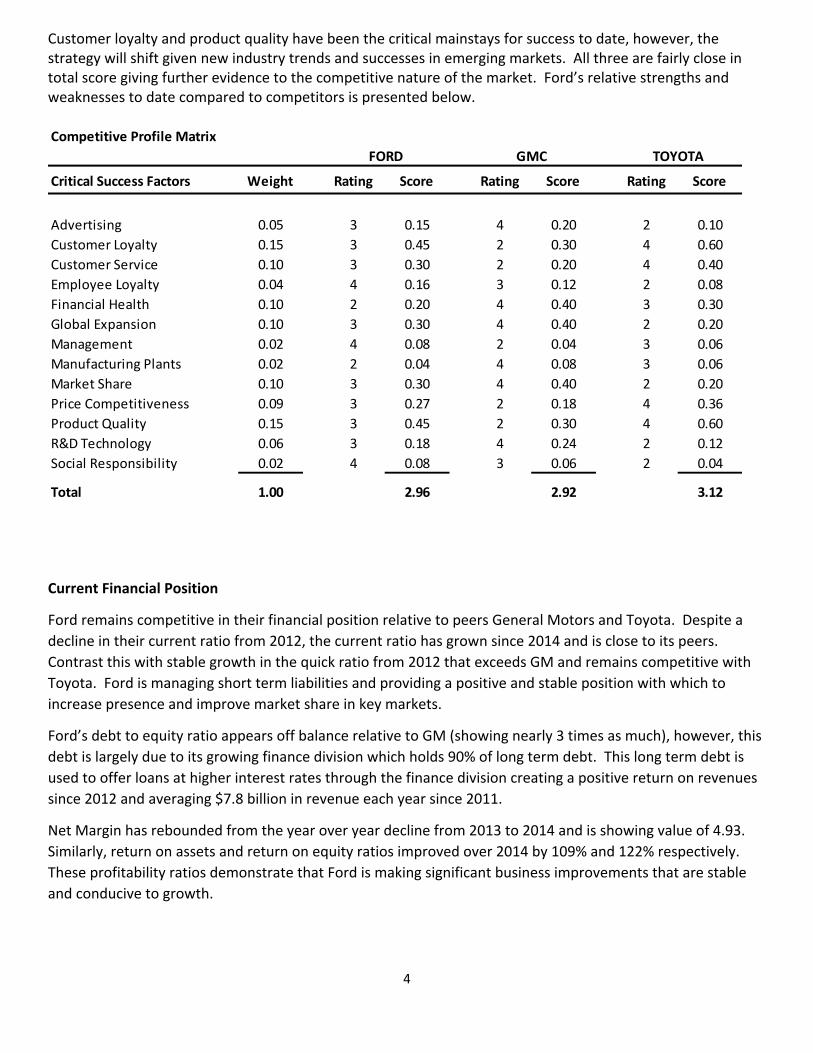
Ford’s company valuation and key financial ratios compared to GM and Toyota are presented below.
Ford Motor CompanyStockholders' Equity - (Goodwill + Intangibles)Net Income x 5(Share Price/EPS) x Net IncomeNumber of Shares Outstanding x Share PriceMethod Average
General MotorsStockholders' Equity - (Goodwill + Intangibles)Net Income x 5(Share Price/EPS) x Net IncomeNumber of Shares Outstanding x Share PriceMethod Average $36,140,369
$39,871,000$48,435,000$55,745,325
$12,531,580$12,531,580
$28,049,290
$510,150
$57,284,000$29,850,000
ToyotaStockholders' Equity - (Goodwill + Intangibles)Net Income x 5(Share Price/EPS) x Net IncomeNumber of Shares Outstanding x Share PriceMethod Average
$407,385,440$329,445,110
$139,989,000$90,610,000$679,796,000
6
Key Financial Ratios
Liquidity Ratios
Current Ratio 2011 2012 2013 2014 2015FORD 1.16 1.23 1.15 1.13 1.15GMC 1.22 1.3 1.31 1.27 1.09TOYOTA 1.1 1.05 1.07 1.07 1.09
Quick Ratio 2011 2012 2013 2014 2015FORD 0.72 0.69 0.83 1.07 1.09GMC 0.87 0.79 0.85 0.84 0.72TOYOTA 0.85 0.84 0.84 0.8 0.87
Leverage Ratios
D/E Ratio 2011 2012 2013 2014 2015FORD 3.94 6.59 4.35 4.8 4.64GMC 0.42 0.44 0.85 1.32 1.58TOYOTA 0.62 0.57 0.6 0.59 0.6
Activity Ratios
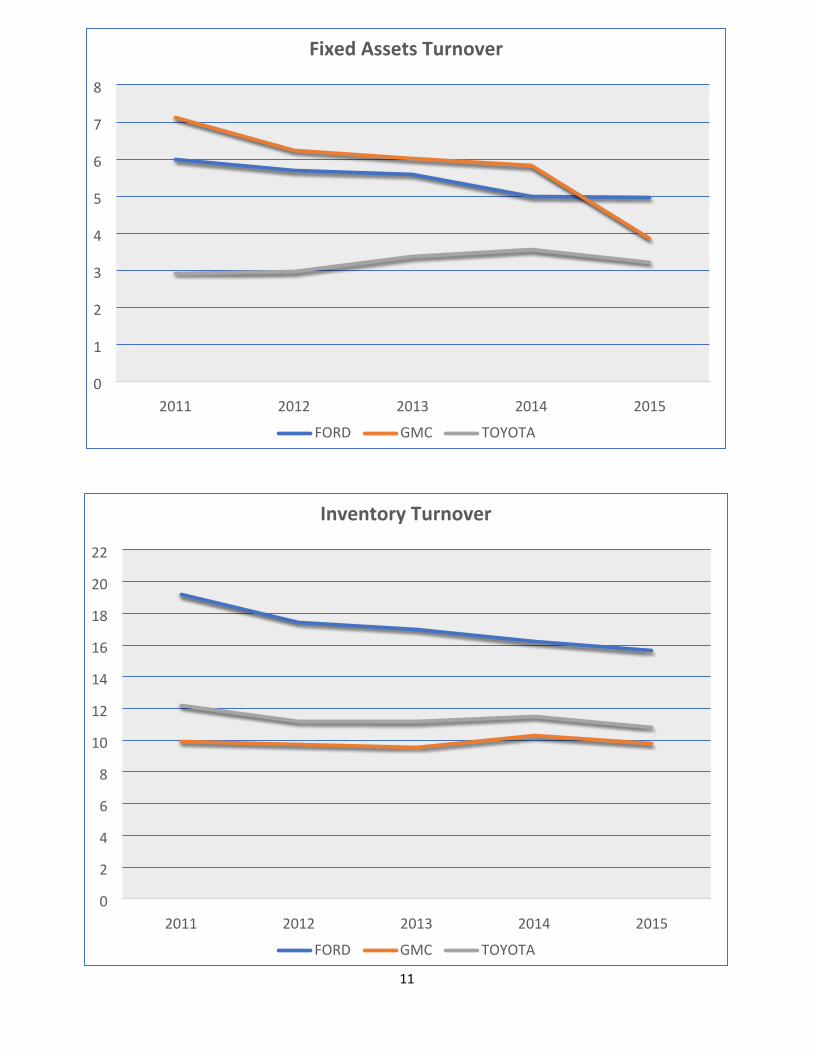
Inventory Turnover 2011 2012 2013 2014 2015FORD 19.18 17.45 17 16.21 15.63GMC 9.92 9.74 9.56 10.27 9.78TOYOTA 12.19 11.2 11.17 11.52 10.83
Fixed Assets Turnover 2011 2012 2013 2014 2015FORD 5.98 5.68 5.59 4.99 4.96GMC 7.12 6.24 6.01 5.82 3.85TOYOTA 2.92 2.96 3.37 3.55 3.22
7
Profitability Ratios
Net Margin % 2011 2012 2013 2014 2015FORD 14.83 4.22 4.87 2.21 4.93GMC 5.05 3.19 2.43 1.8 6.36TOYOTA 2.15 1.53 4.36 7.1 9.98
ROA % 2011 2012 2013 2014 2015FORD 11.78 3.07 3.65 1.55 3.4GMC 5.35 3.31 2.39 1.63 5.21TOYOTA 1.36 0.94 2.91 4.74 4.87
ROE % 2011 2012 2013 2014 2015FORD 281.62 36.58 33.81 12.45 27.59GMC 28.35 18.14 11.54 7.48 25.72TOYOTA 3.95 2.72 8.48 13.7 13.91
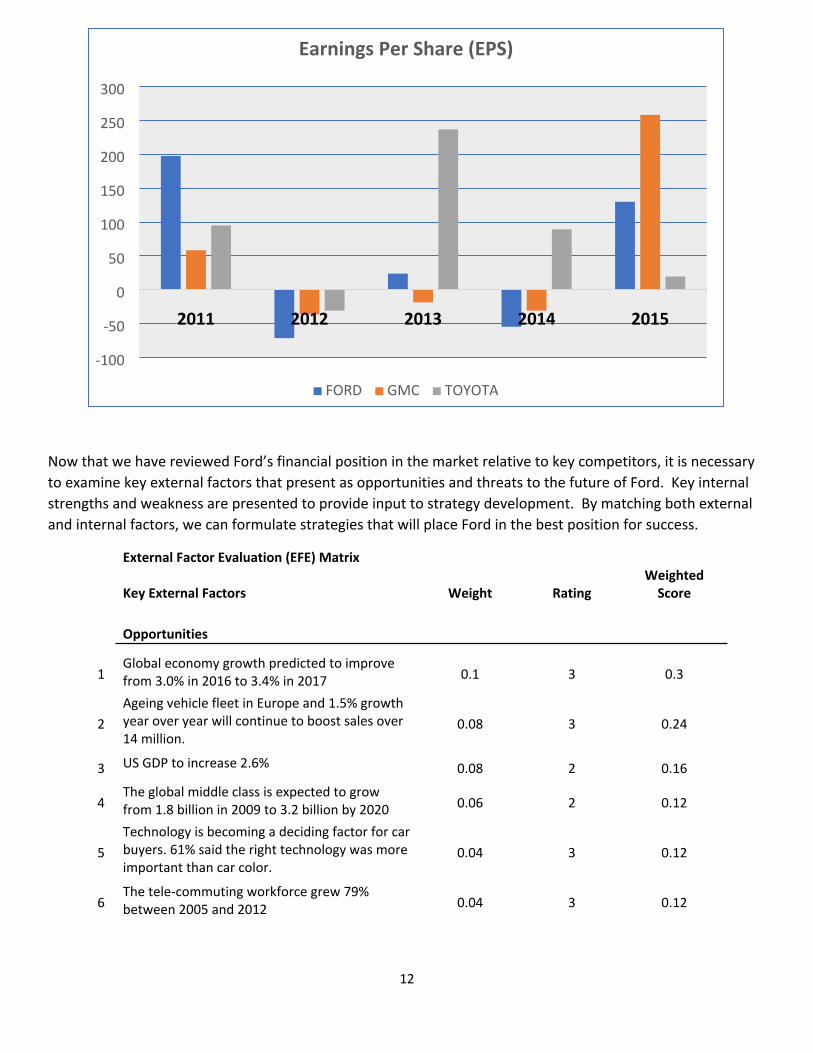
EPS % 2011 2012 2013 2014 2015FORD 197.59 -71.26 23.94 -54.55 130GMC 58.48 -36.24 -18.498 -30.67 258.18TOYOTA 94.88 -30.7 236.78 89.26 19.61
Growth Ratio
Net Income% 2011 2012 2013 2014 2015FORD 208.08 -71.97 26.3 -55.46 131.35GMC 48.9 -32.67 -13.61 -26.13 145.3TOYOTA 94.88 -30.53 239.32 89.48 19.21
8
2011 2012 2013 2014 20150
0.2
0.4
0.6
0.8
1
1.2
1.4
FORD GMC TOYOTA
Current Ratio
2011 2012 2013 2014 20150
0.2
0.4
0.6
0.8
1
1.2
FORD GMC TOYOTA
Quick Ratio
9
2011 2012 2013 2014 20150
1
2
3
4
5
6
7
FORD GMC TOYOTA
Debt to Equity Ratio
2011 2012 2013 2014 20150
2
4
6
8
10
12
14
16
FORD GMC TOYOTA
Net Margin %
10
2011 2012 2013 2014 20150
2
4
6
8
10
12
14
FORD GMC TOYOTA
Return on Total Assets (ROA)
2011 2012 2013 2014 20150
50
100
150
200
250
300
FORD GMC TOYOTA
Return on Equity (ROE)
11
2011 2012 2013 2014 20150
1
2
3
4
5
6
7
8
FORD GMC TOYOTA
Fixed Assets Turnover
2011 2012 2013 2014 20150
2
4
6
8
10
12
14
16
18
20
22
FORD GMC TOYOTA
Inventory Turnover
12
2011 2012 2013 2014 2015
-100
-50
0
50
100
150
200
250
300
FORD GMC TOYOTA
Earnings Per Share (EPS)
Now that we have reviewed Ford’s financial position in the market relative to key competitors, it is necessary to examine key external factors that present as opportunities and threats to the future of Ford. Key internal strengths and weakness are presented to provide input to strategy development. By matching both external and internal factors, we can formulate strategies that will place Ford in the best position for success.
External Factor Evaluation (EFE) Matrix
Key External Factors Weight RatingWeighted
Score
Opportunities
1Global economy growth predicted to improve from 3.0% in 2016 to 3.4% in 2017 0.1 3 0.3
2Ageing vehicle fleet in Europe and 1.5% growth year over year will continue to boost sales over 14 million.
0.08 3 0.24
3 US GDP to increase 2.6% 0.08 2 0.16
4The global middle class is expected to grow from 1.8 billion in 2009 to 3.2 billion by 2020 0.06 2 0.12
5Technology is becoming a deciding factor for car buyers. 61% said the right technology was more important than car color.
0.04 3 0.12
6The tele-commuting workforce grew 79% between 2005 and 2012 0.04 3 0.12
13
778% of Chinese and 84% of Indian adults can see themselves buying a self-driving car in the future
0.04 3 0.12
8 40% of US automobiles are at least 12 years old 0.03 2 0.06
9The Millennial population (ages 21-35 in 2015) of auto buyers grew to 28% 0.03 2 0.06
10Technology is becoming a deciding factor for car buyers. 48% said the right technology was more important than the brand or style of car.
0.03 3 0.09
Threats
1President Trump may impose large tariffs (up to 35%) to automakers that manufacture outside of the US
0.08 2 0.16
2
U.S. regular gasoline retail prices are expected to increase from an average of $2.25/gallon (gal) in December to $2.31/gal in the first quarter of 2017. U.S. regular gasoline retail prices are forecast to average $2.38/gal in 2017 and $2.41/gal in 2018.
0.07 2 0.14
3A 26% reduction in the peso vs the dollar in Mexico will reduce car sales 0.06 1 0.06
4 Brazilian GDP shrank 3.5% in 2016 0.06 3 0.18
5Current Corporate Average Fuel Economy Standard is between 50 and 52.6 mpg by 2025 0.04 2 0.08
610% rise in the price of steel may increase cost to build an automobile up 1.5% 0.04 2 0.08
7Finance rates expected to rise from 4 to 4.5% on new cars 0.03 2 0.06
82015 length of vehicle ownership was 6.5 years, up from 4.3 years in 2006. 0.03 2 0.06
976% of US and 62% of Chinese and Indian adults say they will keep their car at least 10 years 0.03 1 0.03
10Auto loan delinquency are projected to have a 21.3% increase over the last 5 years 0.03 2 0.06
TOTAL 1.00 2.3
Ford’s opportunities are evident in emerging markets and sales trends abroad. A strengthening global economy, growing middle class, and ageing vehicle fleet offers opportunities for future growth and market seizure. The rise in importance of technology will play into Ford’s current line-up of “tech-savvy” vehicles. External threats are most related to political and economic uncertainty both domestically and in emerging markets such as Brazil, Mexico, and Russia. Gas prices and government regulatory standards will also impact sales and investment expenses in research and development.
14
Internal Factor Evaluation (IFE) MatrixKey Internal Factors Weight Rating Weighted ScoreStrengths
1 Sales in China grew 14% in 2016 0.07 4 0.282 Sales of Lincoln in China grew 180% in 2016 0.05 4 0.2
3Demand for Ford Edge and Ford Explorer in China grew 159% combined in 2016 0.05 4 0.2
4Demand for Ford Mustang and Focus ST/RS in China rose 57% combined in 2016 0.05 4 0.2
5Ford is the best-selling brand of commercial vehicles in Europe for the second year in a row holding 13.2% of market share
0.05 4 0.2
6Ford European performance car sales – Fiesta ST, Focus ST, Focus RS, Mustang and GT – grew 60 percent from 2015
0.05 3 0.15
7 Ford SUV European sales up 31% 0.05 4 0.28 Sales of Lincoln in the US grew 14% 0.04 4 0.169 Ford F150 number 1 selling truck in 2016 0.04 4 0.16
10 Ford European sales rose 5% in 2016 0.04 4 0.16
Weaknesses
1Ford South America posted an $832 million loss in 2015 0.1 1 0.1
2Ford expanded recall from 830K vehicles to 2.4M at a cost of $640 million 0.07 2 0.14
3Ford posted a $3 billion charge against 4th QTR 2016 earnings due to its accounting change in pensions
0.07 2 0.14
4 Ford lost 0.1% total market share from 2015 0.06 1 0.06
5Ford stock has underperformed against peers GM, Fiat Chrysler, and Toyota 0.05 2 0.1
6 Ford Super Duty recall of 8,000 vehicles 0.05 2 0.1
7The first 11 months of 2016 showed a 13.1% year over year global decline in car segment sales
0.04 2 0.08
8 Total debt of $132 billion 0.03 2 0.069 Wholesale volume 3Q 2016 down 4% 0.02 2 0.04
10 Revenue volume 3Q 2016 down 7% 0.02 2 0.04
TOTAL 1.00 2.77
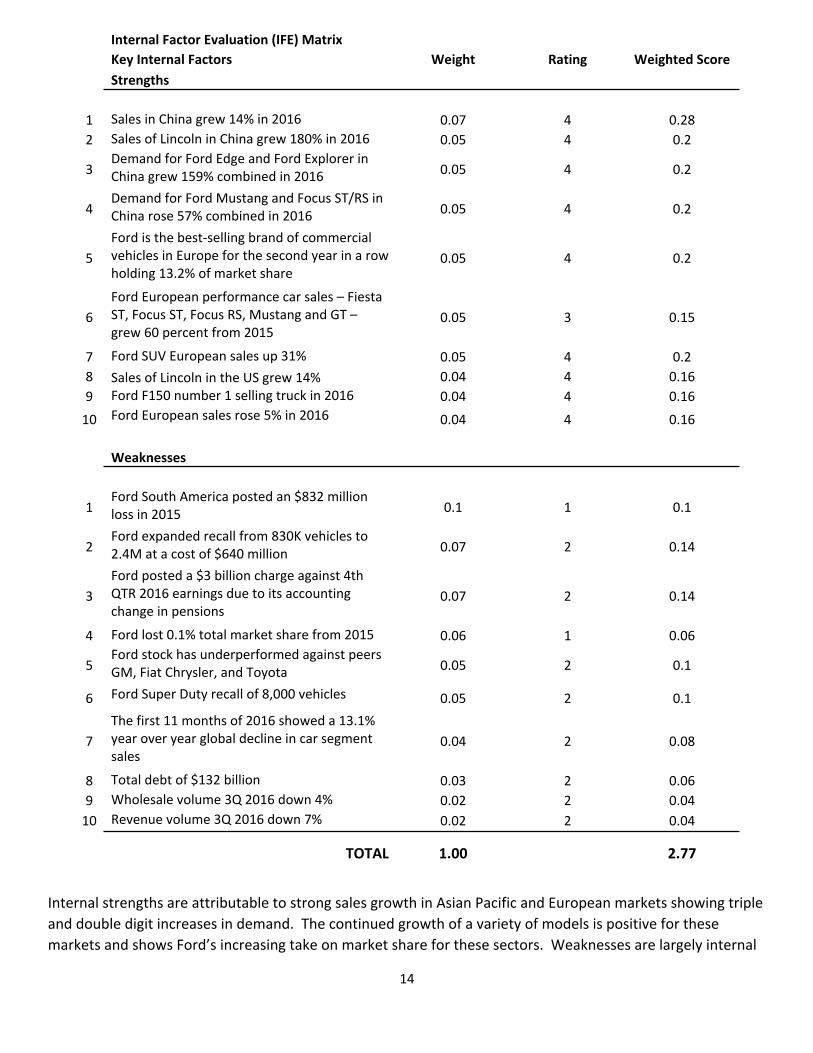
Internal strengths are attributable to strong sales growth in Asian Pacific and European markets showing triple and double digit increases in demand. The continued growth of a variety of models is positive for these markets and shows Ford’s increasing take on market share for these sectors. Weaknesses are largely internal
15
with expenses incurred due to costly recalls. Despite strong sales in China and Europe, global market share and sales volume decreased in 2015.
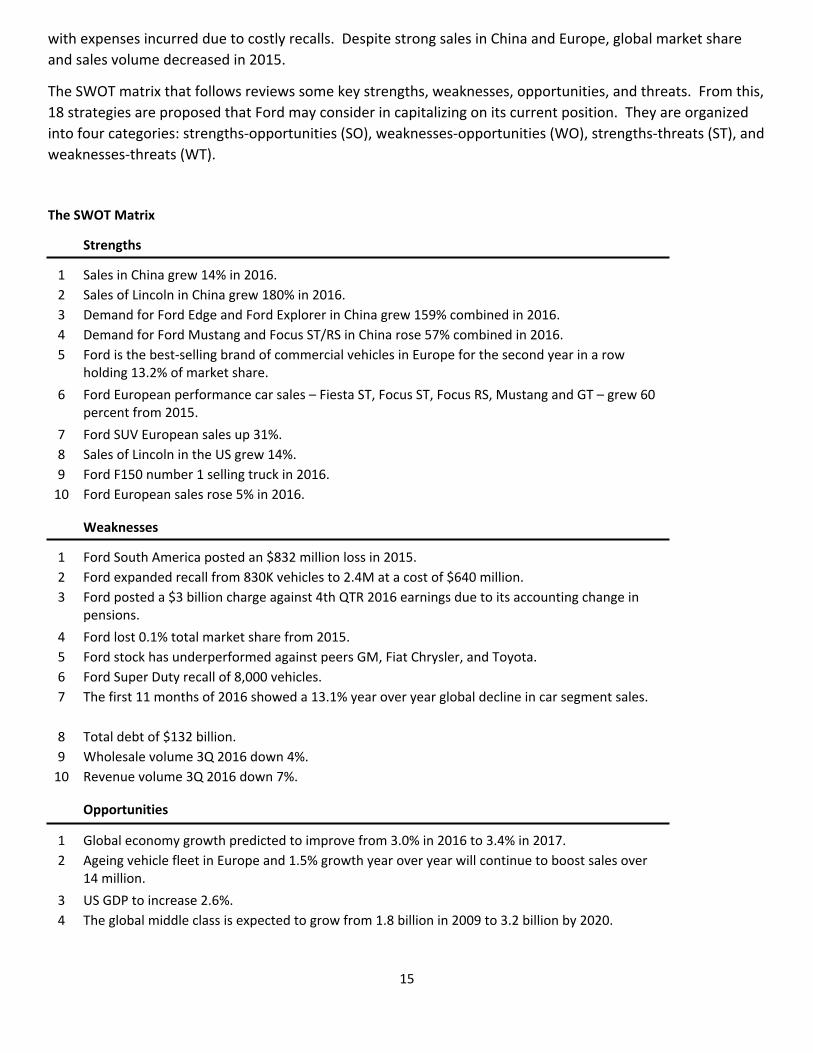
The SWOT matrix that follows reviews some key strengths, weaknesses, opportunities, and threats. From this, 18 strategies are proposed that Ford may consider in capitalizing on its current position. They are organized into four categories: strengths-opportunities (SO), weaknesses-opportunities (WO), strengths-threats (ST), and weaknesses-threats (WT).
The SWOT Matrix
Strengths
1 Sales in China grew 14% in 2016.2 Sales of Lincoln in China grew 180% in 2016.3 Demand for Ford Edge and Ford Explorer in China grew 159% combined in 2016.4 Demand for Ford Mustang and Focus ST/RS in China rose 57% combined in 2016.5 Ford is the best-selling brand of commercial vehicles in Europe for the second year in a row
holding 13.2% of market share.6 Ford European performance car sales – Fiesta ST, Focus ST, Focus RS, Mustang and GT – grew 60
percent from 2015.7 Ford SUV European sales up 31%.8 Sales of Lincoln in the US grew 14%.9 Ford F150 number 1 selling truck in 2016.
10 Ford European sales rose 5% in 2016.
Weaknesses
1 Ford South America posted an $832 million loss in 2015.2 Ford expanded recall from 830K vehicles to 2.4M at a cost of $640 million.3 Ford posted a $3 billion charge against 4th QTR 2016 earnings due to its accounting change in
pensions.4 Ford lost 0.1% total market share from 2015.5 Ford stock has underperformed against peers GM, Fiat Chrysler, and Toyota.6 Ford Super Duty recall of 8,000 vehicles.7 The first 11 months of 2016 showed a 13.1% year over year global decline in car segment sales.
8 Total debt of $132 billion.9 Wholesale volume 3Q 2016 down 4%.
10 Revenue volume 3Q 2016 down 7%.
Opportunities
1 Global economy growth predicted to improve from 3.0% in 2016 to 3.4% in 2017.2 Ageing vehicle fleet in Europe and 1.5% growth year over year will continue to boost sales over
14 million.3 US GDP to increase 2.6%.4 The global middle class is expected to grow from 1.8 billion in 2009 to 3.2 billion by 2020.
16
5 Technology is becoming a deciding factor for car buyers. 61% said the right technology was more important than car color.
6 The telecommuting workforce grew 79% between 2005 and 2012.7 78% of Chinese and 84% of Indian adults can see themselves buying a self-driving car in the
future.8 40% of US automobiles are at least 12 years old.9 The Millennial population (ages 21-35 in 2015) of auto buyers grew to 28%.
10 Technology is becoming a deciding factor for car buyers. 48% said the right technology was more important than the brand or style of car.
Threats
1 President Trump may impose large tariffs (up to 35%) to automakers that manufacture outside of the US.
2 U.S. regular gasoline retail prices are expected to increase from an average of $2.25/gallon (gal) in December to $2.31/gal in the first quarter of 2017. U.S. regular gasoline retail prices are forecast to average $2.38/gal in 2017 and $2.41/gal in 2018.
3 A 26% reduction in the peso vs the dollar in Mexico will reduce car sales.4 Brazilian GDP shrank 3.5% in 2016.5 Current Corporate Average Fuel Economy Standard is between 50 and 52.6 mpg by 2025.6 10% rise in the price of steel may increase cost to build an automobile up 1.5%.7 Finance rates expected to rise from 4 to 4.5% on new cars.8 2015 length of vehicle ownership was 6.5 years, up from 4.3 years in 2006.9 76% of US and 62% of Chinese and Indian adults say they will keep their car at least 10 years.
10 Auto loan delinquency are projected to have a 21.3% increase over the last 5 years.
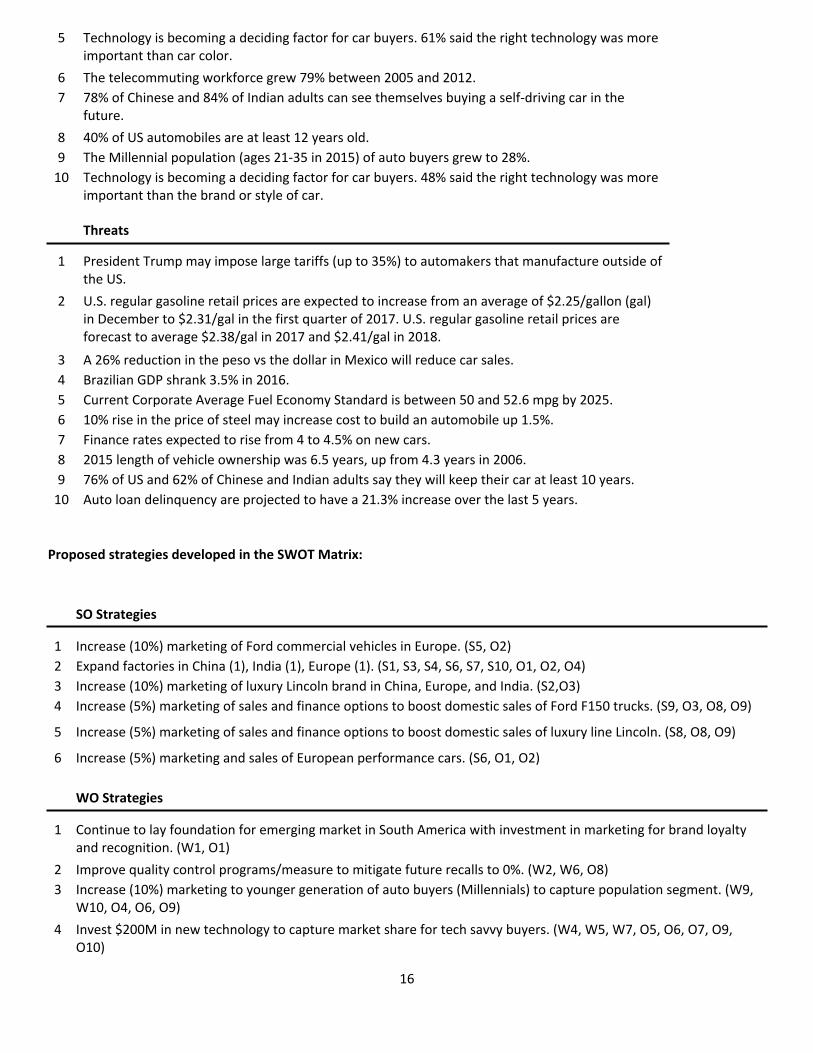
Proposed strategies developed in the SWOT Matrix:
SO Strategies
1 Increase (10%) marketing of Ford commercial vehicles in Europe. (S5, O2)2 Expand factories in China (1), India (1), Europe (1). (S1, S3, S4, S6, S7, S10, O1, O2, O4)3 Increase (10%) marketing of luxury Lincoln brand in China, Europe, and India. (S2,O3)4 Increase (5%) marketing of sales and finance options to boost domestic sales of Ford F150 trucks. (S9, O3, O8, O9)
5 Increase (5%) marketing of sales and finance options to boost domestic sales of luxury line Lincoln. (S8, O8, O9)
6 Increase (5%) marketing and sales of European performance cars. (S6, O1, O2)
WO Strategies
1 Continue to lay foundation for emerging market in South America with investment in marketing for brand loyalty and recognition. (W1, O1)
2 Improve quality control programs/measure to mitigate future recalls to 0%. (W2, W6, O8)3 Increase (10%) marketing to younger generation of auto buyers (Millennials) to capture population segment. (W9,
W10, O4, O6, O9)4 Invest $200M in new technology to capture market share for tech savvy buyers. (W4, W5, W7, O5, O6, O7, O9,
O10)
17
ST Strategies
1 Increase $300M in R&D to produce new models and styles to encourage sales. (S1, S2, S3, S4, S5, S6, S7, S9, S10, T7, T8, T9)
2 Continue to develop strategies for fuel efficiency in Ford fleet line of vans and trucks. (S9, T2, T5)3 Create performance packages for Ford Mustang and Ford Focus ST/RS to target new sales by greater than 10%.
(S4, T9)4 Continue to develop Eco-Boost engine to improve fuel efficiency standard for Ford F150 by 2 mpg. (S9, T2)
WT Strategies
1 Continue to lay foundation for emerging market in South America with investment (5%) in marketing for brand loyalty and recognition. (W1, T4)
2 Create 4 new Incentive programs to offer new and loyal customer discounts on new vehicles. (W4, W5, W7, W9, W10, T3, T4, T7, T8, T9)
3 Continue to develop Ford Financing division and joint ventures to offset liability. (W1, W2, W3, W8 W9, W10, T3, T4, T6, T7, T10)
4 Develop new automotive model within 5 years to target new car buying interest. (W7, T9)
18
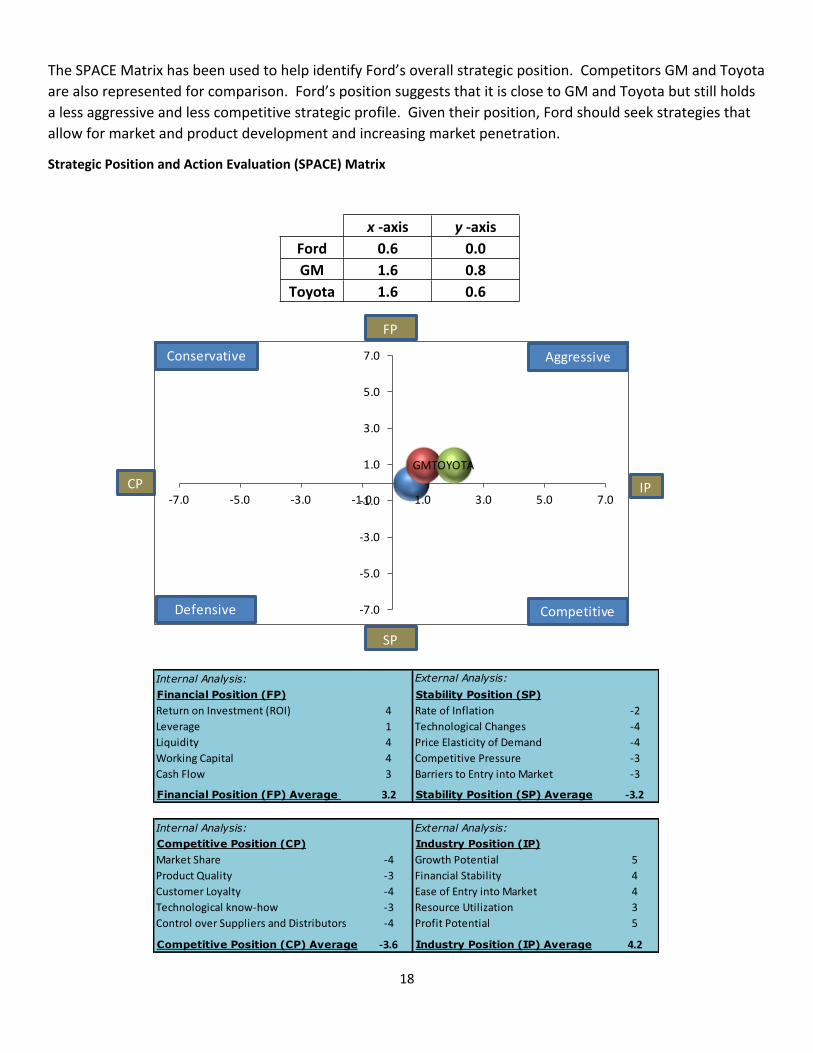
The SPACE Matrix has been used to help identify Ford’s overall strategic position. Competitors GM and Toyota are also represented for comparison. Ford’s position suggests that it is close to GM and Toyota but still holds a less aggressive and less competitive strategic profile. Given their position, Ford should seek strategies that allow for market and product development and increasing market penetration.
Strategic Position and Action Evaluation (SPACE) Matrix
x -axis y -axisFord 0.6 0.0GM 1.6 0.8
Toyota 1.6 0.6
GMTOYOTA
-7.0
-5.0
-3.0
-1.0
1.0
3.0
5.0
7.0
-7.0 -5.0 -3.0 -1.0 1.0 3.0 5.0 7.0
FP
SP
CP IP
Defensive
Conservative Aggressive
Competitive
Internal Analysis: External Analysis:Financial Position (FP) Stability Position (SP)
4 -21 -44 -44 -33 -3
Financial Position (FP) Average 3.2 Stability Position (SP) Average -3.2
Internal Analysis: External Analysis:Competitive Position (CP) Industry Position (IP)Market Share -4 Growth Potential 5Product Quality -3 Financial Stability 4Customer Loyalty -4 Ease of Entry into Market 4Technological know-how -3 Resource Utilization 3Control over Suppliers and Distributors -4 Profit Potential 5
Competitive Position (CP) Average -3.6 Industry Position (IP) Average 4.2
Liquidity Working Capital Cash Flow
Rate of InflationTechnological ChangesPrice Elasticity of DemandCompetitive PressureBarriers to Entry into Market
Return on Investment (ROI)Leverage
19
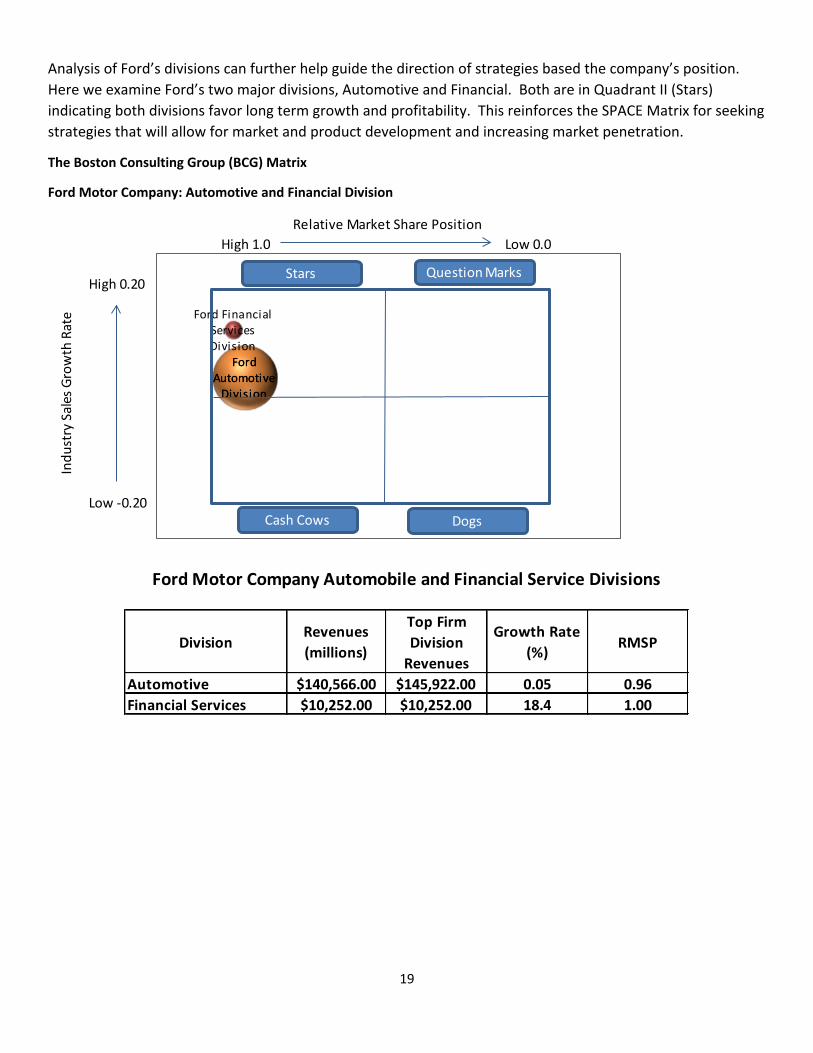
Analysis of Ford’s divisions can further help guide the direction of strategies based the company’s position. Here we examine Ford’s two major divisions, Automotive and Financial. Both are in Quadrant II (Stars) indicating both divisions favor long term growth and profitability. This reinforces the SPACE Matrix for seeking strategies that will allow for market and product development and increasing market penetration.
The Boston Consulting Group (BCG) Matrix
Ford Motor Company: Automotive and Financial Division
High 1.0
High 0.20
Low -0.20
Low 0.0
Indu
stry
Sal
es G
row
th R
ate
Relative Market Share Position
Ford Automotive
Division
Ford Financial Services Division
Ford Automotive
Division
Question MarksStars
Cash Cows Dogs
DivisionRevenues (millions)
Top Firm Division
Revenues
Growth Rate (%) RMSP
Automotive $140,566.00 $145,922.00 0.05 0.96Financial Services $10,252.00 $10,252.00 18.4 1.00
Ford Motor Company Automobile and Financial Service Divisions
20
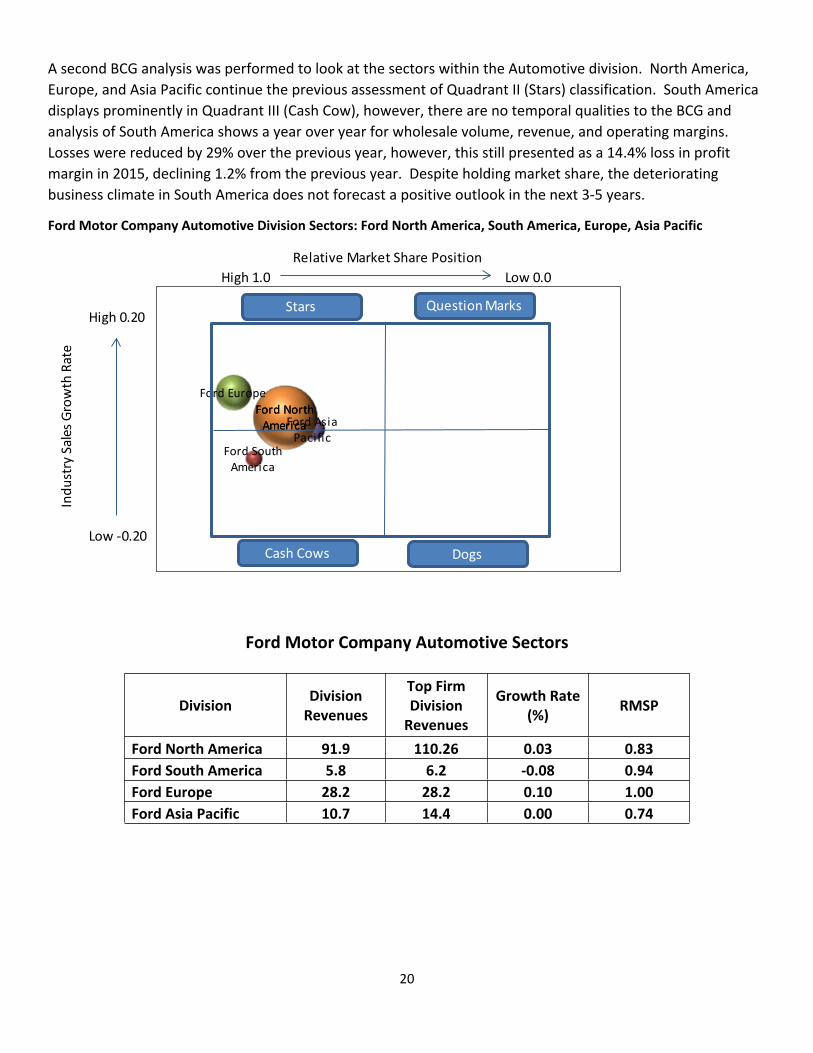
A second BCG analysis was performed to look at the sectors within the Automotive division. North America, Europe, and Asia Pacific continue the previous assessment of Quadrant II (Stars) classification. South America displays prominently in Quadrant III (Cash Cow), however, there are no temporal qualities to the BCG and analysis of South America shows a year over year for wholesale volume, revenue, and operating margins. Losses were reduced by 29% over the previous year, however, this still presented as a 14.4% loss in profit margin in 2015, declining 1.2% from the previous year. Despite holding market share, the deteriorating business climate in South America does not forecast a positive outlook in the next 3-5 years.
Ford Motor Company Automotive Division Sectors: Ford North America, South America, Europe, Asia Pacific
High 1.0
High 0.20
Low -0.20
Low 0.0
Indu
stry
Sal
es G
row
th R
ate
Relative Market Share Position
Ford North America
Ford South America
Ford Europe
Ford Asia Pacific
Ford North America
Question MarksStars
Cash Cows Dogs
Ford Motor Company Automotive Sectors
Division Division Revenues
Top Firm Division
Revenues
Growth Rate (%) RMSP
Ford North America 91.9 110.26 0.03 0.83Ford South America 5.8 6.2 -0.08 0.94Ford Europe 28.2 28.2 0.10 1.00Ford Asia Pacific 10.7 14.4 0.00 0.74
21
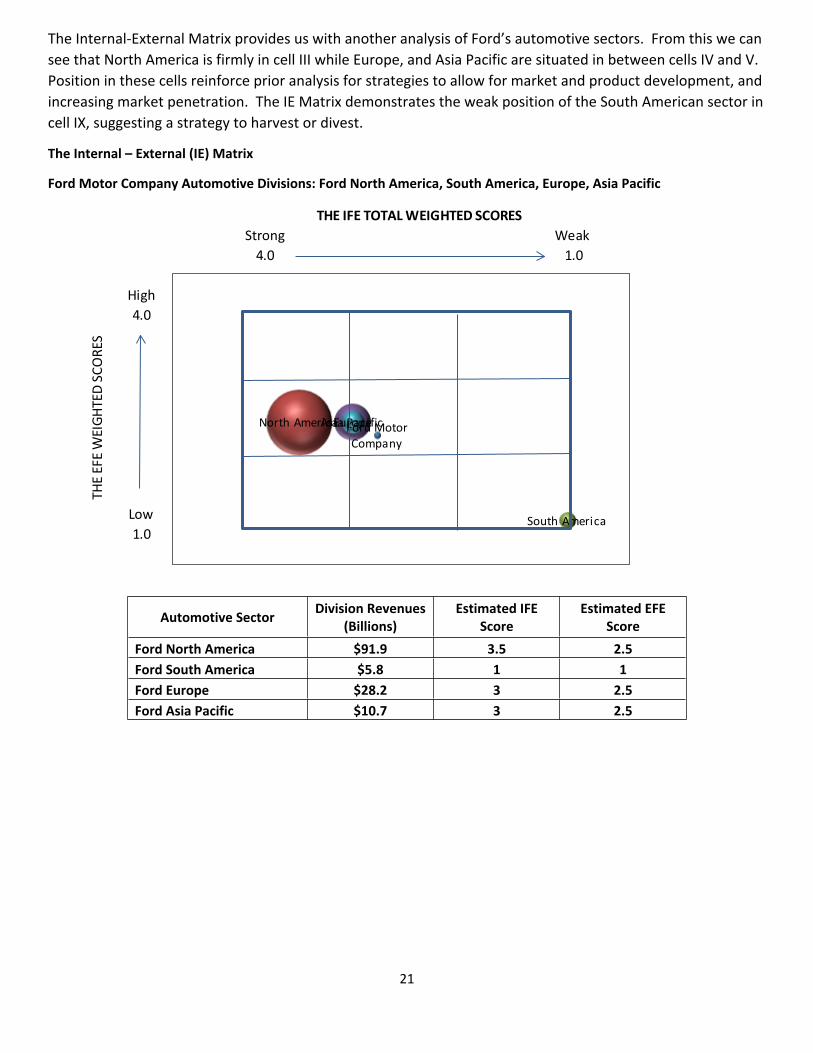
The Internal-External Matrix provides us with another analysis of Ford’s automotive sectors. From this we can see that North America is firmly in cell III while Europe, and Asia Pacific are situated in between cells IV and V. Position in these cells reinforce prior analysis for strategies to allow for market and product development, and increasing market penetration. The IE Matrix demonstrates the weak position of the South American sector in cell IX, suggesting a strategy to harvest or divest.
The Internal – External (IE) Matrix
Ford Motor Company Automotive Divisions: Ford North America, South America, Europe, Asia Pacific
Strong Weak 4.0 1.0
High4.0
Low1.0
THE IFE TOTAL WEIGHTED SCORES
THE
EFE
WEI
GHTE
D SC
ORE
S
Ford Motor Company
North America
South America
EuropeAsia Pacific
Automotive Sector Division Revenues (Billions)
Estimated IFE Score
Estimated EFE Score
Ford North America $91.9 3.5 2.5Ford South America $5.8 1 1Ford Europe $28.2 3 2.5Ford Asia Pacific $10.7 3 2.5
22
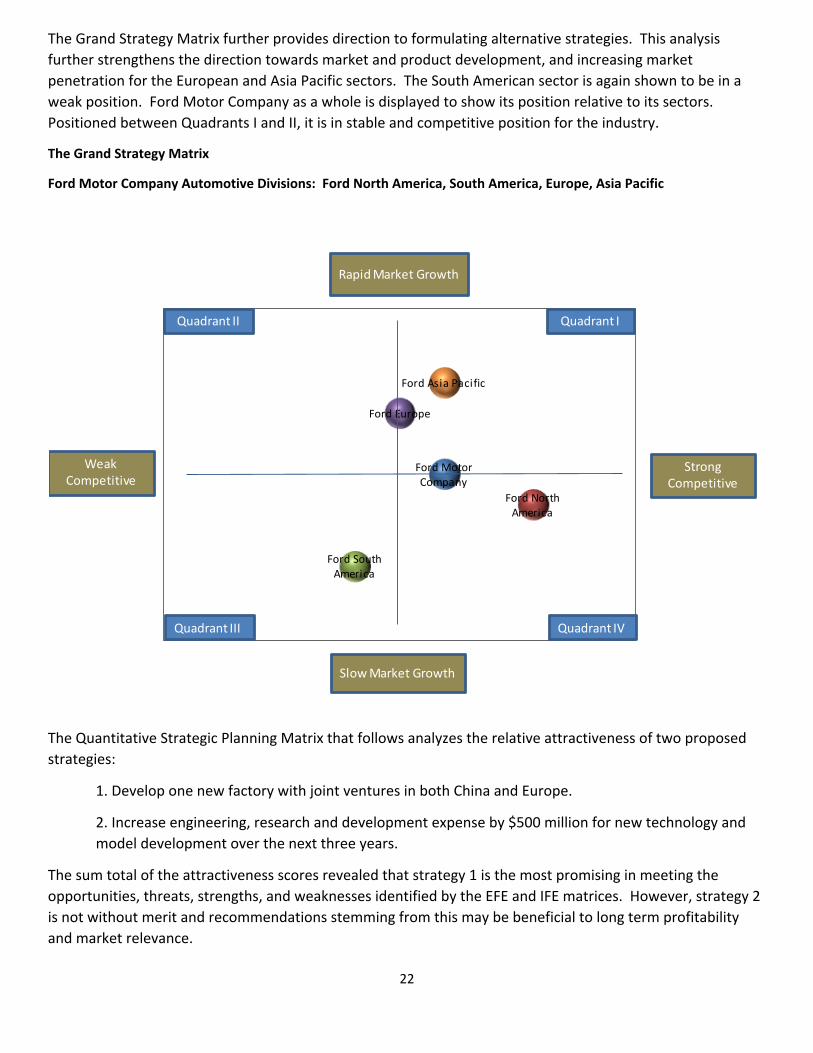
The Grand Strategy Matrix further provides direction to formulating alternative strategies. This analysis further strengthens the direction towards market and product development, and increasing market penetration for the European and Asia Pacific sectors. The South American sector is again shown to be in a weak position. Ford Motor Company as a whole is displayed to show its position relative to its sectors. Positioned between Quadrants I and II, it is in stable and competitive position for the industry.
The Grand Strategy Matrix
Ford Motor Company Automotive Divisions: Ford North America, South America, Europe, Asia Pacific
Ford Motor Company
Ford North America
Ford South America
Ford Europe
Ford Asia Pacific
Quadrant II Quadrant I
Quadrant III Quadrant IV
Rapid Market Growth
Slow Market Growth
Strong Competitive
Weak Competitive
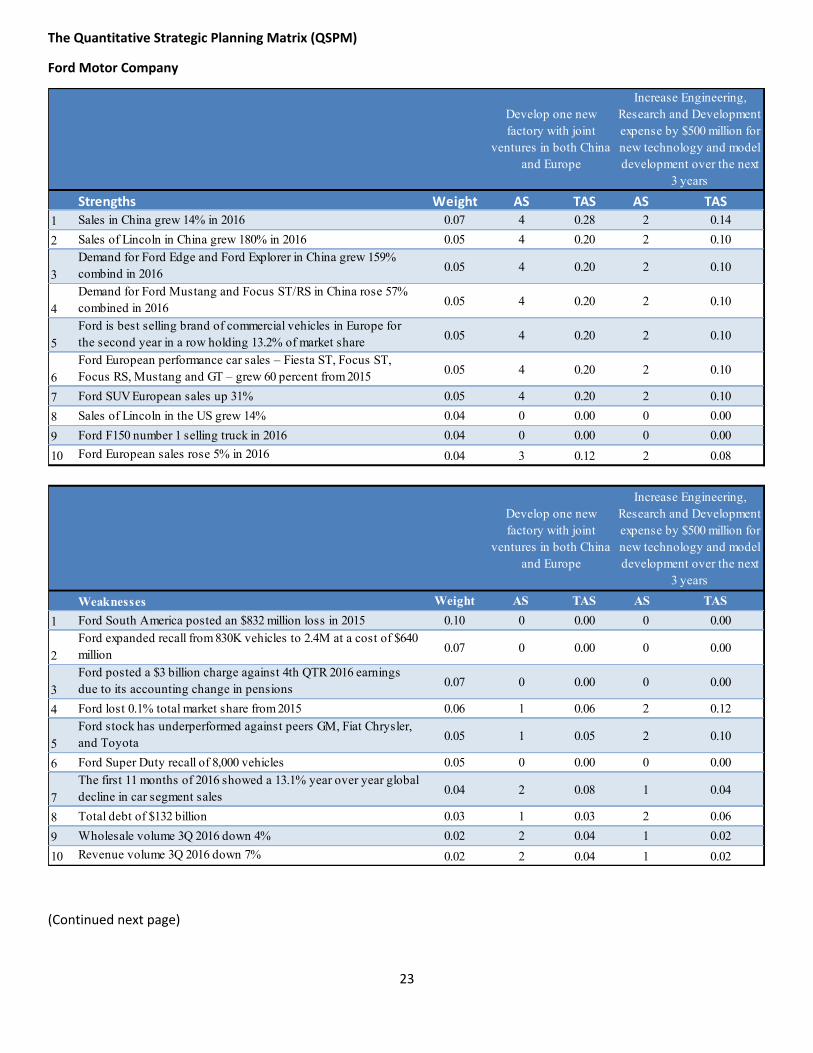
The Quantitative Strategic Planning Matrix that follows analyzes the relative attractiveness of two proposed strategies:
1. Develop one new factory with joint ventures in both China and Europe.
2. Increase engineering, research and development expense by $500 million for new technology and model development over the next three years.
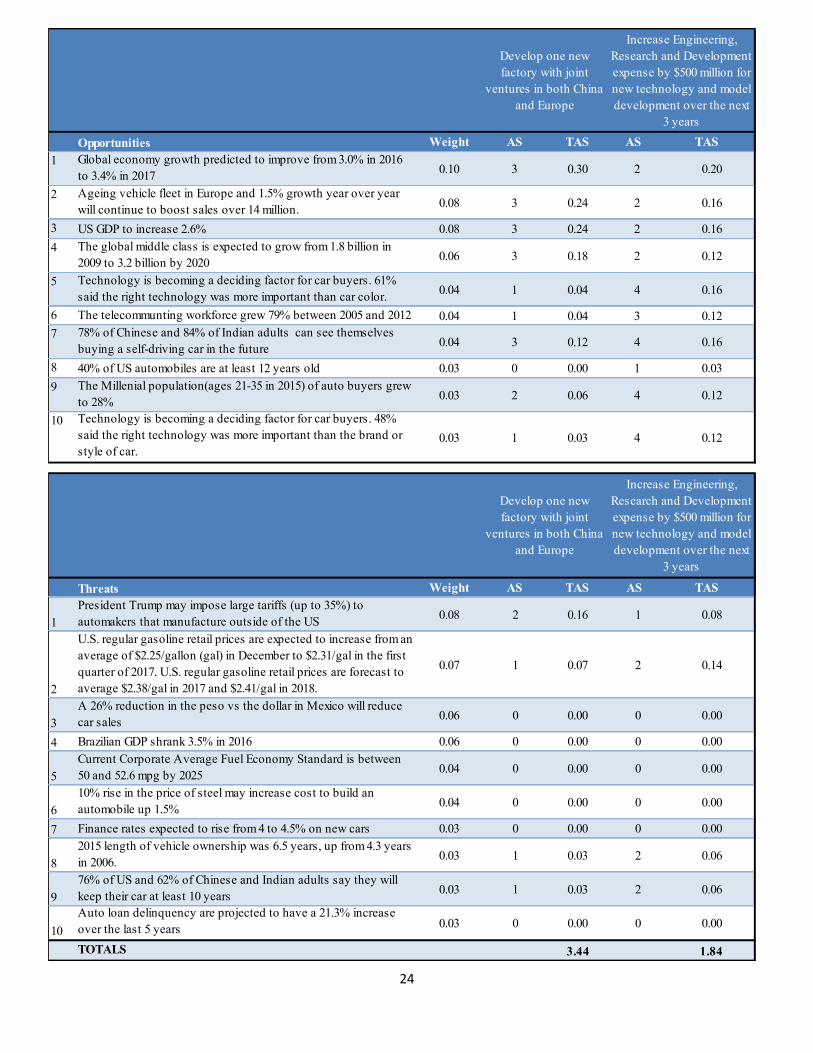
The sum total of the attractiveness scores revealed that strategy 1 is the most promising in meeting the opportunities, threats, strengths, and weaknesses identified by the EFE and IFE matrices. However, strategy 2 is not without merit and recommendations stemming from this may be beneficial to long term profitability and market relevance.
23
The Quantitative Strategic Planning Matrix (QSPM)
Ford Motor Company
Strengths Weight AS TAS AS TAS 1 Sales in China grew 14% in 2016 0.07 4 0.28 2 0.142 Sales of Lincoln in China grew 180% in 2016 0.05 4 0.20 2 0.10
3Demand for Ford Edge and Ford Explorer in China grew 159% combind in 2016 0.05 4 0.20 2 0.10
4Demand for Ford Mustang and Focus ST/RS in China rose 57% combined in 2016 0.05 4 0.20 2 0.10
5Ford is best selling brand of commercial vehicles in Europe for the second year in a row holding 13.2% of market share 0.05 4 0.20 2 0.10
6Ford European performance car sales – Fiesta ST, Focus ST, Focus RS, Mustang and GT – grew 60 percent from 2015 0.05 4 0.20 2 0.10
7 Ford SUV European sales up 31% 0.05 4 0.20 2 0.108 Sales of Lincoln in the US grew 14% 0.04 0 0.00 0 0.009 Ford F150 number 1 selling truck in 2016 0.04 0 0.00 0 0.0010 Ford European sales rose 5% in 2016 0.04 3 0.12 2 0.08
Weaknesses Weight AS TAS AS TAS 1 Ford South America posted an $832 million loss in 2015 0.10 0 0.00 0 0.00
2Ford expanded recall from 830K vehicles to 2.4M at a cost of $640 million 0.07 0 0.00 0 0.00
3Ford posted a $3 billion charge against 4th QTR 2016 earnings due to its accounting change in pensions 0.07 0 0.00 0 0.00
4 Ford lost 0.1% total market share from 2015 0.06 1 0.06 2 0.12
5Ford stock has underperformed against peers GM, Fiat Chrysler, and Toyota 0.05 1 0.05 2 0.10
6 Ford Super Duty recall of 8,000 vehicles 0.05 0 0.00 0 0.00
7The first 11 months of 2016 showed a 13.1% year over year global decline in car segment sales 0.04 2 0.08 1 0.04
8 Total debt of $132 billion 0.03 1 0.03 2 0.069 Wholesale volume 3Q 2016 down 4% 0.02 2 0.04 1 0.0210 Revenue volume 3Q 2016 down 7% 0.02 2 0.04 1 0.02
Develop one new factory with joint
ventures in both China and Europe
Increase Engineering, Research and Development expense by $500 million for new technology and model development over the next
3 years
Increase Engineering, Research and Development expense by $500 million for new technology and model development over the next
3 years
Develop one new factory with joint
ventures in both China and Europe
(Continued next page)
24
Opportunities Weight AS TAS AS TAS 1 Global economy growth predicted to improve from 3.0% in 2016
to 3.4% in 2017 0.10 3 0.30 2 0.20
2 Ageing vehicle fleet in Europe and 1.5% growth year over year will continue to boost sales over 14 million. 0.08 3 0.24 2 0.16
3 US GDP to increase 2.6% 0.08 3 0.24 2 0.164 The global middle class is expected to grow from 1.8 billion in
2009 to 3.2 billion by 2020 0.06 3 0.18 2 0.12
5 Technology is becoming a deciding factor for car buyers. 61% said the right technology was more important than car color. 0.04 1 0.04 4 0.16
6 The telecommunting workforce grew 79% between 2005 and 2012 0.04 1 0.04 3 0.127 78% of Chinese and 84% of Indian adults can see themselves
buying a self-driving car in the future 0.04 3 0.12 4 0.16
8 40% of US automobiles are at least 12 years old 0.03 0 0.00 1 0.039 The Millenial population(ages 21-35 in 2015) of auto buyers grew
to 28% 0.03 2 0.06 4 0.12
10 Technology is becoming a deciding factor for car buyers. 48% said the right technology was more important than the brand or style of car.
0.03 1 0.03 4 0.12
Threats Weight AS TAS AS TAS
1President Trump may impose large tariffs (up to 35%) to automakers that manufacture outside of the US 0.08 2 0.16 1 0.08
2
U.S. regular gasoline retail prices are expected to increase from an average of $2.25/gallon (gal) in December to $2.31/gal in the first quarter of 2017. U.S. regular gasoline retail prices are forecast to average $2.38/gal in 2017 and $2.41/gal in 2018.
0.07 1 0.07 2 0.14
3A 26% reduction in the peso vs the dollar in Mexico will reduce car sales 0.06 0 0.00 0 0.00
4 Brazilian GDP shrank 3.5% in 2016 0.06 0 0.00 0 0.00
5Current Corporate Average Fuel Economy Standard is between 50 and 52.6 mpg by 2025 0.04 0 0.00 0 0.00
610% rise in the price of steel may increase cost to build an automobile up 1.5% 0.04 0 0.00 0 0.00
7 Finance rates expected to rise from 4 to 4.5% on new cars 0.03 0 0.00 0 0.00
82015 length of vehicle ownership was 6.5 years, up from 4.3 years in 2006. 0.03 1 0.03 2 0.06
976% of US and 62% of Chinese and Indian adults say they will keep their car at least 10 years 0.03 1 0.03 2 0.06
10Auto loan delinquency are projected to have a 21.3% increase over the last 5 years 0.03 0 0.00 0 0.00
TOTALS 3.44 1.84
Increase Engineering, Research and Development expense by $500 million for new technology and model development over the next
3 years
Develop one new factory with joint
ventures in both China and Europe
Increase Engineering, Research and Development expense by $500 million for new technology and model development over the next
3 years
Develop one new factory with joint
ventures in both China and Europe
25
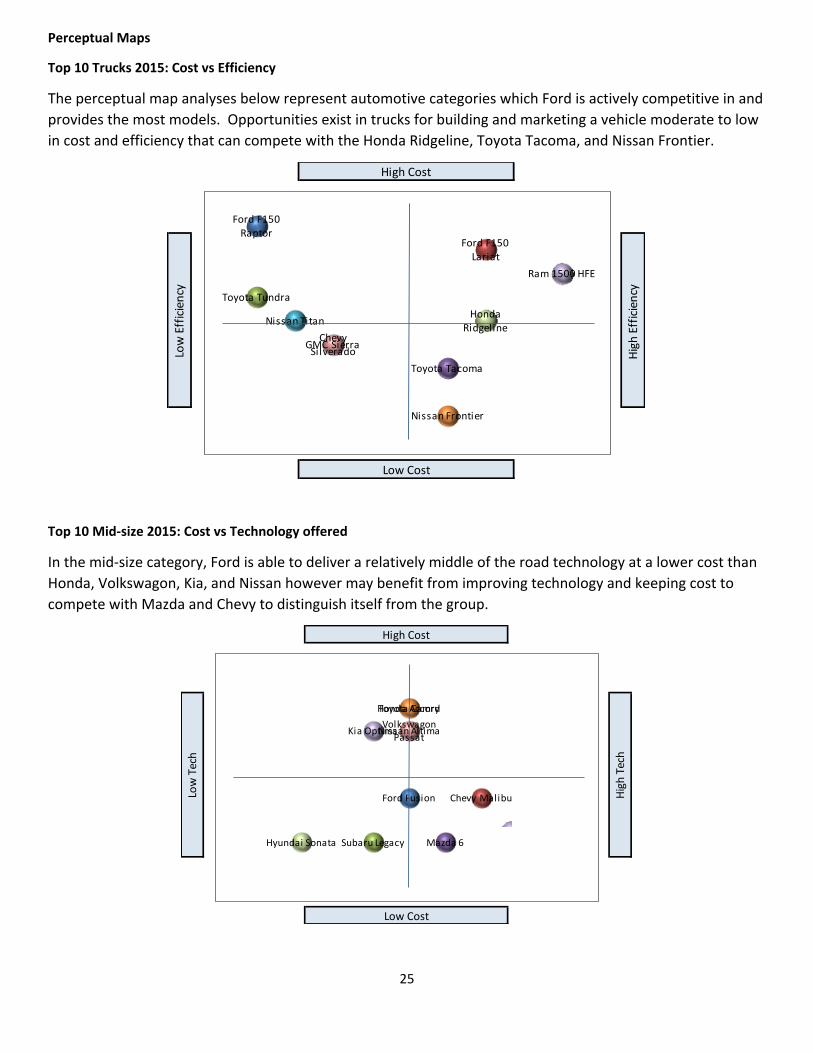
Perceptual Maps
Top 10 Trucks 2015: Cost vs Efficiency
The perceptual map analyses below represent automotive categories which Ford is actively competitive in and provides the most models. Opportunities exist in trucks for building and marketing a vehicle moderate to low in cost and efficiency that can compete with the Honda Ridgeline, Toyota Tacoma, and Nissan Frontier.
Low Cost
Low
Eff
icien
cy
High
Eff
icien
cy
High Cost
Ford F150 Raptor
Ford F150 Lariat
Toyota Tundra
Toyota Tacoma
Nissan Titan
Nissan Frontier
Chevy SilveradoGMC Sierra
Honda Ridgeline
Ram 1500 HFE
Top 10 Mid-size 2015: Cost vs Technology offered
In the mid-size category, Ford is able to deliver a relatively middle of the road technology at a lower cost than Honda, Volkswagon, Kia, and Nissan however may benefit from improving technology and keeping cost to compete with Mazda and Chevy to distinguish itself from the group.
Low Cost
Low
Tec
h
High
Tec
hHigh Cost
Ford Fusion Chevy Malibu
Subaru Legacy Mazda 6
Honda AccordToyota CamryVolkswagon
PassatNissan Altima
Hyundai Sonata
Kia Optima
26
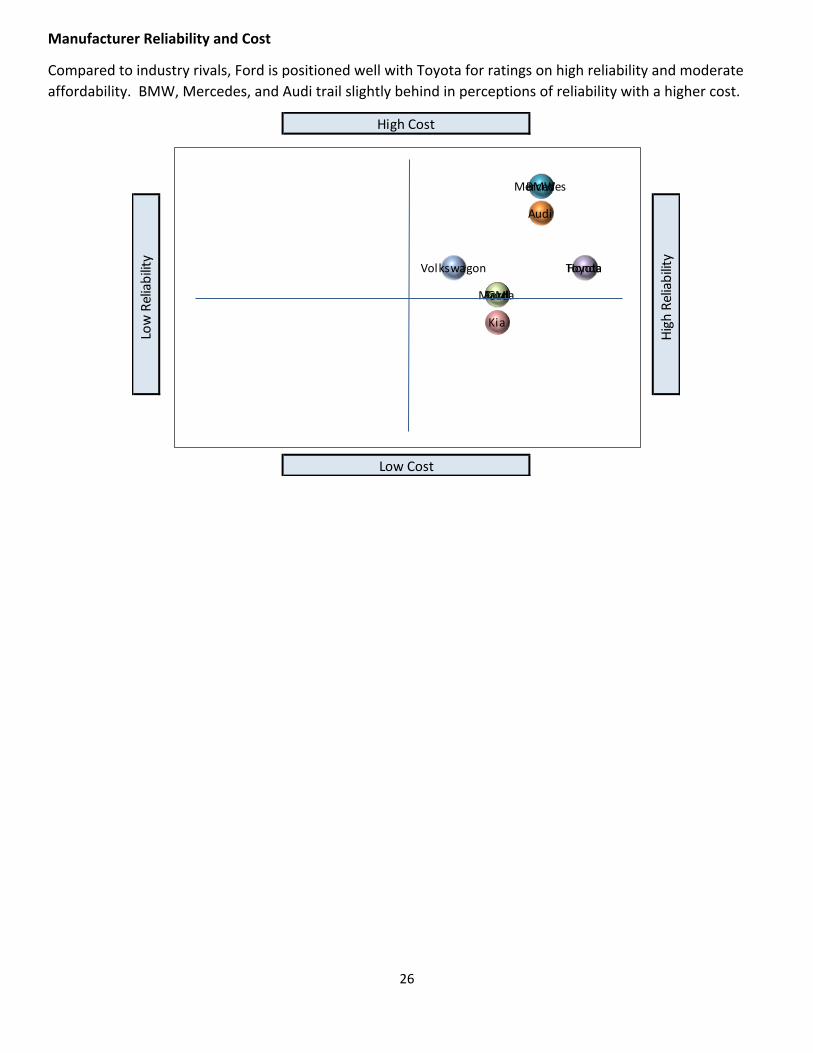
Manufacturer Reliability and Cost
Compared to industry rivals, Ford is positioned well with Toyota for ratings on high reliability and moderate affordability. BMW, Mercedes, and Audi trail slightly behind in perceptions of reliability with a higher cost.
Low Cost
Low
Rel
iabi
lity
High
Rel
iabi
lity
High Cost
FordGM
Toyota
MercedesBMW
Audi
Volkswagon
Kia
Mazda
Honda
27
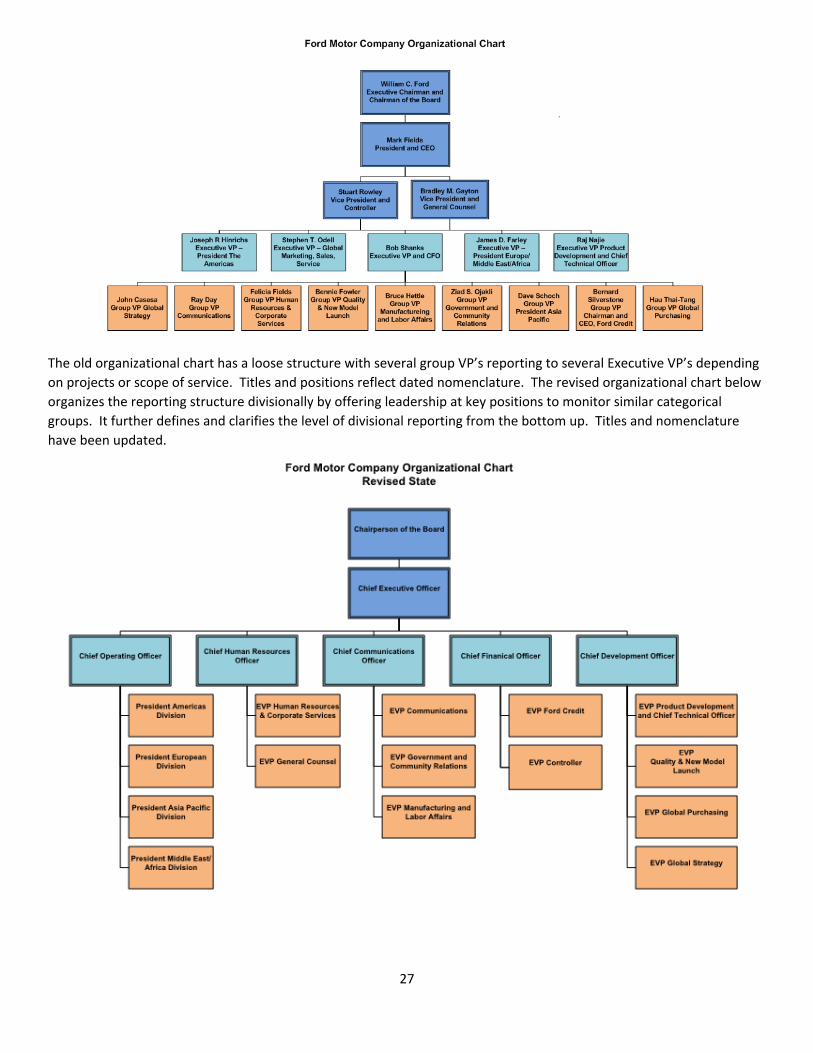
The old organizational chart has a loose structure with several group VP’s reporting to several Executive VP’s depending on projects or scope of service. Titles and positions reflect dated nomenclature. The revised organizational chart below organizes the reporting structure divisionally by offering leadership at key positions to monitor similar categorical groups. It further defines and clarifies the level of divisional reporting from the bottom up. Titles and nomenclature have been updated.
28
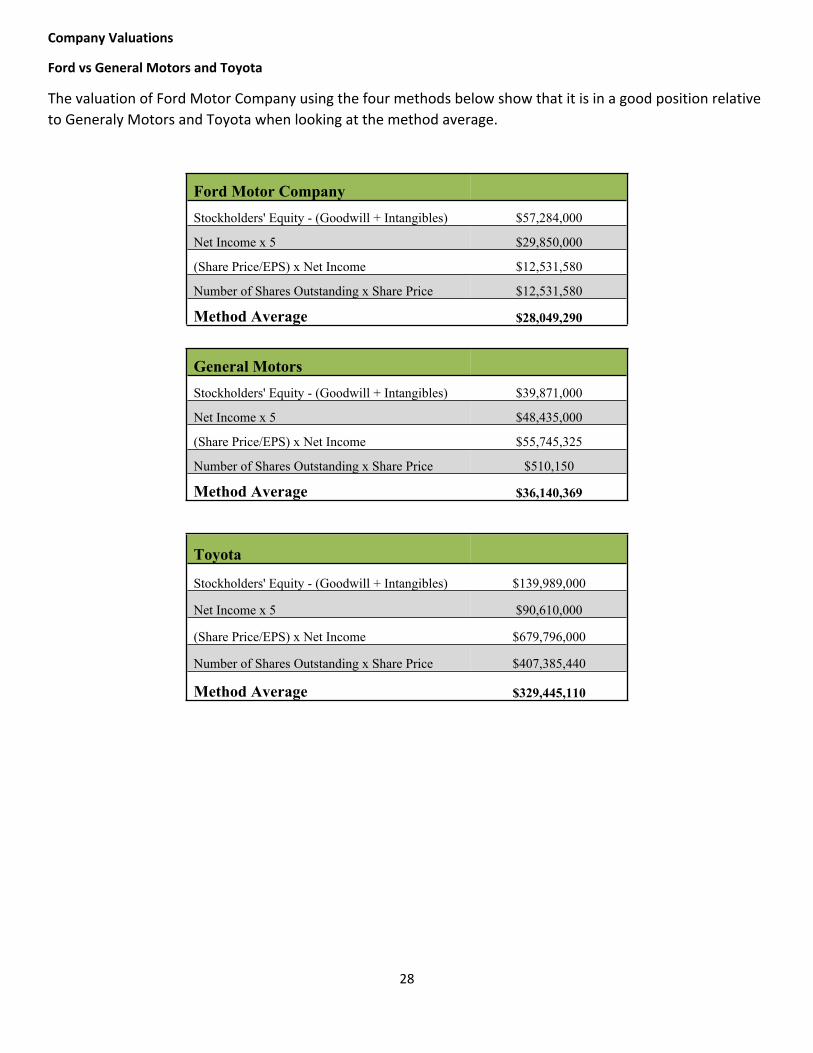
Company Valuations
Ford vs General Motors and Toyota
The valuation of Ford Motor Company using the four methods below show that it is in a good position relative to Generaly Motors and Toyota when looking at the method average.
Ford Motor Company
Stockholders' Equity - (Goodwill + Intangibles) $57,284,000
Net Income x 5 $29,850,000
(Share Price/EPS) x Net Income $12,531,580
Number of Shares Outstanding x Share Price $12,531,580
Method Average $28,049,290
General Motors
Stockholders' Equity - (Goodwill + Intangibles) $39,871,000
Net Income x 5 $48,435,000
(Share Price/EPS) x Net Income $55,745,325
Number of Shares Outstanding x Share Price $510,150
Method Average $36,140,369
Toyota
Stockholders' Equity - (Goodwill + Intangibles) $139,989,000
Net Income x 5 $90,610,000
(Share Price/EPS) x Net Income $679,796,000
Number of Shares Outstanding x Share Price $407,385,440
Method Average $329,445,110
29
Recommendations Year 1 Year 2 Year 3 Total Cost
1 Develop 1 factory in both China and Europe with help of joint ventures.
$750,000,000 $750,000,000 $0 $1,500,000,000
2 Create new 3 new automobile models with current base platform compatibility to be released in 3 years.
$1,100,000,000 $0 $0 $1,100,000,000
3 Increase engineering, research and development budget by $300 million over 3 years to focus on fuel efficient and alternative fuel engine development.
$100,000,000 $100,000,000 $100,000,000 $300,000,000
4 Develop upgrades in 6 plants over 3 years to mitigate risk of recalls and improve operational efficiency.
$80,000,000 $80,000,000 $80,000,000 $240,000,000
5 Increase engineering, research and development budget by $200 million over 3 years to focus on developing technology for Ford Smart Mobility Initiatives: Sync, Autonomous vehicles, and Ford Pass.
$68,000,000 $66,000,000 $66,000,000 $200,000,000
6 Increase & market loan and lease incentives through Ford Credit on commercial and retail sales of automobiles (projected 10% increase in revenues and 5% increase in expense for next 3 years).
$400,000 $400,000 $400,000 $1,200,000
7 Shift & increase marketing campaign by 3.3% in Europe to focus on strengthening sales of Ford commercial vehicles.
$30,000,000 $30,000,000 $30,000,000 $90,000,000
8 Shift & increase marketing campaign by 3.3% in China towards luxury line Lincoln.
$30,000,000 $30,000,000 $30,000,000 $90,000,000
9 Shift & increase marketing campaign by 3.3% to target Millennial segment and younger generation of consumers.
$30,000,000 $30,000,000 $30,000,000 $90,000,000
10 Continue current level of marketing and operations in South America to maintain and/or improve market share from competitors.
$0 $0 $0 $0
TOTALS $2,188,400,000 $1,086,400,000 $336,400,000 $3,611,200,000
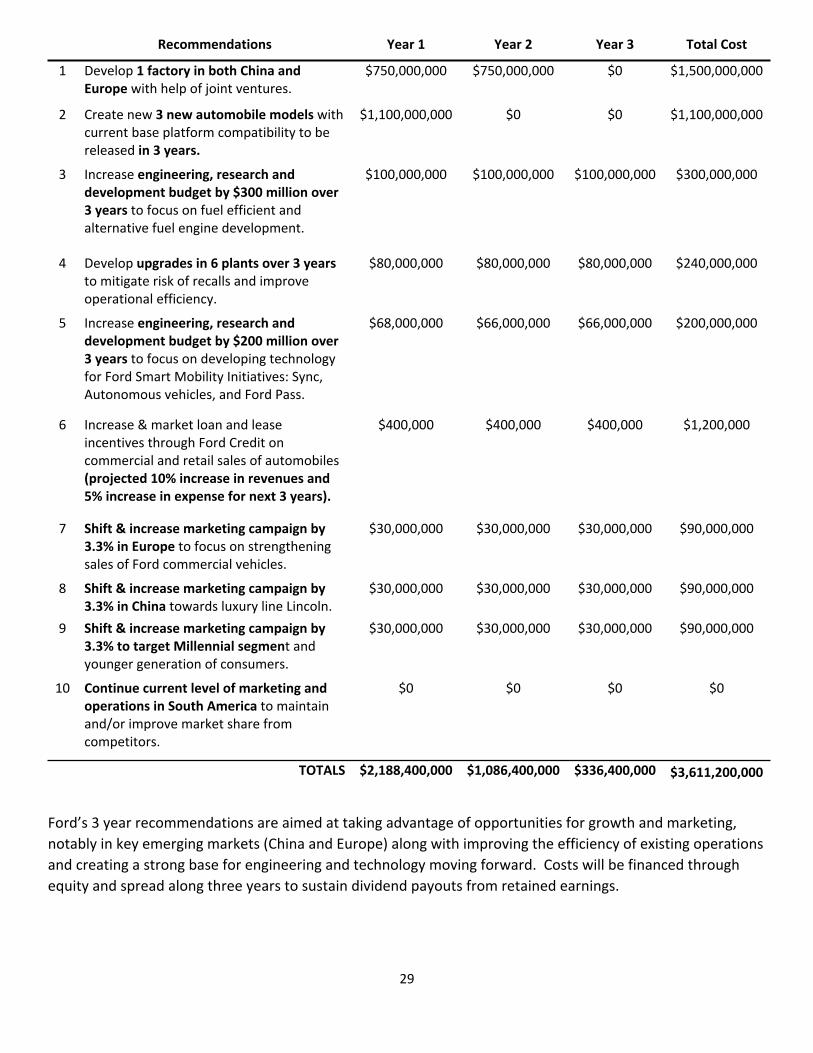
Ford’s 3 year recommendations are aimed at taking advantage of opportunities for growth and marketing, notably in key emerging markets (China and Europe) along with improving the efficiency of existing operations and creating a strong base for engineering and technology moving forward. Costs will be financed through equity and spread along three years to sustain dividend payouts from retained earnings.
30
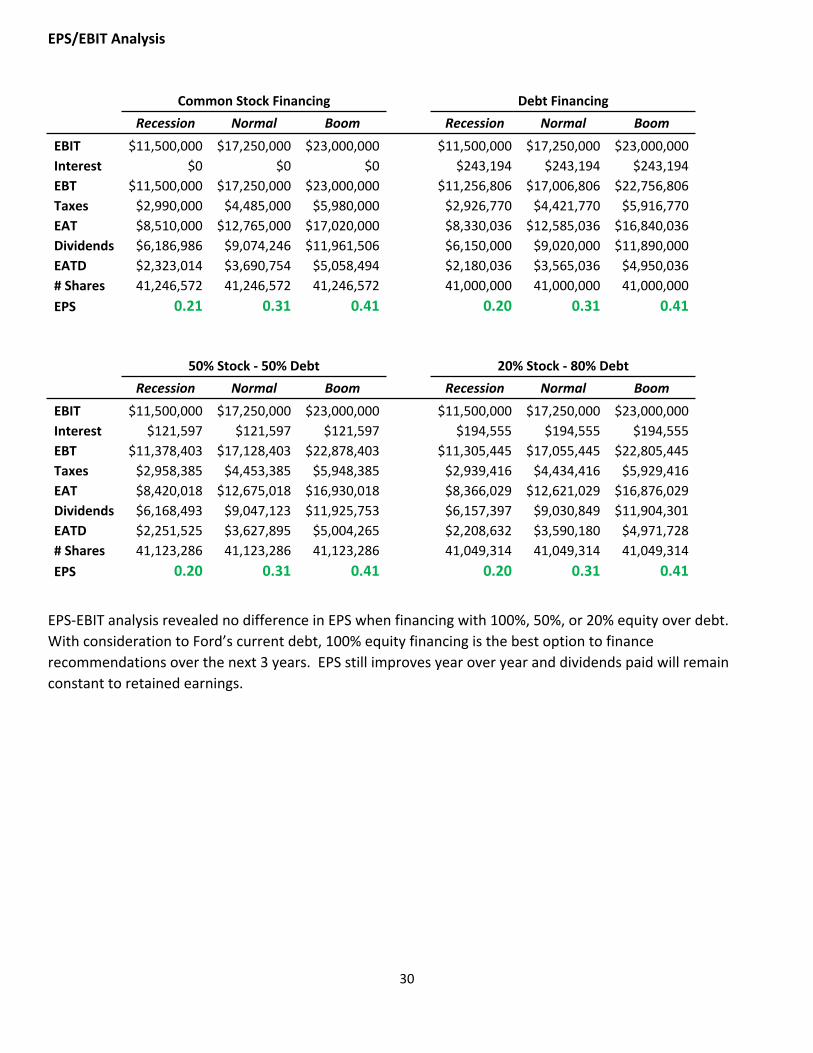
EPS/EBIT Analysis
Common Stock Financing Debt Financing
Recession Normal Boom Recession Normal BoomEBIT $11,500,000 $17,250,000 $23,000,000 $11,500,000 $17,250,000 $23,000,000Interest $0 $0 $0 $243,194 $243,194 $243,194EBT $11,500,000 $17,250,000 $23,000,000 $11,256,806 $17,006,806 $22,756,806Taxes $2,990,000 $4,485,000 $5,980,000 $2,926,770 $4,421,770 $5,916,770EAT $8,510,000 $12,765,000 $17,020,000 $8,330,036 $12,585,036 $16,840,036Dividends $6,186,986 $9,074,246 $11,961,506 $6,150,000 $9,020,000 $11,890,000EATD $2,323,014 $3,690,754 $5,058,494 $2,180,036 $3,565,036 $4,950,036# Shares 41,246,572 41,246,572 41,246,572 41,000,000 41,000,000 41,000,000EPS 0.21 0.31 0.41 0.20 0.31 0.41
50% Stock - 50% Debt 20% Stock - 80% Debt
Recession Normal Boom Recession Normal BoomEBIT $11,500,000 $17,250,000 $23,000,000 $11,500,000 $17,250,000 $23,000,000Interest $121,597 $121,597 $121,597 $194,555 $194,555 $194,555EBT $11,378,403 $17,128,403 $22,878,403 $11,305,445 $17,055,445 $22,805,445Taxes $2,958,385 $4,453,385 $5,948,385 $2,939,416 $4,434,416 $5,929,416EAT $8,420,018 $12,675,018 $16,930,018 $8,366,029 $12,621,029 $16,876,029Dividends $6,168,493 $9,047,123 $11,925,753 $6,157,397 $9,030,849 $11,904,301EATD $2,251,525 $3,627,895 $5,004,265 $2,208,632 $3,590,180 $4,971,728# Shares 41,123,286 41,123,286 41,123,286 41,049,314 41,049,314 41,049,314EPS 0.20 0.31 0.41 0.20 0.31 0.41
EPS-EBIT analysis revealed no difference in EPS when financing with 100%, 50%, or 20% equity over debt. With consideration to Ford’s current debt, 100% equity financing is the best option to finance recommendations over the next 3 years. EPS still improves year over year and dividends paid will remain constant to retained earnings.
31
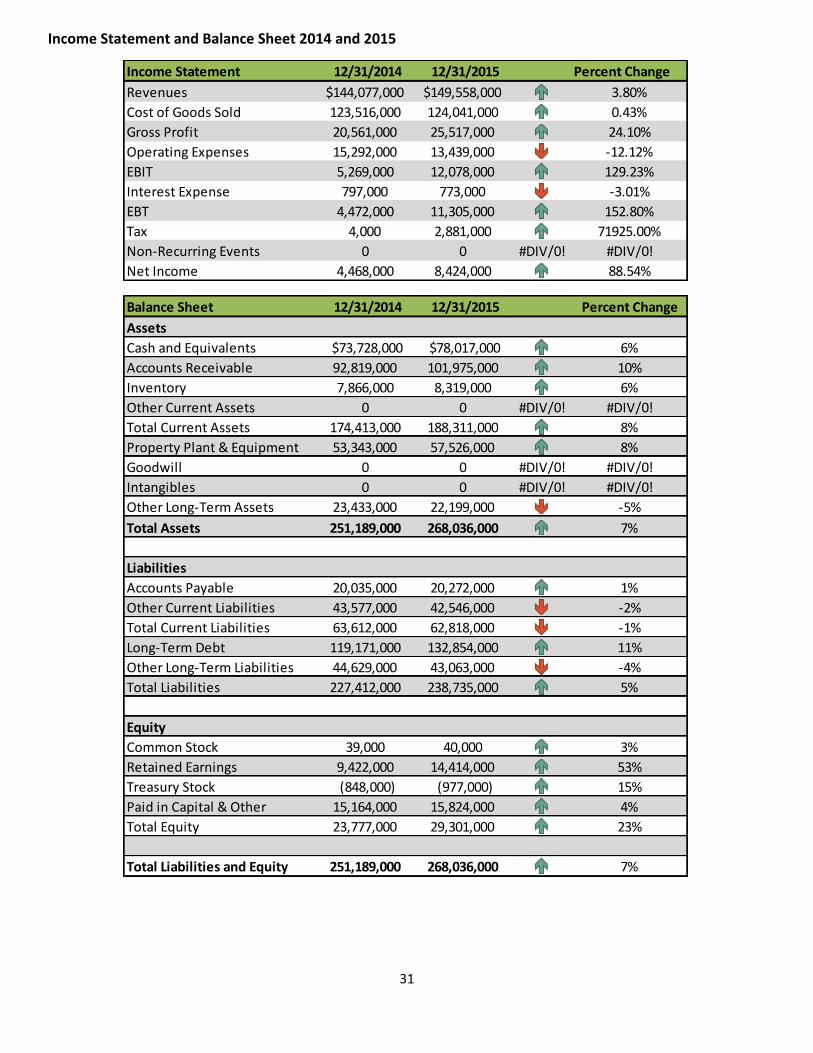
Income Statement and Balance Sheet 2014 and 2015
12/31/2014 12/31/2015 Percent Change$144,077,000 $149,558,000 3.80%123,516,000 124,041,000 0.43%20,561,000 25,517,000 24.10%15,292,000 13,439,000 -12.12%5,269,000 12,078,000 129.23%797,000 773,000 -3.01%
4,472,000 11,305,000 152.80%4,000 2,881,000 71925.00%
0 0 #DIV/0! #DIV/0!4,468,000 8,424,000 88.54%
Non-Recurring EventsNet Income
Income Statement
Interest ExpenseEBTTax
RevenuesCost of Goods SoldGross ProfitOperating ExpensesEBIT
12/31/2014 12/31/2015 Percent Change
$73,728,000 $78,017,000 6%92,819,000 101,975,000 10%7,866,000 8,319,000 6%
0 0 #DIV/0! #DIV/0!174,413,000 188,311,000 8%53,343,000 57,526,000 8%
0 0 #DIV/0! #DIV/0!0 0 #DIV/0! #DIV/0!
23,433,000 22,199,000 -5%251,189,000 268,036,000 7%
20,035,000 20,272,000 1%43,577,000 42,546,000 -2%63,612,000 62,818,000 -1%119,171,000 132,854,000 11%44,629,000 43,063,000 -4%227,412,000 238,735,000 5%
39,000 40,000 3%9,422,000 14,414,000 53%(848,000) (977,000) 15%
15,164,000 15,824,000 4%23,777,000 29,301,000 23%
251,189,000 268,036,000 7%
Balance SheetAssetsCash and EquivalentsAccounts Receivable
Total Current Liabilities
Other Current AssetsTotal Current AssetsProperty Plant & EquipmentGoodwillIntangiblesOther Long-Term AssetsTotal Assets
LiabilitiesAccounts PayableOther Current Liabilities
Inventory
Total Liabilities and Equity
Long-Term DebtOther Long-Term LiabilitiesTotal Liabilities
EquityCommon StockRetained EarningsTreasury StockPaid in Capital & OtherTotal Equity
32
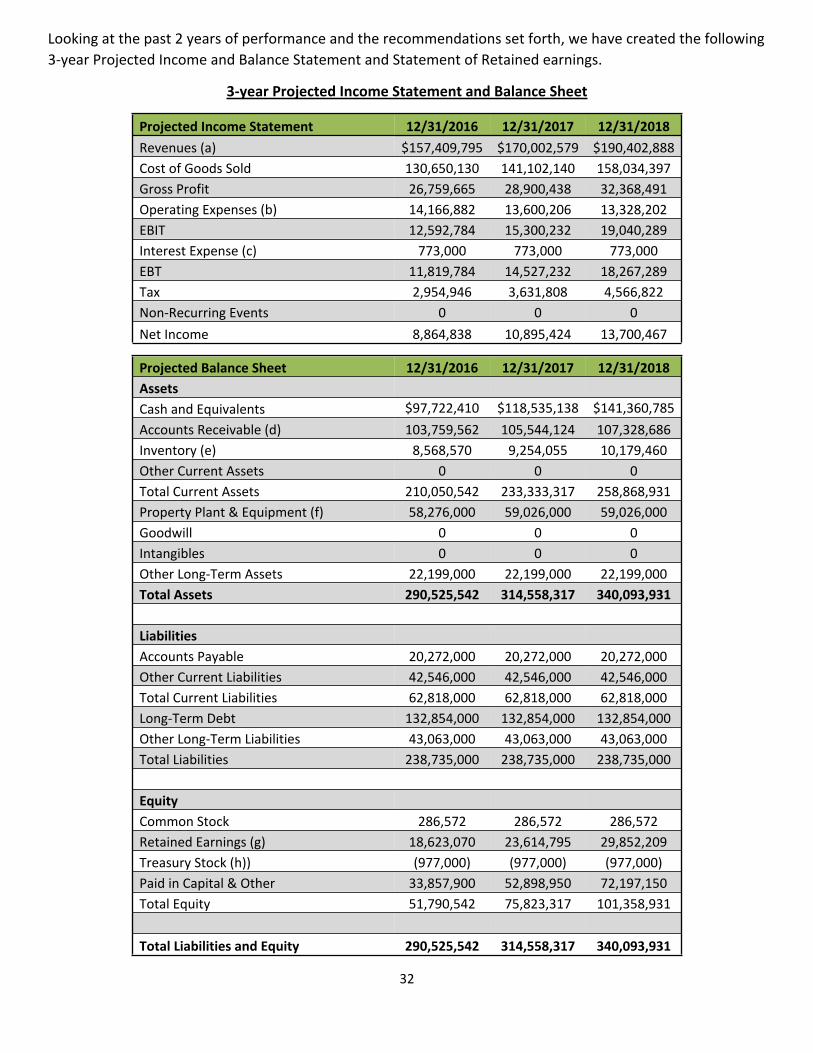
Looking at the past 2 years of performance and the recommendations set forth, we have created the following 3-year Projected Income and Balance Statement and Statement of Retained earnings.
3-year Projected Income Statement and Balance Sheet
Projected Income Statement 12/31/2016 12/31/2017 12/31/2018Revenues (a) $157,409,795 $170,002,579 $190,402,888 Cost of Goods Sold 130,650,130 141,102,140 158,034,397 Gross Profit 26,759,665 28,900,438 32,368,491 Operating Expenses (b) 14,166,882 13,600,206 13,328,202 EBIT 12,592,784 15,300,232 19,040,289 Interest Expense (c) 773,000 773,000 773,000 EBT 11,819,784 14,527,232 18,267,289 Tax 2,954,946 3,631,808 4,566,822 Non-Recurring Events 0 0 0 Net Income 8,864,838 10,895,424 13,700,467
Projected Balance Sheet 12/31/2016 12/31/2017 12/31/2018Assets Cash and Equivalents $97,722,410 $118,535,138 $141,360,785 Accounts Receivable (d) 103,759,562 105,544,124 107,328,686 Inventory (e) 8,568,570 9,254,055 10,179,460 Other Current Assets 0 0 0 Total Current Assets 210,050,542 233,333,317 258,868,931 Property Plant & Equipment (f) 58,276,000 59,026,000 59,026,000 Goodwill 0 0 0 Intangibles 0 0 0 Other Long-Term Assets 22,199,000 22,199,000 22,199,000 Total Assets 290,525,542 314,558,317 340,093,931 Liabilities Accounts Payable 20,272,000 20,272,000 20,272,000 Other Current Liabilities 42,546,000 42,546,000 42,546,000 Total Current Liabilities 62,818,000 62,818,000 62,818,000 Long-Term Debt 132,854,000 132,854,000 132,854,000 Other Long-Term Liabilities 43,063,000 43,063,000 43,063,000 Total Liabilities 238,735,000 238,735,000 238,735,000 Equity Common Stock 286,572 286,572 286,572 Retained Earnings (g) 18,623,070 23,614,795 29,852,209 Treasury Stock (h)) (977,000) (977,000) (977,000)Paid in Capital & Other 33,857,900 52,898,950 72,197,150 Total Equity 51,790,542 75,823,317 101,358,931 Total Liabilities and Equity 290,525,542 314,558,317 340,093,931
33
Notes to Projected Income Statement
(a) Revenues: Increases of 5.25% Year 1, 8% Year 2, and 12% Year 3 with addition of 2 new factories (China and Europe), 3 new model releases, increased marketing focus in China, Europe, and Millennial population segment, and Ford Credit growth.
(b) Operating Expenses: 9% Year 1, decrease to 8% Year 2 and decrease to 7% Year 3 secondary to 6 plant upgrades creating improved efficiencies.
(c) Interest Expense: No new interest expense incurred for projected recommendations. Finance all with equity.
Notes to Projected Balance Sheet
(d) Accounts Receivable: Historical average of 1.7% increase.
(e) Inventory: Plant development in Year 1 and 2 along with plant upgrades Year 1, 2, and 3 will allow for steady increase of inventory produced with 3% Year 1, 8% Year 2, and 10% Year 3.
(f) Property Plant & Equipment: Increase of $750 million in Year 1 and Year 2 for plant development.
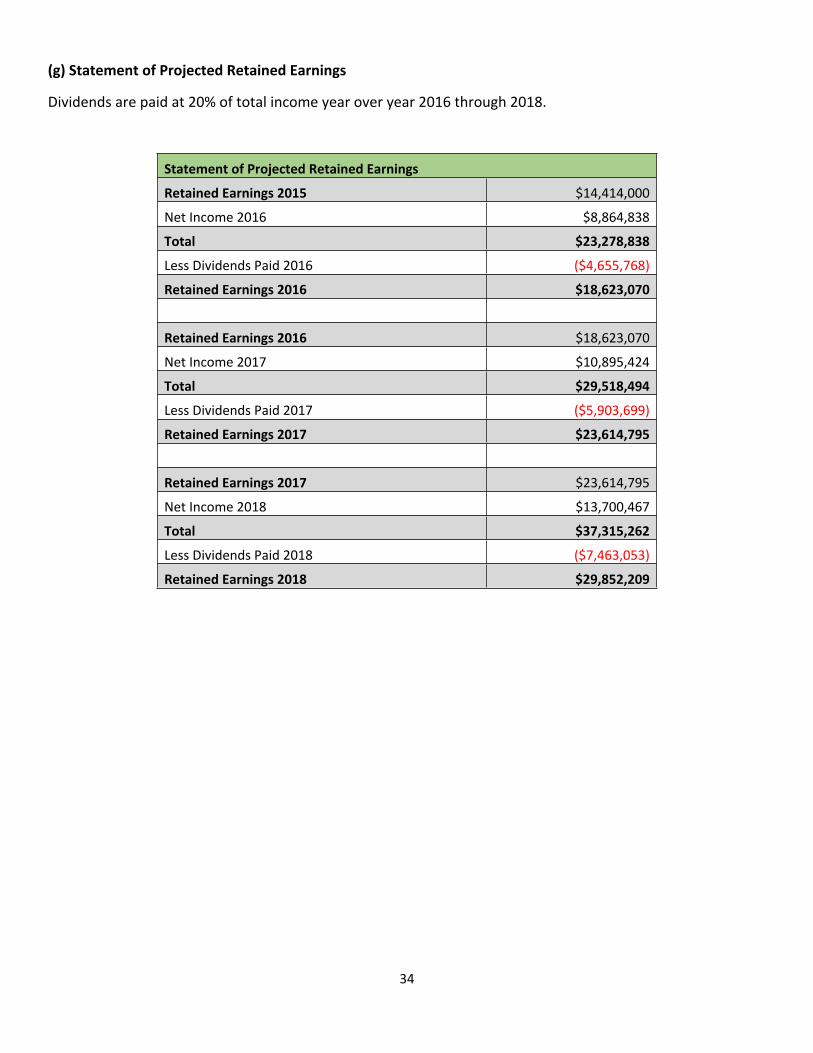
(g) Retained Earnings: See Statement of Projected Retained Earnings below. Dividend payout of 20% year over year 2016 through 2018.
(h) Treasury Stock: No new additional treasury stock projected.
34
(g) Statement of Projected Retained Earnings
Dividends are paid at 20% of total income year over year 2016 through 2018.
Statement of Projected Retained Earnings
Retained Earnings 2015 $14,414,000
Net Income 2016 $8,864,838
Total $23,278,838
Less Dividends Paid 2016 ($4,655,768)
Retained Earnings 2016 $18,623,070
Retained Earnings 2016 $18,623,070
Net Income 2017 $10,895,424
Total $29,518,494
Less Dividends Paid 2017 ($5,903,699)
Retained Earnings 2017 $23,614,795
Retained Earnings 2017 $23,614,795
Net Income 2018 $13,700,467
Total $37,315,262
Less Dividends Paid 2018 ($7,463,053)
Retained Earnings 2018 $29,852,209
35
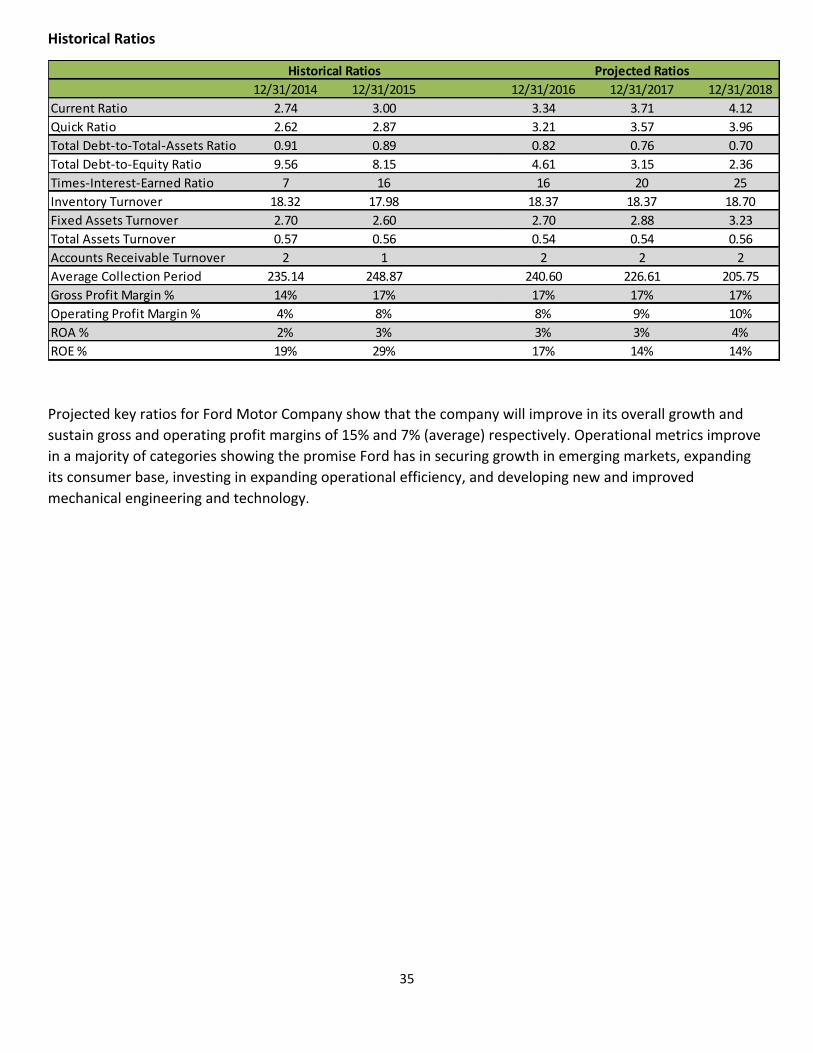
Historical Ratios
12/31/2014 12/31/2015 12/31/2016 12/31/2017 12/31/2018Current Ratio 2.74 3.00 3.34 3.71 4.12Quick Ratio 2.62 2.87 3.21 3.57 3.96Total Debt-to-Total-Assets Ratio 0.91 0.89 0.82 0.76 0.70Total Debt-to-Equity Ratio 9.56 8.15 4.61 3.15 2.36Times-Interest-Earned Ratio 7 16 16 20 25Inventory Turnover 18.32 17.98 18.37 18.37 18.70Fixed Assets Turnover 2.70 2.60 2.70 2.88 3.23Total Assets Turnover 0.57 0.56 0.54 0.54 0.56Accounts Receivable Turnover 2 1 2 2 2Average Collection Period 235.14 248.87 240.60 226.61 205.75Gross Profit Margin % 14% 17% 17% 17% 17%Operating Profit Margin % 4% 8% 8% 9% 10%ROA % 2% 3% 3% 3% 4%ROE % 19% 29% 17% 14% 14%
Projected RatiosHistorical Ratios
Projected key ratios for Ford Motor Company show that the company will improve in its overall growth and sustain gross and operating profit margins of 15% and 7% (average) respectively. Operational metrics improve in a majority of categories showing the promise Ford has in securing growth in emerging markets, expanding its consumer base, investing in expanding operational efficiency, and developing new and improved mechanical engineering and technology.
36
Executive Summary
Ford is a global leader in the automotive industry. Investment in its operations over the past four years has laid a substantial foundation with which to attain sustainable growth and profitability moving forward. While competitors slow down or retract, Ford moves forward with its unified mission to gain footing in this highly competitive industry. The key to success in the automotive industry is to differentiate oneself from the competition in meeting the customer for both products and service. Ford ‘s ability to overcome the United States economic crisis through solid investments in technology for their products and service to their customers has allowed it to be in a position to reap rewards in growth and finances moving forward.
Recommendations over the next 3 years are focused on continuous investments in emerging markets for global growth, investments in engineering and technology so that we are poised to dominate the future of automotive offerings and trends, and investments in infrastructure to continually improve efficiency driving quality up and costs down. Ford recognizes the future of its customer base and will steer marketing to impact both emerging markets as well as, new and old customer bases.
Emerging Markets
Plant development in China and Europe will increase our ability to deliver vehicles in the most influential growth markets and population segments. We are seeing a consumer shift in both vehicle brand and model offerings at mid to high price ranges. Additionally, presence in these markets will allow easier access through infrastructure and logistics to the Middle East, Africa, and Russia. With the middle class growing globally, the Ford automotive market can be there to reap the benefits.
Research and Development in Engineering and Technology
Market research shows a growing desire for emerging technology to encompass all areas of the customer’s lifestyle. Investment in technologies for the new age of automobiles will cater to customer wants and needs as technology becomes more of a standard than a luxury within the automotive industry. Developing and incorporating this technology will require a solid investment and collaboration with leading technological firms to set Ford apart from its competitors.
Engineering in vehicle efficiency is still a key player in consumer decisions. Not only as the customer base becomes more environmentally conscious, but as regulations and cost on fuels increase. Efficient engines and vehicle design that can still perform and excite the customer will always be a mainstay for Ford.
Ford Automotive Infrastructure
Quality was an issue in 2014 and 2015 with recall costs at an all-time high. Recalls damage automotive credibility and can cost more than what is shown on the expense line on the balance sheet. Investment in the focus on quality and the efficiency of plant operations will show to have an increase in overall production and revenue while driving costs down.
Marketing Focus
Ford recognizes the changing consumer base. Clients in all markets clamor for different trends to meet their needs. To capitalize on the growth of the Ford brand, we must re-appropriate funds to focus on these

37
consumer bases. We have a generation emerging into a growing middle class of consumerism and emerging markets that are poised to arrive onto the automotive consumption scene. Establishing a firm Ford brand through aggressive marketing of all the strengths will establish our foothold and allow increasing expansion.
As projected, the next 3 years show year over year profitability for Ford with ongoing growth and investment in the key areas stated above. Ford will continue to offer dividend payouts over the next three years to maintain investor confidence. Projected ratios demonstrate the healthy future of the Ford Motor Company and its continued leadership in the automotive industry.
![2019 FIRST QUARTER FINANCIAL RESULTS* - shareholder.ford… · 4 Ford Motor Company 1Q April 25, 2019 CONFERENCE CALL DETAILS Ford Motor Company [NYSE:F] and Ford Motor Credit Company](https://img.pdfslide.us/doc/110x75/5cc7fa2788c993fb538ca3a1/2019-first-quarter-financial-results-4-ford-motor-company-1q-april-25-2019.jpg)