Embed Size (px)
Citation preview

Gravitational LensingYannick Mellier
IAP and Obs. de Paris / LERMA
SLAC Aug. 7-9 2007

V. Gravitational Lensing:
Cosmological weak lensing(cosmic shear)
SLAC Aug. 7-9 2007
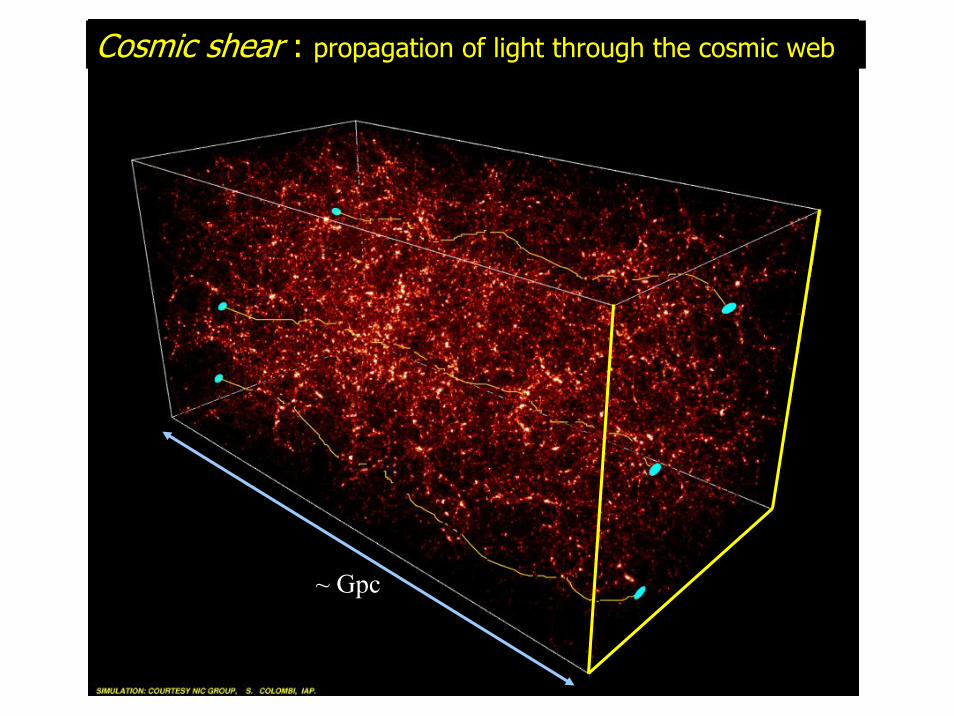
~ Gpc
Cosmic shear : propagation of light through the cosmic web

Cosmological distortion field projected on the sky

~ Gpc
Cosmic shear : propagation of light through the cosmic web
• How can we measure the signal?• Is the signal-to-noise high enough? • What can we derive on cosmology from it?

Cosmological Weak Lensing:
Theoretical expectations
SLAC Aug. 7-9 2007

Weak gravitational lensing and cosmology:Light propagation in inhomogeneous universes
ds2=c2dt2 - a2(t) [dw2 + fK2(w) dω2]
Deflection angle:
SLAC Aug. 7-9 2007
Blandford et al 1991, Miralda-Escudé 1990, Kaiser 1992, Bernardeau, van Waerbeke & Mellier, 1997, Jain & Seljak 1997

Weak gravitational lensing and cosmology:Light propagation in inhomogeneous universes

SLAC Aug. 7-9 2007
Weak gravitational lensing and cosmology:Light propagation in inhomogeneous universes
Total deflection angle:
Total convergence:

Weak gravitational lensing and cosmology:
Bartelmann & Schneider 2001; Erben 2002
ds2=c2dt2 - a2(t) [dw2 + fK2(w) dω2]
Deflection angle:
DistancesPower spectrum, growth rate of structure
Both depend on the dark matter and dark energy content in the Universe

The convergence power spectrum
Power of the convergence at scale (1/l) :Given by the 3-D power spectrum of the mass densityfluctuation at scale fK (w)(1/l) integrated over w .

SLAC Aug. 7-9 2007
Relations between the convergence powerspectrum and the shear power spectrum

SLAC Aug. 7-9 2007
Relations between the convergence powerspectrum and the shear power spectrum

SLAC Aug. 7-9 2007
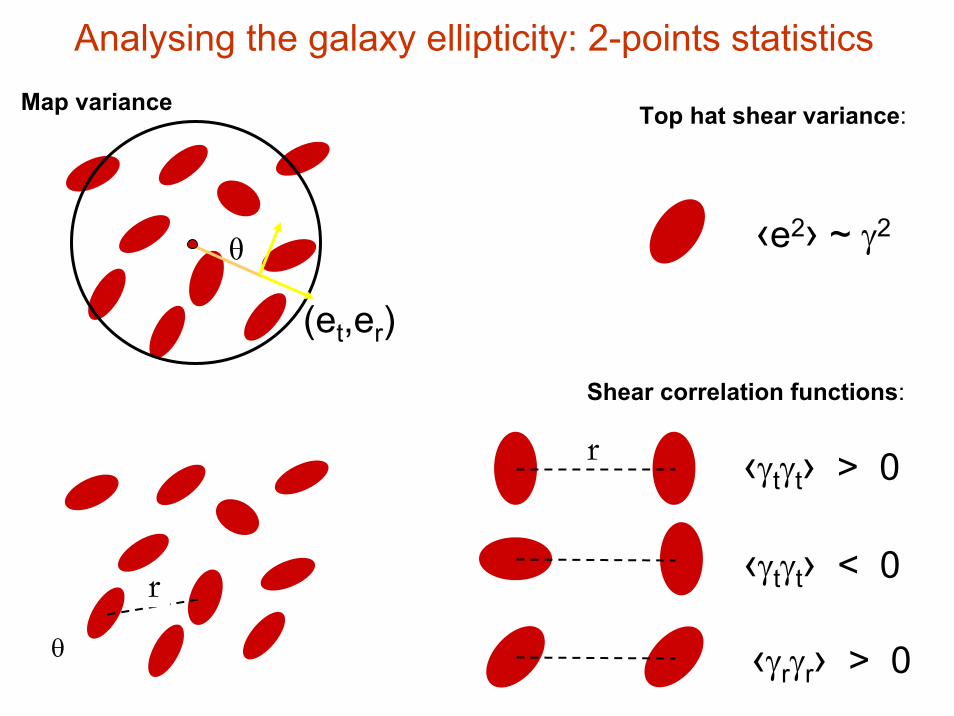
Example of simple two-pointstatistics: the top-hat shear variance
θ
r
r
Analysing the galaxy ellipticity: 2-points statisticsMap variance
Shear correlation functions:
θ
(et,er)
‹e2› ~ γ2
‹γtγt› > 0
‹γtγt› < 0
‹γrγr› > 0
Top hat shear variance:

2c40
κ34
c
2 )]θ(J[ )( dπθ288 kkPk
kMap ∫∞
=⟩⟨
2c10 κ2
c
2 )]θ(J[ )( dπθ
2γ kkPkk
∫∞
=⟩⟨
[ ]2source0 3D
20κ F . );
)((P . z d
49)( z,zz
zDkkP
L∫
∞Ω=
)θ(J )( d2π1θ)γ(r)γ(r 0
0κr kkPkk∫
∞=⟩+⟨
• Convergence (projected mass) power spectrum:
• Aperture mass (Map) variance at scale θc :
• Top-hat shear variance at scale θc:
• Shear correlation function at separation θ:
Cosmic Shear Statistics and Power Spectrum(Blandford el al 1991, Miralda-Escudé 1991, Kaiser 1992, 1998, Bernardeau et al 1997,
Jain & Seljak 1997, Schneider et al 1998)
SLAC Aug. 7-9 2007

Bartelmann & Schneider 2001 : theoretical predictions from the gravitational instability scenario
Shear Statistics : Theoretical Predictions(Blandford el al 1991, Miralda-Escudé 1991, Kaiser 1992, 1998, Bernardeau et al 1997, Jain & Seljak 1997, Schneider et al 1998)
Map variance Top-Hat Shear variance)
Linear
Non-Linear
Non_linear
Linear

Amplitude of the cosmicshear signal
SLAC Aug. 7-9 2007

Properties of cosmic shear signal
Simple case, assuming a single lens plane and P(k) ~ σ8 k n
mC
? …Amplitude of the lensing signal ?

~ Gpc
= Dos
Mean number of structures crossed by light beams?
Cluster
Super cluster
R

Amplitude of cosmic shear signal
• Amplitude for a single perturbation of size R………….………………..
• Net magnification= random cumulative in all directions, • After crossing N perturbations with typical size R …………………………
~ 0.1 x ~ 0.1 for supercluster x ~ 1 : 1 %

Properties of cosmic shear signal
Simple case, assuming a single lens plane and P(k) ~ σ8 k n
m
Amplitude of the lensing signal
If shear = ellipticity, then the S/N is basically a comparison with theintrinsic ellpiticity distribution of galaxies (projected on the sky)

Beating intrinsic ellipticitydistribution
σε =0.35
Assume a shear amplitude of 1%
- Minimum number ofgalaxies
ng= (0.35/0.01)2
- About 10000 galaxies just for 3-sigma detection
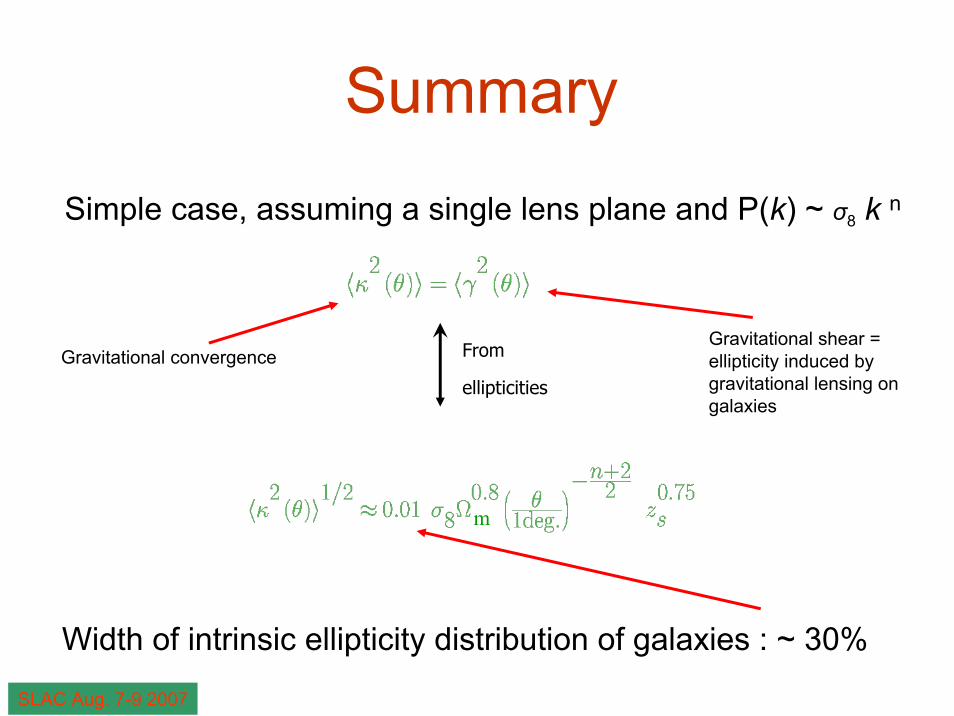
Summary
Width of intrinsic ellipticity distribution of galaxies : ~ 30%
Gravitational shear = ellipticity induced by gravitational lensing on galaxies
Simple case, assuming a single lens plane and P(k) ~ σ8 k n
Gravitational convergence
m
From
ellipticities
SLAC Aug. 7-9 2007

Contamination
SLAC AUg. 7-9 2007

Unfortunately…
Gravitational ellipticity signal iscontaminated by non-gravitational distortion
SLAC Aug. 7-9 2007
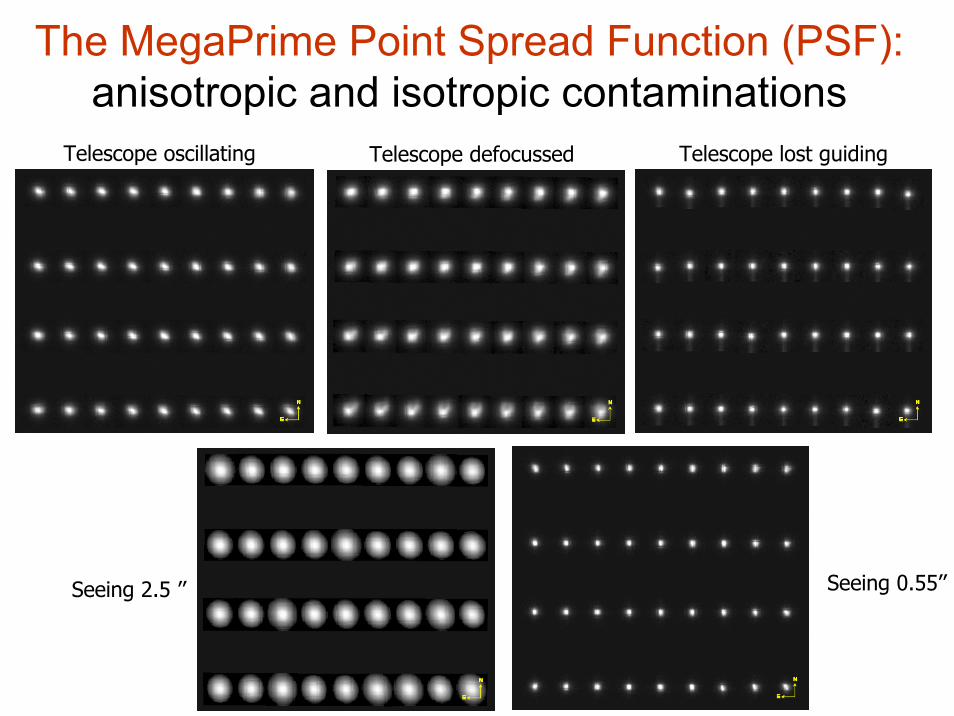
The MegaPrime Point Spread Function (PSF): anisotropic and isotropic contaminations
Telescope oscillating Telescope defocussed Telescope lost guiding
Seeing 0.55’’Seeing 2.5 ’’
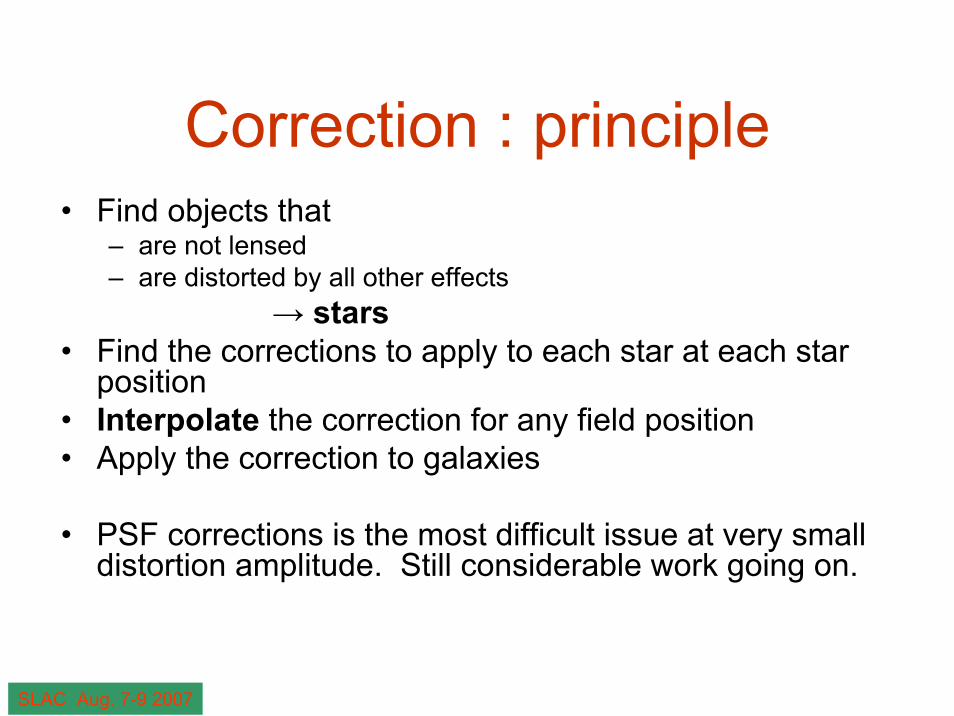
Correction : principle• Find objects that
– are not lensed– are distorted by all other effects
→ stars• Find the corrections to apply to each star at each star
position• Interpolate the correction for any field position • Apply the correction to galaxies
• PSF corrections is the most difficult issue at very smalldistortion amplitude. Still considerable work going on.
SLAC Aug. 7-9 2007

Using stars for the PSF correctionFahlman et al 1994, Bonnet & Mellier 1994, Mould et al 1994, KSB 1995, Kuijken 1999, 2006, Hoekstra et al 2000, Erben et al 2001, Bacon et al 2001, Refregier et al 2001, Bernstein et al 2001, etc…
Need careful check of systematic residual after corrections

E projectionPure gravity signal
45 degrees rotatedgalaxies, E -> B
Testing systematics and reliability of cosmic shear signal:Gravitational lensing does not produce B-modes (Curl=0)

Cosmic shear : results
SLAC Aug. 7-9 2007

Measuring cosmic shear andfirst proof of detection
Detection level: 5.5-σ
Van Waerbeke et al 2000
Measuring shear signal in practice
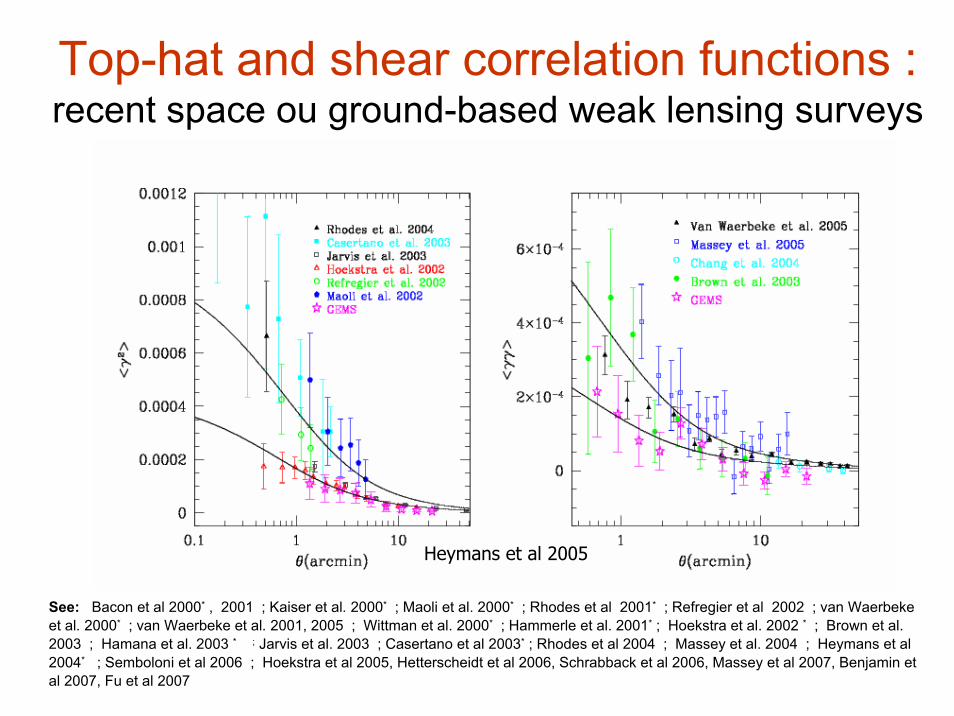
Top-hat and shear correlation functions :recent space ou ground-based weak lensing surveys
Heymans et al 2005
See: Bacon et al 2000* , 2001 ; Kaiser et al. 2000* ; Maoli et al. 2000* ; Rhodes et al 2001* ; Refregier et al 2002 ; van Waerbekeet al. 2000* ; van Waerbeke et al. 2001, 2005 ; Wittman et al. 2000* ; Hammerle et al. 2001* ; Hoekstra et al. 2002 * ; Brown et al. 2003 ; Hamana et al. 2003 * ; Jarvis et al. 2003 ; Casertano et al 2003* ; Rhodes et al 2004 ; Massey et al. 2004 ; Heymans et al 2004* ; Semboloni et al 2006 ; Hoekstra et al 2005, Hetterscheidt et al 2006, Schrabback et al 2006, Massey et al 2007, Benjamin et al 2007, Fu et al 2007

An example:
The Canada France Hawaii Telescope CosmicShear Legacy Survey (CSLS)
K. Benabed (IAP), F. Bernardeau (CEA/SPhT), A. Benjamin (UBC, Vancouver), J. Coupon (IAP), L. Fu (IAP), S. Gwyn (U. Victoria), C. Heymans (UBC Vancouver), H. Hoekstra (U. Victoria), M. Hudson (U. Waterloo), M. Kilbinger, R. Maoli (IAP), Y. Mellier (IAP), L. Parker (U. Waterloo), U.L. Pen (CITA), C. Schimd (CEA/SPP+IAP), E. Semboloni (IAP/Bonn), I. Tereno (IAP/Bonn), L. van Waerbeke (UBC, Vancouver), J.-P. Uzan (IAP)
SLAC Aug. 7-9 2007

CFHT telescope: built and operated by CNRS/INSU, CNRC et UH
Megacam: built by CEA
MegaPrime: CNRS/INSU, CNRC, UH
Data processed and released by Terapix.
Archived at CADC

Terapix/Skywatcher : all data 03A-05A : 20000 Megacam images
W2
VW
VW
D4
W3 & D3
VW
VW
VW
D2
VW
Canada-France-Hawaii Telescope Legacy Survey: Canada-France collaboration- 4 Wide fields 20-80 deg2 (CFHTLS-Wide), 4 Deep of 1 deg2 (CFHTLS-Deep)
- 500 nights between June 2003 and June 2008 ( CNRS/INSU+CNRC)
W1 & D1

Weak lensing needs good image quality instrument
MegaPrime among the bestwide field instrument, but still…
MegaPrime image qualitystrong optical distortion : concerns about residualsafter corrections

Reliability of Cosmic shear withCFHTLS data
• 2 independent pipelines: – One in Canada (UVic+UBC+Waterloo), one in France (IAP)– Each pipeline does astrometric calibration and image stacking
differently– Two different IMCAT version used
• Both pipelines check B-modes .
• Both used 3 different cosmic shear statistics
• Cross-check: shapes and amplitudes are similar for the 2 pipelines.
• Deep: check achromaticity using i and r data independently
• Check with past results (VIRMOS-Descart)

CFHTLS Wide+Deep 1.5 yeardata:
early results

Cosmic shear in CFHTLS Deep fieldsTerapix release T0001: E and B modes analysis
Semboloni et al 2006
E mode
E mode
B mode
B mode

Comparing signal in r and i bands:achromatic effect confirmed
σ
Semboloni et al. 2006
• i and r band processed independently• Comparison catalogues contain the same galaxies
i-band (820nm)
Δ r-band (650nm)
E mode
B mode
SLAC Aug. 7-9 2007
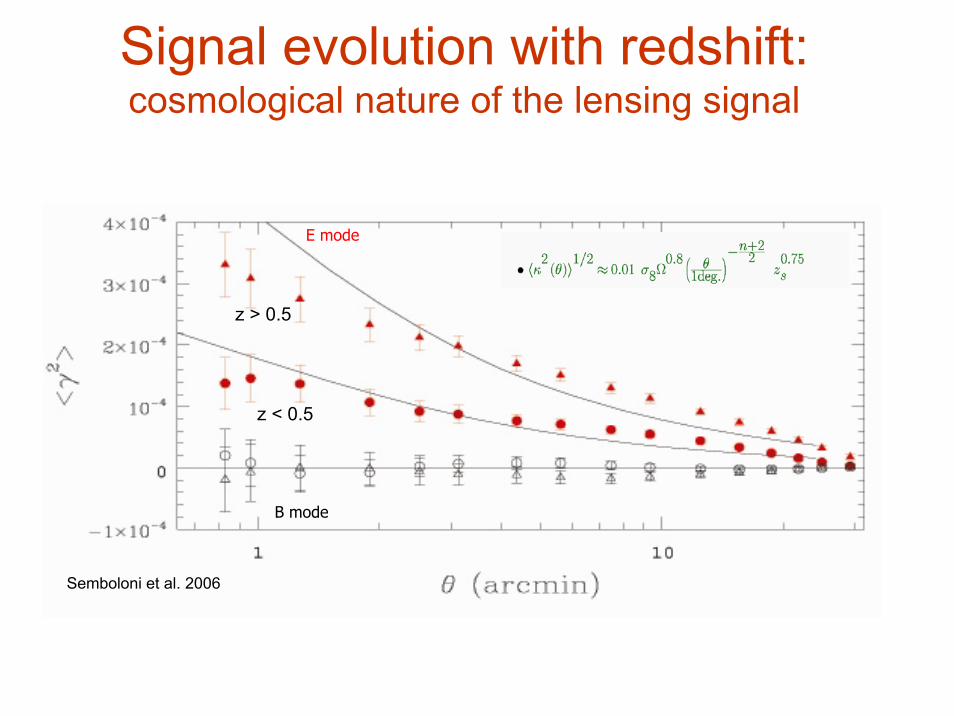
Signal evolution with redshift: cosmological nature of the lensing signal
Semboloni et al. 2006
z < 0.5
z > 0.5
E mode
B mode

Cosmic shear in CFHTLS wide:
2 independent pipelinessame results
« Canadian » pipeline
« French » pipeline
Data processed and stacked in 3 different ways, cosmic shear analysed by 2 different pipelines
Difference vs 1-σ error
Hoekstra et al 2006
E mode B mode
B modeE mode

Summary• 2 independent pipelines provide the same results ; same results as the
previous survey Virmos-Descart: robust and reliable measurements
• No B-modes, no <e* γg> cross-correlation: no critical systematics residuals after PSF correction
• No B-mode at all scales (30’’ ; 50’): likely signal from gravity (Curl-free)
• Achromatic: gravitational lensing
• Signal – has the amplitude and the shape predicted from theory of structure formation in a
CDM-dominated scenario – increases with redshift as expected from cosmological structure formation and
weak lensing theory
Cosmological weak lensing

Weak lensing :
cosmological intepretation
SLAC Aug. 7-9 2007

Scaling the shear amplitude : Redshift distribution
Photo-z from Hubble Deep Field optical+NIR data
Wide: Hoesktra et al 2005
<z>=0.81
Deep: Semboloni et al 2005
<z>=1.01

CFHTLS 1.5 yr in good agreement withthe « concordance model »
• Line: σ8=0.85 ; Ωm=0.27 ; Λ=0.73 ; h=0.71 ; <zs>=0.85 ; σε =0.36 ; ngal=15 gal/arcmin2
• Errors: Poisson+cosmic variance includedConcordance model overplot: no fit

Dark Matter:
constraints on Ωm - σ8
SLAC Aug. 7-9 2007

CFHTLS T0001:constraints on Ωm-σ8
Deep + Wide
Deep+Wide assuming Ωm=0.3 :
σ8= 0.89 +/-0.06 (P&D)σ8= 0.86 +/-0.05 (Halo fit)
Semboloni et al 2006 & Hoekstra et al 2006
Deep effective area: 2.1 deg2
Wide effective area : 22 deg2

All WL surveys:<σ8>~ 0.90 +/- 0.15

σ8 derived fromWL (blue) or clusters of galaxies (red)
Hetterscheidt et al 2006

WMAP3 andCFHTLS-T0001 :
1.5-σ tension
CFHTLS
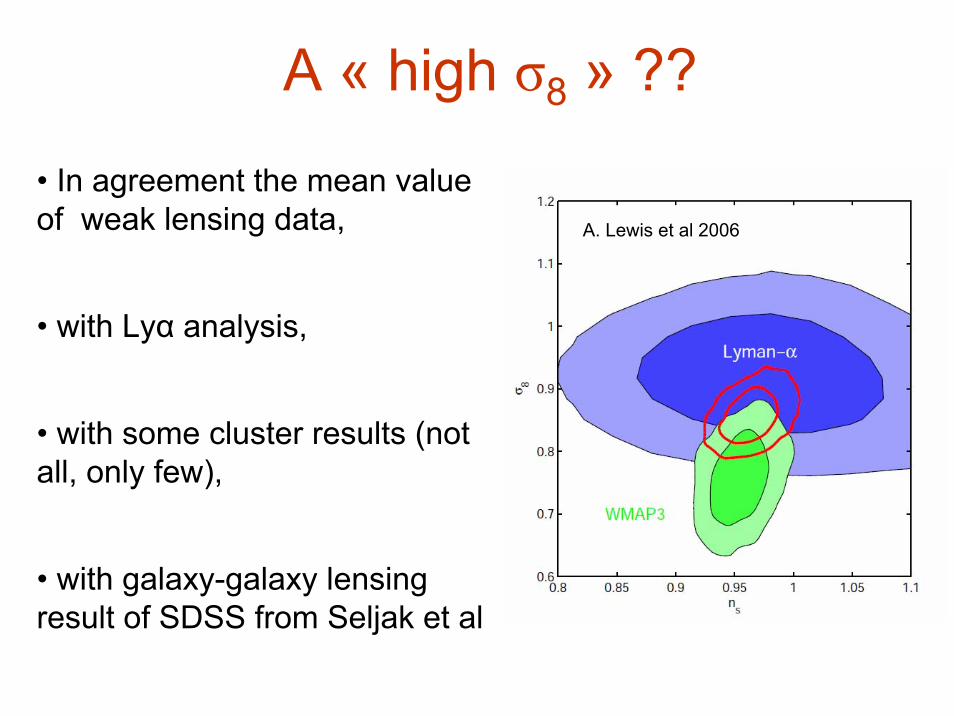
A « high σ8 » ??
A. Lewis et al 2006
• In agreement the mean value of weak lensing data,
• with Lyα analysis,
• with some cluster results (notall, only few),
• with galaxy-galaxy lensingresult of SDSS from Seljak et al2006
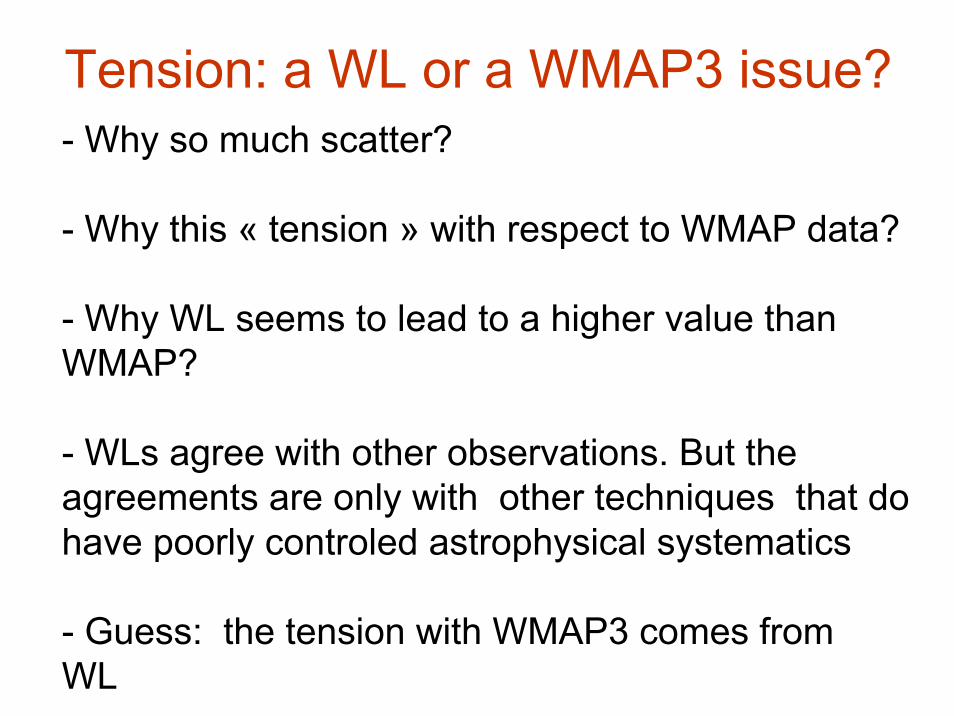
- Why so much scatter?
- Why this « tension » with respect to WMAP data?
- Why WL seems to lead to a higher value thanWMAP?
- WLs agree with other observations. But theagreements are only with other techniques that do have poorly controled astrophysical systematics
- Guess: the tension with WMAP3 comes fromWL?
Tension: a WL or a WMAP3 issue?
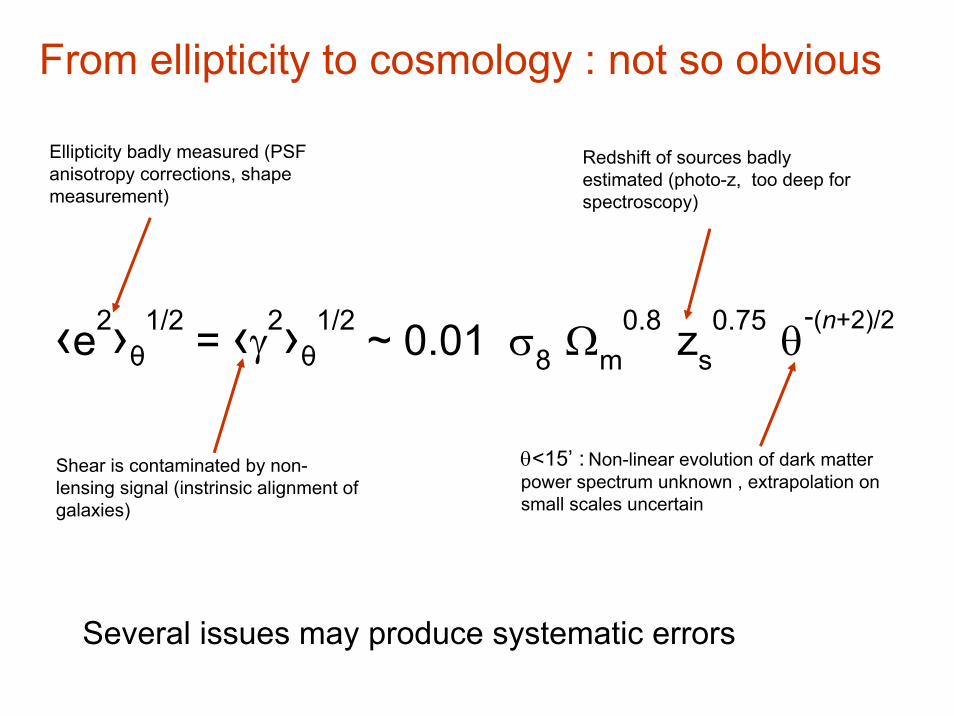
From ellipticity to cosmology : not so obvious
Ellipticity badly measured (PSF anisotropy corrections, shapemeasurement)
Shear is contaminated by non-lensing signal (instrinsic alignment ofgalaxies)
θ<15’ : Non-linear evolution of dark matterpower spectrum unknown , extrapolation on small scales uncertain
Redshift of sources badlyestimated (photo-z, too deep for spectroscopy)
‹e2›θ1/2 = ‹γ2›θ
1/2 ~ 0.01 σ8 Ωm0.8 zs
0.75 θ-(n+2)/2
Several issues may produce systematic errors

Errors and systematics uncertainties• PSF corrections• Redshift distribution• Galaxy source/lens clustering• Contamination by overlapping galaxies• Intrinsic alignement• Intrinsic foreground/backgound correlations• Sampling variance• Non-linear variance• Non-linear dark matter power spectrum• + cosmic variance (survey size, survey
topology, depth)

CFHTLS 1.5 yr weak lensing data :redshift calibrated with one HDF field
• Only one field
• HDF field size: 150000 smaller than total wide
HDF

PSF : correction techniques tested
with STEP1
Heymans et al 2006
The Shear TEsting Program (STEP)
γ - γtrue = q(true)2 + m(true) + c• q = linearity of the correction
• m = calibration bias
• c = PSF systematics and shot noise
• Best method reach 1% accuracy
• Largest error: calibration bias m

Second generation results
• PSF corrections improved: PSF + HST data (COSMOS)
• Astrophysical/instrument systematics: bettercontroled and better taken into account in theerror budget
• Better n(z)• Sky coverage and number of uncorrelated fields
continuously increasing

3 examples of new results
1. COSMOS + n(z): space ACS, 2 deg2
2. Merging of 4 heterogenous surveys + n(z): 100 deg2
3. A homogeneous large survey + n(z), 37deg2 and VERY large angular scale: CFHTLS T0003, 1’, 4deg (85 Mpc!)

Cosmic Shear Tomography with COSMOSRhodes et al 2007, Leauthaud et al 2007, Massey et al 2007
Ωm
σ 8
Lensing tomography with
COSMOS+photo-z
σ8.(Ωm/0.30)0.44=0.866+0.085 -0.068
See R. Massey’s talk
Only 1 field 2deg2
Cosmic variance important issue
0.25
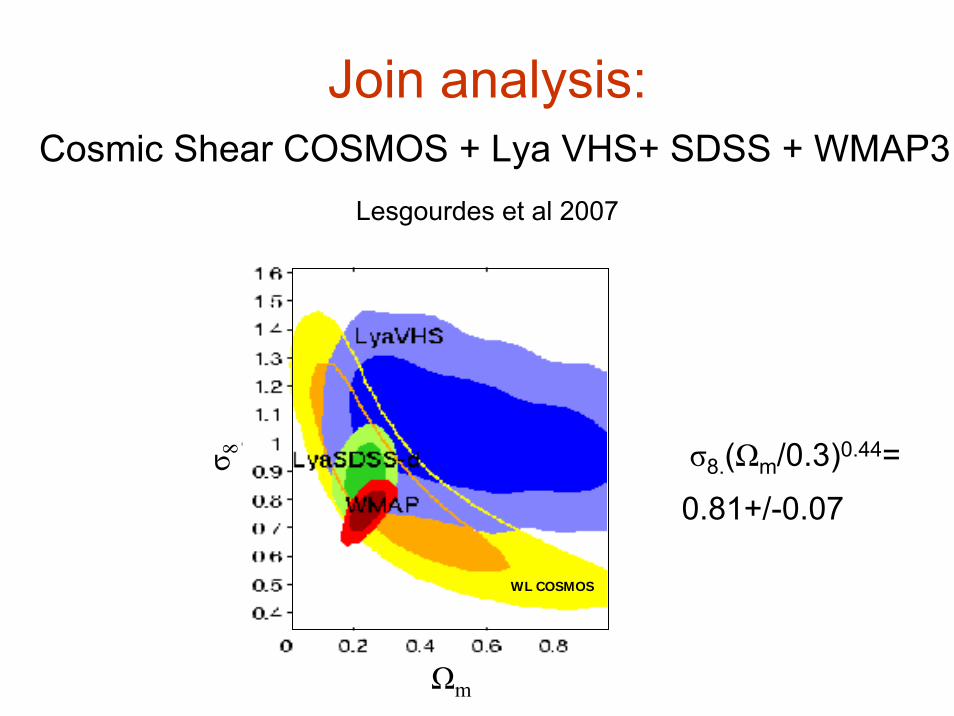
Join analysis:Cosmic Shear COSMOS + Lya VHS+ SDSS + WMAP3
Lesgourdes et al 2007
Ωm
σ 8 σ8.(Ωm/0.3)0.44=
0.81+/-0.07
WL COSMOS

Improving the statistics and consistency between surveys:
a join weak lensing survey analysis+ better n(z)1. CFHTLS-Wide (1.5 yr):MEGACAM Hoekstra et al 2006
2. CFHT-VIRMOS-Descart:CFHT12K, van Waerbeke, Mellier, Hoekstra 2005
3. CFHT-RCS:CFH12K, Hoekstra et al 2002
4. ESO-GaBoDS:WFI Hetterscheidt et al 2006
Merging the 4 surveys:Benjamin et al 2007: 100 deg2

Photometricredshift
Bernardeau & Mellier 2003
SLAC Aug. 7-9 2007

Theuncertain
n(z)
Ilbert et al 2006
HDF size too small as compared to CFHTLS: sampling variance increases error by 10% (van Waerbeke et al 2006)
CFHLTS Deep photometry + ESO / VLT / VVDS spectroscopic surveyof CFHTLS D1 field
Photo-z from CFHTLS-Deep + VVDS: Seem to peak at higher z thanour HDF z-calibration.
Photo-z in CFHTLS deep
550000 galaxies with photo-z

Theuncertain
n(z)
• HDF size too small as compared to CFHTLS: sampling variance increases error by 10% (van Waerbeke et al2006)
• Photo-z from CFHTLS-Deep + VVDS: Seem to peak at higher z than ourHDF z-calibration? Would decrease σ8
CFHLS Deep T0003+ VVDS specto calib.

Cosmic Shear
- Virmos-Descart +
CFHTLS Deep+Wide
- Much better n(z)
WMAP3
VIRMOS-Descart + CFHTLS-T0001 WIDE+Deep
Benjamin et al 2006 In press

CFHTLS T0003
-More sky coverage
-One more field
-Much more angular scale
(1’ – 4 degrees: 85 Mpc@z=0.5)
•- Homogenous data withphoto-z from CFHTLS T0003 deep
Fu et al 2007

CFHTLS T0003: comparing signal of each Wide
Fu et al 2007
W1+W2+W3
1’400kpc
4o
85 Mpc

CFHTLS T0003:comparing cosmological contrains between
Benjamin et al and Fu et al
Benjamin et al 100deg2 heterogenous
(scale 1’ – 40’)
Fu et al 2007: CFHTLS T0003 homogeneous
(scale 2’- 230’)
Fu et al 2007

CFHTLS T0003 and WMAP3
WMAP3
CFHTLS T0003Fu et al 2007

CFHTLS T0003: toward a linear analysis of weak lensing and CMB
Fu et al 2007
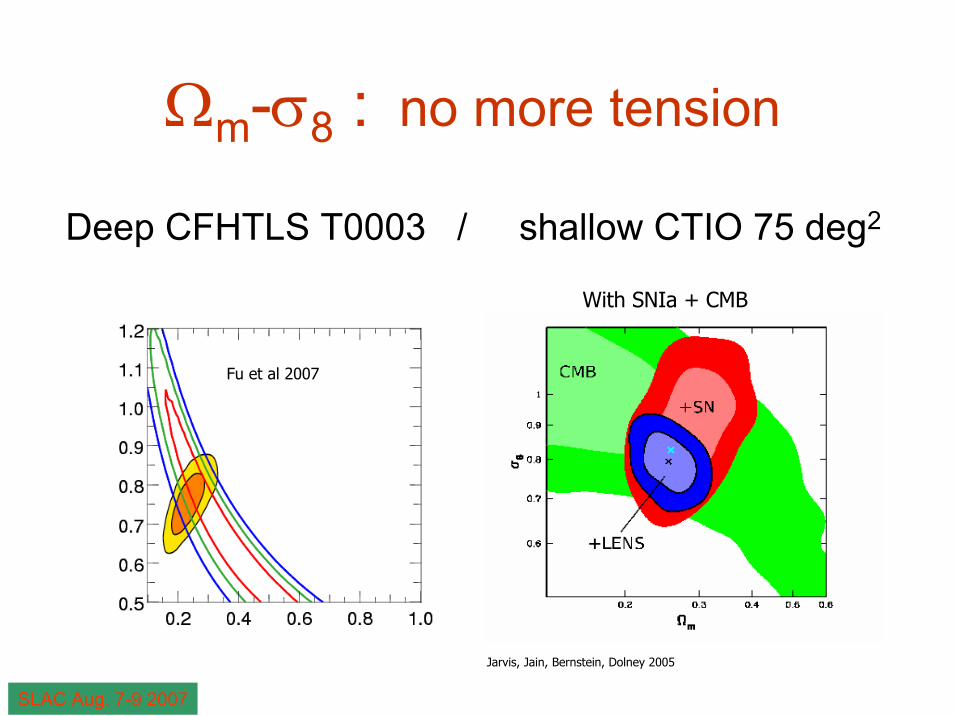
Ωm-σ8 : no more tension
Deep CFHTLS T0003 / shallow CTIO 75 deg2
Jarvis, Jain, Bernstein, Dolney 2005
With SNIa + CMB
SLAC Aug. 7-9 2007
Fu et al 2007

CFHTLS cosmic shear summary
The main issues were n(z):
• faint high-redshift tail,
• sampling variance,
• non Gaussian corrections to cosmic variance
Non linear evolution of P(k) still produce a 2.5% systematics : need betternumerical simulations
Convergence σ8 = 0.80 ? : Ωm - σ8 to better than 5%
CFHTLS T0003 : scales up to 85 Mpc at z=0.3 with
57 deg2 + Deep photo-z in the same fields.

Dark Energy
exploring the role of dark energyon the growth rate of structures
SLAC Aug. 7-9 2007

Projected matter distribution anddark energy
GeometryryPower spectrum, growth rate of structure D+

The Universe with Dark Energy
w = -1.0w = -0.8
w = -0.6
w0 = -0.8 ;w1 = 0.2
w0 = -0.8 ; w1 = 0.3
Growth rate sensitivitymostly at low redshift
Benabed, Bernardeau 2001
Ωm=0.35 , w = -0.8
Ωm=0.35 , w = -0.8
Ωm=0.30 ,w = -1.0
Ωm=0.25 , w = -1.2
Ωm=0.25 , w = -1.2
Linder 2003
P = w ρ

Cosmic shear surveys and dark cosmological models : exploring the power spectrum
z=1
z=2
SLAC Aug. 7-9 2007

CSLS: constraints on Dark Energy P = w0 ρDeep + Wide : w0 < -0.8 (68%) ; w0 < -0.4 (99%)
Deep + Wide
Hoekstra et al 2006 , Semboloni et al 2006
σ8 : [0.7; 0.8]
h : [0.6 ; 0.8]
z : +/- 1σz
P&D Non-linear evol.
Flat universe
n =1

w = -1 ?
CSLS 1yrDeep+Wide22/170 deg2
SNSL 1yr
SNLS 5yrs
CFHTLS T0001+SNLS +COMBO-17
Astier et al 2005+ Semboloni et al 2006+Hoesktra et al 2006

Exploring physical models of dark energywith CFHTLS cosmic shear data:
quintessence models
• Physical models:
– Less general than the « empirical » and more conservative P=wρ, but can challenge physical models to data
– Can explore eolution with redshift. Avoid pivot redshift problems on joint data or in case w(z) evolved at high z
– Can be used in a coherent model with description of the evolutionof perturbations and CMB data (normalisation , no use of σ8 )
w(a) = wpivot + wa(apivot - a) (simple Taylor expansion)
• PB: non linear evolution unknown for these models:
Peacock & Dodds and Halo models used
SLAC Aug. 7-9 2007

Cosmology with physical DarkEnergy models
Schimd et al 2006
Theoretical models

Exploring quintessence models
Ratra-Peebles SUGRA
wpivot wa
Cosmic shear Deep+Wide + SNIa gold set + WMAP-1
RP: V(Q)=M4(Q/Mp-α SUGRA: V(Q)=M4(Q/Mp)-α exp(Q2/2Mp
2)
Schimd et al 2006
(amount of dark energy)

Next: explore w(z)
• Previous plots: assume w is constant
• Still missing precision to get a detailleddescription of dark energy properties
• Still concerns with systematics

Synergy CFHTLS: SNLS+CSLS5 years (expectations): still far from getting wa
CSLS 5yrDeep+Wide170/170 deg2
SNSL 5yr
SNLS 5yrs
CSLS+SNLS
Jarvis, Jain, Bernstein, Dolney 2005

What next ?
SLAC Aug. 7-9 2009

Not fully explored yet• Photo-z for the full Wide survey
• 2-D/3-D power spectrum reconstruction
• Mass reconstruction and projected dark matter maps
• Real 3-D tomography
• Decoupling geometry and power spectrum
• Galaxy (light)-Mass-Map cross correlation: biasing
• Galaxy-galaxy lensing
• Exploring w(z)

3D dark matter reconstruction3D inversion from 2D spectra (galaxies & DM), using broad bands estimates (Map)
Tegmark & Zaldarriaga (2002)Pen, Lu, van Waerbeke, Mellier 2003
Λ=0.73Ω=0.27σ8=0.9Γ=0.19h=0.71
Still in a early phase, but• Very promising for next generation surveys• Evolution with photo-z +spectro-z likely feasible
(see also, Heavens 2003, Taylor et al 2003)

Breaking degeneracies with tomography
SLAC Aug. 7-9 2007

Ωm-σ8 degeneracy with higher order statistics:Skewness of the convergence
Bernardeau, van Waerbeke, Mellier 1997,Jain & Seljak 1997Need mass maps for skewness
• Distribution increasingly skewed by gravity that will produce non-linearstructures (clusters, groups, galaxies):
• S3(κ) will provide a statistical description of these non-linear systems

MASS MAP Skewness of the convergence measured in VIRMOS-Descart data
• S 3=375+342-123
• Ω0 < 0.5 (90% C.L.)
Pen et al 2003

Next Generation Cosmic ShearSurveys
• Goal: dark energy properties know to 5%-1% (50%-20% today)
• Larger field of view
• Multiple lens planes (tomography)
• Accurate 3D positions of lensed galaxies and lenses
• Better accuracy on galaxy shape measurements

Future ProgressSurvey Sq. Degrees Filters Depth Dates Status
CTIO 75 1 shallow published
VIRMOS 9 1 moderate published
COSMOS 2 (space) 1 moderate complete
DLS (NOAO) 36 4 deep complete
Subaru 30? 1? deep 2005? observing
CFH Legacy 170 5 moderate 2004-2008 observing
RCS2 (CFH) 830 3 shallow 2005-2007 approvedVST/KIDS/
VISTA/VIKING 1700 4+5 moderate 2007-2010? 50%approved
DES (NOAO) 5000 4 moderate 2008-2012? proposedPan-
STARRS ~10,000? 5? moderate 2006-2012? ~funded
LSST 15,000? 5? deep 2010-2020? proposed
JDEM/SNAP 1000+ (space) 9 deep 2013-2018? proposed
VST/VISTA
DUNE
5000? 2010-2015?moderate4+5 proposed
20000? (space) 2+1? moderate 2012-2015? proposed
KID
S +
CFH
TLS
Wid
e+
CFH
TLS
Dee
p: 3
lens
plan
es

The ultimate step ?
Hu et al 2000, Huterer 2001,Deusta et al 2002Réfrégier et al 2003, Benabed & van Waerbeke 2003
JDEM/DUNE/LSST
SLAC Aug. 7-9 2007