Embed Size (px)
Citation preview

Coupon Trends and Takeaways for 2013
Devora RogersSenior Director, Retail Marketing Insights

Devora Rogers
• Senior Director, Retail Marketing Insights
• New to Inmar (and North Carolina)
• Previously with IPG Media Lab and Shopper Sciences
• [email protected]• 336.770.3495• Twitter: @devoraerogers

Inmar’s Portfolio of Services

2012 COUPON TRENDSKey Findings

Distribution & Redemption (in billions)
DOWN 1.2%2011-2012
DOWN 1.2%2011-2012
DOWN 14.3%2011-2012
DOWN 14.3%2011-2012
Sources: 2012 Inmar Coupon Trends Report
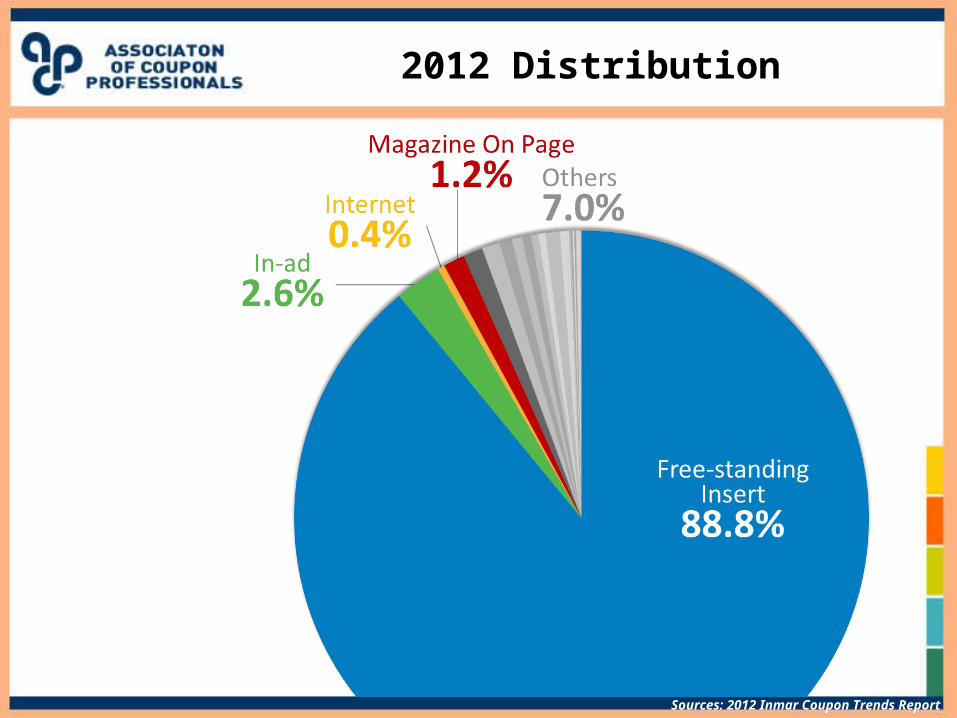
2012 Distribution
Sources: 2012 Inmar Coupon Trends Report

2012 Redemption
Sources: 2012 Inmar Coupon Trends Report
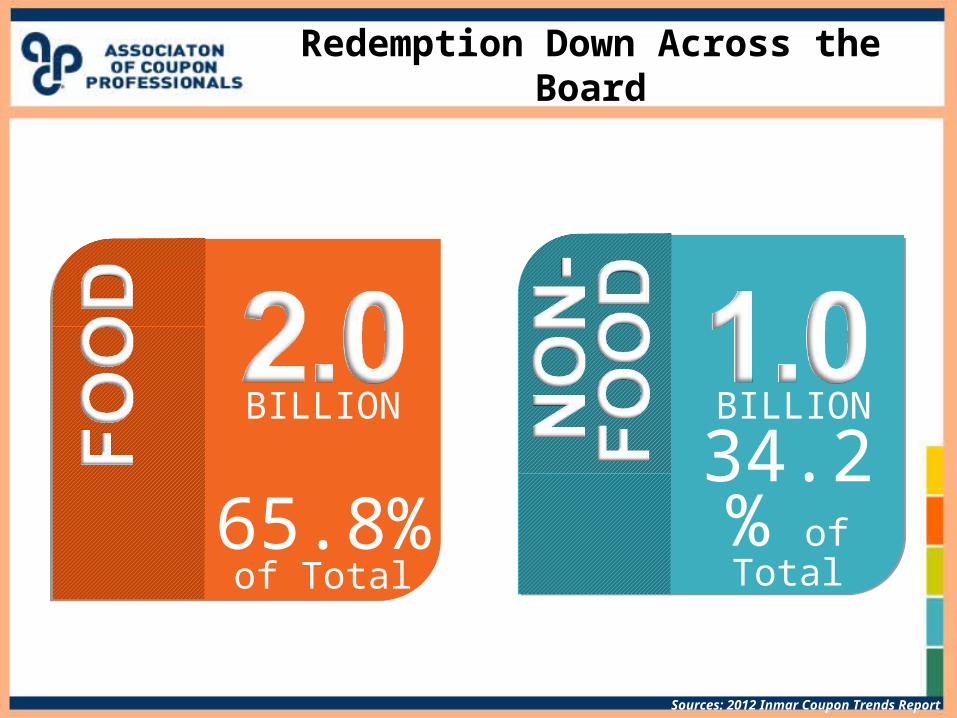
Redemption Down Across the Board
65.8% of Total
BILLION BILLION
34.2% of Total
Sources: 2012 Inmar Coupon Trends Report
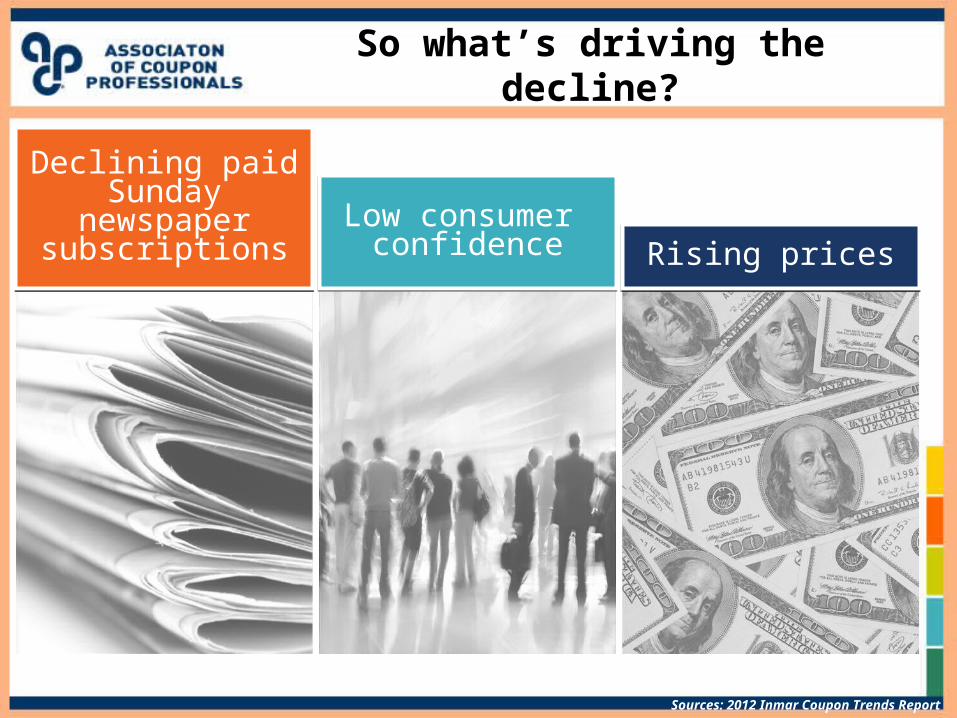
So what’s driving the decline?
Rising pricesRising pricesLow consumer
confidenceLow consumer
confidence
Declining paid Sunday newspaper
subscriptions
Declining paid Sunday newspaper
subscriptions
Sources: 2012 Inmar Coupon Trends Report

Tactics having limited impact on redemption
Distributed:
$1.57 /coupon (-1.3%)
Redeemed:
$1.14 /coupon (+1.8%)
Distributed:
1.49 units/coupon
Redeemed:
1.61 units
Distributed:
2.4 months (-4.0%)
Redeemed:
5.4 months (-7.0%)
Average Face Value
Distributed
Average Face Value
Distributed
Average Purchase Requirement
Distributed
Average Purchase Requirement
Distributed
Average Redemption
Period Distributed
Average Redemption
Period Distributed
Sources: 2012 Inmar Coupon Trends Report

Tactics having limited impact on redemption
34.36%34.36%“I usually won’t use a coupon if I have to purchase multiple items”
37.64%37.64%“There are too
many rules/exclusions
for using coupons”
Sources: 2012 Inmar Coupon Trends Report

New Product Trial Dampening Redemption
Manufacturers Promoting New
Products via FSI in 2012
190190
+9.9% +9.9% over 2011
727727New Product
Event Dates in 2012
+23.2% +23.2% over 2011
9393Categories
Featuring New Product Events
in 2012
+13.4% +13.4% over 2011
“I can’t find coupons for the products I want to buy”52.83%52.83%
Sources:, Marx and 2012 Inmar Shopper Survey

Redemption Period by Method Type
My coupons often expire before I have
the chance to use them.
Sources: 2012 Inmar Coupon Trends Report

SHOPPER BEHAVIOR

15
ENTITLEDENABLEDENGAGED

Changing Shopper Sentiment
“If I put in the effort, I can get deals on the brands I buy.”
“If I shop a store a lot, I shouldn’t have to
work for deals I deserve.”
From effort to entitlement

Are shoppers still using coupons?
Compared to 2011, shoppers reported coupon usage in 2012:
In their own words:
YESSources: 2012 Inmar Coupon Trends Report

Shopper Attitudes to Coupons
36%36%I am not sure where to get coupons for the products that I want to buy.
37%37% I wish all coupons were digital.
65%65%Don’t think they should have to work for deals.
66%66%I would use coupons more if they were more available online.
80%80%Using coupons makes me feel smarter.
Sources: 2012 Inmar Coupon Trends Report

“I wish all coupons were digital”“I wish all coupons were digital”19
44%44%HispanicHispanic
35%Non-
Hispanic
Hispanic Shopper Attitudes

The “New Couponer” is Tech Savvy
Goldman Sachs, 2011
of U.S. cell users will have smartphones
By 2015 Coupon methods used (on average)
Smartphone User = 7.12
Non-smartphone User = 5.19
Sources: 2013 Inmar Shopper Behavior Survey

Rise of the Mansumer
86%
44%
40%
Sources: 2012 Inmar Holiday Study, KSDK, Men’s Health, Spike Network’s ‘State of Men’ study
Participation in holiday meal planning

Average Number of Coupon Methods Used
22
6.43Overall
7.1135+
6.00Under 35
6.76Female
5.68Male
7.32Hispanic
6.12Non-
Hispanic
7.49Kids
5.47No kids

THE DISH ON DIGITAL

How Digitally Discovered Coupons are Redeemed
Manifests as a paper coupon Redeems as a paper coupon
Settles as a paper coupon
Retailer Loyalty Program (i.e. eWallet/ Direct-to-Card / Save-to-Card)
Unique Identifier (10-digit mobile)
Loyalty Aggregator (AOL shortcuts, SavingStar, etc.)
“Closed” Retailer Program (Target, Walgreens, Starbucks, etc.)
Never manifests as paperRedemption recorded separately
Text Email Website
Social QR (et al)
Apps
Redeemed like paper Paperlessly redeemed

Digital Stats for 2012
In 2013, the number of retailer storefronts In 2013, the number of retailer storefronts which accept paperless coupons is which accept paperless coupons is expected to grow 50% or more depending expected to grow 50% or more depending on channel. on channel.
250M250MCLIPPEDCLIPPED
27.5M27.5MREDEEMEDREDEEMED
$0.91$0.91AVERAGEAVERAGE
FACE VALUEFACE VALUE11%11%
AVERAGEAVERAGEREDEMPTIONREDEMPTION
RATERATE
Sources: 2012 Inmar Coupon Trends Report

2013: So far, so good?
Q1 2013 (vs. Q1 2012)
Distribution a little better than flat (up 2%)
Redemption continues to slide… (down 6.6%)
…as marketers continue to pull back (face values down, redemption period shortened)

2013: So far, so good?
Just the (Q1) facts:
Distribution 90.6 billion (up 2.0%)Redemption 717.4 million (down 6.6%)
Avg. Face Value (dist) $1.48 (down 9.8%)Avg. Face Value (red) $1.31 (down 2.2%)
Avg. Redemption Period (dist) 2.2 months (down 4.3%)Avg. Redemption Period (red) 4.9 months (down 2.0%)
Avg. Purchase Requirement (dist) 1.55 (down 0.6%)Avg. Purchase Requirement (red) 1.61 (up 1.9%)

Plus ca change…
Q1 2013 (vs. Q1 2012)
Distribution a little better than flat (up 2%)
Redemption continues to slide… (down 6.6%)
…as marketers continue to pull back (face values down, redemption period shortened)

…plus c’est la meme chose
Q1 2013 (vs. Q1 2012)
FSI remains dominant for distribution (91.2%)
“Big 3” redemption methods (FSI, Instant Redeemable, Electronic Checkout) account for 75% of all coupons redeemed
Print at Home / Internet Printable next with 5.8% share

QUESTIONS?Thank you.