Embed Size (px)
Citation preview
This article was downloaded by: [University of New Hampshire]On: 14 March 2013, At: 10:33Publisher: Taylor & FrancisInforma Ltd Registered in England and Wales Registered Number: 1072954 Registered office: Mortimer House,37-41 Mortimer Street, London W1T 3JH, UK
Transactions of the American Fisheries SocietyPublication details, including instructions for authors and subscription information:http://www.tandfonline.com/loi/utaf20
Coupling Fish Community Structure with Instream Flowand Habitat Connectivity between Two HydrologicallyExtreme YearsCharles E. Stanley a b , Jason M. Taylor a c & Ryan S. King aa Center for Reservoir and Aquatic Systems Research, Department of Biology, BaylorUniversity, One Bear Place, 97388, Waco, Texas, 76798-7388, USAb Lassen Volcanic National Park, Post Office Box 100, Mineral, California, 96063, USAc Department of Natural Resources, New York Cooperative Fish and Wildlife Research Unit,Cornell University, Ithaca, New York, 14853, USAVersion of record first published: 26 Jun 2012.
To cite this article: Charles E. Stanley , Jason M. Taylor & Ryan S. King (2012): Coupling Fish Community Structure withInstream Flow and Habitat Connectivity between Two Hydrologically Extreme Years, Transactions of the American FisheriesSociety, 141:4, 1000-1015
To link to this article: http://dx.doi.org/10.1080/00028487.2012.675893
PLEASE SCROLL DOWN FOR ARTICLE
Full terms and conditions of use: http://www.tandfonline.com/page/terms-and-conditions
This article may be used for research, teaching, and private study purposes. Any substantial or systematicreproduction, redistribution, reselling, loan, sub-licensing, systematic supply, or distribution in any form toanyone is expressly forbidden.
The publisher does not give any warranty express or implied or make any representation that the contentswill be complete or accurate or up to date. The accuracy of any instructions, formulae, and drug doses shouldbe independently verified with primary sources. The publisher shall not be liable for any loss, actions, claims,proceedings, demand, or costs or damages whatsoever or howsoever caused arising directly or indirectly inconnection with or arising out of the use of this material.
Transactions of the American Fisheries Society 141:1000–1015, 2012C© American Fisheries Society 2012ISSN: 0002-8487 print / 1548-8659 onlineDOI: 10.1080/00028487.2012.675893
ARTICLE
Coupling Fish Community Structure with Instream Flowand Habitat Connectivity between Two HydrologicallyExtreme Years
Charles E. Stanley,1 Jason M. Taylor,2 and Ryan S. King*Center for Reservoir and Aquatic Systems Research, Department of Biology, Baylor University,One Bear Place, 97388, Waco, Texas 76798-7388, USA
AbstractHydrologic variability and instream habitat connectivity play fundamental roles in structuring fish communities
in lotic ecosystems. We collected fish assemblage and physical habitat data from 28 central Texas streams duringthe summers of 2006 (a drought year with minimal summer precipitation and low stream flow) and 2007 (anexceptionally wet year with periodic flooding in spring and sustained high flows throughout summer). We evaluated thecorrespondence between the magnitude of physical habitat and fish community composition change in stream reachessampled in these two contrasting years using ordination, successional vector analysis, and indicator species analysis. In2006, streams characterized by disconnected pools had different fish community structure and habitat characteristicsthan streams that had habitats connected by flowing water. The amount of interannual change in both fish communitystructure and habitat characteristics was greatest between streams that had disconnected pools in 2006 and theirpaired samples in 2007. Indicator species analysis identified species that had affinities to disconnected habitats during2006, which included opportunistic life history strategists typical of temporary waters (western mosquitofish Gambusiaaffinis and blackstripe topminnow Fundulus notatus) and equilibrium strategists that rely on stable pool habitats fornesting (longear sunfish Lepomis megalotis and largemouth bass Micropterus salmoides). Conversely, indicator speciesof connected riffle–pool habitat included fluvial specialists (central stoneroller Campostoma anomalum, spotted bassMicropterus punctulatus, and bullhead minnow Pimephales vigilax). In summer 2007, the numbers of most species offish declined markedly compared with 2006. Community structure between previously disconnected and connectedstream types was also highly variable in 2007. However, strong recruitment of juveniles following spring floodingand sustained high summer flow significantly increased the frequency and abundance of two periodical strategists,channel catfish Ictalurus punctatus and flathead catfish Pylodictus olivaris in both types of streams in 2007. Thesefindings provide important insights into how individual species’ life history strategies influence the response of fishcommunity structure to extreme hydrologic events, which are likely to increase in frequency in many parts of theworld due to climate change.
Variation in discharge influences nearly all aspects of riverecosystem functioning (Richter et al. 2003). Discharge affectsaquatic life and its related habitat, nutrient cycling, sedimenttransport, water temperature, riverbank stability, groundwaterrecharge, and many other ecological factors in freshwater lotic
*Corresponding author: ryan s [email protected] address: Lassen Volcanic National Park, Post Office Box 100, Mineral, California 96063, USA.2Present address: Department of Natural Resources, New York Cooperative Fish and Wildlife Research Unit, Cornell University, Ithaca, New
York 14853, USA.Received February 9, 2011; accepted March 1, 2012Published online June 26, 2012
systems (Allan 1995). Strong associations between both thefunctional and taxonomic composition of fish communities andhydrologic regimes occur at regional scales (Poff and Allan1995). Variability in discharge can lead to rapid changes inenvironmental conditions, such as temperature, turbidity, and
1000
Dow
nloa
ded
by [
Uni
vers
ity o
f N
ew H
amps
hire
] at
10:
33 1
4 M
arch
201
3
FISH COMMUNITY STRUCTURE 1001
salinity (Ostrand and Wilde 2002), and these instream environ-mental changes can limit the spatial and temporal distributionof biota in lotic ecosystems.
Fish community structure composition in streams is regu-lated by abiotic (density-independent) factors, such as dischargeand habitat connectivity, and local biotic (density-dependent)factors, such as predation and competition (Taylor 1997). Therelative importance of these two factors in structuring fish as-semblages varies longitudinally in streams (Ostrand and Wilde2002). Smaller streams in the Great Plains are prone to dis-turbance and intermittence, and fish assemblage structure isthought to be controlled primarily by abiotic factors and the fre-quency of disturbances such as flood and drought (Echelle et al.1972; Matthews and Styron 1981; Meador and Matthews 1992;Taylor et al. 1993; Taylor 1997; Herbert and Gelwick 2003). Asa result, the predominant fish species in these stream types haveevolved to be physiologically tolerant of variable environmentalconditions, able to move in response to changing conditions, orable to rapidly recolonize areas of local extinction caused byintermittence (Winemiller 1989; Fausch and Bramblett 1991).
While many previous studies have examined the longitudinalchange of abiotic and biotic variables along the river contin-uum, disproportionately fewer studies have examined the effectof drying within streams that leads to differing assemblages inintermittent perennial pools during drought disturbance events.As perennial pools are formed, differing life history strategiesand variation in tolerance of increasingly stressful abiotic envi-ronmental conditions may contribute to species persistence inthese habitats. For example, opportunistic (O) strategists includesmall-bodied fishes with early maturation, low fecundity perspawning event, and low juvenile survivorship (Winemiller andRose 1992). This strategy, combined with tolerance of high tem-peratures and low dissolved oxygen, may confer an advantageduring extreme low-flow conditions. Lack of connectivity pre-vents the immigration or emigration of fish, and the continuingreduction of pool volume intensifies biotic interactions, poten-tially leading to local extinctions (Taylor 1997). However, stablelow-flow conditions and higher biotic interactions may benefitequilibrium (E) strategists, small to medium-bodied fishes withmoderate maturation age, low fecundity, and high parental in-vestment (Winemiller and Rose 1992). For example, at lower,more stable flows, centrarchids nest success is more associatedwith biotic interactions and positively related to guarding malesize (Noltie and Keenleyside 1986; Jennings and Philipp 1994;Dauwalter and Fisher 2007). In contrast, years with unusuallyhigh-flow events may displace or reset fish assemblage structureand favor periodic (P) strategists, large-bodied fishes with latematuration, high fecundity per spawning event, and no parentalcare (Winemiller and Rose 1992). This strategy, combined withhigh dispersal ability, may allow certain species to take ad-vantage of new feeding and spawning habitats after high-flowevents.
We studied the relative importance of temporal variation inthe physical habitat and fish assemblages of 28 central Texas
streams. These stream reaches differed greatly between sam-pling events in their discharge and physical habitat variablesdue to interannual differences in precipitation. The tempera-tures and precipitation amounts immediately before and duringour index sampling periods differed markedly between 2006and 2007; the summer of 2006 was one of the hottest summerson record and was classified as an extreme drought year forthe study area (Palmer hydrological drought index; http://www.ncdc.noaa.gov/sotc/drought/2006/13), whereas 2007 was thewettest summer on record for the state of Texas, with a springcharacterized by extreme flooding and summer base flows wellabove median flows throughout our study area (http://www.ncdc.noaa.gov/sotc/drought/2007/13).
Historically, as flow recedes during summer months, streamsin the middle Brazos River and upper Trinity River basins be-come intermittent and are characterized as a continuum of dis-connected, often perennial, pools within the streambed (Echelleet al. 1972; Wilde and Ostrand 1999). This pattern was observedduring the 2006 collection period in 16 of the 28 stream reachessampled but in none of the sites sampled in 2007. Stream reacheswere classified into a priori groups based upon this habitat con-nectivity criterion, as determined by discharge measurements(Table A.1 in the appendix) and visual evaluation of pool con-nectivity. This variation presented a unique opportunity to exam-ine the relationship between extremes of hydrologic variabilityand fish assemblages in central Texas streams. We used thisunique data set that spans two sequential years of contrastinghydrological conditions to test the following hypotheses:
1. Extreme hydrologic conditions between years and associatedeffects on stream connectivity would influence habitat andfish assemblage structure;
2. Changes in fish assemblage structure between drought andflood conditions would vary with habitat connectivity duringdrought conditions; and
3. Based on differences in life history strategies and habitatrequirements, we would observe species that were charac-teristic of species assemblage sorting among the extremehydrologic and connectivity conditions observed during ourstudy period.
METHODSSite selection.—The Trinity and Brazos River drainage basins
cover a large portion of central Texas. These drainage basinsspan several ecoregions, including the Cross Timbers ecore-gion, which encompasses the entirety of our study area. Thisecoregion is a transitional zone between the once-prairie, nowwinter wheat–growing regions to the west and the forested lowmountains or hills of eastern Texas. A mosaic of forest, wood-land, savanna, and prairie characterizes this ecoregion (Griffithet al. 2004).
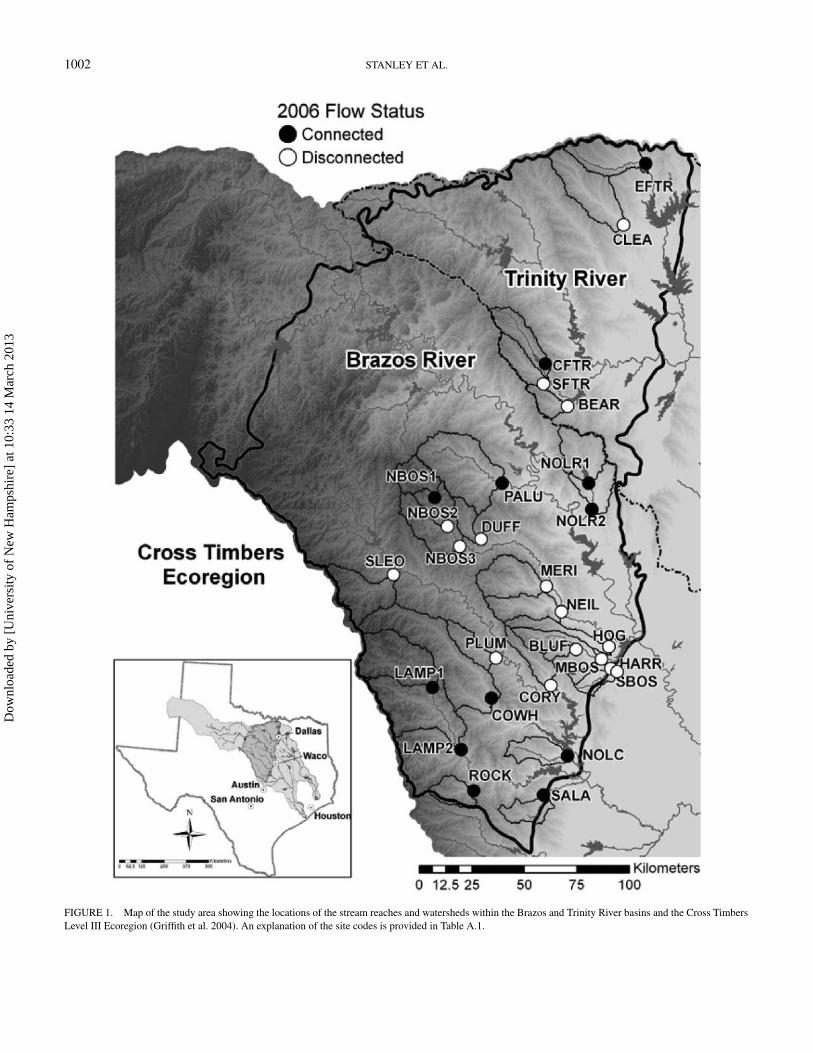
Stream reaches were selected from wadeable streams andriver tributaries throughout this ecoregion to provide broad ge-ographic coverage and a range of landscape features (Figure 1;
Dow
nloa
ded
by [
Uni
vers
ity o
f N
ew H
amps
hire
] at
10:
33 1
4 M
arch
201
3
1002 STANLEY ET AL.
FIGURE 1. Map of the study area showing the locations of the stream reaches and watersheds within the Brazos and Trinity River basins and the Cross TimbersLevel III Ecoregion (Griffith et al. 2004). An explanation of the site codes is provided in Table A.1.
Dow
nloa
ded
by [
Uni
vers
ity o
f N
ew H
amps
hire
] at
10:
33 1
4 M
arch
201
3
FISH COMMUNITY STRUCTURE 1003
Pease et al. 2011). Over 50% of the land area in the Cross Tim-bers ecoregion lies within our study catchments; thus our sitesspanned a substantial range of conditions and were likely rep-resentative of other streams not included in our study. Selectedreaches were sampled once in 2006 and once in 2007 during anindex sampling period (1 May–15 October) defined by the TexasCommission on Environmental Quality (TCEQ 2003). Thirty-eight stream reaches were sampled in July and August during2006; however, due to high stream discharges during the indexsampling period only 28 streams were sampled during the 2007field season, primarily in August and September. Because thisstudy is concerned with interannual variation, it is limited to the28 sites that were sampled during both years of data collection.
Instream physical habitat and fish sampling.—Stream phys-ical habitat and fish data collection during the summer of 2006followed Surface Water Quality Monitoring Procedures proto-cols for habitat and fish assessments (TCEQ 2003; Pease et al.2011). Stream physical habitat and fish assemblages were as-sessed within a sampling reach (40 times the average streamwidth but not less than 150 m or greater than 500 m in totallength). At each site, habitat variables were measured at five tosix equally spaced transects (depending on reach total length)or across the entire reach to characterize instream channel char-acteristics, stream morphology, and riparian environments. Atsites experiencing low-flow conditions in which less than 50% ofthe reach is covered in perennial pools, transects were adjustedto best characterize the available habitat in pools and additionalmeasures of maximum length, width, and depth were recordedfor each pool, with the overall objective being to characterizeavailable pool habitat.
All discrete habitat and cover types within the entire reachwere electrofished with a backpack electroshocker (Smith-RootCo., Vancouver, Washington). Actual shocking time was at least900 s but varied based on reach length and habitat complexity.Six straight seine hauls covering a cumulative distance of at least60 m were conducted across all habitats, especially areas suchas deep pools or shallow riffles where electrofishing may notbe as effective. In shallow riffle areas the seine net was placeddownstream and the riffle habitat was disturbed by aggressivelyagitating the 10-m riffle area by kicking substrate within theriffle to drive fish into the net downstream. Deep pools weresampled with 9.14-m or 4.57-m × 1.83-m × 0.64-cm-meshseines, whereas riffles, runs, and small pools were sampled with2-m or 5-m-long × 4-mm-mesh seines. All collected fish wereidentified (Thomas et al. 2007; Hubbs et al. 2008), separatedinto juvenile and adult age-classes, and counted in the field. Atleast two voucher specimens for each species and all unknownspecies were preserved in 10% buffered formalin and returnedto the laboratory for identification.
Data analyses.—Streams that had connected habitat (allow-ing movement of fish throughout the reach during the 2006sampling) and total stream discharge greater than 0.001 m3/swere classified as having connected instream habitat (2006C). Streams that had disconnected perennial pools (prevent-ing movement of fish throughout the reach during the 2006
sampling) and discharge less than 0.001 m3/s were classifiedas having disconnected instream habitat (2006 D). All streamreaches sampled in 2007 had connected habitat throughout thestream reaches and discharge greater than 0.001 m3/s. Thestream reaches sampled in 2007 were classified by whetherhabitat was connected (2007 PC) or disconnected (2007 PD)during the 2006 sampling period.
We conducted principal components analysis (PCA) to iden-tify correlations among habitat variables and to reduce theshared variance among variables to a smaller number of syn-thetic axes for evaluating changes in habitat among interannualgroups. Prior to the analysis, we reduced the number of vari-ables from an initial list of 49 to 22 by removing variablesthat were redundant within groups of similar variables (e.g.,multiple measures of large woody debris). We further screenedvariables to meet the statistical assumption of approximately lin-ear relationships; in cases in which variables did not meet thisassumption, we applied transformations (square root or loga-rithmic) to those variables (only) to achieve skew and kurtosis< |1|. Principal components analysis was conducted on a cor-relation matrix of stream reaches (28 sites × 2 years) and thereduced set of 22 habitat variables. We assessed the significanceof each principal component by comparing eigenvalues obtainedfrom 1,000 random permutations of the data with the observedeigenvalue (McCune and Grace 2002); PCs with eigenvaluessignificantly different than random (P < 0.05) were retained forfurther analysis and interpretation.
We estimated gradients in fish community compositionamong streams between years using nonmetric multidimen-sional scaling (MDS). This is an effective ordination for eco-logical species composition because it avoids the assumptionof linear relationships necessary for other statistical techniques,such as PCA (Clarke 1993; McCune and Grace 2002). Prior tothe analysis, species abundances (the total number of fish cap-tured per species at each site) were log10(x + 1) transformed inorder to reduce the influence of highly abundant, small-bodiedspecies on the ordination. The MDS was conducted on a Bray-Curtis dissimilarity matrix of 56 sample units (28 streams ×2 years) by 34 species abundances. We used stress, a measurefit between the ordination and the original data, to select theappropriate number of dimensions for the final ordination fol-lowing McCune and Grace (2002). We excluded fish collectedin <5% of the sampling units because these were too infrequentto contribute useful information to the analysis (McCune andGrace 2002). The PCA and MDS analyses were conducted inPC-Ord version 5.20 (McCune and Medford 2006).
We related the habitat variables used in the final PCA to theMDS ordination of fish community composition using rotationalvector fitting (Faith and Norris 1989) as implemented by theenvfit function in the vegan package for R 2.12 (Oksanen et al.2011). Vector fitting determined the direction and magnitude ofthe maximum correlation between predictor variables and theconfiguration sample units in the ordination space and aidedin the interpretation of gradients in fish species composition.The probability of obtaining an equal or larger correlation from
Dow
nloa
ded
by [
Uni
vers
ity o
f N
ew H
amps
hire
] at
10:
33 1
4 M
arch
201
3
1004 STANLEY ET AL.
random data (P) is estimated using 1,000 random permutations.We deemed correlations with P < 0.05 to be different fromrandom.
We tested for differences in habitat structure and speciescomposition among the four hydrological groups and the dis-persion of each group within ordination space using multivari-ate response permutation procedure (MRPP) and PERMuta-tional analysis of multivariate DISPersion (PERMDISP). Weused MRPP (Mielke 1984) as implemented in PC-Ord 5.20 todescribe differences in habitat and community structure usingEuclidean distances among sites in PCA and MDS ordinationspace, respectively. This technique is a multivariate analog to aStudent’s t-test of differences between groups and determinesthe significance of separations of groups in ordination space andthus significant differences in either fish community structure orhabitat characteristics between groups of streams. The MRPPwas performed on coordinates from PCA and MDS ordinationplots. Groups were weighted using a natural weighting, as rec-ommended by Mielke (1984). Pairwise comparisons were madebetween the locations of group centroids in both PCA and MDSordination space to determine the significance of differences ingroup habitat or community composition.
We used the program PERMDISP2 (Anderson 2006) to de-termine whether the dispersions (degree of variability amongsites) of each group around their group centroid were signifi-cantly different from one another. This program is useful in de-termining whether the separations between groups indicated byMRPP are affected by differences in the dispersions of groups.MRPP distance comparisons can be sensitive to between-groupdifferences in dispersion, and this technique is a multivariateanalog to Levene’s test on the Euclidean distances of indi-vidual observations and their group centroid (Anderson 2006).Anderson et al. (2006) also suggest that the overall dispersionof a group measured as average distance (or dissimilarity) froman individual sampling unit to the group centroid may be usedas a multivariate measure of community beta diversity. We hy-pothesized that disconnected sites would have greater dispersion(beta diversity) due to increased biotic interactions, particularlypredation, within disconnected perennial pools, causing a de-coupling of fish species composition from habitat variables.
We interpreted the patterns in change of habitat variables andspecies composition between annual sampling events for bothPCA and MDS ordinations using successional vector diagrams.These diagrams show the direction and magnitude of changein both fish community composition and habitat characteristicsbetween interannual pairs of sites. Each interannual pair of siteswere translated to origin, meaning that all 28 sites sampled in2006 are located at the point (0, 0) of the two-dimensionalsuccessional vector diagram (McCune and Grace 2002).The corresponding paired 2007 sites were graphed in two-dimensional space around the origin and connected with vectorlines so that the direction and magnitude of the interannualchange in ordination space were visualized. Euclidean distancewas used to calculate the vector lengths between interannualpairs of sites from the successional vector diagram. A one-
tailed Student’s t-test for unequal variances was used to deter-mine whether the mean vector lengths for interannually pairedconnected and disconnected sites were significantly different, adirect measure of the magnitude of change between years. Also,coordinates for successional vector diagrams were used as thebasis for additional MRPP comparisons. This MRPP analysisaddresses a different question than the previous one, in that itis concerned with the differences in magnitude and direction ofthe interannual change in habitat condition and species compo-sition.
Finally, we used indicator species analysis (ISA; Dufrene andLegendre 1997) to test for affinities of different species to ourhydrology and habitat connectivity groupings. This analysis as-signs an indicator value (IndVal) to each taxon by calculating theproduct of the relative frequency (the percentage occurrence of ataxon among sample units in each group) and the relative abun-dance (the percentage of the total abundance of a taxon in eachgroup) of each species to a group. The probability of achievingan equal or larger IndVal value among groups (P) was estimatedusing 999 random permutations of the original data (Dufrene andLegendre 1997). Species with significantly (P ≤ 0.05) higherIndVals for a given group are likely to found in other regionalstreams with similar environmental conditions and suggest a hy-drological effect on that species. Indicator species analysis wasused to determine group indicator values for all species includedin analyses.
RESULTS
Physical Habitat AnalysesPrincipal components 1 and 2 had eigenvalues significantly
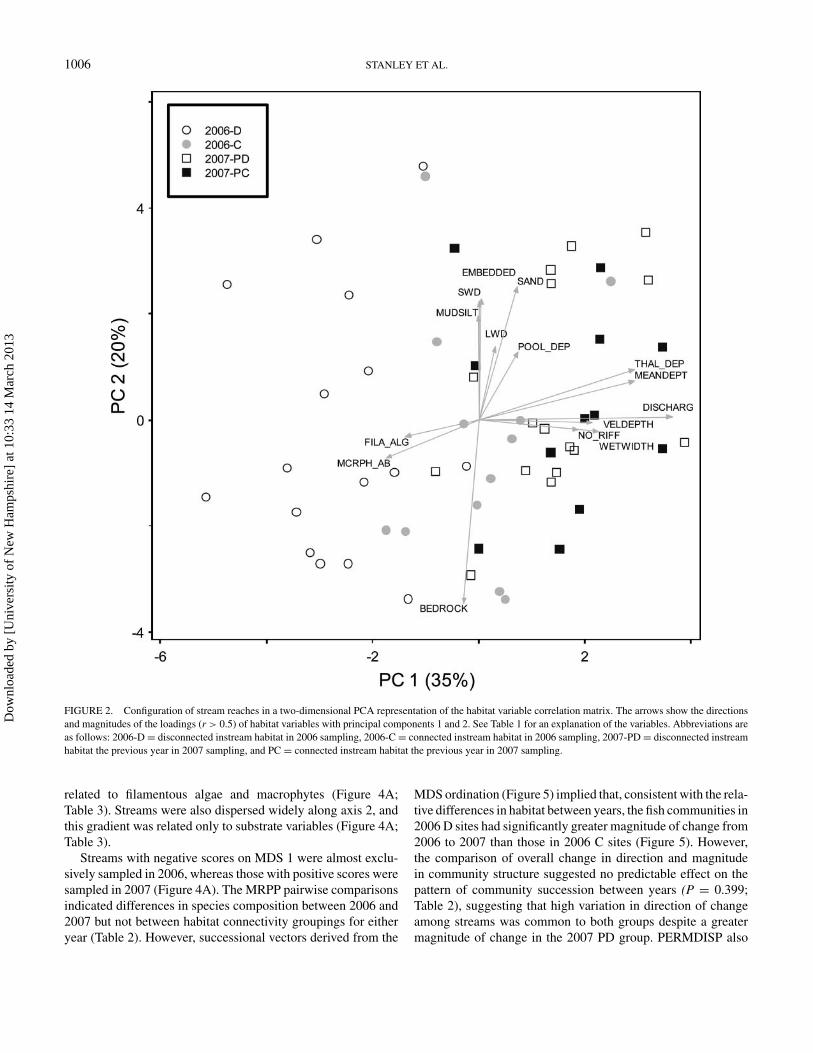
different from random and accounted for 54.9% of the cumula-tive variance among the 22 habitat variables (Table 1; Figure 2).Eigenvalues for PCs 3 and higher were not significantly differentfrom random (P > 0.05). Reaches with increasingly positive val-ues along PC1 were higher-discharge streams with greater waterdepth, diversity of depths and current speeds, and riffles. Nega-tive values along PC1 were indicative of higher abundances ofmacrophytes and filamentous algae and low discharge. Principalcomponent 2 was primarily a substrate variable axis with highervalues corresponding to greater cover of sand, silt, and mud sub-strates; more woody debris; and higher substrate embeddedness.Lower values corresponded to habitats that had less surface wa-ter that was slower moving, with erosional banks resulting inmuddy substrates.
The 2006 D group centroid was significantly separated fromall other groups in PCA space according to MRPP pairwisecomparisons (Figure 2; Table 2), with the greatest separationfrom 2007 PD. The location of this group in PCA space sug-gests that the habitat conditions among streams indicative of thisgroup are characterized by comparatively high macrophyte andfilamentous algae abundance, bedrock substrates, and (by def-inition) no surface flow between disconnected perennial pools.The 2006 C group was not significantly different from either2007 group. These remaining groups’ positions in PCA space
Dow
nloa
ded
by [
Uni
vers
ity o
f N
ew H
amps
hire
] at
10:
33 1
4 M
arch
201
3
FISH COMMUNITY STRUCTURE 1005
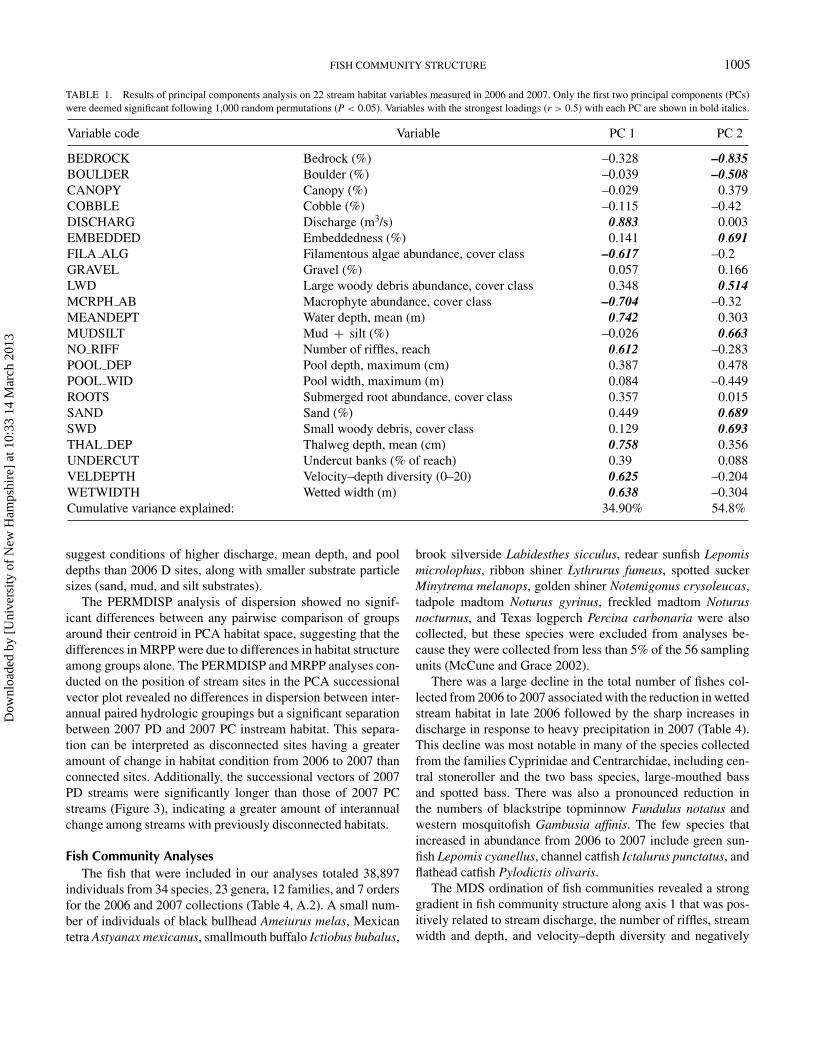
TABLE 1. Results of principal components analysis on 22 stream habitat variables measured in 2006 and 2007. Only the first two principal components (PCs)were deemed significant following 1,000 random permutations (P < 0.05). Variables with the strongest loadings (r > 0.5) with each PC are shown in bold italics.
Variable code Variable PC 1 PC 2
BEDROCK Bedrock (%) –0.328 –0.835BOULDER Boulder (%) –0.039 –0.508CANOPY Canopy (%) –0.029 0.379COBBLE Cobble (%) –0.115 –0.42DISCHARG Discharge (m3/s) 0.883 0.003EMBEDDED Embeddedness (%) 0.141 0.691FILA ALG Filamentous algae abundance, cover class –0.617 –0.2GRAVEL Gravel (%) 0.057 0.166LWD Large woody debris abundance, cover class 0.348 0.514MCRPH AB Macrophyte abundance, cover class –0.704 –0.32MEANDEPT Water depth, mean (m) 0.742 0.303MUDSILT Mud + silt (%) –0.026 0.663NO RIFF Number of riffles, reach 0.612 –0.283POOL DEP Pool depth, maximum (cm) 0.387 0.478POOL WID Pool width, maximum (m) 0.084 –0.449ROOTS Submerged root abundance, cover class 0.357 0.015SAND Sand (%) 0.449 0.689SWD Small woody debris, cover class 0.129 0.693THAL DEP Thalweg depth, mean (cm) 0.758 0.356UNDERCUT Undercut banks (% of reach) 0.39 0.088VELDEPTH Velocity–depth diversity (0–20) 0.625 –0.204WETWIDTH Wetted width (m) 0.638 –0.304Cumulative variance explained: 34.90% 54.8%
suggest conditions of higher discharge, mean depth, and pooldepths than 2006 D sites, along with smaller substrate particlesizes (sand, mud, and silt substrates).
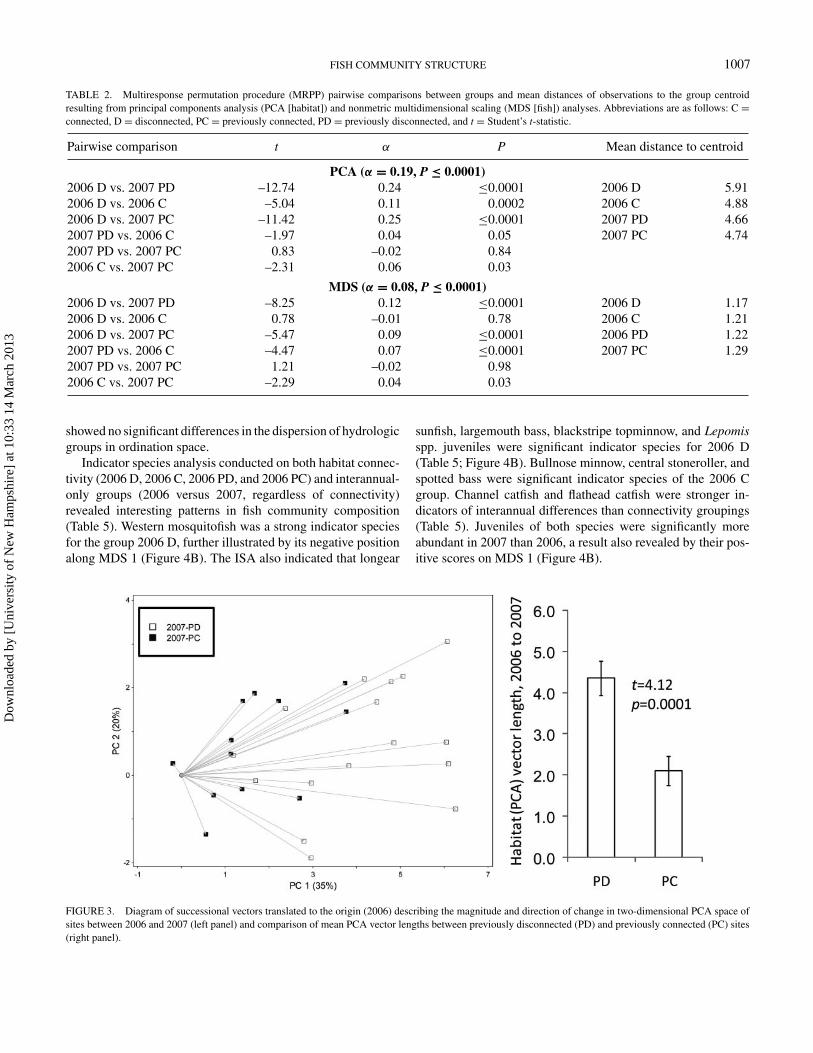
The PERMDISP analysis of dispersion showed no signif-icant differences between any pairwise comparison of groupsaround their centroid in PCA habitat space, suggesting that thedifferences in MRPP were due to differences in habitat structureamong groups alone. The PERMDISP and MRPP analyses con-ducted on the position of stream sites in the PCA successionalvector plot revealed no differences in dispersion between inter-annual paired hydrologic groupings but a significant separationbetween 2007 PD and 2007 PC instream habitat. This separa-tion can be interpreted as disconnected sites having a greateramount of change in habitat condition from 2006 to 2007 thanconnected sites. Additionally, the successional vectors of 2007PD streams were significantly longer than those of 2007 PCstreams (Figure 3), indicating a greater amount of interannualchange among streams with previously disconnected habitats.
Fish Community AnalysesThe fish that were included in our analyses totaled 38,897
individuals from 34 species, 23 genera, 12 families, and 7 ordersfor the 2006 and 2007 collections (Table 4, A.2). A small num-ber of individuals of black bullhead Ameiurus melas, Mexicantetra Astyanax mexicanus, smallmouth buffalo Ictiobus bubalus,
brook silverside Labidesthes sicculus, redear sunfish Lepomismicrolophus, ribbon shiner Lythrurus fumeus, spotted suckerMinytrema melanops, golden shiner Notemigonus crysoleucas,tadpole madtom Noturus gyrinus, freckled madtom Noturusnocturnus, and Texas logperch Percina carbonaria were alsocollected, but these species were excluded from analyses be-cause they were collected from less than 5% of the 56 samplingunits (McCune and Grace 2002).
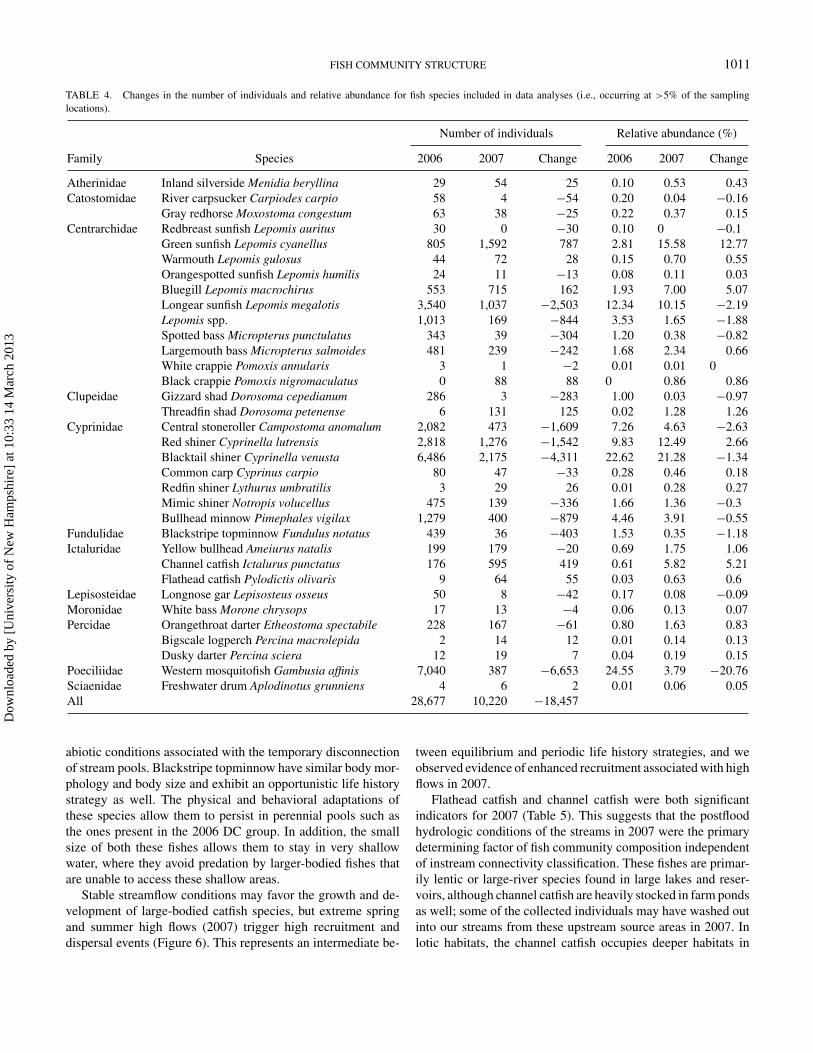
There was a large decline in the total number of fishes col-lected from 2006 to 2007 associated with the reduction in wettedstream habitat in late 2006 followed by the sharp increases indischarge in response to heavy precipitation in 2007 (Table 4).This decline was most notable in many of the species collectedfrom the families Cyprinidae and Centrarchidae, including cen-tral stoneroller and the two bass species, large-mouthed bassand spotted bass. There was also a pronounced reduction inthe numbers of blackstripe topminnow Fundulus notatus andwestern mosquitofish Gambusia affinis. The few species thatincreased in abundance from 2006 to 2007 include green sun-fish Lepomis cyanellus, channel catfish Ictalurus punctatus, andflathead catfish Pylodictis olivaris.
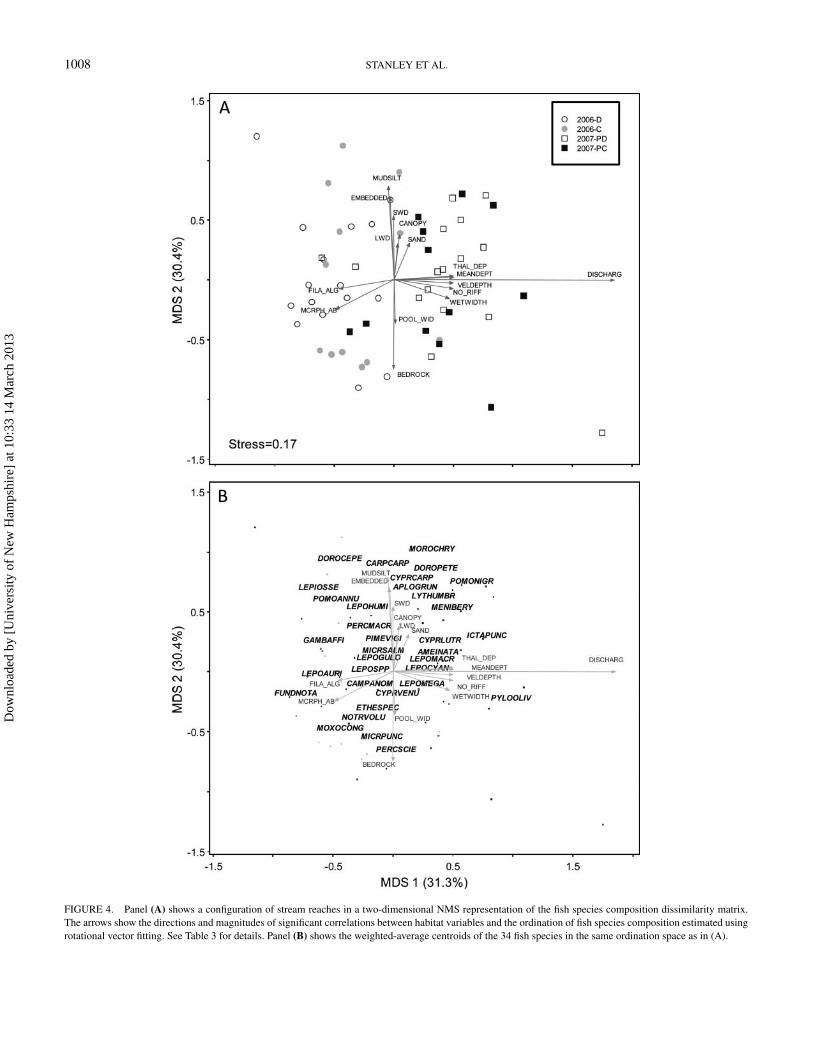
The MDS ordination of fish communities revealed a stronggradient in fish community structure along axis 1 that was pos-itively related to stream discharge, the number of riffles, streamwidth and depth, and velocity–depth diversity and negatively
Dow
nloa
ded
by [
Uni
vers
ity o
f N
ew H
amps
hire
] at
10:
33 1
4 M
arch
201
3
1006 STANLEY ET AL.
FIGURE 2. Configuration of stream reaches in a two-dimensional PCA representation of the habitat variable correlation matrix. The arrows show the directionsand magnitudes of the loadings (r > 0.5) of habitat variables with principal components 1 and 2. See Table 1 for an explanation of the variables. Abbreviations areas follows: 2006-D = disconnected instream habitat in 2006 sampling, 2006-C = connected instream habitat in 2006 sampling, 2007-PD = disconnected instreamhabitat the previous year in 2007 sampling, and PC = connected instream habitat the previous year in 2007 sampling.
related to filamentous algae and macrophytes (Figure 4A;Table 3). Streams were also dispersed widely along axis 2, andthis gradient was related only to substrate variables (Figure 4A;Table 3).
Streams with negative scores on MDS 1 were almost exclu-sively sampled in 2006, whereas those with positive scores weresampled in 2007 (Figure 4A). The MRPP pairwise comparisonsindicated differences in species composition between 2006 and2007 but not between habitat connectivity groupings for eitheryear (Table 2). However, successional vectors derived from the
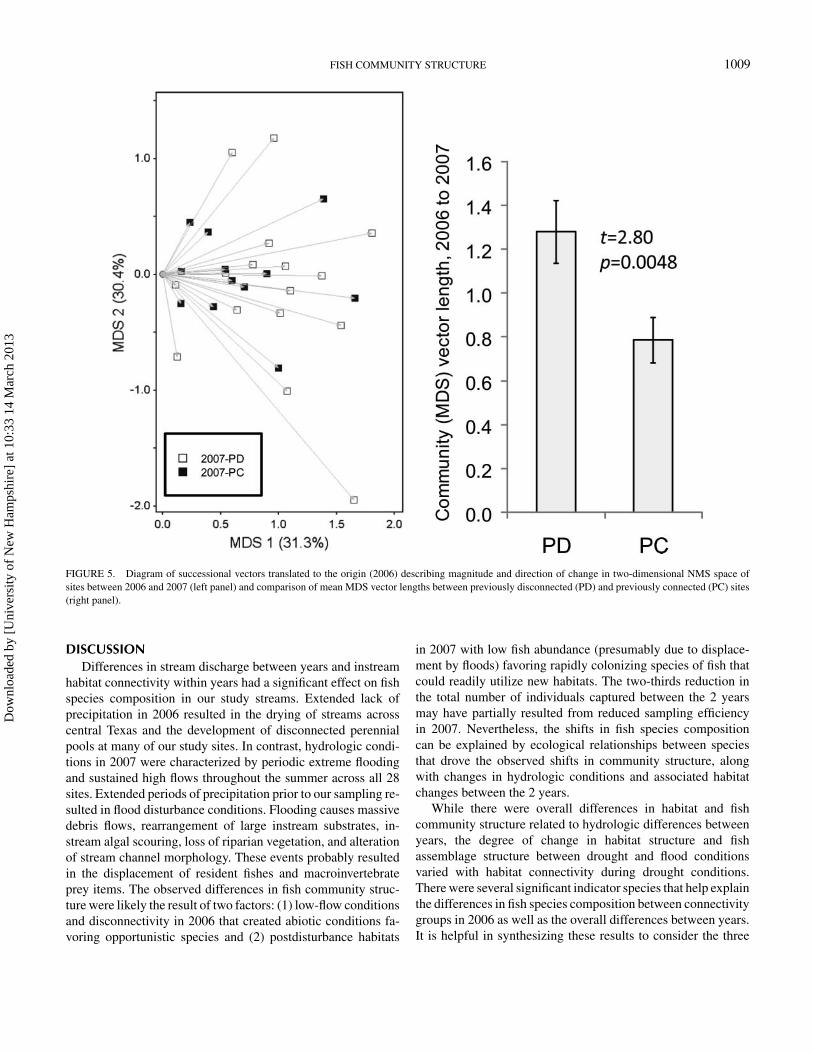
MDS ordination (Figure 5) implied that, consistent with the rela-tive differences in habitat between years, the fish communities in2006 D sites had significantly greater magnitude of change from2006 to 2007 than those in 2006 C sites (Figure 5). However,the comparison of overall change in direction and magnitudein community structure suggested no predictable effect on thepattern of community succession between years (P = 0.399;Table 2), suggesting that high variation in direction of changeamong streams was common to both groups despite a greatermagnitude of change in the 2007 PD group. PERMDISP also
Dow
nloa
ded
by [
Uni
vers
ity o
f N
ew H
amps
hire
] at
10:
33 1
4 M
arch
201
3
FISH COMMUNITY STRUCTURE 1007
TABLE 2. Multiresponse permutation procedure (MRPP) pairwise comparisons between groups and mean distances of observations to the group centroidresulting from principal components analysis (PCA [habitat]) and nonmetric multidimensional scaling (MDS [fish]) analyses. Abbreviations are as follows: C =connected, D = disconnected, PC = previously connected, PD = previously disconnected, and t = Student’s t-statistic.
Pairwise comparison t α P Mean distance to centroid
PCA (α = 0.19, P ≤ 0.0001)2006 D vs. 2007 PD –12.74 0.24 ≤0.0001 2006 D 5.912006 D vs. 2006 C –5.04 0.11 0.0002 2006 C 4.882006 D vs. 2007 PC –11.42 0.25 ≤0.0001 2007 PD 4.662007 PD vs. 2006 C –1.97 0.04 0.05 2007 PC 4.742007 PD vs. 2007 PC 0.83 –0.02 0.842006 C vs. 2007 PC –2.31 0.06 0.03
MDS (α = 0.08, P ≤ 0.0001)2006 D vs. 2007 PD –8.25 0.12 ≤0.0001 2006 D 1.172006 D vs. 2006 C 0.78 –0.01 0.78 2006 C 1.212006 D vs. 2007 PC –5.47 0.09 ≤0.0001 2006 PD 1.222007 PD vs. 2006 C –4.47 0.07 ≤0.0001 2007 PC 1.292007 PD vs. 2007 PC 1.21 –0.02 0.982006 C vs. 2007 PC –2.29 0.04 0.03
showed no significant differences in the dispersion of hydrologicgroups in ordination space.
Indicator species analysis conducted on both habitat connec-tivity (2006 D, 2006 C, 2006 PD, and 2006 PC) and interannual-only groups (2006 versus 2007, regardless of connectivity)revealed interesting patterns in fish community composition(Table 5). Western mosquitofish was a strong indicator speciesfor the group 2006 D, further illustrated by its negative positionalong MDS 1 (Figure 4B). The ISA also indicated that longear
sunfish, largemouth bass, blackstripe topminnow, and Lepomisspp. juveniles were significant indicator species for 2006 D(Table 5; Figure 4B). Bullnose minnow, central stoneroller, andspotted bass were significant indicator species of the 2006 Cgroup. Channel catfish and flathead catfish were stronger in-dicators of interannual differences than connectivity groupings(Table 5). Juveniles of both species were significantly moreabundant in 2007 than 2006, a result also revealed by their pos-itive scores on MDS 1 (Figure 4B).
FIGURE 3. Diagram of successional vectors translated to the origin (2006) describing the magnitude and direction of change in two-dimensional PCA space ofsites between 2006 and 2007 (left panel) and comparison of mean PCA vector lengths between previously disconnected (PD) and previously connected (PC) sites(right panel).
Dow
nloa
ded
by [
Uni
vers
ity o
f N
ew H
amps
hire
] at
10:
33 1
4 M
arch
201
3
1008 STANLEY ET AL.
FIGURE 4. Panel (A) shows a configuration of stream reaches in a two-dimensional NMS representation of the fish species composition dissimilarity matrix.The arrows show the directions and magnitudes of significant correlations between habitat variables and the ordination of fish species composition estimated usingrotational vector fitting. See Table 3 for details. Panel (B) shows the weighted-average centroids of the 34 fish species in the same ordination space as in (A).
Dow
nloa
ded
by [
Uni
vers
ity o
f N
ew H
amps
hire
] at
10:
33 1
4 M
arch
201
3
FISH COMMUNITY STRUCTURE 1009
FIGURE 5. Diagram of successional vectors translated to the origin (2006) describing magnitude and direction of change in two-dimensional NMS space ofsites between 2006 and 2007 (left panel) and comparison of mean MDS vector lengths between previously disconnected (PD) and previously connected (PC) sites(right panel).
DISCUSSIONDifferences in stream discharge between years and instream
habitat connectivity within years had a significant effect on fishspecies composition in our study streams. Extended lack ofprecipitation in 2006 resulted in the drying of streams acrosscentral Texas and the development of disconnected perennialpools at many of our study sites. In contrast, hydrologic condi-tions in 2007 were characterized by periodic extreme floodingand sustained high flows throughout the summer across all 28sites. Extended periods of precipitation prior to our sampling re-sulted in flood disturbance conditions. Flooding causes massivedebris flows, rearrangement of large instream substrates, in-stream algal scouring, loss of riparian vegetation, and alterationof stream channel morphology. These events probably resultedin the displacement of resident fishes and macroinvertebrateprey items. The observed differences in fish community struc-ture were likely the result of two factors: (1) low-flow conditionsand disconnectivity in 2006 that created abiotic conditions fa-voring opportunistic species and (2) postdisturbance habitats
in 2007 with low fish abundance (presumably due to displace-ment by floods) favoring rapidly colonizing species of fish thatcould readily utilize new habitats. The two-thirds reduction inthe total number of individuals captured between the 2 yearsmay have partially resulted from reduced sampling efficiencyin 2007. Nevertheless, the shifts in fish species compositioncan be explained by ecological relationships between speciesthat drove the observed shifts in community structure, alongwith changes in hydrologic conditions and associated habitatchanges between the 2 years.
While there were overall differences in habitat and fishcommunity structure related to hydrologic differences betweenyears, the degree of change in habitat structure and fishassemblage structure between drought and flood conditionsvaried with habitat connectivity during drought conditions.There were several significant indicator species that help explainthe differences in fish species composition between connectivitygroups in 2006 as well as the overall differences between years.It is helpful in synthesizing these results to consider the three
Dow
nloa
ded
by [
Uni
vers
ity o
f N
ew H
amps
hire
] at
10:
33 1
4 M
arch
201
3
1010 STANLEY ET AL.
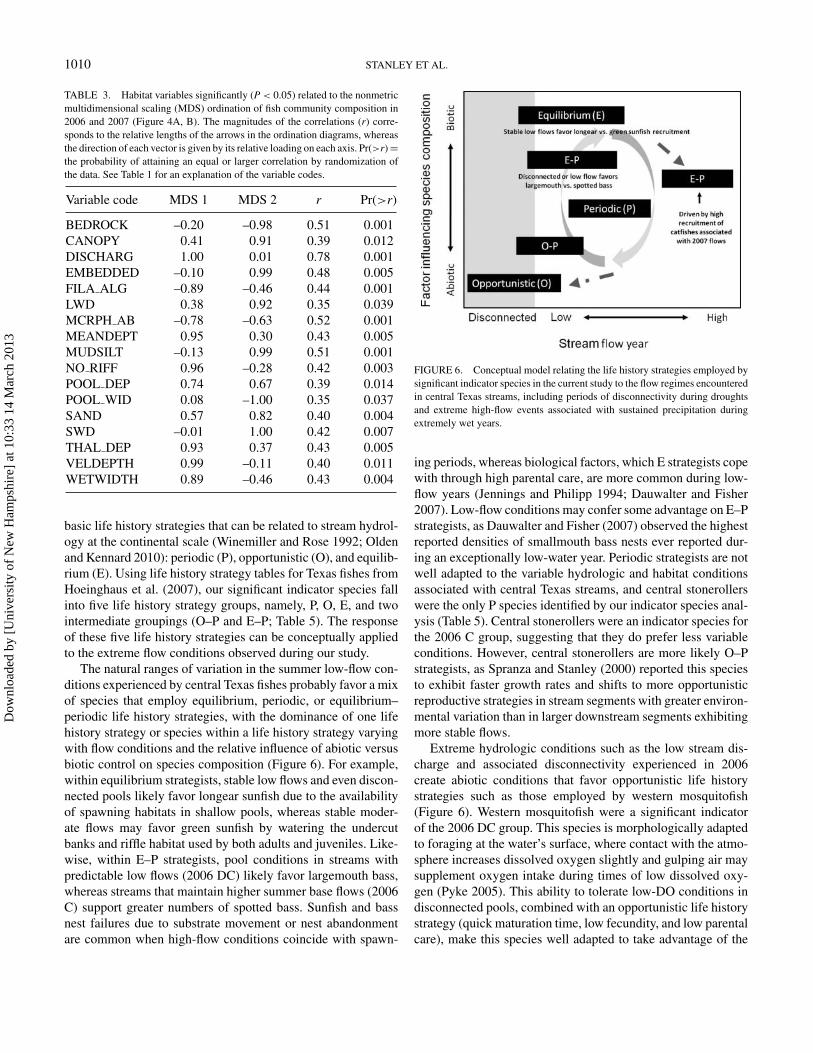
TABLE 3. Habitat variables significantly (P < 0.05) related to the nonmetricmultidimensional scaling (MDS) ordination of fish community composition in2006 and 2007 (Figure 4A, B). The magnitudes of the correlations (r) corre-sponds to the relative lengths of the arrows in the ordination diagrams, whereasthe direction of each vector is given by its relative loading on each axis. Pr(>r) =the probability of attaining an equal or larger correlation by randomization ofthe data. See Table 1 for an explanation of the variable codes.
Variable code MDS 1 MDS 2 r Pr(>r)
BEDROCK –0.20 –0.98 0.51 0.001CANOPY 0.41 0.91 0.39 0.012DISCHARG 1.00 0.01 0.78 0.001EMBEDDED –0.10 0.99 0.48 0.005FILA ALG –0.89 –0.46 0.44 0.001LWD 0.38 0.92 0.35 0.039MCRPH AB –0.78 –0.63 0.52 0.001MEANDEPT 0.95 0.30 0.43 0.005MUDSILT –0.13 0.99 0.51 0.001NO RIFF 0.96 –0.28 0.42 0.003POOL DEP 0.74 0.67 0.39 0.014POOL WID 0.08 –1.00 0.35 0.037SAND 0.57 0.82 0.40 0.004SWD –0.01 1.00 0.42 0.007THAL DEP 0.93 0.37 0.43 0.005VELDEPTH 0.99 –0.11 0.40 0.011WETWIDTH 0.89 –0.46 0.43 0.004
basic life history strategies that can be related to stream hydrol-ogy at the continental scale (Winemiller and Rose 1992; Oldenand Kennard 2010): periodic (P), opportunistic (O), and equilib-rium (E). Using life history strategy tables for Texas fishes fromHoeinghaus et al. (2007), our significant indicator species fallinto five life history strategy groups, namely, P, O, E, and twointermediate groupings (O–P and E–P; Table 5). The responseof these five life history strategies can be conceptually appliedto the extreme flow conditions observed during our study.
The natural ranges of variation in the summer low-flow con-ditions experienced by central Texas fishes probably favor a mixof species that employ equilibrium, periodic, or equilibrium–periodic life history strategies, with the dominance of one lifehistory strategy or species within a life history strategy varyingwith flow conditions and the relative influence of abiotic versusbiotic control on species composition (Figure 6). For example,within equilibrium strategists, stable low flows and even discon-nected pools likely favor longear sunfish due to the availabilityof spawning habitats in shallow pools, whereas stable moder-ate flows may favor green sunfish by watering the undercutbanks and riffle habitat used by both adults and juveniles. Like-wise, within E–P strategists, pool conditions in streams withpredictable low flows (2006 DC) likely favor largemouth bass,whereas streams that maintain higher summer base flows (2006C) support greater numbers of spotted bass. Sunfish and bassnest failures due to substrate movement or nest abandonmentare common when high-flow conditions coincide with spawn-
FIGURE 6. Conceptual model relating the life history strategies employed bysignificant indicator species in the current study to the flow regimes encounteredin central Texas streams, including periods of disconnectivity during droughtsand extreme high-flow events associated with sustained precipitation duringextremely wet years.
ing periods, whereas biological factors, which E strategists copewith through high parental care, are more common during low-flow years (Jennings and Philipp 1994; Dauwalter and Fisher2007). Low-flow conditions may confer some advantage on E–Pstrategists, as Dauwalter and Fisher (2007) observed the highestreported densities of smallmouth bass nests ever reported dur-ing an exceptionally low-water year. Periodic strategists are notwell adapted to the variable hydrologic and habitat conditionsassociated with central Texas streams, and central stonerollerswere the only P species identified by our indicator species anal-ysis (Table 5). Central stonerollers were an indicator species forthe 2006 C group, suggesting that they do prefer less variableconditions. However, central stonerollers are more likely O–Pstrategists, as Spranza and Stanley (2000) reported this speciesto exhibit faster growth rates and shifts to more opportunisticreproductive strategies in stream segments with greater environ-mental variation than in larger downstream segments exhibitingmore stable flows.
Extreme hydrologic conditions such as the low stream dis-charge and associated disconnectivity experienced in 2006create abiotic conditions that favor opportunistic life historystrategies such as those employed by western mosquitofish(Figure 6). Western mosquitofish were a significant indicatorof the 2006 DC group. This species is morphologically adaptedto foraging at the water’s surface, where contact with the atmo-sphere increases dissolved oxygen slightly and gulping air maysupplement oxygen intake during times of low dissolved oxy-gen (Pyke 2005). This ability to tolerate low-DO conditions indisconnected pools, combined with an opportunistic life historystrategy (quick maturation time, low fecundity, and low parentalcare), make this species well adapted to take advantage of the
Dow
nloa
ded
by [
Uni
vers
ity o
f N
ew H
amps
hire
] at
10:
33 1
4 M
arch
201
3
FISH COMMUNITY STRUCTURE 1011
TABLE 4. Changes in the number of individuals and relative abundance for fish species included in data analyses (i.e., occurring at >5% of the samplinglocations).
Number of individuals Relative abundance (%)
Family Species 2006 2007 Change 2006 2007 Change
Atherinidae Inland silverside Menidia beryllina 29 54 25 0.10 0.53 0.43Catostomidae River carpsucker Carpiodes carpio 58 4 −54 0.20 0.04 −0.16
Gray redhorse Moxostoma congestum 63 38 −25 0.22 0.37 0.15Centrarchidae Redbreast sunfish Lepomis auritus 30 0 −30 0.10 0 −0.1
Green sunfish Lepomis cyanellus 805 1,592 787 2.81 15.58 12.77Warmouth Lepomis gulosus 44 72 28 0.15 0.70 0.55Orangespotted sunfish Lepomis humilis 24 11 −13 0.08 0.11 0.03Bluegill Lepomis macrochirus 553 715 162 1.93 7.00 5.07Longear sunfish Lepomis megalotis 3,540 1,037 −2,503 12.34 10.15 −2.19Lepomis spp. 1,013 169 −844 3.53 1.65 −1.88Spotted bass Micropterus punctulatus 343 39 −304 1.20 0.38 −0.82Largemouth bass Micropterus salmoides 481 239 −242 1.68 2.34 0.66White crappie Pomoxis annularis 3 1 −2 0.01 0.01 0Black crappie Pomoxis nigromaculatus 0 88 88 0 0.86 0.86
Clupeidae Gizzard shad Dorosoma cepedianum 286 3 −283 1.00 0.03 −0.97Threadfin shad Dorosoma petenense 6 131 125 0.02 1.28 1.26
Cyprinidae Central stoneroller Campostoma anomalum 2,082 473 −1,609 7.26 4.63 −2.63Red shiner Cyprinella lutrensis 2,818 1,276 −1,542 9.83 12.49 2.66Blacktail shiner Cyprinella venusta 6,486 2,175 −4,311 22.62 21.28 −1.34Common carp Cyprinus carpio 80 47 −33 0.28 0.46 0.18Redfin shiner Lythurus umbratilis 3 29 26 0.01 0.28 0.27Mimic shiner Notropis volucellus 475 139 −336 1.66 1.36 −0.3Bullhead minnow Pimephales vigilax 1,279 400 −879 4.46 3.91 −0.55
Fundulidae Blackstripe topminnow Fundulus notatus 439 36 −403 1.53 0.35 −1.18Ictaluridae Yellow bullhead Ameiurus natalis 199 179 −20 0.69 1.75 1.06
Channel catfish Ictalurus punctatus 176 595 419 0.61 5.82 5.21Flathead catfish Pylodictis olivaris 9 64 55 0.03 0.63 0.6
Lepisosteidae Longnose gar Lepisosteus osseus 50 8 −42 0.17 0.08 −0.09Moronidae White bass Morone chrysops 17 13 −4 0.06 0.13 0.07Percidae Orangethroat darter Etheostoma spectabile 228 167 −61 0.80 1.63 0.83
Bigscale logperch Percina macrolepida 2 14 12 0.01 0.14 0.13Dusky darter Percina sciera 12 19 7 0.04 0.19 0.15
Poeciliidae Western mosquitofish Gambusia affinis 7,040 387 −6,653 24.55 3.79 −20.76Sciaenidae Freshwater drum Aplodinotus grunniens 4 6 2 0.01 0.06 0.05All 28,677 10,220 −18,457
abiotic conditions associated with the temporary disconnectionof stream pools. Blackstripe topminnow have similar body mor-phology and body size and exhibit an opportunistic life historystrategy as well. The physical and behavioral adaptations ofthese species allow them to persist in perennial pools such asthe ones present in the 2006 DC group. In addition, the smallsize of both these fishes allows them to stay in very shallowwater, where they avoid predation by larger-bodied fishes thatare unable to access these shallow areas.
Stable streamflow conditions may favor the growth and de-velopment of large-bodied catfish species, but extreme springand summer high flows (2007) trigger high recruitment anddispersal events (Figure 6). This represents an intermediate be-
tween equilibrium and periodic life history strategies, and weobserved evidence of enhanced recruitment associated with highflows in 2007.
Flathead catfish and channel catfish were both significantindicators for 2007 (Table 5). This suggests that the postfloodhydrologic conditions of the streams in 2007 were the primarydetermining factor of fish community composition independentof instream connectivity classification. These fishes are primar-ily lentic or large-river species found in large lakes and reser-voirs, although channel catfish are heavily stocked in farm pondsas well; some of the collected individuals may have washed outinto our streams from these upstream source areas in 2007. Inlotic habitats, the channel catfish occupies deeper habitats in
Dow
nloa
ded
by [
Uni
vers
ity o
f N
ew H
amps
hire
] at
10:
33 1
4 M
arch
201
3
1012 STANLEY ET AL.
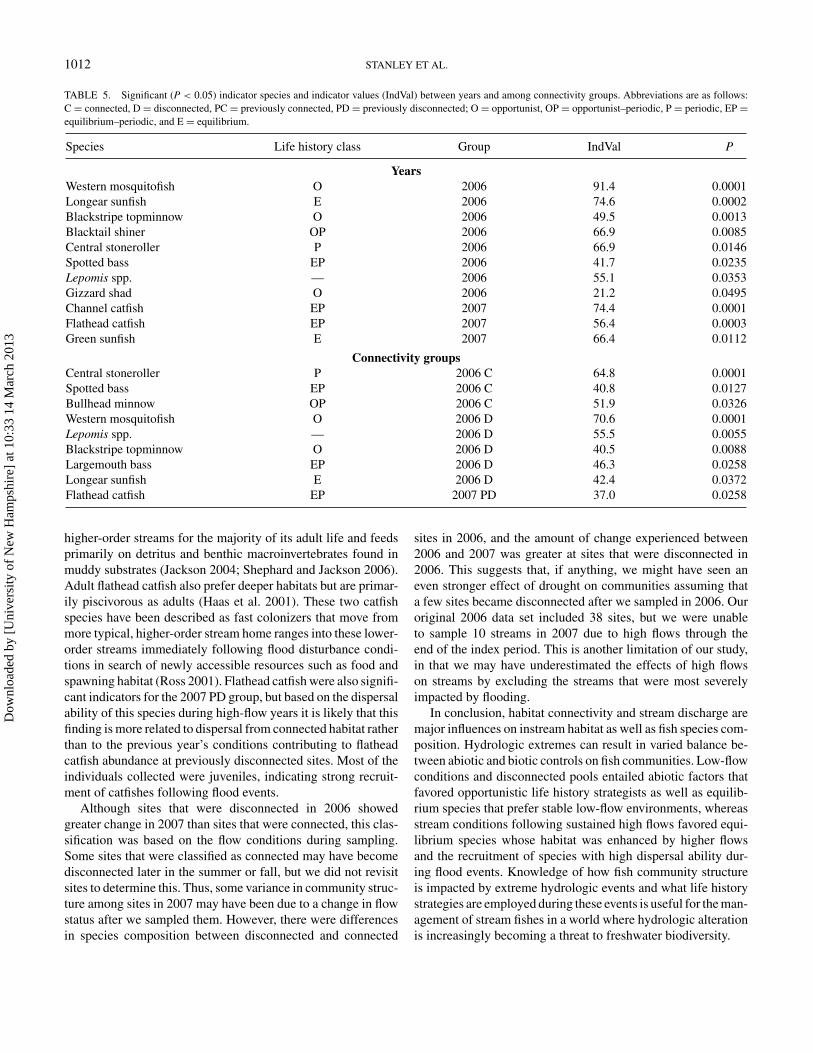
TABLE 5. Significant (P < 0.05) indicator species and indicator values (IndVal) between years and among connectivity groups. Abbreviations are as follows:C = connected, D = disconnected, PC = previously connected, PD = previously disconnected; O = opportunist, OP = opportunist–periodic, P = periodic, EP =equilibrium–periodic, and E = equilibrium.
Species Life history class Group IndVal P
YearsWestern mosquitofish O 2006 91.4 0.0001Longear sunfish E 2006 74.6 0.0002Blackstripe topminnow O 2006 49.5 0.0013Blacktail shiner OP 2006 66.9 0.0085Central stoneroller P 2006 66.9 0.0146Spotted bass EP 2006 41.7 0.0235Lepomis spp. — 2006 55.1 0.0353Gizzard shad O 2006 21.2 0.0495Channel catfish EP 2007 74.4 0.0001Flathead catfish EP 2007 56.4 0.0003Green sunfish E 2007 66.4 0.0112
Connectivity groupsCentral stoneroller P 2006 C 64.8 0.0001Spotted bass EP 2006 C 40.8 0.0127Bullhead minnow OP 2006 C 51.9 0.0326Western mosquitofish O 2006 D 70.6 0.0001Lepomis spp. — 2006 D 55.5 0.0055Blackstripe topminnow O 2006 D 40.5 0.0088Largemouth bass EP 2006 D 46.3 0.0258Longear sunfish E 2006 D 42.4 0.0372Flathead catfish EP 2007 PD 37.0 0.0258
higher-order streams for the majority of its adult life and feedsprimarily on detritus and benthic macroinvertebrates found inmuddy substrates (Jackson 2004; Shephard and Jackson 2006).Adult flathead catfish also prefer deeper habitats but are primar-ily piscivorous as adults (Haas et al. 2001). These two catfishspecies have been described as fast colonizers that move frommore typical, higher-order stream home ranges into these lower-order streams immediately following flood disturbance condi-tions in search of newly accessible resources such as food andspawning habitat (Ross 2001). Flathead catfish were also signifi-cant indicators for the 2007 PD group, but based on the dispersalability of this species during high-flow years it is likely that thisfinding is more related to dispersal from connected habitat ratherthan to the previous year’s conditions contributing to flatheadcatfish abundance at previously disconnected sites. Most of theindividuals collected were juveniles, indicating strong recruit-ment of catfishes following flood events.
Although sites that were disconnected in 2006 showedgreater change in 2007 than sites that were connected, this clas-sification was based on the flow conditions during sampling.Some sites that were classified as connected may have becomedisconnected later in the summer or fall, but we did not revisitsites to determine this. Thus, some variance in community struc-ture among sites in 2007 may have been due to a change in flowstatus after we sampled them. However, there were differencesin species composition between disconnected and connected
sites in 2006, and the amount of change experienced between2006 and 2007 was greater at sites that were disconnected in2006. This suggests that, if anything, we might have seen aneven stronger effect of drought on communities assuming thata few sites became disconnected after we sampled in 2006. Ouroriginal 2006 data set included 38 sites, but we were unableto sample 10 streams in 2007 due to high flows through theend of the index period. This is another limitation of our study,in that we may have underestimated the effects of high flowson streams by excluding the streams that were most severelyimpacted by flooding.
In conclusion, habitat connectivity and stream discharge aremajor influences on instream habitat as well as fish species com-position. Hydrologic extremes can result in varied balance be-tween abiotic and biotic controls on fish communities. Low-flowconditions and disconnected pools entailed abiotic factors thatfavored opportunistic life history strategists as well as equilib-rium species that prefer stable low-flow environments, whereasstream conditions following sustained high flows favored equi-librium species whose habitat was enhanced by higher flowsand the recruitment of species with high dispersal ability dur-ing flood events. Knowledge of how fish community structureis impacted by extreme hydrologic events and what life historystrategies are employed during these events is useful for the man-agement of stream fishes in a world where hydrologic alterationis increasingly becoming a threat to freshwater biodiversity.
Dow
nloa
ded
by [
Uni
vers
ity o
f N
ew H
amps
hire
] at
10:
33 1
4 M
arch
201
3
FISH COMMUNITY STRUCTURE 1013
ACKNOWLEDGMENTSThis study was funded by a contract from the Texas Commis-
sion on Environmental Quality to K. Winemiller and R. King(contract 582-6-80304). We especially thank M. Fisher and G.Easley for providing logistical support. The Texas Parks andWildlife Department provided collecting permits, and TexasAgrilife Research and Baylor University gave administrativesupport. We thank J. Grimm, D. Lang, A. Flores, S. Sumpaon-goen, and J. Back for field assistance and three anonymousreviewers for comments that helped improve an earlier draft.
REFERENCESAllan, J. D. 1995. Stream ecology: structure and function of running waters.
Kluwer Academic Publishers, Dordrecht, The Netherlands.Anderson, M. J. 2006. Distance-based tests for homogeneity of multivariate
dispersions. Biometrics 62:245–253.Anderson, M. J., K. E. Ellingsen, and B. H. McArdle. 2006. Multivariate dis-
persion as a measure of beta diversity. Ecology Letters 9:683–693.Clarke, K. R. 1993. Non-parametric multivariate analyses of changes in com-
munity structure. Australian Journal of Ecology 18:117–143.Dauwalter, D. C., and W. L. Fisher. 2007. Spawning chronology, nest site
selection and nest success of smallmouth bass during benign streamflowconditions. American Midland Naturalist 158:60–78.
Dufrene, M., and P. Legendre. 1997. Species assemblages and indicator species:the need for a flexible asymmetrical approach. Ecological Monographs67:345–366.
Echelle, A. A., A. F. Echelle, and L. G. Hill. 1972. Interspecific interac-tions and limiting factors of abundance and distribution in the Red Riverpupfish, Cyprinodon rubrofluviatilis. American Midland Naturalist 88:109–130.
Faith, D. P., and R. H. Norris. 1989. Correlation of environmental variableswith patterns of distribution and abundance of common and rare fresh-watermacroinvertebrates. Biological Conservation 50:77–98.
Fausch, K. D., and R. G. Bramblett. 1991. Disturbance and fish communities inintermittent tributaries of a western Great Plains river. Copeia 1991:659–674.
Griffith, G. E., S. A. Bryce, J. M. Omernik, J. A. Comstock, A. C. Rogers, B.Harrison, S. L. Hatch, and D. Bezanson. 2004. Ecoregions of Texas. U.S.Geological Survey, Reston, Virginia.
Haas, J. J., L. A. Jahn, and R. Hilsabeck. 2001. Diet of introduced flatheadcatfish (Pylodictus olivarus) in an Illinois reservoir. Journal of FreshwaterEcology 16:551–555.
Herbert, M. E., and F. P. Gelwick. 2003. Spatial variation of headwater fishassemblages explained by hydrologic variability and upstream effects of im-poundment. Copeia 2003:273–284.
Hoeinghaus, D. J., K. O. Winemiller, and J. S. Birnbaum. 2007. Local andregional determinants of stream fish assemblage structure: inferences basedon taxonomic vs. functional groups. Journal of Biogeography 34:324–338.
Hubbs, C., R. J. Edwards, and G. P. Garrett. 2008. An annotated checklist of thefreshwater fishes of Texas, with keys to identification of species, 2nd edition.Texas Academy of Science, Plainville.
Jackson, D. C. 2004. Natural history and fisheries: biology and culture of channelcatfish. Elsevier, Amsterdam.
Jennings, M. J., and D. P. Philipp. 1994. Biotic and abiotic factors affectingsurvival of early life history intervals of a stream-dwelling sunfish. Environ-mental Biology of Fishes 39:153–159.
Matthews, W. J., and J. T. Styron Jr. 1981. Tolerance of headwater vs. main-stream fishes for abrupt physiochemical changes. American Midland Natu-ralist 105:149–158.
McCune, B., and J. B. Grace. 2002. Analysis of ecological communities. MjMSoftware Designs, Gleneden Beach, Oregon.
McCune, B., and M. J. Medford. 2006. PC-ORD: multivariate analysis of eco-logical data, version 5. MjM Software Designs, Gleneden Beach, Oregon.
Meador, M. R., and W. J. Matthews. 1992. Spatial and temporal patterns infish assemblage structure of an intermittent Texas stream. American MidlandNaturalist 127:106–114.
Mielke, P. W., Jr. 1984. Meteorological applications of permutation techniquesbased on distance functions. Pages 813–830 in P. R. Krishnaiah and P. K. Seneditors. Handbook of statistics. Elsevier, Amsterdam.
NOAA (National Oceanic and Atmospheric Administration). 2008. Na-tional climatic data center archives. NOAA, Washington, D.C. Available:www.ncdc.noaa.gov/oa/ncdc.html. (November 2008).
Noltie, D. B., and M. H. A. Keenleyside. 1986. Correlates of reproductivesuccess in stream dwelling male rock bass, Ambloplites rupestris (Centrar-chidae). Environmental Biology of Fishes 17:61–70.
Oksanen, J., F. G. Blanchet, R. Kindt, P. Legendre, R. B. O’Hara, G. L. Simp-son, P. Solymos, M. Henry, H. Stevens, and H. Wagner. 2011. Vegan: com-munity ecology package, R package version 1.17-9. Available: CRAN.R-project.org/package = vegan. (February 2011).
Olden, J. D., and M. J. Kennard. 2010. Intercontinental comparison of fish lifehistory strategies along a gradient of hydrologic variability. Pages 83–107in K. B. Gido and D. A. Jackson, editors. Community ecology of streamfishes: concepts, approaches, and techniques. American Fisheries Society,Symposium 73, Bethesda, Maryland.
Ostrand, K. G., and G. R. Wilde. 2002. Seasonal and spatial variation in a prairiestream-fish assemblage. Ecology of Freshwater Fish 11:137–149.
Pease, A. A., J. M. Taylor, K. O. Winemiller, and R. S. King. 2011. Multi-scale environmental influences on fish assemblage structure in central Texasstreams. Transactions of the American Fisheries Society 140:1409–1427.
Poff, N. L., and J. D. Allan. 1995. Functional organization of stream fish assem-blages in relation to hydrological variability. Ecology 76:606–627.
Pyke, G. H. 2005. A review of the biology of Gambusia affinis and G. holbrooki.Reviews in Fish Biology and Fisheries 15:339–365.
Richter, B. D., R. Mathews, D. L. Harrison, and R. Wigington. 2003. Ecolog-ically sustainable water management: managing river flows for ecologicalintegrity. Ecological Applications 13:206–224.
Ross, S. T. 2001. Inland fishes of Mississippi. Mississippi Department ofWildlife, Fisheries and Parks, Jackson.
Shephard, S., and D. C. Jackson. 2006. Difference in channel catfish growthamong Mississippi stream basins. Transactions of the American FisheriesSociety 135:1224–1229.
Spranza, J. J., and E. H. Stanley. 2000. Condition, growth, and reproduc-tive styles of fishes exposed to different environmental regimes in a prairiedrainage. Environmental Biology of Fishes 59:99–109.
Taylor, C. M. 1997. Fish species richness and incidence patterns in isolatedand connected stream pools: effects of pool volume and spatial position.Oecologia 110:560–566.
Taylor, C. M., M. R. Winston, and W. J. Matthews. 1993. Fish species-environment and abundance relationships in a Great Plains river system.Ecography 16:16–23.
TCEQ (Texas Commission on Environmental Quality). 2003. Surface waterquality monitoring procedures, volume 2: methods for collecting and ana-lyzing biological assemblage and habitat data. TCEQ, Surface Water QualityMonitoring Program, Austin.
Thomas, C., T. H. Bonner, and B. G. Whiteside. 2007. Freshwater fishes ofTexas: a field guide. Texas A&M University Press, College Station.
Wilde, G. R., and K. G. Ostrand. 1999. Changes in the fish assemblage ofan intermittent prairie stream upstream from a Texas impoundment. TexasJournal of Science 51:203–210.
Winemiller, K. O. 1989. Patterns of variation in life history among South Amer-ican fishes in seasonal environments. Oecologia 81:225–241.
Winemiller, K. O., and K. A. Rose. 1992. Patterns of life-history diver-sification in North American fishes: implications for population regu-lation. Canadian Journal of Fisheries and Aquatic Sciences 49:2196–2218.
Dow
nloa
ded
by [
Uni
vers
ity o
f N
ew H
amps
hire
] at
10:
33 1
4 M
arch
201
3
1014 STANLEY ET AL.
APPENDIX: DETAILS AS TO SITES AND FISH SPECIES SAMPLED
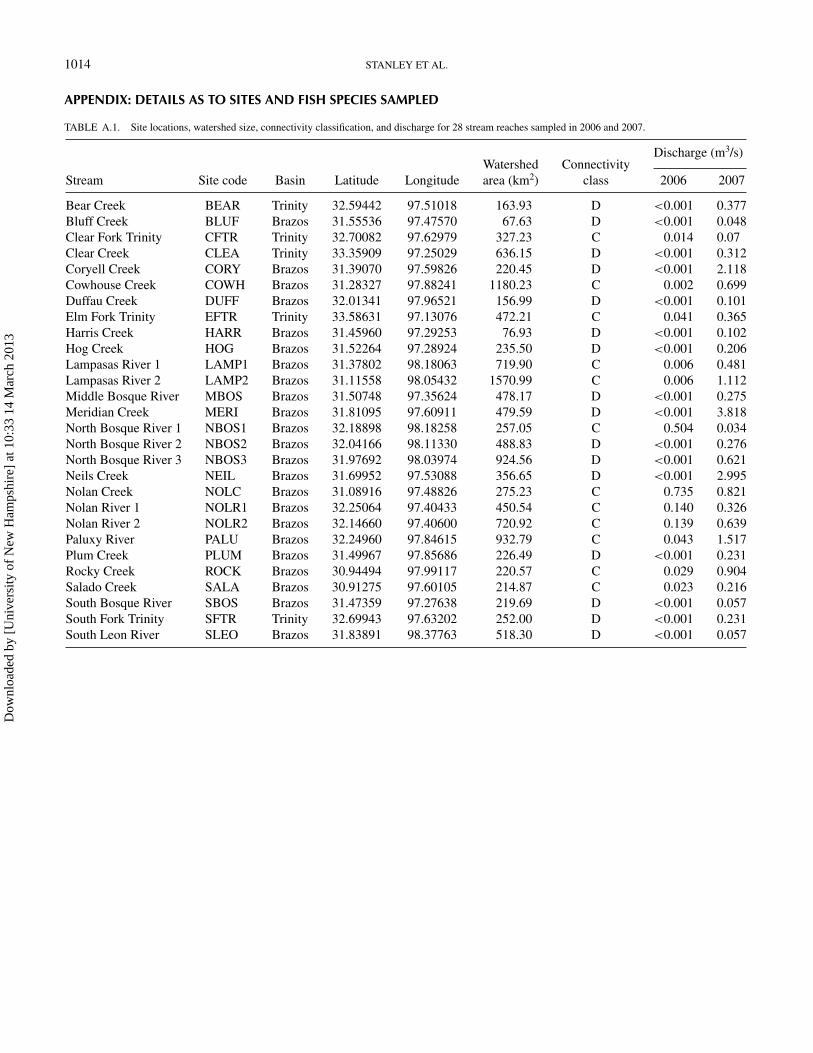
TABLE A.1. Site locations, watershed size, connectivity classification, and discharge for 28 stream reaches sampled in 2006 and 2007.
Discharge (m3/s)Watershed Connectivity
Stream Site code Basin Latitude Longitude area (km2) class 2006 2007
Bear Creek BEAR Trinity 32.59442 97.51018 163.93 D <0.001 0.377Bluff Creek BLUF Brazos 31.55536 97.47570 67.63 D <0.001 0.048Clear Fork Trinity CFTR Trinity 32.70082 97.62979 327.23 C 0.014 0.07Clear Creek CLEA Trinity 33.35909 97.25029 636.15 D <0.001 0.312Coryell Creek CORY Brazos 31.39070 97.59826 220.45 D <0.001 2.118Cowhouse Creek COWH Brazos 31.28327 97.88241 1180.23 C 0.002 0.699Duffau Creek DUFF Brazos 32.01341 97.96521 156.99 D <0.001 0.101Elm Fork Trinity EFTR Trinity 33.58631 97.13076 472.21 C 0.041 0.365Harris Creek HARR Brazos 31.45960 97.29253 76.93 D <0.001 0.102Hog Creek HOG Brazos 31.52264 97.28924 235.50 D <0.001 0.206Lampasas River 1 LAMP1 Brazos 31.37802 98.18063 719.90 C 0.006 0.481Lampasas River 2 LAMP2 Brazos 31.11558 98.05432 1570.99 C 0.006 1.112Middle Bosque River MBOS Brazos 31.50748 97.35624 478.17 D <0.001 0.275Meridian Creek MERI Brazos 31.81095 97.60911 479.59 D <0.001 3.818North Bosque River 1 NBOS1 Brazos 32.18898 98.18258 257.05 C 0.504 0.034North Bosque River 2 NBOS2 Brazos 32.04166 98.11330 488.83 D <0.001 0.276North Bosque River 3 NBOS3 Brazos 31.97692 98.03974 924.56 D <0.001 0.621Neils Creek NEIL Brazos 31.69952 97.53088 356.65 D <0.001 2.995Nolan Creek NOLC Brazos 31.08916 97.48826 275.23 C 0.735 0.821Nolan River 1 NOLR1 Brazos 32.25064 97.40433 450.54 C 0.140 0.326Nolan River 2 NOLR2 Brazos 32.14660 97.40600 720.92 C 0.139 0.639Paluxy River PALU Brazos 32.24960 97.84615 932.79 C 0.043 1.517Plum Creek PLUM Brazos 31.49967 97.85686 226.49 D <0.001 0.231Rocky Creek ROCK Brazos 30.94494 97.99117 220.57 C 0.029 0.904Salado Creek SALA Brazos 30.91275 97.60105 214.87 C 0.023 0.216South Bosque River SBOS Brazos 31.47359 97.27638 219.69 D <0.001 0.057South Fork Trinity SFTR Trinity 32.69943 97.63202 252.00 D <0.001 0.231South Leon River SLEO Brazos 31.83891 98.37763 518.30 D <0.001 0.057
Dow
nloa
ded
by [
Uni
vers
ity o
f N
ew H
amps
hire
] at
10:
33 1
4 M
arch
201
3
FISH COMMUNITY STRUCTURE 1015
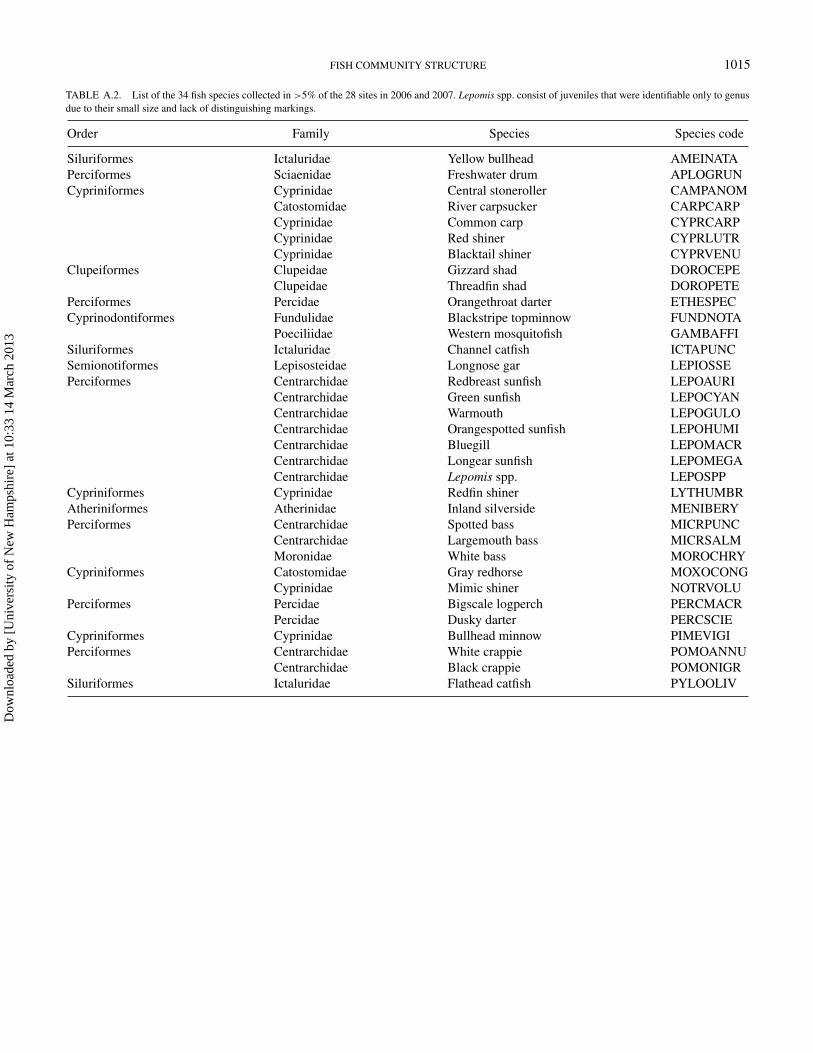
TABLE A.2. List of the 34 fish species collected in >5% of the 28 sites in 2006 and 2007. Lepomis spp. consist of juveniles that were identifiable only to genusdue to their small size and lack of distinguishing markings.
Order Family Species Species code
Siluriformes Ictaluridae Yellow bullhead AMEINATAPerciformes Sciaenidae Freshwater drum APLOGRUNCypriniformes Cyprinidae Central stoneroller CAMPANOM
Catostomidae River carpsucker CARPCARPCyprinidae Common carp CYPRCARPCyprinidae Red shiner CYPRLUTRCyprinidae Blacktail shiner CYPRVENU
Clupeiformes Clupeidae Gizzard shad DOROCEPEClupeidae Threadfin shad DOROPETE
Perciformes Percidae Orangethroat darter ETHESPECCyprinodontiformes Fundulidae Blackstripe topminnow FUNDNOTA
Poeciliidae Western mosquitofish GAMBAFFISiluriformes Ictaluridae Channel catfish ICTAPUNCSemionotiformes Lepisosteidae Longnose gar LEPIOSSEPerciformes Centrarchidae Redbreast sunfish LEPOAURI
Centrarchidae Green sunfish LEPOCYANCentrarchidae Warmouth LEPOGULOCentrarchidae Orangespotted sunfish LEPOHUMICentrarchidae Bluegill LEPOMACRCentrarchidae Longear sunfish LEPOMEGACentrarchidae Lepomis spp. LEPOSPP
Cypriniformes Cyprinidae Redfin shiner LYTHUMBRAtheriniformes Atherinidae Inland silverside MENIBERYPerciformes Centrarchidae Spotted bass MICRPUNC
Centrarchidae Largemouth bass MICRSALMMoronidae White bass MOROCHRY
Cypriniformes Catostomidae Gray redhorse MOXOCONGCyprinidae Mimic shiner NOTRVOLU
Perciformes Percidae Bigscale logperch PERCMACRPercidae Dusky darter PERCSCIE
Cypriniformes Cyprinidae Bullhead minnow PIMEVIGIPerciformes Centrarchidae White crappie POMOANNU
Centrarchidae Black crappie POMONIGRSiluriformes Ictaluridae Flathead catfish PYLOOLIV
Dow
nloa
ded
by [
Uni
vers
ity o
f N
ew H
amps
hire
] at
10:
33 1
4 M
arch
201
3