Embed Size (px)
Citation preview
Vol.:(0123456789)1 3
Sustainable Water Resources Management (2018) 4:361–369 https://doi.org/10.1007/s40899-017-0211-7
ORIGINAL ARTICLE
Coupled surface water and groundwater model to design managed aquifer recharge for the valley of Santo Domingo, B.C.S., Mexico
Jobst Wurl1 · Miguel Angel Imaz‑Lamadrid1
Received: 27 September 2016 / Accepted: 18 December 2017 / Published online: 22 December 2017 © Springer International Publishing AG, part of Springer Nature 2017
AbstractThe Valley of Santo Domingo represents the most important agricultural region in the state of Baja California Sur. The uncontrolled extraction of groundwater, and especially the over-exploitation of the Santo Domingo aquifer from 1957 on, has caused modifications to the natural flow system and induced a lateral inflow of seawater from the Pacific coast. As a result, the groundwater quality in the Santo Domingo Irrigation District (066) is deteriorating. Seawater intrusion and irrigation return water, combined with the mobilization of deeper groundwater, have been identified as important sources of salinization. Due to a reduction of the permitted extraction volume (to only one-third), an equality between discharge and recharge volume was achieved from 2003 on, but the deterioration of the groundwater quality still continues. To plan different scenarios of artificial recharge, a regional groundwater model was created, using the Modflow2000 software. The observed groundwater levels (from 1996 on) were used to calibrate the groundwater flow model, taking into account the extraction rates of more than active 500 wells. To simulate infiltration of surface water, runoff data were introduced to the Streamflow package, based on calculations from an HEC-1 model. In the Valley of Santo Domingo, the natural recharge and infiltration of irrigation return water generate an average annual recharge of 188 million m3. As a first step toward an aquifer management plan, results from hydrological and hydraulic models were incorporated into the regional groundwater flow model, to plan scenarios of additional artificial recharge facilities that would prevent deepening of the cone of depression. The elaborated Water Resources Management plan proposes the capture of an annual volume of 30 million m3 of surface water from the Sierra de la Giganta Mountains, which could be accumulated in four water retention dams. The captured surface water then would flow to the four smaller recharge dams with a total storage volume of about 2 million m3, located downstream, where it would recharge the aquifer. As the model indicates, within a period of 3 months, an annual volume of at least 21.5 million m3 of surface water could be infiltrated via the riverbeds and recharge dams. Although this volume may not be enough to prevent saline intrusion from the coast line, it would stop the water level decline in the center of the cone of depression and improve groundwater quality.
Keywords Arid climate · Aquifer over-exploitation · Artificial recharge
AbbreviationsCNA Mexican National Water CommissionINEGI Mexican National Institute of Statistics and
GeographyCONAGUA Mexican National Water CommissionSTR-1 Stream-flow routing package
Introduction
The Valley of Santo Domingo is located in the middle of the Mexican state of Baja California Sur in the municipal-ity of Comondú. The climate is characterized by very arid conditions (warm climate at the coast to temperate climate in the Sierra La Giganta mountain range), with the average monthly temperature ranging from a maximum of 43.3 °C to a low of 19.8 °C. The predominant natural vegetation in the arid and semi-arid zone is sarcocaulescent scrubland. The average annual rainfall reaches only 150 mm (the range of precipitation is between 50 and 300 mm/year), of which 30% occurs in the winter time and 70% during summer (CNA 2002). In the summer season, runoff is generated frequently
This article is part of the special issue on Managed Aquifer Recharge.
* Jobst Wurl [email protected]
1 Universidad Autónoma de Baja California Sur, La Paz, BCS, Mexico
362 Sustainable Water Resources Management (2018) 4:361–369
1 3
from the rainfall caused mainly by tropical cyclones; the hurricane season begins in mid-May and ends in November (Wurl and Martínez Gutiérrez 2006).
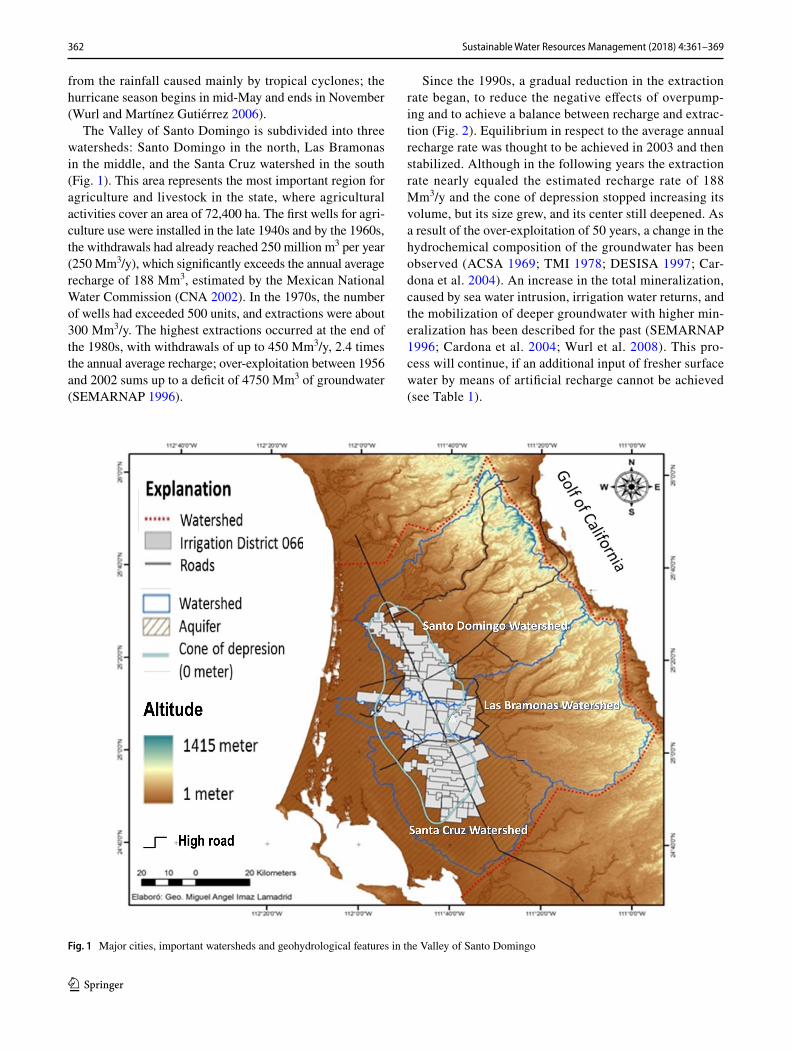
The Valley of Santo Domingo is subdivided into three watersheds: Santo Domingo in the north, Las Bramonas in the middle, and the Santa Cruz watershed in the south (Fig. 1). This area represents the most important region for agriculture and livestock in the state, where agricultural activities cover an area of 72,400 ha. The first wells for agri-culture use were installed in the late 1940s and by the 1960s, the withdrawals had already reached 250 million m3 per year (250 Mm3/y), which significantly exceeds the annual average recharge of 188 Mm3, estimated by the Mexican National Water Commission (CNA 2002). In the 1970s, the number of wells had exceeded 500 units, and extractions were about 300 Mm3/y. The highest extractions occurred at the end of the 1980s, with withdrawals of up to 450 Mm3/y, 2.4 times the annual average recharge; over-exploitation between 1956 and 2002 sums up to a deficit of 4750 Mm3 of groundwater (SEMARNAP 1996).
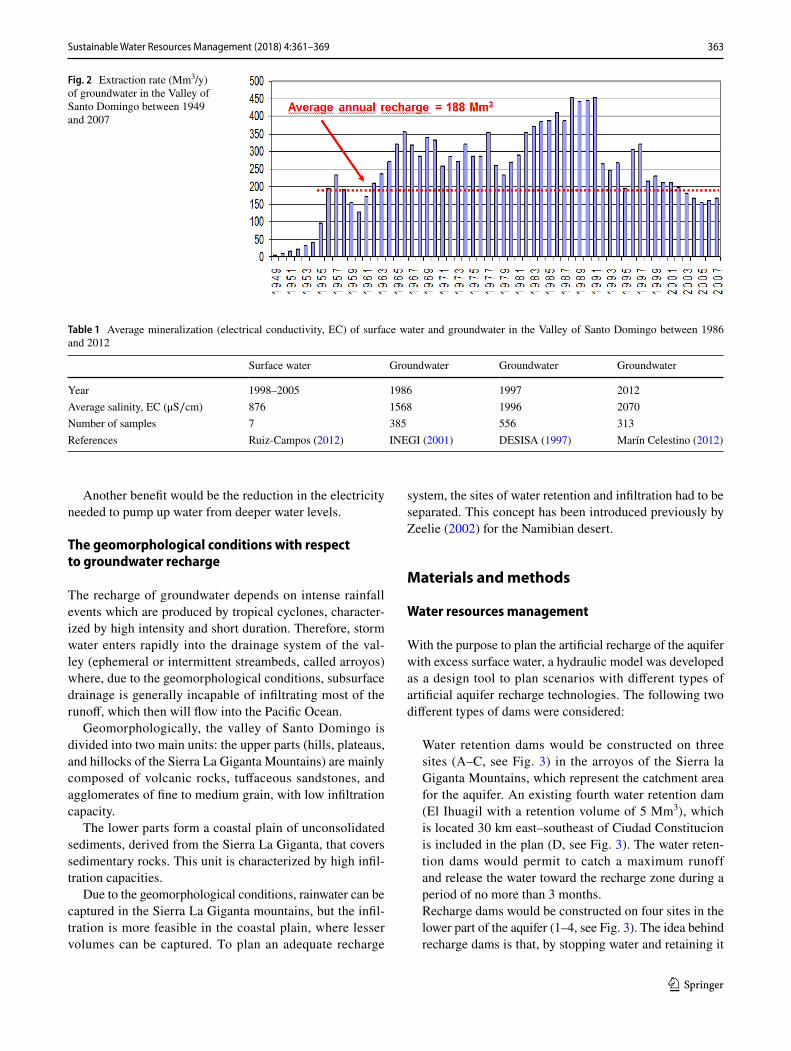
Since the 1990s, a gradual reduction in the extraction rate began, to reduce the negative effects of overpump-ing and to achieve a balance between recharge and extrac-tion (Fig. 2). Equilibrium in respect to the average annual recharge rate was thought to be achieved in 2003 and then stabilized. Although in the following years the extraction rate nearly equaled the estimated recharge rate of 188 Mm3/y and the cone of depression stopped increasing its volume, but its size grew, and its center still deepened. As a result of the over-exploitation of 50 years, a change in the hydrochemical composition of the groundwater has been observed (ACSA 1969; TMI 1978; DESISA 1997; Car-dona et al. 2004). An increase in the total mineralization, caused by sea water intrusion, irrigation water returns, and the mobilization of deeper groundwater with higher min-eralization has been described for the past (SEMARNAP 1996; Cardona et al. 2004; Wurl et al. 2008). This pro-cess will continue, if an additional input of fresher surface water by means of artificial recharge cannot be achieved (see Table 1).
Fig. 1 Major cities, important watersheds and geohydrological features in the Valley of Santo Domingo
363Sustainable Water Resources Management (2018) 4:361–369
1 3
Another benefit would be the reduction in the electricity needed to pump up water from deeper water levels.
The geomorphological conditions with respect to groundwater recharge
The recharge of groundwater depends on intense rainfall events which are produced by tropical cyclones, character-ized by high intensity and short duration. Therefore, storm water enters rapidly into the drainage system of the val-ley (ephemeral or intermittent streambeds, called arroyos) where, due to the geomorphological conditions, subsurface drainage is generally incapable of infiltrating most of the runoff, which then will flow into the Pacific Ocean.
Geomorphologically, the valley of Santo Domingo is divided into two main units: the upper parts (hills, plateaus, and hillocks of the Sierra La Giganta Mountains) are mainly composed of volcanic rocks, tuffaceous sandstones, and agglomerates of fine to medium grain, with low infiltration capacity.
The lower parts form a coastal plain of unconsolidated sediments, derived from the Sierra La Giganta, that covers sedimentary rocks. This unit is characterized by high infil-tration capacities.
Due to the geomorphological conditions, rainwater can be captured in the Sierra La Giganta mountains, but the infil-tration is more feasible in the coastal plain, where lesser volumes can be captured. To plan an adequate recharge
system, the sites of water retention and infiltration had to be separated. This concept has been introduced previously by Zeelie (2002) for the Namibian desert.
Materials and methods
Water resources management
With the purpose to plan the artificial recharge of the aquifer with excess surface water, a hydraulic model was developed as a design tool to plan scenarios with different types of artificial aquifer recharge technologies. The following two different types of dams were considered:
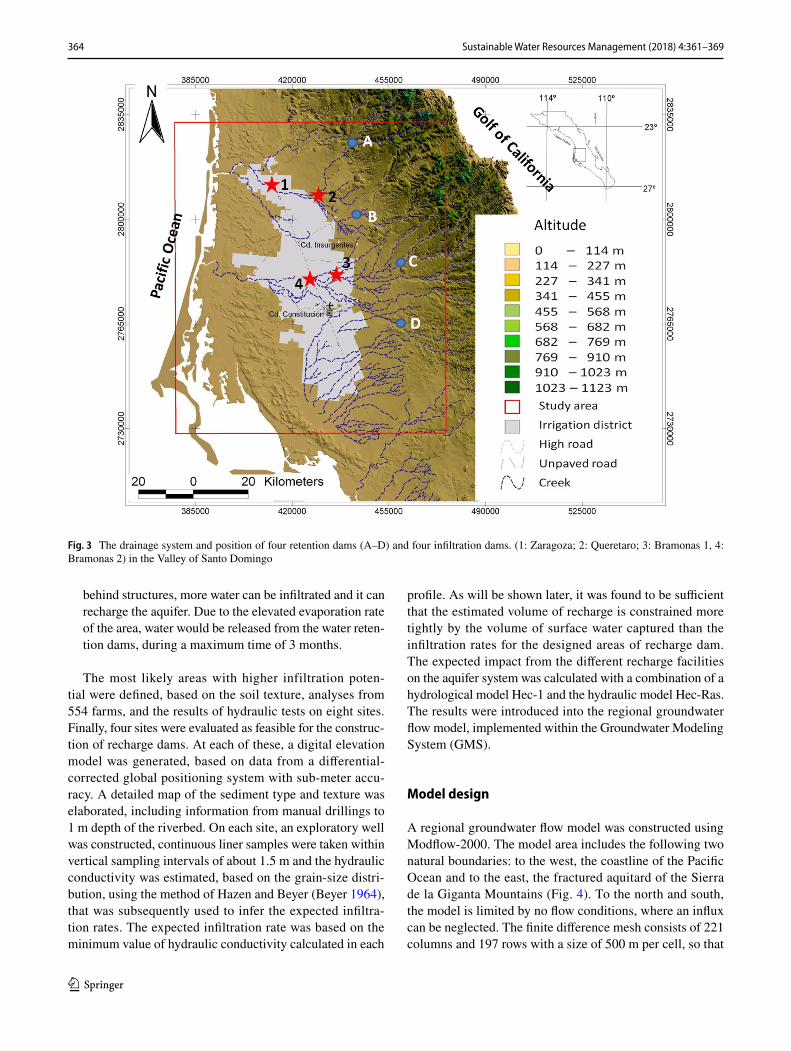
Water retention dams would be constructed on three sites (A–C, see Fig. 3) in the arroyos of the Sierra la Giganta Mountains, which represent the catchment area for the aquifer. An existing fourth water retention dam (El Ihuagil with a retention volume of 5 Mm3), which is located 30 km east–southeast of Ciudad Constitucion is included in the plan (D, see Fig. 3). The water reten-tion dams would permit to catch a maximum runoff and release the water toward the recharge zone during a period of no more than 3 months.Recharge dams would be constructed on four sites in the lower part of the aquifer (1–4, see Fig. 3). The idea behind recharge dams is that, by stopping water and retaining it
Fig. 2 Extraction rate (Mm3/y) of groundwater in the Valley of Santo Domingo between 1949 and 2007
Table 1 Average mineralization (electrical conductivity, EC) of surface water and groundwater in the Valley of Santo Domingo between 1986 and 2012
Surface water Groundwater Groundwater Groundwater
Year 1998–2005 1986 1997 2012Average salinity, EC ( μS∕cm) 876 1568 1996 2070Number of samples 7 385 556 313References Ruiz-Campos (2012) INEGI (2001) DESISA (1997) Marín Celestino (2012)
364 Sustainable Water Resources Management (2018) 4:361–369
1 3
behind structures, more water can be infiltrated and it can recharge the aquifer. Due to the elevated evaporation rate of the area, water would be released from the water reten-tion dams, during a maximum time of 3 months.
The most likely areas with higher infiltration poten-tial were defined, based on the soil texture, analyses from 554 farms, and the results of hydraulic tests on eight sites. Finally, four sites were evaluated as feasible for the construc-tion of recharge dams. At each of these, a digital elevation model was generated, based on data from a differential-corrected global positioning system with sub-meter accu-racy. A detailed map of the sediment type and texture was elaborated, including information from manual drillings to 1 m depth of the riverbed. On each site, an exploratory well was constructed, continuous liner samples were taken within vertical sampling intervals of about 1.5 m and the hydraulic conductivity was estimated, based on the grain-size distri-bution, using the method of Hazen and Beyer (Beyer 1964), that was subsequently used to infer the expected infiltra-tion rates. The expected infiltration rate was based on the minimum value of hydraulic conductivity calculated in each
profile. As will be shown later, it was found to be sufficient that the estimated volume of recharge is constrained more tightly by the volume of surface water captured than the infiltration rates for the designed areas of recharge dam. The expected impact from the different recharge facilities on the aquifer system was calculated with a combination of a hydrological model Hec-1 and the hydraulic model Hec-Ras. The results were introduced into the regional groundwater flow model, implemented within the Groundwater Modeling System (GMS).
Model design
A regional groundwater flow model was constructed using Modflow-2000. The model area includes the following two natural boundaries: to the west, the coastline of the Pacific Ocean and to the east, the fractured aquitard of the Sierra de la Giganta Mountains (Fig. 4). To the north and south, the model is limited by no flow conditions, where an influx can be neglected. The finite difference mesh consists of 221 columns and 197 rows with a size of 500 m per cell, so that
Fig. 3 The drainage system and position of four retention dams (A–D) and four infiltration dams. (1: Zaragoza; 2: Queretaro; 3: Bramonas 1, 4: Bramonas 2) in the Valley of Santo Domingo

365Sustainable Water Resources Management (2018) 4:361–369
1 3
the model includes 43,537 cells and represents an area of 10,781 km2.
Two layers were taken into account: an upper layer, which represents an unconfined aquifer that consists of quaternary sediments and the deeper confined aquitard that consists of clayey sediments of low permeability which represent a hydraulic limit of the upper aquifer in the Valley of Santo Domingo. The top of the aquifer was recalculated from the Digital Elevation Model with a resolution of 30 m, obtained from INEGI (1996). The thickness of the aquifer was defined from bore logs and based on geologic cross-sections and the re-interpretation of resistivity soundings, documented in (SEMARNAP 1996).
Initial flow conditions
The natural flow conditions in the Valley of Santo Domingo (year 1949, before the installation of deep wells) were obtained from the model under steady state conditions and without extraction (see Fig. 5). The calculations under tran-sitory flow conditions (unsteady state) started from the year 1996, based on the documented hydraulic heads in SEMAR-NAT (1996).
Hydraulic conductivity, specific yield and specific storage
The hydraulic conductivity was calculated from the textural classification data of 554 sediment samples in the Irriga-tion District 066 in the Valley of Santo Domingo, applying the methodology from Shiozawa and Campbell (1991). The initial specific yield and specific storage were obtained from (SEMARNAP 1996).
Recharge
The average annual recharge of the aquifer in the Valley of Santo Domingo is 188 Mm3, of which 77% corresponds to natural infiltration; the remaining 23% are due to irrigation return flow (CNA 2002). Principally, the natural recharge results from four different processes, listed here in order of their importance: recharge from direct infiltration of rain-fall, recharge resulting from the infiltration of surface water in the arroyos after storm events, horizontal groundwater flow from the fractured aquifer of the Sierra de la Giganta, and seawater intrusion from the river mouths of the arroyos Santo Domingo and Las Bramonas into the aquifer. The run-off infiltrates partly into the ground, during or immediately after rain events by ephemeral streams, and recharges the aquifer. The streamflow package (STR-1) was used to simu-late this hydraulic inter-connection. The STR-1 package uses Darcy’s law and assumes a continuous stream flow from the stream surface to the aquifer and calculates the correspond-ing volume introduced into the aquifer (Prudic et al. 2004). The main drainage system was introduced into the ground-water model and via the streamflow module that results from synthetic hydrographs, calculated with the amount of surface water generated in the watershed of the Sierra La Giganta Mountains were calculated with the HEC-1 program taking in account different rainfall scenarios; the relation between precipitation and total runoff volume was reported from (SEMARNAP 1996).
Extractions
A total of 710 wells (with an average depth of 84.5 m and maximum depth of 220 m) and the corresponding extrac-tion rates were introduced into the model, taking in account
Fig. 4 East (A′)–West (A) hydrogeological cross-section of the Valley of Santo Domingo with the main aquifers and aquitards

366 Sustainable Water Resources Management (2018) 4:361–369
1 3
the variations between recharge and extraction, observed between 1996 (SEMARNAP 1996) and 2007. From 2008 on, we assumed near equilibrium conditions as indicated by CONAGUA (2015) for the future scenarios.
Time steps
1. The well head data, observed during the period of 1996 to 2007, were obtained from the National Water Com-mission CONAGUA to calibrate the model in transient mode. For each year, the model includes infiltration caused from runoff (obtained from the hydrological model and applied to the larger rain events) during a maximum of 10 days.
Calibration
In the calibration process, the hydraulic conductivity, spe-cific yield (unconfined first layer), and specific storage were adjusted to achieve the observed hydraulic head levels dur-ing the period 1996–2007 (final values see Figs. 6, 7). After the model calibration, different recharge scenarios were gen-erated, maintaining the same infiltration and extraction rates as in 2007, but applying different recharge techniques and volumes, based on the analysis of projected water demands.
The values for the specific yield, obtained after the cali-bration step, range 0.036 and 0.26, where the maximum
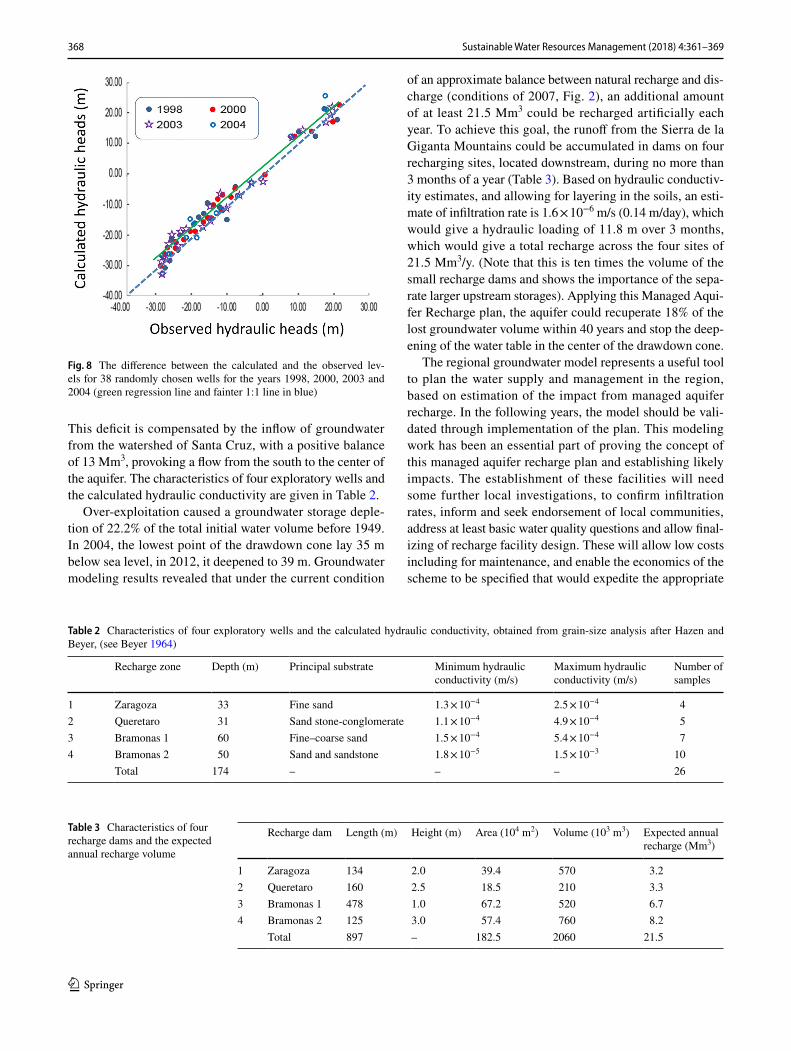
values correspond to the center of the Irrigation District 066 and the lowest values in the periphery. The final specific storage values range from 0.008 to 0.043 m−1. The differ-ence between the calculated and the observed levels for 38 randomly chosen wells for the years 1998, 2000, 2003 and 2004 are presented in Fig. 8.
Results and discussion
The results from the different scenarios provide information on the hydrogeological conditions of the Santo Domingo aquifer. Based on the regional groundwater model, it can be concluded that the total runoff, as a result of extreme floods, mainly generated after tropical cyclones, represents an additional source of water that can be infiltrated and used to recharge the aquifer. Statistically, one tropical cyclone is observed every year. The average rainfall over the Valley of Santo Domingo is 1.342 Mm3. Taking this value as 100%, the direct recharge represents 6%, the runoff is 7%, from which 2% infiltrates and 5% drain into the Pacific Ocean. The remaining 87% are lost by evapotranspiration. Another 37 Mm3 are received as inflow from the fractured aquifer of the Sierra de la Giganta Mountains.
Under actual flow conditions, the balance for the three watersheds, forming the aquifer, indicates that the water-shed Las Bramonas presents a deficit of 2.6 Mm3/y and the watershed Santo Domingo results in a deficit of 9.7 Mm3/y.
Fig. 5 The modeled water table before the installation of the Irrigation District 066 (in the year 1949) and under the conditions of 2007, with an equality between annual recharge and extraction

367Sustainable Water Resources Management (2018) 4:361–369
1 3
Fig. 6 The hydraulic conductivity in the model aquifer (Valley of Santo Domingo) after the calibration
Fig. 7 The specific yield of the model aquifer (Valley of Santo Domingo) after the calibration
368 Sustainable Water Resources Management (2018) 4:361–369
1 3
This deficit is compensated by the inflow of groundwater from the watershed of Santa Cruz, with a positive balance of 13 Mm3, provoking a flow from the south to the center of the aquifer. The characteristics of four exploratory wells and the calculated hydraulic conductivity are given in Table 2.
Over-exploitation caused a groundwater storage deple-tion of 22.2% of the total initial water volume before 1949. In 2004, the lowest point of the drawdown cone lay 35 m below sea level, in 2012, it deepened to 39 m. Groundwater modeling results revealed that under the current condition
of an approximate balance between natural recharge and dis-charge (conditions of 2007, Fig. 2), an additional amount of at least 21.5 Mm3 could be recharged artificially each year. To achieve this goal, the runoff from the Sierra de la Giganta Mountains could be accumulated in dams on four recharging sites, located downstream, during no more than 3 months of a year (Table 3). Based on hydraulic conductiv-ity estimates, and allowing for layering in the soils, an esti-mate of infiltration rate is 1.6 × 10⁻⁶ m/s (0.14 m/day), which would give a hydraulic loading of 11.8 m over 3 months, which would give a total recharge across the four sites of 21.5 Mm3/y. (Note that this is ten times the volume of the small recharge dams and shows the importance of the sepa-rate larger upstream storages). Applying this Managed Aqui-fer Recharge plan, the aquifer could recuperate 18% of the lost groundwater volume within 40 years and stop the deep-ening of the water table in the center of the drawdown cone.
The regional groundwater model represents a useful tool to plan the water supply and management in the region, based on estimation of the impact from managed aquifer recharge. In the following years, the model should be vali-dated through implementation of the plan. This modeling work has been an essential part of proving the concept of this managed aquifer recharge plan and establishing likely impacts. The establishment of these facilities will need some further local investigations, to confirm infiltration rates, inform and seek endorsement of local communities, address at least basic water quality questions and allow final-izing of recharge facility design. These will allow low costs including for maintenance, and enable the economics of the scheme to be specified that would expedite the appropriate
Fig. 8 The difference between the calculated and the observed lev-els for 38 randomly chosen wells for the years 1998, 2000, 2003 and 2004 (green regression line and fainter 1:1 line in blue)
Table 2 Characteristics of four exploratory wells and the calculated hydraulic conductivity, obtained from grain-size analysis after Hazen and Beyer, (see Beyer 1964)
Recharge zone Depth (m) Principal substrate Minimum hydraulic conductivity (m/s)
Maximum hydraulic conductivity (m/s)
Number of samples
1 Zaragoza 33 Fine sand 1.3 × 10⁻⁴ 2.5 × 10⁻⁴ 42 Queretaro 31 Sand stone-conglomerate 1.1 × 10⁻⁴ 4.9 × 10⁻⁴ 53 Bramonas 1 60 Fine–coarse sand 1.5 × 10⁻⁴ 5.4 × 10⁻⁴ 74 Bramonas 2 50 Sand and sandstone 1.8 × 10⁻⁵ 1.5 × 10⁻³ 10
Total 174 – – – 26
Table 3 Characteristics of four recharge dams and the expected annual recharge volume
Recharge dam Length (m) Height (m) Area (104 m2) Volume (103 m3) Expected annual recharge (Mm3)
1 Zaragoza 134 2.0 39.4 570 3.22 Queretaro 160 2.5 18.5 210 3.33 Bramonas 1 478 1.0 67.2 520 6.74 Bramonas 2 125 3.0 57.4 760 8.2
Total 897 – 182.5 2060 21.5

369Sustainable Water Resources Management (2018) 4:361–369
1 3
investment. The separation of water capture and infiltration facilities optimizes the recharge volume. The conditions in the study area are comparable to many watersheds in the northern part of Mexico and southwestern part of the United States, where the presented methodology can be adapted.
Conclusions
The geomorphological conditions in the study area allow the retention of higher water volumes only in the Sierra la Giganta mountains, where there is only low potential to infil-trate the water into the main aquifer. But, as indicated from the groundwater model, a combination of separated sites for water retention and infiltration allows capturing and infil-trating an additional volume on average of 21.5 millon m3 surface water per year. This volume would be sufficient to stop the deepening of the water table in the center of the cone of depression and to reduce the elevated salinity in the center of the Irrigation District 066. On the other hand, the model shows that it will slow, but not stop the growth of this cone of depression towards the coast. To reduce sea water ingress in the future, different types of interventions will be necessary and the elaborated groundwater model can serve as a main tool for their planning.
Acknowledgements This study was conducted partly with the financial support from CONAGUA (Grant no. DLBCS-UABCS 20080715); we thank the CONAGUA for the support received during the realization of this study and SEMARNAT-CONACyT 249423. We also like to thank Peter Dillon and the anonymous reviewers for their observations which helped to improve the text.
Author contributions JW and MIL designed the model; MIL per-formed the model calculation, meanwhile JW wrote the paper.
Compliance with ethical standards
Conflict of interest The authors declare no conflict of interest. The founding sponsors had no role in the design of the study, in the col-lection, analyses, or interpretation of data, in the writing of the manu-script, and in the decision to publish the results.
References
ACSA, Ariel Construcciones, S.A. (1969) Estudio geohidrológico completo de los acuíferos del Valle de Santo Domingo, B.C.S. Tomo I y Anexos 1 y 2. 1969. Estudio realizado para la Secretaría de Agricultura y Recursos Hidráulicos, contrato EI-69–99, clave AS-33, (unpublished)
Beyer W (1964) Zur Bestimmung der Wasserdurchlassigkeit von Kiesen und Sanden aus der Kornverteilung. Wasserwirtschaft—Wassertechnik (WWT). 6:165–169
Cardona A, Carrillo-Rivera JJ, Huizar-Alvarez R, Graniel-Castro E (2004) Salinization in coastal aquifers of arid zones: an example from Santo Domingo, Baja California Sur, Mexico. Environ Geol 45(3):350–366
CNA, Comisión Nacional del Agua (2002) Determinación de la dis-ponibilidad de agua en el acuífero Santo Domingo estado de Baja California Sur, Subgerencia de Evaluación y Modelación Hidro-geológica, México. http://www.conagua.gob.mx/CONAGUA07/Noticias/DR_066.pdf. Accessed 24 Mar 2016
CONAGUA, Comisión Nacional del Agua (2015) Actualización de la Disponibilidad de Agua en el acuífero Santo Domingo, Estado de Baja California Sur. Subgerencia de Evaluación y Modelación Hidrogeológica, México. http://www.conagua.gob.mx/Cona-gua07/Aguasubterranea/pdf/ DR_0306.pdf. Accessed 24 Mar 2016
DESISA, Desarrollo y Sistemas, S.A. (1997) Actualización del estu-dio geohidrológico del Valle de Santo Domingo, Baja Califor-nia Sur. Estudio realizado para la Comisión Nacional del Agua. (unpublished)
INEGI, Instituto Nacional de Estadística y Geografía (1996) Estudio hidrológico del estado de Baja California Sur. p. 206
INEGI, Instituto Nacional de Estadística y Geografía (2001) Carta digital de uso del suelo y vegetación, Escala 1:250,000 Serie II (G1207, VILLA CONSTITUCIÓN)
Marín Celestino AE (2012) Determinación e interpretación de la cali-dad del agua y del suelo en el Distrito de Riego 066 Del Valle de Santo Domingo, Baja California Sur
Prudic DE, Konikow LF, Banta ER (2004) A new stream-flow rout-ing (SFR1) package to simulate stream-aquifer interaction with MODFLOW-2000: U.S. Geological Survey Open-File Report 2004-1042, 2004
Ruiz-Campos G (2012) Catálogo de peces dulceacuícolas de Baja Cali-fornia Sur Semarnat-INE-UABC (2012), p. 164 (No. QL619. M4. R84 2012.)
SEMARNAP, Secretaria Del Medio Ambiente Recursos Naturales Y Pesca (1996) Actualización del estudio geohidrológico del acuífero del Valle de Santo Domingo, B. C. S. Informe final, 1996. Contrato No. GAS-OlO-96, (unpublished)
Shiozawa S, Campbell GS (1991) On the calculation of mean of particle-size distribution: An illustration of model comparison particle diameter and standard deviation from sand, silt, and clay techniques. Soil Sci 152:427–431
TMI, Técnicas Modernas de Ingeniería, S.A. (1978) Estudio Integral para la rehabilitación del Valle de Santo Domingo, en el estado de Baja California Sur. Tomo I y Anexos 1, 2, 3, 4 y 5. 1978. Estudio realizado para la Secretaría de Agricultura y Recursos Hidráulicos, contrato IPP-78–I10 (unpublished)
Wurl J, Martínez Gutiérrez G (2006) El efecto de ciclones tropicales sobre el clima en la cuenca de Santiago, Baja California Sur, México. III Simposio Internacional en Ingeniería y Ciencias para la Sustentabilidad Ambiental y Semana del Ambiente
Wurl J et al (2008) Estudio para la Recuperación del Acuífero del Valle de Santo Domingo, Informe Técnico. UABCS-CONAGUA, La Paz
Zeelie S (2002) OMDEL dam and recharge ponds to enhance recharge in the Namib Desert. In: Dillon P (ed) Management of Aqui-fer Recharge for Sustainability. AA Balkema Publishers, Lisse, pp 387–392