Embed Size (px)
Citation preview

International Journal of Rock Mechanics & Mining Sciences 61 (2013) 266–274
Contents lists available at SciVerse ScienceDirect
International Journal ofRock Mechanics & Mining Sciences
1365-16http://d
n CorrE-m
journal homepage: www.elsevier.com/locate/ijrmms
Coupled seismo-hydromechanical monitoring of inelasticeffects on injection-induced fracture permeability
Benoit Derode a,n, Frédéric Cappa a,c, Yves Guglielmi b, Jonny Rutqvist c
a Geoazur (UMR7329), University of Nice Sophia-Antipolis, Côte d'Azur Observatory, 250 rue Albert Einstein, 06560 Sophia-Antipolis, Franceb Aix-Marseille University, CNRS, IRD, CEREGE (UMR7330), 13545 Aix en Provence, Francec Lawrence Berkeley National Laboratory, Earth Sciences Division, 1 Cyclotron Road, Berkeley, CA, USA
a r t i c l e i n f o
Article history:Received 27 July 2012Received in revised form12 February 2013Accepted 19 March 2013Available online 21 April 2013
Keywords:Inelastic fracture permeabilityMicroseismicityHydromechanical experiment and modelingFluid and stress transferStrength weakening
09/$ - see front matter & 2013 Elsevier Ltd. Ax.doi.org/10.1016/j.ijrmms.2013.03.008
esponding author. Tel.: +33 699 094 725.ail address: [email protected] (B. Derod
a b s t r a c t
We present in situ measurements of fluid pressure, deformation and seismicity in natural fracturestogether with coupled hydromechanical simulations. We conducted a step-rate water injection(�3.5 MPa and 1200 s) to induce the local pressurization of a critically stressed fractured carbonatereservoir layer located at 250 m-depth in the Low Noise Underground Laboratory (LSBB), southernFrance. An observed factor-of-3 increase in the fracture permeability was associated with the injection-induced fluid pressure increase and about 100 triggered seismic events. Both normal opening (a fewmicrons) of the fluid-injected fracture and the associated tilt (o1 micro-radian) of the fracture near fielddisplayed inelastic behavior highlighting an irreversible fracture shear and dilatant failure, amounting toabout 1/3–1/2 of the maximum measured deformations.
Using a plane-strain finite-difference coupled hydromechanical model, our calculation shows thattensile failure first occurred in the injection zone and then shear failure spread along fractures into thesurrounding unsaturated rock through stress transfer from the injection zone. The most striking result ofthese model simulations is that the mechanical weakening of the fractures in the near field induced a 2–5�105 Pa release of the normal stress across the fluid-injected fracture that provoked fracture slip andincrease in permeability. A geological exploration of the fracture zone after the experiment showed thatno major failure had occurred, and we therefore relate these strength and permeability variations to theslight reactivation (�microns) of pre-existing fractures.
& 2013 Elsevier Ltd. All rights reserved.
1. Introduction
Understanding the evolution of the hydraulic properties ofdeformable faults and fractured zones, and the links with inducedseismicity, are important in a broad range of applications ingeomechanics and geophysics. Indeed, fluid hydromechanicalinteractions in fractures zones with contrasting properties arecritical for the potential of rock failure, which, in turn, may provideflow paths for fluid leakage [1–3]. Considering Mohr–Coulombbehavior, the increases of fluid pressure will lower the effectivestress and fractures strength, which can lead to seismic ruptures[4]. If the fluid pressure is high enough, it not only facilitates theslip by reducing the normal stress, but may cause hydrofracturingof the intact rock by tensile cracks, interconnecting and branchingpre-existing fractures. Although fluid injection experiments haveshown that a change in fluid pressure level can be accompanied byseismic events [5,6], no simple relationship has been established
ll rights reserved.
e).
between the injection rates and seismicity [7]. Reasons for thedifficulties in developing such relationships are mainly (1) the lackof in situ experiments with simultaneous seismic and fluid-induced-poroelastic deformations monitoring, and (2) the simple Mohr–Coulomb type arguments that can hardly capture complexities ofgeomechanical nature [8]. Consequently, fundamental uncertaintiesexist as to how fluid pressures induce rupture, to what extent thisrupture is seismic and how this in turn controls the evolution ofhydraulic response and the variations of permeability.
Induced seismicity has been extensively studied in the contextof geothermal systems where high pressure fluid injections aimedat enhancing the permeability in deep reservoirs sometimescan produce significant seismic events with magnitudes of up to6 [7–9]. It has been shown that the interactions between fluidsand stresses can be strongly non-linear, involving complex andheterogeneous mechanical properties, hydraulic diffusivity andrupture along pre-existing fractures and newly formed cracks.Hydraulic well testing experiments conducted in fractured rockhave also shown that the in situ behavior of a single fracturestrongly depends on fracture compliance and permeability, whichare both a function of the asperities and voids between the two
B. Derode et al. / International Journal of Rock Mechanics & Mining Sciences 61 (2013) 266–274 267
rough surfaces of the fracture [10], and on the surroundingfractured rock mass response to poroelastic stresses [11–13]. As aresult, seismicity induced by fluid injection in fractured rocks ofteninvolves a large volume where different triggering mechanismsare invoked, such as the reactivation of pre-existing weak fracturezones [5,14], the general failure processes controlled by the far-field stress [15], and more or less complex hydromechanicalcoupled effects related to fluid pressure diffusion [6,16].
Fluid injection in situ experiments that simultaneously measurefluid pressure, mechanical deformation and induced seismicity at therelevant scale (i.e. the scale where both static to dynamic ruptures canbe captured through micro-strain and micro-seismicity monitoring)are rare because they require special instrumental settings withsensors at and very close to the fluid source. Here we present anactive source experiment that examines the modes of aseismic andseismic failure at the decameter scale. Experiment exhibits a localizedfluid injection in a borehole set through a permeable fractures zonecutting a limestone layer at 250 m-depth. As the fluid pressures(�3.5 MPa) were increased, damage and seismicity were induced inand around the injection zone. The key idea of this research is topresent experimental results to improve the understanding of hydro-mechanical degradation in fractures and fault zones, and how it affectsfluid flow and seismicity. In this paper, we describe the experimentand the main features of the seismicity and interpret them in relationto hydraulic and mechanical properties and responses of the fluid-injected fracture zone. The joint analysis of coupled seismic andhydromechanical data presented in this study represents new resultsin the field, and allowed us to propose a process based model offracture permeability evolution related to the weakening of thefracture zone by poroelastic stress transfer.
Fig. 1. (a) Geomodel view of the LSBB galleries; (b) decameter scale 3D view of the experplanes (upper hemisphere, black square is bedding plane pole and black circles areexperimental set-up (Pf0–Pf3: pressuremeters, Hy0: hydrophone, Un: vibrating wire exsaturated-with-water zone at the injection's end). (For interpretation of the references to
2. Geological and experimental settings
The experiment is sited close to a gallery 250 m below theground surface within the Low Noise Underground Laboratory(LSBB, http://lsbb.oca.eu/) in southern France [17] (Fig. 1a and b).The LSBB site presents a unique combination of environmentalcharacteristics that provides very quiet conditions, which enableaccurate (below the micro-unit) geophysical measurements.A horizontal borehole (diameter of 70 mm and 2.5 m long) wasdrilled from the gallery into a N120-201SW limestone layer cut bya main plane of anisotropy corresponding to the N30 family offractures with dip angles of 60–801W and with a 0.2 m spacing(Fig. 1b and c). This fracture zone corresponds to the damage zone(Fig. 1b) of a 10 m thick strike-slip fault. The hydraulic apertures offractures vary strongly, i.e. from 0.11 to 0.01�10−3 m, and fracturewalls are locally sealed with calcite cement. The injection test wasperformed in a 0.5 m long chamber isolating (between twoinflatable packers) a fracture with a length of several tens ofmeters and a dip angle of 801W (Fig. 1d). The fracture zone wasinitially unsaturated. Water was injected at different flow rates:first, by increasing step-by-step the pressure in the fracture to amaximum value of 35�105 Pa; and, second, by decreasing thepressure with the same steps until returning to the initial state(Fig. 2a).
Flow rate (Q) and fluid pressure (Pf0) in the chamber werecontrolled by Keller sensors set on the injection device both insideand outside the borehole. A hydrophone RESON-TC4013 (Hy0 inFig. 1d) with a sensitivity of 10−6 Pa/V was set in the chamber tomonitor the dynamic (1–170 KHz frequency range) fluid pressurewaves that eventually nucleated at the injection point. Leakages in
iment location close to the gallery; (c) stereographic projection of the main fracturefracture planes poles) and (d) horizontal meter scale map of the geological andtensometer, Acc.1: accelerometer, T1 and T2: tiltmeters, zone in light blue is thecolor in this figure legend, the reader is referred to the web version of this article.)
0 400 800 1200Time (seconds)
Nor
mal
ized
Sei
smic
ene
rgy
0.20.4
0.80.6
NS - T1
NS - T2
EW - T1
EW - T2
0
-0.2
-0.4
-0.6
Rot
atio
n (μ
rad)
35
25
15
50
Pf0 (x105 Pa)
Un (10-6 m/m) -5
11
109
87
65
43
2
1
Q ( 10-1 L.min-1)
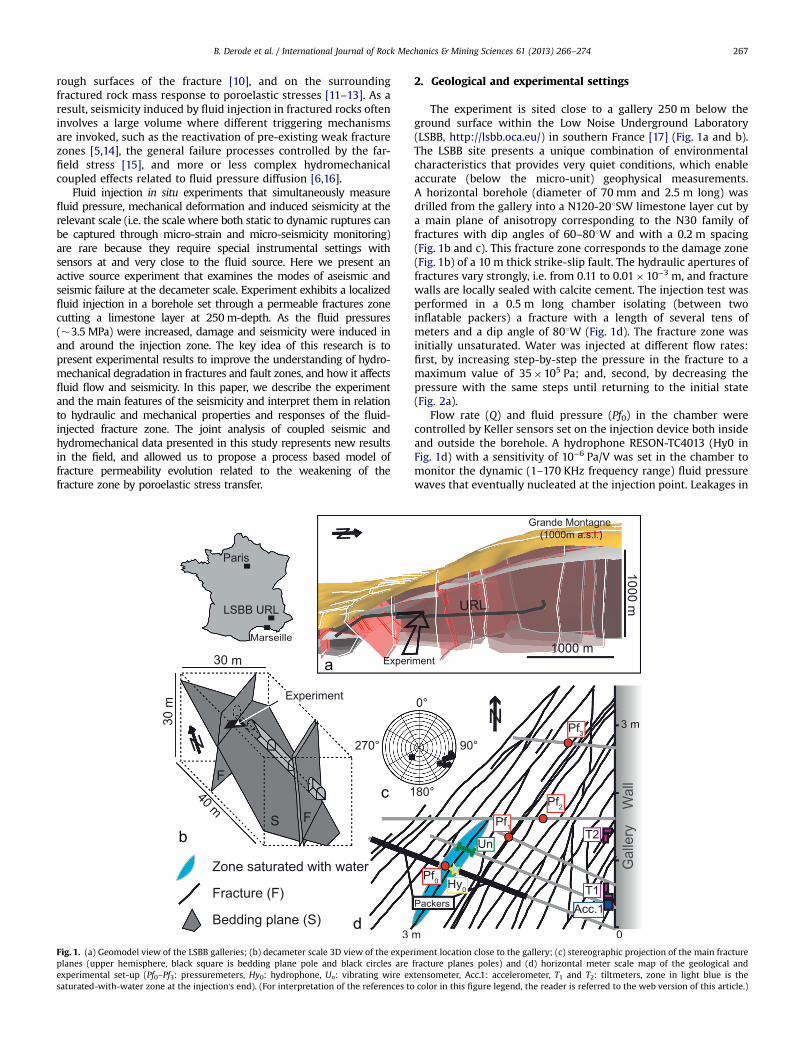
Fig. 2. (a) Variations of the fluid pressure (Pf0), flow rate (Q) and fracture normaldeformation (Un); (b) rotation of the NS- and EW-components of tiltmeters T1 andT2 and (c) normalized seismic energy (amplitude square of the signal) measured atthe gallery wall by the accelerometer Acc.1 (see Fig. 1d for location).
B. Derode et al. / International Journal of Rock Mechanics & Mining Sciences 61 (2013) 266–274268
the surrounding fractures were monitored with pressure sensorslocated in adjacent boreholes (Pf1, Pf2 and Pf3 in Fig. 1d). Accuracyof the fluid pressure and flow rate measurements is 103 Pa and 1L/min, respectively. A vibrating wire Geokon4210 extensometerwas sealed into a horizontal borehole perpendicular to the fractureplane and spaced 20 cm away from the injection chamber, tomeasure the normal deformation of the fracture during fluidinjection (Un in Fig. 1d).
Four single-component tiltmeters (Applied Geomechanics, T1and T2 in Fig. 1d) and one 3-component MEM Colibrys SF3000Laccelerometer (Acc.1 in Fig. 1d) with a flat response in the rangefrom DC to 1 kHz and a 1.2 V/g sensitivity were placed inside smallcavities drilled in the gallery wall, at 2.10 m and 2.60 m, respec-tively, from the injection chamber. Pressure, flow rate, anddeformation were synchronously recorded at a 1 Hz samplingfrequency; tilt, and accelerometer data were recorded at a 1 kHzsampling rate, and hydrophone data were recorded at a 16 kHzsampling rate.
3. Experimental results
3.1. Hydromechanical results
The experiment duration is of 1200 s, with the first 600 scorresponding to the increasing part of the fluid pressure, andthen the last 600 s corresponding to the pressure decreasing partuntil the end of injection. During the increasing part of the step-rate test (i.e., the first 600 s of the experiment), pressure isincreased from 0�105 Pa to 35�105 Pa in five steps ranging from3�105 Pa to 12�105 Pa (Fig. 2a). Due to the low initial perme-ability of the injection chamber, the measured flow rate remainsclose to zero (o1 l/min) throughout this period. The pressure
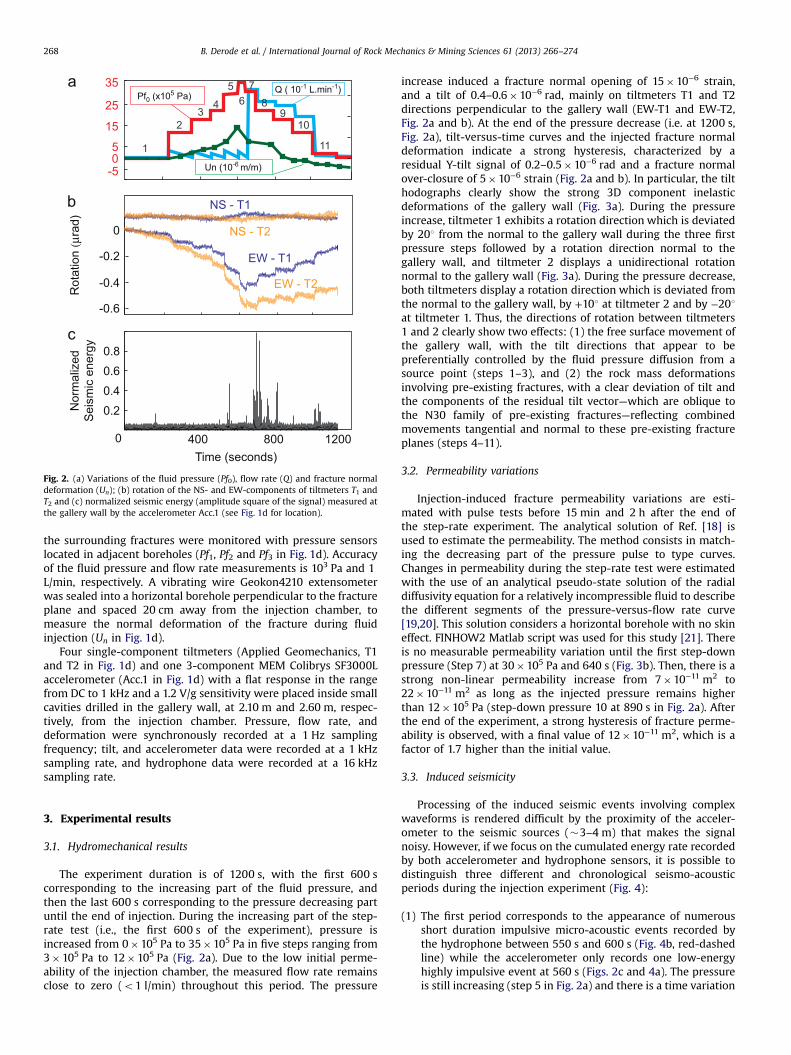
increase induced a fracture normal opening of 15�10−6 strain,and a tilt of 0.4–0.6�10−6 rad, mainly on tiltmeters T1 and T2directions perpendicular to the gallery wall (EW-T1 and EW-T2,Fig. 2a and b). At the end of the pressure decrease (i.e. at 1200 s,Fig. 2a), tilt-versus-time curves and the injected fracture normaldeformation indicate a strong hysteresis, characterized by aresidual Y-tilt signal of 0.2–0.5�10−6 rad and a fracture normalover-closure of 5�10−6 strain (Fig. 2a and b). In particular, the tilthodographs clearly show the strong 3D component inelasticdeformations of the gallery wall (Fig. 3a). During the pressureincrease, tiltmeter 1 exhibits a rotation direction which is deviatedby 201 from the normal to the gallery wall during the three firstpressure steps followed by a rotation direction normal to thegallery wall, and tiltmeter 2 displays a unidirectional rotationnormal to the gallery wall (Fig. 3a). During the pressure decrease,both tiltmeters display a rotation direction which is deviated fromthe normal to the gallery wall, by +101 at tiltmeter 2 and by −201at tiltmeter 1. Thus, the directions of rotation between tiltmeters1 and 2 clearly show two effects: (1) the free surface movement ofthe gallery wall, with the tilt directions that appear to bepreferentially controlled by the fluid pressure diffusion from asource point (steps 1–3), and (2) the rock mass deformationsinvolving pre-existing fractures, with a clear deviation of tilt andthe components of the residual tilt vector—which are oblique tothe N30 family of pre-existing fractures—reflecting combinedmovements tangential and normal to these pre-existing fractureplanes (steps 4–11).
3.2. Permeability variations
Injection-induced fracture permeability variations are esti-mated with pulse tests before 15 min and 2 h after the end ofthe step-rate experiment. The analytical solution of Ref. [18] isused to estimate the permeability. The method consists in match-ing the decreasing part of the pressure pulse to type curves.Changes in permeability during the step-rate test were estimatedwith the use of an analytical pseudo-state solution of the radialdiffusivity equation for a relatively incompressible fluid to describethe different segments of the pressure-versus-flow rate curve[19,20]. This solution considers a horizontal borehole with no skineffect. FINHOW2 Matlab script was used for this study [21]. Thereis no measurable permeability variation until the first step-downpressure (Step 7) at 30�105 Pa and 640 s (Fig. 3b). Then, there is astrong non-linear permeability increase from 7�10−11 m2 to22�10−11 m2 as long as the injected pressure remains higherthan 12�105 Pa (step-down pressure 10 at 890 s in Fig. 2a). Afterthe end of the experiment, a strong hysteresis of fracture perme-ability is observed, with a final value of 12�10−11 m2, which is afactor of 1.7 higher than the initial value.
3.3. Induced seismicity
Processing of the induced seismic events involving complexwaveforms is rendered difficult by the proximity of the acceler-ometer to the seismic sources (�3–4 m) that makes the signalnoisy. However, if we focus on the cumulated energy rate recordedby both accelerometer and hydrophone sensors, it is possible todistinguish three different and chronological seismo-acousticperiods during the injection experiment (Fig. 4):
(1)
The first period corresponds to the appearance of numerousshort duration impulsive micro-acoustic events recorded bythe hydrophone between 550 s and 600 s (Fig. 4b, red-dashedline) while the accelerometer only records one low-energyhighly impulsive event at 560 s (Figs. 2c and 4a). The pressureis still increasing (step 5 in Fig. 2a) and there is a time variation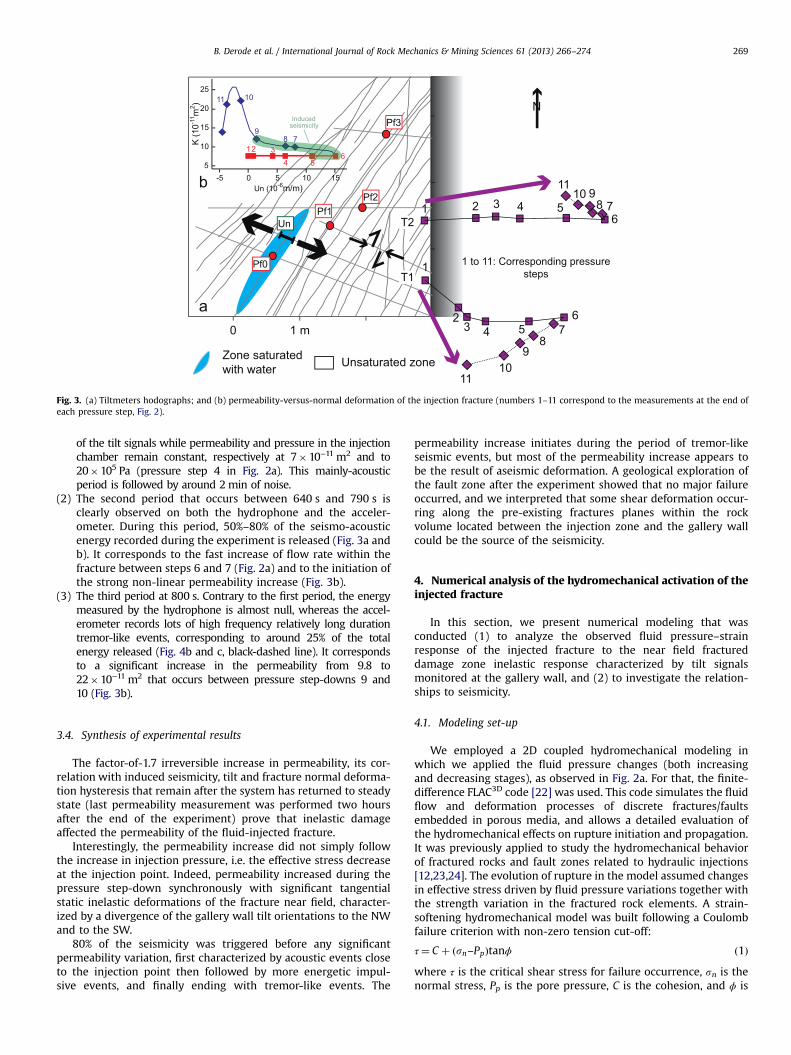
T1
T2
1 m0
Zone saturatedwith water Unsaturated zone
N
1 2 3 4 56
78910
11
23 4 5
67
89
1011
1 1 to 11: Corresponding pressuresteps
Pf0
UnPf1
Pf2
Pf3
-5 1050 15
K (1
0-11 m
2 )Un (10-6m/m)
25
20
10
5
15
12
11 10
98 7
654
38
3
Induced seismicity
Fig. 3. (a) Tiltmeters hodographs; and (b) permeability-versus-normal deformation of the injection fracture (numbers 1–11 correspond to the measurements at the end ofeach pressure step, Fig. 2).
B. Derode et al. / International Journal of Rock Mechanics & Mining Sciences 61 (2013) 266–274 269
of the tilt signals while permeability and pressure in the injectionchamber remain constant, respectively at 7�10−11 m2 and to20�105 Pa (pressure step 4 in Fig. 2a). This mainly-acousticperiod is followed by around 2min of noise.
(2)
The second period that occurs between 640 s and 790 s isclearly observed on both the hydrophone and the acceler-ometer. During this period, 50%–80% of the seismo-acousticenergy recorded during the experiment is released (Fig. 3a andb). It corresponds to the fast increase of flow rate within thefracture between steps 6 and 7 (Fig. 2a) and to the initiation ofthe strong non-linear permeability increase (Fig. 3b).(3)
The third period at 800 s. Contrary to the first period, the energymeasured by the hydrophone is almost null, whereas the accel-erometer records lots of high frequency relatively long durationtremor-like events, corresponding to around 25% of the totalenergy released (Fig. 4b and c, black-dashed line). It correspondsto a significant increase in the permeability from 9.8 to22�10−11 m2 that occurs between pressure step-downs 9 and10 (Fig. 3b).3.4. Synthesis of experimental results
The factor-of-1.7 irreversible increase in permeability, its cor-relation with induced seismicity, tilt and fracture normal deforma-tion hysteresis that remain after the system has returned to steadystate (last permeability measurement was performed two hoursafter the end of the experiment) prove that inelastic damageaffected the permeability of the fluid-injected fracture.
Interestingly, the permeability increase did not simply followthe increase in injection pressure, i.e. the effective stress decreaseat the injection point. Indeed, permeability increased during thepressure step-down synchronously with significant tangentialstatic inelastic deformations of the fracture near field, character-ized by a divergence of the gallery wall tilt orientations to the NWand to the SW.
80% of the seismicity was triggered before any significantpermeability variation, first characterized by acoustic events closeto the injection point then followed by more energetic impul-sive events, and finally ending with tremor-like events. The
permeability increase initiates during the period of tremor-likeseismic events, but most of the permeability increase appears tobe the result of aseismic deformation. A geological exploration ofthe fault zone after the experiment showed that no major failureoccurred, and we interpreted that some shear deformation occur-ring along the pre-existing fractures planes within the rockvolume located between the injection zone and the gallery wallcould be the source of the seismicity.
4. Numerical analysis of the hydromechanical activation of theinjected fracture
In this section, we present numerical modeling that wasconducted (1) to analyze the observed fluid pressure–strainresponse of the injected fracture to the near field fractureddamage zone inelastic response characterized by tilt signalsmonitored at the gallery wall, and (2) to investigate the relation-ships to seismicity.
4.1. Modeling set-up
We employed a 2D coupled hydromechanical modeling inwhich we applied the fluid pressure changes (both increasingand decreasing stages), as observed in Fig. 2a. For that, the finite-difference FLAC3D code [22] was used. This code simulates the fluidflow and deformation processes of discrete fractures/faultsembedded in porous media, and allows a detailed evaluation ofthe hydromechanical effects on rupture initiation and propagation.It was previously applied to study the hydromechanical behaviorof fractured rocks and fault zones related to hydraulic injections[12,23,24]. The evolution of rupture in the model assumed changesin effective stress driven by fluid pressure variations together withthe strength variation in the fractured rock elements. A strain-softening hydromechanical model was built following a Coulombfailure criterion with non-zero tension cut-off:
τ¼ C þ ðsn–PpÞtanϕ ð1Þwhere τ is the critical shear stress for failure occurrence, sn is thenormal stress, Pp is the pore pressure, C is the cohesion, and ϕ is
EW Acc.1
Vertical Acc.1
NS Acc.1
0 400 800 1200Time (seconds)
0
Acc
eler
atio
n (μ
g)-0.2
0.2
Increasing part of pressure
Decreasing part of pressure0
1
Nor
mal
ized
C
umul
ativ
e E
nerg
y
Hydrophone Accelerometer
0 0.50.40.30.20.100.60.50.40.30.20.1 0.6
-2
2
1
0
-1
-2
2
1
0
-1
Hydrophone
Accelerometer
Sig
nal a
mpl
itude
(mV
)
Time (sec) Time (sec)
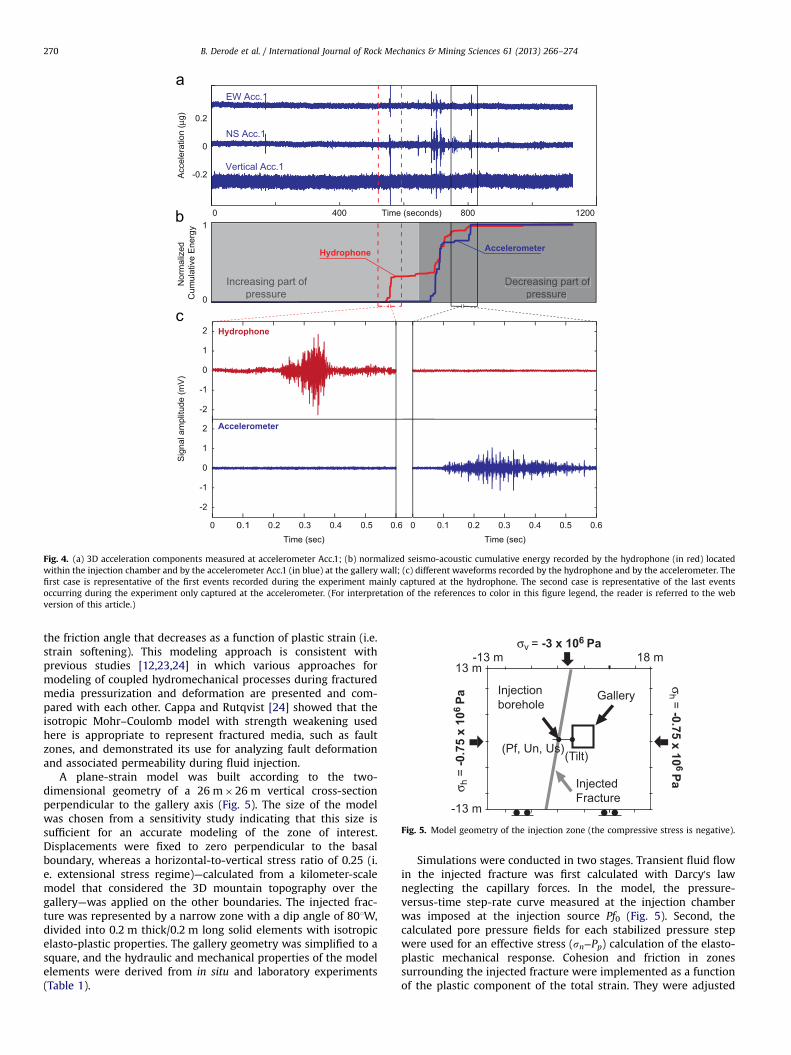
Fig. 4. (a) 3D acceleration components measured at accelerometer Acc.1; (b) normalized seismo-acoustic cumulative energy recorded by the hydrophone (in red) locatedwithin the injection chamber and by the accelerometer Acc.1 (in blue) at the gallery wall; (c) different waveforms recorded by the hydrophone and by the accelerometer. Thefirst case is representative of the first events recorded during the experiment mainly captured at the hydrophone. The second case is representative of the last eventsoccurring during the experiment only captured at the accelerometer. (For interpretation of the references to color in this figure legend, the reader is referred to the webversion of this article.)
13 m18 m
-13 m
-13 mσv = -3 x 10⁶ Pa
σ h =
-0.7
5 x
106
Pa σ
h = -0.75 x 10⁶ Pa
Injectionborehole
InjectedFracture
(Pf, Un, Us)(Tilt)
Gallery
Fig. 5. Model geometry of the injection zone (the compressive stress is negative).
B. Derode et al. / International Journal of Rock Mechanics & Mining Sciences 61 (2013) 266–274270
the friction angle that decreases as a function of plastic strain (i.e.strain softening). This modeling approach is consistent withprevious studies [12,23,24] in which various approaches formodeling of coupled hydromechanical processes during fracturedmedia pressurization and deformation are presented and com-pared with each other. Cappa and Rutqvist [24] showed that theisotropic Mohr–Coulomb model with strength weakening usedhere is appropriate to represent fractured media, such as faultzones, and demonstrated its use for analyzing fault deformationand associated permeability during fluid injection.
A plane-strain model was built according to the two-dimensional geometry of a 26 m�26 m vertical cross-sectionperpendicular to the gallery axis (Fig. 5). The size of the modelwas chosen from a sensitivity study indicating that this size issufficient for an accurate modeling of the zone of interest.Displacements were fixed to zero perpendicular to the basalboundary, whereas a horizontal-to-vertical stress ratio of 0.25 (i.e. extensional stress regime)—calculated from a kilometer-scalemodel that considered the 3D mountain topography over thegallery—was applied on the other boundaries. The injected frac-ture was represented by a narrow zone with a dip angle of 801W,divided into 0.2 m thick/0.2 m long solid elements with isotropicelasto-plastic properties. The gallery geometry was simplified to asquare, and the hydraulic and mechanical properties of the modelelements were derived from in situ and laboratory experiments(Table 1).
Simulations were conducted in two stages. Transient fluid flowin the injected fracture was first calculated with Darcy's lawneglecting the capillary forces. In the model, the pressure-versus-time step-rate curve measured at the injection chamberwas imposed at the injection source Pf0 (Fig. 5). Second, thecalculated pore pressure fields for each stabilized pressure stepwere used for an effective stress (sn−Pp) calculation of the elasto-plastic mechanical response. Cohesion and friction in zonessurrounding the injected fracture were implemented as a functionof the plastic component of the total strain. They were adjusted

Table 1Material properties used in the simulations.
Model parameters Injected fracture zone Surrounding rock
Bulk modulus (GPa) 0.0125 [10–25]Shear modulus (GPa) 0.00938 [7.5–18.75]Mass density (kg/m3) 2540 2540Cohesion (�107 Pa) 0.25 [2–0.1]Tensile strength (�107 Pa) 0.12 [1–0.5]Angle of friction (1) 40 40Permeability (�10−11 m2) 7.4 0.01
B. Derode et al. / International Journal of Rock Mechanics & Mining Sciences 61 (2013) 266–274 271
until the calculated normal deformation-versus-pressure curve atthe injection zone and the calculated tilt-versus-pressure curve atthe gallery wall matched the in situ measured ones.
4.2. Modeling results: parameters controlling the injected fracturehydromechanical activation
The fracture hydromechanical response and the gallery wall tiltsignal are well reproduced (curves MC-with-Yield and K-variablein Fig. 6c–h), when (1) the fracture is represented as a thin highlydeformable, permeable and low cohesive membrane, respectivelya-factor-of-800 to 2000 more deformable, a-factor-of-740 to 2200higher permeable and a-factor-of-8 less cohesive than the sur-rounding rock (Table 1); and, (2) the increase in the fracturepermeability, the decrease of 30% for the cohesion and 10% for thefriction angle of both the fracture and the surrounding blockstrength properties are considered (curves Fig. 6b and f).
If the strength of the injected fracture is high (same as for thesurrounding rock), no failure occurs and the elastic component ofthe deformation only represents a small amount of the measureddeformations (elastic curves in Fig. 6c and d). It is interesting toobserve that the plastic deformation occurs above 12�105 Pa thatcorresponds to the pressure step 2 which is much before thetriggered seismicity period (at steps 5–8 in Fig. 2a). When applyingthe Mohr–Coulomb model with no strength decrease or whenstrength decrease is only considered in the fracture (respectivelyNo-strength weakening—No SW- and Fault-strength weakening—Fault SW-curves in Fig. 6c and d), the calculated deformations ofthe decreasing pressure part of the experiment are highly over-estimated compared to measurements. Consequently, the moststriking result of the model is that after the triggered seismicityperiods, the injected fracture hydromechanical response is mainlycontrolled by the non-linear decrease in the strength of thevolume surrounding the injected fracture.
If the initial permeability of the injected fracture is set to afactor-of-100 higher than the measured one, there is a factor-of-2overestimation of the calculated plastic deformations that isrelated to a higher magnitude effective stress variation appliedover a larger fluid diffusion length within the injected fracture(curve K¼9�10−9 m2 in Fig. 6g and h). If the initial permeability isnot varied, there is a slight overestimation of the deformationsduring the pressure step down that is related to a low magnitudeeffective stress variation applied within a smaller fluid diffusionlength within the injected fracture (curve K¼7.4�10−11 m2 inFig. 6g and h). These models show that the initial permeability ofthe injected fracture has a more important effect on its instabilitythan the permeability variations related to the fracture zonedeformations. Indeed, models show that the permeability increasedid not stop the injection-induced fracture instability.
4.3. Synthesis: process based model
We compare the calculated locations of failure zones with thecalculated tangential and normal deformations of the injected
fracture to investigate the observed induced seismicity evolutionand its relationship to permeability variations of the fracture(Fig. 7). The gallery, which is located 3–4 m from the injectedfracture, acts as a weak zone that induces an important effect onstresses in the volume between the injected fracture and thegallery wall. Indeed, from the injection point in the fracture (whichis stressed close to the far-field in situ confining stress) there is(1) a gradual decrease of the horizontal stress (which is close tothe stress normal to the fracture plane) toward the gallery wall,and (2) an increase in the vertical stress due to the gallery-inducedstress abutment. The result is a stress arch oriented toward theinjected fracture where the high vertical-to-horizontal stress ratiofavors shear failure.
Two types of failure modes are calculated during the simulatedstep-rate injection experiment. Firstly, at relatively low pressurestep-ups (step 3 in Fig. 7), tensile failures develop in the injectionarea of the fracture. These failures are caused by a local unloadingof the fracture related to a decrease of the effective stress. Thisprogressive unloading that propagates from the injection pointinto the injected fracture with the pressure step-up hydraulicdiffusion increases the deviatoric stress in the zone between thefracture and the gallery. Secondly, at or around the maximumpressure, shear failure occurs in the initial gallery-induced stressarching zone within the rock volume between the fracture and thegallery wall (step 7 in Fig. 7). This failure can be categorized asstress-transfer-induced failure. It results (1) in a global decrease inboth the cohesion and friction properties of the rock volumesurrounding the injected fracture, and (2) in a release of the stressnormal to the injected fracture. Snapshots of pressure step-downs8 and 10 (Fig. 7) show that shear failure progressive propagationfollows the gallery-induced stress arch, and then branches to theinjected fault plane. This failure propagation occurs at theobserved triggered seismicity period and it may be mainly relatedto pre-existing fractures reactivations through a process of cemen-ted bonds between the fracture walls shear failures.
Cumulated fracture tangential and normal deformations com-pared to measured permeability evolution follow two main stepsrelated to the complex failure propagation in and around theinjected fracture (Fig. 7). Firstly, there is no significant perme-ability variation when tensile failure is limited to the injectionzone in the fracture. Secondly, when failure progressively propa-gates in the surrounding block, it causes a release of the normalstress on the fracture plane (estimated to 0.2–0.5�105 Pa in themodel) that provokes the activation of the fracture tangentialdeformation. The measured permeability increase clearly corre-lates to the tangential fracture deformation variation, whichappears significantly higher than the normal deformation (esti-mated to a factor-of-six higher at the end of the experiment).
5. Discussion
Our in situ observations of the seismic and hydromechanicalprocesses occurring in the near field of a high-pressure injectionhighlight how the reactivation of the surrounding fractures canaffect fluid flow and mechanical deformation of the fluid-injectedfracture. Thanks to the coupled fluid pressure-deformation andseismicity monitoring in and close to the fracture, it was possibleto isolate a mechanism of reactivation through stress transfer thatis not associated with fluid-pressure diffusion in the surroundingfractures. We show that this weakening of the strength propertiesin the environment of the injected fracture strongly influences itsshear deformation and is critical to its permeability variation.
Interestingly, permeability increase follows the induced seis-micity swarm that occurs during the decreasing pressure part of
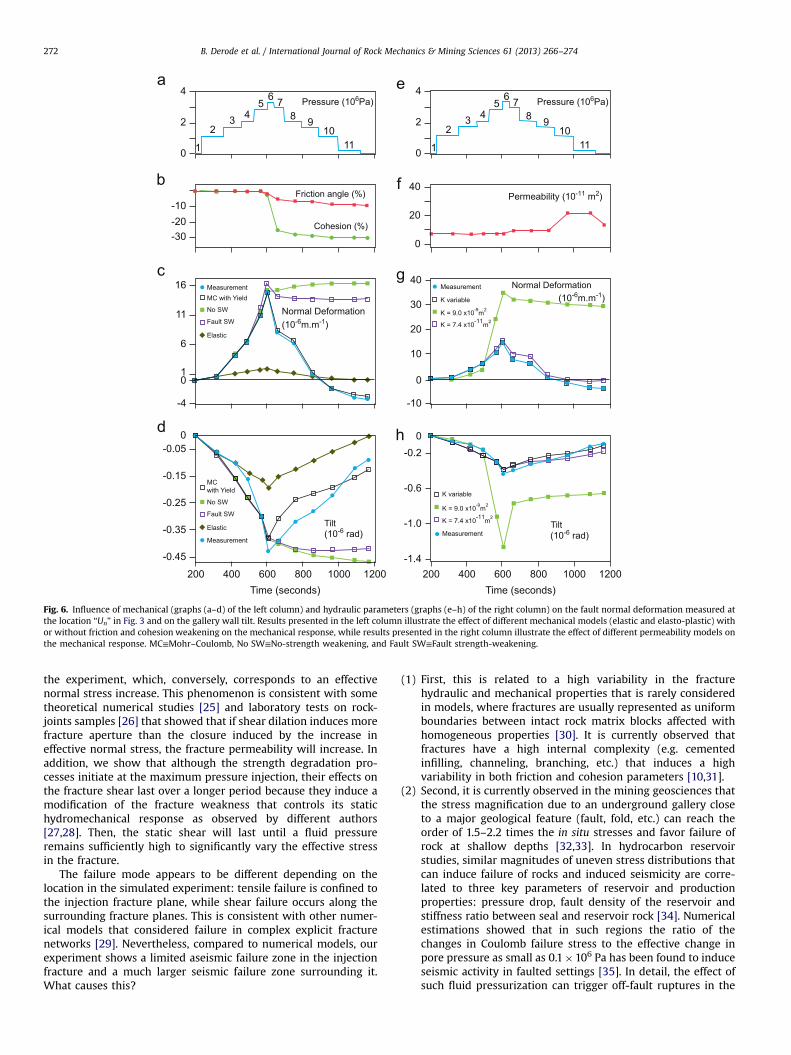
Fig. 6. Influence of mechanical (graphs (a–d) of the left column) and hydraulic parameters (graphs (e–h) of the right column) on the fault normal deformation measured atthe location “Un” in Fig. 3 and on the gallery wall tilt. Results presented in the left column illustrate the effect of different mechanical models (elastic and elasto-plastic) withor without friction and cohesion weakening on the mechanical response, while results presented in the right column illustrate the effect of different permeability models onthe mechanical response. MC≡Mohr–Coulomb, No SW≡No-strength weakening, and Fault SW≡Fault strength-weakening.
B. Derode et al. / International Journal of Rock Mechanics & Mining Sciences 61 (2013) 266–274272
the experiment, which, conversely, corresponds to an effectivenormal stress increase. This phenomenon is consistent with sometheoretical numerical studies [25] and laboratory tests on rock-joints samples [26] that showed that if shear dilation induces morefracture aperture than the closure induced by the increase ineffective normal stress, the fracture permeability will increase. Inaddition, we show that although the strength degradation pro-cesses initiate at the maximum pressure injection, their effects onthe fracture shear last over a longer period because they induce amodification of the fracture weakness that controls its statichydromechanical response as observed by different authors[27,28]. Then, the static shear will last until a fluid pressureremains sufficiently high to significantly vary the effective stressin the fracture.
The failure mode appears to be different depending on thelocation in the simulated experiment: tensile failure is confined tothe injection fracture plane, while shear failure occurs along thesurrounding fracture planes. This is consistent with other numer-ical models that considered failure in complex explicit fracturenetworks [29]. Nevertheless, compared to numerical models, ourexperiment shows a limited aseismic failure zone in the injectionfracture and a much larger seismic failure zone surrounding it.What causes this?
(1)
First, this is related to a high variability in the fracturehydraulic and mechanical properties that is rarely consideredin models, where fractures are usually represented as uniformboundaries between intact rock matrix blocks affected withhomogeneous properties [30]. It is currently observed thatfractures have a high internal complexity (e.g. cementedinfilling, channeling, branching, etc.) that induces a highvariability in both friction and cohesion parameters [10,31].(2)
Second, it is currently observed in the mining geosciences thatthe stress magnification due to an underground gallery closeto a major geological feature (fault, fold, etc.) can reach theorder of 1.5–2.2 times the in situ stresses and favor failure ofrock at shallow depths [32,33]. In hydrocarbon reservoirstudies, similar magnitudes of uneven stress distributions thatcan induce failure of rocks and induced seismicity are corre-lated to three key parameters of reservoir and productionproperties: pressure drop, fault density of the reservoir andstiffness ratio between seal and reservoir rock [34]. Numericalestimations showed that in such regions the ratio of thechanges in Coulomb failure stress to the effective change inpore pressure as small as 0.1�106 Pa has been found to induceseismic activity in faulted settings [35]. In detail, the effect ofsuch fluid pressurization can trigger off-fault ruptures in the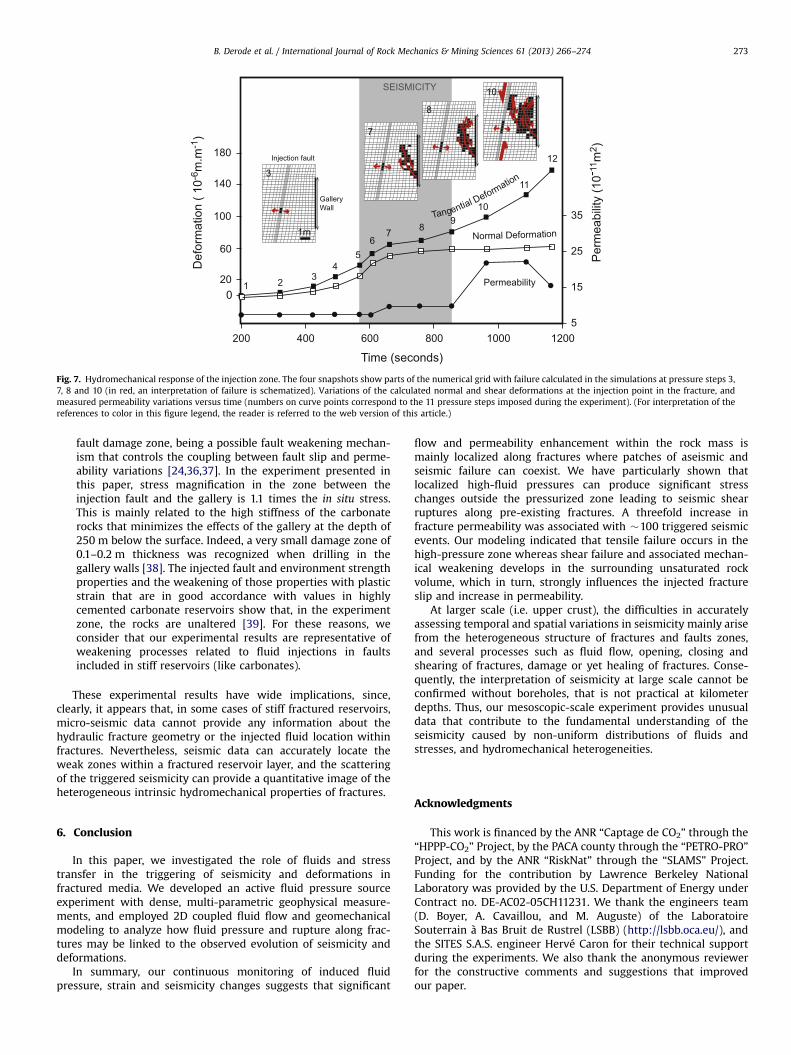
SEISMICITY
GalleryWall
Injection fault
1m
020
60
100
140
180
200 400 600 800 10005
15
25
35
Def
orm
atio
n ( 1
0-6 m
.m-1
)
Per
mea
bilit
y (1
0-11
m2 )
Tangential Deformation
Normal Deformation
Permeability3
7 8
10
3
7
8
10
Time (seconds)
1 2
45
6
9
11
12
1200
Fig. 7. Hydromechanical response of the injection zone. The four snapshots show parts of the numerical grid with failure calculated in the simulations at pressure steps 3,7, 8 and 10 (in red, an interpretation of failure is schematized). Variations of the calculated normal and shear deformations at the injection point in the fracture, andmeasured permeability variations versus time (numbers on curve points correspond to the 11 pressure steps imposed during the experiment). (For interpretation of thereferences to color in this figure legend, the reader is referred to the web version of this article.)
B. Derode et al. / International Journal of Rock Mechanics & Mining Sciences 61 (2013) 266–274 273
fault damage zone, being a possible fault weakening mechan-ism that controls the coupling between fault slip and perme-ability variations [24,36,37]. In the experiment presented inthis paper, stress magnification in the zone between theinjection fault and the gallery is 1.1 times the in situ stress.This is mainly related to the high stiffness of the carbonaterocks that minimizes the effects of the gallery at the depth of250 m below the surface. Indeed, a very small damage zone of0.1–0.2 m thickness was recognized when drilling in thegallery walls [38]. The injected fault and environment strengthproperties and the weakening of those properties with plasticstrain that are in good accordance with values in highlycemented carbonate reservoirs show that, in the experimentzone, the rocks are unaltered [39]. For these reasons, weconsider that our experimental results are representative ofweakening processes related to fluid injections in faultsincluded in stiff reservoirs (like carbonates).
These experimental results have wide implications, since,clearly, it appears that, in some cases of stiff fractured reservoirs,micro-seismic data cannot provide any information about thehydraulic fracture geometry or the injected fluid location withinfractures. Nevertheless, seismic data can accurately locate theweak zones within a fractured reservoir layer, and the scatteringof the triggered seismicity can provide a quantitative image of theheterogeneous intrinsic hydromechanical properties of fractures.
6. Conclusion
In this paper, we investigated the role of fluids and stresstransfer in the triggering of seismicity and deformations infractured media. We developed an active fluid pressure sourceexperiment with dense, multi-parametric geophysical measure-ments, and employed 2D coupled fluid flow and geomechanicalmodeling to analyze how fluid pressure and rupture along frac-tures may be linked to the observed evolution of seismicity anddeformations.
In summary, our continuous monitoring of induced fluidpressure, strain and seismicity changes suggests that significant
flow and permeability enhancement within the rock mass ismainly localized along fractures where patches of aseismic andseismic failure can coexist. We have particularly shown thatlocalized high-fluid pressures can produce significant stresschanges outside the pressurized zone leading to seismic shearruptures along pre-existing fractures. A threefold increase infracture permeability was associated with �100 triggered seismicevents. Our modeling indicated that tensile failure occurs in thehigh-pressure zone whereas shear failure and associated mechan-ical weakening develops in the surrounding unsaturated rockvolume, which in turn, strongly influences the injected fractureslip and increase in permeability.
At larger scale (i.e. upper crust), the difficulties in accuratelyassessing temporal and spatial variations in seismicity mainly arisefrom the heterogeneous structure of fractures and faults zones,and several processes such as fluid flow, opening, closing andshearing of fractures, damage or yet healing of fractures. Conse-quently, the interpretation of seismicity at large scale cannot beconfirmed without boreholes, that is not practical at kilometerdepths. Thus, our mesoscopic-scale experiment provides unusualdata that contribute to the fundamental understanding of theseismicity caused by non-uniform distributions of fluids andstresses, and hydromechanical heterogeneities.
Acknowledgments
This work is financed by the ANR “Captage de CO2” through the“HPPP-CO2” Project, by the PACA county through the “PETRO-PRO”Project, and by the ANR “RiskNat” through the “SLAMS” Project.Funding for the contribution by Lawrence Berkeley NationalLaboratory was provided by the U.S. Department of Energy underContract no. DE-AC02-05CH11231. We thank the engineers team(D. Boyer, A. Cavaillou, and M. Auguste) of the LaboratoireSouterrain à Bas Bruit de Rustrel (LSBB) (http://lsbb.oca.eu/), andthe SITES S.A.S. engineer Hervé Caron for their technical supportduring the experiments. We also thank the anonymous reviewerfor the constructive comments and suggestions that improvedour paper.
B. Derode et al. / International Journal of Rock Mechanics & Mining Sciences 61 (2013) 266–274274
References
[1] Hawkes CD, Mclellan PJ, Bachu S. Geomechanical factors affecting geologicalstorage of CO2 in depleted oil and gas reservoirs. J Can Petrol Technol2005;29:1445–56.
[2] Segall P. Earthquake and volcano deformation. Princeton: Princeton UniversityPress; 2009.
[3] Gaffet S, Guglielmi Y, Cappa F, Pambrun C, Monfret T, Amitrano D. Use of thesimultaneous seismic, GPS and meteorological monitoring for the character-ization of a large unstable mountain slope in the southern French Alps.Geophys J Int 2010;182:1395–410.
[4] Zoback M, Harjes HP. Injection-induced earthquakes and crustal stress at 9 kmdepth at the KTB deep drilling site, Germany. J Geophys Res 1997;102(18):477–91.
[5] Fehler M. Stress control of seismicity patterns observed during hydraulicfracturing experiments at the Fenton Hill Hot Dry Rock geothermal energysite, New Mexico. Int J Rock Mech Min Sci Geomech Abstr 1989;26:211–9.
[6] Shapiro SA, Audigane P, Royer JJ. Large-scale in-situ permeability tensor ofrocks from induced seismicity. Geophys J Int 1999;137:207–13.
[7] Majer EL, Baria R, Stark M, Oates S, Bommer J, Smith B, et al. Inducedseismicity associated with enhanced geothermal systems. Geothermics2007;36:185–222.
[8] Suckale J. Induced seismicity in hydrocarbon fields. Adv Geophys 2009;51:55–106.
[9] Glowacka E, Nava FA. Major earthquakes in Mexicali Valley, Mexico, and fluidextraction at Cerro Prieto geothermal field. Bull Seismol Soc Am1996;86:93–105.
[10] Pyrak-Nolte LJ, Morris JP. Single fractures under normal stress: the relationbetween fracture specific stiffness and fluid flow. Int J Rock Mech Min Sci2000;37:245–62.
[11] Rutqvist J. Determination of hydraulic normal stiffness of fractures in hardrock from well testing. Int J Rock Mech Min Sci 1995;32:513–23.
[12] Cappa F, Guglielmi Y, Rutqvist J, Tsang C-F, Thoraval A. Hydromechanicalmodeling of pulse tests that measure fluid pressure and fracture normaldisplacement at the Coaraze Laboratory site, France. Int J Rock Mech Min Sci2006;43:1062–82.
[13] Cappa F, Guglielmi Y, Rutqvist J, Tsang C-F, Thoraval A. Estimation of fractureflow parameters through numerical analysis of hydromechanical pressurepulses. Water Resour Res 2008;44:W11408.
[14] Warpinski N, Teufel LW. Influence of geologic discontinuities on hydraulicfracture propagation. J Petrol Technol 1987;39:209–20.
[15] Cornet FH, Morin RH. Evaluation of hydromechanical coupling in a graniterock mass from a high-volume high-pressure injection experiment: Le Mayetde Montagne, France. Int J Rock Mech Min Sci 1997;34:207.e1–14.
[16] Guglielmi Y, Cappa F, Amitrano D. High-definition analysis of fluid-inducedseismicity related to the mesoscale hydromechanical properties of a faultzone. Geophys Res Lett 2008;35:L06306.
[17] Gaffet S, Guglielmi Y, Virieux J, Waysand G, Chwala A, Stolz R, et al.Simultaneous seismic and magnetic measurements in the LSBB, France duringthe 2001, 26th January Indian earthquake. Geophys J Int 2003;155:981–90.
[18] Cooper HH, Bredehoeft JD, Papadopulos IS. Response of a finite-diameter wellto an instantaneous charge of water. Water Resour Res 1967;3:263–9.
[19] Hvorslev MJ. Time lag and soil permeability in ground-water observations.Bulltin no. 36. Waterways Experiment Station Corps of Engineers, U.S. Army:Vicksburg, Mississippi; 1951 p. 1–50.
[20] Singh P, Agarwal RG. SRT (Step Rate Test): new procedure for determiningformation parting pressure. Paper SPE 1814; 1990.
[21] Park E, Zhan H. Hydraulics of horizontal wells in fractured shallow aquifersystems. J Hydrol 2003;281:147–58.
[22] Itasca Consulting Group. FLAC3D. fast lagrangian analysis of continua in 3dimensions. Version 3.0. Five volumes. Itasca Consulting Group: Minneapolis,Minnesota; 2006.
[23] Guglielmi Y, Cappa F, Rutqvist J, Tsang C-F, Thoraval A. Mesoscale character-ization of coupled hydromechanical behavior of a fractured-porous slopde inresponse to free water-surface movement. Int J Rock Mech Min Sci2008;45:862–78.
[24] Cappa F, Rutqvist J. Modeling of coupled deformation and permeabilityevolution during fault reactivation induced by deep underground injectionof CO2. Int J Greenhouse Gas Control 2011;5:336–46.
[25] Tao Q, Ghassemi A, Ehlig-Economides C. A fully coupled method to modelfracture permeability change in naturally fractured reservoirs. Int J Rock MechMin Sci 2010;48:259–68.
[26] Gentier S, Lamontagne E, Archambault G, Riss J. Anisotropy of flow in afracture undergoing shear and its relation to the direction of shearing andinjection pressure. Int J Rock Mech Min Sci 1997;94:e1-94.1234 1997;94:e1-94.12.
[27] Cornet FH, Li L, Hulin JP, Ippolito I, Kurowski P. The hydromechanical behaviorof a fracture: an in situ experimental case study. Int J Rock Mech Min Sci2003;40:1257–70.
[28] Cappa F, Guglielmi Y, Virieux J. Stress and fluid transfer in a fault zone due tooverpressures in the seismogenic crust. Geophys Res Lett 2007;34:L05301.
[29] Gil I, Nagel N, Sanchez-Nagel M. The effect of operational parameters onhydraulic fracture propagation in naturally fractured reservoirs—getting con-trol of the fracture optimization process. In: Proceedings of the 45th US RockMechanics Symposium, Paper ARMA 11-391.
[30] Adachi J, Siebrits E, Pierce A, Desroches J. Computer simulation of hydraulicfractures. Int J Rock Mech Min Sci 2006;44:739–57.
[31] Barton N. Rock quality, seismic velocity, attenuation and anisotropy. London:Taylor and Francis; 2006.
[32] Barton N, Pandey SK. Numerical modeling of two stopping methods in twoIndian mines using degradation of c and mobilization of φ based on Q-parameters. Int J Rock Mech Min Sci 2011;48:1095–112.
[33] Diederichs MS, Kaiser PK. Tensile strength and abutment relaxation as failurecontrol mechanisms in underground excavations. Int J Rock Mech Min Sci1999;36:69–96.
[34] Van Eijs RMHE, Mulders FMM, Nepveu M, Kenter CJ, Scheffers BC. Correlationbetween hydrocarbon reservoir properties and induced seismicity in theNetherlands. Eng Geol 2006;84:99–111.
[35] Soltanzadeh H, Hawkes CD. Assessing fault reactivation tendency within andsurrounding porous reservoirs during fluid production or injection. Int J RockMech Min Sci 2009;46:1–7.
[36] Cappa F. Modelling fluid transfer and slip in a fault zone when integratingheterogeneous hydromechanical characteristics in its internal structure.Geophys J Int 2009;178:1357–62.
[37] Cappa F. Influence of hydromechanical heterogeneities of fault zones onearthquake ruptures. Geophys J Int 2011;185:1049–58.
[38] Jeanne P, Guglielmi Y, Cappa F. Multiscale seismic signature of a small faultzone in carbonate reservoir: relationships between VP imaging, fault zonearchitecture and cohesion. Tectonophysics 2012;554–557:185–201.
[39] Gaswirth SB, Budd DA, Crawford BR. Textural and stratigraphic controls onfractured dolomite in a carbonate aquifer system, Ocala limestone, west-central Florida. Sediment Geol 2006;184:241–54.