Embed Size (px)
Citation preview

A
hpmsfi©
K
1
mbIcidefl
spot
0d
Materials Science and Engineering A 448 (2007) 177–188
Coupled modeling of electromagnetic field, fluid flow, heat transfer andsolidification during low frequency electromagnetic
casting of 7XXX aluminum alloysPart II: The effects of electromagnetic parameters on
casting processes
Haitao Zhang a,∗, Hiromi Nagaumi b, Jianzhong Cui a
a Key Lab of Electromagnetic Processing of Materials, Ministry of Education, Northeastern University, Shenyang, Liaoning 110004, Chinab Nippon Light Metal Company Ltd., Nikkei Research and Development Center, 1-34-1 Kambara Kambara-cho, Ihara-gun, Shizuoka-ken 421-3291, Japan
Received 2 April 2006; received in revised form 8 October 2006; accepted 16 October 2006
bstract
A comprehensive mathematical model for the interaction of the multiple physics fields during the conventional DC casting and LFEC processesas been developed and verified against experimental results in Part I. In this second article of a two-part series, the effects of electromagneticarameters on electromagnetic field, fluid flow, temperature field and solidification during LFEC process have investigated numerically by using the
athematic model in Part I. The choosing criterion of the electromagnetic parameters during LFEC process has been used in order to obtain the besttructure of the billets by analyzing the effects of fluid flow and temperature field on the solidification process in the presence of electromagneticeld. 2006 Elsevier B.V. All rights reserved.
low fi
g[oorpmt
fsIt
eywords: Low frequency electromagnetic field; Casting; Temperature field; F
. Introduction
In Part I of this two-part series, a comprehensive mathematicodel for the conventional DC casting and LFEC processes has
een presented and compared with the measured cooling curves.t has been found that there was good agreement between thealculated results and the measured results. In addition, compar-son of the calculated results during the LFEC process with thaturing the conventional DC casting process have indicated thatlectromagnetic field modified remarkably temperature field,uid flow and solidification during the casting process.
Eskin and Katgerman [1] have studied the effects of castingpeed and water-flow rate on structure and macrosegregation
rofiles. In addition, the effects of second water cooling strengthn the temperature field and stress field in the billets duringhe start-up phase and steady static phase have been investi-∗ Corresponding author. Tel.: +86 24 83687734; fax: +86 24 83681758.E-mail address: haitao [email protected] (H. Zhang).
2
pde
921-5093/$ – see front matter © 2006 Elsevier B.V. All rights reserved.oi:10.1016/j.msea.2006.10.063
eld; Solidification
ated in detail by other researchers [2–5]. Moreover, Cui’s group6–8] has developed the effects of electromagnetic parametersn the microstructure and macrosegregation in billets by meansf experiments during DC casting process. However, it is rarelyeported that the effects of electromagnetic parameters on tem-erature field, fluid flow and solidification were developed byeans of numerical modeling during DC casting process, in par-
icular, in the presence of low frequency electromagnetic field.This second part investigates the effects of electromagnetic
requency and intensity on temperature field, fluid flow andolidification by using the verified mathematic model in Partand determines the electromagnetic parameters under which
he best structure of the billets is obtained during LFEC process.
. Simulation procedure
All casting process parameters except electromagneticarameters are fixed and the electromagnetic parameters areivided into two groups in order to investigate the effects oflectromagnetic parameters on temperature field, fluid flow

178 H. Zhang et al. / Materials Science and Engineering A 448 (2007) 177–188
magn
ask2aa1
3
3p
3fl
intitbwtiutasioawaFtmwe
B
wpbflatnfltbmilspmcthe vector sum of two electromagnetic fields mentioned above.The effect zone of the electromagnetic field produced by thesource current is large, and it is larger than the electromag-netic field produced by the eddy current in the total billet when
Fig. 1. Magnetic flux density contours and vectors under different electro
nd solidification. In the first group, electromagnetic inten-ity (ampere turn is used to denote electromagnetic intensity)eeps being 8000 At and electromagnetic frequency is 10 Hz,0 Hz, 30 Hz, 40 Hz and 50 Hz, respectively. Moreover, innother group, electromagnetic frequency keeps being 20 Hznd electromagnetic intensity is 6400 At, 8000 At, 9600 At and2,000 At, respectively.
. Results and discussion
.1. The effects of electromagnetic frequency on castingrocesses
.1.1. The effect of electromagnetic frequency on magneticux density
Fig. 1(a–e) shows magnetic flux density contours and vectorsn the billets cast during the LFEC process when electromag-etic frequency is in the range of 10–100 Hz. It is found thathe maximum values of magnetic flux density decrease, thenclinations between the magnetic flux density contours andhe centerline of the billets become steeper and the distri-utions and directions of magnetic flux density are modifiedhen electromagnetic frequency increases, which results from
he skin effect of alternative electromagnetic field. As seenn Fig. 1(a–e), the directions of magnetic flux density is allpward and their values decrease from the surface to the cen-erline of the billets when electromagnetic frequency is 10 Hznd 20 Hz. However, there is a vortex of magnetic flux den-ity in the billets and the direction of magnetic flux densitys upward at the surface and is downward at the centerlinef the billets when electromagnetic frequency is 30 Hz, 50 Hznd 100 Hz. Moreover, the center of the vortex moves outwardhen electromagnetic frequency increases. Fig. 2 shows vari-
tion of magnetic flux density on the given path (y = 0.015 inig. 1) from the center of the billets to the outer surface of
he mold with electromagnetic frequency. For planar electro-agnetic wave, the solution for transmitting of electromagnetic
ave within conductor can be obtained by solving the Maxwell’squations:
= B0e−r√
πfμσ (1)
Ftf
etic frequency: (a) 10 Hz, (b) 20 Hz, (c) 30 Hz, (d) 50 Hz and (e) 100 Hz.
here r is distance from Point A in Fig. 2 along the givenath from the outer surface of the mold to the center of theillets, f the electromagnetic frequency and B0 is the magneticux density at Point A. So electromagnetic flux density attenu-tes exponentially from Point A to the center of the billets andhe attenuation rate increase with the increase of electromag-etic frequency, as seen in Fig. 2. However, electromagneticux density attenuates firstly and then improves and the loca-
ion of the minimum value moves towards the surface of theillets with increasing electromagnetic frequency when electro-agnetic frequency is in the range of 30–100 Hz. This reason
s that the eddy currents in the mold and the edge of the bil-ets can be produced and their directions are opposite to theource currents in the coil, and then these eddy currents can alsoroduce electromagnetic field and the direction of this electro-agnetic field is also opposite to that produced by the source
urrent in the coil. The electromagnetic field shown in Fig. 1 is
ig. 2. Magnetic flux density from the outer surface of mold to the center ofhe billets on the given path (y = 0.015 in Fig. 1) under different electromagneticrequency.
H. Zhang et al. / Materials Science and Engineering A 448 (2007) 177–188 179
F undea
etibtwiF
3a
aiufenetvost
pbe
F
Se
F
w
ueii
Fp
ig. 3. Time average electromagnetic volume force density contours and vectorsnd (e) 100 Hz.
lectromagnetic frequency is low, so the exponential attenua-ion of the electromagnetic flux density under 10 Hz and 20 Hzs seen in Fig. 2. However, the electromagnetic field producedy the eddy current is larger than that by the source current inhe center zone of the billets due to the small penetration depthhen the electromagnetic frequency increases, hence the vary-
ng curves under 30 Hz, 50 Hz and 100 Hz can be observed inig. 2.
.1.2. The effect of electromagnetic frequency on timeverage electromagnetic volume force density
Time average electromagnetic volume force density contoursnd vectors under different electromagnetic frequency are shownn Fig. 3(a–e). It is found that time average electromagnetic vol-me force density increases and the electromagnetic volumeorce gradient on the skin layer increases with the increase oflectromagnetic frequency, but the divergence of the electromag-etic volume force under 50 Hz and 100 Hz is so less. Moreover,lectromagnetic frequency has slight effect on the direction ofhe electromagnetic volume force on the skin layer. Fig. 4 shows
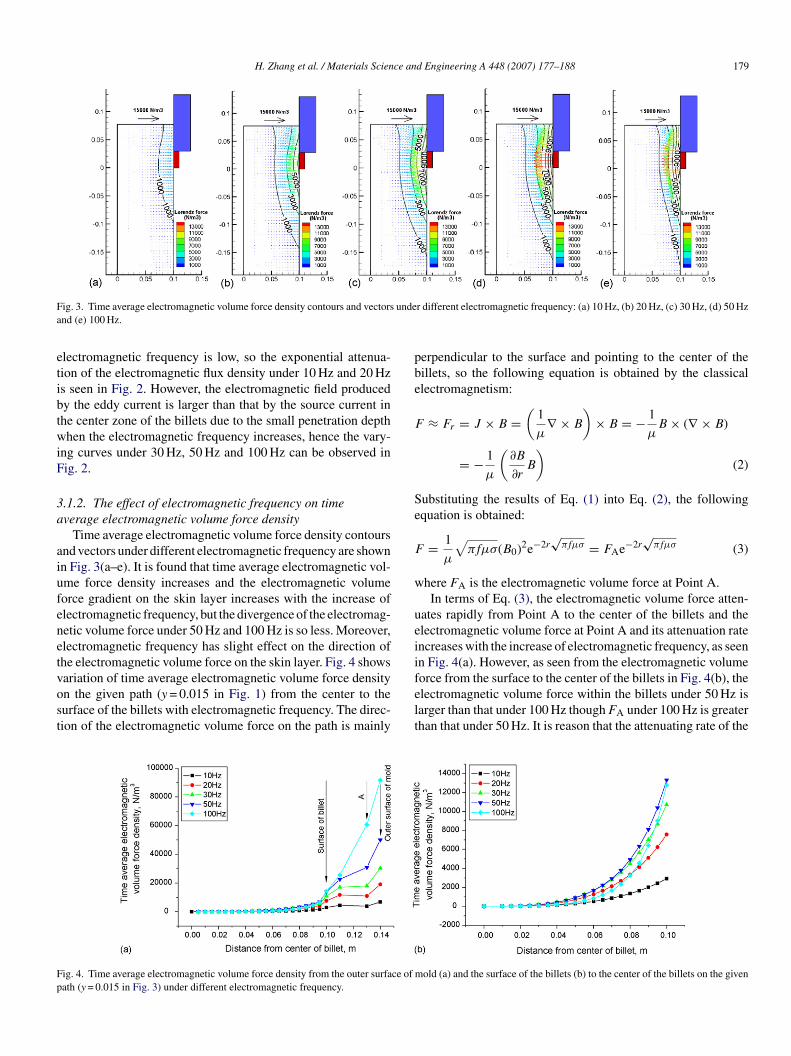
ariation of time average electromagnetic volume force densityn the given path (y = 0.015 in Fig. 1) from the center to theurface of the billets with electromagnetic frequency. The direc-ion of the electromagnetic volume force on the path is mainlyfelt
ig. 4. Time average electromagnetic volume force density from the outer surface of math (y = 0.015 in Fig. 3) under different electromagnetic frequency.
r different electromagnetic frequency: (a) 10 Hz, (b) 20 Hz, (c) 30 Hz, (d) 50 Hz
erpendicular to the surface and pointing to the center of theillets, so the following equation is obtained by the classicallectromagnetism:
≈ Fr = J × B =(
1
μ∇ × B
)× B = − 1
μB × (∇ × B)
= − 1
μ
(∂B
∂rB
)(2)
ubstituting the results of Eq. (1) into Eq. (2), the followingquation is obtained:
= 1
μ
√πfμσ(B0)2e−2r
√πfμσ = FAe−2r
√πfμσ (3)
here FA is the electromagnetic volume force at Point A.In terms of Eq. (3), the electromagnetic volume force atten-
ates rapidly from Point A to the center of the billets and thelectromagnetic volume force at Point A and its attenuation ratencreases with the increase of electromagnetic frequency, as seenn Fig. 4(a). However, as seen from the electromagnetic volume
orce from the surface to the center of the billets in Fig. 4(b), thelectromagnetic volume force within the billets under 50 Hz isarger than that under 100 Hz though FA under 100 Hz is greaterhan that under 50 Hz. It is reason that the attenuating rate of theold (a) and the surface of the billets (b) to the center of the billets on the given
180 H. Zhang et al. / Materials Science and Engineering A 448 (2007) 177–188
agne
eu
3
dtplsFoaetnitcmtvt(a
meofoiInfdi
3t
epsnsn
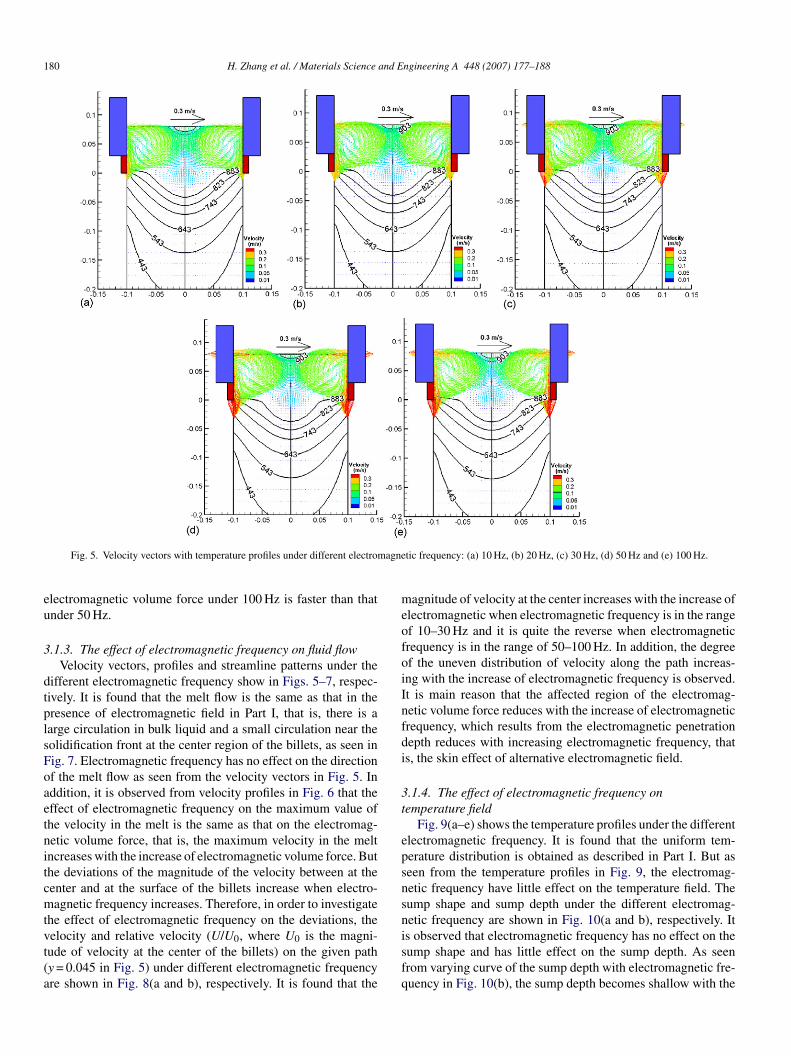
Fig. 5. Velocity vectors with temperature profiles under different electrom
lectromagnetic volume force under 100 Hz is faster than thatnder 50 Hz.
.1.3. The effect of electromagnetic frequency on fluid flowVelocity vectors, profiles and streamline patterns under the
ifferent electromagnetic frequency show in Figs. 5–7, respec-ively. It is found that the melt flow is the same as that in theresence of electromagnetic field in Part I, that is, there is aarge circulation in bulk liquid and a small circulation near theolidification front at the center region of the billets, as seen inig. 7. Electromagnetic frequency has no effect on the directionf the melt flow as seen from the velocity vectors in Fig. 5. Inddition, it is observed from velocity profiles in Fig. 6 that theffect of electromagnetic frequency on the maximum value ofhe velocity in the melt is the same as that on the electromag-etic volume force, that is, the maximum velocity in the meltncreases with the increase of electromagnetic volume force. Buthe deviations of the magnitude of the velocity between at theenter and at the surface of the billets increase when electro-agnetic frequency increases. Therefore, in order to investigate
he effect of electromagnetic frequency on the deviations, the
elocity and relative velocity (U/U0, where U0 is the magni-ude of velocity at the center of the billets) on the given pathy = 0.045 in Fig. 5) under different electromagnetic frequencyre shown in Fig. 8(a and b), respectively. It is found that theisfq
tic frequency: (a) 10 Hz, (b) 20 Hz, (c) 30 Hz, (d) 50 Hz and (e) 100 Hz.
agnitude of velocity at the center increases with the increase oflectromagnetic when electromagnetic frequency is in the rangef 10–30 Hz and it is quite the reverse when electromagneticrequency is in the range of 50–100 Hz. In addition, the degreef the uneven distribution of velocity along the path increas-ng with the increase of electromagnetic frequency is observed.t is main reason that the affected region of the electromag-etic volume force reduces with the increase of electromagneticrequency, which results from the electromagnetic penetrationepth reduces with increasing electromagnetic frequency, thats, the skin effect of alternative electromagnetic field.
.1.4. The effect of electromagnetic frequency onemperature field
Fig. 9(a–e) shows the temperature profiles under the differentlectromagnetic frequency. It is found that the uniform tem-erature distribution is obtained as described in Part I. But aseen from the temperature profiles in Fig. 9, the electromag-etic frequency have little effect on the temperature field. Theump shape and sump depth under the different electromag-etic frequency are shown in Fig. 10(a and b), respectively. It
s observed that electromagnetic frequency has no effect on theump shape and has little effect on the sump depth. As seenrom varying curve of the sump depth with electromagnetic fre-uency in Fig. 10(b), the sump depth becomes shallow with the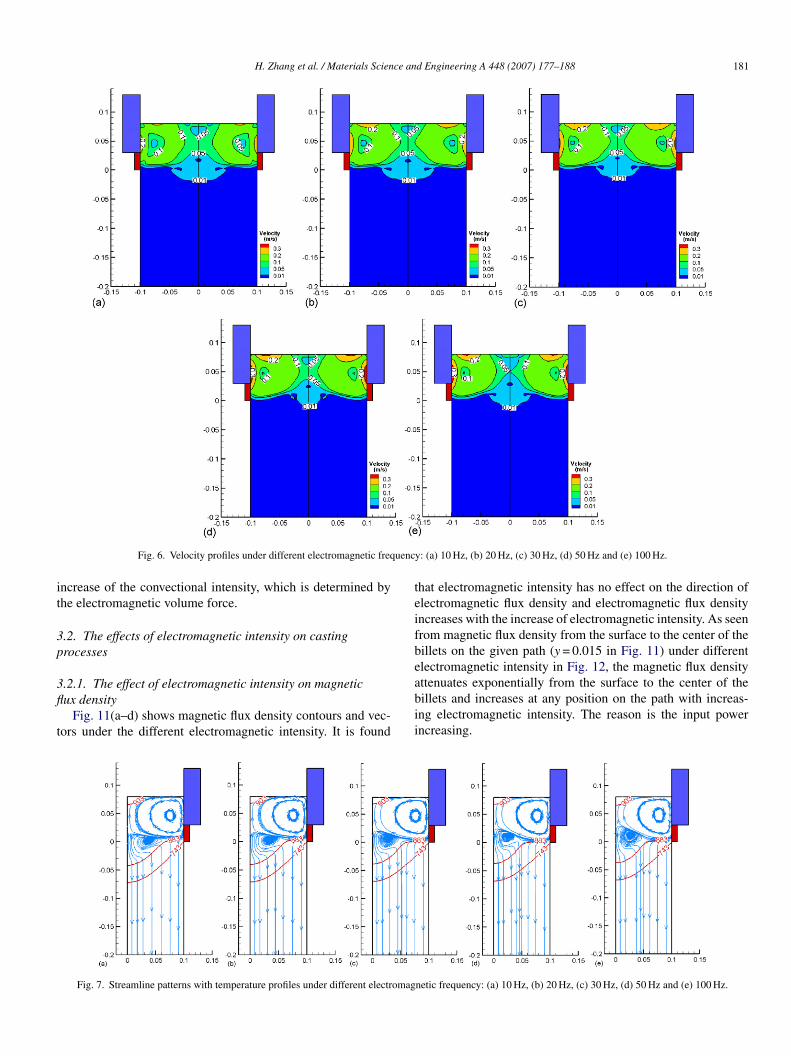
H. Zhang et al. / Materials Science and Engineering A 448 (2007) 177–188 181
uenc
it
3p
3fl
t
teifbe
Fig. 6. Velocity profiles under different electromagnetic freq
ncrease of the convectional intensity, which is determined byhe electromagnetic volume force.
.2. The effects of electromagnetic intensity on castingrocesses
.2.1. The effect of electromagnetic intensity on magneticux density
Fig. 11(a–d) shows magnetic flux density contours and vec-ors under the different electromagnetic intensity. It is found
abii
Fig. 7. Streamline patterns with temperature profiles under different electromag
y: (a) 10 Hz, (b) 20 Hz, (c) 30 Hz, (d) 50 Hz and (e) 100 Hz.
hat electromagnetic intensity has no effect on the direction oflectromagnetic flux density and electromagnetic flux densityncreases with the increase of electromagnetic intensity. As seenrom magnetic flux density from the surface to the center of theillets on the given path (y = 0.015 in Fig. 11) under differentlectromagnetic intensity in Fig. 12, the magnetic flux density
ttenuates exponentially from the surface to the center of theillets and increases at any position on the path with increas-ng electromagnetic intensity. The reason is the input powerncreasing.netic frequency: (a) 10 Hz, (b) 20 Hz, (c) 30 Hz, (d) 50 Hz and (e) 100 Hz.

182 H. Zhang et al. / Materials Science and Engineering A 448 (2007) 177–188
Fig. 8. Velocity (a) and relative velocity (b) on the given path (y = 0.045 in Fig. 5) under different electromagnetic frequency.
equen
3a
tssfiatu
mtpi
3
Fig. 9. Temperature profiles under different electromagnetic fr
.2.2. The effect of electromagnetic intensity on timeverage electromagnetic volume force density
The time average electromagnetic volume force density con-ours and vectors under different electromagnetic intensity arehown in Fig. 13(a–d). It is observed that electromagnetic inten-ity has no effect on the direction of the electromagnetic volumeorce and the electromagnetic volume force increases with the
ncrease of electromagnetic intensity. As seen from the timeverage electromagnetic volume force density from the surfaceo the center of the billets on the given path (y = 0.015 in Fig. 13)nder different electromagnetic intensity in Fig. 14, the electro-trie
Fig. 10. The effects of electromagnetic frequenc
cy: (a) 10 Hz, (b) 20 Hz, (c) 30 Hz, (d) 50 Hz and (e) 100 Hz.
agnetic volume force attenuates exponentially from the surfaceo the center of the billets and increases at any position on theath with increasing electromagnetic intensity. The reason is thenput power increasing.
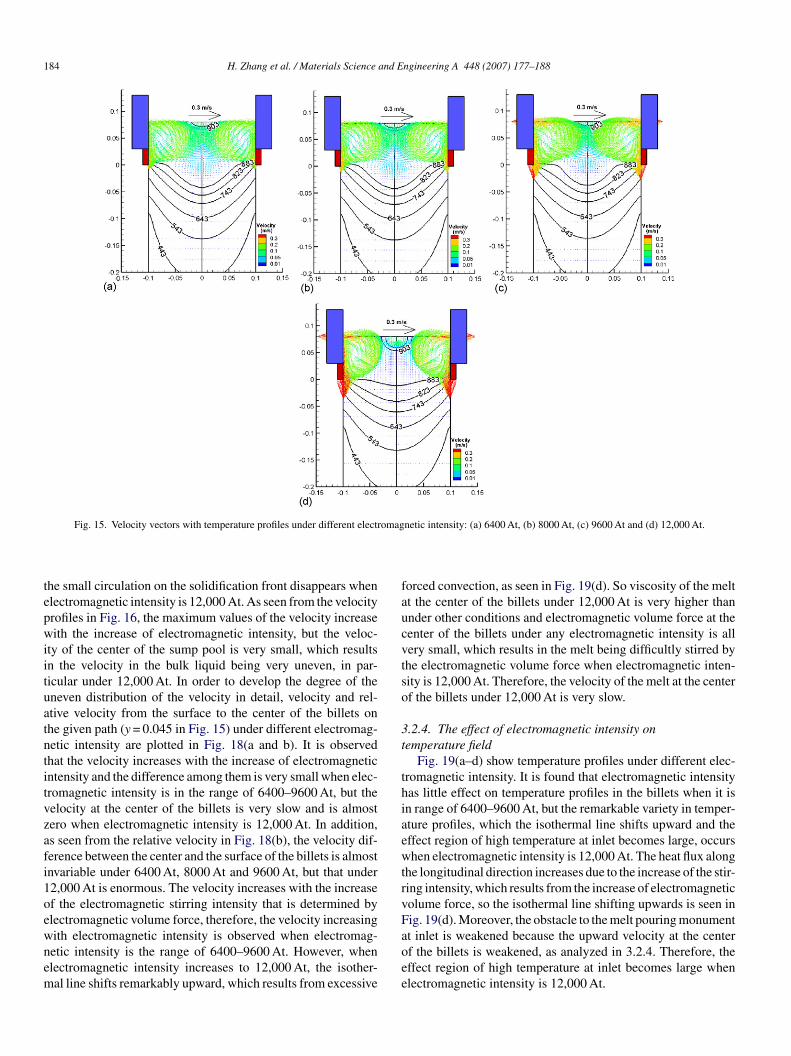
.2.3. The effect of electromagnetic intensity on fluid flowThe velocity vectors, profiles and streamline patterns under
he different electromagnetic intensity are shown in Figs. 15–17,espectively. It is observed that the direction of the melt flowsn’t modified in the increase of electromagnetic intensity whenlectromagnetic intensity is in the range of 6400–9600 At, but
y on (a) sump shape and (b) sump depth.

H. Zhang et al. / Materials Science and Engineering A 448 (2007) 177–188 183
Fig. 11. Magnetic flux density contours and vectors under different electromagnetic intensity: (a) 6400 At, (b) 8000 At, (c) 9600 At and (d) 12,000 At.
Fd
Fa
ig. 12. Magnetic flux density on the given path (y = 0.015 in Fig. 12) underifferent electromagnetic intensity.
F(
ig. 13. Time average electromagnetic volume force density contours and vectors und (d) 12,000 At.
ig. 14. Time average electromagnetic volume force density on the given pathy = 0.015 in Fig. 14) under different electromagnetic intensity.
nder different electromagnetic intensity: (a) 6400 At, (b) 8000 At, (c) 9600 At
184 H. Zhang et al. / Materials Science and Engineering A 448 (2007) 177–188
omag
tepwiituatntitvzafi1oewnem
faucvtso
3t
thiaewtrvF
Fig. 15. Velocity vectors with temperature profiles under different electr
he small circulation on the solidification front disappears whenlectromagnetic intensity is 12,000 At. As seen from the velocityrofiles in Fig. 16, the maximum values of the velocity increaseith the increase of electromagnetic intensity, but the veloc-
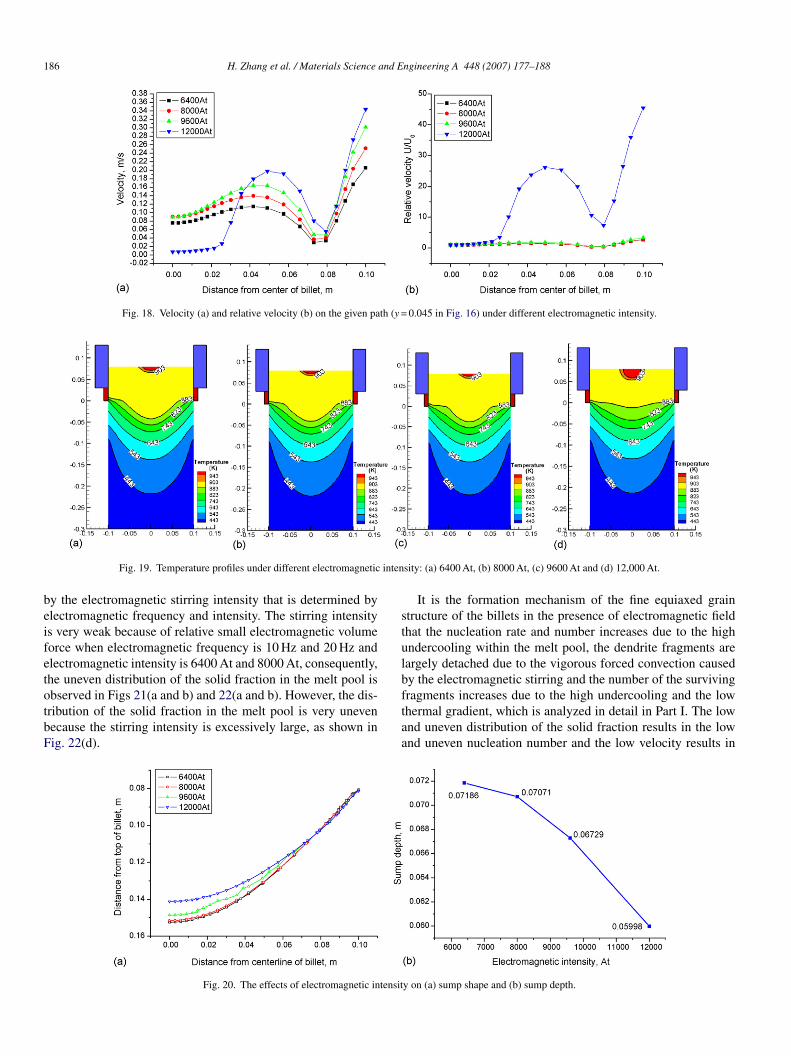
ty of the center of the sump pool is very small, which resultsn the velocity in the bulk liquid being very uneven, in par-icular under 12,000 At. In order to develop the degree of theneven distribution of the velocity in detail, velocity and rel-tive velocity from the surface to the center of the billets onhe given path (y = 0.045 in Fig. 15) under different electromag-etic intensity are plotted in Fig. 18(a and b). It is observedhat the velocity increases with the increase of electromagneticntensity and the difference among them is very small when elec-romagnetic intensity is in the range of 6400–9600 At, but theelocity at the center of the billets is very slow and is almostero when electromagnetic intensity is 12,000 At. In addition,s seen from the relative velocity in Fig. 18(b), the velocity dif-erence between the center and the surface of the billets is almostnvariable under 6400 At, 8000 At and 9600 At, but that under2,000 At is enormous. The velocity increases with the increasef the electromagnetic stirring intensity that is determined bylectromagnetic volume force, therefore, the velocity increasing
ith electromagnetic intensity is observed when electromag-etic intensity is the range of 6400–9600 At. However, whenlectromagnetic intensity increases to 12,000 At, the isother-al line shifts remarkably upward, which results from excessiveaoee
netic intensity: (a) 6400 At, (b) 8000 At, (c) 9600 At and (d) 12,000 At.
orced convection, as seen in Fig. 19(d). So viscosity of the meltt the center of the billets under 12,000 At is very higher thannder other conditions and electromagnetic volume force at theenter of the billets under any electromagnetic intensity is allery small, which results in the melt being difficultly stirred byhe electromagnetic volume force when electromagnetic inten-ity is 12,000 At. Therefore, the velocity of the melt at the centerf the billets under 12,000 At is very slow.
.2.4. The effect of electromagnetic intensity onemperature field
Fig. 19(a–d) show temperature profiles under different elec-romagnetic intensity. It is found that electromagnetic intensityas little effect on temperature profiles in the billets when it isn range of 6400–9600 At, but the remarkable variety in temper-ture profiles, which the isothermal line shifts upward and theffect region of high temperature at inlet becomes large, occurshen electromagnetic intensity is 12,000 At. The heat flux along
he longitudinal direction increases due to the increase of the stir-ing intensity, which results from the increase of electromagneticolume force, so the isothermal line shifting upwards is seen inig. 19(d). Moreover, the obstacle to the melt pouring monument
t inlet is weakened because the upward velocity at the centerf the billets is weakened, as analyzed in 3.2.4. Therefore, theffect region of high temperature at inlet becomes large whenlectromagnetic intensity is 12,000 At.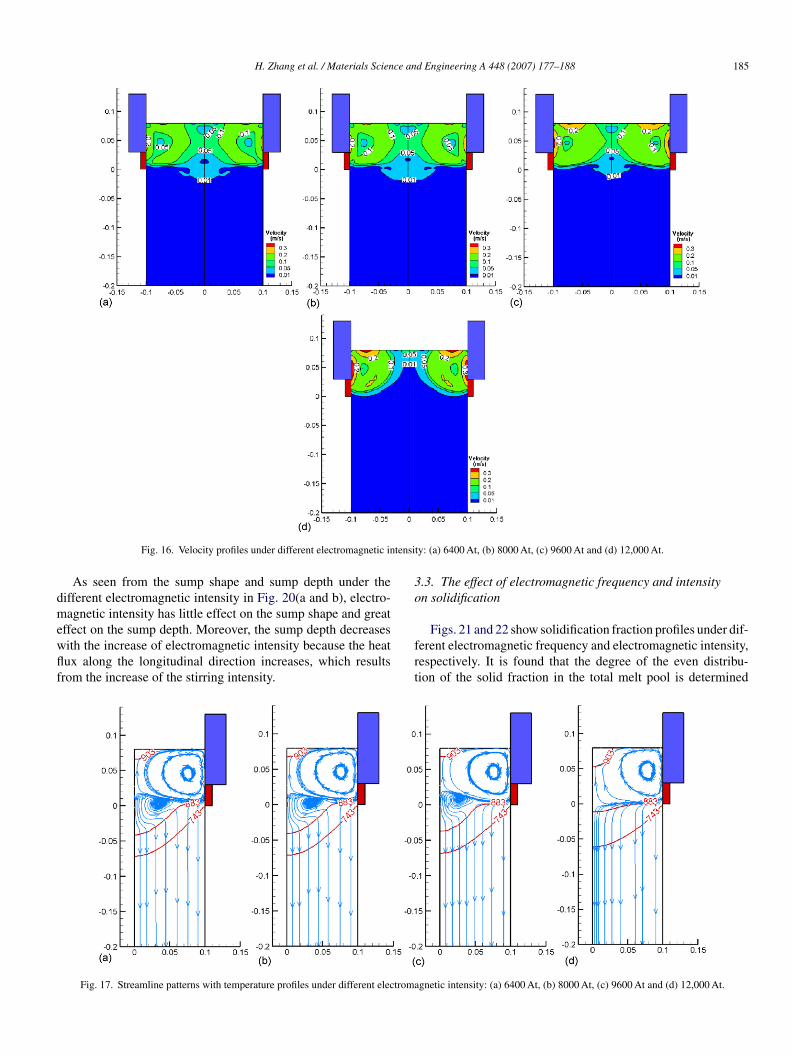
H. Zhang et al. / Materials Science and Engineering A 448 (2007) 177–188 185
tensi
dmewflf
3o
Fig. 16. Velocity profiles under different electromagnetic in
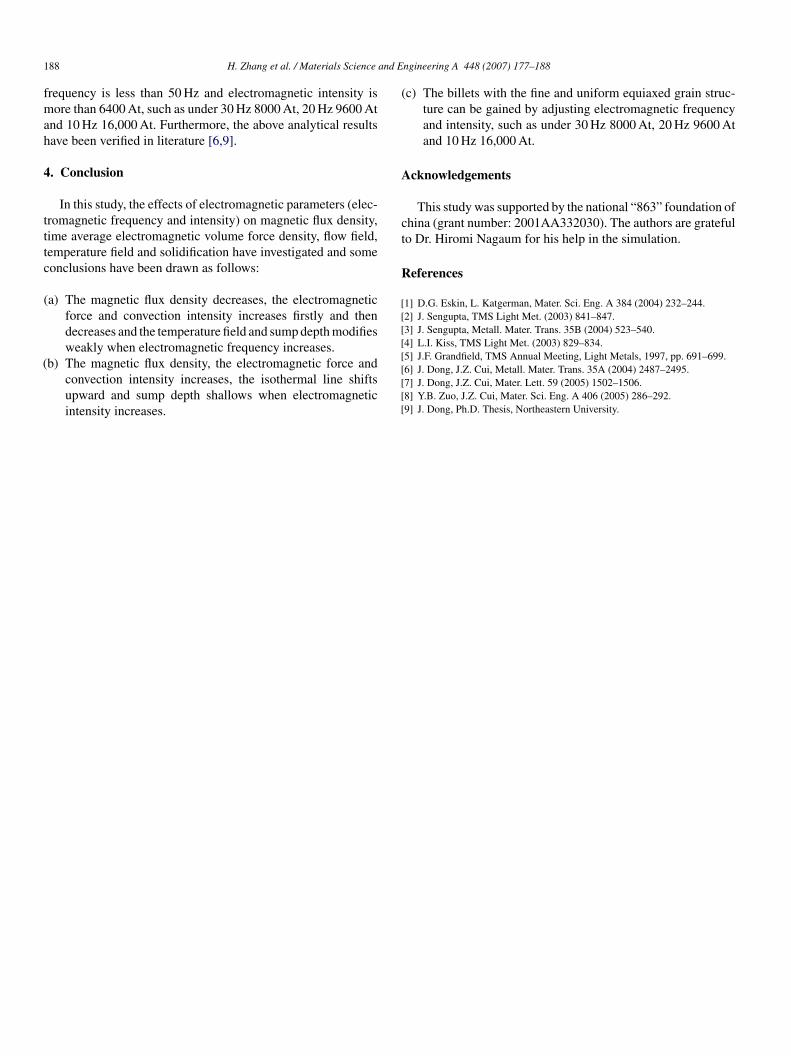
As seen from the sump shape and sump depth under theifferent electromagnetic intensity in Fig. 20(a and b), electro-agnetic intensity has little effect on the sump shape and great
ffect on the sump depth. Moreover, the sump depth decreasesith the increase of electromagnetic intensity because the heatux along the longitudinal direction increases, which resultsrom the increase of the stirring intensity.
frt
Fig. 17. Streamline patterns with temperature profiles under different electroma
ty: (a) 6400 At, (b) 8000 At, (c) 9600 At and (d) 12,000 At.
.3. The effect of electromagnetic frequency and intensityn solidification
Figs. 21 and 22 show solidification fraction profiles under dif-erent electromagnetic frequency and electromagnetic intensity,espectively. It is found that the degree of the even distribu-ion of the solid fraction in the total melt pool is determined
gnetic intensity: (a) 6400 At, (b) 8000 At, (c) 9600 At and (d) 12,000 At.
186 H. Zhang et al. / Materials Science and Engineering A 448 (2007) 177–188
Fig. 18. Velocity (a) and relative velocity (b) on the given path (y = 0.045 in Fig. 16) under different electromagnetic intensity.
inten
beifetotbF
stulb
Fig. 19. Temperature profiles under different electromagnetic
y the electromagnetic stirring intensity that is determined bylectromagnetic frequency and intensity. The stirring intensitys very weak because of relative small electromagnetic volumeorce when electromagnetic frequency is 10 Hz and 20 Hz andlectromagnetic intensity is 6400 At and 8000 At, consequently,he uneven distribution of the solid fraction in the melt pool is
bserved in Figs 21(a and b) and 22(a and b). However, the dis-ribution of the solid fraction in the melt pool is very unevenecause the stirring intensity is excessively large, as shown inig. 22(d).ftaa
Fig. 20. The effects of electromagnetic intensit
sity: (a) 6400 At, (b) 8000 At, (c) 9600 At and (d) 12,000 At.
It is the formation mechanism of the fine equiaxed graintructure of the billets in the presence of electromagnetic fieldhat the nucleation rate and number increases due to the highndercooling within the melt pool, the dendrite fragments areargely detached due to the vigorous forced convection causedy the electromagnetic stirring and the number of the surviving
ragments increases due to the high undercooling and the lowhermal gradient, which is analyzed in detail in Part I. The lownd uneven distribution of the solid fraction results in the lownd uneven nucleation number and the low velocity results iny on (a) sump shape and (b) sump depth.

H. Zhang et al. / Materials Science and Engineering A 448 (2007) 177–188 187
frequency: (a) 10 Hz, (b) 20 Hz, (c) 30 Hz, (d) 50 Hz and (e) 100 Hz.
ddrpttIatftnscsTuDtdas
Table 1The effects of electromagnetic frequency and intensity on stirring intensity
Electromagnetic frequency (Hz)
10 20 30 50 100
Electromagnetic intensity (At)6,400 A A A A A and D8,000 A A B D D91
rsiomba
Fig. 21. Solid fraction profiles under different electromagnetic
ecreasing the number and the surviving chance of the detachedendrite fragments, which must lower the effect of the grainefining. Moreover, the low velocity at the center of the meltool and the uneven flow of the melt must result in producinghe coarse grain at the center of the billets and the uneven dis-ribution of the grain size along total cross-section of the billets.n addition, both the uneven distributions of the solid fractionnd the uneven flow of the melt are completely dependent onhe electromagnetic stirring intensity and uniformity, that is, theormer is due to excessively weak electromagnetic stirring andhe latter is due to excessively strong and uneven electromag-etic stirring. Therefore, in this research, the electromagnetictirring intensity and uniformity is considered as an importantriterion to judge whether the fine and uniform equiaxed graintructure of billets can be obtained during the LFEC process.able 1 lists electromagnetic stirring intensity and uniformitynder the different electromagnetic parameters, where A, C and
indicate the excessively weak, the excessively strong and
he uneven electromagnetic stirring, respectively. However, Benotes a meet electromagnetic stirring. According to the abovenalysis, the coarse grain and the uneven distribution of the grainize will be produced under the condition marking A, C and D,tee
Fig. 22. Solid fraction profiles under different electromagnetic inten
,600 A B C C and D D2,000 A C C C and D D
espectively. Nevertheless, the fine and uniform equiaxed graintructure of the billets will be obtained under the condition mark-ng B. Moreover, the meet electromagnetic stirring can also bebtained when electromagnetic frequency is 10 Hz and electro-agnetic intensity increases to 16,000 At. So the structure of the
illets cast under 10 Hz 16,000 At is also composed of the finend uniform equiaxed grain structure.
In summary, the meet electromagnetic stirring must occur inhe melt pool in order to gain the billets with the fine and uniformquiaxed grain structure, and it can be obtained by adjustinglectromagnetic frequency and intensity when electromagnetic
sity: (a) 6400 At, (b) 8000 At, (c) 9600 At and (d) 12,000 At.
1 and E
fmah
4
tttc
(
(
(
A
ct
R
[[[[
88 H. Zhang et al. / Materials Science
requency is less than 50 Hz and electromagnetic intensity isore than 6400 At, such as under 30 Hz 8000 At, 20 Hz 9600 At
nd 10 Hz 16,000 At. Furthermore, the above analytical resultsave been verified in literature [6,9].
. Conclusion
In this study, the effects of electromagnetic parameters (elec-romagnetic frequency and intensity) on magnetic flux density,ime average electromagnetic volume force density, flow field,emperature field and solidification have investigated and someonclusions have been drawn as follows:
a) The magnetic flux density decreases, the electromagneticforce and convection intensity increases firstly and thendecreases and the temperature field and sump depth modifiesweakly when electromagnetic frequency increases.
b) The magnetic flux density, the electromagnetic force andconvection intensity increases, the isothermal line shiftsupward and sump depth shallows when electromagneticintensity increases.
[[[[[
ngineering A 448 (2007) 177–188
c) The billets with the fine and uniform equiaxed grain struc-ture can be gained by adjusting electromagnetic frequencyand intensity, such as under 30 Hz 8000 At, 20 Hz 9600 Atand 10 Hz 16,000 At.
cknowledgements
This study was supported by the national “863” foundation ofhina (grant number: 2001AA332030). The authors are gratefulo Dr. Hiromi Nagaum for his help in the simulation.
eferences
1] D.G. Eskin, L. Katgerman, Mater. Sci. Eng. A 384 (2004) 232–244.2] J. Sengupta, TMS Light Met. (2003) 841–847.3] J. Sengupta, Metall. Mater. Trans. 35B (2004) 523–540.4] L.I. Kiss, TMS Light Met. (2003) 829–834.
5] J.F. Grandfield, TMS Annual Meeting, Light Metals, 1997, pp. 691–699.6] J. Dong, J.Z. Cui, Metall. Mater. Trans. 35A (2004) 2487–2495.7] J. Dong, J.Z. Cui, Mater. Lett. 59 (2005) 1502–1506.8] Y.B. Zuo, J.Z. Cui, Mater. Sci. Eng. A 406 (2005) 286–292.9] J. Dong, Ph.D. Thesis, Northeastern University.