Embed Size (px)
Citation preview
Pennsylvania Commission on Sentencing
State College Office: 009 Brumbaugh Hall Penn State University Park Campus
Mail: PO Box 1200 State College, PA 16804-1200
Phone: 814.863.2797
Fax: 814.863.2129
URL: http://pasentencing.us
County Sentencing Project
Report 1
County Time Served and Revocations
2013
The Commission is an agency of the General Assembly affiliated with The Pennsylvania State University.
1
Pennsylvania Commission on Sentencing
Report 1
County Time Served and Revocations
Highlights
This report presents findings from a project on county sentencing practices in eighteen counties. The
project involved collecting information on the amount of time served for county jail sentences, as well as
the sanctions imposed upon revocation of jail, probation or County Intermediate Punishment sentence.
The sample for this project consisted of 4,666 offenders convicted of 9 offenses [misdemeanor and felony
theft, misdemeanor and felony retail theft, misdemeanor and felony drugs, M and M1 DUI, and simple
assault]. The major findings are presented below:
Most offenders were released on bail or ROR [Release on Recognizance] prior to trial.
About 38% of the sample received a jail sentence, with an average minimum sentence of 3.6 months.
Felony drug offenders had the longest average minimum [6.5 months].
About 27% of the offenders sentenced to jail were released at the expiration of their minimum
sentence; 34% were released before, and 38% were released after the expiration of their minimum.
Among offenders who were released before the expiration of their minimum sentence, 18% were
released within two days of the minimum, 53% were within one month, and 93% within two months.
Among offenders who were released after the expiration of their minimum sentence, 13% were within
two days, 48% were within one month; and 85% were within two months.
The average amount of time served was 4.2 months, with the average time served prior to trial being
1.8 months and the average amount of time post sentencing being 2.4 months.
Felony offenders were more likely to be released before the expiration of their minimum sentence, and
misdemeanor offenders were more likely to be released beyond their minimum sentence.
There was quite a bit of variation among counties in the amount of time served by offenders. The
percentage of offenders released at the expiration of their minimum sentence ranged from 4% to 59%;
The range was broad for both the percentage released below and above the minimum sentence [15% to
55% and 5 to 61%, respectively].
About 38% of the offenders on probation or CIP and 40% of the offenders on parole had a violation
for their current offense. For all offenders the most common reason for a violation was non-payment
of fines. Most offenders with a violation had their sentence revoked.
About 54% of the offenders who had a probation or CIP revocation received a jail sentence as a result
of their revocation, with an average minimum sentence of 5 months. An additional 6% were sentenced
to prison, with an average minimum sentence of 13 months.
The violation rate was highest among retail theft offenders [both felony and misdemeanor] and lowest
among DUI offenders.
The violation rate among the counties ranged from 18% to 74%.
2
Pennsylvania Commission on Sentencing
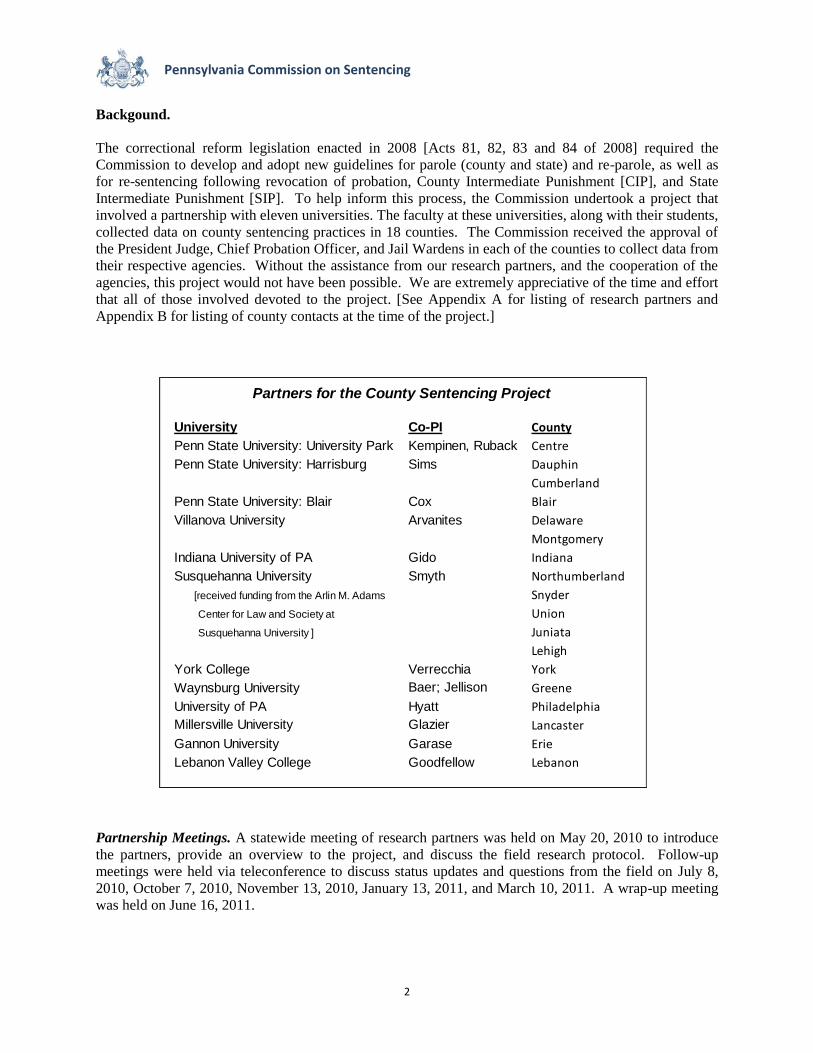
University Co-PI County
Penn State University: University Park Kempinen, Ruback Centre
Penn State University: Harrisburg Sims Dauphin
Cumberland
Penn State University: Blair Cox Blair
Villanova University Arvanites Delaware
Montgomery
Indiana University of PA Gido Indiana
Susquehanna University Smyth Northumberland
[received funding from the Arlin M. Adams Snyder
Center for Law and Society at Union
Susquehanna University ] Juniata
Lehigh
York College Verrecchia York
Waynsburg University Baer; Jellison Greene
University of PA Hyatt Philadelphia
Millersville University Glazier Lancaster
Gannon University Garase Erie
Lebanon Valley College Goodfellow Lebanon
Partners for the County Sentencing Project
Backgound.
The correctional reform legislation enacted in 2008 [Acts 81, 82, 83 and 84 of 2008] required the
Commission to develop and adopt new guidelines for parole (county and state) and re-parole, as well as
for re-sentencing following revocation of probation, County Intermediate Punishment [CIP], and State
Intermediate Punishment [SIP]. To help inform this process, the Commission undertook a project that
involved a partnership with eleven universities. The faculty at these universities, along with their students,
collected data on county sentencing practices in 18 counties. The Commission received the approval of
the President Judge, Chief Probation Officer, and Jail Wardens in each of the counties to collect data from
their respective agencies. Without the assistance from our research partners, and the cooperation of the
agencies, this project would not have been possible. We are extremely appreciative of the time and effort
that all of those involved devoted to the project. [See Appendix A for listing of research partners and
Appendix B for listing of county contacts at the time of the project.]
Partnership Meetings. A statewide meeting of research partners was held on May 20, 2010 to introduce
the partners, provide an overview to the project, and discuss the field research protocol. Follow-up
meetings were held via teleconference to discuss status updates and questions from the field on July 8,
2010, October 7, 2010, November 13, 2010, January 13, 2011, and March 10, 2011. A wrap-up meeting
was held on June 16, 2011.
3
Pennsylvania Commission on Sentencing
Project goals
The major purpose of the project was to obtain information on county sentencing practices that would
assist the Commission in the implementation of their new responsibilities of developing guidelines for
parole, re-parole, and resentencing. Specifically, the project had four primary objectives:
What is the amount of time served on county jail sentences? The Commission on Sentencing collects
information of all convictions for felonies and misdemeanors. While the Commission has the type and
length of sentence imposed, it does not have information on the actual amount of time served on these
sentences. In order for the Commission to develop parole guidelines at the county level, we first needed
to obtain some information on current paroling practices. As judges have the paroling authority for
county jail sentences, and counties can determine their own ‘good time’ policies, a defendant can be
released prior to the expiration of the minimum sentence.1 Further, since Pennsylvania statute requires
the imposition of a minimum and maximum sentence, a defendant can also be held in jail up to the
maximum sentence imposed.
What factors result in the revocation of probation and county intermediate punishment, and what
sentence is imposed as a result of revocation? In addition to the development of parole guidelines, the
Commission has also been mandated to develop guidelines for resentencing following the revocation of
probation and county intermediate punishment. Since the Commission did not collect information on
violations or revocations at the time of this project, the second objective of this project was to collect this
information.2
What factors result in the revocation of county parole, and how much time is served as a result of the
revocation? Act 81 of 2008 mandated the Commission to develop guidelines not only for county parole,
but for re-parole as well. Thus, in addition to collecting information on the amount of time served on the
original sentence imposed, we also asked for information on revocation of county parole. Upon
revocation the judge imposes the balance of the original sentence to be served. The court may, on cause
shown by the probation officer that the inmate has violated his parole, recommit and reparole the inmate
in the same manner and by the same procedure as in the case of the original parole if, in the judgment of
the court, there is a reasonable probability that the inmate will benefit from being paroled. The court may
also recommit for violation of that parole. (42 Pa.C.S.A. §9776(e)). The judge then has the authority of
re-paroling the offenders.
What factors predict future recidivism? Act 81 of 2008 also mandated that, in the development of
guidelines for parole, the guidelines consider a validated risk assessment tool. The Commission has
underway another project that is working on the development of a risk assessment instrument. That
project primarily includes criminal justice factors, along with a limited number of demographic factors.
Other information, such as substance abuse, education, and employment is not readily available. Thus, a
fourth objective of this project was to obtain information beyond criminal justice factors to see their
contribution in the prediction of recidivism.
1 Act 81 of 2008 revised the judge’s paroling authority for county jail sentences. Judges may only parole an offender prior to
the expiration of their minimum sentence if the offender was made eligible to participate in a reentry plan at the time of sentencing. However, this policy was not yet in effect for our sample. 2 The Commission started to collect information on revocations in November 2011.
4
Pennsylvania Commission on Sentencing
This report discusses the findings from the first three goals. A subsequent report will provide findings
from the recidivism study.
Data Collection Process
The Commission submitted this project for IRB approval at Penn State University in February 2010, and
received approval in May 2010. At that point we had partnerships with faculty at seven universities
involved with data collection in sixteen counties [including PSU/UP]. Data collection in these counties
began in the summer of 2010. Subsequently, we had five additional universities join the project, with
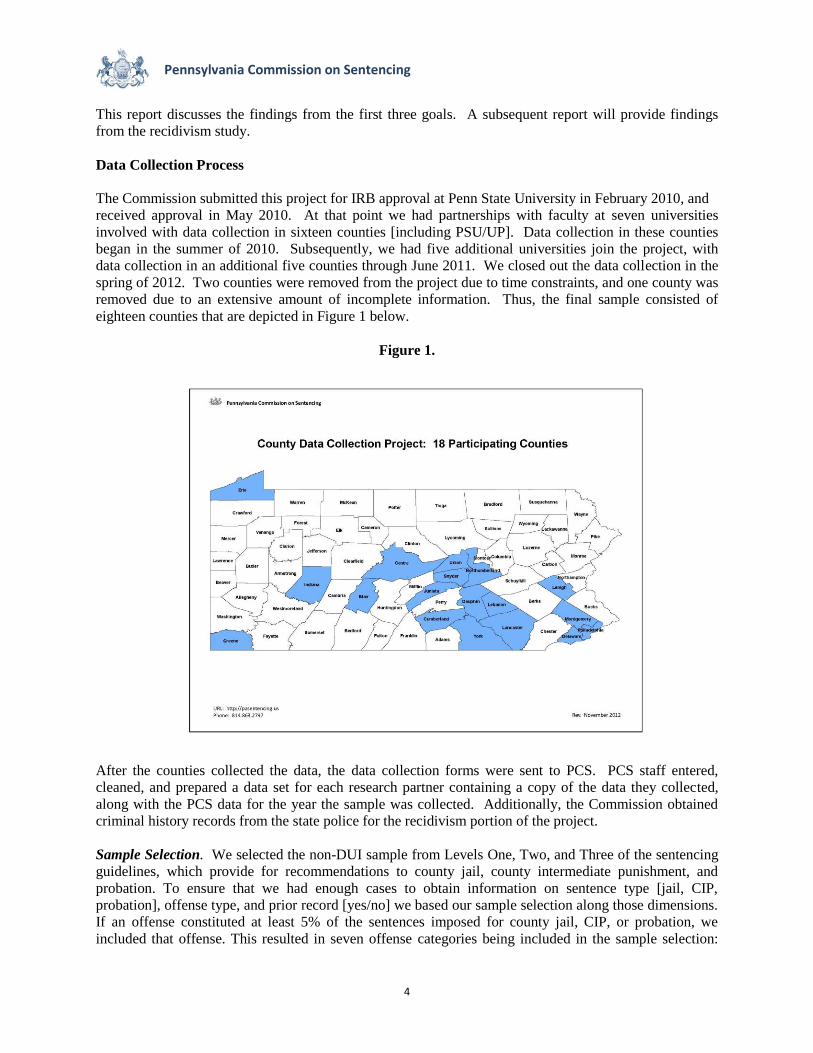
data collection in an additional five counties through June 2011. We closed out the data collection in the
spring of 2012. Two counties were removed from the project due to time constraints, and one county was
removed due to an extensive amount of incomplete information. Thus, the final sample consisted of
eighteen counties that are depicted in Figure 1 below.
Figure 1.
After the counties collected the data, the data collection forms were sent to PCS. PCS staff entered,
cleaned, and prepared a data set for each research partner containing a copy of the data they collected,
along with the PCS data for the year the sample was collected. Additionally, the Commission obtained
criminal history records from the state police for the recidivism portion of the project.
Sample Selection. We selected the non-DUI sample from Levels One, Two, and Three of the sentencing
guidelines, which provide for recommendations to county jail, county intermediate punishment, and
probation. To ensure that we had enough cases to obtain information on sentence type [jail, CIP,
probation], offense type, and prior record [yes/no] we based our sample selection along those dimensions.
If an offense constituted at least 5% of the sentences imposed for county jail, CIP, or probation, we
included that offense. This resulted in seven offense categories being included in the sample selection:
5
Pennsylvania Commission on Sentencing
felony theft, misdemeanor theft, felony retail theft, misdemeanor retail theft, felony drug, misdemeanor
drug, and simple assault. These seven offenses also allow the opportunity to conduct analysis with
respect to offense type: property, personal, and drug. For the DUI sample, we randomly selected ten
cases from each sentence type for each county to obtain a sample consisting of about 300 DUI cases,
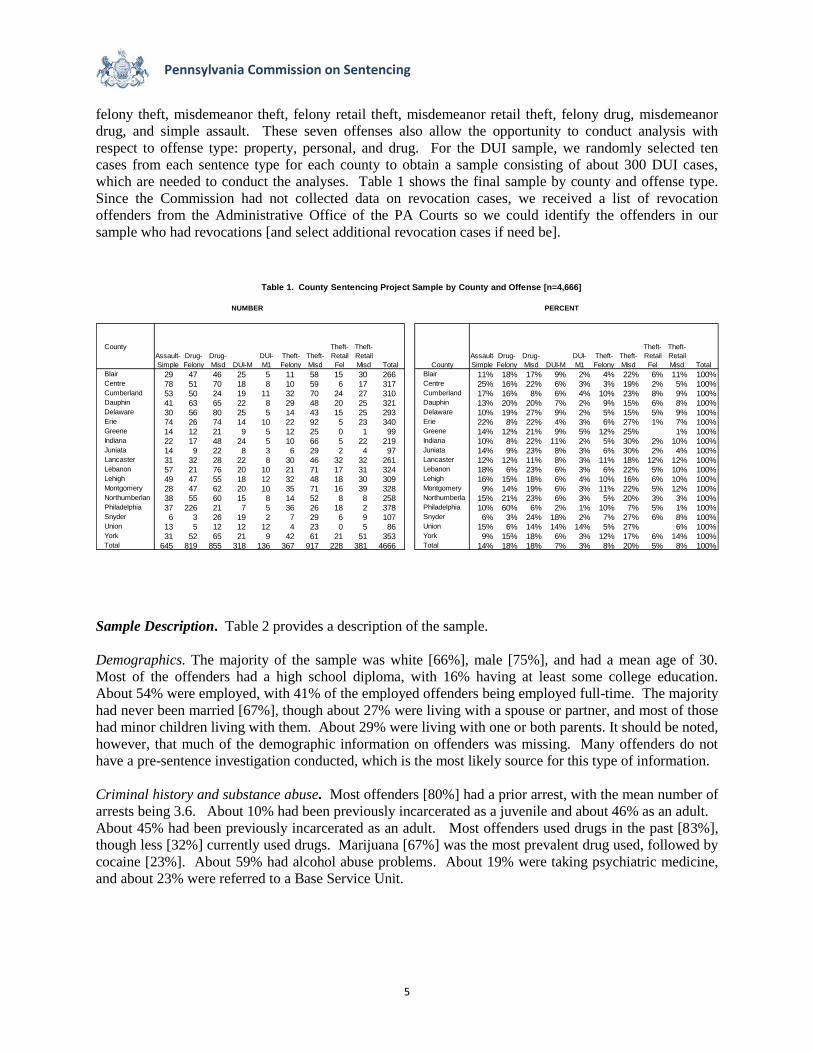
which are needed to conduct the analyses. Table 1 shows the final sample by county and offense type.
Since the Commission had not collected data on revocation cases, we received a list of revocation
offenders from the Administrative Office of the PA Courts so we could identify the offenders in our
sample who had revocations [and select additional revocation cases if need be].
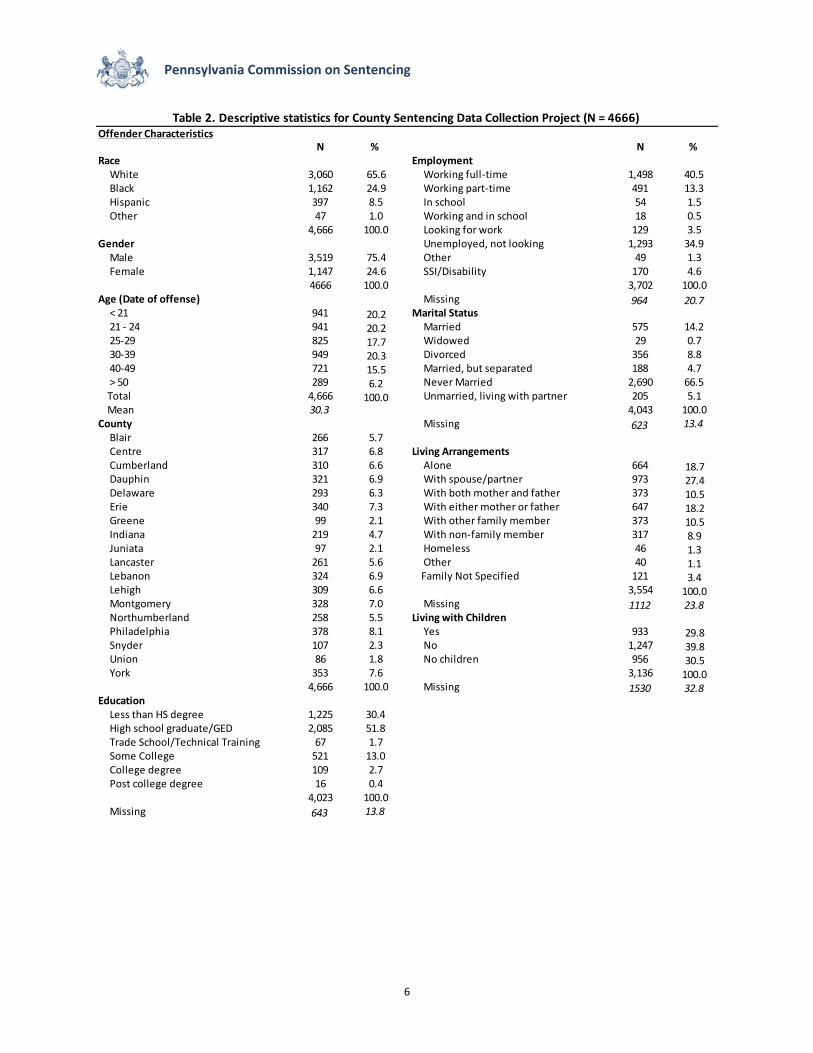
Sample Description. Table 2 provides a description of the sample.
Demographics. The majority of the sample was white [66%], male [75%], and had a mean age of 30.
Most of the offenders had a high school diploma, with 16% having at least some college education.
About 54% were employed, with 41% of the employed offenders being employed full-time. The majority
had never been married [67%], though about 27% were living with a spouse or partner, and most of those
had minor children living with them. About 29% were living with one or both parents. It should be noted,
however, that much of the demographic information on offenders was missing. Many offenders do not
have a pre-sentence investigation conducted, which is the most likely source for this type of information.
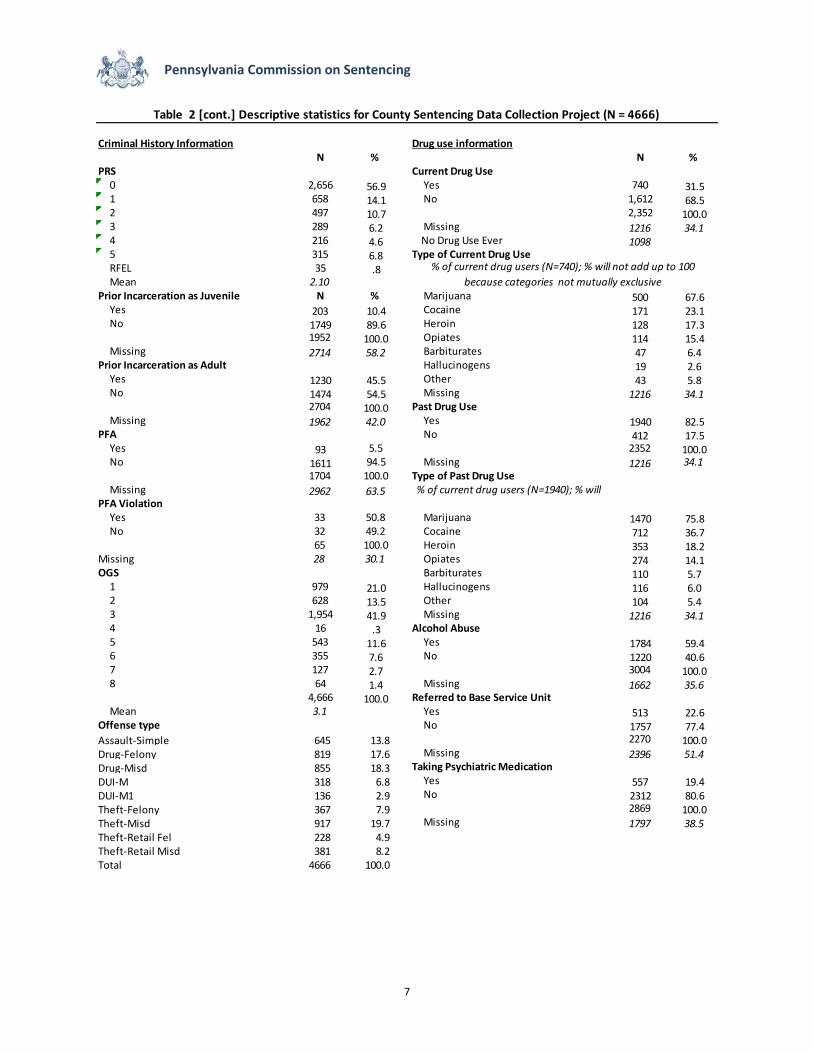
Criminal history and substance abuse. Most offenders [80%] had a prior arrest, with the mean number of
arrests being 3.6. About 10% had been previously incarcerated as a juvenile and about 46% as an adult.
About 45% had been previously incarcerated as an adult. Most offenders used drugs in the past [83%],
though less [32%] currently used drugs. Marijuana [67%] was the most prevalent drug used, followed by
cocaine [23%]. About 59% had alcohol abuse problems. About 19% were taking psychiatric medicine,
and about 23% were referred to a Base Service Unit.
NUMBER PERCENT
County
Assault-
Simple
Drug-
Felony
Drug-
Misd DUI-M
DUI-
M1
Theft-
Felony
Theft-
Misd
Theft-
Retail
Fel
Theft-
Retail
Misd Total County
Assault-
Simple
Drug-
Felony
Drug-
Misd DUI-M
DUI-
M1
Theft-
Felony
Theft-
Misd
Theft-
Retail
Fel
Theft-
Retail
Misd Total
Blair 29 47 46 25 5 11 58 15 30 266 Blair 11% 18% 17% 9% 2% 4% 22% 6% 11% 100%Centre 78 51 70 18 8 10 59 6 17 317 Centre 25% 16% 22% 6% 3% 3% 19% 2% 5% 100%Cumberland 53 50 24 19 11 32 70 24 27 310 Cumberland 17% 16% 8% 6% 4% 10% 23% 8% 9% 100%Dauphin 41 63 65 22 8 29 48 20 25 321 Dauphin 13% 20% 20% 7% 2% 9% 15% 6% 8% 100%Delaware 30 56 80 25 5 14 43 15 25 293 Delaware 10% 19% 27% 9% 2% 5% 15% 5% 9% 100%Erie 74 26 74 14 10 22 92 5 23 340 Erie 22% 8% 22% 4% 3% 6% 27% 1% 7% 100%Greene 14 12 21 9 5 12 25 0 1 99 Greene 14% 12% 21% 9% 5% 12% 25% 1% 100%Indiana 22 17 48 24 5 10 66 5 22 219 Indiana 10% 8% 22% 11% 2% 5% 30% 2% 10% 100%Juniata 14 9 22 8 3 6 29 2 4 97 Juniata 14% 9% 23% 8% 3% 6% 30% 2% 4% 100%Lancaster 31 32 28 22 8 30 46 32 32 261 Lancaster 12% 12% 11% 8% 3% 11% 18% 12% 12% 100%Lebanon 57 21 76 20 10 21 71 17 31 324 Lebanon 18% 6% 23% 6% 3% 6% 22% 5% 10% 100%Lehigh 49 47 55 18 12 32 48 18 30 309 Lehigh 16% 15% 18% 6% 4% 10% 16% 6% 10% 100%Montgomery 28 47 62 20 10 35 71 16 39 328 Montgomery 9% 14% 19% 6% 3% 11% 22% 5% 12% 100%Northumberlan
d38 55 60 15 8 14 52 8 8 258 Northumberla
nd15% 21% 23% 6% 3% 5% 20% 3% 3% 100%
Philadelphia 37 226 21 7 5 36 26 18 2 378 Philadelphia 10% 60% 6% 2% 1% 10% 7% 5% 1% 100%Snyder 6 3 26 19 2 7 29 6 9 107 Snyder 6% 3% 24% 18% 2% 7% 27% 6% 8% 100%Union 13 5 12 12 12 4 23 0 5 86 Union 15% 6% 14% 14% 14% 5% 27% 6% 100%York 31 52 65 21 9 42 61 21 51 353 York 9% 15% 18% 6% 3% 12% 17% 6% 14% 100%Total 645 819 855 318 136 367 917 228 381 4666 Total 14% 18% 18% 7% 3% 8% 20% 5% 8% 100%
Table 1. County Sentencing Project Sample by County and Offense [n=4,666]
6
Pennsylvania Commission on Sentencing
Offender CharacteristicsN % N %
Race Employment White 3,060 65.6 Working full-time 1,498 40.5 Black 1,162 24.9 Working part-time 491 13.3 Hispanic 397 8.5 In school 54 1.5 Other 47 1.0 Working and in school 18 0.5
4,666 100.0 Looking for work 129 3.5Gender Unemployed, not looking 1,293 34.9 Male 3,519 75.4 Other 49 1.3 Female 1,147 24.6 SSI/Disability 170 4.6
4666 100.0 3,702 100.0Age (Date of offense) Missing 964 20.7 < 21 941 20.2 Marital Status 21 - 24 941 20.2 Married 575 14.2 25-29 825 17.7 Widowed 29 0.7 30-39 949 20.3 Divorced 356 8.8
40-49 721 15.5 Married, but separated 188 4.7 > 50 289 6.2 Never Married 2,690 66.5 Total 4,666 100.0 Unmarried, living with partner 205 5.1 Mean 30.3 4,043 100.0County Missing 623 13.4 Blair 266 5.7 Centre 317 6.8 Living Arrangements Cumberland 310 6.6 Alone 664 18.7 Dauphin 321 6.9 With spouse/partner 973 27.4 Delaware 293 6.3 With both mother and father 373 10.5 Erie 340 7.3 With either mother or father 647 18.2 Greene 99 2.1 With other family member 373 10.5 Indiana 219 4.7 With non-family member 317 8.9 Juniata 97 2.1 Homeless 46 1.3 Lancaster 261 5.6 Other 40 1.1 Lebanon 324 6.9 Family Not Specified 121 3.4 Lehigh 309 6.6 3,554 100.0 Montgomery 328 7.0 Missing 1112 23.8 Northumberland 258 5.5 Living with Children Philadelphia 378 8.1 Yes 933 29.8 Snyder 107 2.3 No 1,247 39.8 Union 86 1.8 No children 956 30.5 York 353 7.6 3,136 100.0
4,666 100.0 Missing 1530 32.8Education Less than HS degree 1,225 30.4 High school graduate/GED 2,085 51.8 Trade School/Technical Training 67 1.7 Some College 521 13.0 College degree 109 2.7 Post college degree 16 0.4
4,023 100.0 Missing 643 13.8
Table 2. Descriptive statistics for County Sentencing Data Collection Project (N = 4666)
7
Pennsylvania Commission on Sentencing
Criminal History Information Drug use informationN % N %
PRS Current Drug Use 0 2,656 56.9 Yes 740 31.5 1 658 14.1 No 1,612 68.5 2 497 10.7 2,352 100.0 3 289 6.2 Missing 1216 34.1 4 216 4.6 No Drug Use Ever 1098 5 315 6.8 Type of Current Drug Use RFEL 35 .8 Mean 2.10Prior Incarceration as Juvenile N % Marijuana 500 67.6 Yes 203 10.4 Cocaine 171 23.1 No 1749 89.6 Heroin 128 17.3
1952 100.0 Opiates 114 15.4 Missing 2714 58.2 Barbiturates 47 6.4Prior Incarceration as Adult Hallucinogens 19 2.6 Yes 1230 45.5 Other 43 5.8 No 1474 54.5 Missing 1216 34.1
2704 100.0 Past Drug Use Missing 1962 42.0 Yes 1940 82.5PFA No 412 17.5 Yes 93 5.5 2352 100.0 No 1611 94.5 Missing 1216 34.1
1704 100.0 Type of Past Drug Use Missing 2962 63.5 % of current drug users (N=1940); % will PFA Violation Yes 33 50.8 Marijuana 1470 75.8 No 32 49.2 Cocaine 712 36.7
65 100.0 Heroin 353 18.2Missing 28 30.1 Opiates 274 14.1OGS Barbiturates 110 5.7 1 979 21.0 Hallucinogens 116 6.0 2 628 13.5 Other 104 5.4 3 1,954 41.9 Missing 1216 34.1 4 16 .3 Alcohol Abuse 5 543 11.6 Yes 1784 59.4 6 355 7.6 No 1220 40.6 7 127 2.7 3004 100.0 8 64 1.4 Missing 1662 35.6
4,666 100.0 Referred to Base Service Unit Mean 3.1 Yes 513 22.6Offense type No 1757 77.4Assault-Simple 645 13.8 2270 100.0Drug-Felony 819 17.6 Missing 2396 51.4Drug-Misd 855 18.3 Taking Psychiatric Medication
DUI-M 318 6.8 Yes 557 19.4DUI-M1 136 2.9 No 2312 80.6Theft-Felony 367 7.9 2869 100.0Theft-Misd 917 19.7 Missing 1797 38.5Theft-Retail Fel 228 4.9Theft-Retail Misd 381 8.2Total 4666 100.0
% of current drug users (N=740); % will not add up to 100
because categories not mutually exclusive
Table 2 [cont.] Descriptive statistics for County Sentencing Data Collection Project (N = 4666)
8
Pennsylvania Commission on Sentencing
Pre-trial Decision, Type of Sentence, and Time Served.
This section of the report provides information on the pre-trial decision, type of sentence imposed, and the
amount of time served on county jail sentences.
Pre-Trial Decision.
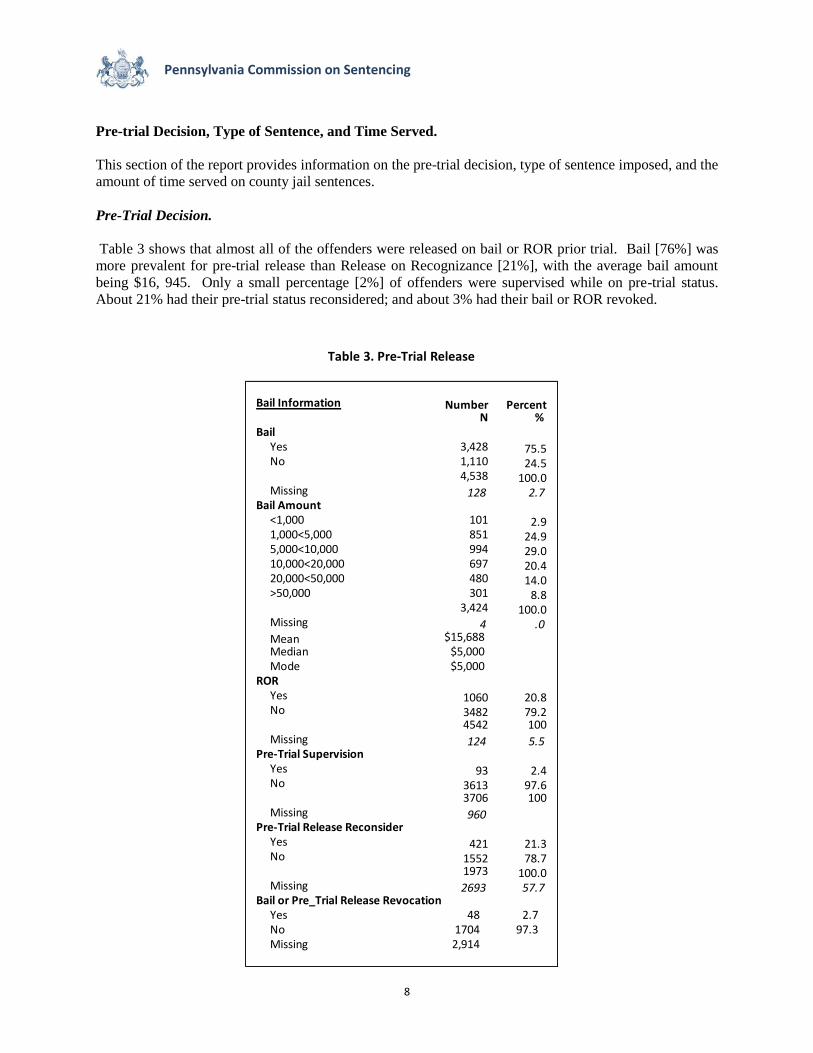
Table 3 shows that almost all of the offenders were released on bail or ROR prior trial. Bail [76%] was
more prevalent for pre-trial release than Release on Recognizance [21%], with the average bail amount
being $16, 945. Only a small percentage [2%] of offenders were supervised while on pre-trial status.
About 21% had their pre-trial status reconsidered; and about 3% had their bail or ROR revoked.
Bail Information Number PercentN %
Bail Yes 3,428 75.5 No 1,110 24.5
4,538 100.0 Missing 128 2.7Bail Amount <1,000 101 2.9 1,000<5,000 851 24.9 5,000<10,000 994 29.0 10,000<20,000 697 20.4 20,000<50,000 480 14.0 >50,000 301 8.8
3,424 100.0 Missing 4 .0 Mean $15,688
Median $5,000 Mode $5,000ROR Yes 1060 20.8 No 3482 79.2
4542 100 Missing 124 5.5Pre-Trial Supervision Yes 93 2.4 No 3613 97.6
3706 100 Missing 960Pre-Trial Release Reconsider Yes 421 21.3 No 1552 78.7
1973 100.0 Missing 2693 57.7Bail or Pre_Trial Release Revocation Yes 48 2.7 No 1704 97.3
Missing 2,914
Table 3. Pre-Trial Release
9
Pennsylvania Commission on Sentencing
Sentence Imposed Information.
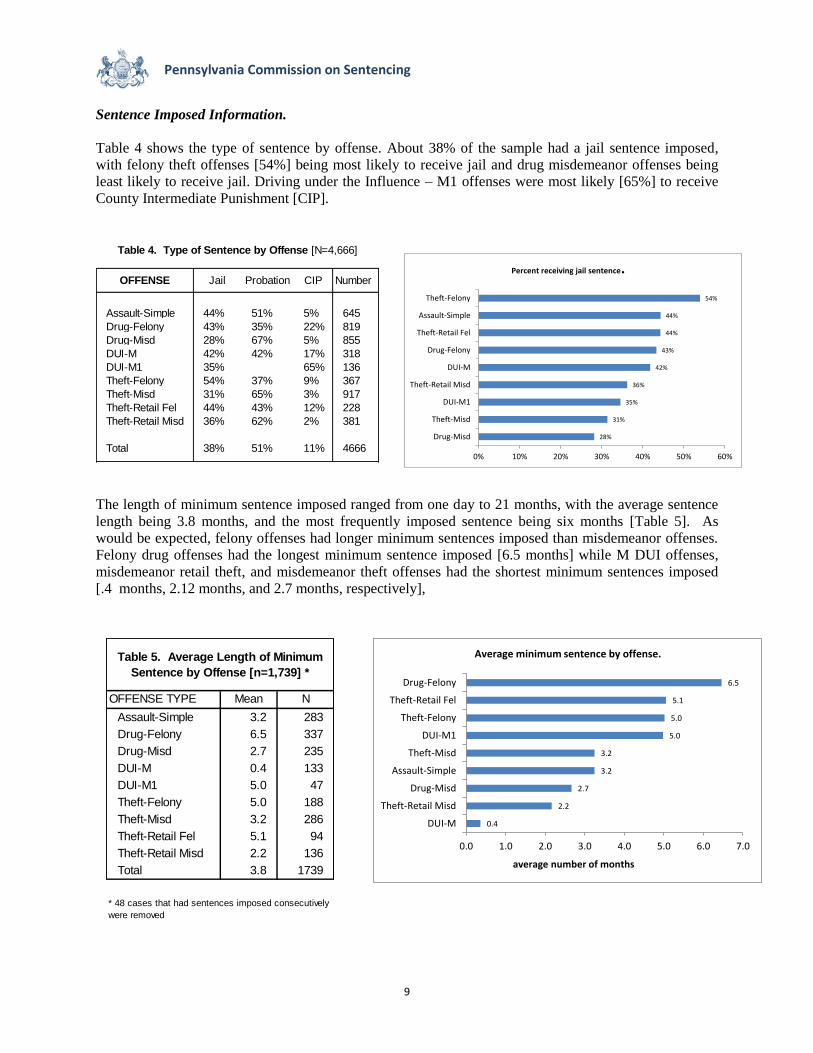
Table 4 shows the type of sentence by offense. About 38% of the sample had a jail sentence imposed,
with felony theft offenses [54%] being most likely to receive jail and drug misdemeanor offenses being
least likely to receive jail. Driving under the Influence – M1 offenses were most likely [65%] to receive
County Intermediate Punishment [CIP].
OFFENSE Jail Probation CIP Number
Assault-Simple 44% 51% 5% 645
Drug-Felony 43% 35% 22% 819
Drug-Misd 28% 67% 5% 855
DUI-M 42% 42% 17% 318
DUI-M1 35% 65% 136
Theft-Felony 54% 37% 9% 367
Theft-Misd 31% 65% 3% 917
Theft-Retail Fel 44% 43% 12% 228
Theft-Retail Misd 36% 62% 2% 381
Total 38% 51% 11% 4666
Table 4. Type of Sentence by Offense [N=4,666]
The length of minimum sentence imposed ranged from one day to 21 months, with the average sentence
length being 3.8 months, and the most frequently imposed sentence being six months [Table 5]. As
would be expected, felony offenses had longer minimum sentences imposed than misdemeanor offenses.
Felony drug offenses had the longest minimum sentence imposed [6.5 months] while M DUI offenses,
misdemeanor retail theft, and misdemeanor theft offenses had the shortest minimum sentences imposed
[.4 months, 2.12 months, and 2.7 months, respectively],
28%
31%
35%
36%
42%
43%
44%
44%
54%
0% 10% 20% 30% 40% 50% 60%
Drug-Misd
Theft-Misd
DUI-M1
Theft-Retail Misd
DUI-M
Drug-Felony
Theft-Retail Fel
Assault-Simple
Theft-Felony
Percent receiving jail sentence.
OFFENSE TYPE Mean N
Assault-Simple 3.2 283
Drug-Felony 6.5 337
Drug-Misd 2.7 235
DUI-M 0.4 133
DUI-M1 5.0 47
Theft-Felony 5.0 188
Theft-Misd 3.2 286
Theft-Retail Fel 5.1 94
Theft-Retail Misd 2.2 136
Total 3.8 1739
* 48 cases that had sentences imposed consecutively
were removed
Table 5. Average Length of Minimum
Sentence by Offense [n=1,739] *
0.4
2.2
2.7
3.2
3.2
5.0
5.0
5.1
6.5
0.0 1.0 2.0 3.0 4.0 5.0 6.0 7.0
DUI-M
Theft-Retail Misd
Drug-Misd
Assault-Simple
Theft-Misd
DUI-M1
Theft-Felony
Theft-Retail Fel
Drug-Felony
average number of months
Average minimum sentence by offense.
10
Pennsylvania Commission on Sentencing
Time Served on County Jail Sentences
One of the major goals of this project was to collect information on the amount of time an offender served
in relation to the sentence imposed. Many of the counties have ‘good time’ polices that can result in an
early release of an offender, but there is no central repository of information pertaining to these good time
policies, and they can vary from county to county. As judges have the paroling authority for county jail
sentences [i.e., those sentences with a maximum sentence under two years], they could impose a
minimum sentence that ends up being longer than the amount of time actually served on the sentence.
Alternatively, an offender can serve up to the maximum sentence imposed, so the offender could also
serve time beyond the minimum sentence imposed.
Credit for time served. In order to determine the total length of time that an offender served on a county
jail sentence, we needed to collect information on the amount of time served both prior to the sentence, as
well as any credit for time served prior to the imposition of sentence.
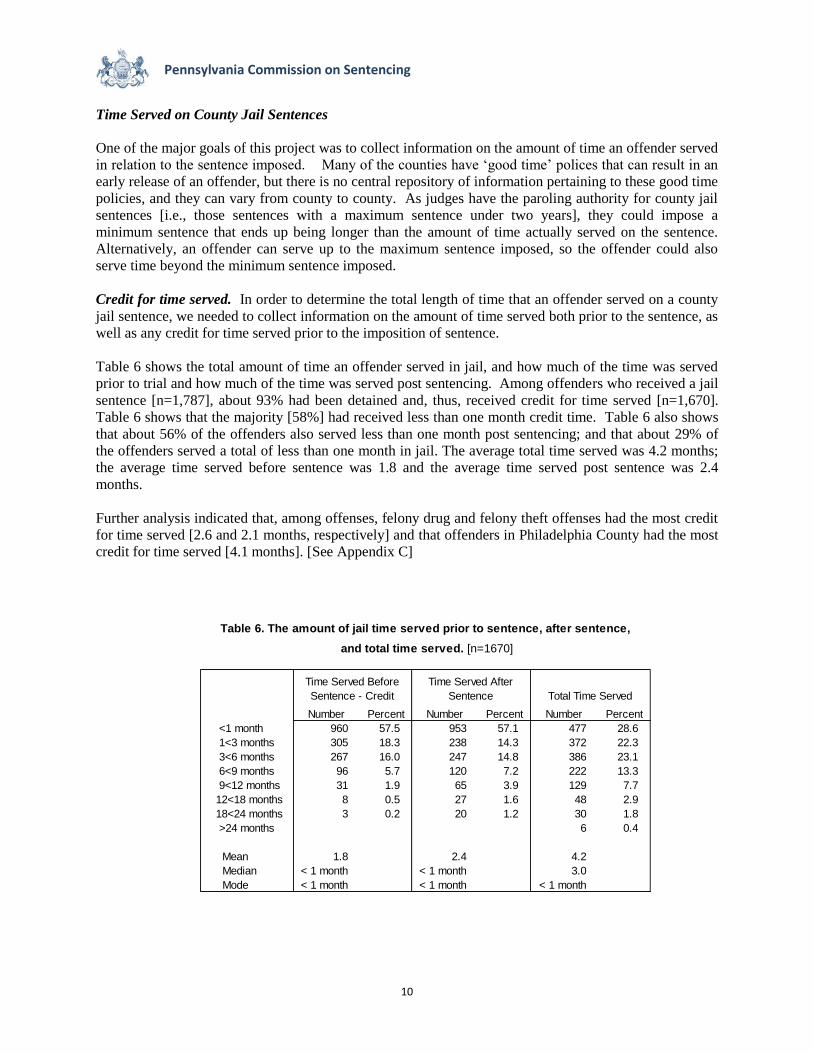
Table 6 shows the total amount of time an offender served in jail, and how much of the time was served
prior to trial and how much of the time was served post sentencing. Among offenders who received a jail
sentence [n=1,787], about 93% had been detained and, thus, received credit for time served [n=1,670].
Table 6 shows that the majority [58%] had received less than one month credit time. Table 6 also shows
that about 56% of the offenders also served less than one month post sentencing; and that about 29% of
the offenders served a total of less than one month in jail. The average total time served was 4.2 months;
the average time served before sentence was 1.8 and the average time served post sentence was 2.4
months.
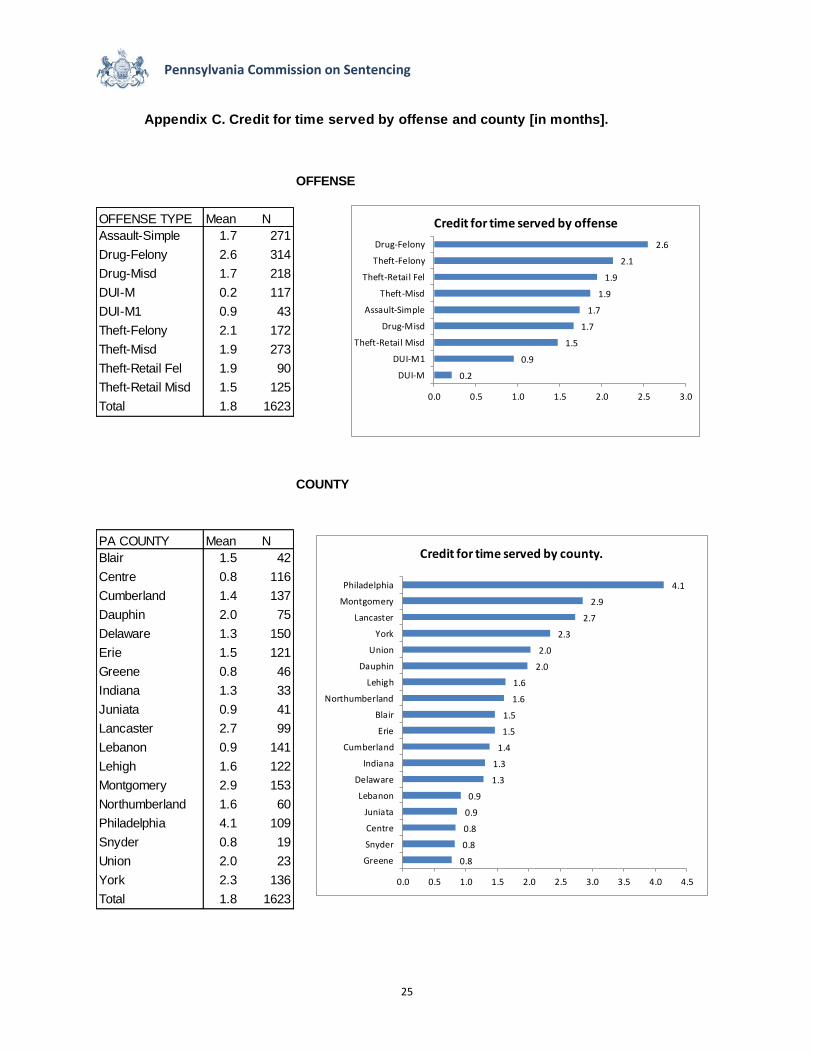
Further analysis indicated that, among offenses, felony drug and felony theft offenses had the most credit
for time served [2.6 and 2.1 months, respectively] and that offenders in Philadelphia County had the most
credit for time served [4.1 months]. [See Appendix C]
Number Percent Number Percent Number Percent
<1 month 960 57.5 953 57.1 477 28.6
1<3 months 305 18.3 238 14.3 372 22.3
3<6 months 267 16.0 247 14.8 386 23.1
6<9 months 96 5.7 120 7.2 222 13.3
9<12 months 31 1.9 65 3.9 129 7.7
12<18 months 8 0.5 27 1.6 48 2.9
18<24 months 3 0.2 20 1.2 30 1.8
>24 months 6 0.4
Mean 1.8 2.4 4.2
Median < 1 month < 1 month 3.0
Mode < 1 month < 1 month < 1 month
Time Served Before
Sentence - Credit
Time Served After
Sentence Total Time Served
Table 6. The amount of jail time served prior to sentence, after sentence,
and total time served. [n=1670]
11
Pennsylvania Commission on Sentencing
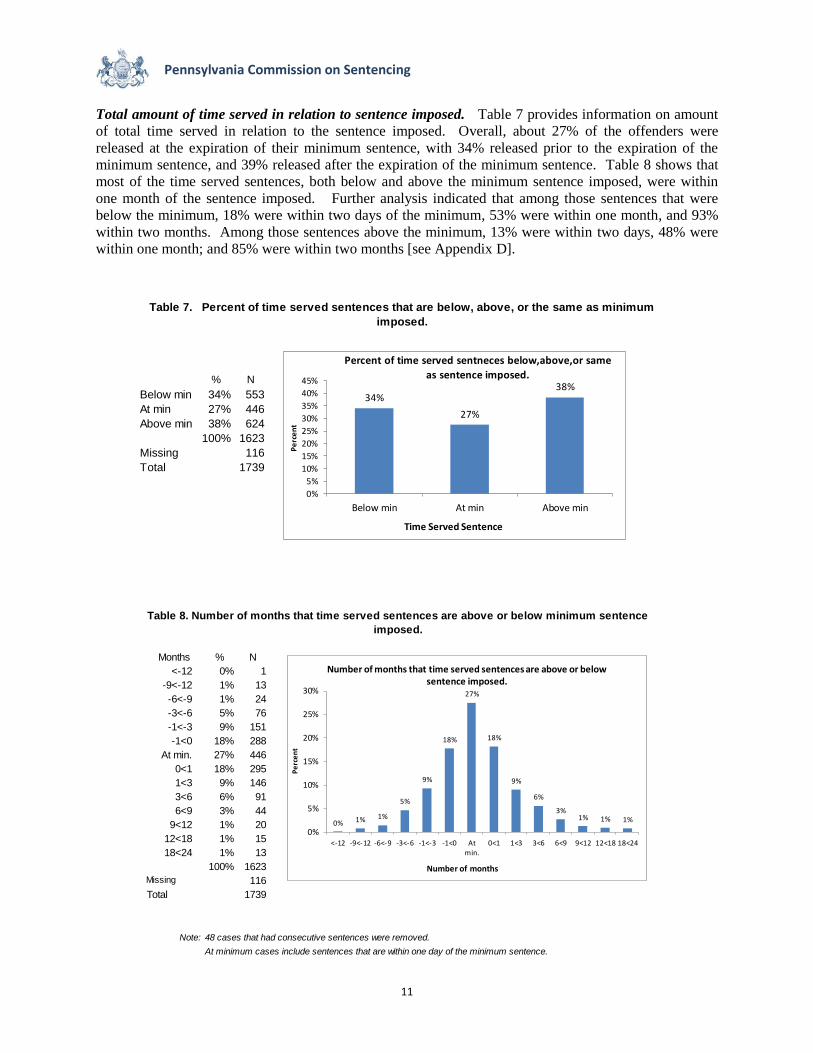
Total amount of time served in relation to sentence imposed. Table 7 provides information on amount
of total time served in relation to the sentence imposed. Overall, about 27% of the offenders were
released at the expiration of their minimum sentence, with 34% released prior to the expiration of the
minimum sentence, and 39% released after the expiration of the minimum sentence. Table 8 shows that
most of the time served sentences, both below and above the minimum sentence imposed, were within
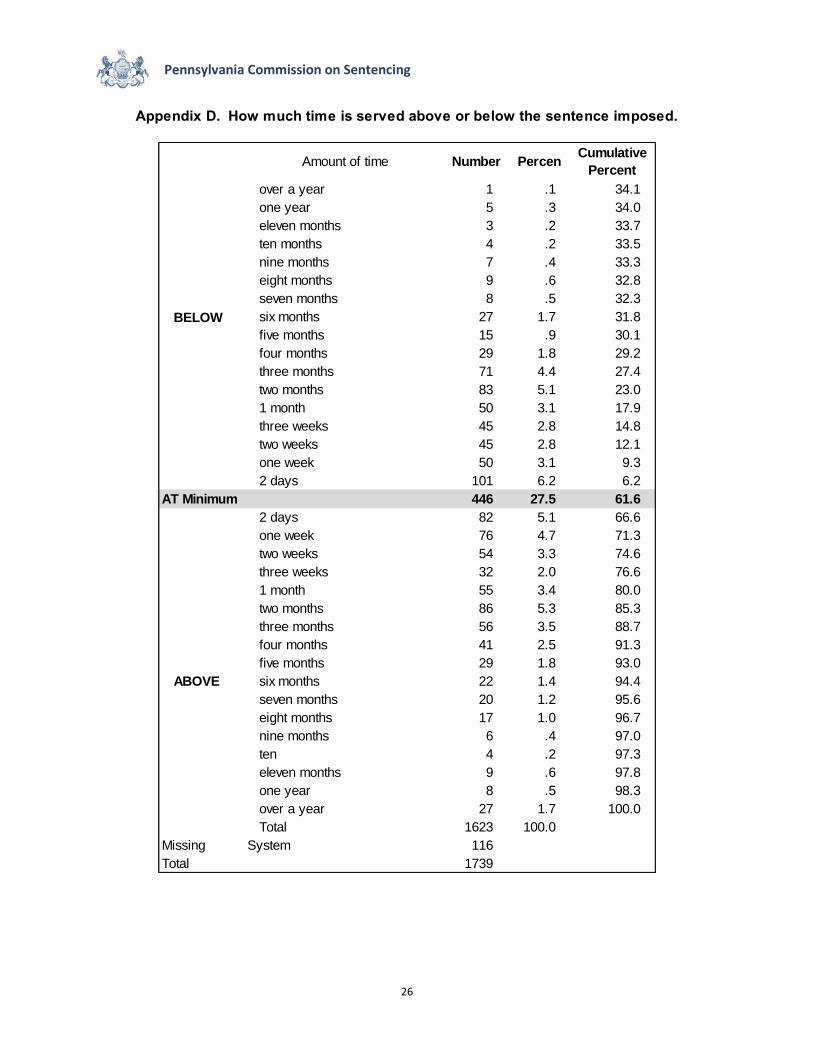
one month of the sentence imposed. Further analysis indicated that among those sentences that were
below the minimum, 18% were within two days of the minimum, 53% were within one month, and 93%
within two months. Among those sentences above the minimum, 13% were within two days, 48% were
within one month; and 85% were within two months [see Appendix D].
% N
Below min 34% 553
At min 27% 446
Above min 38% 624
100% 1623
Missing 116
Total 1739
Table 7. Percent of time served sentences that are below, above, or the same as minimum
imposed.
34%
27%
38%
0%
5%
10%
15%
20%
25%
30%
35%
40%
45%
Below min At min Above min
Pe
rce
nt
Time Served Sentence
Percent of time served sentneces below,above,or same
as sentence imposed.
Months % N
<-12 0% 1
-9<-12 1% 13
-6<-9 1% 24
-3<-6 5% 76
-1<-3 9% 151
-1<0 18% 288
At min. 27% 446
0<1 18% 295
1<3 9% 146
3<6 6% 91
6<9 3% 44
9<12 1% 20
12<18 1% 15
18<24 1% 13
100% 1623
Missing 116
Total 1739
Note: 48 cases that had consecutive sentences were removed.
At minimum cases include sentences that are within one day of the minimum sentence.
Table 8. Number of months that time served sentences are above or below minimum sentence
imposed.
0% 1% 1%
5%
9%
18%
27%
18%
9%
6%
3%1% 1% 1%
0%
5%
10%
15%
20%
25%
30%
<-12 -9<-12 -6<-9 -3<-6 -1<-3 -1<0 Atmin.
0<1 1<3 3<6 6<9 9<12 12<18 18<24
Pe
rce
nt
Number of months
Number of months that time served sentences are above or below sentence imposed.
12
Pennsylvania Commission on Sentencing
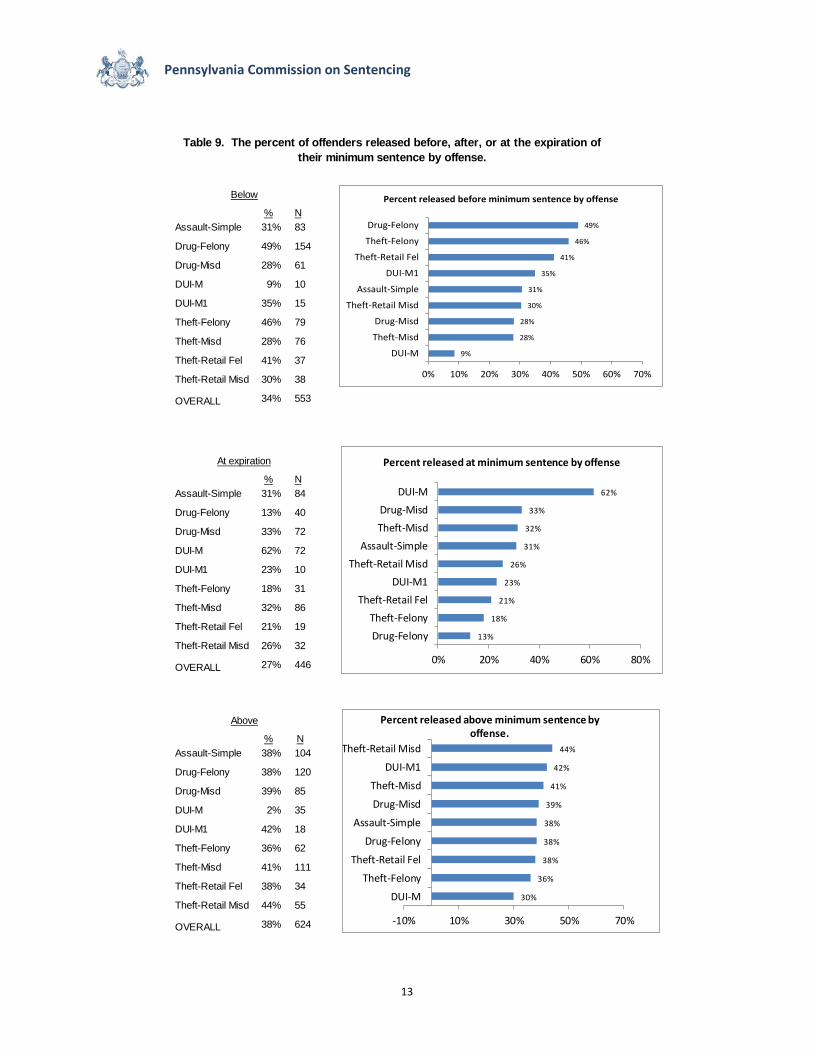
Time Served by offense. Table 9 shows time served sentences by offense. The percentage of offenders
released at the expiration of their minimum sentence ranged from 13% to 62%. Offenders convicted of
DUI–M were most likely to be released at the expiration of their minimum sentence, and offenders
convicted of felony drug offenses were least likely to be released at the expiration of their minimum
sentence. The percentage of offenders released before the expiration of their minimum sentence ranged
from to 9% to 49% percent. Offenders convicted of DUI-M offenses were least likely to be released
prior to their minimum [9%], and those convicted of felony drug [49%] felony theft [46%], and felony
retail theft offenses [41%] were most likely to be released before the expiration of their minimum
sentence. The percentage of offenders released beyond the expiration of their minimum sentence ranged
from 30% to 44%. Misdemeanor retail theft offenses [44%], MI DUI offenses [42%], and misdemeanor
theft offenses [41%] were most likely to serve time beyond their minimum sentence, and offenders
convicted of DUI-M were least likely to serve beyond their minimum sentence. Thus, overall, offenders
most likely to be released before the expiration of their minimum sentence had convictions for felony
offenses, while offenders most likely to be released beyond the expiration of their minimum sentence had
convictions for misdemeanor offenses.3 As noted earlier, felony offenders had the longest sentences
imposed, and misdemeanor offenders had the shortest [Table 5].
3 The analysis included offenders who had multiple convictions, but only those who had their sentences imposed
concurrently. We also looked at offenders who had only one offense [who comprised about 68% of the sample], and found similar results.
13
Pennsylvania Commission on Sentencing
% N
Assault-Simple 31% 83
Drug-Felony 49% 154
Drug-Misd 28% 61
DUI-M 9% 10
DUI-M1 35% 15
Theft-Felony 46% 79
Theft-Misd 28% 76
Theft-Retail Fel 41% 37
Theft-Retail Misd 30% 38
OVERALL 34% 553
% N
Assault-Simple 31% 84
Drug-Felony 13% 40
Drug-Misd 33% 72
DUI-M 62% 72
DUI-M1 23% 10
Theft-Felony 18% 31
Theft-Misd 32% 86
Theft-Retail Fel 21% 19
Theft-Retail Misd 26% 32
OVERALL 27% 446
% N
Assault-Simple 38% 104
Drug-Felony 38% 120
Drug-Misd 39% 85
DUI-M 2% 35
DUI-M1 42% 18
Theft-Felony 36% 62
Theft-Misd 41% 111
Theft-Retail Fel 38% 34
Theft-Retail Misd 44% 55
OVERALL 38% 624
Table 9. The percent of offenders released before, after, or at the expiration of
their minimum sentence by offense.
Below
At expiration
Above
9%
28%
28%
30%
31%
35%
41%
46%
49%
0% 10% 20% 30% 40% 50% 60% 70%
DUI-M
Theft-Misd
Drug-Misd
Theft-Retail Misd
Assault-Simple
DUI-M1
Theft-Retail Fel
Theft-Felony
Drug-Felony
Percent released before minimum sentence by offense
13%
18%
21%
23%
26%
31%
32%
33%
62%
0% 20% 40% 60% 80%
Drug-Felony
Theft-Felony
Theft-Retail Fel
DUI-M1
Theft-Retail Misd
Assault-Simple
Theft-Misd
Drug-Misd
DUI-M
Percent released at minimum sentence by offense
30%
36%
38%
38%
38%
39%
41%
42%
44%
-10% 10% 30% 50% 70%
DUI-M
Theft-Felony
Theft-Retail Fel
Drug-Felony
Assault-Simple
Drug-Misd
Theft-Misd
DUI-M1
Theft-Retail Misd
Percent released above minimum sentence by offense.
14
Pennsylvania Commission on Sentencing
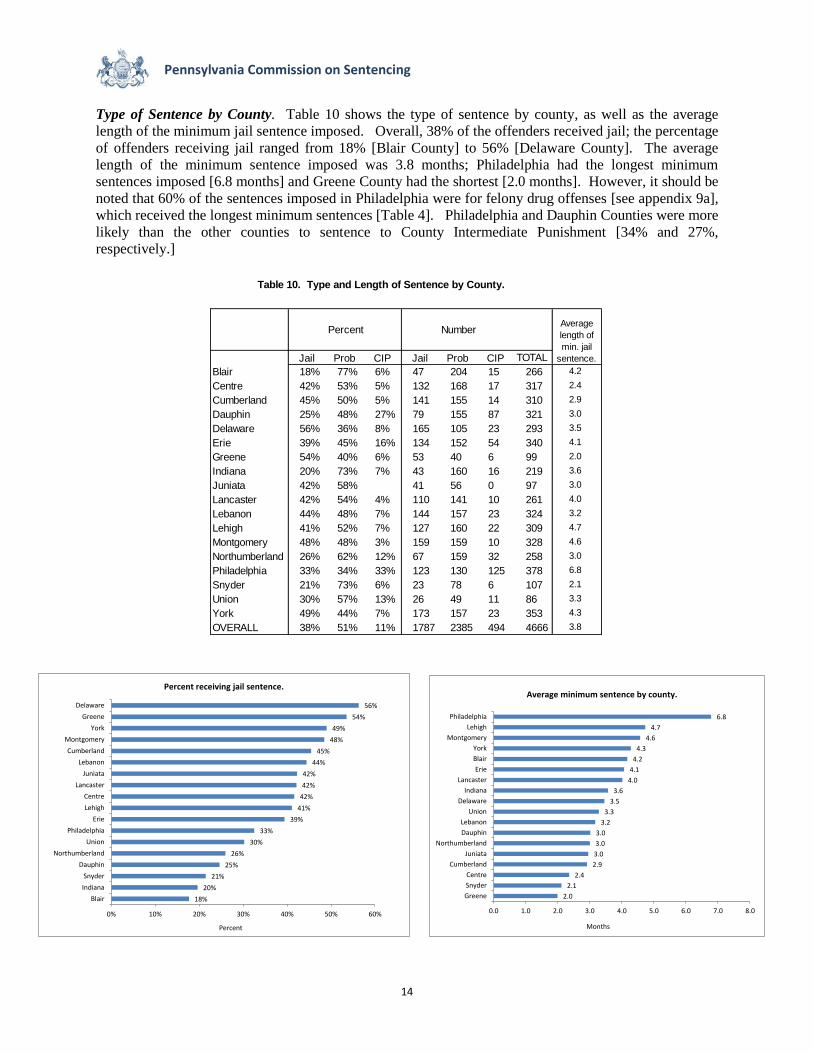
Type of Sentence by County. Table 10 shows the type of sentence by county, as well as the average
length of the minimum jail sentence imposed. Overall, 38% of the offenders received jail; the percentage
of offenders receiving jail ranged from 18% [Blair County] to 56% [Delaware County]. The average
length of the minimum sentence imposed was 3.8 months; Philadelphia had the longest minimum
sentences imposed [6.8 months] and Greene County had the shortest [2.0 months]. However, it should be
noted that 60% of the sentences imposed in Philadelphia were for felony drug offenses [see appendix 9a],
which received the longest minimum sentences [Table 4]. Philadelphia and Dauphin Counties were more
likely than the other counties to sentence to County Intermediate Punishment [34% and 27%,
respectively.]
Percent Number
Jail Prob CIP Jail Prob CIP TOTAL
Blair 18% 77% 6% 47 204 15 266 4.2
Centre 42% 53% 5% 132 168 17 317 2.4
Cumberland 45% 50% 5% 141 155 14 310 2.9
Dauphin 25% 48% 27% 79 155 87 321 3.0
Delaware 56% 36% 8% 165 105 23 293 3.5
Erie 39% 45% 16% 134 152 54 340 4.1
Greene 54% 40% 6% 53 40 6 99 2.0
Indiana 20% 73% 7% 43 160 16 219 3.6
Juniata 42% 58% 41 56 0 97 3.0
Lancaster 42% 54% 4% 110 141 10 261 4.0
Lebanon 44% 48% 7% 144 157 23 324 3.2
Lehigh 41% 52% 7% 127 160 22 309 4.7
Montgomery 48% 48% 3% 159 159 10 328 4.6
Northumberland 26% 62% 12% 67 159 32 258 3.0
Philadelphia 33% 34% 33% 123 130 125 378 6.8
Snyder 21% 73% 6% 23 78 6 107 2.1
Union 30% 57% 13% 26 49 11 86 3.3
York 49% 44% 7% 173 157 23 353 4.3
OVERALL 38% 51% 11% 1787 2385 494 4666 3.8
Table 10. Type and Length of Sentence by County.
Average
length of
min. jail
sentence.
18%
20%
21%
25%
26%
30%
33%
39%
41%
42%
42%
42%
44%
45%
48%
49%
54%
56%
0% 10% 20% 30% 40% 50% 60%
Blair
Indiana
Snyder
Dauphin
Northumberland
Union
Philadelphia
Erie
Lehigh
Centre
Lancaster
Juniata
Lebanon
Cumberland
Montgomery
York
Greene
Delaware
Percent
Percent receiving jail sentence.
2.0
2.1
2.4
2.9
3.0
3.0
3.0
3.2
3.3
3.5
3.6
4.0
4.1
4.2
4.3
4.6
4.7
6.8
0.0 1.0 2.0 3.0 4.0 5.0 6.0 7.0 8.0
Greene
Snyder
Centre
Cumberland
Juniata
Northumberland
Dauphin
Lebanon
Union
Delaware
Indiana
Lancaster
Erie
Blair
York
Montgomery
Lehigh
Philadelphia
Months
Average minimum sentence by county.
15
Pennsylvania Commission on Sentencing
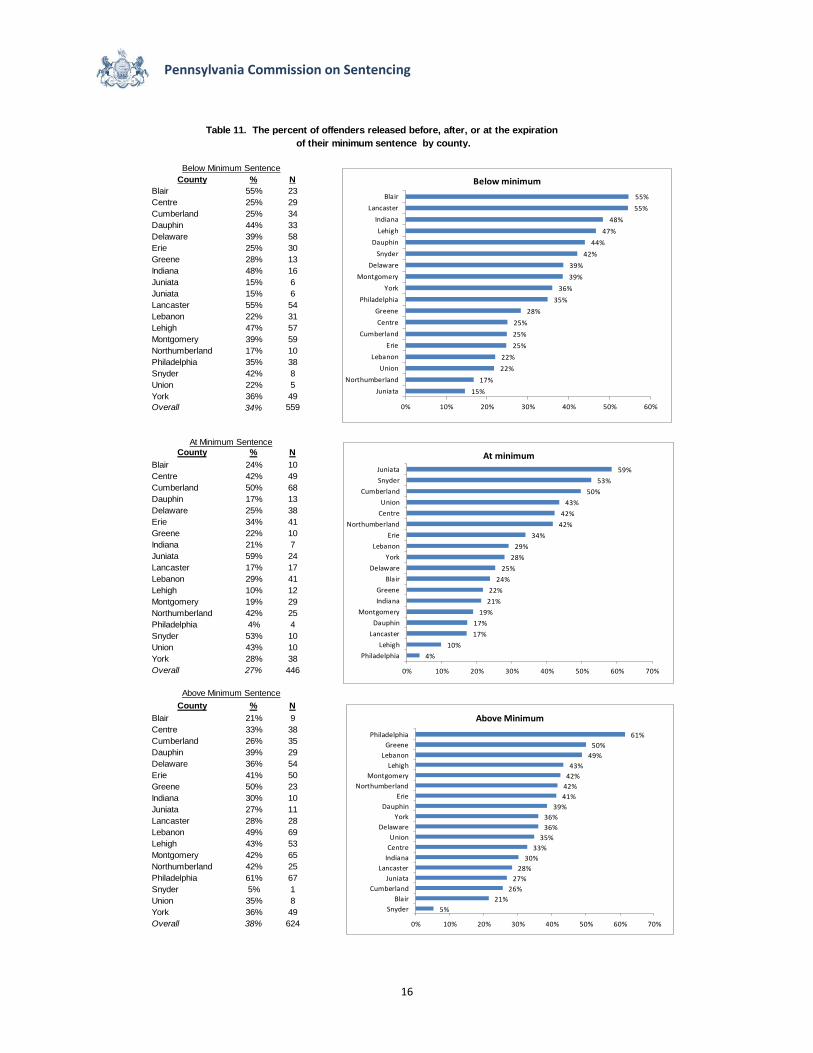
Time Served by County. Table 11, which shows the time served sentences by county, indicates that
there is quite a bit of variation among the counties in the amount of time served. The percentage of
offenders released at their minimum sentence ranged from 4% [Philadelphia] to 59% [Juniata]. The
percentage of offenders released before the expiration of their minimum sentence ranged from 15%
[Juniata] to 55% [Blair]. The percentage of offenders released beyond the expiration of their minimum
sentences ranged from 5% [Snyder] to 61% {Philadelphia]. It should be noted, however, that in looking
at only jail sentences, the number of offenders is quite small for some of the counties so caution should be
used in the interpretation of the these results. [See Appendix E for an alternative way of looking at the
percentage of time served sentences that are below, above, and at the expiration of the minimum sentence
for each of the counties. See Appendix F to see the number of months that time served sentences are
below and above the minimum sentence by county.]
16
Pennsylvania Commission on Sentencing
County % N
Blair 55% 23
Centre 25% 29
Cumberland 25% 34
Dauphin 44% 33
Delaware 39% 58
Erie 25% 30
Greene 28% 13
Indiana 48% 16
Juniata 15% 6
Juniata 15% 6
Lancaster 55% 54
Lebanon 22% 31
Lehigh 47% 57
Montgomery 39% 59
Northumberland 17% 10
Philadelphia 35% 38
Snyder 42% 8
Union 22% 5
York 36% 49
Overall 34% 559
County % N
Blair 24% 10
Centre 42% 49
Cumberland 50% 68
Dauphin 17% 13
Delaware 25% 38
Erie 34% 41
Greene 22% 10
Indiana 21% 7
Juniata 59% 24
Lancaster 17% 17
Lebanon 29% 41
Lehigh 10% 12
Montgomery 19% 29
Northumberland 42% 25
Philadelphia 4% 4
Snyder 53% 10
Union 43% 10
York 28% 38
Overall 27% 446
County % N
Blair 21% 9
Centre 33% 38
Cumberland 26% 35
Dauphin 39% 29
Delaware 36% 54
Erie 41% 50
Greene 50% 23
Indiana 30% 10
Juniata 27% 11
Lancaster 28% 28
Lebanon 49% 69
Lehigh 43% 53
Montgomery 42% 65
Northumberland 42% 25
Philadelphia 61% 67
Snyder 5% 1
Union 35% 8
York 36% 49
Overall 38% 624
Below Minimum Sentence
At Minimum Sentence
Above Minimum Sentence
Table 11. The percent of offenders released before, after, or at the expiration
of their minimum sentence by county.
15%
17%
22%
22%
25%
25%
25%
28%
35%
36%
39%
39%
42%
44%
47%
48%
55%
55%
0% 10% 20% 30% 40% 50% 60%
Juniata
Northumberland
Union
Lebanon
Erie
Cumberland
Centre
Greene
Philadelphia
York
Montgomery
Delaware
Snyder
Dauphin
Lehigh
Indiana
Lancaster
Blair
Below minimum
4%
10%
17%
17%
19%
21%
22%
24%
25%
28%
29%
34%
42%
42%
43%
50%
53%
59%
0% 10% 20% 30% 40% 50% 60% 70%
Philadelphia
Lehigh
Lancaster
Dauphin
Montgomery
Indiana
Greene
Blair
Delaware
York
Lebanon
Erie
Northumberland
Centre
Union
Cumberland
Snyder
Juniata
At minimum
5%
21%
26%
27%
28%
30%
33%
35%
36%
36%
39%
41%
42%
42%
43%
49%
50%
61%
0% 10% 20% 30% 40% 50% 60% 70%
Snyder
Blair
Cumberland
Juniata
Lancaster
Indiana
Centre
Union
Delaware
York
Dauphin
Erie
Northumberland
Montgomery
Lehigh
Lebanon
Greene
Philadelphia
Above Minimum
17
Pennsylvania Commission on Sentencing
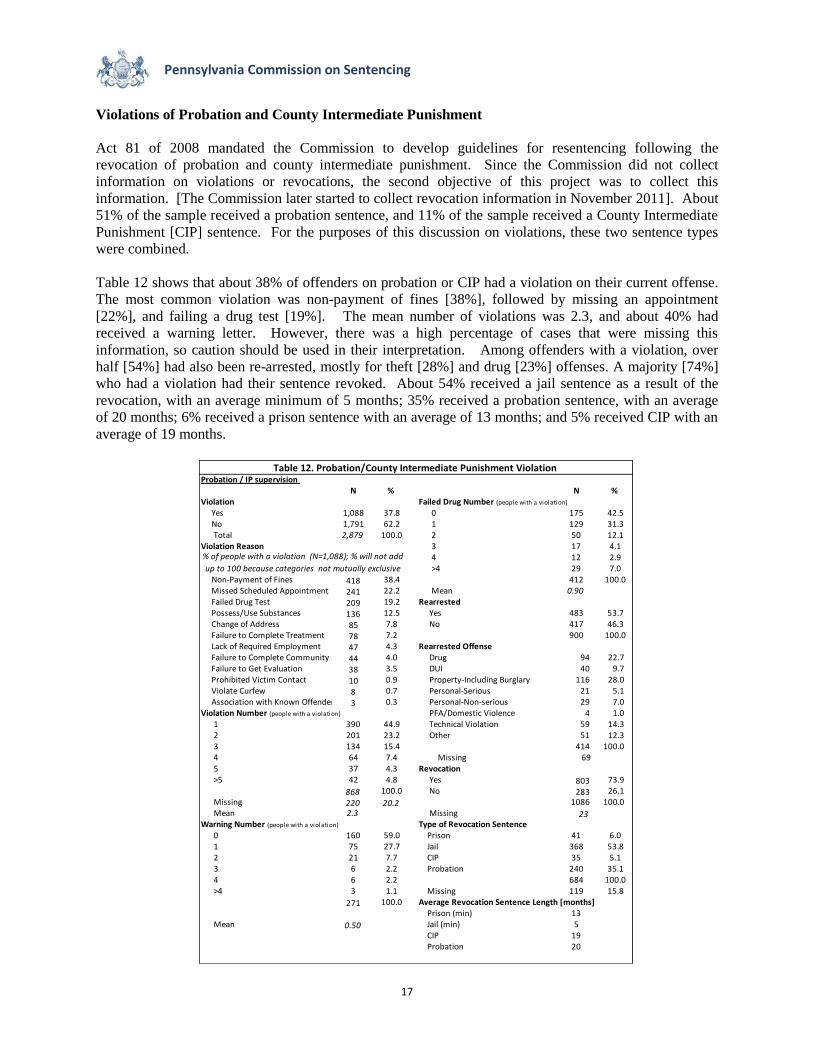
Violations of Probation and County Intermediate Punishment
Act 81 of 2008 mandated the Commission to develop guidelines for resentencing following the
revocation of probation and county intermediate punishment. Since the Commission did not collect
information on violations or revocations, the second objective of this project was to collect this
information. [The Commission later started to collect revocation information in November 2011]. About
51% of the sample received a probation sentence, and 11% of the sample received a County Intermediate
Punishment [CIP] sentence. For the purposes of this discussion on violations, these two sentence types
were combined.
Table 12 shows that about 38% of offenders on probation or CIP had a violation on their current offense.
The most common violation was non-payment of fines [38%], followed by missing an appointment
[22%], and failing a drug test [19%]. The mean number of violations was 2.3, and about 40% had
received a warning letter. However, there was a high percentage of cases that were missing this
information, so caution should be used in their interpretation. Among offenders with a violation, over
half [54%] had also been re-arrested, mostly for theft [28%] and drug [23%] offenses. A majority [74%]
who had a violation had their sentence revoked. About 54% received a jail sentence as a result of the
revocation, with an average minimum of 5 months; 35% received a probation sentence, with an average
of 20 months; 6% received a prison sentence with an average of 13 months; and 5% received CIP with an
average of 19 months.
Probation / IP supervision N % N %
Violation Failed Drug Number (people with a violation)
Yes 1,088 37.8 0 175 42.5 No 1,791 62.2 1 129 31.3
Total 2,879 100.0 2 50 12.1Violation Reason 3 17 4.1
4 12 2.9>4 29 7.0
Non-Payment of Fines 418 38.4 412 100.0 Missed Scheduled Appointment 241 22.2 Mean 0.90 Failed Drug Test 209 19.2 Rearrested Possess/Use Substances 136 12.5 Yes 483 53.7 Change of Address 85 7.8 No 417 46.3 Failure to Complete Treatment 78 7.2 900 100.0 Lack of Required Employment 47 4.3 Rearrested Offense Failure to Complete Community Service44 4.0 Drug 94 22.7 Failure to Get Evaluation 38 3.5 DUI 40 9.7 Prohibited Victim Contact 10 0.9 Property-Including Burglary 116 28.0 Violate Curfew 8 0.7 Personal-Serious 21 5.1 Association with Known Offenders 3 0.3 Personal-Non-serious 29 7.0Violation Number (people with a violation) PFA/Domestic Violence 4 1.0
1 390 44.9 Technical Violation 59 14.32 201 23.2 Other 51 12.33 134 15.4 414 100.04 64 7.4 Missing 695 37 4.3 Revocation>5 42 4.8 Yes 803 73.9
868 100.0 No 283 26.1Missing 220 20.2 1086 100.0Mean 2.3 Missing 23
Warning Number (people with a violation) Type of Revocation Sentence0 160 59.0 Prison 41 6.01 75 27.7 Jail 368 53.82 21 7.7 CIP 35 5.13 6 2.2 Probation 240 35.14 6 2.2 684 100.0>4 3 1.1 Missing 119 15.8
271 100.0 Average Revocation Sentence Length [months] Prison (min) 13
Mean 0.50 Jail (min) 5 CIP 19 Probation 20
Table 12. Probation/County Intermediate Punishment Violation
% of people with a violation (N=1,088); % will not add
up to 100 because categories not mutually exclusive
18
Pennsylvania Commission on Sentencing
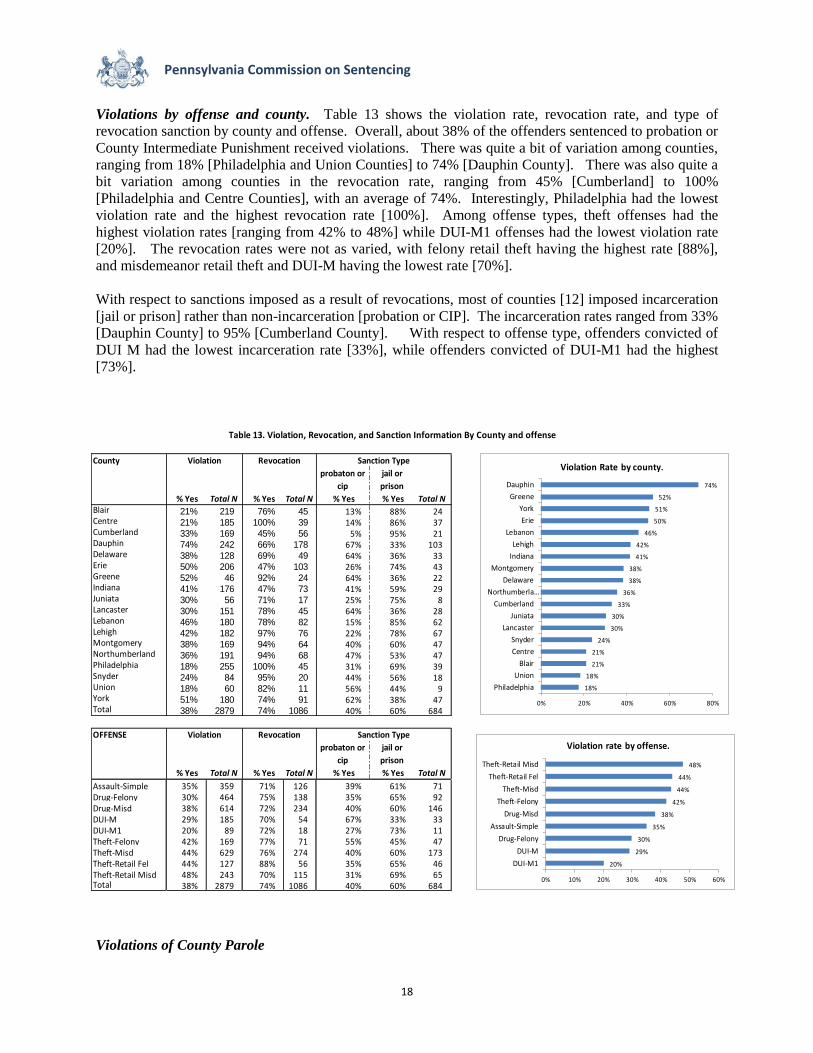
Violations by offense and county. Table 13 shows the violation rate, revocation rate, and type of
revocation sanction by county and offense. Overall, about 38% of the offenders sentenced to probation or
County Intermediate Punishment received violations. There was quite a bit of variation among counties,
ranging from 18% [Philadelphia and Union Counties] to 74% [Dauphin County]. There was also quite a
bit variation among counties in the revocation rate, ranging from 45% [Cumberland] to 100%
[Philadelphia and Centre Counties], with an average of 74%. Interestingly, Philadelphia had the lowest
violation rate and the highest revocation rate [100%]. Among offense types, theft offenses had the
highest violation rates [ranging from 42% to 48%] while DUI-M1 offenses had the lowest violation rate
[20%]. The revocation rates were not as varied, with felony retail theft having the highest rate [88%],
and misdemeanor retail theft and DUI-M having the lowest rate [70%].
With respect to sanctions imposed as a result of revocations, most of counties [12] imposed incarceration
[jail or prison] rather than non-incarceration [probation or CIP]. The incarceration rates ranged from 33%
[Dauphin County] to 95% [Cumberland County]. With respect to offense type, offenders convicted of
DUI M had the lowest incarceration rate [33%], while offenders convicted of DUI-M1 had the highest
[73%].
Violations of County Parole
County
probaton or
cip
jail or
prison
% Yes Total N % Yes Total N % Yes % Yes Total NBlair 21% 219 76% 45 13% 88% 24Centre 21% 185 100% 39 14% 86% 37Cumberland 33% 169 45% 56 5% 95% 21Dauphin 74% 242 66% 178 67% 33% 103Delaware 38% 128 69% 49 64% 36% 33Erie 50% 206 47% 103 26% 74% 43Greene 52% 46 92% 24 64% 36% 22Indiana 41% 176 47% 73 41% 59% 29Juniata 30% 56 71% 17 25% 75% 8Lancaster 30% 151 78% 45 64% 36% 28Lebanon 46% 180 78% 82 15% 85% 62Lehigh 42% 182 97% 76 22% 78% 67Montgomery 38% 169 94% 64 40% 60% 47Northumberland 36% 191 94% 68 47% 53% 47Philadelphia 18% 255 100% 45 31% 69% 39Snyder 24% 84 95% 20 44% 56% 18Union 18% 60 82% 11 56% 44% 9York 51% 180 74% 91 62% 38% 47Total 38% 2879 74% 1086 40% 60% 684
OFFENSE
probaton or
cip
jail or
prison
% Yes Total N % Yes Total N % Yes % Yes Total N
Assault-Simple 35% 359 71% 126 39% 61% 71Drug-Felony 30% 464 75% 138 35% 65% 92Drug-Misd 38% 614 72% 234 40% 60% 146DUI-M 29% 185 70% 54 67% 33% 33DUI-M1 20% 89 72% 18 27% 73% 11Theft-Felony 42% 169 77% 71 55% 45% 47Theft-Misd 44% 629 76% 274 40% 60% 173Theft-Retail Fel 44% 127 88% 56 35% 65% 46Theft-Retail Misd 48% 243 70% 115 31% 69% 65Total 38% 2879 74% 1086 40% 60% 684
Table 13. Violation, Revocation, and Sanction Information By County and offense
Violation Revocation Sanction Type
Violation Revocation Sanction Type
18%
18%
21%
21%
24%
30%
30%
33%
36%
38%
38%
41%
42%
46%
50%
51%
52%
74%
0% 20% 40% 60% 80%
Philadelphia
Union
Blair
Centre
Snyder
Lancaster
Juniata
Cumberland
Northumberla…
Delaware
Montgomery
Indiana
Lehigh
Lebanon
Erie
York
Greene
Dauphin
Violation Rate by county.
20%
29%
30%
35%
38%
42%
44%
44%
48%
0% 10% 20% 30% 40% 50% 60%
DUI-M1
DUI-M
Drug-Felony
Assault-Simple
Drug-Misd
Theft-Felony
Theft-Misd
Theft-Retail Fel
Theft-Retail Misd
Violation rate by offense.
19
Pennsylvania Commission on Sentencing
Act 81 of 2008 mandated the Commission to develop guidelines not only for county parole, but for re-
parole as well. Thus, in addition to collecting information on the amount of time served on the original
sentence imposed, we also asked for information on revocation of county parole. The court may, on
cause shown by the probation officer that the inmate has violated his parole, recommit and reparole the
inmate in the same manner and by the same procedure as in the case of the original parole if, in the
judgment of the court, there is a reasonable probability that the inmate will benefit from being paroled.
The court may also recommit for violation of that parole (42 Pa.C.S.A. §9776(e)).
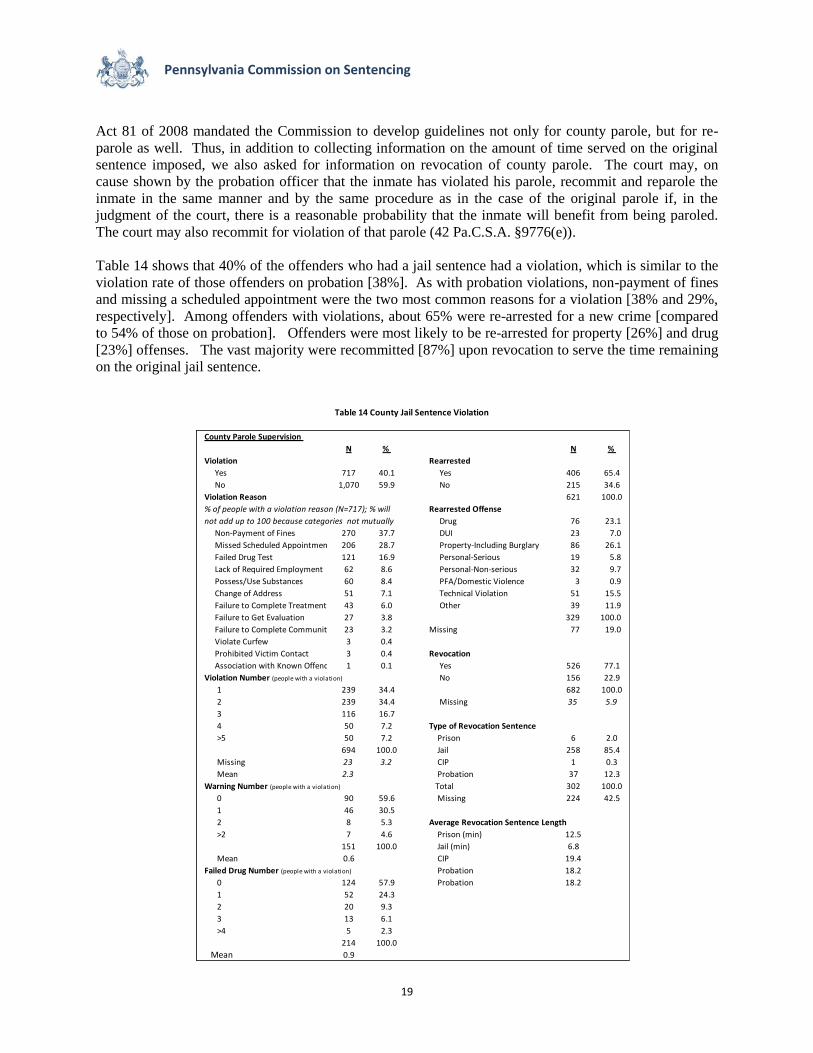
Table 14 shows that 40% of the offenders who had a jail sentence had a violation, which is similar to the
violation rate of those offenders on probation [38%]. As with probation violations, non-payment of fines
and missing a scheduled appointment were the two most common reasons for a violation [38% and 29%,
respectively]. Among offenders with violations, about 65% were re-arrested for a new crime [compared
to 54% of those on probation]. Offenders were most likely to be re-arrested for property [26%] and drug
[23%] offenses. The vast majority were recommitted [87%] upon revocation to serve the time remaining
on the original jail sentence.
County Parole Supervision
N % N %
Violation Rearrested
Yes 717 40.1 Yes 406 65.4
No 1,070 59.9 No 215 34.6
Violation Reason 621 100.0
Rearrested Offense
Drug 76 23.1
Non-Payment of Fines 270 37.7 DUI 23 7.0
Missed Scheduled Appointment 206 28.7 Property-Including Burglary 86 26.1
Failed Drug Test 121 16.9 Personal-Serious 19 5.8
Lack of Required Employment 62 8.6 Personal-Non-serious 32 9.7
Possess/Use Substances 60 8.4 PFA/Domestic Violence 3 0.9
Change of Address 51 7.1 Technical Violation 51 15.5
Failure to Complete Treatment 43 6.0 Other 39 11.9
Failure to Get Evaluation 27 3.8 329 100.0
Failure to Complete Community Service23 3.2 Missing 77 19.0
Violate Curfew 3 0.4
Prohibited Victim Contact 3 0.4 Revocation
Association with Known Offenders 1 0.1 Yes 526 77.1
Violation Number (people with a violation) No 156 22.9
1 239 34.4 682 100.0
2 239 34.4 Missing 35 5.9
3 116 16.7
4 50 7.2 Type of Revocation Sentence
>5 50 7.2 Prison 6 2.0
694 100.0 Jail 258 85.4
Missing 23 3.2 CIP 1 0.3
Mean 2.3 Probation 37 12.3
Warning Number (people with a violation) Total 302 100.0
0 90 59.6 Missing 224 42.5
1 46 30.5
2 8 5.3 Average Revocation Sentence Length
>2 7 4.6 Prison (min) 12.5
151 100.0 Jail (min) 6.8
Mean 0.6 CIP 19.4
Failed Drug Number (people with a violation) Probation 18.2
0 124 57.9 Probation 18.2
1 52 24.3
2 20 9.3
3 13 6.1
>4 5 2.3
214 100.0
Mean 0.9
% of people with a violation reason (N=717); % will
not add up to 100 because categories not mutually
Table 14 County Jail Sentence Violation
20
Pennsylvania Commission on Sentencing
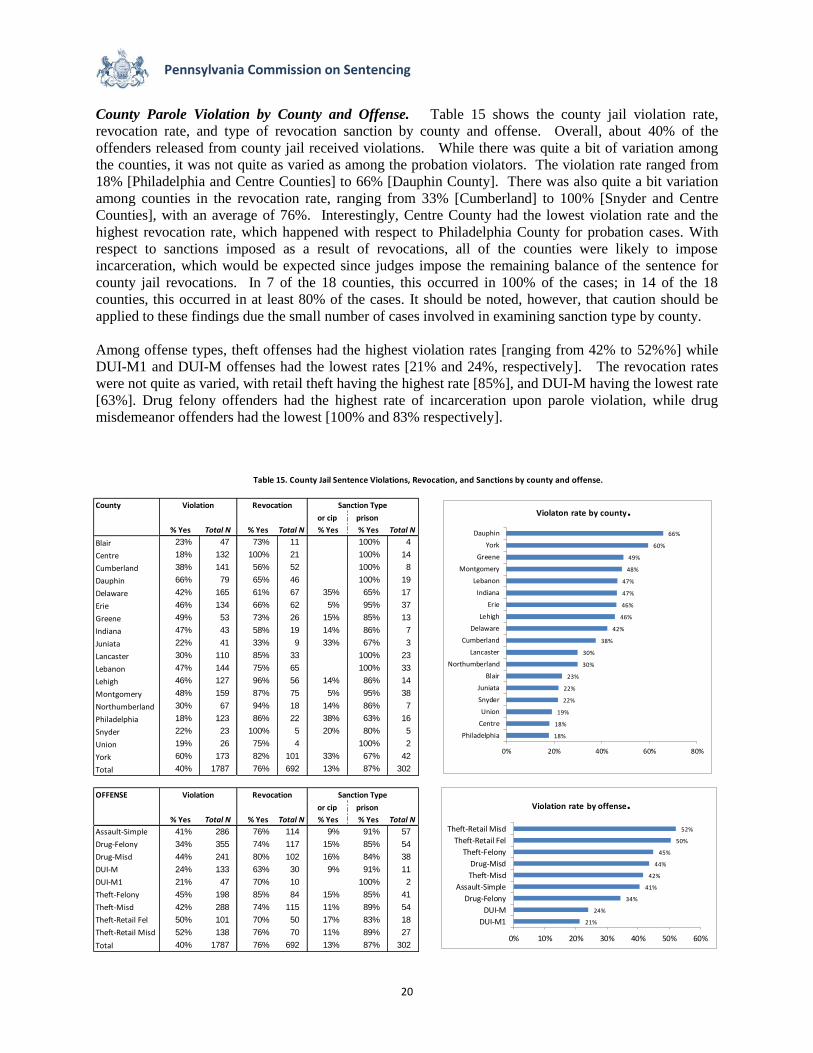
County Parole Violation by County and Offense. Table 15 shows the county jail violation rate,
revocation rate, and type of revocation sanction by county and offense. Overall, about 40% of the
offenders released from county jail received violations. While there was quite a bit of variation among
the counties, it was not quite as varied as among the probation violators. The violation rate ranged from
18% [Philadelphia and Centre Counties] to 66% [Dauphin County]. There was also quite a bit variation
among counties in the revocation rate, ranging from 33% [Cumberland] to 100% [Snyder and Centre
Counties], with an average of 76%. Interestingly, Centre County had the lowest violation rate and the
highest revocation rate, which happened with respect to Philadelphia County for probation cases. With
respect to sanctions imposed as a result of revocations, all of the counties were likely to impose
incarceration, which would be expected since judges impose the remaining balance of the sentence for
county jail revocations. In 7 of the 18 counties, this occurred in 100% of the cases; in 14 of the 18
counties, this occurred in at least 80% of the cases. It should be noted, however, that caution should be
applied to these findings due the small number of cases involved in examining sanction type by county.
Among offense types, theft offenses had the highest violation rates [ranging from 42% to 52%%] while
DUI-M1 and DUI-M offenses had the lowest rates [21% and 24%, respectively]. The revocation rates
were not quite as varied, with retail theft having the highest rate [85%], and DUI-M having the lowest rate
[63%]. Drug felony offenders had the highest rate of incarceration upon parole violation, while drug
misdemeanor offenders had the lowest [100% and 83% respectively].
County probaton
or cip
jail or
prison
% Yes Total N % Yes Total N % Yes % Yes Total N
Blair 23% 47 73% 11 100% 4
Centre 18% 132 100% 21 100% 14
Cumberland 38% 141 56% 52 100% 8
Dauphin 66% 79 65% 46 100% 19
Delaware 42% 165 61% 67 35% 65% 17
Erie 46% 134 66% 62 5% 95% 37
Greene 49% 53 73% 26 15% 85% 13
Indiana 47% 43 58% 19 14% 86% 7
Juniata 22% 41 33% 9 33% 67% 3
Lancaster 30% 110 85% 33 100% 23
Lebanon 47% 144 75% 65 100% 33
Lehigh 46% 127 96% 56 14% 86% 14
Montgomery 48% 159 87% 75 5% 95% 38
Northumberland 30% 67 94% 18 14% 86% 7
Philadelphia 18% 123 86% 22 38% 63% 16
Snyder 22% 23 100% 5 20% 80% 5
Union 19% 26 75% 4 100% 2
York 60% 173 82% 101 33% 67% 42
Total 40% 1787 76% 692 13% 87% 302
OFFENSE probaton
or cip
jail or
prison
% Yes Total N % Yes Total N % Yes % Yes Total N
Assault-Simple 41% 286 76% 114 9% 91% 57
Drug-Felony 34% 355 74% 117 15% 85% 54
Drug-Misd 44% 241 80% 102 16% 84% 38
DUI-M 24% 133 63% 30 9% 91% 11
DUI-M1 21% 47 70% 10 100% 2
Theft-Felony 45% 198 85% 84 15% 85% 41
Theft-Misd 42% 288 74% 115 11% 89% 54
Theft-Retail Fel 50% 101 70% 50 17% 83% 18
Theft-Retail Misd 52% 138 76% 70 11% 89% 27
Total 40% 1787 76% 692 13% 87% 302
Table 15. County Jail Sentence Violations, Revocation, and Sanctions by county and offense.
Violation Revocation Sanction Type
Violation Revocation Sanction Type
21%
24%
34%
41%
42%
44%
45%
50%
52%
0% 10% 20% 30% 40% 50% 60%
DUI-M1
DUI-M
Drug-Felony
Assault-Simple
Theft-Misd
Drug-Misd
Theft-Felony
Theft-Retail Fel
Theft-Retail Misd
Violation rate by offense.
18%
18%
19%
22%
22%
23%
30%
30%
38%
42%
46%
46%
47%
47%
48%
49%
60%
66%
0% 20% 40% 60% 80%
Philadelphia
Centre
Union
Snyder
Juniata
Blair
Northumberland
Lancaster
Cumberland
Delaware
Lehigh
Erie
Indiana
Lebanon
Montgomery
Greene
York
Dauphin
Violaton rate by county.
21
Pennsylvania Commission on Sentencing
APPENDICES
22
Pennsylvania Commission on Sentencing
Appendix A: County Sentencing Project Research Partners *
Thomas M. Arvanites, Ph.D. (Delaware & Montgomery) Chair, Dpt. of Sociology and Criminal Justice Villanova University Amanda K. Cox, Ph.D. (Blair) Assistant Professor of Criminal Justice Penn State Altoona Maria L. Garase, Ph.D. (Erie) Associate Professor
Criminal Justice Department
Mercyhurst University
Rosemary L. Gido, Ph.D. (Indiana) Professor of Criminology Department of Criminology Indiana University of Pennsylvania Mary H. Glazier, Ph.D. (Lancaster) Professor of Sociology Department of Sociology/Anthropology Millersville University Marianne Goodfellow, Ph.D. (Lebanon) Associate Professor of Sociology Department of Sociology Lebanon Valley College Jordon Hyatt, J.D. (Philadelphia) Senior Research Coordinator Jerry Lee Center of Criminology University of Pennsylvania *Positions at the time of the project.
Jenny L. Jellison, Ph.D. (Greene) Assistant Professor of Psychology Human Studies Waynesburg University R. Barry Ruback, Ph.D., J.D. (Centre) Professor of Crime, Law, & Justice and Sociology The Pennsylvania State University, University Park
Barbara A. Sims, Ph.D. (Dauphin & Cumberland) Professor of Criminal Justice School of Public Affairs Penn State Harrisburg
Michael A. Smyth, Ph.D. (Juniata, Lehigh, Northumberland, Union, Snyder) Director, Arlin M. Adams Center for Law and Society Assistant Professor of Sociology Department of Sociology and Anthropology School of Natural and Social Sciences Susquehanna University Philip J. Verrecchia, Ph.D. (York) Assistant Professor of Behavioral Sciences Criminal Justice Program Coordinator York College of Pennsylvania
23
Pennsylvania Commission on Sentencing
Appendix B: County Sentencing Project County Contacts*
Blair The Honorable Jolene Grubb-Kopriva President Judge Janice Meadows District Court Administrator Thomas G. Shea Chief Probation Officer Michael Johnston Warden, Blair County Jail Centre The Honorable David E. Grine President Judge Maxine O. Ishler District Court Administrator Thomas J. Young Director, Probation and Parole Department Edward P. DeSabato Warden, Centre County Correctional Facility Cumberland The Honorable Kevin A. Hess President Judge Melissa H. Calvanelli District Court Administrator Lyle M. Herr Chief Probation Officer Earl F. Reitz, Jr. Warden, Cumberland County Jail Rebekah Finkey Coordinator, Criminal Justice Planning Dauphin The Honorable Todd A. Hoover President Judge Carolyn C. Thompson, Esquire District Court Administrator Michael C. Potteiger Director, Dauphin County Adult Probation Dept Dominick L. DeRose Warden, Dauphin County Prison * Positions at the time of the project.
Delaware The Honorable Joseph P. Cronin, Jr. President Judge Gerald C. Montella, Esquire District Court Administrator Michael W. Raith, Esquire Director, Delaware County Court Services Frank C. Green Superintendent, Delaware County Prison Erie The Honorable Ernest J. DiSantis, Jr. President Judge Thomas C. Aaron District Court Administrator Jeffry Shaw Director, Adult Probation James Veshecco Warden, Erie County Prison Greene The Honorable William R. Nalitz President Judge Audrey Szoyka District Court Administrator R. Craig Wise Chief Probation Officer Harry D. Gillispie Warden, Greene County Prison Indiana The Honorable William J. Martin President Judge Michael J. Kuhar District Court Administrator Denise M. Delancey Chief Probation/Parole Officer Carol Hummel Warden, Indiana County Jail
24
Pennsylvania Commission on Sentencing
Juniata The Honorable Kathy A. Morrow President Judge Christina Zook Court Administrator Michelle A. Beaver Chief Probation Officer H. Thomas Lyter Warden, Juniata County Prison Lancaster The Honorable Joseph C. Madenspacher President Judge Mark M. Dalton Court Administrator Mark Wilson Director, Adult Probation Department Vincent A. Guarini Warden, Lancaster County Jail Lebanon The Honorable John C. Tylwalk President Judge David P. Wingert, Esquire Court Administrator Sally McQuinn-Barry, Chief Probation Officer Robert J. Karnes Warden. Lebanon County Correctional Facility Catharine Kilgore CJAB Planner/Grant Coordinator Lehigh
The Honorable Carol K. McGinley President Judge Susan T. Schellenberg Court Administrator John J. Sikora Chief Adult Probation Officer Dale Meisel Warden, Lehigh County Department of Corrections Montgomery The Honorable Richard J. Hodgson President Judge Michael R. Kehs, Esquire District Court Administrator Michael Gordon Chief Adult Probation Officer Julio Algarin Warden, Montgomery Correctional Facility
Northumberland The Honorable Robert B. Sacavage President Judge Brandy L. Yasenchak, Esquire District Court Administrator Mike Yasenchak Deputy Chief, Adult Probation Dpt. Roy Johnson Warden, Northumberland County Prison Philadelphia The Honorable Pamela Pryor-Dembe President Judge David C. Lawrence District Court Administrator Robert J. Malvestuto Chief Probation Officer Louis Giorla Commissioner, Philadelphia Prison System Snyder The Honorable Michael H. Sholley President Judge Charlotte N. Kratzer District Court Administrator Craig M. Fasold Chief Probation Officer Ruth Rush, Warden, Synder County Prison Union The Honorable Michael H. Sholley President Judge Charlotte N. Kratzer District Court Administrator Scott A. Lizardi Chief Probation Officer Douglas E. Shaffer Warden, Union County Prison York The Honorable Richard Renn President Judge J. Robert Chuk District Court Administrator Albert J. Sabol Chief Adult Probation Officer Mary Sabol Warden, York County Prison
25
Pennsylvania Commission on Sentencing
OFFENSE
OFFENSE TYPE Mean N
Assault-Simple 1.7 271
Drug-Felony 2.6 314
Drug-Misd 1.7 218
DUI-M 0.2 117
DUI-M1 0.9 43
Theft-Felony 2.1 172
Theft-Misd 1.9 273
Theft-Retail Fel 1.9 90
Theft-Retail Misd 1.5 125
Total 1.8 1623
COUNTY
PA COUNTY Mean N
Blair 1.5 42
Centre 0.8 116
Cumberland 1.4 137
Dauphin 2.0 75
Delaware 1.3 150
Erie 1.5 121
Greene 0.8 46
Indiana 1.3 33
Juniata 0.9 41
Lancaster 2.7 99
Lebanon 0.9 141
Lehigh 1.6 122
Montgomery 2.9 153
Northumberland 1.6 60
Philadelphia 4.1 109
Snyder 0.8 19
Union 2.0 23
York 2.3 136
Total 1.8 1623
Appendix C. Credit for time served by offense and county [in months].
0.2
0.9
1.5
1.7
1.7
1.9
1.9
2.1
2.6
0.0 0.5 1.0 1.5 2.0 2.5 3.0
DUI-M
DUI-M1
Theft-Retail Misd
Drug-Misd
Assault-Simple
Theft-Misd
Theft-Retail Fel
Theft-Felony
Drug-Felony
Credit for time served by offense
0.8
0.8
0.8
0.9
0.9
1.3
1.3
1.4
1.5
1.5
1.6
1.6
2.0
2.0
2.3
2.7
2.9
4.1
0.0 0.5 1.0 1.5 2.0 2.5 3.0 3.5 4.0 4.5
Greene
Snyder
Centre
Juniata
Lebanon
Delaware
Indiana
Cumberland
Erie
Blair
Northumberland
Lehigh
Dauphin
Union
York
Lancaster
Montgomery
Philadelphia
Credit for time served by county.
26
Pennsylvania Commission on Sentencing
Amount of time Number PercenCumulative
Percent
over a year 1 .1 34.1
one year 5 .3 34.0
eleven months 3 .2 33.7
ten months 4 .2 33.5
nine months 7 .4 33.3
eight months 9 .6 32.8
seven months 8 .5 32.3
BELOW six months 27 1.7 31.8
five months 15 .9 30.1
four months 29 1.8 29.2
three months 71 4.4 27.4
two months 83 5.1 23.0
1 month 50 3.1 17.9
three weeks 45 2.8 14.8
two weeks 45 2.8 12.1
one week 50 3.1 9.3
2 days 101 6.2 6.2
AT Minimum 446 27.5 61.6
2 days 82 5.1 66.6
one week 76 4.7 71.3
two weeks 54 3.3 74.6
three weeks 32 2.0 76.6
1 month 55 3.4 80.0
two months 86 5.3 85.3
three months 56 3.5 88.7
four months 41 2.5 91.3
five months 29 1.8 93.0
ABOVE six months 22 1.4 94.4
seven months 20 1.2 95.6
eight months 17 1.0 96.7
nine months 6 .4 97.0
ten 4 .2 97.3
eleven months 9 .6 97.8
one year 8 .5 98.3
over a year 27 1.7 100.0
Total 1623 100.0
Missing System 116
1739Total
Appendix D. How much time is served above or below the sentence imposed.
27
Pennsylvania Commission on Sentencing
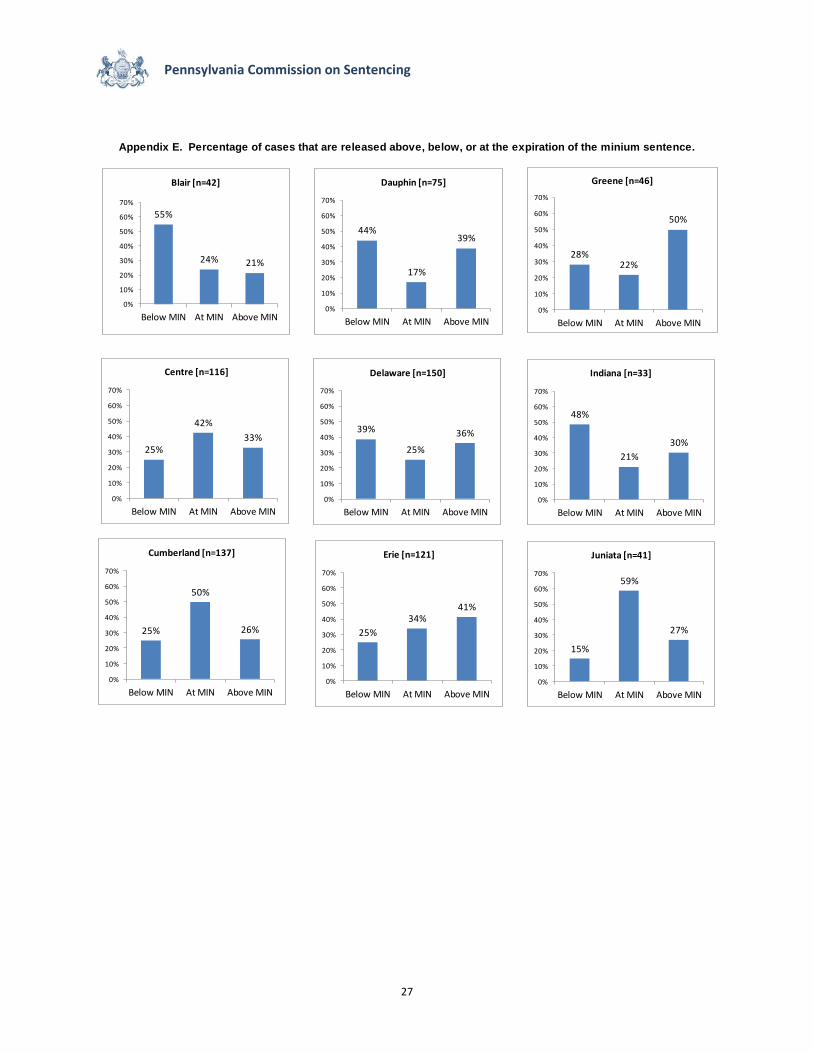
Appendix E. Percentage of cases that are released above, below, or at the expiration of the minium sentence.
55%
24% 21%
0%
10%
20%
30%
40%
50%
60%
70%
Below MIN At MIN Above MIN
Blair [n=42]
25%
42%
33%
0%
10%
20%
30%
40%
50%
60%
70%
Below MIN At MIN Above MIN
Centre [n=116]
25%
50%
26%
0%
10%
20%
30%
40%
50%
60%
70%
Below MIN At MIN Above MIN
Cumberland [n=137]
39%
25%
36%
0%
10%
20%
30%
40%
50%
60%
70%
Below MIN At MIN Above MIN
Delaware [n=150]
25%
34%41%
0%
10%
20%
30%
40%
50%
60%
70%
Below MIN At MIN Above MIN
Erie [n=121]
28%22%
50%
0%
10%
20%
30%
40%
50%
60%
70%
Below MIN At MIN Above MIN
Greene [n=46]
48%
21%
30%
0%
10%
20%
30%
40%
50%
60%
70%
Below MIN At MIN Above MIN
Indiana [n=33]
15%
59%
27%
0%
10%
20%
30%
40%
50%
60%
70%
Below MIN At MIN Above MIN
Juniata [n=41]
44%
17%
39%
0%
10%
20%
30%
40%
50%
60%
70%
Below MIN At MIN Above MIN
Dauphin [n=75]
28
Pennsylvania Commission on Sentencing
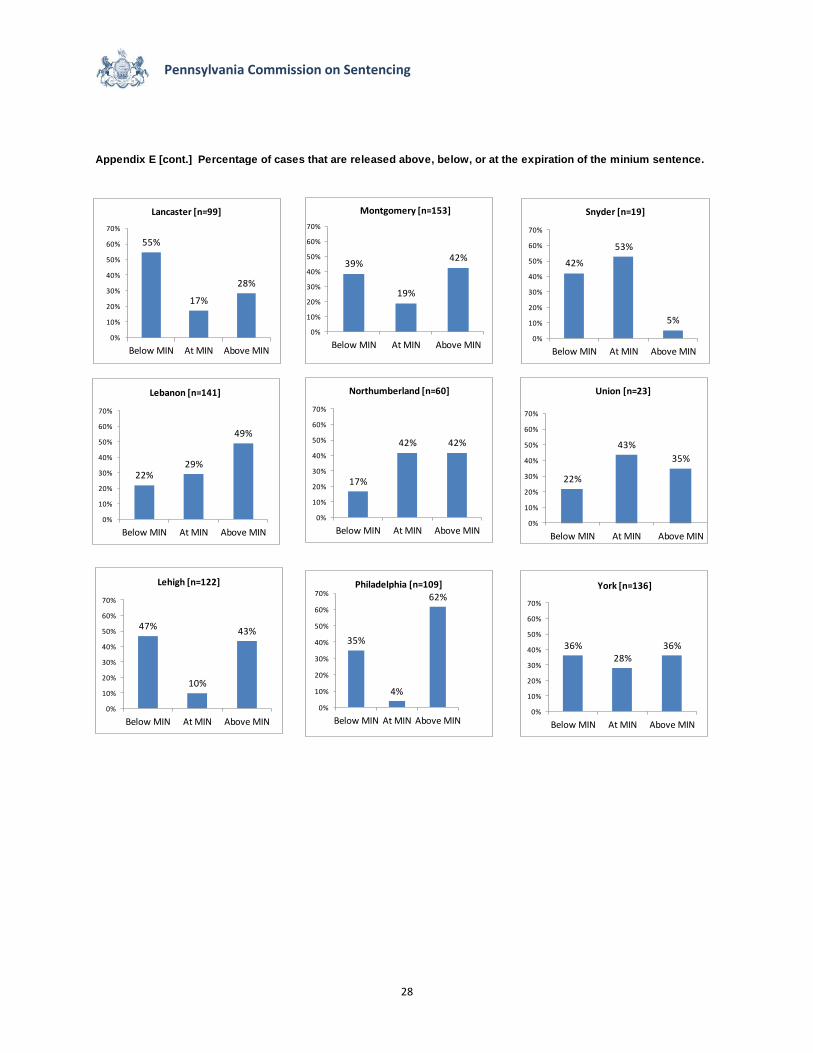
Appendix E [cont.] Percentage of cases that are released above, below, or at the expiration of the minium sentence.
55%
17%
28%
0%
10%
20%
30%
40%
50%
60%
70%
Below MIN At MIN Above MIN
Lancaster [n=99]
22%29%
49%
0%
10%
20%
30%
40%
50%
60%
70%
Below MIN At MIN Above MIN
Lebanon [n=141]
47%
10%
43%
0%
10%
20%
30%
40%
50%
60%
70%
Below MIN At MIN Above MIN
Lehigh [n=122]
39%
19%
42%
0%
10%
20%
30%
40%
50%
60%
70%
Below MIN At MIN Above MIN
Montgomery [n=153]
17%
42% 42%
0%
10%
20%
30%
40%
50%
60%
70%
Below MIN At MIN Above MIN
Northumberland [n=60]
35%
4%
62%
0%
10%
20%
30%
40%
50%
60%
70%
Below MIN At MIN Above MIN
Philadelphia [n=109]
42%
53%
5%
0%
10%
20%
30%
40%
50%
60%
70%
Below MIN At MIN Above MIN
Snyder [n=19]
22%
43%
35%
0%
10%
20%
30%
40%
50%
60%
70%
Below MIN At MIN Above MIN
Union [n=23]
36%28%
36%
0%
10%
20%
30%
40%
50%
60%
70%
Below MIN At MIN Above MIN
York [n=136]
29
Pennsylvania Commission on Sentencing
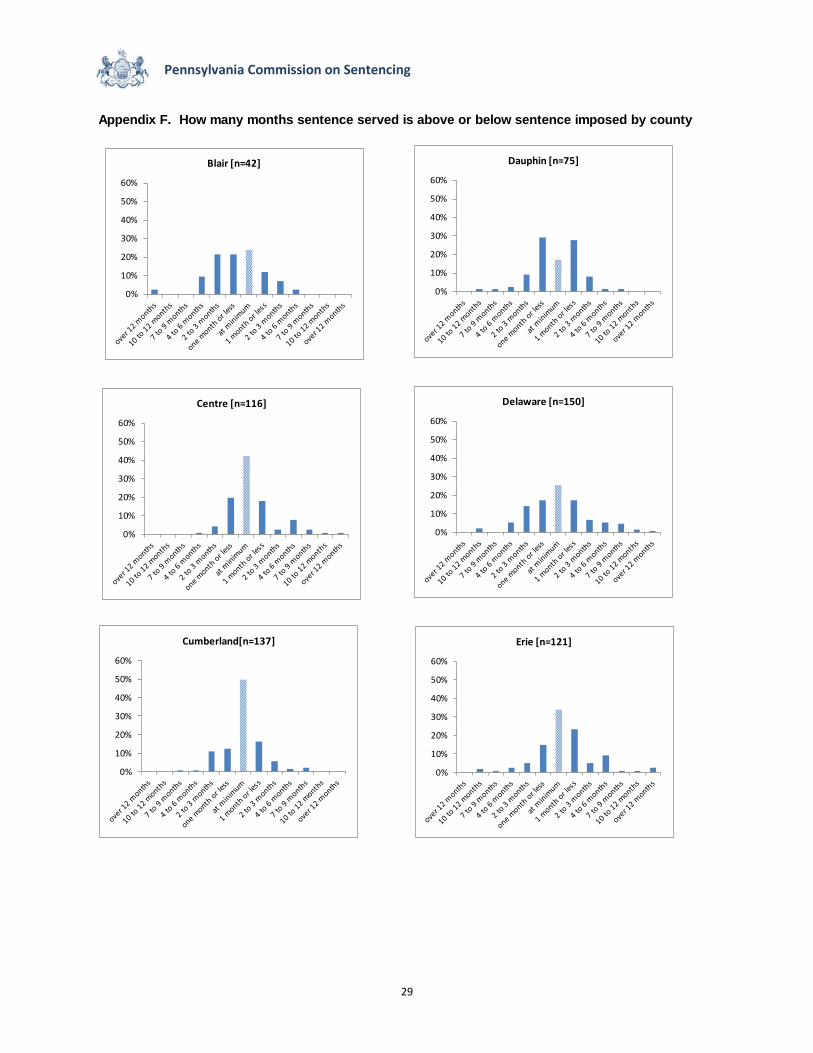
Appendix F. How many months sentence served is above or below sentence imposed by county
0%
10%
20%
30%
40%
50%
60%
Blair [n=42]
0%
10%
20%
30%
40%
50%
60%
Centre [n=116]
0%
10%
20%
30%
40%
50%
60%
Cumberland[n=137]
0%
10%
20%
30%
40%
50%
60%
Dauphin [n=75]
0%
10%
20%
30%
40%
50%
60%
Delaware [n=150]
0%
10%
20%
30%
40%
50%
60%
Erie [n=121]
30
Pennsylvania Commission on Sentencing
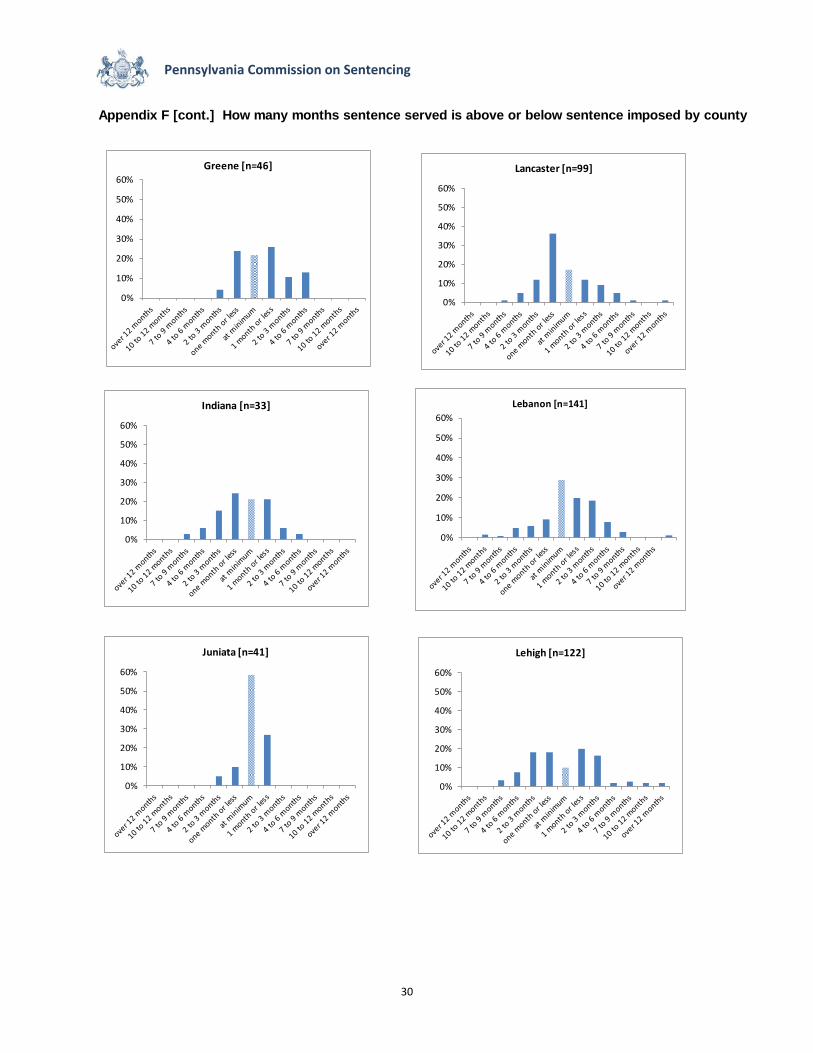
Appendix F [cont.] How many months sentence served is above or below sentence imposed by county
0%
10%
20%
30%
40%
50%
60%
Greene [n=46]
0%
10%
20%
30%
40%
50%
60%
Indiana [n=33]
0%
10%
20%
30%
40%
50%
60%
Juniata [n=41]
0%
10%
20%
30%
40%
50%
60%
Lancaster [n=99]
0%
10%
20%
30%
40%
50%
60%
Lebanon [n=141]
0%
10%
20%
30%
40%
50%
60%
Lehigh [n=122]
31
Pennsylvania Commission on Sentencing
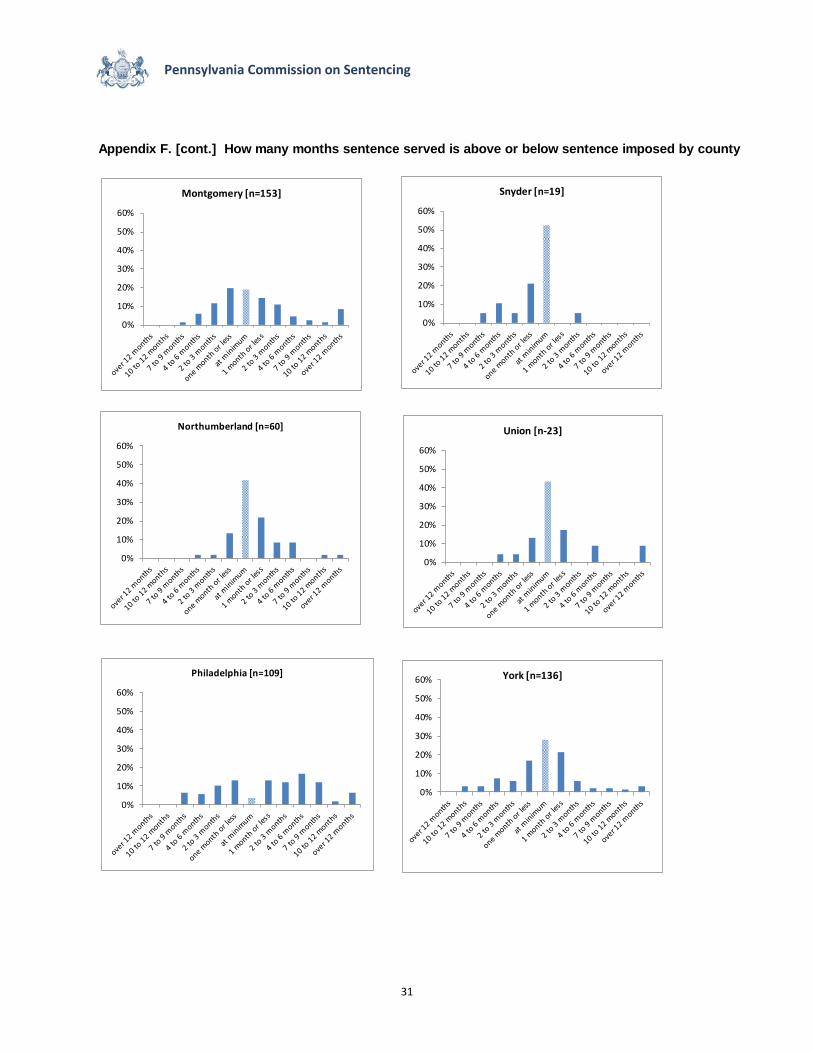
Appendix F. [cont.] How many months sentence served is above or below sentence imposed by county
0%
10%
20%
30%
40%
50%
60%
Montgomery [n=153]
0%
10%
20%
30%
40%
50%
60%
Northumberland [n=60]
0%
10%
20%
30%
40%
50%
60%
Philadelphia [n=109]
0%
10%
20%
30%
40%
50%
60%
Snyder [n=19]
0%
10%
20%
30%
40%
50%
60%
Union [n-23]
0%
10%
20%
30%
40%
50%
60% York [n=136]