Embed Size (px)
Citation preview
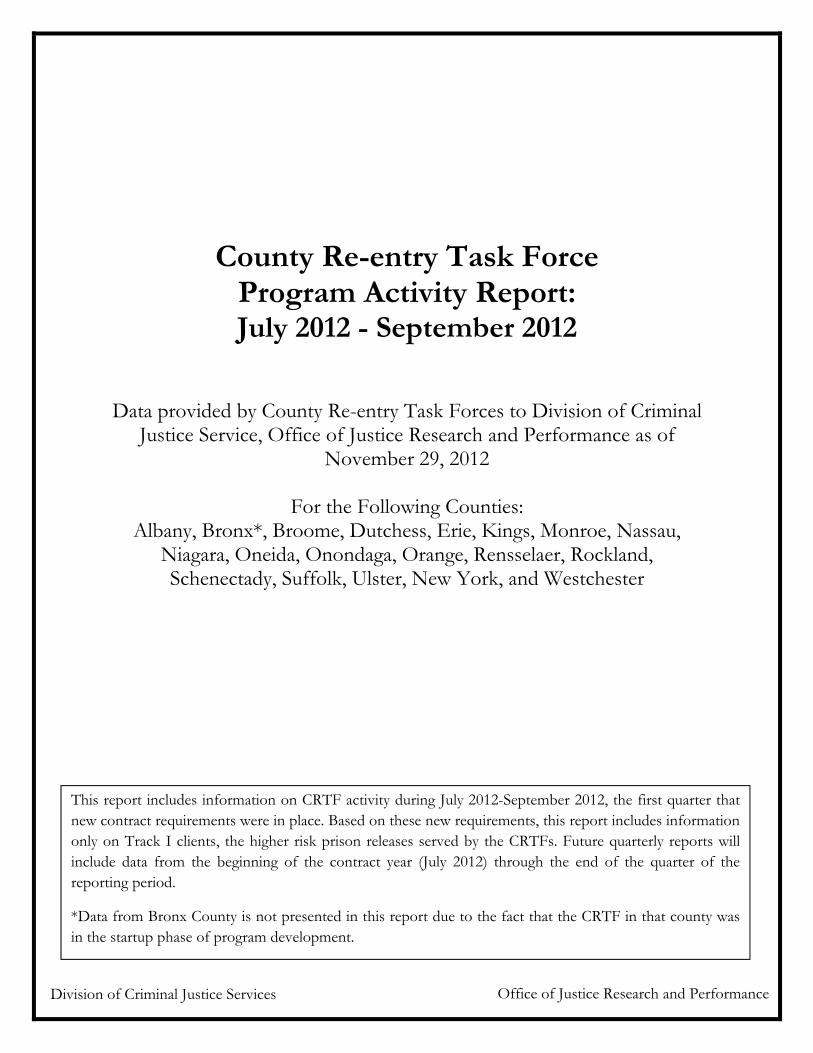
County Re-entry Task Force Program Activity Report:
July 2012 - September 2012
Data provided by County Re-entry Task Forces to Division of Criminal Justice Service, Office of Justice Research and Performance as of
November 29, 2012
For the Following Counties: Albany, Bronx*, Broome, Dutchess, Erie, Kings, Monroe, Nassau,
Niagara, Oneida, Onondaga, Orange, Rensselaer, Rockland, Schenectady, Suffolk, Ulster, New York, and Westchester
Division of Criminal Justice Services Office of Justice Research and Performance
This report includes information on CRTF activity during July 2012-September 2012, the first quarter that new contract requirements were in place. Based on these new requirements, this report includes information only on Track I clients, the higher risk prison releases served by the CRTFs. Future quarterly reports will include data from the beginning of the contract year (July 2012) through the end of the quarter of the reporting period.
*Data from Bronx County is not presented in this report due to the fact that the CRTF in that county was in the startup phase of program development.

2
CRTF Track I (T1) Admissions, July 2012 – September 2012
There were 801 Track I clients admitted to the CRTFs from July through September of 2012. Overall, the CRTFs met 81% of their Track I intake goal for the quarter. Individual county Track I admission goal attainment varied considerably from 29% to 186%.
County
Monthly T1
Intake Goal
Quarterly T1
Intake Goal
July August September July-Sept
# of T1
Intakes
% Goal Met
# of T1
Intakes
% Goal Met
# of T1
Intakes
% Goal Met
# of T1
Intakes
% Goal Met
Albany 20 61 24 118% 26 127% 26 127% 76 124%Broome 11 32 17 161% 16 151% 26 246% 59 186%Dutchess 10 31 6 58% 11 106% N/A N/A 17 54% Erie 38 115 18 47% 8 21% 7 18% 33 29% Kings 21 63 18 86% 27 130% 24 115% 69 110%Monroe 37 111 10 27% 27 73% 12 33% 49 44% Nassau 17 52 31 180% 20 116% 15 87% 66 128%Niagara 10 31 7 67% 5 48% 11 106% 23 74% Oneida 12 36 12 101% 17 143% 18 151% 47 131%Onondaga 28 85 19 67% 18 64% 18 64% 55 65% Orange 15 44 34 232% 28 191% 12 82% 74 168%Rensselaer 8 25 14 168% 7 84% 12 144% 33 132%Rockland 5 15 9 180% 7 140% 8 160% 24 160%Schenectady 12 37 12 97% 14 114% 14 114% 40 108%Suffolk 38 114 15 40% - 0% - 0% 15 13% Ulster 10 31 7 67% 10 96% 4 38% 21 67% New York 21 63 16 77% 7 34% 5 24% 28 45% Westchester 15 44 17 117% 15 103% 15 103% 47 107%
Total 329 988 286 87% 263 80% 227 69% 776 79%
This project was supported by Grant No. 2011-BJ-CX-K042 awarded by the Bureau of Justice Statistics, Office of Justice Programs, U.S. Department of Justice. Points of view in this document are those of the author and do not necessarily represent the official position or policies of the U.S. Department of Justice.

3
CRTF Track I Admissions*, July 2012 – September 2012 (cont’d)
22% of Track I clients admitted to the CRTFs were under 25 years old. For county specific Track I client age information, see page 9.
A small proportion (6%) of Track I clients were female. For county specific Track I client sex information, see page 9.
17 years & under, 1, <1%
18-24 years, 172, 22%
25-34 years, 326, 42%
35-49 years, 208, 27%
50+ years, 69, 9%
Age of Track I Clients: July 2012 - September 2012 Admissions
n=776
Male72894%
Female446%
Unknown4
<1%
Sex Of Track I Clients: July 2012 - September 2012 Admissions
n=776

4
CRTF Track I Admissions, July 2012 – September 2012 (cont’d)
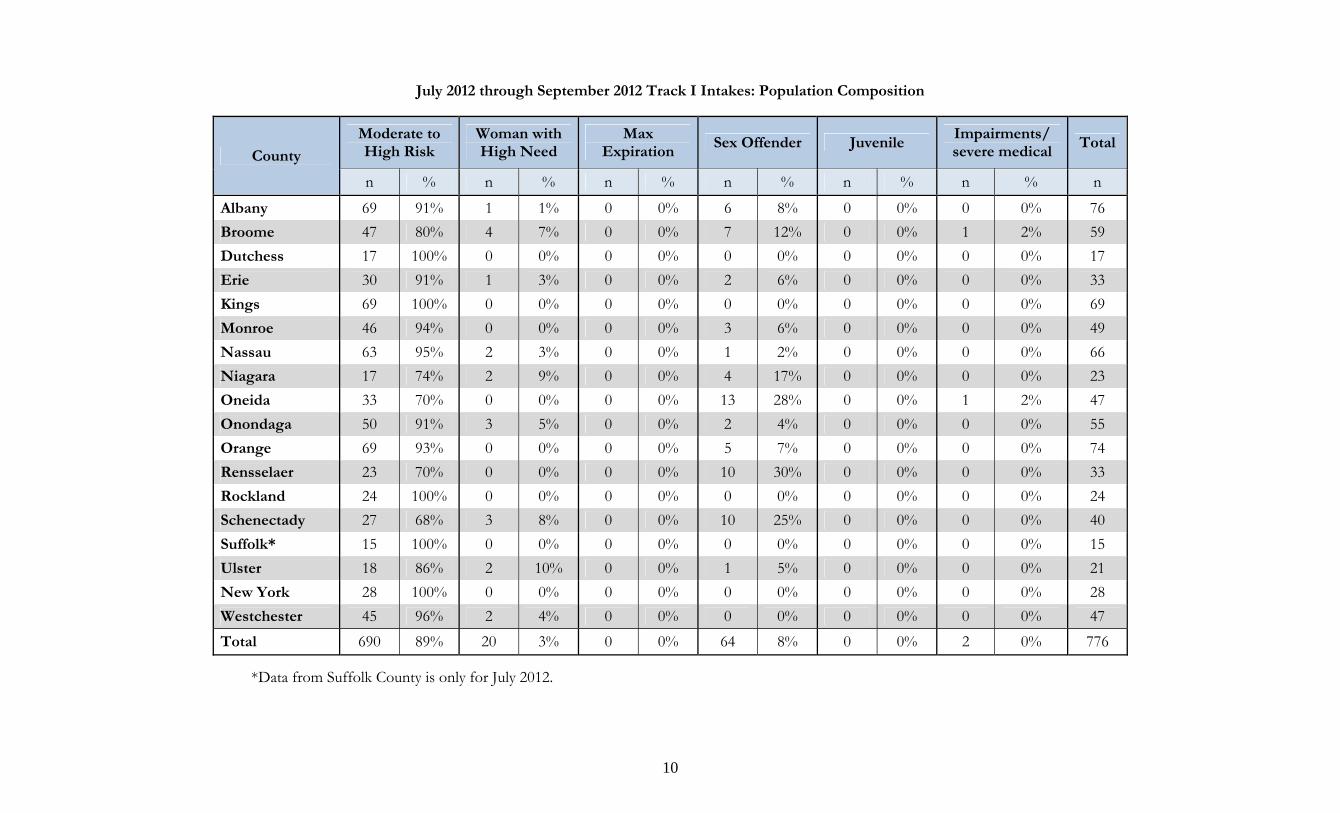
Nearly all (97%) Track I clients were moderate to high risk offenders (89%) or sex offenders (8%). For county level Track I population information, see page 10.
Nearly all (98%) of Track I clients were on parole when admitted to the CRTFs. County level information can be found on page 12.
Of Track I admissions on parole, case conferences were held for 644 (85%). County level information can be found on page 12.
Moderate to High Risk
69089%
Woman with High Need, 3%
Max Expiration, 0%
Sex Offender, 8%
Juvenile, 0%Impairments/ severe medical,
<1%
Other86
11%
Track I Population Composition: July 2012 - September 2012 Admissions
n=776
On Parole, 758, 98%
Maximum Expiration, 17, 2%
Other, 1, <1%
Supervision Status of Track I Clients: July 2012 - September 2012 Admissions
n=776

5
CRTF Track I Admissions, July 2012 – September 2012 (cont’d)
The needs that were most commonly identified by the CRTFs for Track I clients were employment programming (86%), social services assistance (80%), and chemical dependency treatment (76%). See pages 13-14 for additional county specific information.
CRTF Track I Discharges, July 2012 – September 2012
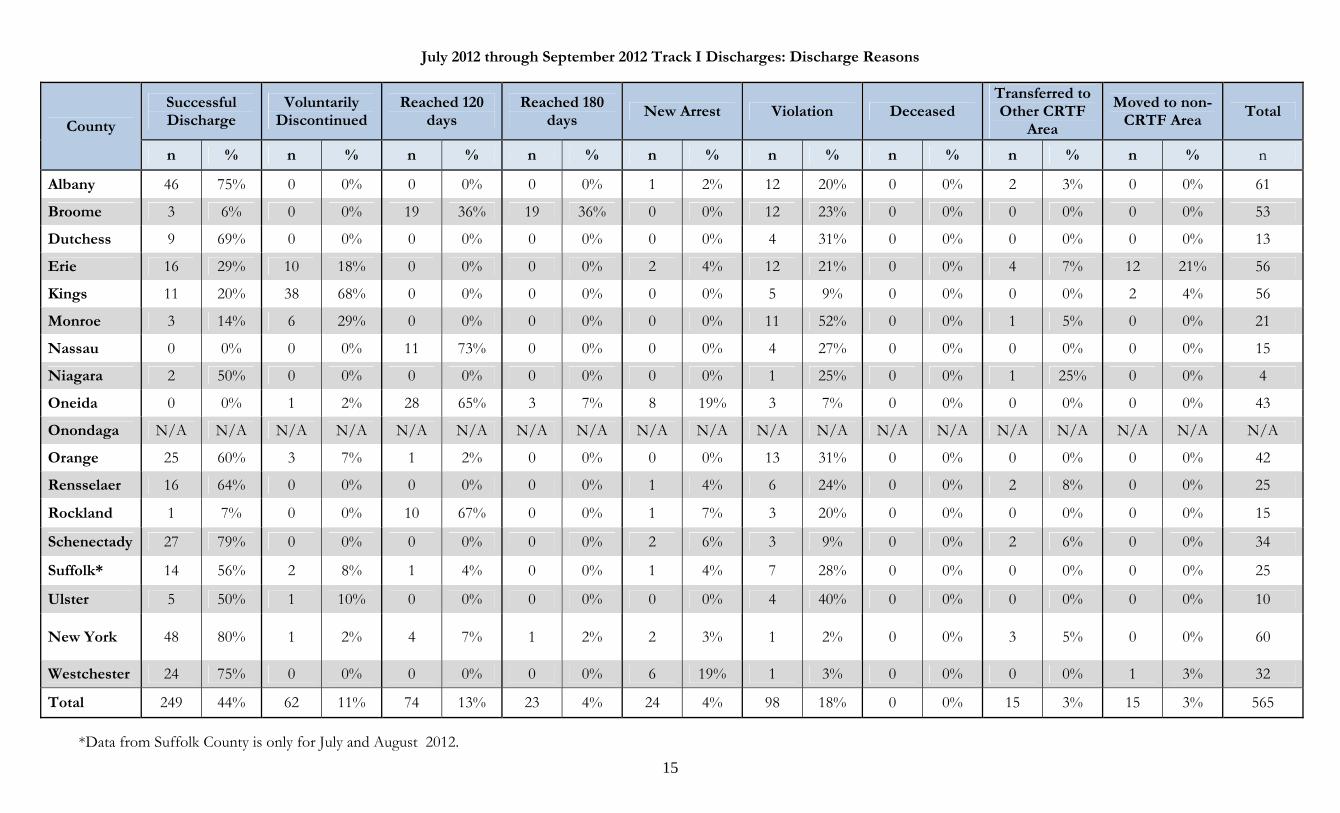
Of the 565 clients discharged between July 2012 and September 2012, 347 (62%) clients successfully completed the CRTFs. 126 (22%) clients were discharged due to a new arrest or parole violation (as reported by the CRTFs). County level data can be found on page 15.
86%80% 76%
64%
52%45%
38% 37% 36%27%
20%9%
3%
Identified Service Needs of Track I Clients: July 2012 - September 2012 Admissions
Successful Completion
34762%
Voluntarily Discontinued
6211%
New Arrest/Violation
12622%
Other Reasons305%
Discharge Reasons for Track I Clients: July 2012 - September 2012 Discharges
n=565

6
CRTF Track I Discharges, July 2012 – September 2012 (cont’d)
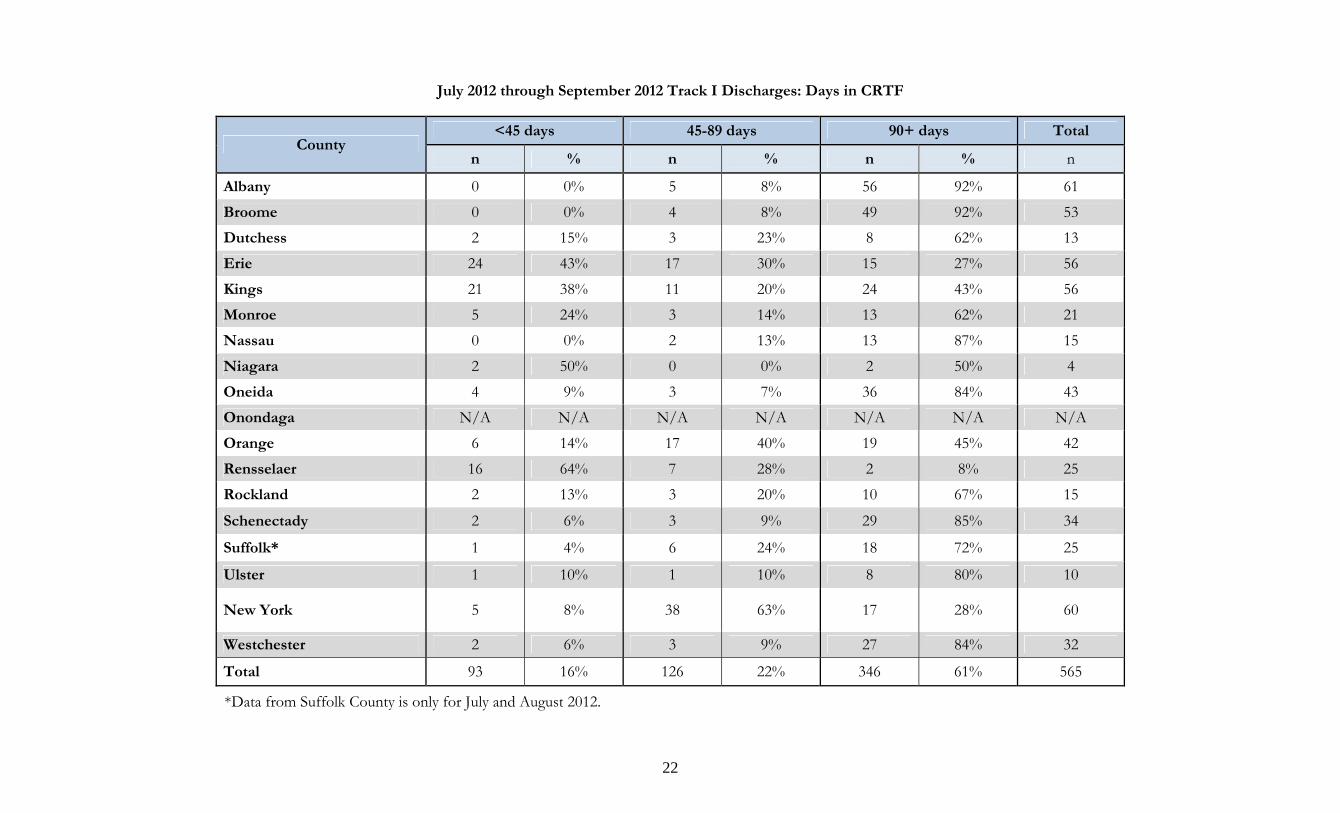
472 (83%) clients spent at least 45 days in the CRTFs, with 346 (61%) enrolled more than 90 days. See page 22 for county specific information.
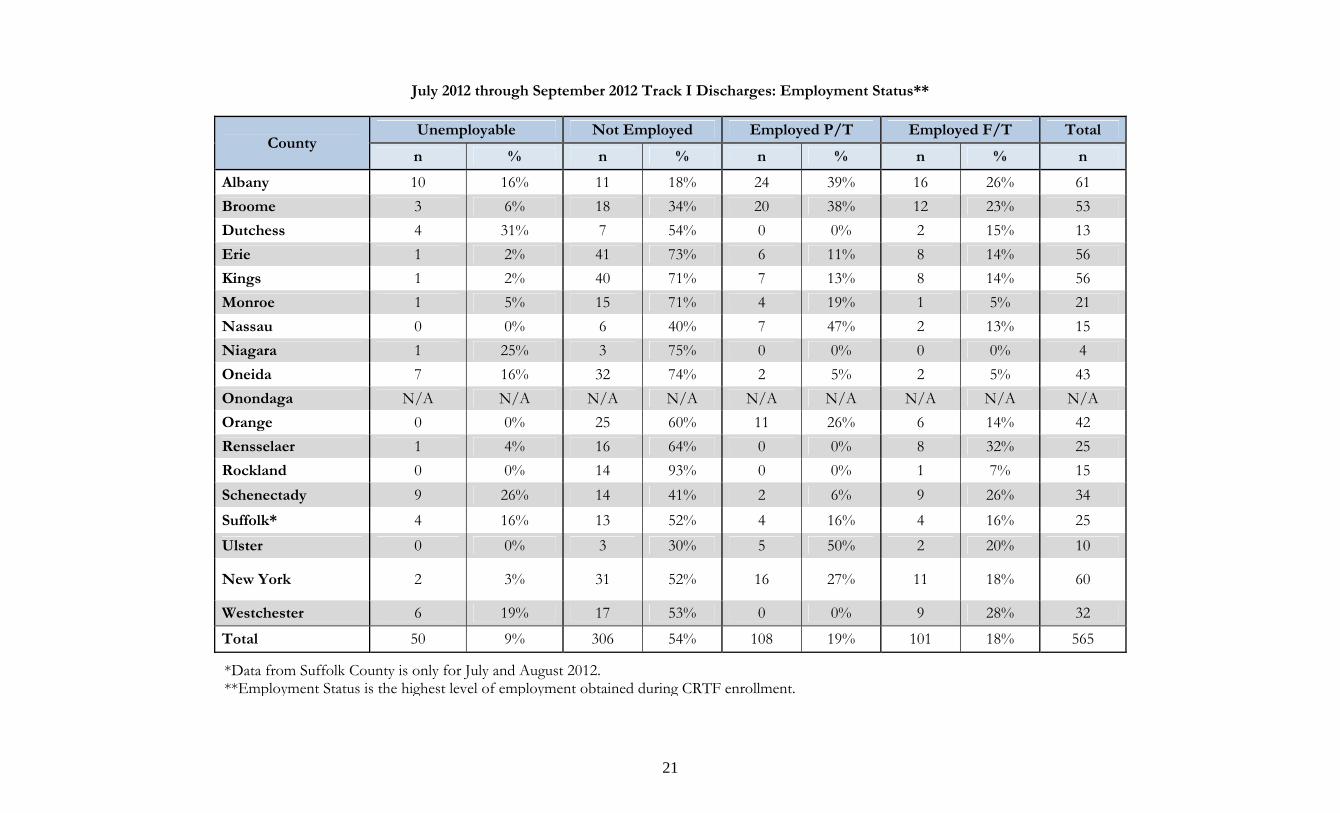
209 (37%) of clients discharged from the CRTFs were employed while in the CRTFs, with an additional 50 (9%) reported to be unemployable. County level employment data is available on page 21.
<45 days93
17%
45-89 days12622%
90+ days34661%
Days Spent in the CRTF by Track I Clients: July 2012 - September 2012 Discharges
n=565
Not Employed30654%
Unemployable9%
Employed P/T19%
Employed F/T18%
Employed/ Unemployable
25946%
Employment Status of Track I Clients: July 2012 - September 2012 Discharges
n=565

7
Program Participation among Track I Discharges*, July 2012 – September 2012
County specific data regarding program participation is located on pages 16-19.
392 (85%) clients with a need for social services assistance assessed at intake had obtained social services assistance prior to discharge.
287 (65%) clients with a need for housing assistance assessed at intake were in a private residence at discharge.
The following chart shows the proportion of clients who either successfully completed or were still engaged in a program at discharge for the remainder of the needs areas:
12%
25%
3%
19% 20%
0%15%
10%12%
2%
51%34%
55%
37% 30%
48%30% 33% 31%
22%
ChemDep Prog
AngerMgt
MH TxProgram
Off AcctProg
Cog BehInt
Sex OffTx Prog
EmployProg
FamilySupp Prog
MentoringProg
Ed/ VocProg
Percentage of Clients with Identified Need Who Successfully Completed or Were Currently Engaged in Programs at Discharge
Successfully Completed Currently Engaged63%
59% 58% 56%
50% 48%45% 43% 43%
24%
*For clients who were discharged due to a new arrest or parole violation, program participation status reported by the CRTF is prior to the client’s arrest/violation.

8
Service Gaps, July 2012 – September 2012
Needs assessment information is reported for 13 needs areas; for each needs area, the CRTFs record whether an assessment is conducted as well as the results. The majority of Track I clients were assessed for all needs areas. Data by county is on pages 13-14.
The following chart shows the proportion of clients who did not have their need met while engaged in the CRTF because an appropriate program does not exist in that county or the client was placed on a waiting list:
The needs areas with the largest proportion of Track I clients who did not get their need met due to lack of an appropriate program were mentoring (28% of clients with an assessed need) and family support (15%). See pages 16-19 for county specific information.
Needs areas with the largest proportion of Track I clients still waiting for a program at discharge were sex offender treatment (24% of clients with an assessed need) and educational/vocational programs (15%). See pages 16-19 for county level data.
28%
3% 5%
15%
8%4% 4% 4%
7%
2%
1%
24%15%
2%
7%
8%8% 7%
4%
4%
MentoringProg
Sex OffTx Prog
Ed/ VocProg
FamilySupp Prog
Off AcctProg
Cog BehInt
AngerMgt
EmployProg
MH TxProgram
ChemDep Prog
Percentage of Clients with Identified Need Who Were Not Enrolled in Programs Due to Lack of Program Availability
No Appropriate Program Client on Waiting List
29%27%
20%
17%15%
12% 12% 11% 11%
6%

9
July 2012 through September 2012 Track I Intakes: Age and Sex
County
17 years & under
18-24 years 25-34 years 35-49 years 50+ years Total County Male Female Unknown Total
n % n % n % n % n % n n % n % n % n
Albany 0 0% 22 29% 31 41% 20 26% 3 4% 76 Albany 74 97% 2 3% 0 0% 76
Broome 0 0% 10 17% 27 46% 15 25% 7 12% 59 Broome 52 88% 6 10% 1 2% 59
Dutchess 0 0% 3 18% 6 35% 6 35% 2 12% 17 Dutchess 15 88% 2 12% 0 0% 17
Erie 0 0% 7 21% 11 33% 10 30% 5 15% 33 Erie 31 94% 2 6% 0 0% 33
Kings 0 0% 14 20% 32 46% 21 30% 2 3% 69 Kings 66 96% 2 3% 1 1% 69
Monroe 0 0% 13 27% 19 39% 13 27% 4 8% 49 Monroe 47 96% 1 2% 1 2% 49
Nassau 0 0% 13 20% 26 39% 19 29% 8 12% 66 Nassau 64 97% 2 3% 0 0% 66
Niagara 0 0% 1 4% 11 48% 7 30% 4 17% 23 Niagara 20 87% 3 13% 0 0% 23
Oneida 0 0% 6 13% 25 53% 15 32% 1 2% 47 Oneida 46 98% 1 2% 0 0% 47
Onondaga 0 0% 16 29% 25 45% 11 20% 3 5% 55 Onondaga 48 87% 7 13% 0 0% 55
Orange 0 0% 15 20% 35 47% 16 22% 8 11% 74 Orange 69 93% 4 5% 1 1% 74
Rensselaer 0 0% 8 24% 11 33% 11 33% 3 9% 33 Rensselaer 32 97% 1 3% 0 0% 33
Rockland 0 0% 6 25% 11 46% 5 21% 2 8% 24 Rockland 24 100% 0 0% 0 0% 24
Schenectady 0 0% 10 25% 15 38% 9 23% 6 15% 40 Schenectady 37 93% 3 8% 0 0% 40
Suffolk* 1 7% 5 33% 4 27% 4 27% 1 7% 15 Suffolk* 15 100% 0 0% 0 0% 15
Ulster 0 0% 5 24% 4 19% 9 43% 3 14% 21 Ulster 16 76% 5 24% 0 0% 21
New York 0 0% 9 32% 8 29% 8 29% 3 11% 28 New York 27 96% 1 4% 0 0% 28
Westchester 0 0% 9 19% 25 53% 9 19% 4 9% 47 Westchester 45 96% 2 4% 0 0% 47
Total 1 0% 172 22% 326 42% 208 27% 69 9% 776 Total 728 94% 44 6% 4 1% 776
*Data from Suffolk County is only for July 2012.
10
July 2012 through September 2012 Track I Intakes: Population Composition
County
Moderate to High Risk
Woman with High Need
Max Expiration
Sex Offender Juvenile Impairments/ severe medical
Total
n % n % n % n % n % n % n
Albany 69 91% 1 1% 0 0% 6 8% 0 0% 0 0% 76 Broome 47 80% 4 7% 0 0% 7 12% 0 0% 1 2% 59 Dutchess 17 100% 0 0% 0 0% 0 0% 0 0% 0 0% 17 Erie 30 91% 1 3% 0 0% 2 6% 0 0% 0 0% 33 Kings 69 100% 0 0% 0 0% 0 0% 0 0% 0 0% 69 Monroe 46 94% 0 0% 0 0% 3 6% 0 0% 0 0% 49 Nassau 63 95% 2 3% 0 0% 1 2% 0 0% 0 0% 66 Niagara 17 74% 2 9% 0 0% 4 17% 0 0% 0 0% 23 Oneida 33 70% 0 0% 0 0% 13 28% 0 0% 1 2% 47 Onondaga 50 91% 3 5% 0 0% 2 4% 0 0% 0 0% 55 Orange 69 93% 0 0% 0 0% 5 7% 0 0% 0 0% 74 Rensselaer 23 70% 0 0% 0 0% 10 30% 0 0% 0 0% 33 Rockland 24 100% 0 0% 0 0% 0 0% 0 0% 0 0% 24 Schenectady 27 68% 3 8% 0 0% 10 25% 0 0% 0 0% 40 Suffolk* 15 100% 0 0% 0 0% 0 0% 0 0% 0 0% 15 Ulster 18 86% 2 10% 0 0% 1 5% 0 0% 0 0% 21 New York 28 100% 0 0% 0 0% 0 0% 0 0% 0 0% 28 Westchester 45 96% 2 4% 0 0% 0 0% 0 0% 0 0% 47 Total 690 89% 20 3% 0 0% 64 8% 0 0% 2 0% 776
*Data from Suffolk County is only for July 2012.

11
July 2012 through September 2012 Track I Intakes: Time between DOCCS Release and CRTF Intake
County 7 days or less 8-30 days 31-60 days 61-90 days 91-365 days
More than 365 days
Total
n % n % n % n % n % n % n Albany 57 75% 13 17% 5 7% 0 0% 0 0% 1 1% 76 Broome 25 42% 29 49% 2 3% 1 2% 0 0% 2 3% 59 Dutchess 10 59% 3 18% 2 12% 0 0% 1 6% 1 6% 17 Erie 23 70% 5 15% 1 3% 1 3% 3 9% 0 0% 33 Kings 6 9% 31 45% 8 12% 5 7% 13 19% 6 9% 69 Monroe 6 12% 17 35% 8 16% 3 6% 11 22% 4 8% 49
Nassau 50 76% 12 18% 3 5% 0 0% 1 2% 0 0% 66
Niagara 15 65% 0 0% 1 4% 2 9% 2 9% 3 13% 23
Oneida 41 87% 5 11% 1 2% 0 0% 0 0% 0 0% 47
Onondaga 41 75% 9 16% 5 9% 0 0% 0 0% 0 0% 55
Orange 32 43% 14 19% 6 8% 4 5% 13 18% 5 7% 74
Rensselaer 27 82% 6 18% 0 0% 0 0% 0 0% 0 0% 33
Rockland 18 75% 5 21% 0 0% 0 0% 0 0% 1 4% 24
Schenectady 19 48% 8 20% 1 3% 0 0% 8 20% 4 10% 40
Suffolk* 8 53% 4 27% 1 7% 0 0% 1 7% 1 7% 15
Ulster 5 24% 10 48% 0 0% 0 0% 3 14% 3 14% 21
New York 4 14% 19 68% 3 11% 1 4% 0 0% 1 4% 28
Westchester 16 34% 17 36% 8 17% 2 4% 1 2% 3 6% 47 Total 403 52% 207 27% 55 7% 19 2% 57 7% 35 5% 776
*Data from Suffolk County is only for July 2012.

12
July 2012 through September 2012 Track I Intakes: Supervision Status and Case Conference Status
County On Parole Max Exp Other Total
County
On Parole, Case Conf
On Parole, No Case Conf
Not on Parole, Case Conf
Not on Parole, No Case Conf
Total
n % n % n % n n % n % n % n % n
Albany 71 93% 5 7% 0 0% 76 Albany 71 93% 0 0% 5 7% 0 0% 76 Broome 55 93% 4 7% 0 0% 59 Broome 55 93% 0 0% 2 3% 2 3% 59 Dutchess 17 100% 0 0% 0 0% 17 Dutchess 11 65% 6 35% 0 0% 0 0% 17 Erie 33 100% 0 0% 0 0% 33 Erie 30 91% 3 9% 0 0% 0 0% 33 Kings 69 100% 0 0% 0 0% 69 Kings 69 100% 0 0% 0 0% 0 0% 69 Monroe 47 96% 2 4% 0 0% 49 Monroe 0 0% 47 96% 0 0% 2 4% 49
Nassau 66 100% 0 0% 0 0% 66 Nassau 62 94% 4 6% 0 0% 0 0% 66
Niagara 23 100% 0 0% 0 0% 23 Niagara 23 100% 0 0% 0 0% 0 0% 23
Oneida 47 100% 0 0% 0 0% 47 Oneida 40 85% 7 15% 0 0% 0 0% 47
Onondaga 54 98% 0 0% 1 2% 55 Onondaga 54 98% 0 0% 1 2% 0 0% 55
Orange 71 96% 3 4% 0 0% 74 Orange 25 34% 46 62% 0 0% 3 4% 74
Rensselaer 33 100% 0 0% 0 0% 33 Rensselaer 33 100% 0 0% 0 0% 0 0% 33
Rockland 24 100% 0 0% 0 0% 24 Rockland 24 100% 0 0% 0 0% 0 0% 24
Schenectady 37 93% 3 8% 0 0% 40 Schenectady 37 93% 0 0% 3 8% 0 0% 40
Suffolk* 15 100% 0 0% 0 0% 15 Suffolk* 13 87% 2 13% 0 0% 0 0% 15
Ulster 21 100% 0 0% 0 0% 21 Ulster 21 100% 0 0% 0 0% 0 0% 21
New York 28 100% 0 0% 0 0% 28 New York 28 100% 0 0% 0 0% 0 0% 28
Westchester 47 100% 0 0% 0 0% 47 Westchester 47 100% 0 0% 0 0% 0 0% 47 Total 758 98% 17 2% 1 0% 776 Total 643 83% 115 15% 11 1% 7 1% 776
*Data from Suffolk County is only for July 2012.

13
July 2012 through September 2012 Track I Intakes: Service Needs
County Total
Albany Broome Dutch-ess Erie Kings Monroe Nassau Niagara Oneida Onon-
daga Orange Renss-elaer
Rock-land
Schen-ectady Suffolk* Ulster New
York West- chester n %
Hou
sin
g Need 30 32 8 22 3 33 36 21 25 31 34 14 3 12 8 14 7 19 352 45% No need 46 27 9 11 66 16 30 2 22 22 40 19 21 28 7 7 21 28 422 54% Not Assessed 0 0 0 0 0 0 0 0 0 2 0 0 0 0 0 0 0 0 2 0%
Em
plo
y Need 73 48 17 17 60 32 66 18 42 44 71 23 18 36 13 18 25 44 665 86% No need 3 11 0 16 9 17 0 5 5 9 0 10 2 4 2 3 3 3 102 13% Not Assessed 0 0 0 0 0 0 0 0 0 2 3 0 4 0 0 0 0 0 9 1%
Ed
/ V
oc Need 24 25 5 15 69 20 66 17 17 23 19 9 4 17 14 16 19 23 402 52%
No need 52 34 12 17 0 29 0 6 30 29 53 24 18 23 1 5 8 24 365 47% Not Assessed 0 0 0 1 0 0 0 0 0 3 2 0 2 0 0 0 1 0 9 1%
Soc
Serv
A
ssis
t Need 69 44 15 30 26 39 66 23 41 45 69 16 21 29 14 18 13 46 624 80% No need 7 15 2 2 43 10 0 0 6 8 4 17 3 11 1 3 15 1 148 19% Not Assessed 0 0 0 1 0 0 0 0 0 2 1 0 0 0 0 0 0 0 4 1%
Ch
em D
ep
Tx
Need 37 45 15 30 68 19 66 18 23 39 63 23 23 23 15 15 22 44 588 76% No need 39 14 2 1 1 30 0 5 24 16 9 10 1 17 0 6 6 3 184 24% Not Assessed 0 0 0 2 0 0 0 0 0 0 2 0 0 0 0 0 0 0 4 1%
Sex
Off
T
x
Need 9 6 1 2 0 5 3 4 9 5 6 10 1 10 0 2 0 0 73 9% No need 67 24 16 31 69 44 63 19 38 50 68 23 22 30 15 19 28 47 673 87% Not Assessed 0 29 0 0 0 0 0 0 0 0 0 0 1 0 0 0 0 0 30 4%
Off
Acc
t P
rog
Need 10 18 1 10 1 3 66 20 8 15 12 1 5 13 9 12 1 7 212 27% No need 66 41 16 21 68 46 0 3 39 39 59 32 19 27 6 9 27 40 558 72% Not Assessed 0 0 0 2 0 0 0 0 0 1 3 0 0 0 0 0 0 0 6 1%
Total 76 59 17 33 69 49 66 23 47 55 74 33 24 40 15 21 28 47 776
*Data from Suffolk County is only from July 2012.

14
July 2012 through September 2012 Track I Intakes: Service Needs (cont’d)
County Total
Albany Broome Dutch-ess Erie Kings Monroe Nassau Niagara Oneida Onon-
daga Orange Renss-elaer
Rock-land
Schen-ectady Suffolk* Ulster New
York West- chester n %
Cog
Beh
In
t Need 52 36 17 10 68 16 66 23 3 9 51 20 3 29 11 15 20 47 496 64% No need 24 23 0 21 1 33 0 0 43 40 20 13 1 11 4 6 8 0 248 32% Not Assessed 0 0 0 2 0 0 0 0 1 6 3 0 20 0 0 0 0 0 32 4%
Men
tor Need 28 29 0 3 7 2 66 21 1 2 5 27 2 26 5 14 1 47 286 37%
No need 48 30 17 29 62 47 0 2 46 51 66 6 14 14 10 7 27 0 476 61% Not Assessed 0 0 0 1 0 0 0 0 0 2 3 0 8 0 0 0 0 0 14 2%
An
ger
Mgt
Need 14 25 13 13 9 23 20 4 1 15 57 12 13 4 9 10 14 36 292 38% No need 62 34 4 18 60 26 46 19 46 40 14 21 11 36 6 11 13 11 478 62% Not Assessed 0 0 0 2 0 0 0 0 0 0 3 0 0 0 0 0 1 0 6 1%
Men
tal
Hea
lth
Tx Need 4 12 5 12 3 4 8 9 12 10 13 10 3 14 2 15 3 13 152 20%
No need 72 47 12 20 66 45 58 14 35 40 58 23 21 26 13 5 25 34 614 79% Not Assessed 0 0 0 1 0 0 0 0 0 5 3 0 0 0 0 1 0 0 10 1%
Fam
Su
pp
Need 23 36 0 7 0 5 66 16 0 35 9 9 1 21 2 13 12 23 278 36% No need 53 23 17 24 69 44 0 7 47 20 63 24 20 19 13 8 16 24 491 63% Not Assessed 0 0 0 2 0 0 0 0 0 0 2 0 3 0 0 0 0 0 7 1%
Vet
s P
rog Need 2 3 0 2 0 0 1 0 2 2 2 1 0 4 0 1 1 0 21 3%
No need 74 3 17 30 69 49 65 23 45 53 71 32 24 30 15 20 27 47 694 89% Not Assessed 0 53 0 1 0 0 0 0 0 0 1 0 0 6 0 0 0 0 61 8%
Total 76 59 17 33 69 49 66 23 47 55 74 33 24 40 15 21 28 47 776
*Data from Suffolk County is only for July 2012.
15
July 2012 through September 2012 Track I Discharges: Discharge Reasons
County
Successful Discharge
Voluntarily Discontinued
Reached 120 days
Reached 180 days
New Arrest Violation Deceased Transferred to Other CRTF
Area
Moved to non-CRTF Area
Total
n % n % n % n % n % n % n % n % n % n
Albany 46 75% 0 0% 0 0% 0 0% 1 2% 12 20% 0 0% 2 3% 0 0% 61
Broome 3 6% 0 0% 19 36% 19 36% 0 0% 12 23% 0 0% 0 0% 0 0% 53
Dutchess 9 69% 0 0% 0 0% 0 0% 0 0% 4 31% 0 0% 0 0% 0 0% 13
Erie 16 29% 10 18% 0 0% 0 0% 2 4% 12 21% 0 0% 4 7% 12 21% 56
Kings 11 20% 38 68% 0 0% 0 0% 0 0% 5 9% 0 0% 0 0% 2 4% 56
Monroe 3 14% 6 29% 0 0% 0 0% 0 0% 11 52% 0 0% 1 5% 0 0% 21
Nassau 0 0% 0 0% 11 73% 0 0% 0 0% 4 27% 0 0% 0 0% 0 0% 15
Niagara 2 50% 0 0% 0 0% 0 0% 0 0% 1 25% 0 0% 1 25% 0 0% 4
Oneida 0 0% 1 2% 28 65% 3 7% 8 19% 3 7% 0 0% 0 0% 0 0% 43
Onondaga N/A N/A N/A N/A N/A N/A N/A N/A N/A N/A N/A N/A N/A N/A N/A N/A N/A N/A N/A
Orange 25 60% 3 7% 1 2% 0 0% 0 0% 13 31% 0 0% 0 0% 0 0% 42
Rensselaer 16 64% 0 0% 0 0% 0 0% 1 4% 6 24% 0 0% 2 8% 0 0% 25
Rockland 1 7% 0 0% 10 67% 0 0% 1 7% 3 20% 0 0% 0 0% 0 0% 15
Schenectady 27 79% 0 0% 0 0% 0 0% 2 6% 3 9% 0 0% 2 6% 0 0% 34
Suffolk* 14 56% 2 8% 1 4% 0 0% 1 4% 7 28% 0 0% 0 0% 0 0% 25
Ulster 5 50% 1 10% 0 0% 0 0% 0 0% 4 40% 0 0% 0 0% 0 0% 10
New York 48 80% 1 2% 4 7% 1 2% 2 3% 1 2% 0 0% 3 5% 0 0% 60
Westchester 24 75% 0 0% 0 0% 0 0% 6 19% 1 3% 0 0% 0 0% 1 3% 32
Total 249 44% 62 11% 74 13% 23 4% 24 4% 98 18% 0 0% 15 3% 15 3% 565
*Data from Suffolk County is only for July and August 2012.

16
July 2012 through September 2012 Track I Discharges: Program Participation Status at CRTF Discharge** County Total
Albany Broome Dutch-ess Erie Kings Monroe Nassau Nia-
gara Oneida Onon-daga Orange Renss-
elaer Rock-land
Schen-ectady
Suf-folk* Ulster New
York West-chester n %
Hou
sin
g
No Need 1 0 0 19 56 0 0 0 2 N/A 0 2 0 3 0 1 18 22 124 22% Halfway House 4 0 0 0 0 1 0 0 0 N/A 1 0 0 0 3 0 1 1 11 2% Residential Treatment Program 8 5 0 1 0 0 0 1 2 N/A 0 0 1 5 4 0 6 1 34 6% Parole Resid Stabilization Prog 5 0 2 1 0 0 1 0 0 N/A 4 1 0 4 0 0 2 0 20 4% Parole Community Based Resid Prog 1 1 0 24 0 7 3 0 0 N/A 0 0 0 0 0 0 0 2 38 7% Shelter- Housing Only 1 1 0 0 0 0 0 0 2 N/A 1 1 0 2 1 1 0 0 10 2% Shelter that includes ancillary services 1 0 0 10 0 0 2 0 1 N/A 1 3 1 0 1 0 0 5 25 4% Hotel/motel 4 3 1 0 0 0 0 0 0 N/A 1 4 0 0 0 2 1 0 16 3% Private Residence 36 43 10 1 0 13 9 3 36 N/A 34 14 13 20 16 6 32 1 287 51%
Em
p P
rog
Not Referred, No Need Identified 5 26 9 30 5 13 1 1 8 N/A 1 4 2 11 4 2 17 5 144 25% Not Referred, No Appropriate Program 1 3 0 4 0 0 0 0 0 N/A 2 0 0 0 2 0 5 1 18 3% Referred, On Waiting List 0 1 0 2 0 0 8 0 0 N/A 1 10 0 0 1 1 5 0 29 5% Referred, Client Declined Services 1 3 0 10 2 2 1 0 3 N/A 3 4 0 16 3 1 7 5 61 11% Referred, Client Deemed Ineligible 7 1 0 0 0 0 0 0 4 N/A 0 1 1 0 0 0 0 0 14 2% Referred, Other Non-Admission Reason 10 1 0 1 0 2 0 1 1 N/A 0 0 2 0 4 0 5 7 34 6% Referred, Currently Engaged 3 11 0 8 1 1 1 2 12 N/A 29 6 7 6 7 0 17 14 125 22% Referred, Discharged, Did Not Complete 9 3 2 1 37 3 4 0 5 N/A 2 0 2 0 3 4 3 0 78 14%
Referred, Discharged, Successful Completion 25 4 2 0 11 0 0 0 10 N/A 4 0 1 1 1 2 1 0 62 11%
Ed
/V
oc P
rog
Not Referred, No Need Identified 50 21 8 33 4 17 1 2 18 N/A 24 20 11 27 6 2 23 13 280 50% Not Referred, No Appropriate Program 3 2 2 1 0 0 0 2 0 N/A 3 0 0 0 1 0 2 0 16 3% Referred, On Waiting List 0 4 0 4 0 0 9 0 6 N/A 0 4 0 0 5 1 8 2 43 8% Referred, Client Declined Services 2 11 0 10 17 0 0 0 6 N/A 5 1 0 6 3 2 8 7 78 14% Referred, Client Deemed Ineligible 0 1 0 1 0 0 0 0 3 N/A 0 0 0 0 0 0 0 0 5 1% Referred, Other Non-Admission Reason 1 0 0 3 0 1 0 0 3 N/A 0 0 0 0 1 0 9 6 24 4% Referred, Currently Engaged 4 11 2 4 3 0 1 0 5 N/A 8 0 1 1 7 3 9 4 63 11% Referred, Discharged, Did Not Complete 0 1 1 0 32 3 4 0 1 N/A 0 0 3 0 2 2 1 0 50 9%
Referred, Discharged, Successful Completion 1 2 0 0 0 0 0 0 1 N/A 2 0 0 0 0 0 0 0 6 1%
Total 61 53 13 56 56 21 15 4 43 N/A 42 25 15 34 25 10 60 32 565
*Data from Suffolk County is only for July and August 2012. **Status for clients discharged due to a new arrest/violation is prior to arrest/violation.

17
July 2012 through September 2012 Track I Discharges: Program Participation Status at CRTF Discharge** (cont’d) County Total
Albany Broome Dutch-ess Erie Kings Monroe Nassau Nia-
gara Oneida Onon-daga Orange Renss-
elaer Rock-land
Schen-ectady
Suf-folk* Ulster New
York West-chester n %
Soc
Serv
Ass
t
No Need 7 7 1 4 19 1 1 0 2 N/A 2 18 3 8 5 7 20 0 105 19% Referred 0 0 1 5 1 0 0 0 1 N/A 0 3 1 1 0 0 3 3 19 3% Applied- Pending 0 0 1 9 3 0 0 0 3 N/A 8 0 0 0 0 0 3 0 27 5% Denied - Not Eligible 0 0 0 1 0 0 0 0 1 N/A 1 1 2 1 1 0 0 0 8 1% Denied - DSS Sanction 1 0 0 1 0 0 0 0 11 N/A 0 0 0 0 0 0 1 0 14 2%
Receiving Services 53 46 10 36 33 20 14 4 25 N/A 31 3 9 24 19 3 33 29 392 69%
Ch
em D
ep P
rog
Not Referred, No Need Identified 18 22 1 6 0 10 0 0 31 N/A 0 5 0 7 3 3 8 1 115 20% Not Referred, No Appropriate Program 0 0 2 1 0 0 0 0 0 N/A 2 0 0 0 1 0 1 0 7 1% Referred, On Waiting List 0 1 0 2 0 0 0 0 1 N/A 0 9 0 0 1 1 1 0 16 3% Referred, Client Declined Services 0 0 0 2 0 0 0 0 0 N/A 0 4 0 5 0 1 1 1 14 2% Referred, Client Deemed Ineligible 0 7 1 3 0 2 0 0 0 N/A 0 1 2 1 0 0 3 8 28 5% Referred, Other Non-Admission Reason 0 0 0 2 0 0 0 0 0 N/A 0 0 1 0 1 0 4 2 10 2% Referred, Currently Engaged 31 10 7 36 0 2 11 3 9 N/A 17 5 8 21 15 2 40 11 228 40% Referred, Discharged, Did Not Complete 9 1 1 2 44 6 4 0 2 N/A 9 0 3 0 3 3 2 2 91 16% Referred, Discharged, Successful Completion 3 12 1 2 12 1 0 1 0 N/A 14 1 1 0 1 0 0 7 56 10%
Sex
Off
Tx
Not Referred, No Need Identified 54 52 13 51 56 20 15 3 36 N/A 42 23 15 29 25 10 60 32 536 95% Not Referred, No Appropriate Program 0 1 0 0 0 0 0 0 0 N/A 0 0 0 0 0 0 0 0 1 0% Referred, On Waiting List 0 0 0 0 0 0 0 0 1 N/A 0 2 0 4 0 0 0 0 7 1% Referred, Client Declined Services 0 0 0 0 0 0 0 0 0 N/A 0 0 0 0 0 0 0 0 0 0% Referred, Client Deemed Ineligible 0 0 0 1 0 0 0 0 0 N/A 0 0 0 0 0 0 0 0 1 0% Referred, Other Non-Admission Reason 0 0 0 0 0 1 0 0 0 N/A 0 0 0 0 0 0 0 0 1 0% Referred, Currently Engaged 5 0 0 3 0 0 0 0 5 N/A 0 0 0 1 0 0 0 0 14 2% Referred, Discharged, Did Not Complete 2 0 0 1 0 0 0 1 1 N/A 0 0 0 0 0 0 0 0 5 1% Referred, Discharged, Successful Completion 0 0 0 0 0 0 0 0 0 N/A 0 0 0 0 0 0 0 0 0 0%
Total 61 53 13 56 56 21 15 4 43 N/A 42 25 15 34 25 10 60 32 565 *Data from Suffolk County is only for July and August 2012.
**Status for clients discharged due to a new arrest/violation is prior to arrest/violation.

18
July 2012 through September 2012 Track I Discharges: Program Participation Status at CRTF Discharge** (cont’d) County Total
Albany Broome Dutch-ess Erie Kings Monroe Nassau Nia-
gara Oneida Onon-daga Orange Renss-
elaer Rock-land
Schen-ectady
Suf-folk* Ulster New
York West-chester n %
Off
Acc
t P
rog
Not Referred, No Need Identified 58 23 13 38 55 17 0 0 32 N/A 37 25 11 28 13 2 48 28 428 76% Not Referred, No Appropriate Program 1 1 0 1 0 0 0 0 0 N/A 1 0 0 6 0 0 0 1 11 2% Referred, On Waiting List 0 4 0 0 0 0 0 0 1 N/A 0 0 0 0 0 2 3 0 10 2% Referred, Client Declined Services 0 2 0 1 0 0 0 1 0 N/A 0 0 0 0 0 1 2 0 7 1% Referred, Client Deemed Ineligible 0 0 0 0 0 0 0 0 0 N/A 0 0 0 0 0 0 0 0 0 0% Referred, Other Non-Admission Reason 0 0 0 1 0 3 2 1 1 N/A 0 0 0 0 1 0 2 2 13 2% Referred, Currently Engaged 2 3 0 11 0 0 9 0 7 N/A 1 0 3 0 9 0 5 1 51 9% Referred, Discharged, Did Not Complete 0 1 0 2 1 1 4 2 1 N/A 1 0 1 0 2 3 0 0 19 3% Referred, Discharged, Successful Completion 0 19 0 2 0 0 0 0 1 N/A 2 0 0 0 0 2 0 0 26 5%
Cog
Beh
In
t
Not Referred, No Need Identified 13 12 0 51 0 17 0 0 35 N/A 0 18 2 19 7 0 29 0 203 36% Not Referred, No Appropriate Program 5 0 1 1 0 0 0 0 0 N/A 2 0 0 3 0 0 4 0 16 3% Referred, On Waiting List 2 3 0 1 0 0 0 0 4 N/A 0 2 0 0 0 1 15 0 28 5% Referred, Client Declined Services 9 1 0 1 0 0 0 2 0 N/A 0 4 0 0 0 1 1 4 23 4% Referred, Client Deemed Ineligible 1 1 1 0 0 0 0 0 0 N/A 0 1 0 0 0 0 0 0 4 1% Referred, Other Non-Admission Reason 12 0 0 0 0 0 0 0 1 N/A 0 0 0 0 0 0 4 3 20 4% Referred, Currently Engaged 6 8 3 2 0 0 11 1 3 N/A 19 0 8 11 13 2 4 18 109 19% Referred, Discharged, Did Not Complete 2 1 8 0 44 4 4 1 0 N/A 8 0 4 0 3 4 2 2 87 15% Referred, Discharged, Successful Completion 11 27 0 0 12 0 0 0 0 N/A 13 0 1 1 2 2 1 5 75 13%
Men
tori
ng
Not Referred, No Need Identified 42 24 13 50 53 21 0 0 42 N/A 37 2 14 19 24 4 60 0 405 72% Not Referred, No Appropriate Program 1 5 0 0 0 0 0 1 1 N/A 2 0 0 2 0 0 0 32 44 8% Referred, On Waiting List 1 0 0 1 0 0 0 0 0 N/A 0 0 0 0 0 0 0 0 2 0% Referred, Client Declined Services 2 5 0 1 0 0 0 2 0 N/A 0 7 0 7 0 4 0 0 28 5% Referred, Client Deemed Ineligible 0 0 0 0 0 0 0 0 0 N/A 0 0 0 0 0 0 0 0 0 0% Referred, Other Non-Admission Reason 3 0 0 1 0 0 0 0 0 N/A 0 0 0 0 0 0 0 0 4 1% Referred, Currently Engaged 12 5 0 3 0 0 11 0 0 N/A 2 13 0 3 0 0 0 0 49 9% Referred, Discharged, Did Not Complete 0 1 0 0 2 0 4 1 0 N/A 1 0 1 0 0 2 0 0 12 2% Referred, Discharged, Successful Completion 0 13 0 0 1 0 0 0 0 N/A 0 3 0 3 1 0 0 0 21 4%
Total 61 53 13 56 56 21 15 4 43 N/A 42 25 15 34 25 10 60 32 565 *Data from Suffolk County is only for July and August 2012.
**Status for clients discharged due to a new arrest/violation is prior to arrest/violation.

19
July 2012 through September 2012 Track I Discharges: Program Participation Status at CRTF Discharge** (cont’d) County Total
Albany Broome Dutch-ess Erie Kings Monroe Nassau Nia-
gara Oneida Onon-daga Orange Renss-
elaer Rock-land
Schen-ectady
Suf-folk* Ulster New
York West-chester n %
An
ger
Mgt
Not Referred, No Need Identified 53 25 2 25 49 8 11 3 42 N/A 2 24 10 29 21 4 32 11 351 62% Not Referred, No Appropriate Program 1 0 1 0 0 0 0 0 0 N/A 2 0 0 2 0 0 2 0 8 1% Referred, On Waiting List 0 4 1 0 0 0 0 0 1 N/A 0 0 0 0 1 3 6 0 16 3% Referred, Client Declined Services 2 0 0 5 0 0 0 0 0 N/A 0 0 0 0 0 2 0 1 10 2% Referred, Client Deemed Ineligible 0 0 0 0 0 0 0 0 0 N/A 0 0 0 0 0 0 0 1 1 0% Referred, Other Non-Admission Reason 1 0 0 2 0 0 0 0 0 N/A 0 0 0 0 1 0 5 1 10 2% Referred, Currently Engaged 3 2 0 13 0 0 2 0 0 N/A 16 1 2 3 1 1 14 14 72 13% Referred, Discharged, Did Not Complete 1 0 5 4 6 8 2 1 0 N/A 9 0 2 0 0 0 1 2 41 7% Referred, Discharged, Successful Completion 0 22 4 7 1 5 0 0 0 N/A 13 0 1 0 1 0 0 2 56 10%
Men
tal H
ealt
h P
rog
Not Referred, No Need Identified 49 43 9 36 53 14 15 0 30 N/A 38 23 12 26 23 3 55 25 454 80% Not Referred, No Appropriate Program 0 3 0 1 0 0 0 1 0 N/A 2 0 0 1 0 0 0 0 8 1% Referred, On Waiting List 1 1 0 1 0 0 0 0 0 N/A 0 1 0 0 0 0 0 0 4 1% Referred, Client Declined Services 0 0 0 2 0 2 0 0 1 N/A 0 1 0 2 0 3 2 1 14 2% Referred, Client Deemed Ineligible 1 0 0 0 0 0 0 0 0 N/A 1 0 0 0 0 0 0 0 2 0% Referred, Other Non-Admission Reason 0 0 0 0 0 0 0 0 0 N/A 0 0 1 0 1 0 2 0 4 1% Referred, Currently Engaged 10 3 3 15 0 3 0 3 9 N/A 1 0 1 5 1 1 1 5 61 11% Referred, Discharged, Did Not Complete 0 0 1 1 3 2 0 0 3 N/A 0 0 1 0 0 3 0 1 15 3% Referred, Discharged, Successful Completion 0 3 0 0 0 0 0 0 0 N/A 0 0 0 0 0 0 0 0 3 1%
Fam
Su
pp
Pro
g
Not Referred, No Need Identified 48 26 12 48 51 21 0 1 43 N/A 39 23 15 24 20 7 50 11 439 78% Not Referred, No Appropriate Program 0 15 0 0 0 0 0 0 0 N/A 3 2 0 0 0 0 0 0 20 4% Referred, On Waiting List 0 2 0 1 0 0 0 0 0 N/A 0 0 0 0 0 0 0 0 3 1% Referred, Client Declined Services 2 2 0 4 0 0 0 2 0 N/A 0 0 0 9 0 1 0 15 35 6% Referred, Client Deemed Ineligible 0 0 0 0 0 0 0 0 0 N/A 0 0 0 0 0 0 0 0 0 0% Referred, Other Non-Admission Reason 1 0 0 0 0 0 1 0 0 N/A 0 0 0 0 0 0 2 3 7 1% Referred, Currently Engaged 10 4 0 3 0 0 10 1 0 N/A 0 0 0 1 0 1 8 3 41 7% Referred, Discharged, Did Not Complete 0 0 0 0 3 0 4 0 0 N/A 0 0 0 0 0 1 0 0 8 1% Referred, Discharged, Successful Completion 0 4 1 0 2 0 0 0 0 N/A 0 0 0 0 5 0 0 0 12 2%
Total 61 53 13 56 56 21 15 4 43 N/A 42 25 15 34 25 10 60 32 565 *Data from Suffolk County is only for July and August 2012.
**Status for clients discharged due to a new arrest/violation is prior to arrest/violation.
20
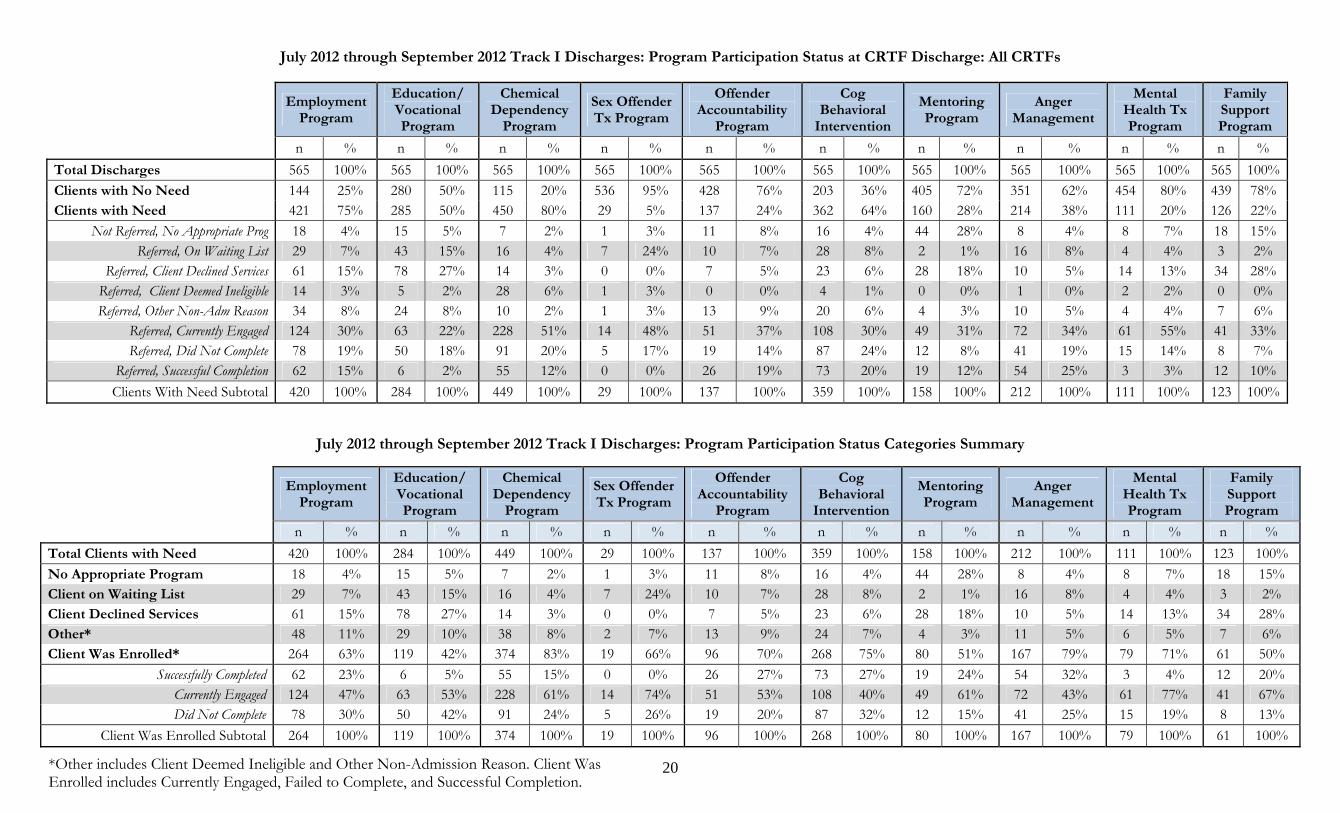
July 2012 through September 2012 Track I Discharges: Program Participation Status at CRTF Discharge: All CRTFs
Employment
Program
Education/ Vocational Program
Chemical Dependency
Program
Sex Offender Tx Program
Offender Accountability
Program
Cog Behavioral
Intervention
Mentoring Program
Anger Management
Mental Health Tx Program
Family Support Program
n % n % n % n % n % n % n % n % n % n % Total Discharges 565 100% 565 100% 565 100% 565 100% 565 100% 565 100% 565 100% 565 100% 565 100% 565 100% Clients with No Need 144 25% 280 50% 115 20% 536 95% 428 76% 203 36% 405 72% 351 62% 454 80% 439 78% Clients with Need 421 75% 285 50% 450 80% 29 5% 137 24% 362 64% 160 28% 214 38% 111 20% 126 22%
Not Referred, No Appropriate Prog 18 4% 15 5% 7 2% 1 3% 11 8% 16 4% 44 28% 8 4% 8 7% 18 15% Referred, On Waiting List 29 7% 43 15% 16 4% 7 24% 10 7% 28 8% 2 1% 16 8% 4 4% 3 2%
Referred, Client Declined Services 61 15% 78 27% 14 3% 0 0% 7 5% 23 6% 28 18% 10 5% 14 13% 34 28% Referred, Client Deemed Ineligible 14 3% 5 2% 28 6% 1 3% 0 0% 4 1% 0 0% 1 0% 2 2% 0 0% Referred, Other Non-Adm Reason 34 8% 24 8% 10 2% 1 3% 13 9% 20 6% 4 3% 10 5% 4 4% 7 6%
Referred, Currently Engaged 124 30% 63 22% 228 51% 14 48% 51 37% 108 30% 49 31% 72 34% 61 55% 41 33% Referred, Did Not Complete 78 19% 50 18% 91 20% 5 17% 19 14% 87 24% 12 8% 41 19% 15 14% 8 7%
Referred, Successful Completion 62 15% 6 2% 55 12% 0 0% 26 19% 73 20% 19 12% 54 25% 3 3% 12 10% Clients With Need Subtotal 420 100% 284 100% 449 100% 29 100% 137 100% 359 100% 158 100% 212 100% 111 100% 123 100%
July 2012 through September 2012 Track I Discharges: Program Participation Status Categories Summary
Employment Program
Education/ Vocational Program
Chemical Dependency
Program
Sex Offender Tx Program
Offender Accountability
Program
Cog Behavioral
Intervention
Mentoring Program
Anger Management
Mental Health Tx Program
Family Support Program
n % n % n % n % n % n % n % n % n % n % Total Clients with Need 420 100% 284 100% 449 100% 29 100% 137 100% 359 100% 158 100% 212 100% 111 100% 123 100% No Appropriate Program 18 4% 15 5% 7 2% 1 3% 11 8% 16 4% 44 28% 8 4% 8 7% 18 15% Client on Waiting List 29 7% 43 15% 16 4% 7 24% 10 7% 28 8% 2 1% 16 8% 4 4% 3 2% Client Declined Services 61 15% 78 27% 14 3% 0 0% 7 5% 23 6% 28 18% 10 5% 14 13% 34 28% Other* 48 11% 29 10% 38 8% 2 7% 13 9% 24 7% 4 3% 11 5% 6 5% 7 6% Client Was Enrolled* 264 63% 119 42% 374 83% 19 66% 96 70% 268 75% 80 51% 167 79% 79 71% 61 50%
Successfully Completed 62 23% 6 5% 55 15% 0 0% 26 27% 73 27% 19 24% 54 32% 3 4% 12 20% Currently Engaged 124 47% 63 53% 228 61% 14 74% 51 53% 108 40% 49 61% 72 43% 61 77% 41 67% Did Not Complete 78 30% 50 42% 91 24% 5 26% 19 20% 87 32% 12 15% 41 25% 15 19% 8 13%
Client Was Enrolled Subtotal 264 100% 119 100% 374 100% 19 100% 96 100% 268 100% 80 100% 167 100% 79 100% 61 100%
*Other includes Client Deemed Ineligible and Other Non-Admission Reason. Client Was Enrolled includes Currently Engaged, Failed to Complete, and Successful Completion.
21
July 2012 through September 2012 Track I Discharges: Employment Status**
County Unemployable Not Employed Employed P/T Employed F/T Total
n % n % n % n % n
Albany 10 16% 11 18% 24 39% 16 26% 61 Broome 3 6% 18 34% 20 38% 12 23% 53 Dutchess 4 31% 7 54% 0 0% 2 15% 13 Erie 1 2% 41 73% 6 11% 8 14% 56 Kings 1 2% 40 71% 7 13% 8 14% 56 Monroe 1 5% 15 71% 4 19% 1 5% 21 Nassau 0 0% 6 40% 7 47% 2 13% 15 Niagara 1 25% 3 75% 0 0% 0 0% 4 Oneida 7 16% 32 74% 2 5% 2 5% 43 Onondaga N/A N/A N/A N/A N/A N/A N/A N/A N/A Orange 0 0% 25 60% 11 26% 6 14% 42 Rensselaer 1 4% 16 64% 0 0% 8 32% 25 Rockland 0 0% 14 93% 0 0% 1 7% 15 Schenectady 9 26% 14 41% 2 6% 9 26% 34 Suffolk* 4 16% 13 52% 4 16% 4 16% 25 Ulster 0 0% 3 30% 5 50% 2 20% 10
New York 2 3% 31 52% 16 27% 11 18% 60
Westchester 6 19% 17 53% 0 0% 9 28% 32
Total 50 9% 306 54% 108 19% 101 18% 565
*Data from Suffolk County is only for July and August 2012. **Employment Status is the highest level of employment obtained during CRTF enrollment.
22
July 2012 through September 2012 Track I Discharges: Days in CRTF
County <45 days 45-89 days 90+ days Total
n % n % n % n
Albany 0 0% 5 8% 56 92% 61 Broome 0 0% 4 8% 49 92% 53 Dutchess 2 15% 3 23% 8 62% 13 Erie 24 43% 17 30% 15 27% 56 Kings 21 38% 11 20% 24 43% 56 Monroe 5 24% 3 14% 13 62% 21 Nassau 0 0% 2 13% 13 87% 15 Niagara 2 50% 0 0% 2 50% 4 Oneida 4 9% 3 7% 36 84% 43 Onondaga N/A N/A N/A N/A N/A N/A N/A Orange 6 14% 17 40% 19 45% 42 Rensselaer 16 64% 7 28% 2 8% 25 Rockland 2 13% 3 20% 10 67% 15
Schenectady 2 6% 3 9% 29 85% 34
Suffolk* 1 4% 6 24% 18 72% 25
Ulster 1 10% 1 10% 8 80% 10
New York 5 8% 38 63% 17 28% 60
Westchester 2 6% 3 9% 27 84% 32
Total 93 16% 126 22% 346 61% 565 *Data from Suffolk County is only for July and August 2012.