Embed Size (px)
Citation preview

County of El Dorado Department of Transportation Diamond Springs Parkway Project Draft EIR
Michael Brandman Associates H:\Client (PN-JN)\1173\11730025\DEIR\11730025 Sec99-00 Appendix Dividers.doc
Appendix C: Air Quality Analysis
Technical Reports

County of El Dorado Department of Transportation Diamond Springs Parkway Project Draft EIR
Michael Brandman Associates H:\Client (PN-JN)\1173\11730025\DEIR\11730025 Sec99-00 Appendix Dividers.doc
C.1 - Air Quality Impact Analysis Report - Parkway, Michael Brandman Associates, November 23, 2009

Air Quality Impact Analysis Report Diamond Springs Parkway Project
El Dorado County, California
Prepared for:
County of El Dorado Department of Transportation 2850 Fairlane Court
Placerville, CA 95667
Contact: Jennifer Maxwell
Prepared by:
Michael Brandman Associates 2444 Main Street, Suite 150
Fresno, CA 93721 559.497.0310
Contact: Elena Nuño, Air Quality Analyst
November 23, 2009

County of El Dorado Department of Transportation Diamond Springs Parkway Project Air Quality Impact Analysis Report Table of Contents
Michael Brandman Associates iii H:\Client (PN-JN)\1173\11730025\AQ\11730025 AQ Report DOT DS Parkway.doc
TABLE OF CONTENTS
Acronyms and Abbreviations .............................................................................................. v Section 1: Introduction and Summary ................................................................................ 1
1.1 - Purpose and Methods of Analysis....................................................................... 1 1.1.1 - Approach to Analysis............................................................................ 1 1.1.2 - Climate Change Analysis ..................................................................... 1
1.2 - Executive Summary ............................................................................................ 2 1.2.1 - Site Location......................................................................................... 2 1.2.2 - Project Description ............................................................................... 5 1.2.3 - Findings/Significance Determination .................................................... 6 1.2.4 - Mitigation Measures ............................................................................. 6
Section 2: Setting.................................................................................................................. 7 2.1 - Regulatory Setting............................................................................................... 7
2.1.1 - Federal and State Regulatory Agencies............................................... 7 2.1.2 - Local Government .............................................................................. 18
2.2 - Pollutants .......................................................................................................... 20 2.2.1 - Carbon Monoxide ............................................................................... 20 2.2.2 - Ozone................................................................................................. 21 2.2.3 - Particulate Matter (PM10 and PM2.5) ................................................... 23 2.2.4 - Other Pollutants of Concern ............................................................... 24 2.2.5 - Greenhouse Gases (GHGs)............................................................... 25
2.3 - Physical Setting................................................................................................. 28 2.3.1 - Climate ............................................................................................... 28 2.3.2 - Regional Sources of Air Pollutants..................................................... 29 2.3.3 - Local Air Quality ................................................................................. 30 2.3.4 - Local Sources of Air Pollutants .......................................................... 31 2.3.5 - Sensitive Receptors ........................................................................... 31 2.3.6 - Alternate Forms of Transportation...................................................... 31
Section 3: Thresholds......................................................................................................... 33 3.1 - Qualitative Significance Criteria ........................................................................ 33
3.1.1 - Land Use Conflicts and Exposure of Sensitive Receptors ................. 33 3.1.2 - Odors.................................................................................................. 34 3.1.3 - Quantitative Significance Criteria ....................................................... 34 3.1.4 - Significance Criteria for Determining Cumulative Impacts ................. 35
Section 4: Impact Analysis................................................................................................. 36 4.1 - Construction (Short-term) Impacts .................................................................... 36
4.1.1 - Construction Dust............................................................................... 38 4.1.2 - Regional Pollutants ............................................................................ 38 4.1.3 - Construction-Generated CO Violation................................................ 40 4.1.4 - Diesel Particulate Matter .................................................................... 41
4.2 - Operational CO Analysis................................................................................... 41 4.3 - Sensitive Receptors .......................................................................................... 43 4.4 - Odor Impacts..................................................................................................... 43 4.5 - Contribution to Climate Change Analysis.......................................................... 44
4.5.1 - Project Inventory of Greenhouse Gas Emissions............................... 44 4.5.2 - Onsite Greenhouse Gas Reduction Options ...................................... 45

County of El Dorado Department of Transportation Diamond Springs Parkway Project Air Quality Impact Analysis Report Table of Contents
Michael Brandman Associates iv H:\Client (PN-JN)\1173\11730025\AQ\11730025 AQ Report DOT DS Parkway.doc
4.5.3 - Summary of Impacts .......................................................................... 47 4.6 - Consistency Analysis with the Air Quality Management Plan ........................... 49
4.6.1 - Project’s Contribution to Air Quality Violations ................................... 49 4.6.2 - AQMP Assumptions ........................................................................... 49 4.6.3 - Control Measures ............................................................................... 49 4.6.4 - Overall Compliance with the AQMP ................................................... 50
4.7 - Cumulative Impacts........................................................................................... 50 Section 5: References......................................................................................................... 52
Appendix A: Road Construction Model Output Appendix B: CO Modeling Output
LIST OF TABLES
Table 1: Ambient Air Quality Standards .................................................................................. 8 Table 2: AB 32 Necessary Reductions ................................................................................. 10 Table 3: Attainment Status.................................................................................................... 16 Table 4: Global Warming Potentials and Atmospheric Lifetimes of Select Greenhouse
Gases ..................................................................................................................... 26 Table 5: El Dorado County Almanac Emissions Projection Data.......................................... 29 Table 6: Air Quality Monitoring Summary ............................................................................. 30 Table 7: Ozone Precursor Significance Thresholds.............................................................. 34 Table 8: Phase One Construction Emissions - Unmitigated (maximum lbs per day)............ 39 Table 9: Phase Two Construction Emissions - Unmitigated (maximum lbs per day)............ 39 Table 10: Carbon Monoxide Concentration and Significance Determination........................ 40 Table 11: CO Concentrations................................................................................................ 42 Table 12: Construction Exhaust CO2 Emissions (Unmitigated) ............................................ 45 Table 13: Pre-Mitigation Project Consistency and Feasibility Analysis with Applicable
Attorney General, OPR, CARB GHG Reduction Measures ................................... 46 Table 14: Post-Mitigation Project Consistency and Feasibility Analysis with Applicable
Attorney General, OPR, CARB GHG Reduction Measures ................................... 48
LIST OF EXHIBITS
Exhibit 1: Regional Vicinity Map.............................................................................................. 3 Exhibit 2: Project Aerial Map ................................................................................................... 4 Exhibit 3: Sacramento Federal Ozone Nonattainment Area ................................................. 15

County of El Dorado Department of Transportation Diamond Springs Parkway Project Air Quality Impact Analysis Report Acronyms and Abbreviations
Michael Brandman Associates v H:\Client (PN-JN)\1173\11730025\AQ\11730025 AQ Report DOT DS Parkway.doc
ACRONYMS AND ABBREVIATIONS
µg micrograms
AASHTO American Association of State Highway and Transportation Officials
AB Assembly Bill
ACM Asbestos Containing Material
ADT average daily trips
AQMP Air Quality Management Plan
BAU business as usual
CAA Federal Clean Air Act
CAAQS California Ambient Air Quality Standards
CARB California Air Resources Board
CAT Climate Action Team
CCAA California Clean Air Act
CEQA California Environmental Quality Act
CIP Capitol Improvement Program
CO carbon monoxide
DOT El Dorado County Department of Transportation
DPM diesel particulate matter
EDAQMD El Dorado County Air Quality Management District
EPA Environmental Protection Agency
LOS Level of Service
MC&FP Missouri Flat Corridor and Funding Plan
MCAB Mountain Counties Air Basin
NAAQS National Ambient Air Quality Standards
NESHAPs National Emission Standards for Hazardous Air Pollutants

County of El Dorado Department of Transportation Diamond Springs Parkway Project Air Quality Impact Analysis Report Acronyms and Abbreviations
Michael Brandman Associates vi H:\Client (PN-JN)\1173\11730025\AQ\11730025 AQ Report DOT DS Parkway.doc
NOx Oxides of Nitrogen
OPR California Governor’s Office of Planning and Research
PM Particulate Matter
ppm parts per million
RFP Reasonable Further Progress Plan
ROG reactive organic gases
RTP Regional Transportation Plans
SACOG Sacramento Area Council of Governments
SB Senate Bill
SFONA Sacramento Federal Ozone Nonattainment Area
SIP State Implementation Plans
TAC toxic air contaminant
TIA Traffic Impact Analysis
TIM Traffic Impact Mitigation
TIS traffic impact study
VMT vehicle miles traveled

County of El Dorado Department of Transportation Diamond Springs Parkway Project Air Quality Impact Analysis Report Introduction and Summary
Michael Brandman Associates 1 H:\Client (PN-JN)\1173\11730025\AQ\11730025 AQ Report DOT DS Parkway.doc
SECTION 1: INTRODUCTION AND SUMMARY
1.1 - Purpose and Methods of Analysis
This Air Quality Impact Analysis was prepared to evaluate whether the expected air pollutant emissions generated as a result of the Diamond Springs Parkway Project (Parkway, or project) would cause significant impacts to air resources or sensitive receptors in the project area. This analysis was conducted within the context of the California Environmental Quality Act (CEQA, California Public Resources Code Sections 21000, et seq.). The methodology follows the Guide to Air Quality Assessment - Determining Significance of Air Quality Impacts Under the California Environmental Quality Act (Guide) prepared by the El Dorado County Air Quality Management District (EDAQMD) to facilitate the evaluation and review of air quality impacts for projects under CEQA.
1.1.1 - Approach to Analysis
EDAQMD’s Guide distinguishes between short-term and long-term impacts of projects. Short-term impacts occur during site grading and project construction. Long-term air quality impacts occur once a project is operational. Air quality impacts can be qualitatively or quantitatively determined.
The project would construct a new roadway facility; hence, the project itself would not generate new operational emissions in the form of new traffic, but would result in modified traffic patterns in the general project area. This Air Quality Analysis examines short-term impacts related to the construction of the roadway. The project’s potential contribution to carbon monoxide exceedances is also analyzed in this report. In general, the long-term impacts related to operational emissions of the project have been analyzed in the Regional Transportation Plan Program Environmental Impact Report (EIR).
1.1.2 - Climate Change Analysis
Although not currently listed as an air quality impact in the CEQA Guidelines Appendix G, the potential effect of a project’s greenhouse gas (GHG) emissions on climate change is an emerging issue that warrants discussion under CEQA.
In 2006, Governor Arnold Schwarzenegger signed Assembly Bill (AB) 32, which charged the California Air Resources Board (CARB) with developing regulations on how the State would address climate change (also known as “global warming”). This Air Quality Analysis includes a CEQA-level climate change discussion, a threshold of significance, and an evaluation of the potential impact of the proposed project based on the intent of AB 32.

County of El Dorado Department of Transportation Diamond Springs Parkway Project Air Quality Impact Analysis Report Introduction and Summary
Michael Brandman Associates 2 H:\Client (PN-JN)\1173\11730025\AQ\11730025 AQ Report DOT DS Parkway.doc
1.2 - Executive Summary
1.2.1 - Site Location The project is located within unincorporated El Dorado County, California, south of the Missouri Flat Road/Highway 50 (US-50) Interchange, west of the City of Placerville, and north of the town of Diamond Springs (see Exhibit 1). As illustrated in Exhibit 2, the principle roadway network in the project vicinity includes Missouri Flat Road, Pleasant Valley Road (east-west portion of State Route 49 [SR-49]), Diamond Road/SR-49 (north-south portion of SR-49), Lime Kiln Road, and China Garden Road. Land uses within the project area are designated industrial and commercial according to the County’s General Plan Land Use Map (El Dorado County 2004). Actual uses along the proposed alignment are highly variable and include pockets of residential development, various manufacturing and storage areas, and vacant industrial lots.


County of El Dorado Department of Transportation Diamond Springs Parkway Project Air Quality Impact Analysis Report Introduction and Summary
Michael Brandman Associates 5 H:\Client (PN-JN)\1173\11730025\AQ\11730025 AQ Report DOT DS Parkway.doc
1.2.2 - Project Description The El Dorado County Department of Transportation (DOT) proposes the construction of the Diamond Springs Parkway (Parkway, or project) to improve traffic circulation along the Pleasant Valley Road and Missouri Flat Road corridors, in the vicinity of Diamond Springs. The County General Plan Circulation Map (El Dorado County 2004) identifies this project as a planned roadway. The project is part of DOT’s 2009 Capital Improvement Plan (CIP), which includes the County’s Traffic Impact Mitigation (TIM) Fee Program. The proposed project was programmatically evaluated in the Missouri Flat Corridor and Funding Plan (MC&FP) EIR (EDAW 1998), which referred to the project as the Missouri Flat Road/Pleasant Valley Connector (Interconnector). The MC&FP EIR included a discussion of the need for roadway projects within the MC&FP area, with the project representing one of the necessary components of the proposed roadway system. Since the preparation of the MC&FP EIR, the Parkway alignment has shifted at several locations in response to the planned El Dorado Multi-Use Trail and to avoid natural resources (e.g., wetlands). Further, the original Connector project did not analyze the improvements to SR-49/Diamond Road, which are required to mitigate project-related impacts to traffic circulation in the study area.
The Diamond Springs Parkway is identified in the County’s General Plan Circulation Element Table TC-1 and Circulation Map from Missouri Flat Road to SR-49 as a future four-lane, divided roadway, and it is included in the County’s 2009 CIP and TIM Fee Program as described above. The proposed Parkway would extend eastward from Missouri Flat Road near its intersection with the Sacramento-Placerville Transportation Corridor, north of China Garden Road, and would connect to Diamond Road (SR-49). Construction of the Parkway would also require minor improvements and/or realignment of China Garden Road, Throwita Way, Truck Street, Bradley Drive, and Old Depot Road. A new Truck Street/Bradley Drive Connector would be constructed approximately west of Diamond Road (SR-49) to enhance circulation within the project area.
The Parkway would provide fully controlled access at three new signalized intersections with limited private property access and public road approaches. The Parkway would have a design speed of 50 miles per hour (mph), and the proposed lane configurations would reflect the ultimate roadway design contemplated in the County’s General Plan. The Parkway would be constructed according to American Association of State Highway and Transportation Officials (AASHTO) Policy on Geometric Design of Highway and Streets (2004).
The General Plan also includes the Parkway from SR-49 to Pleasant Valley Road as an ultimate four-lane major highway. Under the proposed project, SR-49 would be improved to a major highway, in accordance with Caltrans’s Highway Design Manual, 6th Edition, with nearly all existing driveway encroachments eliminated. The improvements would be accomplished by creating a new frontage road along the existing roadway and widening the roadway to the west. A new median would be included to provide sufficient separation between the frontage road and SR-49. The SR-49

County of El Dorado Department of Transportation Diamond Springs Parkway Project Air Quality Impact Analysis Report Introduction and Summary
Michael Brandman Associates 6 H:\Client (PN-JN)\1173\11730025\AQ\11730025 AQ Report DOT DS Parkway.doc
improvements would require minor improvements and/or realignment of Black Rice Road, Happy Lane, and Lime Kiln Road.
1.2.3 - Findings/Significance Determination
The analysis concludes that the project does not exceed EDAQMD thresholds of significance for ROG or NOx during construction of the proposed project. EDAQMD’s CEQA Guide states that if the estimated ROG and NOx emissions are less than EDAQMD’s thresholds, then exhaust emissions of CO and PM10 may also deemed less than significant. Therefore, project impacts would be less than significant for construction exhaust emissions of ROG and NOx, as well as CO and PM10. The analysis supports the following findings:
• The project will not conflict with or obstruct implementation of the 1994 Sacramento Region Clean Air Plan.
• The project will not exceed EDAQMD’s localized significance thresholds.
• The construction emissions from the project will not exceed EDAQMD’s regional significance thresholds.
• The project will not expose sensitive receptors to substantial air pollution concentrations.
• The project will not create objectionable odors that affect sensitive receptors near the Project area.
• The project will not significantly hinder or delay California’s ability to meet the reduction targets contained in AB 32.
• The Project will not result in significant cumulative air quality impacts
1.2.4 - Mitigation Measures The following mitigation measures are considered feasible, practical, and effective, and would be implemented to reduce greenhouse gas (GHG) emissions from the proposed project:
MM AIR-1 Any traffic lights installed or replaced as part of this project shall use Light Emitting Diodes (LEDs).
MM AIR-2 Prior to commencement of construction, the project construction contractor(s) shall have in place a County-approved Solid Waste Diversion and Recycling Plan (or such other documentation to the satisfaction of the County) that demonstrates the diversion and recycling of salvageable and re-useable wood, metal, plastic and paper products during project construction. The Solid Waste Diversion and Recycling Plan shall be in compliance with County Ordinance Chapter 8.43—Construction and Demolition Debris Recycling Within the County of El Dorado. This requirement shall be included in the construction/specification bid documents for the project.

County of El Dorado Department of Transportation Diamond Springs Parkway Project Air Quality Impact Analysis Report Setting
Michael Brandman Associates 7 H:\Client (PN-JN)\1173\11730025\AQ\11730025 AQ Report DOT DS Parkway.doc
SECTION 2: SETTING
2.1 - Regulatory Setting
Air pollutants are regulated at the national, state, and air basin level; each agency has a different degree of control. The United States Environmental Protection Agency (EPA) regulates at the national level. The CARB regulates at the state level. The EDAQMD regulates at the air basin level, maintaining ambient air monitoring sites, and regulating stationary sources and indirect sources.
2.1.1 - Federal and State Regulatory Agencies The EPA handles global, international, national, and interstate air pollution issues and policies. The EPA sets national vehicle and stationary source emission standards, oversees approval of all State Implementation Plans (SIPs), and provides research and guidance in air pollution programs, and sets National Ambient Air Quality Standards (NAAQS), also known as federal standards. There are NAAQS for six common air pollutants, called criteria air pollutants, which were identified resulting from provisions of the Clean Air Act of 1970 (CAA). The six criteria pollutants are:
• Ozone • Particulate matter (PM10 and PM2.5) • Nitrogen dioxide • Carbon monoxide (CO) • Lead • Sulfur dioxide
The NAAQS were set to protect public health, including that of sensitive individuals; thus, the standards continue to change as more medical research is available regarding the health effects of the criteria pollutants.
The SIP for the State of California is administered by CARB, which has overall responsibility for statewide air quality maintenance and air pollution prevention. An SIP is a document prepared by each state describing existing air quality conditions and measures that will be followed to attain and maintain NAAQS. The SIP incorporates the individual plans for regional air districts. Regional air quality attainment plans (AQPs) prepared by individual regional air districts are sent to the CARB to be approved and incorporated into the California SIP. SIPs include the technical foundation for understanding the air quality (e.g., emission inventories and air quality monitoring), control measures and strategies, and enforcement mechanisms. The CARB also administers California Ambient Air Quality Standards (CAAQS) for the 10 air pollutants designated in the California Clean Air Act (CCAA). The 10 state air pollutants are the six national criteria pollutants plus:

County of El Dorado Department of Transportation Diamond Springs Parkway Project Air Quality Impact Analysis Report Setting
Michael Brandman Associates 8 H:\Client (PN-JN)\1173\11730025\AQ\11730025 AQ Report DOT DS Parkway.doc
• Visibility reducing particulates • Hydrogen sulfide (H2S) • Sulfates • Vinyl chloride
The federal and state ambient air quality standards and the most relevant effects are summarized in Table 1.
Table 1: Ambient Air Quality Standards
Air Pollutant Averaging
Time California Standard
National Standard Most Relevant Effects
1-hour 0.09 ppm — Ozone
8-hour 0.070 ppm 0.075** ppm
(a) Decrease of pulmonary function and localized lung edema in humans and animals;
(b) risk to public health implied by alterations in pulmonary morphology and host defense in animals;
(c) increased mortality risk; (d) risk to public health implied by altered
connective tissue metabolism and altered pulmonary morphology in animals after long-term exposures and pulmonary function decrements in chronically exposed humans;
(e) vegetation damage; (f) property damage.
1-hour 20 ppm 35 ppm Carbon Monoxide (CO) 8-hour 9.0 ppm 9 ppm
(a) Aggravation of angina pectoris (chest pain or discomfort) and other aspects of coronary heart disease;
(b) decreased exercise tolerance in persons with peripheral vascular disease and lung disease;
(c) impairment of central nervous system functions;
(d) possible increased risk to fetuses.
1-hour 0.18 ppm — Nitrogen Dioxide (NO2) Mean 0.030 ppm 0.053 ppm
(a) Potential to aggravate chronic respiratory disease and respiratory symptoms in sensitive groups;
(b) risk to public health implied by pulmonary and extra-pulmonary biochemical and cellular changes and pulmonary structural changes;
(c) contribution to atmospheric discoloration.
1-hour 0.25 ppm —
24-hour 0.04 ppm 0.14 ppm
Sulfur Dioxide (SO2)
Mean — 0.030 ppm
Bronchoconstriction accompanied by symptoms which may include wheezing, shortness of breath and chest tightness, during exercise or physical activity in persons with asthma.

County of El Dorado Department of Transportation Diamond Springs Parkway Project Air Quality Impact Analysis Report Setting
Michael Brandman Associates 9 H:\Client (PN-JN)\1173\11730025\AQ\11730025 AQ Report DOT DS Parkway.doc
Table 1 (cont.): Ambient Air Quality Standards
Air Pollutant Averaging
Time California Standard
National Standard Most Relevant Effects
24 hour 50 µg/m3 150 µg/m3 Particulate Matter (PM10) Mean 20 µg/m3 —
24-hour — 35 µg/m3 Particulate Matter (PM2.5)(*) Mean 12 µg/m3 15 µg/m3
(a) Exacerbation of symptoms in sensitive patients with respiratory or cardiovascular disease;
(b) declines in pulmonary function growth in children;
(c) increased risk of premature death from heart or lung diseases in the elderly.
Sulfates 24-hour 25 µg/m3 — (a) Decrease in ventilatory function; (b) aggravation of asthmatic symptoms; (c) aggravation of cardio-pulmonary
disease; (d) vegetation damage; (e) Degradation of visibility; (f) property
damage.
30-day 1.5 µg/m3 — (a) Learning disabilities; (b) impairment of blood formation and
nerve conduction.
Lead
Quarter — 1.5 µg/m3
Notes: ppm = parts per million (concentration) µg/m3 = micrograms per cubic meter Mean = Annual Arithmetic Mean 30-day = 30-day average Quarter = calendar quarter * In 2006, EPA tightened the 24-hour PM2.5 standard from 65 µg/m3 to 35 µg/m3 and retained the existing annual
standard of 15 µg/m3. ** The EPA promulgated a new 8-hour standard for ozone on March 12, 2008, effective March 27, 2008. Source: CARB 2007b.
Toxic Air Contaminant Regulations
The CARB’s Toxic Air Contaminant (TAC) program traces its beginning to the criteria pollutant program in the 1960s. For many years, the criteria pollutant control program has been effective at reducing TACs, since many reactive organic gases (ROG) and PM constituents are also TACs. During the 1980s, the public’s concern over toxic chemicals heightened. As a result, citizens demanded protection and control over the release of toxic chemicals into the air. In response to public concerns, the California legislature enacted the Toxic Air Contaminant Identification and Control Act (AB 1807, Tanner 1983) governing the release of TACs into the air. This law charges the CARB with the responsibility for identifying substances as TACs, setting priorities for control, adopting control strategies, and promoting alternative processes. The CARB has designated almost 200 compounds as TACs. Additionally, the CARB has implemented control strategies for a number of compounds that pose high health risk and show potential for effective control.

County of El Dorado Department of Transportation Diamond Springs Parkway Project Air Quality Impact Analysis Report Setting
Michael Brandman Associates 10 H:\Client (PN-JN)\1173\11730025\AQ\11730025 AQ Report DOT DS Parkway.doc
Climate Change
The State of California has enacted key legislation in an effort to reduce its contribution to climate change, as discussed below.
On June 1, 2005, the Governor issued Executive Order S 3-05 which set the following greenhouse gas emission reduction targets:
• By 2010, reduce greenhouse gas emissions to 2000 levels; • By 2020, reduce greenhouse gas emissions to 1990 levels; • By 2050, reduce greenhouse gas emissions to 80 percent below 1990 levels.
To meet these targets, the Climate Action Team (CAT) prepared a 2006 report to the Governor that contains recommendations and strategies to help ensure the targets in Executive Order S-3-05 are met (2006 CAT Report).
In 2006, the California State Legislature enacted AB 32, the California Global Warming Solutions Act of 2006. AB 32 focuses on reducing greenhouse gas emissions in California. Greenhouse gases, as defined under AB 32, include carbon dioxide, methane, nitrous oxide, hydrofluorocarbons, perfluorocarbons, and sulfur hexafluoride. AB 32 requires that greenhouse gases emitted in California be reduced to 1990 levels by the year 2020. Under AB 32, CARB is the state agency charged with monitoring and regulating sources of emissions of greenhouse gases that cause global warming in order to reduce emissions of greenhouse gases. CARB approved a 1990 greenhouse gas emissions level of 427 million metric tons of carbon dioxide equivalent (MMTCO2e), on December 6, 2007. Therefore, in 2020, emissions in California are required to be at or below 427 MMTCO2e.
Under the current BAU scenario, statewide emissions are increasing at a rate of approximately 1 percent per year, as noted in Table 2. Also shown are the average reductions needed from all statewide sources (including all existing sources) to reduce greenhouse gas emissions back to 1990 levels.
Table 2: AB 32 Necessary Reductions
Year BAU Emissions Projection Necessary Reductions
1990 427 MMTCO2e None*
2004 480 MMTCO2e 11% reduction
2008 495 MMTCO2e 14% reduction
2020 600 MMTCO2e 29% reduction
Notes: *Year 1990 emissions are the target baseline.

County of El Dorado Department of Transportation Diamond Springs Parkway Project Air Quality Impact Analysis Report Setting
Michael Brandman Associates 11 H:\Client (PN-JN)\1173\11730025\AQ\11730025 AQ Report DOT DS Parkway.doc
Under AB 32, CARB published its Final Expanded List of Early Action Measures to Reduce Greenhouse Gas Emissions in California in October 2007. Discrete Early Action Measures are currently underway or are enforceable by January 1, 2010. Early Action Measures are regulatory or non-regulatory measure that are currently underway or to be initiated by the CARB in the 2007 to 2012 timeframe. CARB has 44 early action measures that apply to the transportation, commercial, forestry, agriculture, cement, oil and gas, fire suppression, fuels, education, energy efficiency, electricity, and waste sectors. Of those 44 early action measures, nine are considered discrete Early Action Measures, as they are regulatory and enforceable by January 1, 2010. CARB estimates that the 44 recommendations are expected to result in reductions of at least 42 MMTCO2e by 2020, representing approximately 25 percent of the 2020 target.
The CARB released a Proposed Climate Change Scoping Plan on October 15, 2008, and it was approved by the Board at the Board hearing on December 12, 2008. The scoping plan contains the main strategies California will use to reduce the greenhouse gases (GHG) that cause climate change. The scoping plan has a range of GHG reduction actions which include direct regulations, alternative compliance mechanisms, monetary and non-monetary incentives, voluntary actions, market-based mechanisms such as a cap-and-trade system, and an AB 32 cost of implementation fee regulation to fund the program.
SB 97 was passed in August 2007. SB 97 requires that before July 1, 2009, the Governor’s Office of Planning and Research (OPR) prepare, develop, and transmit guidelines to the Resources Agency for the mitigation of the effects of greenhouse gas emissions. SB 97 also requires that, before January 1, 2010, the Resources Agency certify and adopt guidelines prepared and developed by the OPR.
On April 13, 2009, the Governor's Office of Planning and Research (OPR) submitted to the California Secretary for Natural Resources proposed amendments to the CEQA Guidelines for greenhouse gas (GHG) emissions. The proposed amendments seek to address GHG emissions on a small and large scale. Pursuant to SB 97, the Resources Agency must certify and adopt the GHG guidelines on or before January 1, 2010 in a formal rulemaking procedure. After the new Guidelines are adopted, they will affect how lead and responsible agencies analyze proposed development in California.
OPR proposes adding a new section, CEQA Guidelines § 15064.4, to assist agencies in determining the significance of GHG emissions. As proposed, the new Guideline section would allow agencies the discretion to determine whether a quantitative or qualitative analysis is best for a particular project. Importantly, however, little guidance is offered on the crucial next step in this assessment process – how to determine whether a project's estimated GHG emissions are significant or cumulatively considerable. OPR suggests that a lead agency may consider the following when assessing the significance of impacts from greenhouse gas emissions on the environment:

County of El Dorado Department of Transportation Diamond Springs Parkway Project Air Quality Impact Analysis Report Setting
Michael Brandman Associates 12 H:\Client (PN-JN)\1173\11730025\AQ\11730025 AQ Report DOT DS Parkway.doc
(1) The extent to which the project may increase or reduce greenhouse gas emissions as compared to the existing environmental setting;
(2) Whether the project emissions exceed a threshold of significance that the lead agency determines applies to the project.
(3) The extent to which the project complies with regulations or requirements adopted to implement a statewide, regional, or local plan for the reduction or mitigation of greenhouse gas emissions. Such regulations or requirements must be adopted by the relevant public agency through a public review process and must include specific requirements that reduce or mitigate the project’s incremental contribution of greenhouse gas emissions. If there is substantial evidence that the possible effects of a particular project are still cumulatively considerable notwithstanding compliance with the adopted regulations or requirements, an EIR must be prepared for the project.
The proposed guidelines also amend CEQA Guidelines §15126.4 and § 15130, which address mitigation measures and cumulative impacts, respectively. In the proposed revision, GHG mitigation measures are referenced in general terms, but no specific measures are championed by OPR. The proposed revision to the cumulative impact discussion requirement (§ 15130) simply directs agencies to analyze GHG emissions in an EIR when a project's incremental contribution of emissions may be cumulatively considerable; however it does not answer the question of when emissions are cumulatively considerable.
OPR also proposes a Guideline section that would encourage agencies to tier and streamline the GHG emissions analysis in certain cases. Section 15183.5 permits programmatic GHG analysis and later project–specific tiering, as well as the preparation of GHG Reduction Plans. Compliance with such plans can support a determination that a project's cumulative effect is not cumulatively considerable, according to proposed § 15183.5(b).
In addition, the amendments propose revisions to Appendix F of the CEQA Guidelines, which focuses on Energy Conservation, and Appendix G, which includes the sample Environmental Checklist Form. OPR would amend the Checklist to include the following questions: Would the project generate GHG emissions, either directly or indirectly, that may have a significant impact on the environment? And, would the project conflict with any applicable plan, policy or regulation of an agency adopted for the purpose of reducing the emissions of GHG?
In the interim of having the proposed CEQA amendments adopted, OPR published “CEQA and Climate Change: Addressing Climate Change through California Environmental Quality Act (CEQA) Review,” a technical advisory which offers informal guidance regarding the steps lead agencies should take to address climate change in their CEQA documents (OPR 2008). The advisory indicates that each public agency needs to develop its own approach for climate change analyses. The steps for the analysis include the following: identify and quantify greenhouse gas emissions; assess the

County of El Dorado Department of Transportation Diamond Springs Parkway Project Air Quality Impact Analysis Report Setting
Michael Brandman Associates 13 H:\Client (PN-JN)\1173\11730025\AQ\11730025 AQ Report DOT DS Parkway.doc
significance of impact; and identify alternatives and/or mitigation measures to reduce the impacts. The advisory does not specify thresholds or approaches for the analysis. This climate change analysis for the project follows the guidance presented in the OPR’s advisory.
On January 8, 2008, the California Air Pollution Control Officers Association (CAPCOA) released “CEQA & Climate Change: Evaluating and Addressing Greenhouse Gas Emissions from Projects Subject to the California Environmental Quality Act,” a paper to provide a common platform of information and tools for public agencies. The paper contains a disclaimer that it is not a guidance document but a resource to enable local decision makers to make the best decisions they can in the face of incomplete information during a period of change. The paper indicates that it is an interim resource and does not endorse any particular approach. It discusses three groups of potential thresholds, including a no significance threshold, a threshold of zero, and a non-zero threshold (CAPCOA 2008). The non-zero quantitative thresholds identified in the paper range from 900 to 50,000 metric tons per year.
El Dorado County Air Quality Management District
The air pollution control agency for the whole of El Dorado County is the EDAQMD. The Mountain Counties Air Basin (MCAB) portion of El Dorado County lies within the area designated by the EPA as the Sacramento Federal Ozone Nonattainment Area (SFONA), comprised of Sacramento and Yolo counties, and parts of El Dorado, Solano, Placer, and Sutter counties (see Exhibit 3).
The EDAQMD is the local agency with primary responsibility for compliance with both the federal and state standards and for ensuring that air quality conditions are maintained. The EDAQMD accomplishes its responsibility through a comprehensive program of planning, regulation, enforcement, and promotion of air quality issues.
The clean air strategy of the EDAQMD includes the preparation of plans for the attainment of ambient air quality standards, adoption and enforcement of rules and regulations concerning sources of air pollution, issuance of permits for stationary sources of air pollution, inspection of stationary sources of air pollution and response to citizen complaints, monitoring of ambient air quality and meteorological conditions, and implementation of programs and regulations required by the CAA and CCAA.
The EDAQMD has adopted rules and regulations as a means of implementing the air quality plan for El Dorado County. The EDAQMD has also prepared the Guide to Air Quality Assessment: Determining Significance of Air Quality Impacts (Guide) under the California Environmental Quality Act, which provides quantitative emission thresholds and established protocols for the analysis of air quality impacts from projects and plans. The Guide outlines quantitative and qualitative significance criteria, methodologies for the estimation of construction and operational emissions and mitigation measures to reduce significant impacts.

County of El Dorado Department of Transportation Diamond Springs Parkway Project Air Quality Impact Analysis Report Setting
Michael Brandman Associates 14 H:\Client (PN-JN)\1173\11730025\AQ\11730025 AQ Report DOT DS Parkway.doc
Attainment Status and Current Air Quality Plans
Three terms are used to describe if an air basin is exceeding or meeting federal and state standards: Attainment, Nonattainment, and Unclassified. Air basins are assessed for each applicable standard, and they receive a designation for each standard based on that assessment. If an ambient air quality standard is exceeded, the air basin is designated as “nonattainment” for that standard. An air basin is designated as an “attainment” area for standards that are met. If there is inadequate or inconclusive data to make a definitive attainment designation for an air quality standard, the air basin is considered


County of El Dorado Department of Transportation Diamond Springs Parkway Project Air Quality Impact Analysis Report Setting
Michael Brandman Associates 16 H:\Client (PN-JN)\1173\11730025\AQ\11730025 AQ Report DOT DS Parkway.doc
“unclassified.” The current attainment designations for the project area are shown in Table 3.
Federal nonattainment areas are further divided into classifications—severe, serious, or moderate—as a function of deviation from standards. As of June 15, 2005, the EPA revoked the 1-hour ozone standard in all areas except the 8-hour ozone nonattainment Early Action Compact (EAC) Areas. Therefore, the federal 1-hour ozone standard is only applicable to certain areas. The EDAQMD is not listed as an EAC area; therefore, the federal 1-hour ozone standard does not apply to the project area. However, the EDAQMD is still subject to anti-backsliding requirements such as continuation of 1-hour ozone control strategies
Table 3: Attainment Status
Pollutant State Federal
Ozone Nonattainment Nonattainment
Carbon monoxide Unclassified Attainment
Nitrogen dioxide Attainment Unclassified/Attainment
Sulfur dioxide Attainment Unclassified
PM10 Nonattainment Unclassified
PM2.5 Unclassified Unclassified/Attainment
Lead Attainment Attainment
Sulfates Attainment
Hydrogen sulfide Unclassified
Vinyl chloride (No Information Available)
Visibility-reducing particles Unclassified
NA
Notes: NA = No Standard. Source: CARB 2006a; EPA 2008.
As described above under Federal and State Regulatory Agencies, an SIP is a federal requirement: each state prepares an SIP to describe existing air quality conditions and measures that will be followed to attain and maintain the NAAQS. In addition, state ozone standards have planning requirements. However, state PM10 standards have no attainment planning requirements, but air districts must demonstrate that all measures feasible for the area have been adopted.
In response to the complex factors that contribute to the regional ozone problem, the air districts that govern in the region jointly developed and approved a plan for achieving attainment. The EDAQMD is responsible for participating in the development, updating, and implementation of the Air Quality Management Plan (AQMP) for the SFONA.

County of El Dorado Department of Transportation Diamond Springs Parkway Project Air Quality Impact Analysis Report Setting
Michael Brandman Associates 17 H:\Client (PN-JN)\1173\11730025\AQ\11730025 AQ Report DOT DS Parkway.doc
Current Air Quality Plans
Each air district that is designated nonattainment for a federal standard prepares an attainment plan that describes the air quality conditions and measures that will be enacted to attain and maintain the federal standard, which is incorporated into the SIP. Ozone is a regional pollutant. For the federal ozone standard, the EPA has identified Sacramento and Yolo counties, and parts of El Dorado, Solano, Placer, and Sutter counties as the Sacramento Federal Ozone Nonattainment Area, also called the Sacramento Region (see Exhibit 2). The air districts in the Sacramento Region cooperatively developed a federal ozone attainment plan, as discussed below.
Federal Air Quality Attainment Plans
The federal attainment plan for the Sacramento Region is the 1994 Sacramento Area Regional Ozone Attainment Plan, also called the Sacramento Regional Clean Air Plan. The air districts of the Sacramento Region adopted a Rate of Progress Plan for the federal 8-hour ozone standard in 2006.
In addition, the districts adopted the 2011 Reasonable Further Progress Plan (RFP) for the 8-hour federal ozone standard in April 2008. The RFP shows that the Sacramento Region cannot meet the 2013 attainment deadline, which is the basis for the voluntary federal reclassification request discussed further below.
A draft 8-hour Attainment Demonstration Plan was released for public comment in September 2008. It is expected that the draft plan will go to the air districts’ respective boards of directors for adoption in early 2009.
Voluntary Federal Reclassification Request
On February 14, 2008, the five air districts that constitute the Sacramento Region requested ARB to submit a formal request to EPA to reclassify the area from “serious” to “severe” nonattainment for the federal 8-hour ozone standard, with an associated attainment deadline of June 15, 2019. The request is based on an evaluation of the emission reductions necessary to attain the federal standard, and the emission reductions associated with feasible rules. It was determined that the Sacramento Region would not be able to achieve the necessary emission reduction in the existing attainment timeframe through the existing suite of feasible rules.
State Air Quality Attainment Plans
The CCAA does not contain planning requirements for areas in nonattainment of the state PM10 standards, but air districts must demonstrate to the CARB that all feasible measures for their district have been adopted.
However, state ozone standards do have planning requirements. The CCAA requires air districts that are nonattainment of the state ozone standards to adopt air quality attainment plans and to review and revise their plans to address deficiencies in interim measures of progress once every 3 years.

County of El Dorado Department of Transportation Diamond Springs Parkway Project Air Quality Impact Analysis Report Setting
Michael Brandman Associates 18 H:\Client (PN-JN)\1173\11730025\AQ\11730025 AQ Report DOT DS Parkway.doc
District Rules Applicable to the Project
As discussed above, the AQMP for the SFONA establishes a program of rules and regulations administered by the EDAQMD in El Dorado County to obtain attainment of the national air quality standards. The rules and regulations that apply to this project include but are not limited to the following:
• EDAQMD Rule 224 governs the sale and use of asphalt and limits the VOC content in asphalt.
• EDAQMD Rule 223-1 governs the amount of particulate matter entrained in the ambient air as a result of anthropogenic (man-made) fugitive dust sources by requiring actions to prevent, reduce, or mitigate fugitive dust emissions, and it applies to any construction or construction-related activities, including, but not limited to, land clearing, grubbing, scraping, travel onsite, and travel on access roads. This rule also applies to all sites where carryout or trackout has occurred or may occur on paved public roads or the paved shoulders of a paved public road.
• EDAQMD Rule 300 applies to open burning. The burning of unsalable wood waste from trees, vines, and bushes on property being developed for commercial or residential purposes is allowed to burn as long as there is compliance with provisions in the rule regarding minimum drying time, no-burn days, smoke management, and obtaining a burning permit.
2.1.2 - Local Government The local government with jurisdiction of the project area is El Dorado County. The goals, policies, and implementation programs from the 2004 General Plan are considered in this analysis. The General Plan is intended to guide land use and development decisions in the future to achieve the County’s vision for the future. The following policies are included in El Dorado County’s General Plan to reduce cumulative air impacts, air quality plan conflicts, exposure of sensitive receptors to pollutants, and exposure to odors.
Policy 2.2.5.2.1 Requires development projects to be designed and located in a manner that avoids adjacent incompatible land uses.
Policy 6.4.1.1 Enhances naturally occurring asbestos and dust protection standards.
Policy 6.7.7.1 Requires the County AQMD to use the most recent version of the Guide to Air Quality Assessment.
Policy 6.7.6.2 Requires new projects with sensitive receptors to be sited away from significant sources of air pollution.
Additional General Plan policies related to water conservation and biological resource conservation have a resultant effect on reducing air quality impacts. Water conservation affects air quality through the reduction in air pollutant emissions generated by the transport and treatment of water, and reduces

County of El Dorado Department of Transportation Diamond Springs Parkway Project Air Quality Impact Analysis Report Setting
Michael Brandman Associates 19 H:\Client (PN-JN)\1173\11730025\AQ\11730025 AQ Report DOT DS Parkway.doc
offsite energy consumption. Tree replacement and retention affects air quality through carbon sequestration. A Tree Benefit Estimator indicated that trees have varying carbon sequestration depending on the age (Sacramento Municipal Utility District 2007). A 1-year-old tree would sequester 0.003 ton of carbon dioxide per year, a 5-year-old tree would sequester 0.02 ton of carbon dioxide per year, and a mature tree would sequester 0.161 ton of carbon dioxide per year.
Policy 7.4.4.4 Requires mitigation for tree canopy cover for projects that would result in soil disturbance on parcels that (1) are over an acre and have at least 1 percent total canopy cover or (2) are less than an acre and have at least 10 percent total canopy cover by woodlands habitats as defined in this General Plan and determined from base line aerial photography or by site survey performed by a qualified biologist or licensed arborist, the County shall require one of two mitigation options: (1) the project applicant shall adhere to the tree canopy retention and replacement standards per County standards; or (2) the project applicant shall contribute to the County’s Integrated Natural Resources Management Plan (INRMP) conservation fund described in Policy 7.4.2.8.
El Dorado County Resolution No. 29-2008 On March 25, 2008, the El Dorado County Board of Supervisors adopted the “Environmental Vision for El Dorado County” Resolution No. 29-2008, brought forward by the Youth Commission. The Resolution sets forth goals and calls for implementation of positive environmental changes to reduce global impact, improve air quality and reduce dependence on landfills, promote alternative energies, increase recycling, and encourage local governments to adopt green and sustainable practices.
El Dorado County Department of Transportation Standard Procedures/Requirements applicable to Project Construction The El Dorado County DOT would retain a construction contractor to construct the proposed improvements and the contractor would be responsible for compliance with all applicable rules, regulations and ordinances associated with construction activities and for actual implementation of the construction-related mitigation measures to be adopted for the project. DOT would provide construction contractor oversight and management and would be responsible for verifying mitigation measure implementation. The project would be constructed in accordance with the Public Contracts Code of the State of California, the State of California Department of Transportation Standard Plans and Standard Specifications, and the Contract, Project Plans, and Project Special Provisions under development by the County of El Dorado Department of Transportation. The following are a combination of standard and project-specific procedures/requirements applicable to project construction that are related to air quality:
• Construction contract special provisions will require that a traffic management plan be prepared. The traffic management plan will include construction staging and traffic control measures to be implemented during construction to maintain and minimize impacts to traffic during construction.

County of El Dorado Department of Transportation Diamond Springs Parkway Project Air Quality Impact Analysis Report Setting
Michael Brandman Associates 20 H:\Client (PN-JN)\1173\11730025\AQ\11730025 AQ Report DOT DS Parkway.doc
Air Benefit: Decreased congestion and idling emissions.
• Contract special provisions will require compliance with EDAQMD Rules 223, 223-1, and 223-2 to minimize fugitive dust emissions. Compliance with EDAQMD Rules for fugitive dust will require the preparation of a Fugitive Dust Best Management Practices Plan that will describe the application of standard best management practices, as described in EDAPQMD Rule 223-1, to control dust during construction. Best management practices will include applying water to disturbed soils a minimum of two times per day, covering haul vehicles, replanting disturbed areas as soon as practical, restricting vehicle speeds on unpaved roads to 15 mph, and other measures, as deemed appropriate to control fugitive dust. Air Benefit: Minimization of construction emissions associated with construction of the proposed project.
• Compliance with the California Air Resources Board Airborne Toxic Control Measure at Title 17 Section 93105 addressing Construction, Grading, Quarrying, and Surface Mining activities and with the Asbestos ATCM for Surfacing Applications (California Code of Regulations, Title 17, Section 93106); Air Benefit: Control of toxic air emissions.
2.2 - Pollutants
The criteria pollutants of greatest concern for the MCAB are ozone, inhalable particulate matter (PM10), and fine particulate mater (PM2.5). Background concentrations of carbon monoxide (CO) are well below the AAQS; however, there is a potential for CO hotspots on congested roadways and at congested intersections. Other pollutants of concern are TACs and greenhouse gases.
The proposed project is not expected to produce air emissions containing hydrogen sulfide, sulfates, and vinyl chloride; therefore, these pollutants will not be discussed.
2.2.1 - Carbon Monoxide CO is a colorless, odorless gas that is formed when carbon in fuel is not burned completely. It is a component of motor vehicle exhaust, which contributes about 56 percent of all CO emissions nationwide. Other non-road engines and vehicles (such as construction equipment and boats) contribute about 22 percent of all CO emissions nationwide. Higher levels of CO generally occur in areas with heavy traffic congestion. In cities, 85 to 95 percent of all CO emissions may come from motor vehicle exhaust. Other sources of CO emissions include industrial processes (such as metals processing and chemical manufacturing), residential woodburning, and natural sources such as forest
County of El Dorado Department of Transportation Diamond Springs Parkway Project Air Quality Impact Analysis Report Setting
Michael Brandman Associates 21 H:\Client (PN-JN)\1173\11730025\AQ\11730025 AQ Report DOT DS Parkway.doc
fires. Woodstoves, gas stoves, cigarette smoke, and unvented gas and kerosene space heaters are sources of CO indoors.
CO is a public health concern because it combines readily with hemoglobin, reducing the amount of oxygen transported in the bloodstream. The health threat from lower levels of CO is most serious for those who suffer from such heart-related diseases as angina, clogged arteries, or congestive heart failure. For a person with heart disease, a single exposure to CO at low levels may cause chest pain and reduce that person’s ability to exercise; repeated exposures may contribute to other cardiovascular effects. High levels of CO can affect even healthy people. People who breathe high levels of CO can develop vision problems, reduced ability to work or learn, reduced manual dexterity, and difficulty performing complex tasks. At extremely high levels, CO is poisonous and can cause death.
Motor vehicles are the dominant source of CO emissions in most areas. CO is described as having only a local influence because it dissipates quickly. High CO levels develop primarily during winter, when periods of light winds combine with the formation of ground-level temperature inversions (typically from the evening through early morning). These conditions result in reduced dispersion of vehicle emissions. Because CO is a product of incomplete combustion, motor vehicles exhibit increased CO emission rates at low air temperatures. High CO concentrations occur in areas of limited geographic size, sometimes referred to as hot spots. Since CO concentrations are strongly associated with motor vehicle emissions, high CO concentrations generally occur in the immediate vicinity of roadways with high traffic volumes and traffic congestion, active parking lots, and in automobile tunnels. Areas adjacent to heavily traveled and congested intersections are particularly susceptible to high CO concentrations.
2.2.2 - Ozone Ozone is not emitted directly into the air but is formed by a photochemical reaction between the ozone precursors ROG and NOx, and sunlight. Because photochemical reaction rates depend on the intensity of ultraviolet light and air temperature, ozone is primarily a summer air pollution problem. Ozone is a regional pollutant that is generated over a large area and is transported and spread by the wind.
As a photochemical pollutant, ozone is formed only during daylight hours under appropriate conditions, but it is destroyed throughout the day and night. Thus, ozone concentrations vary, depending upon both the time of day and the location. Even in pristine areas, some ambient ozone forms from natural emissions that are not controllable. This is termed background ozone. The average background ozone concentrations near sea level are in the range of 0.015 to 0.035 parts per million (ppm), with a maximum of about 0.040 ppm (CARB 2005).

County of El Dorado Department of Transportation Diamond Springs Parkway Project Air Quality Impact Analysis Report Setting
Michael Brandman Associates 22 H:\Client (PN-JN)\1173\11730025\AQ\11730025 AQ Report DOT DS Parkway.doc
Ground-level ozone is a respiratory irritant and an oxidant that increases susceptibility to respiratory infections and can cause substantial damage to vegetation and other materials. Ozone can irritate lung airways and cause inflammation much like a sunburn. Other symptoms include wheezing, coughing, pain when taking a deep breath, and breathing difficulties during exercise or outdoor activities. People with respiratory problems are most vulnerable, but even healthy people who are active outdoors can be affected when ozone levels are high. Chronic ozone exposure can induce morphological (tissue) changes throughout the respiratory tract, particularly at the junction of the conducting airways and the gas exchange zone in the lung. Anyone who spends time outdoors in the summer is at risk, particularly children and other people who are active outdoors. Even at very low levels, ground-level ozone triggers a variety of health problems, including aggravated asthma, reduced lung capacity, and increased susceptibility to respiratory illnesses like pneumonia and bronchitis.
Ozone also damages vegetation and ecosystems. It leads to reduced agricultural crop and commercial forest yields; reduced growth and survivability of tree seedlings; and increased susceptibility to diseases, pests, and other stresses such as harsh weather. In the United States alone, ozone is responsible for an estimated $500 million in reduced crop production each year. Ozone also damages the foliage of trees and other plants, affecting the landscape of cities, national parks and forests, and recreation areas. In addition, ozone causes damage to buildings, rubber, and some plastics.
Reactive Organic Gases
ROG, also known as volatile organic compounds (VOC), are defined as any compound of carbon, excluding carbon monoxide, carbon dioxide, carbonic acid, metallic carbides or carbonates, and ammonium carbonate, which participate in atmospheric photochemical reactions. ROG consist of nonmethane hydrocarbons and oxygenated hydrocarbons. Hydrocarbons are organic compounds that contain only hydrogen and carbon atoms. Nonmethane hydrocarbons do not contain the unreactive hydrocarbon, methane. Oxygenated hydrocarbons have oxygenated functional groups attached.
It should be noted that there are no state or national ambient air quality standards for ROG because they are not classified as criteria pollutants. They are regulated, however, because a reduction in ROG emissions reduces certain chemical reactions that contribute to the formulation of ozone. ROG also are transformed into organic aerosols in the atmosphere, which contribute to higher PM10 levels and lower visibility.
Nitrogen Oxides
During combustion of fossil fuels, oxygen reacts with nitrogen to produce nitrogen oxides or NOx. This occurs primarily in motor vehicle internal combustion engines and fossil fuel-fired electric utility and industrial boilers. Whereas one form of NOx, nitrogen dioxide (NO2), is a criteria pollutant, NO2 by itself is not a pollutant of concern in the MCAB. In addition to being an ozone precursor, NOx can be a precursor to PM10 and PM2.5.

County of El Dorado Department of Transportation Diamond Springs Parkway Project Air Quality Impact Analysis Report Setting
Michael Brandman Associates 23 H:\Client (PN-JN)\1173\11730025\AQ\11730025 AQ Report DOT DS Parkway.doc
Because NOx and ROG are ozone precursors, the health effects associated with ozone (as discussed above) also are indirect health effects associated with significant levels of NOx and ROG emissions.
2.2.3 - Particulate Matter (PM10 and PM2.5) PM is the term for a mixture of solid particles and liquid droplets found in the air. Some particles, such as dust, dirt, soot, or smoke, are large or dark enough to be seen with the naked eye. Others are so small they can only be detected using an electron microscope.
Particle pollution includes “inhalable coarse particles,” with diameters larger than 2.5 micrometers and smaller than 10 micrometers and “fine particles,” with diameters that are 2.5 micrometers and smaller. For reference, PM2.5 is approximately one-thirtieth the size of the average human hair.
These particles come in many sizes and shapes and can be made up of hundreds of different chemicals. Some particles, known as primary particles, are emitted directly from a source, such as construction sites, unpaved roads, fields, smokestacks, or fires. Others form in complicated reactions in the atmosphere from chemicals such as sulfur dioxides and nitrogen oxides that are emitted from power plants, industrial activity, and automobiles. These particles, known as secondary particles, make up most of the fine particle pollution in the United States.
Particle exposure can lead to a variety of health effects. For example, numerous studies link particle levels to increased hospital admissions and emergency room visits—and even to death from heart or lung diseases. Both long- and short-term particle exposures have been linked to health problems. Long-term exposures, such as those experienced by people living for many years in areas with high particle levels, have been associated with problems such as reduced lung function and the development of chronic bronchitis, and even premature death. Short-term exposures to particles (hours or days) can aggravate lung disease, causing asthma attacks and acute bronchitis, and may increase susceptibility to respiratory infections. In people with heart disease, short-term exposures have been linked to heart attacks and arrhythmias. Healthy children and adults have not been reported to suffer serious effects from short-term exposures, although they may experience temporary minor irritation when particle levels are elevated.
Visibility-Reducing Particles
Visibility-reducing particles are suspended particulates that reduce visibility and are not considered a health risk but are regulated by the EPA. The distance that can be seen is limited by the amount of gases and aerosol particles in the way. Looking up vertically into the sky, one can see a greater distance compared with looking across the horizon because there are fewer particles blocking the view. Without pollution effects in the western United States, a natural visual range is 140 miles, and in the eastern United States, the range would be 90 miles (EPA 1999). In 1999, the visibility range in the West was 33 to 90 miles and in the East 14 to 24 miles. The EPA implemented a Regional Haze Rule in 1999 to attempt to protect visibility in 156 Class I national parks and wilderness areas in the

County of El Dorado Department of Transportation Diamond Springs Parkway Project Air Quality Impact Analysis Report Setting
Michael Brandman Associates 24 H:\Client (PN-JN)\1173\11730025\AQ\11730025 AQ Report DOT DS Parkway.doc
United States. The regulation requires states to establish goals for improving their areas and work together with other states, since the pollution is often transported over long distances.
2.2.4 - Other Pollutants of Concern Toxic Air Contaminants
A TAC is defined as an air pollutant that may cause or contribute to an increase in mortality or serious illness, or that may pose a hazard to human health. TACs are usually present in minute quantities in the ambient air; however, their high toxicity or health risk may pose a threat to public health even at very low concentrations. In general, for those TACs that may cause cancer, there is no concentration that does not present some risk. In other words, there is no threshold level below which adverse health impacts are not expected to occur. This contrasts with the criteria pollutants for which acceptable levels of exposure can be determined and for which the state and federal governments have set ambient air quality standards.
Diesel Particulate Matter
The CARB identified the PM emissions from diesel-fueled engines as a TAC in August 1998 under California’s TAC program. Diesel PM is emitted from both mobile and stationary sources. In California, on-road diesel-fueled vehicles contribute approximately 40 percent of the statewide total, with an additional 57 percent attributed to other mobile sources such as construction and mining equipment, agricultural equipment, and transport refrigeration units. Stationary sources, contributing about 3 percent of emissions, include shipyards, warehouses, heavy equipment repair yards, and oil and gas production operations. Emissions from these sources are from diesel-fueled internal combustion engines. Stationary sources that report diesel PM emissions also include heavy construction (except highway) manufacturers of asphalt paving materials and blocks, and electrical generation.
Asbestos
NOA is present in certain rock formations such as serpentinite or ultramafic rocks. Rock formations that contain NOA are known to be present in 44 of California’s 58 counties, including El Dorado County. Crushing or breaking these rocks, through construction or other means, can release asbestoform fibers into the air.
Exposure to asbestos fibers may result in health issues such as lung cancer, mesotheliomia (a rare cancer of the thin membranes lining the lungs, chest, and abdominal cavity), and asbestosis (a non-cancerous lung disease that causes scarring of the lungs).
Sources of NOA emissions include unpaved roads or driveways surfaced with source rock, construction activities in source rock deposits, or rock quarrying activities where asbestoform rock is present. NOA-containing rock formations are predominantly located in the western portion of El Dorado County. As discussed above, DMG has a published guide for generally identifying areas that

County of El Dorado Department of Transportation Diamond Springs Parkway Project Air Quality Impact Analysis Report Setting
Michael Brandman Associates 25 H:\Client (PN-JN)\1173\11730025\AQ\11730025 AQ Report DOT DS Parkway.doc
are likely to contain NOA in western El Dorado County. There nearest known location of NOA is approximately 4.5 miles west of the project. Therefore, the project is not in an area that is likely to contain naturally occurring asbestos (DMG 2002).
2.2.5 - Greenhouse Gases (GHGs) Unlike criteria air pollutants and TACs, which are pollutants of regional and local concern, greenhouse gases are global pollutants. Worldwide, California is the 12th to 16th largest emitter of CO2 and is responsible for approximately 2 percent of the world’s CO2 emissions (CEC 2006). In 2004, California produced 497 million gross metric tons of carbon dioxide-equivalent (CARB 2007b).
Gases that trap heat in the atmosphere are called greenhouse gases. The effect is analogous to the way a greenhouse retains heat. Common greenhouse gases include water vapor, carbon dioxide, methane, nitrous oxides, chlorofluorocarbons, hydrofluorocarbons, perfluorocarbons, sulfur hexafluoride, ozone, and aerosols. Natural processes and human activities emit greenhouse gas. The presence of greenhouse gases in the atmosphere affects the earth’s temperature. Without the natural heat-trapping effect of greenhouse gas, the earth’s surface would be about 34 degrees Centigrade (°C) (93 degrees Fahrenheit [°F]) cooler (CAT 2006). However, it is believed that emissions from human activities, such as electricity production and vehicle use, have elevated the concentration of these gases in the atmosphere beyond the level of naturally occurring concentrations.
Climate change is driven by forcings and feedbacks. Radiative forcing is the difference between the incoming energy and outgoing energy in the climate system. A feedback is “an internal climate process that amplifies or dampens the climate response to a specific forcing” (NRC 2005). The global warming potential is the potential of a gas or aerosol to trap heat in the atmosphere; it is the “cumulative radiative forcing effects of a gas over a specified time horizon resulting from the emission of a unit mass of gas relative to a reference gas” (EPA 2006a).
Individual greenhouse gas compounds have varying warming potentials and atmospheric lifetimes. The reference gas for the global warming potential is carbon dioxide. As shown in Table 4, carbon dioxide has a global warming potential of 1. The calculation of the carbon dioxide equivalent is a consistent methodology for comparing greenhouse gas emissions, since it normalizes various greenhouse gas emissions to a consistent metric. Methane’s warming potential of 23 indicates that methane has a global warming effect 23 times greater than carbon dioxide on a molecule per molecule basis. A carbon dioxide equivalent is the mass emissions of an individual greenhouse gas multiplied by its global warming potential.
The atmospheric lifetime and global warming potentials of selected greenhouse gases are summarized in Table 4. As shown in the table, global warming potentials range from 1 (carbon dioxide) to 22,200 (sulfur hexafluoride).

County of El Dorado Department of Transportation Diamond Springs Parkway Project Air Quality Impact Analysis Report Setting
Michael Brandman Associates 26 H:\Client (PN-JN)\1173\11730025\AQ\11730025 AQ Report DOT DS Parkway.doc
Table 4: Global Warming Potentials and Atmospheric Lifetimes of Select Greenhouse Gases
Greenhouse Gas Atmospheric Lifetime
(years) Global Warming Potential
(100-year time horizon)
Carbon dioxide (CO2) 50 to 200 1
Methane (CH4) 12 23
Nitrous oxide (N2O) 114 296
HFC-23 260 12,000
HFC-134a 13.8 1,300
HFC-152a 1.4 120
Sulfur hexafluoride 3,200 22,200
Source: IPCC 2001.
The following greenhouse gases are defined under Assembly Bill 32 but are not expected to be generated by the project: chlorofluorocarbons, hydrofluorocarbons, perfluorocarbons, and sulfur hexafluoride.
Aerosols
Description: Aerosols are suspensions of particulate matter in a gas emitted into the air through burning biomass (plant material) and fossil fuels. Aerosols can warm the atmosphere by absorbing and emitting heat and can cool the atmosphere by reflecting light. Cloud formation can also be affected by aerosols. Sulfate aerosols are emitted when fuel containing sulfur is burned. Black carbon (or soot) is emitted during biomass burning and incomplete combustion of fossil fuels.
Health Effects: Particulate matter can be inhaled directly into the lungs where it can be absorbed into the bloodstream. It is a respiratory irritant and can cause direct pulmonary effects such as coughing, bronchitis, lung disease, respiratory illnesses, increased airway reactivity, and exacerbation of asthma (EPA 2003b). In addition, particulate matter is thought to have direct effects on the health, capacity, and productivity of the heart (EPA 2003b). Relatively recent mortality studies have shown a statistically significant direct association between mortality and daily concentrations of particulate matter in the air (EPA 2003b). Non-health effects include reduced visibility and soiling of property.
Sources: Sulfate aerosols are emitted when fuel containing sulfur is burned. Black carbon (or soot) is emitted during biomass burning and incomplete combustion of fossil fuels. The regulation of particulate matter has been lowering aerosol concentrations in the United States; however, global concentrations are likely increasing.
Carbon Dioxide
Description: Carbon dioxide (CO2) is an odorless, colorless natural greenhouse gas.

County of El Dorado Department of Transportation Diamond Springs Parkway Project Air Quality Impact Analysis Report Setting
Michael Brandman Associates 27 H:\Client (PN-JN)\1173\11730025\AQ\11730025 AQ Report DOT DS Parkway.doc
Health Effects: Outdoor levels of carbon dioxide are not high enough to result in negative health effects. The National Institute for Occupational Safety and Health reference exposure level is 5,000 ppm, averaged over 10 hours in a 40-hour workweek. The short-term reference exposure level is 30,000 ppm, averaged over 15 minutes. At those levels, potential health problems are headache, dizziness, restlessness, and paresthesia (skin tingling, prickling, or numbness); dyspnea (breathing difficulty); sweating; malaise (vague feeling of discomfort); increased heart rate, cardiac output, and blood pressure; coma; asphyxia; and convulsions (NIOSH 2005).
Sources: Carbon dioxide is emitted from natural and anthropogenic sources. Natural sources include decomposition of dead organic matter; respiration of bacteria, plants, animals, and fungus; evaporation from oceans; and volcanic outgassing. Anthropogenic sources are from burning coal, oil, natural gas, and wood. Concentrations of carbon dioxide were 379 ppm in 2005, which is an increase of 1.4 ppm per year since 1960 (IPCC 2007). The concentration of carbon dioxide in the atmosphere is projected to increase to a minimum of 540 ppm by year 2100 as a direct result of anthropogenic sources (IPCC 2001).
Sinks: Sinks are mechanisms by which a gas or aerosol is taken out of the atmosphere. Carbon dioxide is removed from the air by photosynthesis, dissolution into ocean water, transfer to soils and ice caps, and mineral sequestration into solid carbonate salts (surface limestone or calcium carbonate).
Methane
Description: Methane (CH4) is a flammable gas and is the main component of natural gas. When one molecule of methane is burned in the presence of oxygen, one molecule of carbon dioxide and two molecules of water are released.
Health Effects: There are no ill health effects from methane. The immediate health hazard is that it may cause burns if it ignites. It is highly flammable and may form explosive mixtures with air. Methane is violently reactive with oxidizers, halogens, and some halogen-containing compounds. Methane is also an asphyxiant and may displace oxygen in an enclosed space (OSHA 2003).
Sources: A natural source of methane is from the anaerobic decay of organic matter. Geological deposits known as natural gas fields also contain methane, which is extracted for fuel. Other sources are from landfills, fermentation of manure, and ruminants such as cattle.
Nitrous Oxide
Description: Nitrous oxide (N2O), also known as laughing gas, is a colorless greenhouse gas.
Health Effects: Higher concentrations can cause dizziness, euphoria, and sometimes mild hallucinations.
County of El Dorado Department of Transportation Diamond Springs Parkway Project Air Quality Impact Analysis Report Setting
Michael Brandman Associates 28 H:\Client (PN-JN)\1173\11730025\AQ\11730025 AQ Report DOT DS Parkway.doc
Sources: Nitrous oxide is produced by microbial processes in soil and water, including those reactions that occur in fertilizer containing nitrogen. In addition to agricultural sources, some industrial processes (fossil fuel-fired power plants, nylon production, nitric acid production, and vehicle emissions) also contribute to its atmospheric load. It is used in rocket engines, racecars, and as an aerosol spray propellant.
2.3 - Physical Setting
The project site is located in an unincorporated area in the County of El Dorado, in the MCAB. The MCAB comprises Plumas, Sierra, Nevada, Placer (middle portion), El Dorado (western portion), Amador, Calaveras, Tuolumne, and Mariposa counties. The MCAB lies along the northern Sierra Nevada mountain range, close to or contiguous with the Nevada border, and covers an area of roughly 11,000 square miles. The western slope of El Dorado County, from Lake Tahoe on the east to the Sacramento County boundary on the west, lies within the MCAB. Elevations range from over 10,000 feet at the Sierra crest down to several hundred feet above sea level at the Sacramento County boundary. Throughout the County, the topography is highly variable and includes rugged mountain peaks and valleys with extreme slopes and differences in altitude in the Sierras, as well as rolling foothills to the west.
2.3.1 - Climate The general climate of the MCAB varies considerably with elevation and proximity to the Sierra Nevada ridge. The terrain features of the MCAB make it possible for various climates to exist in relative proximity. The pattern of mountains and hills causes a wide variation in rainfall, temperature, and localized winds throughout the MCAB. Temperature variations have an important influence on MCAB wind flow, dispersion along mountain ridges, vertical mixing, and photochemistry. The Sierra Nevada receives large amounts of precipitation from storms moving in from the Pacific in the winter, with lighter amounts from intermittent “Monsoonal” moisture flows from the south and cumulus buildup in the summer. Precipitation levels are high in the highest mountain elevations but decline rapidly toward the western portion of the MCAB. Winter temperatures in the mountains can be below freezing for weeks at a time, and substantial depths of snow can accumulate, but in the western foothills, winter temperatures usually dip below freezing only at night and precipitation is mixed as rain or light snow. In the summer, temperatures in the mountains are mild, with daytime peaks in the 70s to low 80sºF, but the western end of the County can routinely exceed 100ºF.
From an air quality perspective, the topography and meteorology of the MCAB combine such that local conditions predominate in determining the effect of emissions in each area. Regional airflows are affected by the mountains and hills, which direct surface air flows, cause shallow vertical mixing, and create areas of high pollutant concentrations by hindering dispersion. Inversion layers, where warm air overlays cooler air, frequently occur and trap pollutants close to the ground. In the winter,

County of El Dorado Department of Transportation Diamond Springs Parkway Project Air Quality Impact Analysis Report Setting
Michael Brandman Associates 29 H:\Client (PN-JN)\1173\11730025\AQ\11730025 AQ Report DOT DS Parkway.doc
these conditions can lead to CO “hotspots” along heavily traveled roads and at busy intersections. During summer’s longer daylight hours, stagnant air, high temperatures, and plentiful sunshine provide the conditions and energy for the photochemical reaction between ROG and NOx that result in the formation of ozone. Because of its long formation time, ozone is a regional pollutant rather than a local hotspot problem.
In the summer, the strong upwind valley air flowing into the MCAB from the Central Valley to the west is an effective transport medium for ozone precursors and ozone generated in the San Francisco Bay Area and the Sacramento and San Joaquin valleys. These transported pollutants predominate as the cause of ozone in the MCAB and are largely responsible for the exceedances of the state and federal standards in the MCAB. The CARB has officially designated the MCAB as “ozone impacted” by transport from those areas (13 CCR §70500).
2.3.2 - Regional Sources of Air Pollutants CARB publishes emissions inventory data for air districts and counties. Table 5 provides a summary of emissions for El Dorado County.
Table 5: El Dorado County Almanac Emissions Projection Data
Tons per Day Emission Category ROG NOx PM10
Stationary Sources 0.8 0.3 0.5
Areawide Sources 3.7 0.5 16.7
Mobile Sources 8.0 5.8 0.3
Natural Sources 49.6 0.2 0.5
Total El Dorado in MCAB 62.1 6.8 18.0
Source: CARB 2008d.
ROG. Natural sources contributed approximately 80 percent of the 2006 ROG emissions, with biogenic (plant-generated) emissions constituting the majority of natural source missions. Mobile sources accounted for approximately 13 percent of the 2006 emissions inventory.
NOx. Mobile sources generated the majority of NOx emissions in the MCAB portion of El Dorado County at approximately 85 percent of the total NOx inventory.
PM10. For PM10, areawide sources contributed more than 90 percent of the 2006 inventory. The main PM10-generating areawide sources include unpaved road dust, residential fuel combustion, and paved road dust.

County of El Dorado Department of Transportation Diamond Springs Parkway Project Air Quality Impact Analysis Report Setting
Michael Brandman Associates 30 H:\Client (PN-JN)\1173\11730025\AQ\11730025 AQ Report DOT DS Parkway.doc
2.3.3 - Local Air Quality Existing levels of ambient air quality and historical trends and projections of air quality in the project area are best documented from measurements made near the project site. The nearest monitoring site is in Placerville, approximately 1.5 miles northeast of the project site, which measures ozone, CO, and PM10. Table 6 summarizes the latest published monitoring data for each pollutant of concern monitored. The data shows that the ozone is an air quality problem in the area, as all years experienced a violation of the state 1-hour and the federal 8-hour ozone standards.
Table 6: Air Quality Monitoring Summary
Monitoring Year Pollutant Standard
2004 2005 2006
California Standard
1-Hour - 0.09 ppm (# days exceeded) 9 17 23
Federal Primary Standards
1-Hour - 0.12 ppma (# days exceeded) 0 0 0
8-Hour - 0.08 ppm (# days exceeded) 7 16 20
Maximum 1-Hour Concentration (ppm) 0.106 0.114 0.114
Ozone
Maximum 8-Hour Concentration (ppm) 0.095 0.104 0.102
California Standards
24-Hour - 50 μg/m3 (# days exceeded) 0 0 0
Annual Geometric Mean (μg/m3) 14.8 12.9 14.1
Federal Primary Standards
24-Hour - 150 μg/m3 (# days exceeded) 0 0 0
Annual Arithmetic Mean (μg/m3) 15.4 13.5 14.8
Respirable Particulates (PM10)
Maximum 24-Hour Concentration (μg/m3) 51 28 27
California Standards
1-Hour - 20 ppm (# days exceeded) 0 0 0
8-Hour - 9.0 ppm (# days exceeded) 0 0 0
Federal Primary Standards
1-Hour - 35 ppm (# days exceeded) 0 0 0
8-Hour - 9.5 ppm (# days exceeded) 0 0 0
Maximum 1-Hour Concentration (ppm) 2.4 6.1 1.5
Carbon Monoxide
Maximum 8-Hour Concentration (ppm) 1.9 4.4 0.7
Notes: a Data for federal 1-hour standard exceedances included because standard was in effect for monitoring years ppm = parts per million μg/m3 = micrograms per cubic meter Source: California Air Quality Data, http://www.arb.ca.gov/aqd/aqdpage.htm, accessed February 2008.

County of El Dorado Department of Transportation Diamond Springs Parkway Project Air Quality Impact Analysis Report Setting
Michael Brandman Associates 31 H:\Client (PN-JN)\1173\11730025\AQ\11730025 AQ Report DOT DS Parkway.doc
2.3.4 - Local Sources of Air Pollutants Nearby sources of air pollution include Missouri Flat Road and U.S. Highway 50 Interchange, Pleasant Valley Road (SR-49), Diamond Road (SR- 49) and the Western El Dorado County Materials Recovery Facility.
2.3.5 - Sensitive Receptors The potential for adverse air quality impacts increases as the distance between the source of emissions and members of the public decreases. The Guide states that while impacts on all members of the population should be considered, impacts on sensitive receptors are of particular concern (EDAQMD 2002). Sensitive receptors are facilities that house or attract children, the elderly, people with illnesses or others who are especially sensitive to the effects of air pollutants. Hospitals, schools, and convalescent facilities are examples of sensitive receptors.
The project site is located in a predominantly industrial and commercial area, and with the exception of the Materials Recovery Facility; the existing sources of air pollution are mainly mobile sources traveling along the nearby regional roadways located near the project site.
CARB’s Land Use Handbook
The CARB adopted the Air Quality and Land Use Handbook: A Community Health Perspective (Land Use Handbook). The Land Use Handbook provides information and guidance on siting sensitive receptors in relation to sources of TACs. The sources of TACs identified in the Land Use Handbook are high traffic freeways and roads, distribution centers, rail yards, ports, refineries, chrome plating facilities, dry cleaners, and large gas-dispensing facilities. If the project involves siting a sensitive receptor or source of TAC discussed in the Land Use Handbook, siting mitigation may be added to avoid potential land use conflicts, thereby reducing the potential for health impacts to the sensitive receptors.
In traffic-related studies, the additional non-cancer health risk attributable to proximity was seen within 1,000 feet and was strongest within 300 feet. California freeway studies show about a 70-percent drop off in particulate pollution levels at 500 feet. The CARB recommends avoiding siting new sensitive land uses within 500 feet of a freeway, urban roads with 100,000 vehicles per day, or rural roads with 50,000 vehicles per day.
2.3.6 - Alternate Forms of Transportation Transit services in western El Dorado County are provided through a joint powers agreement between the El Dorado County Transit Authority (EDCTA), County of El Dorado, and City of Placerville. EDCTA operates a wide range of services, including local deviated fixed routes, demand response, intercity commuter service, and contracted social service transportation.

County of El Dorado Department of Transportation Diamond Springs Parkway Project Air Quality Impact Analysis Report Setting
Michael Brandman Associates 32 H:\Client (PN-JN)\1173\11730025\AQ\11730025 AQ Report DOT DS Parkway.doc
Commercial Service Commercial bus service is provided by Amtrak at the Placerville Station on Mosquito Road. Amtrak thruway feeder bus service is provided daily from Placerville and Cameron Park to the Sacramento Amtrak station.

County of El Dorado Department of Transportation Diamond Springs Parkway Project Air Quality Impact Analysis Report Thresholds
Michael Brandman Associates 33 H:\Client (PN-JN)\1173\11730025\AQ\11730025 AQ Report DOT DS Parkway.doc
SECTION 3: THRESHOLDS
While the final determination of whether or not a project is significant is within the purview of the lead agency pursuant to §15064(b) of the CEQA Guidelines, the EDAQMD has recommended air pollution thresholds to be used by the lead agencies in determining whether the proposed project could result in a significant impact. Appendix G of the CEQA Guidelines presents recommended impact questions to assist lead agencies in evaluating environmental impacts. Appendix G is only a suggested form, and lead agencies are free to use different formats. The EDAQMD thresholds will be used to assess potential air quality impacts from the proposed project. In addition to the EDAQMD thresholds, this document proposes a Global Climate Change qualitative threshold. The following questions are evaluated in this report:
Would the project:
a) Conflict with or obstruct implementation of the applicable air quality plan;
b) Violate any air quality standard or contribute substantially to an existing or projected air quality violation.
c) Result in a cumulatively considerable net increase of any criteria pollutant for which the project region is non attainment under an applicable Federal or state ambient air quality standard (including releasing emissions which exceed quantitative thresholds for ozone precursors);
d) Expose sensitive receptors to substantial pollutant concentrations or toxic air contaminants; or
e) Create objectionable odors affecting a substantial number of people.
f) Does the project comply with the provisions of an adopted Greenhouse Gas Reduction Plan or Strategy? If no such Plan or Strategy is applicable, would the project significantly hinder or delay California’s ability to meet the reduction targets contained in AB 32?
If the lead agency finds that the proposed project has the potential to exceed any of the following air pollution thresholds, the project should be considered significant.
3.1 - Qualitative Significance Criteria
3.1.1 - Land Use Conflicts and Exposure of Sensitive Receptors The location of a project is a major factor in determining whether it will result in localized air quality impacts. The potential for adverse air quality impacts increases as the distance between the source of emissions and members of the public decreases. While impacts on all members of the population should be considered, impacts on sensitive receptors are of particular concern. Early consultation between project proponents and Lead Agency staff can avoid or minimize localized impacts on

County of El Dorado Department of Transportation Diamond Springs Parkway Project Air Quality Impact Analysis Report Thresholds
Michael Brandman Associates 34 H:\Client (PN-JN)\1173\11730025\AQ\11730025 AQ Report DOT DS Parkway.doc
sensitive receptors. Often, the provision of an adequate buffer zone between the source of emissions and the receptor(s) is sufficient to mitigate the problem.
3.1.2 - Odors A qualitative assessment is made as to whether a project has the potential to generate odorous emissions of a type or quantity that could meet the statutory definition for nuisance, i.e., odors “which cause detriment, nuisance, or annoyance to any considerable number of persons or to the public, or which may endanger the comfort, repose, health, or safety of any such person or the public, or which may cause, or have a natural tendency to cause, injury or damage to business or property,” or places new sensitive receptors into an area where odors are considered a nuisance.
3.1.3 - Quantitative Significance Criteria The EDAQMD recommends that the Lead Agency should determine whether the proposed project would exceed any of the thresholds set forth in this section. If any of the thresholds are exceeded, then the project is deemed to have a significant air quality impact. Tests of significance are not limited to the quantitative criteria listed below. The qualitative criteria mentioned above must also be satisfied, although in many cases the quantitative analysis will have the effect of showing that some or all of the qualitative criteria have been met.
Significance Criteria for Ozone
The daily operational emissions “significance” thresholds are 82 pounds per day of ROG or NOx, as shown in Table 7.
Table 7: Ozone Precursor Significance Thresholds
Pollutant Pounds per Day
NOx 82
ROG 82
Source: EDAQMD 2002.
Significance Criteria for Other Criteria Pollutants
For the other criteria pollutants, including CO, PM10, SO2, NO2, sulfates, lead, and hydrogen sulfide (H2S), a project is considered to have a significant impact on air quality if it will cause or contribute significantly to a violation of the applicable national or state ambient air quality standard(s). (See Table 1 for a list of the federal and state standards.) The determination of whether emissions of these pollutants from a project will cause or contribute to a violation of an applicable AAQS will be done in accordance with the methods laid out in the Guide (EDAQMD 2002).

County of El Dorado Department of Transportation Diamond Springs Parkway Project Air Quality Impact Analysis Report Thresholds
Michael Brandman Associates 35 H:\Client (PN-JN)\1173\11730025\AQ\11730025 AQ Report DOT DS Parkway.doc
3.1.4 - Significance Criteria for Determining Cumulative Impacts
A proposed project is considered cumulatively significant if one or more of the following conditions is met:
• The project requires a change in the existing land use designation (i.e., general plan amendment, rezone), and projected emissions (ROG, NOx, CO, or PM10) are greater than the emissions anticipated for the site if developed under the existing land use designation.
• The project would individually exceed any significance criteria in the Guide.
• For impacts that are determined to be significant under the Guide, the lead agency for the project does not require the project to implement the emission reduction measures contained in and/or derived from the AQMP.
• The project is located in a jurisdiction that does not implement the emission reduction measures contained in and/or derived from the AQMP.

County of El Dorado Department of Transportation Diamond Springs Parkway Project Air Quality Impact Analysis Report Impact Analysis
Michael Brandman Associates 36 H:\Client (PN-JN)\1173\11730025\AQ\11730025 AQ Report DOT DS Parkway.doc
SECTION 4: IMPACT ANALYSIS
This section analyzes the potential impacts of the proposed project on the air quality in the area surrounding the site. As recommended by the EDAQMD, the Sacramento Metropolitan AQMD’s Road Construction Model, Version 6.3, was used to quantify construction emissions from the project.
Air quality impacts can be described in a short-term and long-term perspective and can be qualitatively or quantitatively analyzed. Short-term impacts will occur during site grading and project construction. Long-term air quality impacts will occur once the project is in operation.
The project was included in the Circulation Element of the General Plan (El Dorado County 2004). Operational emissions from the buildout of the El Dorado County General Plan were determined to have a significant and unavoidable impact (EDC 2003).
The project itself would not generate new operational emissions in the form of new traffic, but would result in modified traffic patterns in the general project area; therefore, regional pollutant emissions from operations (vehicle use) are not quantified. However, carbon monoxide and TACs (localized pollutants) are addressed in this analysis, as the realignment would move the location of operational emissions in relation to sensitive receptors.
4.1 - Construction (Short-term) Impacts
Short-term impacts associated with the proposed project include the creation of fugitive dust and other particulate matter, as well as exhaust emissions generated by rough grading, excavation, and site work. Short-term impacts would also include emissions generated during construction of structural facilities (structural forms, rebar and conduits), paving and striping, and construction workers’ personal vehicles.
The EDAQMD’s Guide says that construction emissions for road construction and road widening projects can be estimated using the latest version of the Roadway Construction Emissions Model developed by the Sacramento Metropolitan AQMD. The Roadway Construction Emissions Model is a Microsoft Excel worksheet available to assess the emissions of linear construction projects. The worksheet can be used to estimate emissions for both vehicle exhaust and fugitive dust. The methodology used to estimate fugitive dust emissions is a simplified methodology involving estimates of the maximum area (acreage) of land disturbed daily. DOT provided a construction phasing schedule for the project. The phases and modeling assumptions are described below:
Phase One: This phase would begin construction in April 2011. Approximately three months would be spent on grading and drainage improvements, one month on paving/striping and an additional month for signalization. This phase would involve improvements to Diamond Road (SR-49), Lime Kiln, Happy Lane, Black Rice, and the frontage road paving. DOT estimates the total area that would

County of El Dorado Department of Transportation Diamond Springs Parkway Project Air Quality Impact Analysis Report Impact Analysis
Michael Brandman Associates 37 H:\Client (PN-JN)\1173\11730025\AQ\11730025 AQ Report DOT DS Parkway.doc
be graded for this phase to be 13 acres, with a maximum of 6 acres of soil disturbed on a single day. Further assumptions are as follows:
Diamond Road (SR 49) Road Construction • Approximately 2,700 feet of roadway will be widened. • A maximum width of 200 feet of ROW will be disturbed.
Happy Lane/Black Rice Road Improvements • Approximately 250 feet of roadway will be widened. • A maximum width of 24 feet of will be disturbed.
LimeKiln/Diamond Road Improvements • Approximately 500 feet of roadway will be widened. • A maximum width of 24 feet of will be disturbed.
Frontage Road for Diamond Road (SR 49) • Approximately 1,500 feet of roadway will be constructed. • A maximum width of 40 feet of ROW will be disturbed.
Phase Two: This phase would begin construction in January 2012. Approximately four and a half months would be spent on grading and drainage improvements, one and a half months on paving/striping and an additional month for signalization. This phase would involve the construction of Diamond Springs Parkway. DOT estimates the total area that would be graded for this phase to be 20 acres, with a maximum of 7 acres of soil disturbed on a single day. Further assumptions are as follows:
Diamond Springs Parkway Road Construction • Total Amount of Soil Imported: 121,000 cubic yards. • Total Amount of Soil Exported: 43,100 cubic yards. • Construction staging would occur on and fill material would be acquired from the Abel and
Lindemen parcels located just south of the Parkway and just west of SR-49 (Diamond Road); an approximately 2-mile round trip travel for soil import and export was estimated for the whole project.
• Approximately 4,400 feet of roadway will be constructed. • A maximum width of 150 feet of ROW will be disturbed.
Truck Street/Bradley Drive • Approximately 400 feet of roadway will be constructed. • A maximum width of 24 feet of will be disturbed.
Truck Street Improvements • Approximately 475 feet of roadway will be realigned. • A maximum width of 24 feet of will be disturbed.

County of El Dorado Department of Transportation Diamond Springs Parkway Project Air Quality Impact Analysis Report Impact Analysis
Michael Brandman Associates 38 H:\Client (PN-JN)\1173\11730025\AQ\11730025 AQ Report DOT DS Parkway.doc
Throwita Way Improvements • Approximately 500 feet of roadway will be realigned. • A maximum width of 24 feet of will be disturbed.
Old Depot Road Improvements • Approximately 400 feet of roadway will be widened. • A maximum width of 28 feet of will be disturbed.
Realignment of El Dorado Multi-Use Trail • Approximately 1,140 feet of trail/roadway will be constructed. • A maximum width of 8 feet of will be disturbed.
4.1.1 - Construction Dust The Guide states that mass emissions of fugitive dust need not be quantified, and may be assumed to be less than significant, if the project includes mitigation measures that will prevent visible dust beyond the property line, as detailed in Tables C.4 and C.5 of the CEQA Guide (EDAQMD 2002). This recommendation was made prior to EDAQMD’s adoption of Rule 223-1 (Fugitive Dust), which limits the fugitive dust from construction and construction-related activities.
DOT’s special contract provisions require compliance with EDAQMD Rules 223, 223-1, and 223-2, to minimize fugitive dust emissions. As a result of the required compliance with these Rules, impacts associated with construction-related fugitive dust emissions are considered less than significant.
Level of Significance Before Mitigation
Less than significant impact.
Mitigation Measures
No mitigation is required. Level of Significance After Mitigation
Less than significant impact.
4.1.2 - Regional Pollutants Short-term emissions were evaluated with the Roadway Construction Emissions Model Version 6.2.
Table 8 summarizes the results of these evaluations for Phase One, and Table 9 summarizes the results for Phase Two.

County of El Dorado Department of Transportation Diamond Springs Parkway Project Air Quality Impact Analysis Report Impact Analysis
Michael Brandman Associates 39 H:\Client (PN-JN)\1173\11730025\AQ\11730025 AQ Report DOT DS Parkway.doc
Table 8: Phase One Construction Emissions - Unmitigated (maximum lbs per day)
Construction Phase
Grading/ Excavation
Drainage/ Sub-grade Paving Signalization
Phase Component ROG NOx ROG NOx ROG NOx ROG NOx
SR-49 (Diamond Road)
7.6 60.1 5.1 37 5.7 31.6 2.6 17.6
Lime Kiln * * * * 2.4 13.5 ** **
Happy Lane/Black Rice
* * * * 2.3 13.4 ** **
Frontage Road * * * * 2.6 14.0 ** **
EDAQMD Significance Threshold
82 82 82 82 82 82 82 82
Significant? No No No No No No No No Notes: Modeling assumes that construction phases for each Phase Component do not overlap. * Total acreage and maximum acreage per day were included in the SR-49 modeling. ** Signalization equipment fleet and worker commute emissions included in the SR-49 modeling. Source: Michael Brandman Associates, 2008
Table 9: Phase Two Construction Emissions - Unmitigated (maximum lbs per day)
Construction Phase
Grading/ Excavation
Drainage/ Sub-grade Paving Signalization
Phase Component ROG NOx ROG NOx ROG NOx ROG NOx
Diamond Springs Parkway
8.3 55.9 4.9 33.8 5.3 29.4 2.45 16.48
Truck Street * * * * 2.1 12.2 ** **
Truck Street/Bradley Drive
* * * * 2.1 12.2 ** **
Old Depot Road * * * * 2.1 12.2 ** **
Throwita Way * * * * 2.1 12.2 ** **
El Dorado Multiuse Trail
* * * * 2.2 12.5 ** **
EDAQMD Significance Threshold
82 82 82 82 82 82 82 82
Significant? No No No No No No No No Notes: Modeling assumes that construction phases for each Phase Component do not overlap * Total acreage and maximum acreage per day were included in the SR-49 modeling. ** Signalization equipment fleet and worker commute emissions included in the SR-49 modeling. Source: Michael Brandman Associates, 2008

County of El Dorado Department of Transportation Diamond Springs Parkway Project Air Quality Impact Analysis Report Impact Analysis
Michael Brandman Associates 40 H:\Client (PN-JN)\1173\11730025\AQ\11730025 AQ Report DOT DS Parkway.doc
As shown above, the emissions of ROG and NOx will not exceed the EDAQMD’s thresholds of significance.
Level of Significance Before Mitigation
Less than significant impact.
Mitigation Measures
No mitigation is required. Level of Significance After Mitigation
Less than significant impact.
4.1.3 - Construction-Generated CO Violation In addition to the mass daily regional threshold standards, project construction has the potential to raise localized ambient concentrations. This could present a significant impact if these concentrations were to exceed the ambient air quality standards at receptor locations.
Table 10: Carbon Monoxide Concentration and Significance Determination
Concentration 1-Hour 8-Hour
Background Concentration 1.320 0.924
Project-Related Concentration 3.100 3.100
Anticipated Total Concentration 4.420 4.024
Ambient Air Quality Standard 20 9
Exceed Significance Threshold? No No
Notes: 1. The CAAQS are more stringent than the NAAQS, which is35.0 ppm. The above calculations assume project-related CO concentration levels associated with additional peak-hour trips are based on a conservative assumption that the project would result in 1,000 additional peak-hour trips during construction. Source: Michael Brandman Associates, 2008.
Level of Significance Before Mitigation
Less than significant impact.
Mitigation Measures
No mitigation is necessary.
Level of Significance After Mitigation
Less than significant impact.

County of El Dorado Department of Transportation Diamond Springs Parkway Project Air Quality Impact Analysis Report Impact Analysis
Michael Brandman Associates 41 H:\Client (PN-JN)\1173\11730025\AQ\11730025 AQ Report DOT DS Parkway.doc
4.1.4 - Diesel Particulate Matter The construction equipment would emit diesel particulate matter, which is a carcinogen. However, the diesel particulate matter emissions are short term in nature. Determination of risk from diesel particulate matter is considered over a 70-year exposure time. Therefore, considering the dispersion of the emissions and the short time frame, exposure to diesel particulate matter is anticipated to be less than significant.
Level of Significance Before Mitigation
Less than significant impact.
Mitigation Measures
No mitigation is necessary.
Level of Significance After Mitigation
Less than significant impact.
4.2 - Operational CO Analysis
A CO violation occurs when a localized concentration of CO exceeds the state or national 1-hour or 8-hour CO ambient air standards. Localized high levels of CO are associated with traffic congestion and idling or slow-moving vehicles.
EDAQMD’s methodology for estimating operational CO impacts uses the number of peak hour trips a project will contribute and adds the potential CO concentration levels associated with those trips to the background CO concentration level to determine if there is a potential air quality violation. The Diamond Springs Parkway Project does not generate additional peak hour trips, but rather redirects where existing and future trips will travel. Absent a peak hour value to determine the project concentration contribution, a CO analysis using the Caltrans CO Protocol modeling tool CALINE4 was used. The analysis assessed the potential CO impacts at intersections with the greatest congestion reflected by decreased Level of Service (LOS). The Traffic Impact Analysis (TIA) for the Diamond Springs Parkway project prepared by Kimley-Horn and Associates (KHA 2009) identified several intersections that would experience the most traffic congestion under the following scenarios: Existing (2010) plus Proposed Project Conditions, Interim (2020) plus Proposed Project Conditions and Cumulative (2030) plus Proposed Project Conditions. The intersections listed below in Table 11 were evaluated using CALINE4 to determine if they would cause a CO violation. Because the greatest CO concentration potential exists at the intersections the roadway segments were not evaluated. If the intersections do not violate the CO standard then the roadway segments, which experience greater dispersion and decreased CO concentration levels would also not violate the CO standard. Table 11 provides a summary of the potential CO concentrations as a result of the project.

County of El Dorado Department of Transportation Diamond Springs Parkway Project Air Quality Impact Analysis Report Impact Analysis
Michael Brandman Associates 42 H:\Client (PN-JN)\1173\11730025\AQ\11730025 AQ Report DOT DS Parkway.doc
Table 11: CO Concentrations
Intersection 1-Hour Estimated CO Concentration
(ppm)* 8-Hour Estimated CO Concentration
(ppm)** Significant Impact?***
2010 Diamond Road and Lime Kiln/Black Rice Road 3.1 2.2 No
2010 Diamond Road and Pleasant Valley Road 3.2 2.3 No
2020 Diamond Road and Lime Kiln/Black Rice Road 2.0 1.4 No
2020 Diamond Springs Parkway and Missouri Flat Road 1.8 1.3 No
2020 Diamond Springs Parkway and Throwita Way 1.8 1.3 No
2030 Diamond Road and Lime Kiln/Black Rice Road 1.7 1.2 No
2030 Diamond Springs Parkway and Missouri Flat Road 1.7 1.2 No
2030 Diamond Springs Parkway and Throwita Way 1.6 1.1 No
Notes: * CALINE4 output (see appendix for model output) plus the 1-hour background concentration of 1.32 ppm (CARB 2008) ** The 8-hour project increment was calculated by multiplying the 1-hour CALINE4 output by 0.7 (persistence factor), then adding the 8-hour background concentration of 0.92 ppm. *** Comparison of the 1-hour concentration to the state standard of 20 ppm and the 8-hour concentration to the state/national standard of 9 ppm. Source: Michael Brandman Associates, 2008
As shown above, the estimated 1-hour and 8-hour average CO concentrations for the most congested project intersections in the near term 2010 with project traffic, interim 2020 with project traffic, and cumulative 2030 project traffic impacts, in combination with background concentrations, are below the state and federal ambient air quality standards. No CO hotspots are anticipated because of redirected traffic emissions by the proposed project. Therefore, the project is not anticipated to contribute substantially to an existing or projected air quality violation of CO.
Level of Significance Before Mitigation
Less than significant impact.
Mitigation Measures
No mitigation is necessary.

County of El Dorado Department of Transportation Diamond Springs Parkway Project Air Quality Impact Analysis Report Impact Analysis
Michael Brandman Associates 43 H:\Client (PN-JN)\1173\11730025\AQ\11730025 AQ Report DOT DS Parkway.doc
4.3 - Sensitive Receptors
Construction As previously stated, the construction equipment would emit diesel particulate matter, which is a carcinogen. However, the diesel particulate matter emissions are short term in nature. Determination of risk from diesel particulate matter is considered over a 70-year exposure time. Therefore, considering the dispersion of the emissions and the short time frame, exposure to diesel particulate matter is anticipated to be less than significant.
PM10 thresholds are considered less than significant if ROG and NOx do not exceed EDAQMD thresholds of significance.
Operation A CO hotspot analysis is the appropriate tool to determine if project emissions of CO during operation would exceed ambient air quality standards. The main source of air pollutant emissions during operation are from offsite motor vehicles traveling on the roads surrounding the project. The CO analysis demonstrated that emissions of CO during operation would not result in an exceedance of the most stringent ambient air quality standards for CO. Therefore, according to this criterion, air pollutant emissions during operation would result in a less than significant impact.
The CARB Air Quality and Land Use Handbook recommendations for distances between sensitive receptors and certain land uses. Some of the land uses includes freeways, urban roads, distribution centers, fueling stations, and dry cleaners. The proposed project is not located within the distances of concern. Therefore, air pollution from the land uses assessed in the CARB Handbook would not significantly impact the project.
Level of Significance Before Mitigation
Less than significant impact.
Mitigation Measures
No mitigation is required.
Level of Significance After Mitigation
Less than significant impact.
4.4 - Odor Impacts
Odor impacts are based on the location of the sensitive receptors in relation to sources of odors. A project can either be a generator of odors, and concern would be focused on what sensitive receptors are already in the proximity of the proposed project, or a project can add new sensitive receptors that could be affected by sources of air pollution or odors.

County of El Dorado Department of Transportation Diamond Springs Parkway Project Air Quality Impact Analysis Report Impact Analysis
Michael Brandman Associates 44 H:\Client (PN-JN)\1173\11730025\AQ\11730025 AQ Report DOT DS Parkway.doc
Transportation projects are traditionally not considered odor generators. A survey of the area surrounding the project reveals existing sources of air pollution and odors from industrial sources and the Materials Recovery Facility. Diesel exhaust and ROGs would be emitted during construction of the project, which are objectionable to some; however, emissions would disperse rapidly from the project site and, therefore, should not be at a level to induce a negative response.
Level of Significance Before Mitigation
Less than significant impact.
Mitigation Measures
No mitigation is required.
Level of Significance After Mitigation
Less than significant impact.
4.5 - Contribution to Climate Change Analysis
The project contributes to climate change impacts through its contribution of greenhouse gases (GHG). The project will emit greenhouse gases such as carbon dioxide, methane, and nitrous oxide from the exhaust of equipment used during construction and exhaust of vehicles during operation.
The following approach is used to address the impact of the proposed project on climate change:
1. Inventory: Generate an inventory of greenhouse gas emissions emitted during construction and operation.
2. Onsite mitigation measures: Mitigation measures and strategies from various sources are reviewed to determine the applicability and feasibility of such measures to reduce project-related greenhouse gas emissions.
3. Offsite measures: The feasibility of offsite measures such as carbon offsets is explored.
4. Determination of significance: The level of significance after mitigation is determined. 4.5.1 - Project Inventory of Greenhouse Gas Emissions Construction Emission Estimation Assumptions Exhaust emissions during construction were estimated using the Sacramento Metropolitan AQMD’s Road Construction Model, Version 6.3. Table 12 provides a summary of the emissions.
Emissions Inventory The project would emit greenhouse gases from upstream emission sources (the manufacture of building materials such as cement) and direct sources (combustion of fuels from worker vehicles and

County of El Dorado Department of Transportation Diamond Springs Parkway Project Air Quality Impact Analysis Report Impact Analysis
Michael Brandman Associates 45 H:\Client (PN-JN)\1173\11730025\AQ\11730025 AQ Report DOT DS Parkway.doc
construction equipment). An upstream emission source refers to emissions that were generated during the manufacture of products to be used for construction of the project. Upstream emission sources for the project include but are not limited to the following: emissions from the manufacture of cement, emissions from the manufacture of steel, and/or emissions from the transportation of building materials. The upstream emissions were not estimated because CEQA does not require a “lifecycle” analysis approach to determine significance of potential environmental impacts.
Emissions of nitrous oxide and methane are negligible. The emissions of carbon dioxide from project construction equipment and worker vehicles are shown in Table 12. Without mitigation, project construction emissions total 557.38 MTCO2e.
Table 12: Construction Exhaust CO2 Emissions (Unmitigated)
Phase Component Total Tons (MTCO2e)*
SR-49 193.20 175.27
Lime Kiln 12.70 11.52
Happy Lane/Black Rice 12.40 11.25
Frontage Road 13.10 11.88
2011 Subtotal 231.40 209.93
Diamond Springs Parkway 288.20 261.46
Truck Street 18.80 17.06
Truck Street/Bradley Drive 18.80 17.06
Old Depot Road 18.80 17.06
Throwita Way 19.00 17.24
El Dorado Multiuse Trail 19.40 17.60
2012 Subtotal 383.00 347.46
Project Total 614.40 557.38
Notes: *MTCO2e = metric tons of carbon dioxide equivalent, converted from tons by multiplying by 0.9072 Source: Michael Brandman Associates, 2008
4.5.2 - Onsite Greenhouse Gas Reduction Options Although not required by statute or regulation, there are voluntary greenhouse gas reduction strategies available for projects to reduce greenhouse gas emissions. The California Attorney General has provided suggestions on ways to reduce overall impacts. The CARB adopted a Scoping Plan in December 2008, which includes a few measures that would be applicable to the project. The OPR
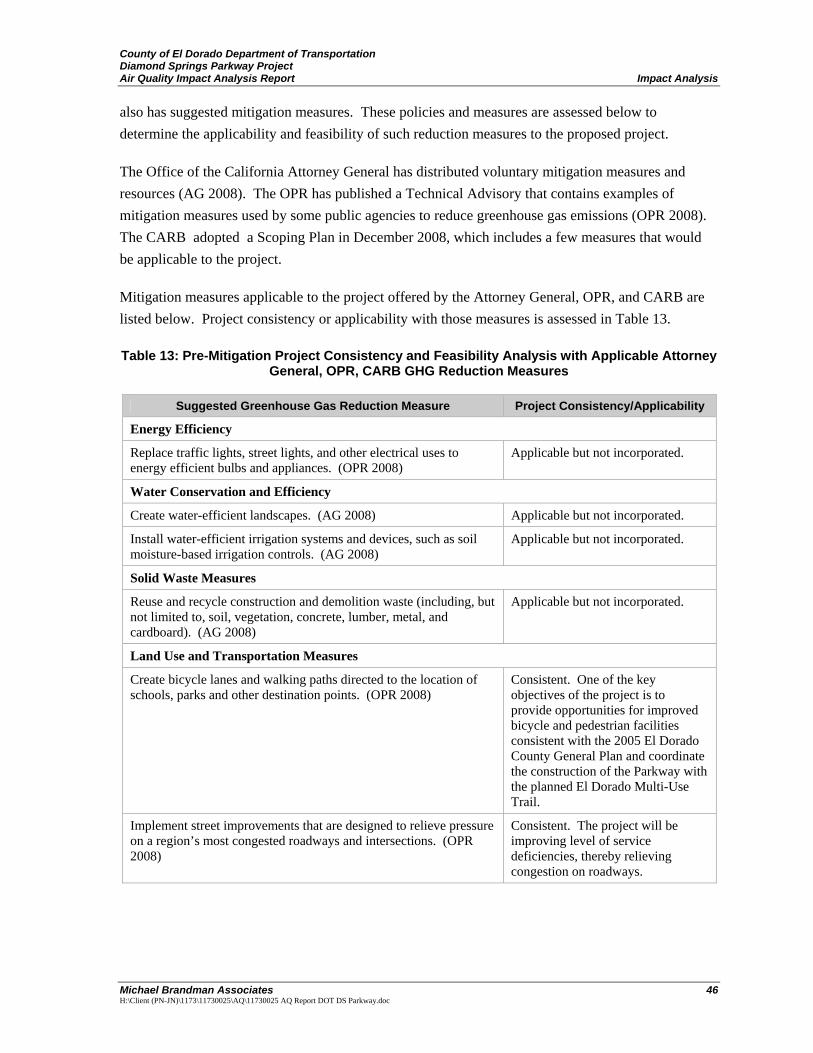
County of El Dorado Department of Transportation Diamond Springs Parkway Project Air Quality Impact Analysis Report Impact Analysis
Michael Brandman Associates 46 H:\Client (PN-JN)\1173\11730025\AQ\11730025 AQ Report DOT DS Parkway.doc
also has suggested mitigation measures. These policies and measures are assessed below to determine the applicability and feasibility of such reduction measures to the proposed project.
The Office of the California Attorney General has distributed voluntary mitigation measures and resources (AG 2008). The OPR has published a Technical Advisory that contains examples of mitigation measures used by some public agencies to reduce greenhouse gas emissions (OPR 2008). The CARB adopted a Scoping Plan in December 2008, which includes a few measures that would be applicable to the project.
Mitigation measures applicable to the project offered by the Attorney General, OPR, and CARB are listed below. Project consistency or applicability with those measures is assessed in Table 13.
Table 13: Pre-Mitigation Project Consistency and Feasibility Analysis with Applicable Attorney General, OPR, CARB GHG Reduction Measures
Suggested Greenhouse Gas Reduction Measure Project Consistency/Applicability
Energy Efficiency
Replace traffic lights, street lights, and other electrical uses to energy efficient bulbs and appliances. (OPR 2008)
Applicable but not incorporated.
Water Conservation and Efficiency
Create water-efficient landscapes. (AG 2008) Applicable but not incorporated.
Install water-efficient irrigation systems and devices, such as soil moisture-based irrigation controls. (AG 2008)
Applicable but not incorporated.
Solid Waste Measures
Reuse and recycle construction and demolition waste (including, but not limited to, soil, vegetation, concrete, lumber, metal, and cardboard). (AG 2008)
Applicable but not incorporated.
Land Use and Transportation Measures
Create bicycle lanes and walking paths directed to the location of schools, parks and other destination points. (OPR 2008)
Consistent. One of the key objectives of the project is to provide opportunities for improved bicycle and pedestrian facilities consistent with the 2005 El Dorado County General Plan and coordinate the construction of the Parkway with the planned El Dorado Multi-Use Trail.
Implement street improvements that are designed to relieve pressure on a region’s most congested roadways and intersections. (OPR 2008)
Consistent. The project will be improving level of service deficiencies, thereby relieving congestion on roadways.

County of El Dorado Department of Transportation Diamond Springs Parkway Project Air Quality Impact Analysis Report Impact Analysis
Michael Brandman Associates 47 H:\Client (PN-JN)\1173\11730025\AQ\11730025 AQ Report DOT DS Parkway.doc
Table 13 (cont.): Pre-Mitigation Project Consistency and Feasibility Analysis with Applicable Attorney General, OPR, CARB GHG Reduction Measures
Suggested Greenhouse Gas Reduction Measure Project Consistency/Applicability
Urban Forestry
Preserve or replace onsite trees (that are removed due to development) as a means of providing carbon storage. (AG 2008)
Applicable but not incorporated.
Source for Measures: AG 2008, OPR 2008, ARB Scoping Plan Reduction Measure: CARB 2008. Source for Project Consistency Analysis: Michael Brandman Associates, 2009.
4.5.3 - Summary of Impacts The project would construct or widen roads to improve existing Level of Service (LOS) deficiencies on US-50 at the Missouri Flat Road Interchange, Missouri Flat Road from its intersection with US-50 south to Pleasant Valley Road (SR-49), and Pleasant Valley Road (SR-49) in the vicinity of Diamond Springs.
The project could, but currently does not, implement a number of mitigation measures that either would directly or indirectly reduce emissions of greenhouse gases.
Level of Significance Before Mitigation
Potentially significant impact.
Without mitigation, the project would generate 557.38 MTCO2e and is not doing all it can do to reduce its emissions of greenhouse gases. Therefore, the project could hinder or delay California’s ability to meet the reduction targets by 2020.
Mitigation Measures
The following mitigation measures will reduce GHG emissions.
AIR-1 Any traffic lights installed or replaced as part of this project shall use Light Emitting Diodes (LEDs).
AIR-2 Prior to commencement of construction, the project construction contractor(s) shall have in place a County-approved Solid Waste Diversion and Recycling Plan (or such other documentation to the satisfaction of the County) that demonstrates the diversion and recycling of salvageable and re-useable wood, metal, plastic and paper products during project construction. The Solid Waste Diversion and Recycling Plan shall be in compliance with County Ordinance Chapter 8.43–Construction and Demolition Debris Recycling Within the County of El Dorado. This requirement shall be included in the construction/specification bid documents for the project.

County of El Dorado Department of Transportation Diamond Springs Parkway Project Air Quality Impact Analysis Report Impact Analysis
Michael Brandman Associates 48 H:\Client (PN-JN)\1173\11730025\AQ\11730025 AQ Report DOT DS Parkway.doc
Level of Significance After Mitigation
Less than significant impact.
The proposed project incorporates a number of features and mitigation measures that would minimize greenhouse gas emissions to the maximum extent practicable. These features and mitigation measures are consistent with all applicable strategies identified by the OPR, CARB, and the Attorney General’s Office. The road construction and realignment would improve circulation and safety in the project vicinity for vehicles, pedestrians, and bicycles and promote reductions in vehicular emissions. For these reasons, the proposed project’s greenhouse gas emissions would not significantly hinder or delay California’s ability to meet the reduction targets contained in AB 32.
Table 14: Post-Mitigation Project Consistency and Feasibility Analysis with Applicable Attorney General, OPR, CARB GHG Reduction Measures
Suggested Greenhouse Gas Reduction Measure Project Consistency/Applicability
Energy Efficiency
Replace traffic lights, street lights, and other electrical uses to energy efficient bulbs and appliances. (OPR 2008)
Consistent with Mitigation Measure AIR-1.
Water Conservation and Efficiency
Install water-efficient irrigation systems and devices, such as soil moisture-based irrigation controls. (AG 2008)
Consistent with County Policy 7.3.1.2.
Solid Waste Measures
Reuse and recycle construction and demolition waste (including, but not limited to, soil, vegetation, concrete, lumber, metal, and cardboard). (AG 2008)
Consistent with Mitigation Measure AIR-2.
Land Use and Transportation Measures
Create bicycle lanes and walking paths directed to the location of schools, parks and other destination points. (OPR 2008)
Consistent. One of the key objectives of the project is to provide opportunities for improved bicycle and pedestrian facilities consistent with the 2004 El Dorado County General Plan and coordinate the construction of the Parkway with the planned El Dorado Multi-Use Trail.
Implement street improvements that are designed to relieve pressure on a region’s most congested roadways and intersections. (OPR 2008)
Consistent. The project will be improving level of service deficiencies, thereby relieving congestion on roadways.
Urban Forestry
Preserve or replace onsite trees (that are removed due to development) as a means of providing carbon storage. (AG 2008)
Consistent with County Policy 7.4.4.4.
Source for Measures: AG 2008; OPR 2008; ARB Scoping Plan Reduction Measure: CARB 2008. Source for Project Consistency Analysis: Michael Brandman Associates, 2009.

County of El Dorado Department of Transportation Diamond Springs Parkway Project Air Quality Impact Analysis Report Impact Analysis
Michael Brandman Associates 49 H:\Client (PN-JN)\1173\11730025\AQ\11730025 AQ Report DOT DS Parkway.doc
4.6 - Consistency Analysis with the Air Quality Management Plan
This analysis uses three criteria for determining project consistency with the 1994 Sacramento Regional Clean Air Plan, considered the local AQMP, as discussed below. There are four key indicators of AQMP consistency:
1) Whether the project will not result in an increase in the frequency or severity of existing air quality violations or cause or contribute to new violations, or delay timely attainment of air quality standards or the interim emission reductions specified in the AQMP;
2) Whether the project will exceed the assumptions in the AQMP based on the year of project build out; and
3) Whether the project is compliant with the control measures in the AQMP. 4.6.1 - Project’s Contribution to Air Quality Violations It was determined that the project would not contribute to air quality violations because it does not exceed the EDAQMD thresholds for short-term NOx or ROG emissions.
4.6.2 - AQMP Assumptions The second way to assess project compliance with the AQMP assumptions is to ensure that the population density and land use are consistent with the growth assumptions used in the plans for the MCAB. The existing general plan includes the project in its Circulation Element. The AQMP uses General Plans for their growth assumptions. The project would not result in an increase in population; therefore, it is consistent with the assumption in the AQMP and the General Plan. Since this project is consistent with the General Plan, the AQMP assumptions remain valid and there would be no impact.
4.6.3 - Control Measures The third criterion is compliance with the control measures in the AQMP. The AQMP contains a number of land use and transportation control measures that include the EDAQMD’s Stationary and Mobile Source Control Measures and State Control Measures proposed by CARB. CARB’s strategy for reducing mobile source emissions include the following approaches: new engine standards; reduce emissions from in-use fleet, require clean fuels, support alternative fuels and reduce petroleum dependency, work with the EPA to reduce emissions from federal and state sources, and pursue long-term advanced technology measures. The project indirectly will comply with the control measures set by CARB. Additionally, as discussed in an earlier section, EDAQMD Rules Applicable to the Project, the project will comply with all of the EDAQMD’s applicable rules and regulations. Therefore, the project complies with this criterion.

County of El Dorado Department of Transportation Diamond Springs Parkway Project Air Quality Impact Analysis Report Impact Analysis
Michael Brandman Associates 50 H:\Client (PN-JN)\1173\11730025\AQ\11730025 AQ Report DOT DS Parkway.doc
4.6.4 - Overall Compliance with the AQMP The project does not exceed the EDAQMD thresholds for short-term construction; therefore, the project would not contribute to an air quality violation. Considering that criterion, the project is consistent with the AQMP. The project complies with the growth assumptions in the AQMP. The project will comply with applicable control measures in the AQMP. Therefore, the project is consistent with all three criteria.
Level of Significance Before Mitigation
Less than significant impact. The project would comply with the EDAQMD’s control measures and would not exceed EDAQMD thresholds of significance for ROG or NOx, nor contribute to a CO violation, nor expose sensitive receptors to substantial pollutant concentrations.
Mitigation Measures
No mitigation is required.
Level of Significance After Mitigation
Less than significant impact.
4.7 - Cumulative Impacts
Section 3.1.5, Significance Criteria for Determining Cumulative Impacts, describes the significant criteria presented in the Guide to determine the cumulative impacts of a project, which are:
• If a project requires a change in land use designation and the new designation would create more emissions that the existing designation;
• If a project would individually exceed the significance criteria in the Guide;
• For projects determined to be significant, the lead agency does not require emission reduction measures; and
• If the project is located in a jurisdiction that does not implement reduction measures derived from the AQMP.
The project is in an area that implements the emission reduction measures contained in and/or derived from the AQMP and the project individually does not exceed the significance criteria for ROG or NOx in the Guide. Therefore, the project does not have a significant cumulative effect.
Level of Significance Before Mitigation
Less than significant impact.
Mitigation Measures
No mitigation is required.

County of El Dorado Department of Transportation Diamond Springs Parkway Project Air Quality Impact Analysis Report Impact Analysis
Michael Brandman Associates 51 H:\Client (PN-JN)\1173\11730025\AQ\11730025 AQ Report DOT DS Parkway.doc
Level of Significance After Mitigation
Less than significant impact.
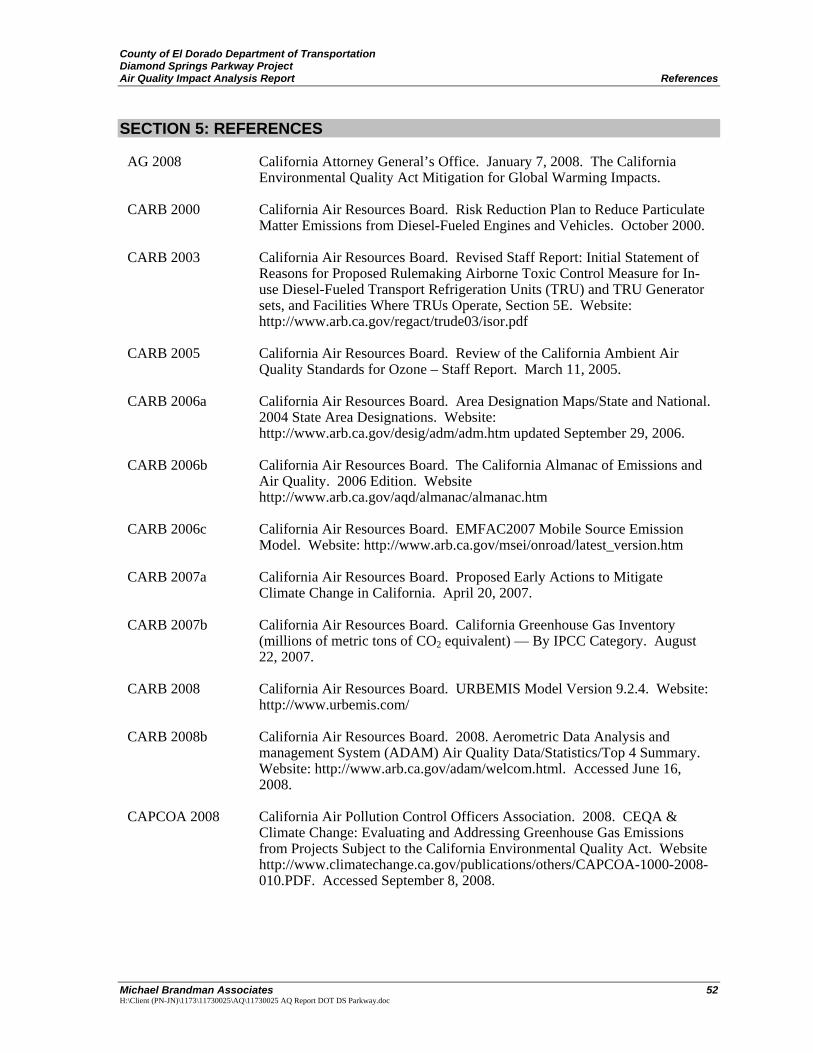
County of El Dorado Department of Transportation Diamond Springs Parkway Project Air Quality Impact Analysis Report References
Michael Brandman Associates 52 H:\Client (PN-JN)\1173\11730025\AQ\11730025 AQ Report DOT DS Parkway.doc
SECTION 5: REFERENCES
AG 2008 California Attorney General’s Office. January 7, 2008. The California Environmental Quality Act Mitigation for Global Warming Impacts.
CARB 2000 California Air Resources Board. Risk Reduction Plan to Reduce Particulate Matter Emissions from Diesel-Fueled Engines and Vehicles. October 2000.
CARB 2003 California Air Resources Board. Revised Staff Report: Initial Statement of Reasons for Proposed Rulemaking Airborne Toxic Control Measure for In-use Diesel-Fueled Transport Refrigeration Units (TRU) and TRU Generator sets, and Facilities Where TRUs Operate, Section 5E. Website: http://www.arb.ca.gov/regact/trude03/isor.pdf
CARB 2005 California Air Resources Board. Review of the California Ambient Air Quality Standards for Ozone – Staff Report. March 11, 2005.
CARB 2006a California Air Resources Board. Area Designation Maps/State and National. 2004 State Area Designations. Website: http://www.arb.ca.gov/desig/adm/adm.htm updated September 29, 2006.
CARB 2006b California Air Resources Board. The California Almanac of Emissions and Air Quality. 2006 Edition. Website http://www.arb.ca.gov/aqd/almanac/almanac.htm
CARB 2006c California Air Resources Board. EMFAC2007 Mobile Source Emission Model. Website: http://www.arb.ca.gov/msei/onroad/latest_version.htm
CARB 2007a California Air Resources Board. Proposed Early Actions to Mitigate Climate Change in California. April 20, 2007.
CARB 2007b California Air Resources Board. California Greenhouse Gas Inventory (millions of metric tons of CO2 equivalent) — By IPCC Category. August 22, 2007.
CARB 2008 California Air Resources Board. URBEMIS Model Version 9.2.4. Website: http://www.urbemis.com/
CARB 2008b California Air Resources Board. 2008. Aerometric Data Analysis and management System (ADAM) Air Quality Data/Statistics/Top 4 Summary. Website: http://www.arb.ca.gov/adam/welcom.html. Accessed June 16, 2008.
CAPCOA 2008 California Air Pollution Control Officers Association. 2008. CEQA & Climate Change: Evaluating and Addressing Greenhouse Gas Emissions from Projects Subject to the California Environmental Quality Act. Website http://www.climatechange.ca.gov/publications/others/CAPCOA-1000-2008-010.PDF. Accessed September 8, 2008.

County of El Dorado Department of Transportation Diamond Springs Parkway Project Air Quality Impact Analysis Report References
Michael Brandman Associates 53 H:\Client (PN-JN)\1173\11730025\AQ\11730025 AQ Report DOT DS Parkway.doc
CAT 2006 State of California, Environmental Protection Agency, Climate Action Team. March 2006. Climate Action Team Report to Governor Schwarzenegger and the California Legislature. Website: www.climatechange.ca.gov/climate_action_team/reports/index.html. Accessed April 8, 2008.
CC 2006 Clean Air, Cool Planet. A Consumer’s Guide to Retail Carbon Offset Providers. 2006. Website: www.cleanaircoolplanet.org/ConsumersGuidetoCarbonOffsets.pdf. Accessed April 8, 2008.
CEC 2006 California Energy Commission. December 2006. Inventory of California Greenhouse Gas Emissions and Sinks: 1990 to 2004. Staff Final Report. CEC-600-2006-013-SF.
EDAQMD 2002 El Dorado County Air Quality Management District, First Edition. 2002. Guide to Air Quality Assessment - Determining Significance of Air Quality Impacts Under the California Environmental Quality Act. February.
EDAQMD 2008 Asbestos Parcel Lookup El Dorado County AQMD Website http://www.co.el-dorado.ca.us/emd/apcd/gpchecklist.asp
EDC 2003 El Dorado County. 2003. El Dorado County General Plan EIR Air Quality.
EDC 2004 El Dorado County. 2004. El Dorado County General Plan. As amended, 2008.
EPA 1995 U.S. Environmental Protection Agency. Integrated Risk Information System.1,1,1,2-Tetrafluoroethane (CASRN 811-97-2). Website: http://cfpub.epa.gov/iris/quickview.cfm?substance_nmbr=0656. Accessed April 8, 2008.
EPA 1999 U.S. Environmental Protection Agency. Fact Sheet. Final Regional Haze Regulations for Protection of Visibility in National Parks and Wilderness Areas. 1999.
EPA 2003 U.S. Environmental Protection Agency, Office of Air and Radiation. June 2003. Ozone: Good up high bad nearby. EPA-451-K-03-001. Website: www.epa.gov/air/ozonepollution/pdfs/ozonegb.pdf. Accessed April 8, 2008.
EPA 2003b U.S. Environmental Protection Agency, Office of Air and Radiation. September 2003. Particulate Pollution and Your Health. EPA-452/F-03-001
EPA 2006a U.S. Environmental Protection Agency, Office of Atmospheric Programs. April 2006. The U.S. Inventory of Greenhouse Gas Emissions and Sinks: Fast Facts. http://epa.gov/climatechange/emissions/downloads06/06FastFacts.pdf, Accessed April 8, 2008.
EPA 2006b U.S. Environmental Protection Agency. 2006. High Global Warming Potential Gases. Science. Website: http://www.epa.gov/highgwp/scientific.html. Accessed April 8, 2008.

County of El Dorado Department of Transportation Diamond Springs Parkway Project Air Quality Impact Analysis Report References
Michael Brandman Associates 54 H:\Client (PN-JN)\1173\11730025\AQ\11730025 AQ Report DOT DS Parkway.doc
EPA 2008b U.S. Environmental Protection Agency. 2008. Green Book Nonattainment Areas for Criteria Pollutants. Website: www.epa.gov/air/oaqps/greenbk/. Accessed September 22, 2008.
IPCC 2001 Intergovernmental Panel on Climate Change. Climate Change 2001: The Scientific Basis. Contribution of Working Group I to the Third Assessment Report of the Intergovernmental Panel on Climate Change. Houghton, J.T., Y. Ding, D.J. Griggs, M. Noguer, P.J. van der Linden, X. Dai, K. Maskell, and C.A. Johnson, eds. Cambridge University Press, Cambridge, United Kingdom and New York, NY, USA, 881 pp. www.grida.no/CLIMATE/IPCC_TAR/WG1/index.htm, Accessed April 8, 2008.
IPCC 2007 Summary for Policymakers. In: Climate Change 2007: The Physical Science Basis. Contribution of Working Group I to the Fourth Assessment Report of the Intergovernmental Panel on Climate Change (Solomon, S., D. Qin, M. Manning, Z. Chen, M. Marquis, KOBE. Averyt, M. Tignor and H.L. Miller [eds.]). Cambridge University Press, Cambridge, United Kingdom and New York, NY, USA. Website: http://www.ipcc.ch/pdf/assessment-report/ar4/wg1/ar4-wg1-spm.pdf. Accessed April 8, 2008.
JAC 2002 Jacobson, Mark Z. Atmospheric Pollution, History, Science, and Regulation. Cambridge University Press, New York. 2002.
KHA 2009 Kimley Horn and Associates, Inc. Traffic Impact Analysis Report for the Diamond Springs Parkway Project. March 26, 2009.
NIOSH 1989 Department of Health and Human Services, Centers for Disease Control & Prevention, the National Institute for Occupational Safety and Health. Preventing Death from Excessive Exposure to Chlorofluorocarbon 113 (CFC-113). NIOSH ALERT: May 1989. DHHS (NIOSH) Publication No. 89-109. Website: http://www.cdc.gov/niosh/89-109.html. Accessed April 8, 2008.
NIOSH 2005 Department of Health and Human Services, Centers for Disease Control & Prevention, the National Institute for Occupational Safety and Health. Carbon Dioxide. September 2005. Website: http://www.cdc.gov/niosh/npg/npgd0103.html, Accessed April 8, 2008.
NRC 2005 National Research Council of the National Academies, Climate Research Committee, Board on Atmospheric Sciences and Climate, Committee on Radiative Forcing Effects on Climate. Radiative Forcing of Climate Change: Expanding the Concept and Addressing Uncertainties. The National Academies Press, Washington, D.C.
OPR 2008 Governor’s Office of Planning and Research. Technical Advisory. CEQA AND CLIMATE CHANGE: Addressing Climate Change Through California Environmental Quality Act (CEQA) Review. June 19, 2008. Website: www.opr.ca.gov/index.php?a=ceqa/index.html

County of El Dorado Department of Transportation Diamond Springs Parkway Project Air Quality Impact Analysis Report
Michael Brandman Associates H:\Client (PN-JN)\1173\11730025\AQ\11730025 AQ Report DOT DS Parkway.doc
Appendix A: Road Construction Model Output

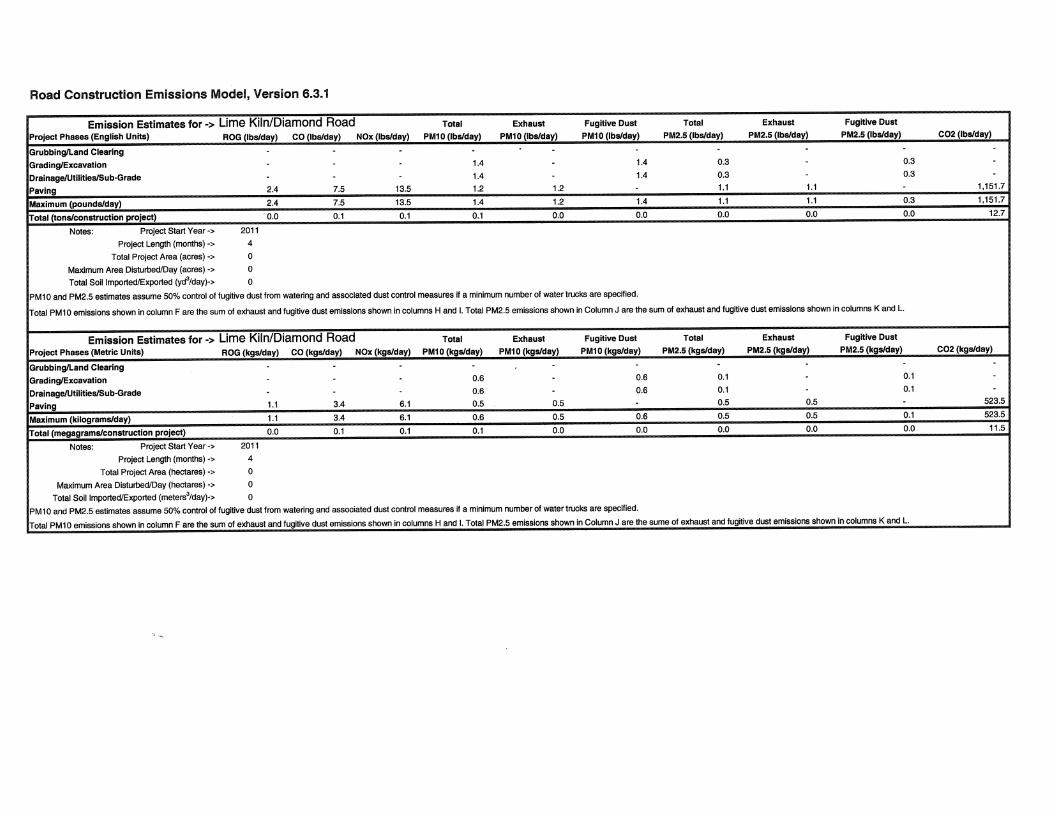


County of El Dorado Department of Transportation Diamond Springs Parkway Project Air Quality Impact Analysis Report
Michael Brandman Associates H:\Client (PN-JN)\1173\11730025\AQ\11730025 AQ Report DOT DS Parkway.doc
Appendix B: CO Modeling Output

Diamond Springs Parkway Project CO Modeling Results
1-hour background 1.328-hour background 0.92Persistence Factor 0.7
IntersectionCaline4 Output
(1-hour)1-hour
(with background)
8-hour (without
background)8-hour
(with background)2010 Diamond Road&Lime Kiln/Black Rice Road 1.8 3.1 1.26 2.22010 Diamond Road&Pleasant Valley Road 1.9 3.2 1.33 2.32020 Diamond Road&Lime Kiln/Black Rice Road 0.7 2.0 0.49 1.42020 Diamond Springs Parkway&Missouri Flat Road 0.5 1.8 0.35 1.32020 Diamond Springs Parkway&Throwita Way 0.5 1.8 0.35 1.32030 Diamond Road&Lime Kiln/Black Rice Road 0.4 1.7 0.28 1.22030 Diamond Springs Parkway&Missouri Flat Road 0.4 1.7 0.28 1.22030 Diamond Springs Parkway&Throwita Way 0.3 1.6 0.21 1.1

2010_DiamondRd&LimeKiln-BlackRice_Output.txt CALINE4: CALIFORNIA LINE SOURCE DISPERSION MODEL JUNE 1989 VERSION PAGE 1 JOB: 2010 Diamond Road & Lime Kiln/Black Rice RUN: Hour 1 (WORST CASE ANGLE) POLLUTANT: Carbon Monoxide I. SITE VARIABLES U= 1.0 M/S Z0= 100. CM ALT= 549. (M) BRG= WORST CASE VD= .0 CM/S CLAS= 7 (G) VS= .0 CM/S MIXH= 1000. M AMB= .0 PPM SIGTH= 5. DEGREES TEMP= 6.1 DEGREE (C)
II. LINK VARIABLES LINK * LINK COORDINATES (M) * EF H W DESCRIPTION * X1 Y1 X2 Y2 * TYPE VPH (G/MI) (M) (M) ----------------*-------------------------*------------------------------ A. NB External * 4 0 4 600 * AG 653 5.0 .0 10.0 B. NB Approach * 4 600 4 752 * AG 613 8.7 .0 10.0 C. NB Depart * 4 752 4 904 * AG 778 8.7 .0 10.0 D. NB External * 4 904 4 1504 * AG 778 5.0 .0 10.0 E. NB Left * 4 600 2 752 * AG 40 8.7 .0 10.0 F. SB Left * 0 904 2 752 * AG 25 8.7 .0 10.0 G. SB External * 0 1504 0 904 * AG 779 5.0 .0 10.0 H. SB Approach * 0 904 0 752 * AG 754 8.7 .0 10.0 I. SB Depart * 0 752 0 600 * AG 740 8.7 .0 10.0 J. SB External * 0 600 0 0 * AG 740 5.0 .0 10.0 K. EB External * -750 750 -150 750 * AG 187 5.0 .0 10.0 L. EB Approach * -150 750 2 750 * AG 37 8.7 .0 10.0 M. EB Depart * 2 750 154 750 * AG 47 8.7 .0 10.0 N. EB External * 154 750 754 750 * AG 47 5.0 .0 10.0 O. WB External * 754 754 154 754 * AG 44 5.0 .0 10.0 P. WB Approach * 154 754 2 754 * AG 38 8.7 .0 10.0 Q. WB Depart * 2 754 -150 754 * AG 98 8.7 .0 10.0 R. WB External * -150 754 -750 754 * AG 98 5.0 .0 10.0 S. EB Left * -150 750 2 752 * AG 150 8.7 .0 10.0 T. WB Left * 154 754 2 752 * AG 6 8.7 .0 10.0
CALINE4: CALIFORNIA LINE SOURCE DISPERSION MODEL JUNE 1989 VERSION PAGE 2 JOB: 2010 Diamond Road & Lime Kiln/Black Rice RUN: Hour 1 (WORST CASE ANGLE) POLLUTANT: Carbon Monoxide III. RECEPTOR LOCATIONS * COORDINATES (M) RECEPTOR * X Y Z ------------*--------------------- 1. Receptor * -5 745 2.0 2. Receptor * 8 745 2.0 3. Receptor * 8 758 2.0 4. Receptor * -5 758 2.0
IV. MODEL RESULTS (WORST CASE WIND ANGLE ) * * PRED * CONC/LINK * BRG * CONC * (PPM) RECEPTOR * (DEG) * (PPM) * A B C D E F G H-------------*-------*-------*---------------------------------------- 1. Receptor * 4. * 1.7 * .0 .0 .4 .1 .0 .0 .0 .8 2. Receptor * 357. * 1.8 * .0 .1 .9 .1 .0 .0 .2 .4 3. Receptor * 183. * 1.6 * .1 .7 .1 .0 .0 .0 .0 .0 4. Receptor * 176. * 1.6 * .1 .3 .0 .0 .0 .0 .0 .1 * CONC/LINK * (PPM) RECEPTOR * I J K L M N O P Q R S T ------------*------------------------------------------------------------ 1. Receptor * .1 .0 .0 .0 .0 .0 .0 .0 .0 .0 .0 .0 2. Receptor * .0 .0 .0 .0 .0 .0 .0 .0 .0 .0 .0 .0 3. Receptor * .4 .1 .0 .0 .0 .0 .0 .0 .0 .0 .0 .0 4. Receptor * .8 .0 .0 .0 .0 .0 .0 .0 .0 .0 .0 .0
Page 1

2010_DiamondRd&PleasantValley_Output.txt CALINE4: CALIFORNIA LINE SOURCE DISPERSION MODEL JUNE 1989 VERSION PAGE 1 JOB: 2010 Diamond Road & Pleasant Valley Road RUN: Hour 1 (WORST CASE ANGLE) POLLUTANT: Carbon Monoxide I. SITE VARIABLES U= 1.0 M/S Z0= 100. CM ALT= 549. (M) BRG= WORST CASE VD= .0 CM/S CLAS= 7 (G) VS= .0 CM/S MIXH= 1000. M AMB= .0 PPM SIGTH= 5. DEGREES TEMP= 6.1 DEGREE (C) II. LINK VARIABLES LINK * LINK COORDINATES (M) * EF H W DESCRIPTION * X1 Y1 X2 Y2 * TYPE VPH (G/MI) (M) (M) ----------------*-------------------------*------------------------------ A. NB External * 4 0 4 600 * AG 124 5.0 .0 10.0 B. NB Approach * 4 600 4 755 * AG 89 8.7 .0 10.0 C. NB Depart * 4 755 4 909 * AG 485 8.7 .0 10.0 D. NB External * 4 909 4 1509 * AG 485 5.0 .0 10.0 E. NB Left * 4 600 2 755 * AG 35 8.7 .0 10.0 F. SB Left * 0 909 2 755 * AG 750 8.7 .0 10.0 G. SB External * 0 1509 0 909 * AG 915 5.0 .0 10.0 H. SB Approach * 0 909 0 755 * AG 165 8.7 .0 10.0 I. SB Depart * 0 755 0 600 * AG 144 8.7 .0 10.0 J. SB External * 0 600 0 0 * AG 144 5.0 .0 10.0 K. EB External * -750 750 -150 750 * AG 540 5.0 .0 12.2 L. EB Approach * -150 750 2 750 * AG 390 8.7 .0 12.2 M. EB Depart * 2 750 154 750 * AG 1126 8.7 .0 12.2 N. EB External * 154 750 754 750 * AG 1126 5.0 .0 12.2 O. WB External * 754 759 154 759 * AG 536 5.0 .0 12.2 P. WB Approach * 154 759 2 759 * AG 517 8.7 .0 12.2 Q. WB Depart * 2 759 -150 759 * AG 360 8.7 .0 12.2 R. WB External * -150 759 -750 759 * AG 360 5.0 .0 12.2 S. EB Left * -150 750 2 755 * AG 150 8.7 .0 12.2 T. WB Left * 154 759 2 755 * AG 19 8.7 .0 12.2
CALINE4: CALIFORNIA LINE SOURCE DISPERSION MODEL JUNE 1989 VERSION PAGE 2 JOB: 2010 Diamond Road & Pleasant Valley Road RUN: Hour 1 (WORST CASE ANGLE) POLLUTANT: Carbon Monoxide III. RECEPTOR LOCATIONS * COORDINATES (M) RECEPTOR * X Y Z ------------*--------------------- 1. Receptor * -5 742 2.0 2. Receptor * 8 742 2.0 3. Receptor * 8 767 2.0 4. Receptor * -5 767 2.0 IV. MODEL RESULTS (WORST CASE WIND ANGLE ) * * PRED * CONC/LINK * BRG * CONC * (PPM) RECEPTOR * (DEG) * (PPM) * A B C D E F G H-------------*-------*-------*---------------------------------------- 1. Receptor * 4. * 1.5 * .0 .0 .3 .0 .0 .6 .1 .2 2. Receptor * 356. * 1.9 * .0 .0 .5 .0 .0 .6 .1 .1 3. Receptor * 356. * 1.6 * .0 .0 .7 .0 .0 .6 .2 .1 4. Receptor * 98. * 1.3 * .0 .0 .1 .0 .0 .2 .0 .0 * CONC/LINK * (PPM) RECEPTOR * I J K L M N O P Q R S T ------------*------------------------------------------------------------ 1. Receptor * .0 .0 .0 .1 .0 .0 .0 .0 .0 .0 .0 .0 2. Receptor * .0 .0 .0 .0 .3 .0 .0 .1 .0 .0 .0 .0 3. Receptor * .0 .0 .0 .0 .0 .0 .0 .0 .0 .0 .0 .0 4. Receptor * .0 .0 .0 .0 .4 .0 .0 .4 .0 .0 .0 .0
Page 1

2020_DiamondRd&LimeKiln-BlackRice_Output.txt CALINE4: CALIFORNIA LINE SOURCE DISPERSION MODEL JUNE 1989 VERSION PAGE 1 JOB: 2020 Diamond Road & Lime Kiln-Black Rice RUN: Hour 1 (WORST CASE ANGLE) POLLUTANT: Carbon Monoxide I. SITE VARIABLES U= 1.0 M/S Z0= 100. CM ALT= 549. (M) BRG= WORST CASE VD= .0 CM/S CLAS= 7 (G) VS= .0 CM/S MIXH= 1000. M AMB= .0 PPM SIGTH= 5. DEGREES TEMP= 6.1 DEGREE (C) II. LINK VARIABLES LINK * LINK COORDINATES (M) * EF H W DESCRIPTION * X1 Y1 X2 Y2 * TYPE VPH (G/MI) (M) (M) ----------------*-------------------------*------------------------------ A. NB External * 4 0 4 600 * AG 744 1.9 .0 10.0 B. NB Approach * 4 600 4 752 * AG 700 2.9 .0 10.0 C. NB Depart * 4 752 4 904 * AG 889 2.9 .0 10.0 D. NB External * 4 904 4 1504 * AG 889 1.9 .0 10.0 E. NB Left * 4 600 2 752 * AG 44 2.9 .0 10.0 F. SB Left * 0 904 2 752 * AG 23 2.9 .0 10.0 G. SB External * 0 1504 0 904 * AG 903 1.9 .0 10.0 H. SB Approach * 0 904 0 752 * AG 880 2.9 .0 10.0 I. SB Depart * 0 752 0 600 * AG 854 2.9 .0 10.0 J. SB External * 0 600 0 0 * AG 854 1.9 .0 10.0 K. EB External * -750 750 -150 750 * AG 216 1.9 .0 10.0 L. EB Approach * -150 750 2 750 * AG 41 2.9 .0 10.0 M. EB Depart * 2 750 154 750 * AG 69 2.9 .0 10.0 N. EB External * 154 750 754 750 * AG 69 1.9 .0 10.0 O. WB External * 754 754 154 754 * AG 67 1.9 .0 10.0 P. WB Approach * 154 754 2 754 * AG 59 2.9 .0 10.0 Q. WB Depart * 2 754 -150 754 * AG 118 2.9 .0 10.0 R. WB External * -150 754 -750 754 * AG 118 1.9 .0 10.0 S. EB Left * -150 750 2 752 * AG 175 2.9 .0 10.0 T. WB Left * 154 754 2 752 * AG 8 2.9 .0 10.0
CALINE4: CALIFORNIA LINE SOURCE DISPERSION MODEL JUNE 1989 VERSION PAGE 2 JOB: 2020 Diamond Road & Lime Kiln-Black Rice RUN: Hour 1 (WORST CASE ANGLE) POLLUTANT: Carbon Monoxide III. RECEPTOR LOCATIONS * COORDINATES (M) RECEPTOR * X Y Z ------------*--------------------- 1. Receptor * -5 745 2.0 2. Receptor * 8 745 2.0 3. Receptor * 8 758 2.0 4. Receptor * -5 758 2.0 IV. MODEL RESULTS (WORST CASE WIND ANGLE ) * * PRED * CONC/LINK * BRG * CONC * (PPM) RECEPTOR * (DEG) * (PPM) * A B C D E F G H-------------*-------*-------*---------------------------------------- 1. Receptor * 4. * .6 * .0 .0 .1 .0 .0 .0 .0 .3 2. Receptor * 357. * .7 * .0 .0 .3 .0 .0 .0 .0 .1 3. Receptor * 183. * .6 * .0 .3 .0 .0 .0 .0 .0 .0 4. Receptor * 176. * .6 * .0 .1 .0 .0 .0 .0 .0 .0 * CONC/LINK * (PPM) RECEPTOR * I J K L M N O P Q R S T ------------*------------------------------------------------------------ 1. Receptor * .0 .0 .0 .0 .0 .0 .0 .0 .0 .0 .0 .0 2. Receptor * .0 .0 .0 .0 .0 .0 .0 .0 .0 .0 .0 .0 3. Receptor * .1 .0 .0 .0 .0 .0 .0 .0 .0 .0 .0 .0 4. Receptor * .3 .0 .0 .0 .0 .0 .0 .0 .0 .0 .0 .0
Page 1

2020_Parkway&MissFlatRoad_Output.txt CALINE4: CALIFORNIA LINE SOURCE DISPERSION MODEL JUNE 1989 VERSION PAGE 1 JOB: 2020 Diamond Springs Parkway & Missouri RUN: Hour 1 (WORST CASE ANGLE) POLLUTANT: Carbon Monoxide I. SITE VARIABLES U= 1.0 M/S Z0= 100. CM ALT= 549. (M) BRG= WORST CASE VD= .0 CM/S CLAS= 7 (G) VS= .0 CM/S MIXH= 1000. M AMB= .0 PPM SIGTH= 5. DEGREES TEMP= 6.1 DEGREE (C) II. LINK VARIABLES LINK * LINK COORDINATES (M) * EF H W DESCRIPTION * X1 Y1 X2 Y2 * TYPE VPH (G/MI) (M) (M) ----------------*-------------------------*------------------------------ A. NB External * 13 0 13 600 * AG 199 1.9 .0 15.8 B. NB Approach * 13 600 13 756 * AG 151 2.9 .0 15.8 C. NB Depart * 13 756 13 913 * AG 44 2.9 .0 15.8 D. NB External * 13 913 13 1513 * AG 44 1.9 .0 15.8 E. NB Left * 13 600 6 756 * AG 48 2.9 .0 15.8 F. SB Left * 0 913 6 756 * AG 2 2.9 .0 15.8 G. SB External * 0 1513 0 913 * AG 26 1.9 .0 15.8 H. SB Approach * 0 913 0 756 * AG 24 2.9 .0 15.8 I. SB Depart * 0 756 0 600 * AG 611 2.9 .0 15.8 J. SB External * 0 600 0 0 * AG 611 1.9 .0 15.8 K. EB External * -750 750 -150 750 * AG 1038 1.9 .0 15.8 L. EB Approach * -150 750 6 750 * AG 1026 2.9 .0 15.8 M. EB Depart * 6 750 163 750 * AG 798 2.9 .0 15.8 N. EB External * 163 750 763 750 * AG 798 1.9 .0 15.8 O. WB External * 763 763 163 763 * AG 1213 1.9 .0 15.8 P. WB Approach * 163 763 6 763 * AG 980 2.9 .0 15.8 Q. WB Depart * 6 763 -150 763 * AG 1023 2.9 .0 15.8 R. WB External * -150 763 -750 763 * AG 1023 1.9 .0 15.8 S. EB Left * -150 750 6 756 * AG 12 2.9 .0 15.8 T. WB Left * 163 763 6 756 * AG 233 2.9 .0 15.8
CALINE4: CALIFORNIA LINE SOURCE DISPERSION MODEL JUNE 1989 VERSION PAGE 2 JOB: 2020 Diamond Springs Parkway & Missouri RUN: Hour 1 (WORST CASE ANGLE) POLLUTANT: Carbon Monoxide III. RECEPTOR LOCATIONS * COORDINATES (M) RECEPTOR * X Y Z ------------*--------------------- 1. Receptor * -9 741 2.0 2. Receptor * 22 741 2.0 3. Receptor * 22 772 2.0 4. Receptor * -9 772 2.0 IV. MODEL RESULTS (WORST CASE WIND ANGLE ) * * PRED * CONC/LINK * BRG * CONC * (PPM) RECEPTOR * (DEG) * (PPM) * A B C D E F G H-------------*-------*-------*---------------------------------------- 1. Receptor * 83. * .5 * .0 .0 .0 .0 .0 .0 .0 .0 2. Receptor * 276. * .5 * .0 .0 .0 .0 .0 .0 .0 .0 3. Receptor * 264. * .5 * .0 .0 .0 .0 .0 .0 .0 .0 4. Receptor * 96. * .5 * .0 .0 .0 .0 .0 .0 .0 .0 * CONC/LINK * (PPM) RECEPTOR * I J K L M N O P Q R S T ------------*------------------------------------------------------------ 1. Receptor * .0 .0 .0 .0 .2 .0 .0 .0 .0 .0 .0 .0 2. Receptor * .0 .0 .0 .3 .0 .0 .0 .0 .0 .0 .0 .0 3. Receptor * .0 .0 .0 .0 .0 .0 .0 .0 .3 .0 .0 .0 4. Receptor * .0 .0 .0 .0 .0 .0 .0 .2 .0 .0 .0 .0
Page 1

2020_Parkway&ThrowitaWay_Output.txt CALINE4: CALIFORNIA LINE SOURCE DISPERSION MODEL JUNE 1989 VERSION PAGE 1 JOB: 2020 Diamond Springs Parkway & Throwita RUN: Hour 1 (WORST CASE ANGLE) POLLUTANT: Carbon Monoxide I. SITE VARIABLES U= 1.0 M/S Z0= 100. CM ALT= 549. (M) BRG= WORST CASE VD= .0 CM/S CLAS= 7 (G) VS= .0 CM/S MIXH= 1000. M AMB= .0 PPM SIGTH= 5. DEGREES TEMP= 6.1 DEGREE (C) II. LINK VARIABLES LINK * LINK COORDINATES (M) * EF H W DESCRIPTION * X1 Y1 X2 Y2 * TYPE VPH (G/MI) (M) (M) ----------------*-------------------------*------------------------------ A. NB External * 4 0 4 600 * AG 75 1.9 .0 10.0 B. NB Approach * 4 600 4 756 * AG 31 2.9 .0 10.0 C. NB Depart * 4 756 4 913 * AG 74 2.9 .0 10.0 D. NB External * 4 913 4 1513 * AG 74 1.9 .0 10.0 E. NB Left * 4 600 2 756 * AG 44 2.9 .0 10.0 F. SB Left * 0 913 2 756 * AG 24 2.9 .0 10.0 G. SB External * 0 1513 0 913 * AG 52 1.9 .0 10.0 H. SB Approach * 0 913 0 756 * AG 28 2.9 .0 10.0 I. SB Depart * 0 756 0 600 * AG 105 2.9 .0 10.0 J. SB External * 0 600 0 0 * AG 105 1.9 .0 10.0 K. EB External * -750 750 -150 750 * AG 798 1.9 .0 15.8 L. EB Approach * -150 750 2 750 * AG 754 2.9 .0 15.8 M. EB Depart * 2 750 154 750 * AG 716 2.9 .0 15.8 N. EB External * 154 750 754 750 * AG 716 1.9 .0 15.8 O. WB External * 754 763 154 763 * AG 1183 1.9 .0 15.8 P. WB Approach * 154 763 2 763 * AG 1163 2.9 .0 15.8 Q. WB Depart * 2 763 -150 763 * AG 1213 2.9 .0 15.8 R. WB External * -150 763 -750 763 * AG 1213 1.9 .0 15.8 S. EB Left * -150 750 2 756 * AG 44 2.9 .0 15.8 T. WB Left * 154 763 2 756 * AG 20 2.9 .0 15.8
CALINE4: CALIFORNIA LINE SOURCE DISPERSION MODEL JUNE 1989 VERSION PAGE 2 JOB: 2020 Diamond Springs Parkway & Throwita RUN: Hour 1 (WORST CASE ANGLE) POLLUTANT: Carbon Monoxide III. RECEPTOR LOCATIONS * COORDINATES (M) RECEPTOR * X Y Z ------------*--------------------- 1. Receptor * -5 741 2.0 2. Receptor * 8 741 2.0 3. Receptor * 8 772 2.0 4. Receptor * -5 772 2.0
IV. MODEL RESULTS (WORST CASE WIND ANGLE ) * * PRED * CONC/LINK * BRG * CONC * (PPM) RECEPTOR * (DEG) * (PPM) * A B C D E F G H-------------*-------*-------*---------------------------------------- 1. Receptor * 84. * .4 * .0 .0 .0 .0 .0 .0 .0 .0 2. Receptor * 276. * .4 * .0 .0 .0 .0 .0 .0 .0 .0 3. Receptor * 264. * .5 * .0 .0 .0 .0 .0 .0 .0 .0 4. Receptor * 264. * .5 * .0 .0 .0 .0 .0 .0 .0 .0 * CONC/LINK * (PPM) RECEPTOR * I J K L M N O P Q R S T ------------*------------------------------------------------------------ 1. Receptor * .0 .0 .0 .0 .2 .0 .0 .0 .0 .0 .0 .0 2. Receptor * .0 .0 .0 .2 .0 .0 .0 .0 .0 .0 .0 .0 3. Receptor * .0 .0 .0 .0 .0 .0 .0 .0 .3 .0 .0 .0 4. Receptor * .0 .0 .0 .0 .0 .0 .0 .0 .3 .0 .0 .0
Page 1

2030_DiamondRd&LimeKiln-BlackRice_Output.txt CALINE4: CALIFORNIA LINE SOURCE DISPERSION MODEL JUNE 1989 VERSION PAGE 1 JOB: 2030 Diamond Road & Lime Kiln-Black Rice RUN: Hour 1 (WORST CASE ANGLE) POLLUTANT: Carbon Monoxide I. SITE VARIABLES U= 1.0 M/S Z0= 100. CM ALT= 549. (M) BRG= WORST CASE VD= .0 CM/S CLAS= 7 (G) VS= .0 CM/S MIXH= 1000. M AMB= .0 PPM SIGTH= 5. DEGREES TEMP= 6.1 DEGREE (C) II. LINK VARIABLES LINK * LINK COORDINATES (M) * EF H W DESCRIPTION * X1 Y1 X2 Y2 * TYPE VPH (G/MI) (M) (M) ----------------*-------------------------*------------------------------ A. NB External * 4 0 4 600 * AG 835 1.2 .0 10.0 B. NB Approach * 4 600 4 752 * AG 787 1.7 .0 10.0 C. NB Depart * 4 752 4 904 * AG 1000 1.7 .0 10.0 D. NB External * 4 904 4 1504 * AG 1000 1.2 .0 10.0 E. NB Left * 4 600 2 752 * AG 48 1.7 .0 10.0 F. SB Left * 0 904 2 752 * AG 20 1.7 .0 10.0 G. SB External * 0 1504 0 904 * AG 1025 1.2 .0 10.0 H. SB Approach * 0 904 0 752 * AG 1005 1.7 .0 10.0 I. SB Depart * 0 752 0 600 * AG 965 1.7 .0 10.0 J. SB External * 0 600 0 0 * AG 965 1.2 .0 10.0 K. EB External * -750 750 -150 750 * AG 244 1.2 .0 10.0 L. EB Approach * -150 750 2 750 * AG 44 1.7 .0 10.0 M. EB Depart * 2 750 154 750 * AG 90 1.7 .0 10.0 N. EB External * 154 750 754 750 * AG 90 1.2 .0 10.0 O. WB External * 754 754 154 754 * AG 89 1.2 .0 10.0 P. WB Approach * 154 754 2 754 * AG 80 1.7 .0 10.0 Q. WB Depart * 2 754 -150 754 * AG 138 1.7 .0 10.0 R. WB External * -150 754 -750 754 * AG 138 1.2 .0 10.0 S. EB Left * -150 750 2 752 * AG 200 1.7 .0 10.0 T. WB Left * 154 754 2 752 * AG 9 1.7 .0 10.0
CALINE4: CALIFORNIA LINE SOURCE DISPERSION MODEL JUNE 1989 VERSION PAGE 2 JOB: 2030 Diamond Road & Lime Kiln-Black Rice RUN: Hour 1 (WORST CASE ANGLE) POLLUTANT: Carbon Monoxide III. RECEPTOR LOCATIONS * COORDINATES (M) RECEPTOR * X Y Z ------------*--------------------- 1. Receptor * -5 745 2.0 2. Receptor * 8 745 2.0 3. Receptor * 8 758 2.0 4. Receptor * -5 758 2.0 IV. MODEL RESULTS (WORST CASE WIND ANGLE ) * * PRED * CONC/LINK * BRG * CONC * (PPM) RECEPTOR * (DEG) * (PPM) * A B C D E F G H-------------*-------*-------*---------------------------------------- 1. Receptor * 4. * .4 * .0 .0 .0 .0 .0 .0 .0 .2 2. Receptor * 357. * .4 * .0 .0 .2 .0 .0 .0 .0 .0 3. Receptor * 183. * .4 * .0 .2 .0 .0 .0 .0 .0 .0 4. Receptor * 176. * .4 * .0 .0 .0 .0 .0 .0 .0 .0 * CONC/LINK * (PPM) RECEPTOR * I J K L M N O P Q R S T ------------*------------------------------------------------------------ 1. Receptor * .0 .0 .0 .0 .0 .0 .0 .0 .0 .0 .0 .0 2. Receptor * .0 .0 .0 .0 .0 .0 .0 .0 .0 .0 .0 .0 3. Receptor * .0 .0 .0 .0 .0 .0 .0 .0 .0 .0 .0 .0 4. Receptor * .2 .0 .0 .0 .0 .0 .0 .0 .0 .0 .0 .0
Page 1

2030_DiamondRd&PleasantValley_Output.txt CALINE4: CALIFORNIA LINE SOURCE DISPERSION MODEL JUNE 1989 VERSION PAGE 1 JOB: 2030 Diamond Road & Pleasant Valley Road RUN: Hour 1 (WORST CASE ANGLE) POLLUTANT: Carbon Monoxide I. SITE VARIABLES U= 1.0 M/S Z0= 100. CM ALT= 549. (M) BRG= WORST CASE VD= .0 CM/S CLAS= 7 (G) VS= .0 CM/S MIXH= 1000. M AMB= .0 PPM SIGTH= 5. DEGREES TEMP= 6.1 DEGREE (C) II. LINK VARIABLES LINK * LINK COORDINATES (M) * EF H W DESCRIPTION * X1 Y1 X2 Y2 * TYPE VPH (G/MI) (M) (M) ----------------*-------------------------*------------------------------ A. NB External * 4 0 4 600 * AG 147 1.2 .0 10.0 B. NB Approach * 4 600 4 755 * AG 102 1.7 .0 10.0 C. NB Depart * 4 755 4 909 * AG 790 1.7 .0 10.0 D. NB External * 4 909 4 1509 * AG 790 1.2 .0 10.0 E. NB Left * 4 600 2 755 * AG 45 1.7 .0 10.0 F. SB Left * 0 909 2 755 * AG 900 1.7 .0 10.0 G. SB External * 0 1509 0 909 * AG 1160 1.2 .0 10.0 H. SB Approach * 0 909 0 755 * AG 260 1.7 .0 10.0 I. SB Depart * 0 755 0 600 * AG 181 1.7 .0 10.0 J. SB External * 0 600 0 0 * AG 181 1.2 .0 10.0 K. EB External * -750 750 -150 750 * AG 806 1.2 .0 12.2 L. EB Approach * -150 750 2 750 * AG 581 1.7 .0 12.2 M. EB Depart * 2 750 154 750 * AG 1447 1.7 .0 12.2 N. EB External * 154 750 754 750 * AG 1447 1.2 .0 12.2 O. WB External * 754 759 154 759 * AG 810 1.2 .0 12.2 P. WB Approach * 154 759 2 759 * AG 785 1.7 .0 12.2 Q. WB Depart * 2 759 -150 759 * AG 505 1.7 .0 12.2 R. WB External * -150 759 -750 759 * AG 505 1.2 .0 12.2 S. EB Left * -150 750 2 755 * AG 225 1.7 .0 12.2 T. WB Left * 154 759 2 755 * AG 25 1.7 .0 12.2
CALINE4: CALIFORNIA LINE SOURCE DISPERSION MODEL JUNE 1989 VERSION PAGE 2 JOB: 2030 Diamond Road & Pleasant Valley Road RUN: Hour 1 (WORST CASE ANGLE) POLLUTANT: Carbon Monoxide III. RECEPTOR LOCATIONS * COORDINATES (M) RECEPTOR * X Y Z ------------*--------------------- 1. Receptor * -5 742 2.0 2. Receptor * 8 742 2.0 3. Receptor * 8 767 2.0 4. Receptor * -5 767 2.0 IV. MODEL RESULTS (WORST CASE WIND ANGLE ) * * PRED * CONC/LINK * BRG * CONC * (PPM) RECEPTOR * (DEG) * (PPM) * A B C D E F G H-------------*-------*-------*---------------------------------------- 1. Receptor * 4. * .4 * .0 .0 .0 .0 .0 .1 .0 .0 2. Receptor * 357. * .5 * .0 .0 .2 .0 .0 .1 .0 .0 3. Receptor * 356. * .4 * .0 .0 .2 .0 .0 .1 .0 .0 4. Receptor * 96. * .4 * .0 .0 .0 .0 .0 .0 .0 .0 * CONC/LINK * (PPM) RECEPTOR * I J K L M N O P Q R S T ------------*------------------------------------------------------------ 1. Receptor * .0 .0 .0 .0 .0 .0 .0 .0 .0 .0 .0 .0 2. Receptor * .0 .0 .0 .0 .0 .0 .0 .0 .0 .0 .0 .0 3. Receptor * .0 .0 .0 .0 .0 .0 .0 .0 .0 .0 .0 .0 4. Receptor * .0 .0 .0 .0 .0 .0 .0 .1 .0 .0 .0 .0
Page 1

2030_Parkway&MissFlatRoad_Output.txt CALINE4: CALIFORNIA LINE SOURCE DISPERSION MODEL JUNE 1989 VERSION PAGE 1 JOB: 2030 Diamond Springs Parkway & Missouri RUN: Hour 1 (WORST CASE ANGLE) POLLUTANT: Carbon Monoxide I. SITE VARIABLES U= 1.0 M/S Z0= 100. CM ALT= 549. (M) BRG= WORST CASE VD= .0 CM/S CLAS= 7 (G) VS= .0 CM/S MIXH= 1000. M AMB= .0 PPM SIGTH= 5. DEGREES TEMP= 6.1 DEGREE (C) II. LINK VARIABLES LINK * LINK COORDINATES (M) * EF H W DESCRIPTION * X1 Y1 X2 Y2 * TYPE VPH (G/MI) (M) (M) ----------------*-------------------------*------------------------------ A. NB External * 13 0 13 600 * AG 807 1.2 .0 15.8 B. NB Approach * 13 600 13 756 * AG 229 1.7 .0 15.8 C. NB Depart * 13 756 13 913 * AG 53 1.7 .0 15.8 D. NB External * 13 913 13 1513 * AG 53 1.2 .0 15.8 E. NB Left * 13 600 6 756 * AG 578 1.7 .0 15.8 F. SB Left * 0 913 6 756 * AG 3 1.7 .0 15.8 G. SB External * 0 1513 0 913 * AG 31 1.2 .0 15.8 H. SB Approach * 0 913 0 756 * AG 28 1.7 .0 15.8 I. SB Depart * 0 756 0 600 * AG 706 1.7 .0 15.8 J. SB External * 0 600 0 0 * AG 706 1.2 .0 15.8 K. EB External * -750 750 -150 750 * AG 1192 1.2 .0 15.8 L. EB Approach * -150 750 6 750 * AG 1177 1.7 .0 15.8 M. EB Depart * 6 750 163 750 * AG 936 1.7 .0 15.8 N. EB External * 163 750 763 750 * AG 936 1.2 .0 15.8 O. WB External * 763 763 163 763 * AG 1299 1.2 .0 15.8 P. WB Approach * 163 763 6 763 * AG 1063 1.7 .0 15.8 Q. WB Depart * 6 763 -150 763 * AG 1634 1.7 .0 15.8 R. WB External * -150 763 -750 763 * AG 1634 1.2 .0 15.8 S. EB Left * -150 750 6 756 * AG 15 1.7 .0 15.8 T. WB Left * 163 763 6 756 * AG 236 1.7 .0 15.8
CALINE4: CALIFORNIA LINE SOURCE DISPERSION MODEL JUNE 1989 VERSION PAGE 2 JOB: 2030 Diamond Springs Parkway & Missouri RUN: Hour 1 (WORST CASE ANGLE) POLLUTANT: Carbon Monoxide III. RECEPTOR LOCATIONS * COORDINATES (M) RECEPTOR * X Y Z ------------*--------------------- 1. Receptor * -9 741 2.0 2. Receptor * 22 741 2.0 3. Receptor * 22 772 2.0 4. Receptor * -9 772 2.0 IV. MODEL RESULTS (WORST CASE WIND ANGLE ) * * PRED * CONC/LINK * BRG * CONC * (PPM) RECEPTOR * (DEG) * (PPM) * A B C D E F G H-------------*-------*-------*---------------------------------------- 1. Receptor * 83. * .4 * .0 .0 .0 .0 .0 .0 .0 .0 2. Receptor * 276. * .4 * .0 .0 .0 .0 .0 .0 .0 .0 3. Receptor * 265. * .4 * .0 .0 .0 .0 .0 .0 .0 .0 4. Receptor * 264. * .4 * .0 .0 .0 .0 .0 .0 .0 .0 * CONC/LINK * (PPM) RECEPTOR * I J K L M N O P Q R S T ------------*------------------------------------------------------------ 1. Receptor * .0 .0 .0 .0 .1 .0 .0 .0 .0 .0 .0 .0 2. Receptor * .0 .0 .0 .2 .0 .0 .0 .0 .0 .0 .0 .0 3. Receptor * .0 .0 .0 .0 .0 .0 .0 .0 .2 .0 .0 .0 4. Receptor * .0 .0 .0 .0 .0 .0 .0 .0 .2 .0 .0 .0
Page 1

2030_Parkway&ThrowitaWay_Output.txt CALINE4: CALIFORNIA LINE SOURCE DISPERSION MODEL JUNE 1989 VERSION PAGE 1 JOB: 2030 Diamond Springs Parkway & Throwita RUN: Hour 1 (WORST CASE ANGLE) POLLUTANT: Carbon Monoxide I. SITE VARIABLES U= 1.0 M/S Z0= 100. CM ALT= 549. (M) BRG= WORST CASE VD= .0 CM/S CLAS= 7 (G) VS= .0 CM/S MIXH= 1000. M AMB= .0 PPM SIGTH= 5. DEGREES TEMP= 6.1 DEGREE (C) II. LINK VARIABLES LINK * LINK COORDINATES (M) * EF H W DESCRIPTION * X1 Y1 X2 Y2 * TYPE VPH (G/MI) (M) (M) ----------------*-------------------------*------------------------------ A. NB External * 4 0 4 600 * AG 91 1.2 .0 10.0 B. NB Approach * 4 600 4 756 * AG 41 1.7 .0 10.0 C. NB Depart * 4 756 4 913 * AG 97 1.7 .0 10.0 D. NB External * 4 913 4 1513 * AG 97 1.2 .0 10.0 E. NB Left * 4 600 2 756 * AG 50 1.7 .0 10.0 F. SB Left * 0 913 2 756 * AG 30 1.7 .0 10.0 G. SB External * 0 1513 0 913 * AG 63 1.2 .0 10.0 H. SB Approach * 0 913 0 756 * AG 33 1.7 .0 10.0 I. SB Depart * 0 756 0 600 * AG 128 1.7 .0 10.0 J. SB External * 0 600 0 0 * AG 128 1.2 .0 10.0 K. EB External * -750 750 -150 750 * AG 936 1.2 .0 15.8 L. EB Approach * -150 750 2 750 * AG 877 1.7 .0 15.8 M. EB Depart * 2 750 154 750 * AG 831 1.7 .0 15.8 N. EB External * 154 750 754 750 * AG 831 1.2 .0 15.8 O. WB External * 754 763 154 763 * AG 1265 1.2 .0 15.8 P. WB Approach * 154 763 2 763 * AG 1242 1.7 .0 15.8 Q. WB Depart * 2 763 -150 763 * AG 1299 1.7 .0 15.8 R. WB External * -150 763 -750 763 * AG 1299 1.2 .0 15.8 S. EB Left * -150 750 2 756 * AG 59 1.7 .0 15.8 T. WB Left * 154 763 2 756 * AG 23 1.7 .0 15.8
CALINE4: CALIFORNIA LINE SOURCE DISPERSION MODEL JUNE 1989 VERSION PAGE 2 JOB: 2030 Diamond Springs Parkway & Throwita RUN: Hour 1 (WORST CASE ANGLE) POLLUTANT: Carbon Monoxide III. RECEPTOR LOCATIONS * COORDINATES (M) RECEPTOR * X Y Z ------------*--------------------- 1. Receptor * -5 741 2.0 2. Receptor * 8 741 2.0 3. Receptor * 8 772 2.0 4. Receptor * -5 772 2.0 IV. MODEL RESULTS (WORST CASE WIND ANGLE ) * * PRED * CONC/LINK * BRG * CONC * (PPM) RECEPTOR * (DEG) * (PPM) * A B C D E F G H-------------*-------*-------*---------------------------------------- 1. Receptor * 84. * .2 * .0 .0 .0 .0 .0 .0 .0 .0 2. Receptor * 276. * .3 * .0 .0 .0 .0 .0 .0 .0 .0 3. Receptor * 265. * .3 * .0 .0 .0 .0 .0 .0 .0 .0 4. Receptor * 264. * .3 * .0 .0 .0 .0 .0 .0 .0 .0 * CONC/LINK * (PPM) RECEPTOR * I J K L M N O P Q R S T ------------*------------------------------------------------------------ 1. Receptor * .0 .0 .0 .0 .1 .0 .0 .0 .0 .0 .0 .0 2. Receptor * .0 .0 .0 .1 .0 .0 .0 .0 .0 .0 .0 .0 3. Receptor * .0 .0 .0 .0 .0 .0 .0 .0 .2 .0 .0 .0 4. Receptor * .0 .0 .0 .0 .0 .0 .0 .0 .2 .0 .0 .0
Page 1

County of El Dorado Department of Transportation Diamond Springs Parkway Project Draft EIR
Michael Brandman Associates H:\Client (PN-JN)\1173\11730025\DEIR\11730025 Sec99-00 Appendix Dividers.doc
C.2 - Air Quality Impact Analysis Report - Highway 49 Intertie, Michael Brandman Associates, February 20, 2009
Air Quality Impact Analysis Report Highway 49 Intertie Improvements Project
County of El Dorado, California
Prepared for:
El Dorado Irrigation District 2890 Mosquito Road Placerville, CA 95667
530.642.4130
Prepared by:
Michael Brandman Associates 2000 “O” Street
Suite 200 Sacramento, CA 95811
February 20, 2009
El Dorado Irrigation District - Highway 49 Intertie Improvements Project Air Quality Impact Analysis Report Table of Contents
Michael Brandman Associates ii S:\Projects\28490004 EID HWY 49 Intertie Improvements\Air Quality\Final Report\28490004 AQ Report_FINAL.doc
TABLE OF CONTENTS
Acronyms and Abbreviations ............................................................................................. iv Section 1: Introduction ......................................................................................................... 1
1.1 - Project Location and Description ........................................................................ 1 1.2 - Purpose and Methods of Analysis....................................................................... 2 1.3 - Findings............................................................................................................... 2
Section 2: Setting.................................................................................................................. 5 2.1 - Regulatory Setting............................................................................................... 5
2.1.1 - Federal and State................................................................................. 5 2.1.2 - El Dorado Air Quality Management District .......................................... 8 2.1.3 - Local Government .............................................................................. 11 2.1.4 - Climate Change/Greenhouse Gas Regulation ................................... 12
2.2 - Air Quality Setting ............................................................................................. 16 2.2.1 - Mountain Counties Air Basin (MCAB) ................................................ 16 2.2.2 - Regional Air Quality............................................................................ 18 2.2.3 - Local Air Quality ................................................................................. 19 2.2.4 - Greenhouse Gas Emissions and Climate Change............................. 20
2.3 - Pollutants of Concern........................................................................................ 22 2.3.1 - Ozone................................................................................................. 22 2.3.2 - Particulate Matter (PM10 and PM2.5) ................................................... 24 2.3.3 - Carbon Monoxide ............................................................................... 25 2.3.4 - Naturally Occurring Asbestos............................................................. 26 2.3.5 - Greenhouse Gases ............................................................................ 26
Section 3: Thresholds......................................................................................................... 28 3.1.1 - Air Quality Attainment Plan Consistency............................................ 28 3.1.2 - Regional Significance Thresholds ...................................................... 28 3.1.3 - Other Criteria Pollutants ..................................................................... 29 3.1.4 - Visibility Threshold ............................................................................. 29 3.1.5 - Health Risk Thresholds ...................................................................... 29 3.1.6 - Contribution to Climate Change Threshold ........................................ 30 3.1.7 - Cumulative Impacts............................................................................ 30
Section 4: Impact Analysis................................................................................................. 31 4.1 - Emissions Calculation Methodology ................................................................. 31 4.2 - Impact Assessment........................................................................................... 32
4.2.1 - Localized Impacts............................................................................... 32 4.2.2 - Regional Impacts................................................................................ 33 4.2.3 - Health Risk ......................................................................................... 34 4.2.4 - Odor ................................................................................................... 34 4.2.5 - Conformance with Air Quality Attainment Plan .................................. 35 4.2.6 - Greenhouse Gas and Climate Change .............................................. 35 4.2.7 - Cumulative Impacts............................................................................ 37
Section 5: References......................................................................................................... 39
Appendix A : Roadway Model Calculations

El Dorado Irrigation District - Highway 49 Intertie Improvements Project Air Quality Impact Analysis Report Table of Contents
Michael Brandman Associates iii S:\Projects\28490004 EID HWY 49 Intertie Improvements\Air Quality\Final Report\28490004 AQ Report_FINAL.doc
LIST OF TABLES
Table 1: Ambient Air Quality Standards .................................................................................. 7 Table 2: Attainment Status...................................................................................................... 9 Table 3: 2006 El Dorado County MCAB Emissions Inventory .............................................. 19 Table 4: Air Quality Monitoring Summary ............................................................................. 19 Table 5: Regional Thresholds ............................................................................................... 29 Table 6: Construction Exhaust Emissions (2010) ................................................................. 33 Table 7: Project GHG Emissions .......................................................................................... 36
LIST OF EXHIBITS
Exhibit 1: Regional Location Map............................................................................................ 3 Exhibit 2: Local Vicinity Map ................................................................................................... 4 Exhibit 3: Sacramento Federal Ozone Nonattainment Area ................................................. 10

El Dorado Irrigation District - Highway 49 Intertie Improvements Project Air Quality Impact Analysis Report Acronyms and Abbreviations
Michael Brandman Associates iv S:\Projects\28490004 EID HWY 49 Intertie Improvements\Air Quality\Final Report\28490004 AQ Report_FINAL.doc
ACRONYMS AND ABBREVIATIONS
µm micrometer AQAP Air Quality Attainment Plan ARB California Air Resources Control Board BMP best management practices BSA Broader Sacramento Area CAAQS California Ambient Air Quality Standards CAT Climate Action Team CCAA California Clean Air Act CEQA California Environmental Quality Act CO carbon monoxide DPM diesel particulate matter EDAQMD El Dorado Air Quality Management District EDMS Emissions and Dispersion Modeling System EID El Dorado Irrigation District EMFAC EMission FACtor Model EPA Environmental Protection Agency LOS level of service MCAB Mountain Counties Air Basin msl mean sea level NAAQS National Ambient Air Quality Standards NESHAPs National Emission Standards for Hazardous Air Pollutants NOA naturally occurring asbestos NOx nitrogen oxides PM10 particulate matter less than 10 microns in diameter PM2.5 particulate matter less than 2.5 microns in diameter ppm parts per million ppt parts per trillion REL relative exposure level ROG reactive organic gases RTP Regional Transportation Plans SIP State Implementation Plans TAC toxic air contaminant URBEMIS URBan EMISsion Model VMT vehicle miles traveled VOC volatile organic compounds

El Dorado Irrigation District - Highway 49 Intertie Improvements Project Air Quality Impact Analysis Report Introduction
Michael Brandman Associates 1 S:\Projects\28490004 EID HWY 49 Intertie Improvements\Air Quality\Final Report\28490004 AQ Report_FINAL.doc
SECTION 1: INTRODUCTION
1.1 - Project Location and Description
El Dorado Irrigation District (EID) proposes to upgrade existing waterlines located along Highway 49 (Highway 49 Intertie), concurrent with construction of the El Dorado County Department of Transportation’s Diamond Springs Parkway Project (Parkway) that lies perpendicular to Highway 49, north of the community of Diamond Springs. The Highway 49 Intertie Improvements Project (Project) is generally located between Missouri Flat Road and Diamond Road/Highway 49 (Exhibit 1).
The Highway 49 Intertie serves as an important means to transmit water from the northern El Dorado Main system to the southern Diamond Springs Main system. The Highway 49 Intertie mostly consists of 12-inch waterline; however, a segment of the Intertie is 6 inches and 8 inches in diameter. This reduction in pipe diameter creates a bottleneck that significantly reduces the capacity of the Intertie. The Project replaces the bottleneck in the Highway 49 Intertie to improve the flow of water through the transmission system. The Project involves the replacement of approximately 2,000 feet of 6-inch waterline with a new 12-inch waterline in Highway 49 near Diamond Springs, and approximately 3,800 feet of new 18-inch waterline that would intertie to an existing 18-inch waterline to aid in supply for existing and future customers as demands increase with growth projected by the General Plan.
Increasing water demands require increased transmission capacity to provide adequate service. The Highway 49 Intertie is a crucial transmission main used to supplement the Diamond Spring Main during high flow periods. It also has been the only feed to maintain water service in Diamond Springs during the recent Pleasant Oak Main line breaks. Increasing the capacity of the line would improve the reliability and redundancy of the overall transmission system.
The Project would be concurrently constructed with the Parkway. The location of the Project relative to the Parkway is shown in Exhibit 2. The Parkway is being constructed to improve traffic circulation along the Pleasant Valley Road and Missouri Flat Road corridors by directly connecting Missouri Flat Road with State Route 49 (SR-49). MBA conducted an air quality impacts assessment and prepared an Air Quality Analysis Report for the Parkway (MBA 2008a). This Project was not evaluated in the Air Quality Analysis Report prepared for the Parkway. Therefore, this report assesses the potential air quality effects that would result from constructing the proposed Intertie Improvements Project.
Construction of the Project is expected to occur in 2010. Detailed information on the construction activities is located in Section 4.1 - Emissions Calculation Methodology.

El Dorado Irrigation District - Highway 49 Intertie Improvements Project Air Quality Impact Analysis Report Introduction
Michael Brandman Associates 2 S:\Projects\28490004 EID HWY 49 Intertie Improvements\Air Quality\Final Report\28490004 AQ Report_FINAL.doc
1.2 - Purpose and Methods of Analysis
This air quality analysis was prepared to evaluate whether the expected air pollutant emissions generated from the Project would cause significant impacts to air resources in the Project area. This assessment was conducted within the context of the California Environmental Quality Act (CEQA, California Public Resources Code Sections 21000, et seq.). The methodology follows the Guide to Air Quality Assessment prepared by El Dorado Air Quality Management District (EDAQMD), adopted February 2002 (EDAQMD 2002).
1.3 - Findings
• The Project will not conflict with or obstruct implementation of the 1994 Sacramento Region Clean Air Plan.
• The Project will not exceed EDAQMD’s localized significance thresholds.
• The construction emissions from the Project will not exceed EDAQMD’s regional significance thresholds.
• The Project will not expose sensitive receptors to substantial air pollution concentrations.
• The Project will not create objectionable odors that affect sensitive receptors near the Project area.
• The Project will not significantly hinder or delay California’s ability to meet the reduction targets contained in AB 32.
• The Project will not result in significant cumulative air quality impacts.


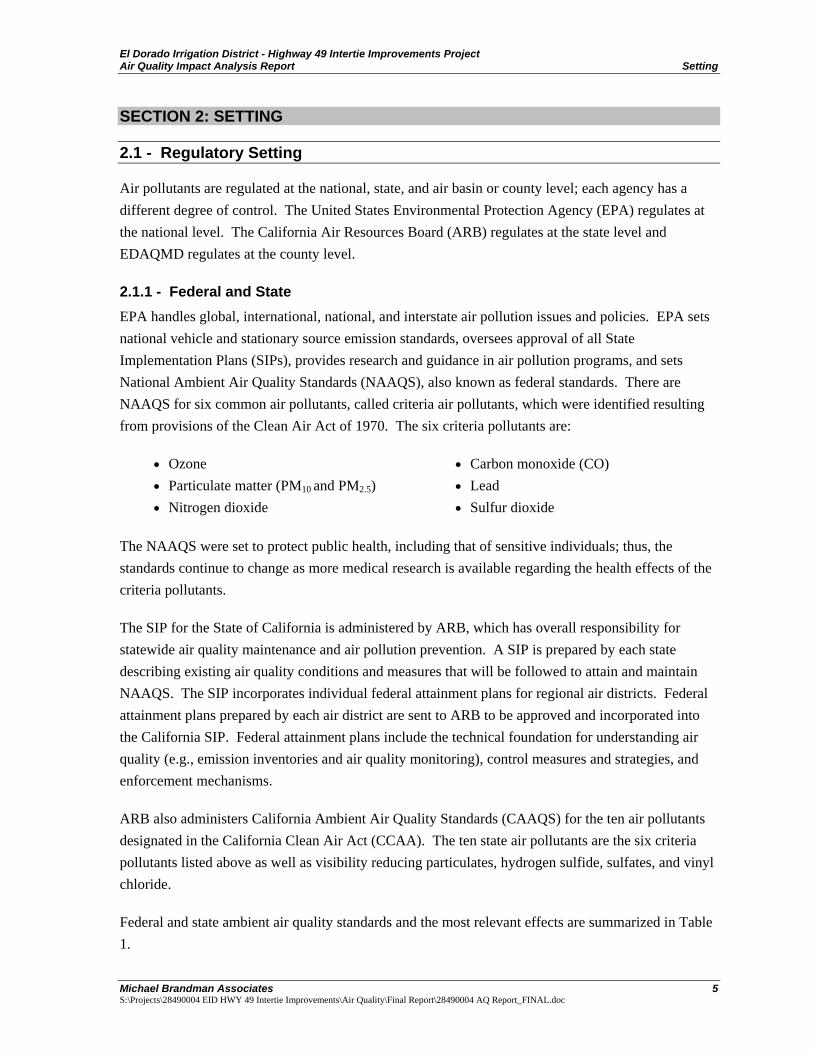
El Dorado Irrigation District - Highway 49 Intertie Improvements Project Air Quality Impact Analysis Report Setting
Michael Brandman Associates 5 S:\Projects\28490004 EID HWY 49 Intertie Improvements\Air Quality\Final Report\28490004 AQ Report_FINAL.doc
SECTION 2: SETTING
2.1 - Regulatory Setting
Air pollutants are regulated at the national, state, and air basin or county level; each agency has a different degree of control. The United States Environmental Protection Agency (EPA) regulates at the national level. The California Air Resources Board (ARB) regulates at the state level and EDAQMD regulates at the county level.
2.1.1 - Federal and State EPA handles global, international, national, and interstate air pollution issues and policies. EPA sets national vehicle and stationary source emission standards, oversees approval of all State Implementation Plans (SIPs), provides research and guidance in air pollution programs, and sets National Ambient Air Quality Standards (NAAQS), also known as federal standards. There are NAAQS for six common air pollutants, called criteria air pollutants, which were identified resulting from provisions of the Clean Air Act of 1970. The six criteria pollutants are:
• Ozone • Particulate matter (PM10 and PM2.5) • Nitrogen dioxide
• Carbon monoxide (CO) • Lead • Sulfur dioxide
The NAAQS were set to protect public health, including that of sensitive individuals; thus, the standards continue to change as more medical research is available regarding the health effects of the criteria pollutants.
The SIP for the State of California is administered by ARB, which has overall responsibility for statewide air quality maintenance and air pollution prevention. A SIP is prepared by each state describing existing air quality conditions and measures that will be followed to attain and maintain NAAQS. The SIP incorporates individual federal attainment plans for regional air districts. Federal attainment plans prepared by each air district are sent to ARB to be approved and incorporated into the California SIP. Federal attainment plans include the technical foundation for understanding air quality (e.g., emission inventories and air quality monitoring), control measures and strategies, and enforcement mechanisms.
ARB also administers California Ambient Air Quality Standards (CAAQS) for the ten air pollutants designated in the California Clean Air Act (CCAA). The ten state air pollutants are the six criteria pollutants listed above as well as visibility reducing particulates, hydrogen sulfide, sulfates, and vinyl chloride.
Federal and state ambient air quality standards and the most relevant effects are summarized in Table 1.

El Dorado Irrigation District - Highway 49 Intertie Improvements Project Air Quality Impact Analysis Report Setting
Michael Brandman Associates 6 S:\Projects\28490004 EID HWY 49 Intertie Improvements\Air Quality\Final Report\28490004 AQ Report_FINAL.doc
Recent Air Quality Standard Actions
In 2006, EPA changed the 24-hour PM2.5 standard from 65 micrograms per cubic meter (µg/m3) to 35 µg/m3 and retained the existing annual standard of 15.0 µg/m3. EPA promulgated a new 8-hour standard for ozone on March 12, 2008, effective March 27, 2008.
In February 2007, ARB established a new annual average nitrogen dioxide standard of 0.030 parts per million (ppm) and lowered the 1-hour nitrogen dioxide standard to 0.18 ppm. These changes became effective March 20, 2008.
On October 15, 2008, EPA reduced the federal lead standard from 1.5 µg/m3 to 0.15 µg/m3. In addition, EPA revised the averaging time and form of the lead standard. EPA will retain the existing 1978 lead standard until one year after designations for the new 2008 standard. ARB is required to make recommendations for areas to be designated attainment, nonattainment, or unclassifiable by October 2009. Final designations will be effective no later than 2012.
Applicable Toxic Air Contaminant Regulation
Rock formations containing naturally occurring asbestos (NOA) are known to be present in El Dorado County. During construction in areas that contain NOA-containing rock formations, asbestos can be released into the air and pose a health hazard. The Department of Conservation, Division of Mines and Geology (DMG) has a published guide for generally identifying areas that are likely to contain NOA in western El Dorado County (DMG 2002). However, a review of the DMG’s map showing areas more likely to have rock formations containing NOA in western El Dorado County indicates that the Project is not in an area that is likely to contain naturally occurring asbestos. There nearest location of NOA shown is approximately 4.5 miles west of the Project.
In July 2001, ARB approved an Air Toxic Control Measure for construction, grading, quarrying and surface mining operations to minimize NOA emissions. The regulation requires application of best management practices to control fugitive dust in areas known to have NOA, as well as requiring notification to the local air district prior to commencement of ground-disturbing activities. In addition, EDAQMD approved Rule 223-2 (Fugitive Dust – Asbestos Hazard Mitigation) contains specific activity and administrative requirements for projects that meet the applicability criteria. This Project does not meet Rule 223-2 applicability criteria.
ARB approved a regulatory measure to reduce emissions of toxics and criteria pollutants by limiting idling of heavy-duty diesel vehicles (ARB 2005c). The driver of any vehicle subject to this section (1) shall not idle the vehicle’s primary diesel engine for greater than 5 minutes at any location and (2) shall not idle a diesel-fueled auxiliary power system for more than 5 minutes to power a heater, air conditioner, or any ancillary equipment on the vehicle if it has a sleeper berth and the truck is located within 100 feet of a restricted area (homes and schools).

El Dorado Irrigation District - Highway 49 Intertie Improvements Project Air Quality Impact Analysis Report Setting
Michael Brandman Associates 7 S:\Projects\28490004 EID HWY 49 Intertie Improvements\Air Quality\Final Report\28490004 AQ Report_FINAL.doc
Table 1: Ambient Air Quality Standards
Air Pollutant
Averaging Time
California Standard
National Standard Most Relevant Effects
1-hour 0.09 ppm — Ozone
8-hour 0.070 ppm 0.075 ppm
(a) Decrease of pulmonary function and localized lung edema in humans and animals; (b) risk to public health implied by alterations in pulmonary morphology and host defense in animals; (c) increased mortality risk; (d) risk to public health implied by altered connective tissue metabolism and altered pulmonary morphology in animals after long-term exposures and pulmonary function decrements in chronically exposed humans; (e) vegetation damage; (f) property damage.
1-hour 20 ppm 35 ppm Carbon monoxide (CO) 8-hour 9.0 ppm 9 ppm
(a) Aggravation of angina pectoris (chest pain or discomfort) and other aspects of coronary heart disease; (b) decreased exercise tolerance in persons with peripheral vascular disease and lung disease; (c) impairment of central nervous system functions; (d) possible increased risk to fetuses.
1-hour 0.18 ppm — Nitrogen dioxide (NO2) Mean 0.030 ppm 0.053 ppm
(a) Potential to aggravate chronic respiratory disease and respiratory symptoms in sensitive groups; (b) risk to public health implied by pulmonary and extra-pulmonary biochemical and cellular changes and pulmonary structural changes; (c) contribution to atmospheric discoloration.
1-hour 0.25 ppm —
24-hour 0.04 ppm 0.14 ppm
Sulfur dioxide (SO2)
Mean — 0.030 ppm
Bronchoconstriction accompanied by symptoms which may include wheezing, shortness of breath and chest tightness, during exercise or physical activity in persons with asthma.
24-hour 50 µg/m3 150 µg/m3 Particulate matter (PM10) Mean 20 µg/m3 —
24-hour — 35 µg/m3 Particulate matter (PM2.5) Mean 12 µg/m3 15.0 µg/m3
(a) Exacerbation of symptoms in sensitive patients with respiratory or cardiovascular disease; (b) declines in pulmonary function growth in children; (c) increased risk of premature death from heart or lung diseases in the elderly.
Sulfates 24-hour 25 µg/m3 — (a) Decrease in ventilatory function; (b) aggravation of asthmatic symptoms; (c) aggravation of cardio-pulmonary disease; (d) vegetation damage; (e) degradation of visibility; (f) property damage.
30-day 1.5 µg/m3 — Lead
Quarter — 1.5 µg/m3
(a) Learning disabilities; (b) impairment of blood formation and nerve conduction.
Abbreviations: ppm = parts per million (concentration) µg/m3 = micrograms per cubic meter Mean = Annual Arithmetic Mean 30-day = 30-day average Quarter = Calendar year quarter Sources: ARB 2008a; EPA 2008a.

El Dorado Irrigation District - Highway 49 Intertie Improvements Project Air Quality Impact Analysis Report Setting
Michael Brandman Associates 8 S:\Projects\28490004 EID HWY 49 Intertie Improvements\Air Quality\Final Report\28490004 AQ Report_FINAL.doc
ARB’s Land Use Handbook
ARB adopted the Air Quality and Land Use Handbook: A Community Health Perspective (Land Use Handbook) in 2005. The Land Use Handbook provides information and guidance on siting sensitive receptors in relation to sources of toxic air contaminants (TACs). The sources of TACs identified in the Land Use Handbook are high-traffic freeways and roads, distribution centers, rail yards, ports, refineries, chrome plating facilities, dry cleaners, and large gasoline dispensing facilities. If the project involves siting a sensitive receptor or source of TAC discussed in the Land Use Handbook, siting mitigation may be added to avoid potential land use conflicts, thereby reducing the potential for health impacts to the sensitive receptors (ARB 2005a). The Project would not construct a source of TACs or a location of sensitive receptors.
2.1.2 - El Dorado Air Quality Management District The local air pollution control agency for El Dorado County is EDAQMD. The Project is located within the Mountain Counties Air Basin (MCAB) portion of El Dorado County. EDAQMD is responsible for controlling emissions primarily from stationary sources, and it has primary responsibility for compliance with both the federal and state standards.
EDAQMD has prepared the Guide to Air Quality Assessment (CEQA Guide) that provides quantitative and qualitative significance thresholds and establishes protocols for the analysis of air quality impacts from projects and plans. The CEQA Guide also contains methodologies for estimating construction and operation emissions, and mitigation measures to reduce potentially significant impacts.
Attainment Status
There are three terms used to describe if an air basin is exceeding or meeting federal and state standards: Attainment, Nonattainment, and Unclassified. Air basins are assessed for each applicable standard and receive a designation based on that assessment. Each standard has a different definition, or “form” of what constitutes attainment, based on specific air quality statistics. For example, the federal 8-hour CO standard is not to be exceeded more than once per year; therefore, an area is in attainment of the CO standard if no more than one 8-hour ambient air monitoring value exceeds the threshold per year. In contrast, the federal annual PM2.5 standard is met if the 3-year average of the annual average PM2.5 concentration is less than or equal to the standard.
Areas are designated attainment or nonattainment on a per-pollutant basis. If an air basin exceeds the “form” of a federal or state standard, the air basin is designated as “nonattainment” for that air pollutant. An air basin is designated as “attainment” for pollutant if all the standards for that pollutant are met. If there is inadequate or inconclusive data to make a definitive attainment designation for a pollutant, the air basin is considered “unclassified.” The current attainment designations for the Project area are shown in Table 2.

El Dorado Irrigation District - Highway 49 Intertie Improvements Project Air Quality Impact Analysis Report Setting
Michael Brandman Associates 9 S:\Projects\28490004 EID HWY 49 Intertie Improvements\Air Quality\Final Report\28490004 AQ Report_FINAL.doc
The MCAB portion of El Dorado County is designated as nonattainment for the state and federal ozone standards. In addition, the Project area is designated nonattainment for state PM10 standards. The MCAB portion of El Dorado County is included in the Sacramento Federal Ozone Nonattainment Area, also called the Sacramento Region (Exhibit 3). The current attainment designations for the Project area are shown in Table 2.
Table 2: Attainment Status
Pollutant State Federal
Ozone Nonattainment Nonattainment
Carbon monoxide Unclassified Attainment
Nitrogen dioxide Attainment Unclassified/Attainment
Sulfur dioxide Attainment Unclassified
PM10 Nonattainment Unclassified
PM2.5 Unclassified Unclassified/Attainment
Lead Attainment Attainment
Sulfates Attainment
Hydrogen sulfide Unclassified
Vinyl chloride (No Information Available)
Visibility-reducing particles Unclassified
NA
Notes: NA = No Standard. Source: ARB 2006; EPA 2008b.
Current Air Quality Plans
As discussed above, each air district designated nonattainment for a federal standard prepares an attainment plan that describes air quality conditions and measures that will be enacted to attain and maintain the federal standard, which is incorporated into the SIP. For the federal ozone standard, EPA has identified Sacramento and Yolo counties, and parts of El Dorado, Solano, Placer, and Sutter counties as the Sacramento Federal Ozone Nonattainment Area, also called the Sacramento Region. Air districts in the Sacramento Region cooperatively developed a federal ozone attainment plan, as discussed below.
Federal Air Quality Attainment Plans The federal attainment plan for the Sacramento Region is the 1994 Sacramento Area Regional Ozone Attainment Plan, also called the Sacramento Regional Clean Air Plan. The air districts of the Sacramento Region adopted a Rate of Progress Plan for the federal 8-hour ozone standard in 2006.


El Dorado Irrigation District - Highway 49 Intertie Improvements Project Air Quality Impact Analysis Report Setting
Michael Brandman Associates 11 S:\Projects\28490004 EID HWY 49 Intertie Improvements\Air Quality\Final Report\28490004 AQ Report_FINAL.doc
In addition, the districts adopted the 2011 Reasonable Further Progress Plan (RFP) for the 8-hour federal ozone standard between March and May 2008. The RFP shows that the Sacramento Region cannot meet the 2013 attainment deadline, and it is the basis for the voluntary federal reclassification request discussed further below.
A draft 8-hour Attainment Demonstration Plan was released for public comment in September 2008. It is expected that the draft plan will go to the air districts’ respective Board of Directors for adoption in early 2009.
Voluntary Federal Reclassification Request On February 14, 2008, the five air districts that constitute the Sacramento Region requested ARB to submit a formal request to EPA to reclassify the area from “serious” to “severe” nonattainment for the federal 8-hour ozone standard, with an associated attainment deadline of June 15, 2019. The request is based on an evaluation of the emission reductions necessary to attain the federal standard, and the emission reductions associated with feasible rules. It was determined that the Sacramento Region would not be able to achieve the necessary emission reduction in the existing attainment timeframe through the existing suite of feasible rules.
State Air Quality Attainment Plans The CCAA does not contain planning requirements for areas in nonattainment of the state PM10 standards, but air districts must demonstrate to ARB that all feasible measures for their district have been adopted.
However, state ozone standards do have planning requirements. The CCAA requires air districts that are nonattainment for state ozone standards adopt air quality attainment plans and review and revise their plans to address deficiencies in interim measures of progress once every 3 years.
Rules Applicable to the Project
The Project would be required to comply with all of EDAQMD’s applicable rules and regulations, including (but not limited to):
Rule 223-1 (Fugitive Dust – Construction, Bulk Material Handling, Blasting, Other Earthmoving Activities and Carryout and Trackout Prevention). This rule limits the amount of fugitive dust from construction and construction-related activities limits the visible emissions of fugitive dust based on opacity, and specifies requirements for trackout management. Application of Best Management Practices is required of all applicable projects.
2.1.3 - Local Government The local government with jurisdiction over non-federal portions of the Project area is El Dorado County. Pursuant to Section 15125(d) of the CEQA Guidelines, the air emissions of the Project are also evaluated against the goals, policies, and implementation programs of the General Plan to
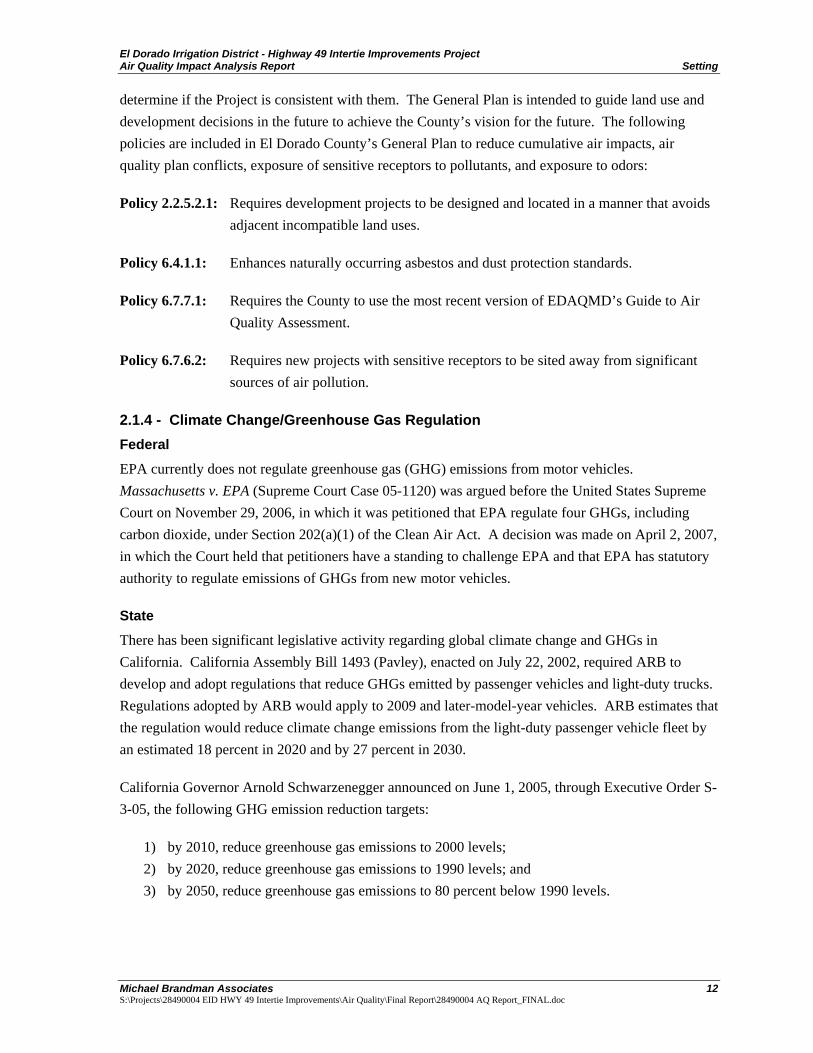
El Dorado Irrigation District - Highway 49 Intertie Improvements Project Air Quality Impact Analysis Report Setting
Michael Brandman Associates 12 S:\Projects\28490004 EID HWY 49 Intertie Improvements\Air Quality\Final Report\28490004 AQ Report_FINAL.doc
determine if the Project is consistent with them. The General Plan is intended to guide land use and development decisions in the future to achieve the County’s vision for the future. The following policies are included in El Dorado County’s General Plan to reduce cumulative air impacts, air quality plan conflicts, exposure of sensitive receptors to pollutants, and exposure to odors:
Policy 2.2.5.2.1: Requires development projects to be designed and located in a manner that avoids adjacent incompatible land uses.
Policy 6.4.1.1: Enhances naturally occurring asbestos and dust protection standards.
Policy 6.7.7.1: Requires the County to use the most recent version of EDAQMD’s Guide to Air Quality Assessment.
Policy 6.7.6.2: Requires new projects with sensitive receptors to be sited away from significant sources of air pollution.
2.1.4 - Climate Change/Greenhouse Gas Regulation Federal
EPA currently does not regulate greenhouse gas (GHG) emissions from motor vehicles. Massachusetts v. EPA (Supreme Court Case 05-1120) was argued before the United States Supreme Court on November 29, 2006, in which it was petitioned that EPA regulate four GHGs, including carbon dioxide, under Section 202(a)(1) of the Clean Air Act. A decision was made on April 2, 2007, in which the Court held that petitioners have a standing to challenge EPA and that EPA has statutory authority to regulate emissions of GHGs from new motor vehicles.
State
There has been significant legislative activity regarding global climate change and GHGs in California. California Assembly Bill 1493 (Pavley), enacted on July 22, 2002, required ARB to develop and adopt regulations that reduce GHGs emitted by passenger vehicles and light-duty trucks. Regulations adopted by ARB would apply to 2009 and later-model-year vehicles. ARB estimates that the regulation would reduce climate change emissions from the light-duty passenger vehicle fleet by an estimated 18 percent in 2020 and by 27 percent in 2030.
California Governor Arnold Schwarzenegger announced on June 1, 2005, through Executive Order S-3-05, the following GHG emission reduction targets:
1) by 2010, reduce greenhouse gas emissions to 2000 levels; 2) by 2020, reduce greenhouse gas emissions to 1990 levels; and 3) by 2050, reduce greenhouse gas emissions to 80 percent below 1990 levels.
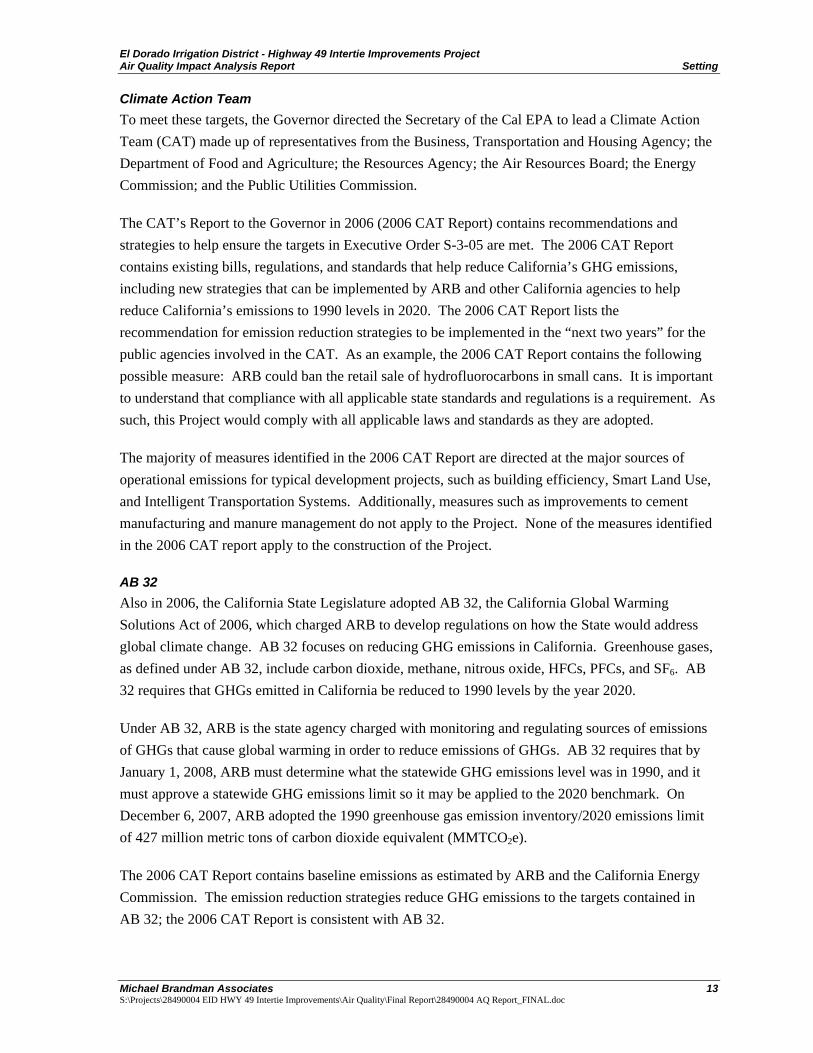
El Dorado Irrigation District - Highway 49 Intertie Improvements Project Air Quality Impact Analysis Report Setting
Michael Brandman Associates 13 S:\Projects\28490004 EID HWY 49 Intertie Improvements\Air Quality\Final Report\28490004 AQ Report_FINAL.doc
Climate Action Team To meet these targets, the Governor directed the Secretary of the Cal EPA to lead a Climate Action Team (CAT) made up of representatives from the Business, Transportation and Housing Agency; the Department of Food and Agriculture; the Resources Agency; the Air Resources Board; the Energy Commission; and the Public Utilities Commission.
The CAT’s Report to the Governor in 2006 (2006 CAT Report) contains recommendations and strategies to help ensure the targets in Executive Order S-3-05 are met. The 2006 CAT Report contains existing bills, regulations, and standards that help reduce California’s GHG emissions, including new strategies that can be implemented by ARB and other California agencies to help reduce California’s emissions to 1990 levels in 2020. The 2006 CAT Report lists the recommendation for emission reduction strategies to be implemented in the “next two years” for the public agencies involved in the CAT. As an example, the 2006 CAT Report contains the following possible measure: ARB could ban the retail sale of hydrofluorocarbons in small cans. It is important to understand that compliance with all applicable state standards and regulations is a requirement. As such, this Project would comply with all applicable laws and standards as they are adopted.
The majority of measures identified in the 2006 CAT Report are directed at the major sources of operational emissions for typical development projects, such as building efficiency, Smart Land Use, and Intelligent Transportation Systems. Additionally, measures such as improvements to cement manufacturing and manure management do not apply to the Project. None of the measures identified in the 2006 CAT report apply to the construction of the Project.
AB 32 Also in 2006, the California State Legislature adopted AB 32, the California Global Warming Solutions Act of 2006, which charged ARB to develop regulations on how the State would address global climate change. AB 32 focuses on reducing GHG emissions in California. Greenhouse gases, as defined under AB 32, include carbon dioxide, methane, nitrous oxide, HFCs, PFCs, and SF6. AB 32 requires that GHGs emitted in California be reduced to 1990 levels by the year 2020.
Under AB 32, ARB is the state agency charged with monitoring and regulating sources of emissions of GHGs that cause global warming in order to reduce emissions of GHGs. AB 32 requires that by January 1, 2008, ARB must determine what the statewide GHG emissions level was in 1990, and it must approve a statewide GHG emissions limit so it may be applied to the 2020 benchmark. On December 6, 2007, ARB adopted the 1990 greenhouse gas emission inventory/2020 emissions limit of 427 million metric tons of carbon dioxide equivalent (MMTCO2e).
The 2006 CAT Report contains baseline emissions as estimated by ARB and the California Energy Commission. The emission reduction strategies reduce GHG emissions to the targets contained in AB 32; the 2006 CAT Report is consistent with AB 32.

El Dorado Irrigation District - Highway 49 Intertie Improvements Project Air Quality Impact Analysis Report Setting
Michael Brandman Associates 14 S:\Projects\28490004 EID HWY 49 Intertie Improvements\Air Quality\Final Report\28490004 AQ Report_FINAL.doc
SB 97 SB 97 was passed in August 2007. SB 97 indicates that Section 21083.05 will be added to the Public Resources Code, “(a) On or before July 1, 2009, the Office of Planning and Research shall prepare, develop, and transmit to the Resources Agency guidelines for the mitigation of greenhouse gas emissions or the effects of greenhouse gas emissions as required by this division, including, but not limited to, effects associated with transportation or energy consumption. (b) On or before January 1, 2010, the Resources Agency shall certify and adopt guidelines prepared and developed by the Office of Planning and Research pursuant to subdivision (a).” Section 21097 is also added to the Public Resources Code and indicates that the failure to analyze adequately the effects of GHGs in a document related to the environmental review of a transportation project funded under the Highway Safety, Traffic Reduction, Air Quality, and Port Security Bond Act of 2006 does not create a cause of action for a violation. However, SB 97 does not safeguard non-transportation-funded projects from being challenged in court for omitting a global climate change analysis.
Governor’s Office of Planning and Research The Governor’s Office of Planning and Research (OPR) published a technical advisory on CEQA and Climate Change, as required under SB 97, on June 19, 2008. The guidance did not include a suggested threshold, but stated that the OPR has asked ARB to “recommend a method for setting thresholds which will encourage consistency and uniformity in the CEQA analysis of greenhouse gas emissions throughout the state.” The OPR does recommend that CEQA analyses include the following components:
• Identify greenhouse gas emissions • Determine significance • Mitigate impacts
The OPR has also started tracking environmental documents that contain GHG analysis and mitigation measures. The website “www.ceqamap.com” contains the list of documents in electronic form and is maintained by CEQAdocs.com.
ARB Under AB 32, ARB published its Final Expanded List of Early Action Measures to Reduce Greenhouse Gas Emissions in California. Discrete early action measures are currently underway or are enforceable by January 1, 2010. Early action measures are regulatory or non-regulatory and are currently underway or to be initiated by ARB in the 2007 to 2012 timeframe. ARB has 44 early action measures that apply to the transportation, commercial, forestry, agriculture, cement, oil and gas, fire suppression, fuels, education, energy efficiency, electricity, and waste sectors. Of the 44 early action measures, nine are considered discrete early action measures, as they are regulatory and enforceable by January 1, 2010. ARB estimates that implementation of all 44 recommendations will result in reductions of at least 42 MMTCO2e by 2020, representing approximately 25 percent of the 2020 target. Note that ARB currently defers measures involving general plans and CEQA. A review

El Dorado Irrigation District - Highway 49 Intertie Improvements Project Air Quality Impact Analysis Report Setting
Michael Brandman Associates 15 S:\Projects\28490004 EID HWY 49 Intertie Improvements\Air Quality\Final Report\28490004 AQ Report_FINAL.doc
of ARB’s reduction measures that are underway, or to be initiated by ARB in the 2007 to 2012 timeframe, indicates that none of the measures would be applicable to the Project.
California is also exploring the possibility of cap and trade systems for GHGs. The Market Advisory Committee to ARB published draft recommendations for designing a GHG cap and trade system for California. ARB released the Climate Change Proposed Scoping Plan in October 2008, which relies on a proposed cap and trade system to achieve the GHG emission reductions necessary to reach the AB 32 emissions goal.
Attorney General Mitigation The Office of the California Attorney General maintains a list of CEQA Mitigations for Global Warming Impacts on its website. The Attorney General’s Office has listed some examples of types of mitigations that local agencies may consider to offset or reduce global warming impacts from a project. The Attorney General’s Office states that the lists are examples and not intended to be exhaustive but instead are provided as measures and policies that could be undertaken. Moreover, the measures cited may not be appropriate for every project, so the Attorney General suggests that the lead agency should use its own informed judgment in deciding which measures it would analyze, and which measures it would require, for a given project. The mitigation measures are divided into two groups: generally applicable measures and general plan measures. The Attorney General presents “generally applicable” measures in the following areas:
• Energy efficiency • Renewable energy • Water conservation and efficiency • Solid waste measures • Land use measures • Transportation and motor vehicles • Carbon offsets
However, this Project does not involve the development of a general plan, nor does it contain the land uses targeted by the Attorney General’s measures.
Executive Order S-01-07 Executive Order S-01-07 was enacted by the Governor on January 18, 2007. The order mandates that a statewide goal shall be established to reduce the carbon intensity of California’s transportation fuels by at least 10 percent by 2020. It also requires that a Low Carbon Fuel Standard for transportation fuels be established for California.
California Air Pollution Control Officers Association White Paper The California Air Pollution Control Officers Association has released a white paper entitled “CEQA & Climate Change,” which discussed three alternative thresholds, including a no significance
El Dorado Irrigation District - Highway 49 Intertie Improvements Project Air Quality Impact Analysis Report Setting
Michael Brandman Associates 16 S:\Projects\28490004 EID HWY 49 Intertie Improvements\Air Quality\Final Report\28490004 AQ Report_FINAL.doc
threshold, a zero increase threshold, and a non-zero threshold, as well as multiple analysis options. The white paper is a resource guide developed to support local governments, and details tools for GHG assessment, emission models, and mitigation strategies to reduce potentially significant GHG emissions from a project.
Local Public Agencies
The Climate Change Strategy Group—formed by the air districts of Sacramento Region, Sacramento Metropolitan Utilities District, ARB, Sacramento Area Council of Governments (SACOG), City of Sacramento, and County of Sacramento—operates with the purpose of conducting a dialogue regarding what the agencies can do to educate the public and implement specific GHG-reducing measures.
On March 25, 2008, the El Dorado County Board of Supervisors adopted the “Environmental Vision for El Dorado County,” Resolution No. 29-2008, brought forward by the Youth Commission. The Resolution sets forth goals and calls for implementation of positive environmental changes to reduce global impact, improve air quality, reduce dependence on landfills, promote alternative energies, increase recycling, and encourage local governments to adopt green and sustainable practices.
EID was recognized in 2007 at the California Water Policy 17 Conference for leadership on climate change, based on EID’s programs that reduce demand for energy and plan for long-term water supply changes. In addition, EID has joined the California Climate Action Registry and, as such, will complete a third-party-verified inventory of its carbon dioxide (CO2) emissions.
Local agencies such as the County of El Dorado and EDAQMD do not have formal GHG reduction plans or recommended emission thresholds for determining significance of GHGs for CEQA analyses.
2.2 - Air Quality Setting
2.2.1 - Mountain Counties Air Basin (MCAB) MCAB comprises the mountainous area of the central and northern Sierra Nevada Mountains, from Plumas County south to Mariposa County. Elevations within MCAB range from several hundred feet above mean sea level (msl) in the foothills to over 10,000 feet above msl along the Sierra Crest (ARB 2008c). The general climate of MCAB varies considerably with elevation and proximity to the Sierra Crest. The variation in topography causes a wide variation in rainfall, temperature, and localized winds.
Transport
Transport is the term used to describe the flow of air pollutants from one geographic area to another. In the summer, a strong up-valley wind flows from the Broader Sacramento Area (BSA) into the

El Dorado Irrigation District - Highway 49 Intertie Improvements Project Air Quality Impact Analysis Report Setting
Michael Brandman Associates 17 S:\Projects\28490004 EID HWY 49 Intertie Improvements\Air Quality\Final Report\28490004 AQ Report_FINAL.doc
northern and central portions of MCAB. BSA includes the metropolitan portion of the southern Sacramento Valley Air Basin and extends east into El Dorado County to just east of Placerville.
ARB characterizes the transport of ozone from BSA into MCAB as “overwhelming”—meaning that the emissions from upwind area (BSA) independently resulted in a violation of the ozone standard in the downwind (MCAB) area. As such, the upwind area bears the responsibility for the violation. ARB concluded in its 1996 Transport Assessment that all violations of the ozone standard in the central portion of MCAB during 1994 and 1995 were due to overwhelming transport of pollutants from upwind areas. ARB’s analysis suggests that locally produced MCAB ozone precursor emissions were not significant enough to cause a local exceedance of the ozone standards (ARB 1996).
Climate and Meteorology
This section discusses both regional and site-specific meteorological conditions. Meteorology is the study of weather and climate. Weather refers to the state of the atmosphere at a given time and place relating to temperature, air pressure, humidity, cloudiness, and precipitation. Weather conditions occur over short periods, whereas climate is the general condition over long periods, generally at least 30 to 50 years.
El Dorado County’s climate is characterized by cold winters and hot summers, which is reflective of its location in the Sierra Foothills. The closest meteorological station is located in the City of Placerville, approximately 1.6 miles north of the Project. Temperatures in the Placerville area range from an average monthly high of 93.3 degrees Fahrenheit (ºF) in July to an average monthly low of 31.5 ºF in January. The average annual rainfall in the Project area, as recorded between 1941 and 2007, is 51.47 inches and the average annual snowfall is 59.20 inches.
Air quality is a function of both the rate and location of pollutant emissions under the influence of meteorological conditions and topographic features. Atmospheric conditions such as wind speed, wind direction, and air temperature gradients interact with the physical features of the landscape to determine the movement and dispersal of air pollutants and, consequently, their effect on air quality.
Inversions are also an important component of regional air quality. In general, air temperature decreases with distance from the earth’s surface, creating a gradient from warmer air near the ground to cooler air at elevation. Under normal circumstances, the air close to the earth warms as it absorbs surface heat and begins to rise. Winds occur when cooler air rushes in to take the place of the rising warm air. The wind and upward movement of air causes “mixing” in the atmosphere and can carry away or dilute pollution. Inversions occur when a layer of warm air sits over cooler air, trapping the cooler air beneath. These inversions trap pollutants from dispersing vertically and the mountainous terrain of MCAB traps the pollutants from dispersing horizontally. There are two main ways that inversions affect the area’s air quality. First, localized nighttime inversions that occur in the winter can trap pollutants, including smoke from wood stoves and fireplaces. Second, strong regional inversions in the adjacent San Joaquin Valley Air Basin are known to form with a mixing height (cap

El Dorado Irrigation District - Highway 49 Intertie Improvements Project Air Quality Impact Analysis Report Setting
Michael Brandman Associates 18 S:\Projects\28490004 EID HWY 49 Intertie Improvements\Air Quality\Final Report\28490004 AQ Report_FINAL.doc
of the inversion) between 2,000 to 2,500 feet above msl during the summer, and at 500 to 1,000 feet above msl during the winter. The Project site is located approximately 1,800 feet above msl and thus may be affected by summer-time San Joaquin Valley Air Basin inversions.
2.2.2 - Regional Air Quality Background
An emissions inventory is an account of the amount of air pollution generated by various emissions sources. To estimate the sources and quantities of pollution, ARB, in cooperation with local air districts, other government agencies, and industry, maintains an inventory of California emission sources. Sources are subdivided into the four major emission categories: mobile, stationary, area-wide, and natural sources.
Mobile sources include on-road sources and off-road mobile sources. The on-road emissions inventory, which includes automobiles, motorcycles, and trucks, is based on an estimation of population, activity, and emissions of the on-road motor vehicles used in California. The off-road emissions inventory is based on an estimate of the population, activity, and emissions of various off-road equipment, including recreational vehicles, farm and construction equipment, lawn and garden equipment, forklifts, locomotives, commercial marine ships, and marine pleasure craft.
Stationary sources are large, fixed sources of air pollution, such as power plants, refineries, and manufacturing facilities. Stationary sources also include aggregated point sources. These include many small point sources, or facilities, that are not inventoried individually but are estimated as a group and reported as a single-source category. Examples include gas stations and dry cleaners. Each of the local air districts estimates the emissions for the majority of stationary sources within its jurisdiction. Stationary source emissions are based on estimates made by facility operators and local air districts. Emissions from specific facilities can be identified by name and location.
Area-wide sources include source categories associated with human activity that take place over a wide geographic area. Emissions from area-wide sources may be either from small, individual sources, such as residential fireplaces, or from widely distributed sources that cannot be tied to a single location, such as consumer products, and dust from unpaved roads or farming operations (such as tilling).
Natural, or non-anthropogenic, sources include source categories with naturally occurring emissions such as geogenic (e.g., petroleum seeps), wildfires, and biogenic emissions from plants.
El Dorado County Emissions Inventory
The 2006 emissions inventory for the MCAB portion of El Dorado County is available in ARB’s 2007 Almanac Emission Projection Data. Table 3 summarizes the estimated 2006 emissions for the main pollutants of concern in the MCAB portion of El Dorado County.

El Dorado Irrigation District - Highway 49 Intertie Improvements Project Air Quality Impact Analysis Report Setting
Michael Brandman Associates 19 S:\Projects\28490004 EID HWY 49 Intertie Improvements\Air Quality\Final Report\28490004 AQ Report_FINAL.doc
Table 3: 2006 El Dorado County MCAB Emissions Inventory
Tons per Day Emission Category
ROG NOx PM10
Stationary Sources 0.8 0.3 0.5
Area-wide Sources 3.7 0.5 16.7
Mobile Sources 8.0 5.8 0.3
Natural Sources 49.6 0.2 0.5
Total El Dorado in MCAB 62.1 6.8 18.0
Source: ARB 2008d.
ROG. Natural sources contributed approximately 80 percent of the 2006 ROG emissions, with biogenic (plant-generated) emissions constituting the majority of natural source missions. Mobile sources accounted for approximately 13 percent of the 2006 emissions inventory.
NOx. Mobile sources generated the majority of NOx emissions in the MCAB portion of El Dorado County at approximately 85 percent of the total NOx inventory.
PM10. For PM10, area-wide sources contributed more than 90 percent of the 2006 inventory. The main PM10-generating, area-wide sources include unpaved road dust, residential fuel combustion, and paved road dust.
2.2.3 - Local Air Quality Existing local air quality, historical trends, and projections of air quality are best evaluated by reviewing relevant air pollutant concentrations from near the Project area. ARB operates an air monitoring station on Gold Nugget Way in Placerville, approximately 1.6 miles north of the Project. The Placerville-Gold Nugget Way ambient air monitoring station (Placerville Station) measures 1-hour and 8-hour ozone, daily PM10, and 8-hour CO. Table 4 summarizes 2005 through 2007 published monitoring data from ARB’s Aerometric Data Analysis and Management System for the Placerville Station. As shown in Table 4, ambient air pollution concentrations in the Placerville area regularly exceeded the state 1-hour ozone standard and the federal 8-hour standard in the last 3 years. In the same timeframe, the Placerville area did not exceed the federal or state daily PM10 standards, or the federal or state CO standards.
Table 4: Air Quality Monitoring Summary
Air Pollutant, Averaging Time (Units) 2005 2006 2007
Ozone
Max 1-hour (ppm) Days > CAAQS (0.09 ppm)
0.114 17
0.114 23
0.115 4
Max 8-hour (ppm) 1 Days > CAAQS (0.07 ppm)
0.105 48
0.103 63
0.107 20

El Dorado Irrigation District - Highway 49 Intertie Improvements Project Air Quality Impact Analysis Report Setting
Michael Brandman Associates 20 S:\Projects\28490004 EID HWY 49 Intertie Improvements\Air Quality\Final Report\28490004 AQ Report_FINAL.doc
Air Pollutant, Averaging Time (Units) 2005 2006 2007
Days > 1997 NAAQS (0.08 ppm) 16 20 4
Carbon Monoxide
Max 8-hour (ppm) Days > CAAQS (9.0 ppm) Days > NAAQS (9.0 ppm)
0.68 0 0
* * *
* * *
Particulate Matter (PM10)
California Annual Mean (20 µg/m3) 12.9 14.1 13.6
Max 24-hour (µg/m3) 1 Days > CAAQS (50 µg/m3) Days > NAAQS (150 µg/m3)
25.0 0 0
33.0 0 0
36.0 0 0
Abbreviations: > = exceed ppm = parts per million µg/m3 = micrograms per cubic meter * = insufficient or no data max = maximum CAAQS = California Ambient Air Quality Standard NAAQS = National Ambient Air Quality Standard Mean = Annual Arithmetic Mean 1. From the California measurement. Source: ARB 2008b.
Local Sources of Air Pollutants
Highway 49 and US Highway 50 (US 50) are the main sources of locally generated air pollution in the immediate vicinity of the Project. The Highway 49/Missouri Flat Road intersection sustained an estimated 23,100 annual average daily trips in 2007. The US 50/Missouri Flat Road interchange sustained an estimated 113,000 annual average daily trips in 2007 (CalTrans 2007).
Sensitive Receptors
Certain populations, such as children, the elderly, and persons with preexisting respiratory or cardiovascular illness, are particularly sensitive to the health impacts of air pollution. For purposes of CEQA, EDAQMD considers a sensitive receptor to be a location that houses or attracts children, the elderly, people with illnesses, or others who are especially sensitive to the effects of air pollutants. Examples of sensitive receptors include hospitals, residences, convalescent facilities, and schools.
The nearest sensitive receptors to the Project are residences located approximately 150 feet to 550 feet southeast of Missouri Flat road near Halyard Lane. In addition, there are no schools within 0.25 mile of the Project.
2.2.4 - Greenhouse Gas Emissions and Climate Change Constituent gases of the Earth’s atmosphere called GHGs play a critical role in the Earth’s radiation budget by trapping infrared radiation emitted from the Earth’s surface, which would otherwise have escaped into space. Prominent GHGs contributing to this process include CO2, methane (CH4), ozone, water vapor, nitrous oxide (N2O), and chlorofluorocarbons (CFCs). This phenomenon, known as the “Greenhouse Effect,” is responsible for maintaining a habitable climate. Anthropogenic emissions of these GHGs in excess of natural ambient concentrations are widely held to be

El Dorado Irrigation District - Highway 49 Intertie Improvements Project Air Quality Impact Analysis Report Setting
Michael Brandman Associates 21 S:\Projects\28490004 EID HWY 49 Intertie Improvements\Air Quality\Final Report\28490004 AQ Report_FINAL.doc
responsible for the enhancement of the Greenhouse Effect, leading to a trend of unnatural warming of the Earth’s natural climate, known as global warming or climate change. Emissions of these gases that may contribute to inducing or exacerbating global warming are attributable to activities associated with the industrial/manufacturing, utilities, transportation, residential, and agricultural sectors (CEC 2006). Transportation is responsible for 41 percent of the State’s GHG emissions, followed by electricity generation (CEC 2006). Emissions of CO2 and N2O are by-products of fossil fuel combustion. Methane, a potent GHG, results from off-gassing associated with agricultural practices and landfills. Sinks of CO2 include uptake by vegetation and dissolution into the ocean.
GHGs are global pollutants, unlike ozone, carbon dioxide, particulate matter, and TACs, which are pollutants of regional and local concern. Worldwide, California is the 12th- to 16th-largest emitter of CO2 and is responsible for approximately 2 percent of the world’s CO2 emissions (CEC 2006).
Potential Environmental Effects
Worldwide, average temperatures are likely to increase by 1.8 degrees Celsius (°C) to 4°C, or approximately 3 degrees Fahrenheit (°F) to 7°F by the end of the 21st century (IPCC 2007a). However, a global temperature increase does not translate to a uniform increase in temperature in all locations on the earth. Regional climate changes are dependent on multiple variables, such as topography. One region of the Earth may experience increased temperature, increased incidents of drought and similar warming effects, whereas another region may experience a relative cooling. According to the IPCC’s Working Group II Report, climate change impacts to North America may include diminishing snowpack, increasing evaporation, exacerbated shoreline erosion, exacerbated inundation from sea level rising, increased risk and frequency of wildfire, increased risk of insect outbreaks, increased experiences of heat waves, and rearrangement of ecosystems, as species and ecosystem zones shift northward and to higher elevations (IPCC 2007b).
For California, climate change has the potential to incur/exacerbate the following environmental impacts (CAT 2006):
• Reduced precipitation; • Changes to precipitation and runoff
patterns; • Reduced snowfall (precipitation occurring
as rain instead of snow); • Earlier snowmelt; • Decreased snowpack; • Increased agricultural demand for water; • Intrusion of seawater into coastal aquifers;
• Increased agricultural growing season; • Increased growth rates of weeds, insect
pests and pathogens; • Inundation of low-lying coastal areas by
sea level rise; • Increased incidents and severity of
wildfire events; and, • Expansion of the range and increased
frequency of pest outbreaks.

El Dorado Irrigation District - Highway 49 Intertie Improvements Project Air Quality Impact Analysis Report Setting
Michael Brandman Associates 22 S:\Projects\28490004 EID HWY 49 Intertie Improvements\Air Quality\Final Report\28490004 AQ Report_FINAL.doc
Although certain environmental effects are widely accepted to be a potential hazard to certain locations, such as rising sea level for low-laying coastal areas, it is currently infeasible to predict all environmental effects of climate change on any one location.
2.3 - Pollutants of Concern
As described above, the Project area is designated nonattainment for the federal and state 8-hour ozone standards. In addition, the area is designated nonattainment for the state 1-hour ozone, and the 24-hour and annual PM10 standards. Because the area exceeds these health-based ambient air quality standards, ozone and PM10 are the main criteria pollutants of concern for the Project area. In addition, carbon monoxide is a pollutant of concern, due to the localized nature of CO hotspots (see the discussion below). Other pollutants of concern are TACs and GHGs.
The proposed Project is not expected to produce air emissions containing hydrogen sulfide, sulfates, and vinyl chloride; therefore, these pollutants will not be discussed.
The emissions sources and potential health effects of the pollutants of concern are described below.
2.3.1 - Ozone Description and Physical Properties: Ozone is a photochemical pollutant, as it is not emitted directly into the atmosphere but is formed by a complex series of chemical reactions between reactive organic gases (ROG), NOx, and sunlight. ROG and NOx, also called ozone precursors, are emitted from automobiles, solvents, and fuel combustion. Ozone is a regional pollutant that is generated over a large area and is transported and spread by the wind. In order to reduce ozone, it is necessary to control emissions of ozone precursors. Significant ozone formation generally requires an adequate amount of precursors in the atmosphere and several hours in a stable atmosphere with strong sunlight. These conditions are prevalent during the summer when thermal inversions are most likely to occur. As a result, summertime conditions of long periods of daylight and hot temperatures form ozone in the greatest quantities. During the summer, thermal inversions trap ozone from dispersing vertically, and high concentrations of this pollutant are prevalent.
Health Effects: Health effects of ozone can include the following: respiratory system irritation, reduction of lung capacity, asthma aggravation, inflammation and damage to lung cells, aggravated cardiovascular disease, chronic lung disease aggravation, and permanent lung damage (EPA 1999). The greatest health risk is to those who are active outdoors during smoggy periods, such as children, athletes, and outdoor workers. Ozone also damages natural ecosystems such as forests and foothill communities, and damages agricultural crops and materials such as rubber, paint, and plastics.
Sources: Ozone is a secondary pollutant; thus, it is not emitted directly into the lower level of the atmosphere. The sources of ozone precursors (ROG and NOx) are discussed above in the description of ozone as well as the discussions concerning ROG and NOx.

El Dorado Irrigation District - Highway 49 Intertie Improvements Project Air Quality Impact Analysis Report Setting
Michael Brandman Associates 23 S:\Projects\28490004 EID HWY 49 Intertie Improvements\Air Quality\Final Report\28490004 AQ Report_FINAL.doc
Nitrogen Oxides
Description and Physical Properties: During combustion of fossil fuels, oxygen reacts with nitrogen to produce NOx (NO, NO2, N2O, N2O3, N2O4, and N2O5). This occurs primarily in motor vehicle internal combustion engines and fossil fuel-fired electric utility and industrial boilers. As discussed previously, NOx is an ozone precursor, which means that when it is emitted into the atmosphere, it forms or may cause ozone to be formed. When NOx and VOC are released in the atmosphere, they can chemically react with one another in the presence of sunlight to form ozone. NOx can also be a precursor to PM10 and PM2.5. NOx can react with moisture, ammonia, and other compounds to form nitric acid and related particles. This deposition can harm natural resources and materials.
Health Effects: EPA has concluded that the only form of NOx that exists at a level high enough to cause public health concerns is nitrogen dioxide (NO2) (EPA 1997). Nitrogen dioxide is a brown gas with a strong odor. The main human health concerns of nitrogen dioxide include lung damage, increased incidence of chronic bronchitis, eye, and mucus membrane damage, negative effects on the respiratory system, pulmonary dysfunction, and premature death. Small particles can penetrate deeply into the sensitive tissue of the lungs; can cause or worsen respiratory disease such as emphysema, asthma, and bronchitis; and can aggravate existing heart disease (EPA 2007b).
Because NOx is an ozone precursor, the health effects associated with ozone (as discussed above) are also indirect health effects associated with unhealthful levels of NOx emissions.
Sources: Natural sources of oxides of nitrogen (NOx) include lightning, soils, wildfires, stratospheric intrusion, and the oceans. Natural sources accounted for approximately 7 percent of 1990 emissions of NOx by the United States.
Reactive Organic Gases and Volatile Organic Compounds
Description and Physical Properties: ROGs, also referred to as volatile organic compounds (VOCs), are defined as any compound of carbon, excluding carbon monoxide, carbon dioxide, carbonic acid, metallic carbides or carbonates, and ammonium carbonate, that participates in atmospheric photochemical reactions. Although there are slight differences in the definition of ROG and VOC, the two terms are often used interchangeably. ROGs consist of non-methane hydrocarbons and oxygenated hydrocarbons. Hydrocarbons are organic compounds that contain only hydrogen and carbon atoms. Non-methane hydrocarbons are hydrocarbons that do not contain the unreactive hydrocarbon, methane. Oxygenated hydrocarbons are hydrocarbons with oxygenated functional groups attached.
There are no state or national ambient air quality standards for ROGs because they are not classified as criteria pollutants. They are regulated, however, because ROG is an ozone precursor. As such, a reduction in ROG emissions reduces certain chemical reactions that contribute to the formulation of

El Dorado Irrigation District - Highway 49 Intertie Improvements Project Air Quality Impact Analysis Report Setting
Michael Brandman Associates 24 S:\Projects\28490004 EID HWY 49 Intertie Improvements\Air Quality\Final Report\28490004 AQ Report_FINAL.doc
ozone. ROGs are also transformed into organic aerosols in the atmosphere, which contribute to higher PM10 and lower visibility.
Health Effects: Although health-based standards have not been established for ROG, health effects can occur from exposures to high concentrations because of interference with oxygen uptake. In general, concentrations of ROG are suspected to cause eye, nose, and throat irritation; headaches; loss of coordination; nausea; and damage to the liver, kidneys, and the central nervous system (EPA 2007c).
2.3.2 - Particulate Matter (PM10 and PM2.5) Description and Physical Properties: Particulate matter is a generic term that defines a broad group of chemically and physically different particles (either liquid droplets or solids) that can exist in a wide range of sizes. Examples of atmospheric particles include those produced from combustion (diesel soot or fly ash), light produced (urban haze), sea spray produced (salt particles), and soil-like particles from re-suspended dust. In discussions of air pollution, particulate matter is typically divided into two size categories, PM10 and PM2.5, because of the adverse health effects associated with the smaller-sized particles. PM10 refers to particulate matter that is 10 microns or less in diameter (1 micron is one-millionth of a meter, also known as micrometer [µm]). PM2.5 refers to particulate matter that is 2.5 microns or less in diameter. Soil dust consists of the minerals and organic material found in soil being lifted up into the air by winds. Fugitive dust is entrained particulate matter caused by anthropogenic activities (grading, road dust) or natural occurrences (windblown dust).
Health Effects: Particulate matter can be inhaled into the lungs, where it can be absorbed into the bloodstream. It is a respiratory irritant and can cause direct pulmonary effects such as coughing, bronchitis, lung disease, respiratory illnesses, increased airway reactivity, and exacerbation of asthma. Particulate matter is also thought to have direct effects on the heart (EPA 2003). Relatively recent mortality studies have shown a statistically significant direct association between mortality and daily concentrations of particulate matter in the air. Non-health effects include reduced visibility and soiling of property.
Sources: Particulate matter originates from a variety of stationary and mobile sources. Stationary sources include fuel combustion for electrical utilities, residential space heating, and industrial processes; construction and demolition; metals, minerals, and petrochemicals; wood products processing; mills and elevators used in agriculture; erosion from tilled lands; and waste disposal and recycling. Mobile or transportation-related sources include particulate matter from highway vehicles, and non-road vehicles and fugitive dust from paved and unpaved roads.
Diesel Particulate Matter
Description and Physical Properties: Diesel particulate matter (DPM) is a subset of PM2.5—diesel particles are typically 2.5 microns and smaller. In 1998, DPM made up about 6 percent of the total

El Dorado Irrigation District - Highway 49 Intertie Improvements Project Air Quality Impact Analysis Report Setting
Michael Brandman Associates 25 S:\Projects\28490004 EID HWY 49 Intertie Improvements\Air Quality\Final Report\28490004 AQ Report_FINAL.doc
PM2.5 inventory nationwide (EPA 2002). Diesel exhaust is a complex mixture of thousands of particles and gases that are produced when an engine burns diesel fuel. Organic compounds account for 80 percent of the total particulate matter mass, which consist of compounds such as hydrocarbons and their derivatives, and polycyclic aromatic hydrocarbons (PAHs) and their derivatives. Fifteen PAHs are confirmed carcinogens, a number of which are found in diesel exhaust (NTP 2005). The chemical composition and particle sizes of DPM vary among different engine types (heavy-duty, light-duty), engine operating conditions (idling, accelerating, decelerating), expected load, engine emission controls, fuel formulations (high/low sulfur fuel), and engine year (EPA 2002).
Non-Cancer Health Effects: Some short-term (acute) effects of diesel exhaust exposure include eye, nose, throat, and lung irritation, and exposure can cause coughs, headaches, light-headedness, and nausea. Diesel exhaust is a major source of ambient particulate matter pollution in urban environments. Numerous studies have linked elevated particle levels in the air to increased hospital admissions, emergency room visits, asthma attacks, and premature deaths among those suffering from respiratory problems (OEHHA 2002).
Cancer Health Effects: Human studies on the carcinogenicity of DPM demonstrate an increased risk of lung cancer, although the increased risk cannot be clearly attributed to diesel exhaust exposure (NTP 2005).
Sources: Sources of DPM include mobile and stationary diesel-fueled engines.
2.3.3 - Carbon Monoxide Description and Properties: Carbon monoxide (CO) is a colorless, odorless, toxic gas produced by incomplete combustion of carbon-containing fuels (e.g., gasoline, diesel fuel, and biomass). CO is a primary pollutant, which means that it is emitted directly into the air (unlike secondary pollutants such as ozone that are formed by the reactions of other pollutants). CO levels tend to be highest during the winter months when the meteorological conditions favor the accumulation of pollutants. This occurs when relatively low inversion levels trap pollutants near the ground and concentrate the CO (EPA 2007a). However, because CO is somewhat soluble in water, rainfall and fog can suppress CO conditions.
Health Effects: CO is essentially inert to plants and materials but can have significant effects on human health. CO gas enters the body through the lungs, dissolves in the blood, and replaces oxygen as an attachment to hemoglobin. This binding reduces available oxygen in the blood and, therefore, reduces oxygen delivery to the body’s organs and tissues. Effects on humans range from slight headaches, to nausea, to death. Elevated levels of CO can also cause visual impairments, reduced manual dexterity, poor learning ability, reduced work capacity, and trouble performing complex tasks. For people with heart disease, exposure to CO at low levels may cause chest pain and reduced ability to exercise; repeated exposures may contribute to other cardiovascular effects (EPA 2007d).

El Dorado Irrigation District - Highway 49 Intertie Improvements Project Air Quality Impact Analysis Report Setting
Michael Brandman Associates 26 S:\Projects\28490004 EID HWY 49 Intertie Improvements\Air Quality\Final Report\28490004 AQ Report_FINAL.doc
Sources: CO is produced by incomplete combustion of carbon-containing fuels (e.g., gasoline, diesel fuel, and biomass). The primary source of CO is from on-road motor vehicles. It is a component of motor vehicle exhaust, which contributes about 56 percent of all CO emissions nationwide. Other non-road engines and vehicles (such as construction equipment and boats) contribute about 22 percent of all CO emissions nationwide. Higher levels of CO generally occur in areas with heavy traffic congestion. Other sources of CO emissions include industrial processes (such as metals processing and chemical manufacturing), residential woodburning, and natural sources such as forest fires. Woodstoves, gas stoves, cigarette smoke, and unvented gas and kerosene space heaters are sources of CO concentrations indoors.
2.3.4 - Naturally Occurring Asbestos Description and Properties: NOA is present in certain rock formations such as serpentinite or ultramafic rocks. Rock formations that contain NOA are known to be present in 44 of California’s 58 counties, including El Dorado County. Crushing or breaking these rocks, through construction or other means, can release asbestoform fibers into the air.
Health Effects: Exposure to asbestos fibers may result in health issues such as lung cancer, mesotheliomia (a rare cancer of the thin membranes lining the lungs, chest, and abdominal cavity), and asbestosis (a non-cancerous lung disease that causes scarring of the lungs).
Sources: Sources of NOA emissions include unpaved roads or driveways surfaced with source rock, construction activities in source rock deposits, or rock quarrying activities where asbestoform rock is present. NOA-containing rock formations are predominantly located in the western portion of El Dorado County. As discussed above, DMG has a published guide for generally identifying areas that are likely to contain NOA in western El Dorado County. The nearest known location of NOA is approximately 4.5 miles west of the Project. Therefore, the Project is not in an area that is likely to contain naturally occurring asbestos (DMG 2002).
2.3.5 - Greenhouse Gases Gases that trap heat in the atmosphere are GHGs, analogous to the way a greenhouse retains heat. The accumulation of GHGs in the atmosphere regulates the earth’s temperature. However, human activities have increased the amount of GHGs in the atmosphere. Some GHGs can remain in the atmosphere for hundreds of years. The following GHGs are defined under Assembly Bill 32 but are not expected to be generated by the Project: chlorofluorocarbons, hydrofluorocarbons, perfluorocarbons, and sulfur hexafluoride.
The term “global warming potential” is the potential of a gas to contribute to global warming; it is based on a reference scale with carbon dioxide at 1. Some pollutants are more potent than carbon dioxide, which is reflected by a higher global warming potential. The following is a brief description of the most common GHGs that may be emitted by the Project.

El Dorado Irrigation District - Highway 49 Intertie Improvements Project Air Quality Impact Analysis Report Setting
Michael Brandman Associates 27 S:\Projects\28490004 EID HWY 49 Intertie Improvements\Air Quality\Final Report\28490004 AQ Report_FINAL.doc
Carbon dioxide. Carbon dioxide (CO2) is an odorless, colorless natural greenhouse gas. CO2 is emitted from natural and anthropogenic sources. Natural sources include the following: decomposition of dead organic matter; respiration of bacteria, plants, animals, and fungus; evaporation from oceans; and volcanic outgassing. Anthropogenic sources are from burning coal, oil, natural gas, gasoline, and wood. As discussed above, CO2 has a global warming potential of 1.
Methane. Methane is a flammable greenhouse gas. A natural source of methane is from the anaerobic decay of organic matter. Geological deposits, known as natural gas fields, also contain methane, which is extracted for fuel. Other sources are from landfills, fermentation of manure, and ruminants such as cattle. Methane has a global warming potential of 21.
Nitrous oxide. Nitrous oxide, also known as laughing gas, is a colorless greenhouse gas. Nitrous oxide is produced by microbial processes in soil and water, including those reactions that occur in fertilizer containing nitrogen. In addition to agricultural sources, some industrial processes (fossil fuel-fired power plants, nylon production, nitric acid production, and vehicle emissions) also contribute to its atmospheric load. Nitrous oxide is a highly potent greenhouse gas with a global warming potential of 310.

El Dorado Irrigation District - Highway 49 Intertie Improvements Project Air Quality Impact Analysis Report Thresholds
Michael Brandman Associates 28 S:\Projects\28490004 EID HWY 49 Intertie Improvements\Air Quality\Final Report\28490004 AQ Report_FINAL.doc
SECTION 3: THRESHOLDS
The following significance thresholds are from Appendix G of the CEQA Guidelines. Based on these guidelines, a significant impact would occur if the Project would:
a) Conflict with or obstruct implementation of the applicable air quality plan;
b) Violate any air quality standard or contribute substantially to an existing or projected air quality violation;
c) Result in a cumulatively considerable net increase of any criteria pollutant for which the Project region is nonattainment under an applicable Federal or state ambient air quality standard (including releasing emissions which exceed quantitative thresholds for ozone precursors);
d) Expose sensitive receptors to substantial pollutant concentrations; or
e) Create objectionable odors affecting a substantial number of people. While the final determination of whether or not a project is significant is within the purview of the lead agency pursuant to CEQA Guidelines Section 15064(b), EDAQMD recommends that its quantitative and qualitative air pollution thresholds be used to determine the significance of project air impacts.
3.1.1 - Air Quality Attainment Plan Consistency The CEQA Guide states that projects in MCAB are consistent with the AQAP if:
• The project does not require a change in the existing land use designation (i.e., general plan amendment, rezone), and projected emissions (ROG, NOx, CO or PM10) from the project are equal [to] or less than the emissions anticipated for the site if developed under the existing land use designation;
• The project does not exceed the “project alone” significance criteria;
• The lead agency for the project requires the project to implement any applicable emission reduction measures contained in and/or derived from the AQAP; or
• The project complies with all applicable EDAQMD rules and regulations. 3.1.2 - Regional Significance Thresholds The following regional significance thresholds have been established by EDAQMD. Projects within El Dorado County with construction- or operation-related emissions of the ozone precursors ROG or NOx in excess of 82 lbs/day are considered significant. According to EDAQMD’s CEQA Guide, EDAQMD based the ozone precursor thresholds on the offset requirements for NOx and ROG

El Dorado Irrigation District - Highway 49 Intertie Improvements Project Air Quality Impact Analysis Report Thresholds
Michael Brandman Associates 29 S:\Projects\28490004 EID HWY 49 Intertie Improvements\Air Quality\Final Report\28490004 AQ Report_FINAL.doc
contained in Rule 523 (New Source Review). The thresholds contained in the CEQA Guide are based on the version of Rule 523 in effect at the time that the CEQA Guide was prepared in 2002. Rule 523 has been amended twice since 2001, with the last update approved in June 2006. The offsets specified in the current Rule 523 are more stringent than those referenced in the CEQA Guide. However, EDAQMD recommends that the thresholds contained in the CEQA Guide be used until a revised CEQA Guide is approved by EDAQMD’s Board.
Construction or operational emissions greater than the thresholds presented in Table 5 are considered significant.
Table 5: Regional Thresholds
Pollutant Pounds per Day
NOx 82
ROG 82
Source: EDAQMD 2002.
3.1.3 - Other Criteria Pollutants Project-generated emissions are considered significant if they cause or substantially contribute to a localized violation of the other criteria pollutants, including CO, PM10, SO2, NO2, sulfates, lead, and H2S. The CEQA Guide contains detailed screening criteria for each pollutant to determine if dispersion (emissions concentration) analysis is warranted.
3.1.4 - Visibility Threshold Project-generated emissions are considered significant if they would cause or contribute significantly to a violation of the state visibility standard, which is 10 miles when relative humidity is less than 70 percent. The CEQA Guide provides the following screening criteria:
If a project is not expected to result in a significant impact for ozone or PM10, based on the criteria for those pollutants, it may be presumed that no significant visibility impacts will result.
3.1.5 - Health Risk Thresholds EDAQMD has defined the following health risk thresholds for TACs:
• The lifetime probability of contracting cancer is greater than one in one million (ten in one million if Toxic Best Available Control Technology [T-BACT] is applied): or,
• The ground-level concentration of non-carcinogenic toxic air contaminants would result in a Hazard Index of greater than one.

El Dorado Irrigation District - Highway 49 Intertie Improvements Project Air Quality Impact Analysis Report Thresholds
Michael Brandman Associates 30 S:\Projects\28490004 EID HWY 49 Intertie Improvements\Air Quality\Final Report\28490004 AQ Report_FINAL.doc
3.1.6 - Contribution to Climate Change Threshold In addition to EDAQMD and Appendix G thresholds, this report proposes a contribution to climate change threshold. The potential effect of GHG emissions on climate change is an emerging issue that warrants discussion under CEQA. Unlike the pollutants discussed above that may have regional and/or local effects, Project-generated GHG emissions do not directly produce local or regional environmental impacts but may contribute to an impact on the global climate. Individual projects contribute relatively small amounts of GHGs that, when added to all other GHG-emitting activities around the world, result in global increases in these emissions. Local or regional environmental effects may occur if the regional or local climate changes as a result. For the purposes of analyzing the Project’s potential to contribute to climate change, the following threshold is used:
Does the Project comply with provisions of an adopted Greenhouse Gas Reduction Plan or Strategy? If no such Plan or Strategy is applicable, would the Project significantly hinder or delay California’s ability to meet the reduction targets contained in AB 32?
3.1.7 - Cumulative Impacts Chapter 8 of the CEQA Guide states that a project is considered to have a cumulatively significant impact if one or more of the following conditions is met:
• The project is not consistent with the applicable AQAP; • The project would individually exceed any other significance criteria in the CEQA Guide;
The CEQA Guide contains additional criteria based on whether the project is principally an industrial or development project based on operational emissions and activities. However, the proposed Project is not principally an industrial, residential, or other traditional land use project as used in the CEQA Guide. Therefore, this analysis uses only the first two criteria from the CEQA Guide.

El Dorado Irrigation District - Highway 49 Intertie Improvements Project Air Quality Impact Analysis Report Impact Analysis
Michael Brandman Associates 31 S:\Projects\28490004 EID HWY 49 Intertie Improvements\Air Quality\Final Report\28490004 AQ Report_FINAL.doc
SECTION 4: IMPACT ANALYSIS
4.1 - Emissions Calculation Methodology
Construction emissions can vary substantially from day to day, depending on the level of activity, the specific type of activity, and the prevailing weather conditions. The methodology developed for the purposes of quantitative air quality analysis was based on information available at the time of analysis; actual equipment and activity intensity at the time of construction may vary from those analyzed in this document. However, it is anticipated that the level of activity analyzed is representative of activities that will occur during construction. The main air emissions-generating construction activities associated with the Project include rough grading, pipeline construction, and final grading/paving. The main sources of air pollutants associated with the Project include off-road construction equipment exhaust, worker trips, and fugitive PM10 emissions.
EDAQMD recommends two screening criteria to determine if a project’s construction exhaust generation is less than significant for the ozone precursors reactive organic gases (ROG) and oxides of nitrogen (NOx): one is based on fuel use, the other on the incorporation of mitigation measures into the project description. If a project’s emissions are less than EDAQMD’s screening criteria, then ROG and NOx emissions do not need to be quantified and are assumed to be less than significant.
The amount of fuel to be used during Project construction is currently unknown. The Project does not fit the second screening criterion, as the mitigation measures identified in the criterion are not incorporated into the Project, nor is a commitment to pay mitigation fees incorporated into the Project. Therefore, the ROG and NOx emissions were estimated for the Project.
Off-road vehicle emissions were calculated using Sacramento Metropolitan Air Quality Management District’s (SMAQMD) Road Construction Emissions Model version 6.3.1 (Roadway Model). SMAQMD developed the Roadway Model to assess the emissions of linear construction projects. The construction activities as described by EID correspond to the following Roadway Model default phases: grading/excavation, drainage/utilities/subgrade, and paving. For the purposes of conservative analysis, MBA assumed that grading/excavation and drainage/utilities/subgrade would occur concurrently, followed by paving.
Modeling Assumptions EID estimated that excavation and pipeline construction would progress at a rate of approximately 100 feet per day, for a total of 58 days. MBA assumed that final paving would take 10 days.
The following types of construction equipment would be used to construct the Project: trucks, excavators, compactors, loaders, and graders. The number of each equipment type and daily hours of use for each piece of equipment are unknown. Therefore, the Roadway Model’s equipment use

El Dorado Irrigation District - Highway 49 Intertie Improvements Project Air Quality Impact Analysis Report Impact Analysis
Michael Brandman Associates 32 S:\Projects\28490004 EID HWY 49 Intertie Improvements\Air Quality\Final Report\28490004 AQ Report_FINAL.doc
assumptions were used for each phase. The Roadway Model default assumptions were also used to estimate emissions from construction worker trips, the use of a water truck, and fugitive dust.
The total Project length is approximately 5,800 feet, or 1.1 miles. This analysis assumed that the width of area to be disturbed by grading for the Project would be approximately 8 feet. Therefore, approximately 1.06 acres would be disturbed by grading. The analysis assumes that the maximum area to be disturbed on any one day of construction would be 0.3 acre.
The exact amount of soil that would be moved during the construction of the Project is unknown. EID estimates that up to one-third of the earth moved by trenching may be exported. At an assumed trench dimension of 4 feet wide by 4 feet deep and 100 feet of length per day, approximately 1,600 cubic feet (or 59 cubic yards) may be disturbed per day of trenching. Therefore, up to 19.7 cubic yards of soil may be hauled offsite per day, if necessary.
4.2 - Impact Assessment
This section identifies potential impacts to air quality resources and describes mitigation measures that can eliminate impacts or reduce them to a level that is less than significant.
4.2.1 - Localized Impacts The Project in and of itself would not increase vehicular travel on the roadways or otherwise generate operational emissions. Therefore, operational impacts, including CO, are less than significant, because the Project would not result in the activities that generate operational emissions.
Fugitive PM10 is the pollutant of concern for localized exceedance of state and federal standards from construction.
Fugitive PM10. The CEQA Guide states that mass emissions of fugitive dust need not be quantified, and may be assumed to be less than significant, if the project includes mitigation measures that would prevent visible dust beyond the property line, as detailed in Tables C.4 and C.5 of the CEQA Guide (EDAQMD 2002). This recommendation was made prior to EDAQMD’s adoption of Rule 223-1 (Fugitive Dust), which limits the fugitive dust from construction and construction-related activities. Construction of the Project would require compliance with Rule 223-1. Application of standard Best Management Practices to control dust during construction would reduce fugitive dust emissions to zero percent opacity (non visible) at the property line, thereby reducing the project’s potential fugitive dust emissions to less than significant.
As discussed previously, the Project will be constructed concurrently with the DOT’s Parkway project. DOT’s special contract provisions requiring compliance with EDAQMD Rules 223, 223-1, and 223-2, to minimize fugitive duest emissions, will cover construction of both this Project and the Parkway. As a result of the required compliance with these Rules, impacts associated with construction-related fugitive dust emissions are considered less than significant.

El Dorado Irrigation District - Highway 49 Intertie Improvements Project Air Quality Impact Analysis Report Impact Analysis
Michael Brandman Associates 33 S:\Projects\28490004 EID HWY 49 Intertie Improvements\Air Quality\Final Report\28490004 AQ Report_FINAL.doc
Level of Significance Before Mitigation
Less than significant.
Mitigation Measures
No mitigation is required.
Level of Significance After Mitigation
Less than significant
4.2.2 - Regional Impacts The Project region is nonattainment for ozone and PM10 standards, as discussed in the Regulatory Setting. The Project would not result in changes to the existing operational emissions associated with water transmission. Impacts for operational pollutants for which the Project region is nonattainment are less than significant, because the Project would not result in operational emissions.
Pollutants of concern from construction of the Project include fugitive PM10, as well as exhaust emissions of ROG, NOx, PM10 and CO.
Fugitive PM10. As discussed above, construction-generated PM10 is less than significant.
Construction Exhaust. Emissions were estimated for the Project’s main construction activities, which include grading/excavation, drainage/utilities/subgrade, and paving. Emissions from construction activities were calculated using the SMAQMD’s Roadway Model. The detailed emissions calculation methodology is provided in Section 4.1. The Roadway Model output for the Project is available at the end of this report, in Appendix A. Table 6 contains the estimated construction emissions for the Project.
Table 6: Construction Exhaust Emissions (2010)
Emissions (lbs/day) Source
ROG NOx PM10 CO
Grading/Excavation 5.5 39.9 2.1 22.5 Drainage/Excavation/Sub-Grade 4.8 33.5 1.9 17.8 Paving 3.4 16.0 1.4 10.1 Maximum Daily Emissions 10.3 73.4 4.0 40.3 Significance Threshold 82 82 AAQS AAQS
Significant Impact? No No No* No*
Notes: * Conforms to guidance from EDAQMD’s CEQA Guide. Source: MBA 2008b, Appendix A.

El Dorado Irrigation District - Highway 49 Intertie Improvements Project Air Quality Impact Analysis Report Impact Analysis
Michael Brandman Associates 34 S:\Projects\28490004 EID HWY 49 Intertie Improvements\Air Quality\Final Report\28490004 AQ Report_FINAL.doc
EDAQMD’s CEQA Guide states that if the estimated ROG and NOx emissions are less than EDAQMD’s thresholds, then exhaust emissions of CO and PM10 may also be deemed less than significant. Therefore, Project impacts would be less than significant for construction exhaust emissions of ROG and NOx, as well as CO and PM10.
Level of Significance Before Mitigation
Less than significant
Mitigation Measures
No mitigation is required.
Level of Significance After Mitigation
Less than significant.
4.2.3 - Health Risk The construction equipment would emit diesel particulate matter, which is a carcinogen. However, the diesel particulate matter emissions are short term in nature. Determination of risk from diesel particulate matter is based on a 70-year exposure time. Additionally, the nearest sensitive receptors (residences) would be located approximately 150 feet from the Project. As described in the Local Air Quality section, there are no schools within 0.25 mile of the Project. The nearest school, Herbert Green School, is located approximately 0.3 miles northwest of the western end of the project.
Therefore, considering the low amount of construction equipment activity expected, the dispersion of the emissions, and the short time frame, project impacts related to exposure to diesel particulate matter are anticipated to be less than significant.
Level of Significance Before Mitigation
Less than significant.
Mitigation Measures
No mitigation is required.
Level of Significance After Mitigation
Less than significant.
4.2.4 - Odor Land uses typically associated with odors include wastewater treatment facilities, waste-disposal facilities, or agricultural operations. The Project would not construct land uses typically associated with emitting objectionable odors.

El Dorado Irrigation District - Highway 49 Intertie Improvements Project Air Quality Impact Analysis Report Impact Analysis
Michael Brandman Associates 35 S:\Projects\28490004 EID HWY 49 Intertie Improvements\Air Quality\Final Report\28490004 AQ Report_FINAL.doc
Diesel exhaust and ROG, which are objectionable to some, would be emitted during construction of the Project; however, emissions would disperse rapidly from the Project and, therefore, would not occur at a level that would induce a negative response. Therefore, odor impacts would be less than significant.
Level of Significance Before Mitigation
Less than significant.
Mitigation Measures
No mitigation is required.
Level of Significance After Mitigation
Les than significant.
4.2.5 - Conformance with Air Quality Attainment Plan As discussed in the Regulatory Setting section, the applicable AQAP for the Project area is the 1994 Sacramento Regional Clean Air Plan. The four criteria for determining consistency with the AQAP are discussed in Section 3, above.
The Project does not require a change in the existing land use designation and would comply with all applicable EDAQMD rules and regulations, as is required by law. The lead agency, EID, is required by law to implement the applicable emission reduction measures contained in and derived from the AQAP, including applicable rules and regulations.
The localized and regional analyses address the project-alone impacts for criteria pollutants for which the Project area is designated nonattainment. As discussed above, the Project would not exceed the project-alone thresholds of significance for ozone precursors or PM10.
Level of Significance Before Mitigation
Less than significant.
Mitigation Measures
No mitigation is required.
Level of Significance After Mitigation
Less than significant.
4.2.6 - Greenhouse Gas and Climate Change This report does not just analyze whether the Project would result in an increase in GHG emissions, but also assesses whether the Project would result in an increase in GHGs that would significantly hinder or delay the State’s ability to meet the reduction targets contained in AB 32.

El Dorado Irrigation District - Highway 49 Intertie Improvements Project Air Quality Impact Analysis Report Impact Analysis
Michael Brandman Associates 36 S:\Projects\28490004 EID HWY 49 Intertie Improvements\Air Quality\Final Report\28490004 AQ Report_FINAL.doc
This analysis contains two components. One component consists of the Project’s GHG emissions inventory. The emissions inventory describes the sources of emissions, the emissions without incorporation of mitigation measures, and the emissions after the incorporation of mitigation measures, if required. The second component consists of the measures used to compare the Project with the applicable state and local strategies and known mitigation measures to reduce GHGs. In the discussion below, the unmitigated emissions inventory are provided before the state and local strategies.
Emissions Inventory
The Project would emit GHGs during construction due to the combustion of fuels in worker vehicles accessing the site as well as from the construction equipment.
The Project would also emit GHGs during the manufacture and transportation of pipes. However, emissions resulting from materials consumption are not incorporated into the Project’s emissions estimates. CEQA does not require a “lifecycle” analysis approach to determine significance of potential environmental impacts.
Exhaust emissions that would occur during construction of the Project were estimated using SMAQMD’s Roadway Model, using the same methodology as for the impacts above. The daily emissions rate per construction phase, in terms of pounds per day, and the total tons that would be emitted by the Project are presented in Table 7. The detailed calculations underlying these estimates are provided in Appendix A.
Table 7: Project GHG Emissions
CO2 Emissions Source lbs/day Total Tons
Grading/Excavation 3,841.1
Drainage/Utilities/Sub-Grade 3,074.2
Paving 1,389.3
156.7
Source: MBA 2008b.
Applicable State and Local Strategies, Known Mitigation
Under AB 32, ARB has the primary responsibility for reducing GHG emissions. However, the many public agencies involved in land use decisions, energy use, waste streams, construction, and other areas also are involved in the creation and implementation of strategies to reduce GHG emissions in California. The CAT addresses strategies for certain California public agencies. In addition, the California Attorney General’s office has been active in advising public agencies on reducing GHG emissions. Therefore, this analysis focuses on the Project’s early implementation of applicable state strategies. State strategies include measures in the 2006 CAT Report and ARB’s Early Action Measures. This analysis also focuses on the Project’s implementation of the applicable California

El Dorado Irrigation District - Highway 49 Intertie Improvements Project Air Quality Impact Analysis Report Impact Analysis
Michael Brandman Associates 37 S:\Projects\28490004 EID HWY 49 Intertie Improvements\Air Quality\Final Report\28490004 AQ Report_FINAL.doc
Attorney General’s Office suggested mitigation strategies for reducing GHG emissions. To assess significance, the following documents were used.
• The 2006 CAT Report to Governor Schwarzenegger (CAT 2006).
• ARB’s Expanded List of Early Action Measures to Reduce Greenhouse Gas Emissions in California (ARB 2007).
• California Attorney General’s Office Mitigation Letter (AG 2008). As discussed in the Regulatory Setting, none of the 2006 CAT Report measures, ARB Early Action Measures, or Attorney General measures apply to the project. Conclusion
The Project would generate a minor amount of construction-related carbon dioxide, with most of the emissions generated by off-road construction equipment and construction worker trips. Currently, there are no known mitigation measures that directly reduce GHG emissions from construction equipment. Construction activities that generate GHGs are limited to the installation of Project waterlines. The Project would not directly generate long-term operational GHGs. The Project would build capacity for an increase water conveyance, which could lead to increased GHGs through water procurement, transport, treatment, and use. However, the limiting factor for water conveyance is the capacity at the existing treatment plant, which has already been analyzed for environmental effects through an approved CEQA document. Because of the Project’s limited GHG generation during construction, and because it would not directly lead to ongoing operational emissions, the Project would not significantly hinder or delay California’s ability to meet the reduction targets contained in AB 32
Level of Significance Before Mitigation
Less than significant.
Mitigation Measures
No mitigation is required.
Level of Significance After Mitigation
Less than significant.
4.2.7 - Cumulative Impacts Without mitigation, the Project is consistent with the AQAP, as discussed in above. Project impacts are less than significant for the ozone precursors ROG and NOx, as well as the remaining criteria pollutants. Therefore, the Project would not substantially contribute to a cumulative impact.

El Dorado Irrigation District - Highway 49 Intertie Improvements Project Air Quality Impact Analysis Report Impact Analysis
Michael Brandman Associates 38 S:\Projects\28490004 EID HWY 49 Intertie Improvements\Air Quality\Final Report\28490004 AQ Report_FINAL.doc
Level of Significance Before Mitigation
Less than significant.
Mitigation Measures
No mitigation is required.
Level of Significance After Mitigation
Less than significant.

El Dorado Irrigation District - Highway 49 Intertie Improvements Project Air Quality Impact Analysis Report References
Michael Brandman Associates 39 S:\Projects\28490004 EID HWY 49 Intertie Improvements\Air Quality\Final Report\28490004 AQ Report_FINAL.doc
SECTION 5: REFERENCES
AG 2008 California Attorney General. The California Environmental Quality Act: Addressing Global Warming Impacts at the Local Agency Level. Updated May 21, 2008.
ARB 2008a California Air Resources Board. June 26, 2008. Ambient Air Quality Standards. Website: www.arb.ca.gov/research/aaqs/aaqs2.pdf. Accessed July 24, 2008.
ARB 2008b California Air Resources Board. Historical Air Quality, Top 4 Summary. Website: www.arb.ca.gov/adam/cgi-bin/db2www/adamtop4b.d2w/start. Accessed September 15, 2008.
ARB 2008c California Air Resources Board. 2008. The Know Zone – California Air Basins General Information. Website http://www.arb.ca.gov/knowzone/basin/basin.htm. Accessed June 5, 2008
ARB 2008d California Air Resources Board. Almanac of Emission Projection Data, 2006: Estimated Annual Average Emissions, El Dorado County – Mountain Counties Air Basin, All Sources. Website: http://www.arb.ca.gov/app/emsinv/ emseic1_query.php. Accessed September 22, 2008.
ARB 2007 California Air Resources Board. 2007. Expanded List of Early action Measures to Reduce Greenhouse Gas Emissions in California Recommended for Board Consideration. October.
ARB 2006 California Air Resources Board. 2006. Area Designation Maps/State and National. 2004 State Area Designations. Website updated September 29, 2006. Website: www.arb.ca.gov/desig/adm/adm.htm. Accessed September 22, 2008.
ARB 2005a California Environmental Protection Agency. California Air Resources Board. Air Quality and Land Use Handbook: A Community Health Perspective. April 2005. Website: www.arb.ca.gov/ch/landuse.htm. Accessed May 2008.
ARB 2005b California Air Resources Board. Airborne Toxic Control Measure to Limit Diesel-Fueled Commercial Motor Vehicle Idling. Website: www.arb.ca.gov/regact/idling/idling.htm. Accessed May 2008.
ARB 1996 California Air Resources Board. 1996. Second Triennial Review of the Assessment of Impacts of Transported Pollutants on Ozone Concentrations in California (revised). November.
CalTrans 2007 California Department of Transportation. 2007. Traffic and Vehicles Data Systems Unit, 2007: All Traffic Volumes on CSHS. Website: http://www.dot.ca.gov/hq/traffops/saferesr/trafdata/2007all.htm. Accessed December 2, 2008.
CAT 2006 State of California, Environmental Protection Agency, Climate Action Team. March 2006. Climate Action Team Report to Governor Schwarzenegger and the California Legislature.

El Dorado Irrigation District - Highway 49 Intertie Improvements Project Air Quality Impact Analysis Report References
Michael Brandman Associates 40 S:\Projects\28490004 EID HWY 49 Intertie Improvements\Air Quality\Final Report\28490004 AQ Report_FINAL.doc
CEC 2006 California Energy Commission, California Climate Change Center. July 2006. Our Changing Climate, Accessing the Risks to California. CEC-500-2006-077. Website: www.energy.ca.gov/2006publications/CEC-500-2006-077/CEC-500-2006-077.PDF
DMG 2002 Department of Conservation, Division of Mines and Geology. 2002. Areas More Likely to Contain Natural Occurrences of Asbestos in Western El Dorado County, California.
EID 2008a El Dorado Irrigation District. April 28, 2008. 2008-2012 Capital Improvement Program
EID 2008b El Dorado Irrigation District. September 26, 2008. Notice to Proceed for Highway 49 Intertie Improvements.
EDAQMD 2002 El Dorado Air Quality Management District. 2002. Guide to Air Quality Assessment: Determining Significance of Air Quality Impacts Under the California Environmental Quality Act. First Edition. February.
EPA 2008a U.S. Environmental Protection agency. Criteria Pollutants. Website: http://www.epa.gov/oar/oaqps/greenbk/o3co.html. Accessed September 22, 2008.
EPA 2008b U.S. Environmental Protection Agency. 2008. Green Book Nonattainment Areas for Criteria Pollutants. Website: www.epa.gov/air/oaqps/greenbk/. Accessed September 22, 2008.
EPA 2007a U.S. Environmental Protection Agency. 2006. CO: What is it? Where does it come from? Website: www.epa.gov/air/urbanair/co/what1.html. Accessed in May 2008.
EPA 2007b U.S. Environmental Protection Agency. Six Common Air Pollutants. Health and Environmental Impacts of NOx. Website: www.epa.gov/air/urbanair/nox/hlth.html. Accessed May 2008.
EPA 2007c U.S. Environmental Protection Agency. Indoor Air Quality. Sources of Indoor Air Pollution - Organic Gases (Volatile Organic Compounds - VOCs) Website: www.epa.gov/iaq/voc.html. Accessed May 2008.
EPA 2007d U.S. Environmental Protection Agency. Health and Environmental Impacts of CO. Website: www.epa.gov/air/urbanair/co/hlth1.html. Accessed May 2008.
EPA 2003 U.S. Environmental Protection Agency. September 2003. Particle Pollution and your Health. EPA-452/F-03-001. Website: http://epa.gov/pm/pdfs/pm-color.pdf. Accessed May 2008.
EPA 2002 U.S. Environmental Protection Agency. Health Assessment Document for Diesel Engine Exhaust. EPA/600/8-90/057F. May 2002. Website: http://cfpub.epa.gov/ncea/cfm/recordisplay.cfm?deid=29060. Accessed May 2008.

El Dorado Irrigation District - Highway 49 Intertie Improvements Project Air Quality Impact Analysis Report References
Michael Brandman Associates 41 S:\Projects\28490004 EID HWY 49 Intertie Improvements\Air Quality\Final Report\28490004 AQ Report_FINAL.doc
EPA 1999 U.S. Environmental Protection Agency. Ozone and Your Health. 1999. EPA-452/F-99-003. Website: www.epa.gov/air/ozonepollution/pdfs/health.pdf Accessed May 2008.
EPA 1997 U.S. Environmental Protection Agency. Office of Air and Radiation. Nitrogen Oxides: Impact on Public Health and the Environment. 1997. http://www.epa.gov/ttn/oarpg/t1/reports/noxrept.pdf. Accessed May 2008.
IPCC 2007a Intergovernmental Panel on Climate Change, 2007: Summary for Policymakers. In: Climate Change 2007: The Physical Science Basis. Contribution of Working Group I to the Fourth Assessment Report of the Intergovernmental Panel on Climate Change [Solomon, S., D. Qin, M. Manning, Z. Chen, M. Marquis, K.B. Averyt, M. Tignor and H.L. Miller (eds.)]. Cambridge University Press: Cambridge, United Kingdom and New York, NY, USA.
IPCC 2007b Parry, M.L., O.F. Canziani, J.P. Palutikof, et al. 2007: Technical Summary. Climate Change 2007: Impacts, Adaptations and Vulnerability. Contribution of Working Group II t to the Fourth Assessment Report of the Intergovernmental Panel on Climate Change, M.L. Parry, O.F. Canziani, J.P. Palutikof, P.J. van der Linden and C.E. Hanson, Eds., Cambridge University Press, Cambridge, UK, 23-78.
MBA 2008a Michael Brandman Associates. November 2008. Draft Diamond Springs Parkway Project Air Quality Impact Analysis Report.
NTP 2005 Report on Carcinogens, Eleventh Edition; U.S. Department of Health and Human Services, Public Health Service, National Toxicology Program. January 31, 2005. Diesel Exhaust Particles. Website: http://ntp.niehs.nih.gov/ ntp/roc/eleventh/profiles/s069dies.pdf. Accessed May 2008.
OEHAA 2002 California Environmental Protection Agency. Office of Environmental Health Hazard Assessment. Health Effects of Diesel Exhaust. Website: www.oehha.ca.gov/public_info/facts/dieselfacts.html. Accessed in May 2008.
OPR 2007 The Governor’s Office of Planning and Research. 2007. Addressing Naturally Occurring Asbestos in CEQA Documents. August 1.

El Dorado Irrigation District - Highway 49 Intertie Improvements Project Air Quality Impact Analysis Report
Michael Brandman Associates S:\Projects\28490004 EID HWY 49 Intertie Improvements\Air Quality\Final Report\28490004 AQ Report_FINAL.doc
Appendix A: Roadway Model Calculations

Road Construction Emissions Model Version 6.3.1Data Entry Worksheet
Optional data input sections have a blue background. Only areas with a yellow or blue background can be modified. Program defaults have a white background. The user is required to enter information in cells C10 through C25.
Input TypeProject Name Highway 49 Intertie
Construction Start Year 2010 Enter a Year between 2005 and 2025 (inclusive)
Project Type 1 New Road Construction2 Road Widening3 Bridge/Overpass Construction
Project Construction Time 3.0 monthsPredominant Soil/Site Type: Enter 1, 2, or 3 1. Sand Gravel
2. Weathered Rock-Earth3. Blasted Rock
Project Length 1.1 miles
Total Project Area 1.1 acres
Maximum Area Disturbed/Day 0.3 acres
Water Trucks Used? 1 1. Yes 2. No
Soil Imported yd3/daySoil Exported 19.7 yd3/dayAverage Truck Capacity 20.0 yd3 (assume 20 if unknown)
To begin a new project, click this button to clear data previously entered. This button will only work
if you opted not to disable macros when loading this spreadsheet.
Note: Required data input sections have a yellow background.
1
2

Road Construction Emissions Model, Version 6.3.1
Emission Estimates for -> Total Exhaust Fugitive Dust Total Exhaust Fugitive DustProject Phases (English Units) ROG (lbs/day) CO (lbs/day) NOx (lbs/day) PM10 (lbs/day) PM10 (lbs/day) PM10 (lbs/day) PM2.5 (lbs/day) PM2.5 (lbs/day) PM2.5 (lbs/day) CO2 (lbs/day)Grubbing/Land Clearing - - - - - - - - - - Grading/Excavation 5.5 22.5 39.9 4.7 2.1 2.7 2.5 1.9 0.6 3,841.1 Drainage/Utilities/Sub-Grade 4.8 17.8 33.5 4.5 1.9 2.7 2.3 1.7 0.6 3,074.2 Paving 3.4 10.1 16.0 1.4 1.4 - 1.3 1.3 - 1,389.3 Maximum (pounds/day) 5.5 22.5 39.9 4.7 2.1 2.7 2.5 1.9 0.6 3,841.1 Total (tons/construction project) 0.1 0.6 1.0 0.1 0.1 0.1 0.1 0.1 0.0 94.4
Notes: Project Start Year -> 2010Project Length (months) -> 3
Total Project Area (acres) -> 1Maximum Area Disturbed/Day (acres) -> 0Total Soil Imported/Exported (yd3/day)-> 20
Total PM10 emissions shown in column F are the sum of exhaust and fugitive dust emissions shown in columns H and I. Total PM2.5 emissions shown in Column J are the sum of exhaust and fugitive dust emissions shown in columns K and L.
Emission Estimates for -> Total Exhaust Fugitive Dust Total Exhaust Fugitive DustProject Phases (Metric Units) ROG (kgs/day) CO (kgs/day) NOx (kgs/day) PM10 (kgs/day) PM10 (kgs/day) PM10 (kgs/day) PM2.5 (kgs/day) PM2.5 (kgs/day) PM2.5 (kgs/day) CO2 (kgs/day)Grubbing/Land Clearing - - - - - - - - - - Grading/Excavation 2.5 10.2 18.1 2.2 0.9 1.2 1.1 0.9 0.3 1,745.9 Drainage/Utilities/Sub-Grade 2.2 8.1 15.2 2.0 0.8 1.2 1.0 0.8 0.3 1,397.3 Paving 1.5 4.6 7.3 0.7 0.7 - 0.6 0.6 - 631.5 Maximum (kilograms/day) 2.5 10.2 18.1 2.2 0.9 1.2 1.1 0.9 0.3 1,745.9 Total (megagrams/construction project) 0.1 0.5 0.9 0.1 0.1 0.1 0.1 0.0 0.0 85.6
Notes: Project Start Year -> 2010Project Length (months) -> 3
Total Project Area (hectares) -> 0Maximum Area Disturbed/Day (hectares) -> 0
Total Soil Imported/Exported (meters3/day)-> 15
Total PM10 emissions shown in column F are the sum of exhaust and fugitive dust emissions shown in columns H and I. Total PM2.5 emissions shown in Column J are the sume of exhaust and fugitive dust emissions shown in columns K and L.
Highway 49 Intertie
Highway 49 Intertie
PM10 and PM2.5 estimates assume 50% control of fugitive dust from watering and associated dust control measures if a minimum number of water trucks are specified.
PM10 and PM2.5 estimates assume 50% control of fugitive dust from watering and associated dust control measures if a minimum number of water trucks are specified.