Embed Size (px)
Citation preview
October 19, 2012
9,538,821.12
2,402,532.12
1,584,985 2,402,532.12
1,090,459 14,343,885.36
(1) (2) (3) (4) (5) (6) (7) (8)
Hypothetical Factor2
Actual % Based New Total to be
Base Base Distribution on Population3
Excess4
Distributed
Col 3 X Col 4 Col 5 + Col 7
Ada 400,842 536,100.55 1.050 562,905.57 25.290% 607,599.29 1,170,504.86
Boise City 210,145 657,095.91 1.050 689,950.64 19.271% 462,997.81 1,152,948.45
Eagle 20,347 6,313.16 1.050 6,628.82 1.866% 44,829.12 51,457.94
Garden City 11,217 19,746.09 1.050 20,733.39 1.029% 24,713.63 45,447.02
Kuna 15,548 2,775.37 1.050 2,914.14 1.426% 34,255.82 37,169.96
Meridian 76,750 36,602.30 1.050 38,432.42 7.038% 169,097.91 207,530.33
Star 5,868 1,051.34 1.050 1,103.91 0.538% 12,928.55 14,032.46
Subtotal: 1,259,684.72 1,322,668.89 1,356,422.13 2,679,091.02
County or City Population1
Population Information: Total City Excess Distribution:
Population all Counties July 2011 Total County Excess Distribution:
County and City Base and Excess Distribution (S-2)
Quarter Ending: September 30, 2012
Statewide Dollar Distribution Information:
City and County Total Actual Base:
Population all Cities July 2011 City and County Distribution:
Note:Calculations may not agree due to rounding.
1-Most current census info.
2-Lesser of 1.05 or total City/Cnty dist divided by total City/Cnty hypo base.
3-Col. 2 divided by statwide pop. of Counties or Cities.
4-Col. 6 X total City or Cnty excess.
Page 1 of 44 EPB00676_10-19-2012

October 19, 2012
9,538,821.12
2,402,532.12
1,584,985 2,402,532.12
1,090,459 14,343,885.36
(1) (2) (3) (4) (5) (6) (7) (8)
Hypothetical Factor2
Actual % Based New Total to be
Base Base Distribution on Population3
Excess4
Distributed
Col 3 X Col 4 Col 5 + Col 7
Adams 3,977 73,813.67 1.050 77,504.35 0.251% 6,028.37 83,532.72
Council 839 5,105.61 1.050 5,360.89 0.077% 1,848.51 7,209.40
New Meadows 497 3,278.59 1.050 3,442.52 0.046% 1,095.01 4,537.53
Subtotal: 82,197.87 86,307.76 8,971.89 95,279.65
County or City Population1
Population Information: Total City Excess Distribution:
Population all Counties July 2011 Total County Excess Distribution:
County and City Base and Excess Distribution (S-2)
Quarter Ending: September 30, 2012
Statewide Dollar Distribution Information:
City and County Total Actual Base:
Population all Cities July 2011 City and County Distribution:
Note:Calculations may not agree due to rounding.
1-Most current census info.
2-Lesser of 1.05 or total City/Cnty dist divided by total City/Cnty hypo base.
3-Col. 2 divided by statwide pop. of Counties or Cities.
4-Col. 6 X total City or Cnty excess.
Page 2 of 44 EPB00676_10-19-2012
October 19, 2012
9,538,821.12
2,402,532.12
1,584,985 2,402,532.12
1,090,459 14,343,885.36
(1) (2) (3) (4) (5) (6) (7) (8)
Hypothetical Factor2
Actual % Based New Total to be
Base Base Distribution on Population3
Excess4
Distributed
Col 3 X Col 4 Col 5 + Col 7
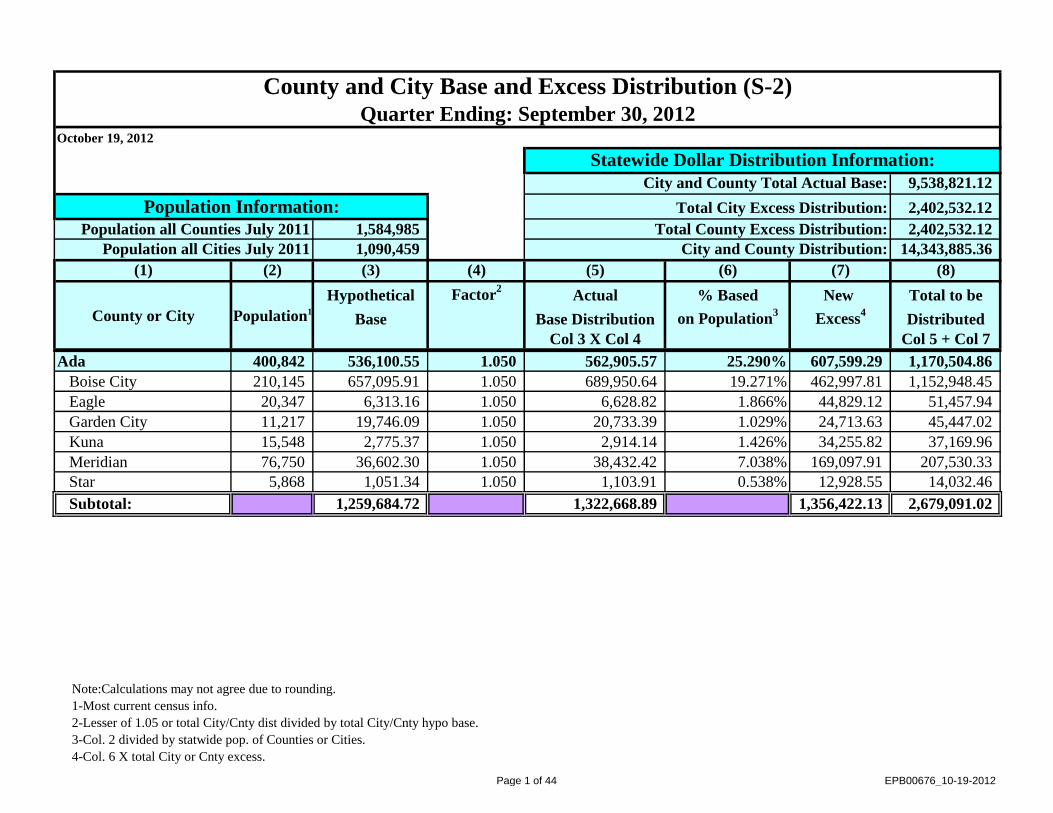
Bannock 83,691 270,650.62 1.050 284,183.15 5.280% 126,859.44 411,042.59
Arimo 360 539.66 1.050 566.64 0.033% 793.16 1,359.80
Chubbuck 14,067 29,133.00 1.050 30,589.65 1.290% 30,992.84 61,582.49
Downey 632 3,562.38 1.050 3,740.50 0.058% 1,392.44 5,132.94
Inkom 863 2,758.40 1.050 2,896.32 0.079% 1,901.39 4,797.71
Lava Hot Springs 411 2,471.62 1.050 2,595.20 0.038% 905.53 3,500.73
McCammon 1,022 2,211.55 1.050 2,322.13 0.094% 2,251.70 4,573.83
Pocatello (part) 54,591 369,327.33 1.050 387,793.70 5.006% 120,276.54 508,070.24
Subtotal: 680,654.56 714,687.29 285,373.04 1,000,060.33
County or City Population1
Population Information: Total City Excess Distribution:
Population all Counties July 2011 Total County Excess Distribution:
County and City Base and Excess Distribution (S-2)
Quarter Ending: September 30, 2012
Statewide Dollar Distribution Information:
City and County Total Actual Base:
Population all Cities July 2011 City and County Distribution:
Note:Calculations may not agree due to rounding.
1-Most current census info.
2-Lesser of 1.05 or total City/Cnty dist divided by total City/Cnty hypo base.
3-Col. 2 divided by statwide pop. of Counties or Cities.
4-Col. 6 X total City or Cnty excess.
Page 3 of 44 EPB00676_10-19-2012

October 19, 2012
9,538,821.12
2,402,532.12
1,584,985 2,402,532.12
1,090,459 14,343,885.36
(1) (2) (3) (4) (5) (6) (7) (8)
Hypothetical Factor2
Actual % Based New Total to be
Base Base Distribution on Population3
Excess4
Distributed
Col 3 X Col 4 Col 5 + Col 7
Bear Lake 6,001 60,780.77 1.050 63,819.81 0.379% 9,096.36 72,916.17
Bloomington 206 356.50 1.050 374.33 0.019% 453.87 828.20
Georgetown 476 687.27 1.050 721.63 0.044% 1,048.74 1,770.37
Montpelier 2,604 22,771.24 1.050 23,909.80 0.239% 5,737.21 29,647.01
Paris 515 1,753.44 1.050 1,841.11 0.047% 1,134.66 2,975.77
St. Charles 36 600.26 1.050 630.27 0.003% 79.32 709.59
Subtotal: 86,949.48 91,296.95 17,550.16 108,847.11
County or City Population1
Population Information: Total City Excess Distribution:
Population all Counties July 2011 Total County Excess Distribution:
County and City Base and Excess Distribution (S-2)
Quarter Ending: September 30, 2012
Statewide Dollar Distribution Information:
City and County Total Actual Base:
Population all Cities July 2011 City and County Distribution:
Note:Calculations may not agree due to rounding.
1-Most current census info.
2-Lesser of 1.05 or total City/Cnty dist divided by total City/Cnty hypo base.
3-Col. 2 divided by statwide pop. of Counties or Cities.
4-Col. 6 X total City or Cnty excess.
Page 4 of 44 EPB00676_10-19-2012

October 19, 2012
9,538,821.12
2,402,532.12
1,584,985 2,402,532.12
1,090,459 14,343,885.36
(1) (2) (3) (4) (5) (6) (7) (8)
Hypothetical Factor2
Actual % Based New Total to be
Base Base Distribution on Population3
Excess4
Distributed
Col 3 X Col 4 Col 5 + Col 7
Benewah 9,209 52,500.82 1.050 55,125.86 0.581% 13,959.07 69,084.93
Plummer 1,035 1,834.39 1.050 1,926.11 0.095% 2,280.34 4,206.45
St. Maries 1,982 17,074.85 1.050 17,928.59 0.182% 4,366.80 22,295.39
Tensed 123 160.98 1.050 169.03 0.011% 271.00 440.03
Subtotal: 71,571.04 75,149.59 20,877.21 96,026.80
County and City Base and Excess Distribution (S-2)
Quarter Ending: September 30, 2012
Statewide Dollar Distribution Information:
City and County Total Actual Base:
County or City Population1
Population Information: Total City Excess Distribution:
Population all Counties July 2011 Total County Excess Distribution:
Population all Cities July 2011 City and County Distribution:
Note:Calculations may not agree due to rounding.
1-Most current census info.
2-Lesser of 1.05 or total City/Cnty dist divided by total City/Cnty hypo base.
3-Col. 2 divided by statwide pop. of Counties or Cities.
4-Col. 6 X total City or Cnty excess.
Page 5 of 44 EPB00676_10-19-2012

October 19, 2012
9,538,821.12
2,402,532.12
1,584,985 2,402,532.12
1,090,459 14,343,885.36
(1) (2) (3) (4) (5) (6) (7) (8)
Hypothetical Factor2
Actual % Based New Total to be
Base Base Distribution on Population3
Excess4
Distributed
Col 3 X Col 4 Col 5 + Col 7
Bingham 45,952 231,180.43 1.050 242,739.45 2.899% 69,654.39 312,393.84
Aberdeen 2,009 11,358.22 1.050 11,926.13 0.184% 4,426.29 16,352.42
Atomic City 29 48.07 1.050 50.47 0.003% 63.89 114.36
Basalt 397 315.46 1.050 331.23 0.036% 874.68 1,205.91
Blackfoot 11,987 91,713.00 1.050 96,298.65 1.099% 26,410.12 122,708.77
Firth 480 1,801.84 1.050 1,891.93 0.044% 1,057.55 2,949.48
Shelley 2,382 21,421.67 1.050 22,492.75 0.218% 5,248.09 27,740.84
Subtotal: 357,838.69 375,730.61 107,735.01 483,465.62
County and City Base and Excess Distribution (S-2)
Quarter Ending: September 30, 2012
Statewide Dollar Distribution Information:
City and County Total Actual Base:
County or City Population1
Population Information: Total City Excess Distribution:
Population all Counties July 2011 Total County Excess Distribution:
Population all Cities July 2011 City and County Distribution:
Note:Calculations may not agree due to rounding.
1-Most current census info.
2-Lesser of 1.05 or total City/Cnty dist divided by total City/Cnty hypo base.
3-Col. 2 divided by statwide pop. of Counties or Cities.
4-Col. 6 X total City or Cnty excess.
Page 6 of 44 EPB00676_10-19-2012

October 19, 2012
9,538,821.12
2,402,532.12
1,584,985 2,402,532.12
1,090,459 14,343,885.36
(1) (2) (3) (4) (5) (6) (7) (8)
Hypothetical Factor2
Actual % Based New Total to be
Base Base Distribution on Population3
Excess4
Distributed
Col 3 X Col 4 Col 5 + Col 7
Blaine 21,199 43,329.86 1.050 45,496.35 1.337% 32,133.60 77,629.95
Bellevue 2,268 1,141.30 1.050 1,198.37 0.208% 4,996.93 6,195.30
Carey 599 143.20 1.050 150.36 0.055% 1,319.73 1,470.09
Hailey 7,893 9,871.11 1.050 10,364.67 0.724% 17,390.10 27,754.77
Ketchum 2,694 13,191.48 1.050 13,851.05 0.247% 5,935.50 19,786.55
Sun Valley 1,395 13,931.19 1.050 14,627.75 0.128% 3,073.51 17,701.26
Subtotal: 81,608.14 85,688.55 64,849.37 150,537.92
County and City Base and Excess Distribution (S-2)
Quarter Ending: September 30, 2012
Statewide Dollar Distribution Information:
City and County Total Actual Base:
County or City Population1
Population Information: Total City Excess Distribution:
Population all Counties July 2011 Total County Excess Distribution:
Population all Cities July 2011 City and County Distribution:
Note:Calculations may not agree due to rounding.
1-Most current census info.
2-Lesser of 1.05 or total City/Cnty dist divided by total City/Cnty hypo base.
3-Col. 2 divided by statwide pop. of Counties or Cities.
4-Col. 6 X total City or Cnty excess.
Page 7 of 44 EPB00676_10-19-2012

October 19, 2012
9,538,821.12
2,402,532.12
1,584,985 2,402,532.12
1,090,459 14,343,885.36
(1) (2) (3) (4) (5) (6) (7) (8)
Hypothetical Factor2
Actual % Based New Total to be
Base Base Distribution on Population3
Excess4
Distributed
Col 3 X Col 4 Col 5 + Col 7
Boise 7,025 37,746.98 1.050 39,634.33 0.443% 10,648.55 50,282.88
Crouch 163 - 1.050 - 0.015% 359.13 359.13
Horseshoe Bend 707 3,314.36 1.050 3,480.08 0.065% 1,557.68 5,037.76
Idaho City 484 996.56 1.050 1,046.39 0.044% 1,066.36 2,112.75
Placerville 53 160.15 1.050 168.16 0.005% 116.77 284.93
Subtotal: 42,218.05 44,328.96 13,748.49 58,077.45
County and City Base and Excess Distribution (S-2)
Quarter Ending: September 30, 2012
Statewide Dollar Distribution Information:
City and County Total Actual Base:
County or City Population1
Population Information: Total City Excess Distribution:
Population all Counties July 2011 Total County Excess Distribution:
Population all Cities July 2011 City and County Distribution:
Note:Calculations may not agree due to rounding.
1-Most current census info.
2-Lesser of 1.05 or total City/Cnty dist divided by total City/Cnty hypo base.
3-Col. 2 divided by statwide pop. of Counties or Cities.
4-Col. 6 X total City or Cnty excess.
Page 8 of 44 EPB00676_10-19-2012

October 19, 2012
9,538,821.12
2,402,532.12
1,584,985 2,402,532.12
1,090,459 14,343,885.36
(1) (2) (3) (4) (5) (6) (7) (8)
Hypothetical Factor2
Actual % Based New Total to be
Base Base Distribution on Population3
Excess4
Distributed
Col 3 X Col 4 Col 5 + Col 7
Bonner 40,808 116,262.02 1.050 122,075.12 2.575% 61,857.07 183,932.19
Clark Fork 536 779.95 1.050 818.95 0.049% 1,180.93 1,999.88
Dover 555 429.58 1.050 451.06 0.051% 1,222.79 1,673.85
East Hope 209 371.58 1.050 390.16 0.019% 460.48 850.64
Hope 85 177.92 1.050 186.82 0.008% 187.27 374.09
Kootenai 677 241.78 1.050 253.87 0.062% 1,491.59 1,745.46
Oldtown 184 345.26 1.050 362.52 0.017% 405.39 767.91
Ponderay 1,135 3,121.80 1.050 3,277.89 0.104% 2,500.67 5,778.56
Priest River 1,747 5,784.70 1.050 6,073.94 0.160% 3,849.04 9,922.98
Sandpoint 131 31,195.44 1.050 32,755.21 0.012% 288.62 33,043.83
Subtotal: 158,710.03 166,645.54 73,443.85 240,089.39
County and City Base and Excess Distribution (S-2)
Quarter Ending: September 30, 2012
Statewide Dollar Distribution Information:
City and County Total Actual Base:
County or City Population1
Population Information: Total City Excess Distribution:
Population all Counties July 2011 Total County Excess Distribution:
Population all Cities July 2011 City and County Distribution:
Note:Calculations may not agree due to rounding.
1-Most current census info.
2-Lesser of 1.05 or total City/Cnty dist divided by total City/Cnty hypo base.
3-Col. 2 divided by statwide pop. of Counties or Cities.
4-Col. 6 X total City or Cnty excess.
Page 9 of 44 EPB00676_10-19-2012

October 19, 2012
9,538,821.12
2,402,532.12
1,584,985 2,402,532.12
1,090,459 14,343,885.36
(1) (2) (3) (4) (5) (6) (7) (8)
Hypothetical Factor2
Actual % Based New Total to be
Base Base Distribution on Population3
Excess4
Distributed
Col 3 X Col 4 Col 5 + Col 7
Bonneville 105,772 268,559.85 1.050 281,987.84 6.673% 160,329.99 442,317.83
Ammon 14,019 4,689.85 1.050 4,924.34 1.286% 30,887.08 35,811.42
Idaho Falls 57,646 391,644.80 1.050 411,227.04 5.286% 127,007.40 538,234.44
Iona 1,830 1,335.07 1.050 1,401.82 0.168% 4,031.91 5,433.73
Irwin 222 - 1.050 - 0.020% 489.12 489.12
Ririe (part) 28 328.14 1.050 344.55 0.003% 61.69 406.24
Swan Valley 209 - 1.050 - 0.019% 460.48 460.48
Ucon 1,125 709.89 1.050 745.38 0.103% 2,478.63 3,224.01
Subtotal: 667,267.60 700,630.97 325,746.30 1,026,377.27
County and City Base and Excess Distribution (S-2)
Quarter Ending: September 30, 2012
Statewide Dollar Distribution Information:
City and County Total Actual Base:
County or City Population1
Population Information: Total City Excess Distribution:
Population all Counties July 2011 Total County Excess Distribution:
Population all Cities July 2011 City and County Distribution:
Note:Calculations may not agree due to rounding.
1-Most current census info.
2-Lesser of 1.05 or total City/Cnty dist divided by total City/Cnty hypo base.
3-Col. 2 divided by statwide pop. of Counties or Cities.
4-Col. 6 X total City or Cnty excess.
Page 10 of 44 EPB00676_10-19-2012

October 19, 2012
9,538,821.12
2,402,532.12
1,584,985 2,402,532.12
1,090,459 14,343,885.36
(1) (2) (3) (4) (5) (6) (7) (8)
Hypothetical Factor2
Actual % Based New Total to be
Base Base Distribution on Population3
Excess4
Distributed
Col 3 X Col 4 Col 5 + Col 7
Boundary 10,804 73,778.68 1.050 77,467.61 0.682% 16,376.78 93,844.39
Bonners Ferry 2,507 11,032.54 1.050 11,584.17 0.230% 5,523.50 17,107.67
Moyie Springs 710 955.23 1.050 1,002.99 0.065% 1,564.29 2,567.28
Subtotal: 85,766.45 90,054.77 23,464.57 113,519.34
County and City Base and Excess Distribution (S-2)
Quarter Ending: September 30, 2012
Statewide Dollar Distribution Information:
City and County Total Actual Base:
County or City Population1
Population Information: Total City Excess Distribution:
Population all Counties July 2011 Total County Excess Distribution:
Population all Cities July 2011 City and County Distribution:
Note:Calculations may not agree due to rounding.
1-Most current census info.
2-Lesser of 1.05 or total City/Cnty dist divided by total City/Cnty hypo base.
3-Col. 2 divided by statwide pop. of Counties or Cities.
4-Col. 6 X total City or Cnty excess.
Page 11 of 44 EPB00676_10-19-2012

October 19, 2012
9,538,821.12
2,402,532.12
1,584,985 2,402,532.12
1,090,459 14,343,885.36
(1) (2) (3) (4) (5) (6) (7) (8)
Hypothetical Factor2
Actual % Based New Total to be
Base Base Distribution on Population3
Excess4
Distributed
Col 3 X Col 4 Col 5 + Col 7
Butte 2,822 26,487.43 1.050 27,811.80 0.178% 4,277.61 32,089.41
Arco 972 6,282.77 1.050 6,596.91 0.089% 2,141.54 8,738.45
Butte city 71 - 1.050 - 0.007% 156.43 156.43
Moore 185 217.13 1.050 227.99 0.017% 407.60 635.59
Subtotal: 32,987.33 34,636.70 6,983.18 41,619.88
County and City Base and Excess Distribution (S-2)
Quarter Ending: September 30, 2012
Statewide Dollar Distribution Information:
City and County Total Actual Base:
County or City Population1
Population Information: Total City Excess Distribution:
Population all Counties July 2011 Total County Excess Distribution:
Population all Cities July 2011 City and County Distribution:
Note:Calculations may not agree due to rounding.
1-Most current census info.
2-Lesser of 1.05 or total City/Cnty dist divided by total City/Cnty hypo base.
3-Col. 2 divided by statwide pop. of Counties or Cities.
4-Col. 6 X total City or Cnty excess.
Page 12 of 44 EPB00676_10-19-2012

October 19, 2012
9,538,821.12
2,402,532.12
1,584,985 2,402,532.12
1,090,459 14,343,885.36
(1) (2) (3) (4) (5) (6) (7) (8)
Hypothetical Factor2
Actual % Based New Total to be
Base Base Distribution on Population3
Excess4
Distributed
Col 3 X Col 4 Col 5 + Col 7
Camas 1,124 26,939.30 1.050 28,286.27 0.071% 1,703.77 29,990.04
Fairfield 418 4,141.38 1.050 4,348.45 0.038% 920.95 5,269.40
Subtotal: 31,080.68 32,634.72 2,624.72 35,259.44
County and City Base and Excess Distribution (S-2)
Quarter Ending: September 30, 2012
Statewide Dollar Distribution Information:
City and County Total Actual Base:
County or City Population1
Population Information: Total City Excess Distribution:
Population all Counties July 2011 Total County Excess Distribution:
Population all Cities July 2011 City and County Distribution:
Note:Calculations may not agree due to rounding.
1-Most current census info.
2-Lesser of 1.05 or total City/Cnty dist divided by total City/Cnty hypo base.
3-Col. 2 divided by statwide pop. of Counties or Cities.
4-Col. 6 X total City or Cnty excess.
Page 13 of 44 EPB00676_10-19-2012

October 19, 2012
9,538,821.12
2,402,532.12
1,584,985 2,402,532.12
1,090,459 14,343,885.36
(1) (2) (3) (4) (5) (6) (7) (8)
Hypothetical Factor2
Actual % Based New Total to be
Base Base Distribution on Population3
Excess4
Distributed
Col 3 X Col 4 Col 5 + Col 7
Canyon 191,694 384,194.61 1.050 403,404.34 12.094% 290,571.20 693,975.54
Caldwell 46,905 136,761.74 1.050 143,599.83 4.301% 103,342.51 246,942.34
Greenleaf 860 652.66 1.050 685.29 0.079% 1,894.78 2,580.07
Melba 521 1,115.75 1.050 1,171.54 0.048% 1,147.88 2,319.42
Middleton 5,607 4,116.23 1.050 4,322.04 0.514% 12,353.51 16,675.55
Nampa 82,755 215,441.50 1.050 226,213.58 7.589% 182,328.31 408,541.89
Notus 539 843.58 1.050 885.76 0.049% 1,187.54 2,073.30
Parma 2,012 6,536.50 1.050 6,863.33 0.185% 4,432.90 11,296.23
Star 53 - 1.050 - 0.005% 116.77 116.77
Wilder 1,557 3,608.00 1.050 3,788.40 0.143% 3,430.43 7,218.83
Subtotal: 753,270.57 790,934.11 600,805.83 1,391,739.94
County and City Base and Excess Distribution (S-2)
Quarter Ending: September 30, 2012
Statewide Dollar Distribution Information:
City and County Total Actual Base:
County or City Population1
Population Information: Total City Excess Distribution:
Population all Counties July 2011 Total County Excess Distribution:
Population all Cities July 2011 City and County Distribution:
Note:Calculations may not agree due to rounding.
1-Most current census info.
2-Lesser of 1.05 or total City/Cnty dist divided by total City/Cnty hypo base.
3-Col. 2 divided by statwide pop. of Counties or Cities.
4-Col. 6 X total City or Cnty excess.
Page 14 of 44 EPB00676_10-19-2012

October 19, 2012
9,538,821.12
2,402,532.12
1,584,985 2,402,532.12
1,090,459 14,343,885.36
(1) (2) (3) (4) (5) (6) (7) (8)
Hypothetical Factor2
Actual % Based New Total to be
Base Base Distribution on Population3
Excess4
Distributed
Col 3 X Col 4 Col 5 + Col 7
Caribou 6,850 116,182.82 1.050 121,991.96 0.432% 10,383.28 132,375.24
Bancroft 371 4,252.72 1.050 4,465.36 0.034% 817.40 5,282.76
Grace 900 6,321.31 1.050 6,637.38 0.083% 1,982.91 8,620.29
Soda Springs 4,444 22,071.79 1.050 23,175.38 0.408% 9,791.15 32,966.53
Subtotal: 148,828.64 156,270.08 22,974.74 179,244.82
County and City Base and Excess Distribution (S-2)
Quarter Ending: September 30, 2012
Statewide Dollar Distribution Information:
City and County Total Actual Base:
County or City Population1
Population Information: Total City Excess Distribution:
Population all Counties July 2011 Total County Excess Distribution:
Population all Cities July 2011 City and County Distribution:
Note:Calculations may not agree due to rounding.
1-Most current census info.
2-Lesser of 1.05 or total City/Cnty dist divided by total City/Cnty hypo base.
3-Col. 2 divided by statwide pop. of Counties or Cities.
4-Col. 6 X total City or Cnty excess.
Page 15 of 44 EPB00676_10-19-2012

October 19, 2012
9,538,821.12
2,402,532.12
1,584,985 2,402,532.12
1,090,459 14,343,885.36
(1) (2) (3) (4) (5) (6) (7) (8)
Hypothetical Factor2
Actual % Based New Total to be
Base Base Distribution on Population3
Excess4
Distributed
Col 3 X Col 4 Col 5 + Col 7
Cassia 23,186 144,286.35 1.050 151,500.67 1.463% 35,145.51 186,646.18
Albion 269 496.72 1.050 521.56 0.025% 592.67 1,114.23
Burley (part) 10,165 61,301.58 1.050 64,366.66 0.932% 22,395.83 86,762.49
Declo 346 887.96 1.050 932.36 0.032% 762.32 1,694.68
Malta 514 401.71 1.050 421.80 0.047% 1,132.46 1,554.26
Oakley 772 1,962.28 1.050 2,060.39 0.071% 1,700.89 3,761.28
Subtotal: 209,336.60 219,803.44 61,729.68 281,533.12
County and City Base and Excess Distribution (S-2)
Quarter Ending: September 30, 2012
Statewide Dollar Distribution Information:
City and County Total Actual Base:
County or City Population1
Population Information: Total City Excess Distribution:
Population all Counties July 2011 Total County Excess Distribution:
Population all Cities July 2011 City and County Distribution:
Note:Calculations may not agree due to rounding.
1-Most current census info.
2-Lesser of 1.05 or total City/Cnty dist divided by total City/Cnty hypo base.
3-Col. 2 divided by statwide pop. of Counties or Cities.
4-Col. 6 X total City or Cnty excess.
Page 16 of 44 EPB00676_10-19-2012

October 19, 2012
9,538,821.12
2,402,532.12
1,584,985 2,402,532.12
1,090,459 14,343,885.36
(1) (2) (3) (4) (5) (6) (7) (8)
Hypothetical Factor2
Actual % Based New Total to be
Base Base Distribution on Population3
Excess4
Distributed
Col 3 X Col 4 Col 5 + Col 7
Clark 949 52,083.69 1.050 54,687.87 0.060% 1,438.50 56,126.37
Dubois 654 3,775.61 1.050 3,964.39 0.060% 1,440.91 5,405.30
Spencer 1,454 135.89 1.050 142.68 0.133% 3,203.50 3,346.18
Subtotal: 55,995.19 58,794.94 6,082.91 64,877.85
County and City Base and Excess Distribution (S-2)
Quarter Ending: September 30, 2012
Statewide Dollar Distribution Information:
City and County Total Actual Base:
County or City Population1
Population Information: Total City Excess Distribution:
Population all Counties July 2011 Total County Excess Distribution:
Population all Cities July 2011 City and County Distribution:
Note:Calculations may not agree due to rounding.
1-Most current census info.
2-Lesser of 1.05 or total City/Cnty dist divided by total City/Cnty hypo base.
3-Col. 2 divided by statwide pop. of Counties or Cities.
4-Col. 6 X total City or Cnty excess.
Page 17 of 44 EPB00676_10-19-2012

October 19, 2012
9,538,821.12
2,402,532.12
1,584,985 2,402,532.12
1,090,459 14,343,885.36
(1) (2) (3) (4) (5) (6) (7) (8)
Hypothetical Factor2
Actual % Based New Total to be
Base Base Distribution on Population3
Excess4
Distributed
Col 3 X Col 4 Col 5 + Col 7
Clearwater 8,702 151,976.36 1.050 159,575.18 0.549% 13,190.56 172,765.74
Elk River 124 2,983.26 1.050 3,132.42 0.011% 273.20 3,405.62
Orofino 3,124 40,282.86 1.050 42,297.00 0.286% 6,882.89 49,179.89
Pierce 505 5,703.59 1.050 5,988.77 0.046% 1,112.63 7,101.40
Weippe 429 4,653.21 1.050 4,885.87 0.039% 945.19 5,831.06
Subtotal: 205,599.28 215,879.24 22,404.47 238,283.71
County and City Base and Excess Distribution (S-2)
Quarter Ending: September 30, 2012
Statewide Dollar Distribution Information:
City and County Total Actual Base:
County or City Population1
Population Information: Total City Excess Distribution:
Population all Counties July 2011 Total County Excess Distribution:
Population all Cities July 2011 City and County Distribution:
Note:Calculations may not agree due to rounding.
1-Most current census info.
2-Lesser of 1.05 or total City/Cnty dist divided by total City/Cnty hypo base.
3-Col. 2 divided by statwide pop. of Counties or Cities.
4-Col. 6 X total City or Cnty excess.
Page 18 of 44 EPB00676_10-19-2012

October 19, 2012
9,538,821.12
2,402,532.12
1,584,985 2,402,532.12
1,090,459 14,343,885.36
(1) (2) (3) (4) (5) (6) (7) (8)
Hypothetical Factor2
Actual % Based New Total to be
Base Base Distribution on Population3
Excess4
Distributed
Col 3 X Col 4 Col 5 + Col 7
Custer 4,333 54,104.60 1.050 56,809.83 0.273% 6,567.99 63,377.82
Challis 1,072 9,018.81 1.050 9,469.75 0.098% 2,361.86 11,831.61
Clayton 7 - 1.050 - 0.001% 15.42 15.42
Lost River - - 1.050 - 0.000% - -
Mackay 2,924 2,969.93 1.050 3,118.43 0.268% 6,442.24 9,560.67
Stanley 62 2,055.49 1.050 2,158.26 0.006% 136.60 2,294.86
Subtotal: 68,148.83 71,556.27 15,524.11 87,080.38
County and City Base and Excess Distribution (S-2)
Quarter Ending: September 30, 2012
Statewide Dollar Distribution Information:
City and County Total Actual Base:
County or City Population1
Population Information: Total City Excess Distribution:
Population all Counties July 2011 Total County Excess Distribution:
Population all Cities July 2011 City and County Distribution:
Note:Calculations may not agree due to rounding.
1-Most current census info.
2-Lesser of 1.05 or total City/Cnty dist divided by total City/Cnty hypo base.
3-Col. 2 divided by statwide pop. of Counties or Cities.
4-Col. 6 X total City or Cnty excess.
Page 19 of 44 EPB00676_10-19-2012
October 19, 2012
9,538,821.12
2,402,532.12
1,584,985 2,402,532.12
1,090,459 14,343,885.36
(1) (2) (3) (4) (5) (6) (7) (8)
Hypothetical Factor2
Actual % Based New Total to be
Base Base Distribution on Population3
Excess4
Distributed
Col 3 X Col 4 Col 5 + Col 7
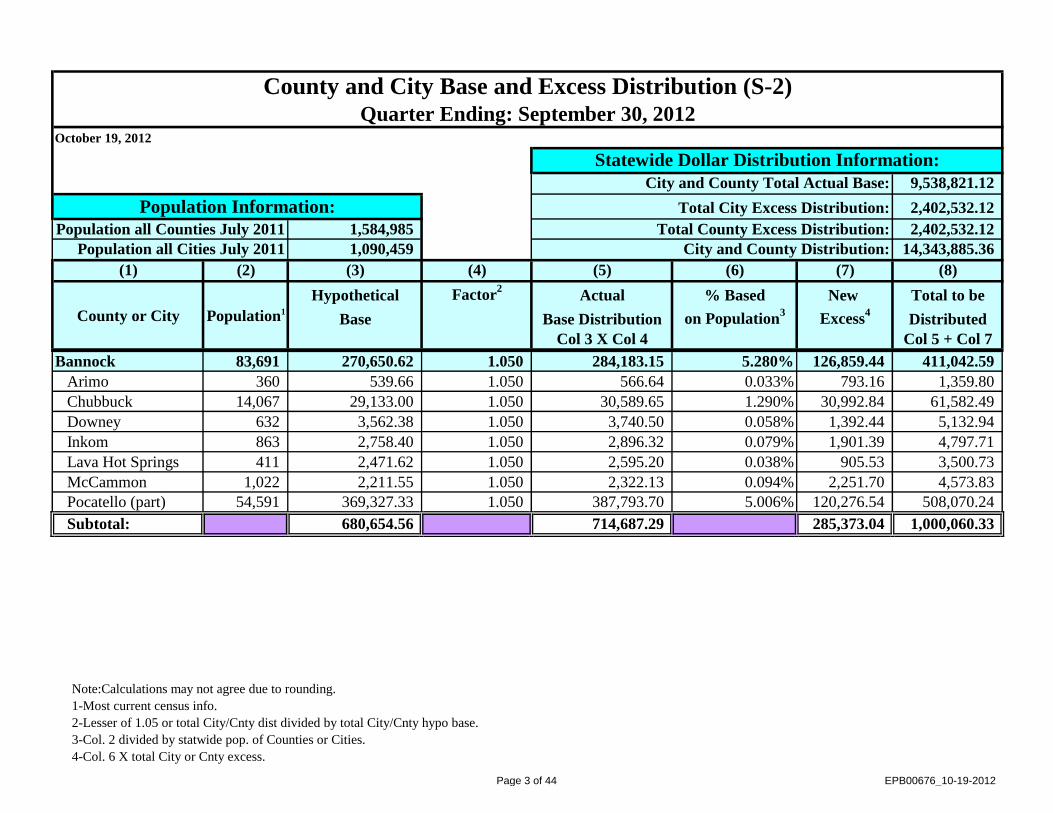
Elmore 26,346 57,157.23 1.050 60,015.09 1.662% 39,935.46 99,950.55
Glenns Ferry 1,284 11,758.65 1.050 12,346.58 0.118% 2,828.95 15,175.53
Mountain Home 13,841 48,149.90 1.050 50,557.40 1.269% 30,494.91 81,052.31
Subtotal: 117,065.78 122,919.07 73,259.32 196,178.39
County and City Base and Excess Distribution (S-2)
Quarter Ending: September 30, 2012
Statewide Dollar Distribution Information:
City and County Total Actual Base:
County or City Population1
Population Information: Total City Excess Distribution:
Population all Counties July 2011 Total County Excess Distribution:
Population all Cities July 2011 City and County Distribution:
Note:Calculations may not agree due to rounding.
1-Most current census info.
2-Lesser of 1.05 or total City/Cnty dist divided by total City/Cnty hypo base.
3-Col. 2 divided by statwide pop. of Counties or Cities.
4-Col. 6 X total City or Cnty excess.
Page 20 of 44 EPB00676_10-19-2012
October 19, 2012
9,538,821.12
2,402,532.12
1,584,985 2,402,532.12
1,090,459 14,343,885.36
(1) (2) (3) (4) (5) (6) (7) (8)
Hypothetical Factor2
Actual % Based New Total to be
Base Base Distribution on Population3
Excess4
Distributed
Col 3 X Col 4 Col 5 + Col 7
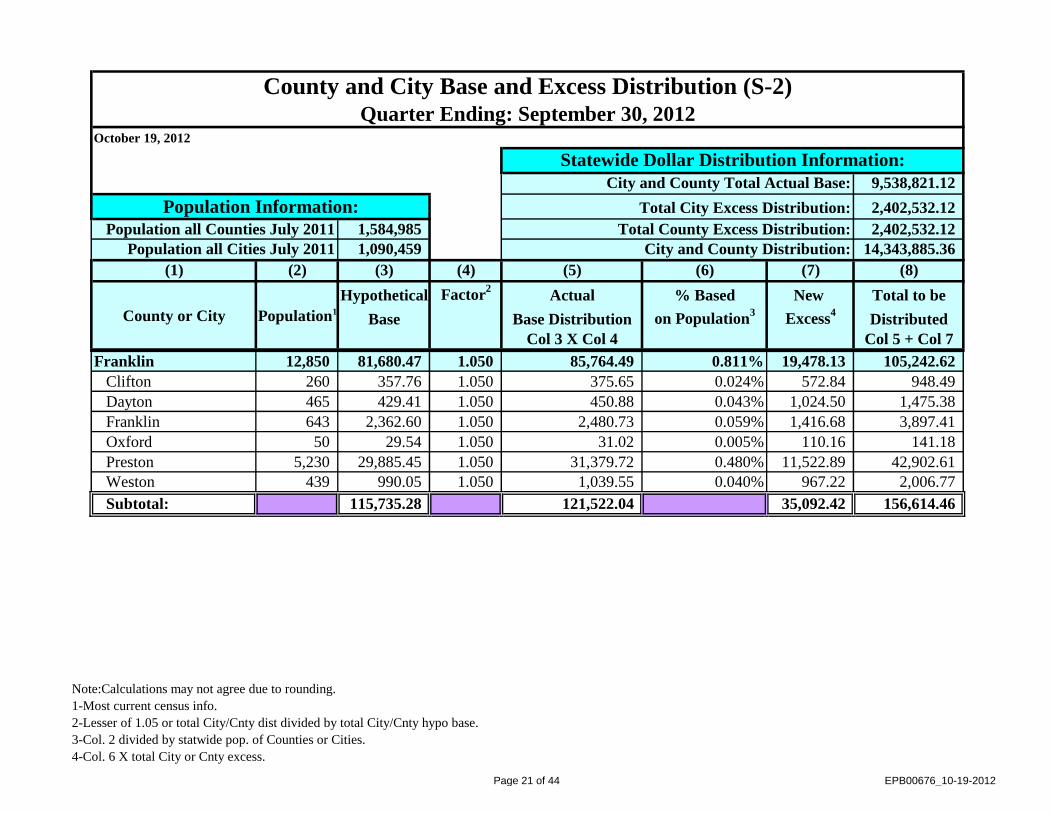
Franklin 12,850 81,680.47 1.050 85,764.49 0.811% 19,478.13 105,242.62
Clifton 260 357.76 1.050 375.65 0.024% 572.84 948.49
Dayton 465 429.41 1.050 450.88 0.043% 1,024.50 1,475.38
Franklin 643 2,362.60 1.050 2,480.73 0.059% 1,416.68 3,897.41
Oxford 50 29.54 1.050 31.02 0.005% 110.16 141.18
Preston 5,230 29,885.45 1.050 31,379.72 0.480% 11,522.89 42,902.61
Weston 439 990.05 1.050 1,039.55 0.040% 967.22 2,006.77
Subtotal: 115,735.28 121,522.04 35,092.42 156,614.46
County and City Base and Excess Distribution (S-2)
Quarter Ending: September 30, 2012
Statewide Dollar Distribution Information:
City and County Total Actual Base:
County or City Population1
Population Information: Total City Excess Distribution:
Population all Counties July 2011 Total County Excess Distribution:
Population all Cities July 2011 City and County Distribution:
Note:Calculations may not agree due to rounding.
1-Most current census info.
2-Lesser of 1.05 or total City/Cnty dist divided by total City/Cnty hypo base.
3-Col. 2 divided by statwide pop. of Counties or Cities.
4-Col. 6 X total City or Cnty excess.
Page 21 of 44 EPB00676_10-19-2012

October 19, 2012
9,538,821.12
2,402,532.12
1,584,985 2,402,532.12
1,090,459 14,343,885.36
(1) (2) (3) (4) (5) (6) (7) (8)
Hypothetical Factor2
Actual % Based New Total to be
Base Base Distribution on Population3
Excess4
Distributed
Col 3 X Col 4 Col 5 + Col 7
Fremont 13,128 79,521.20 1.050 83,497.26 0.828% 19,899.52 103,396.78
Ashton 1,117 7,028.54 1.050 7,379.97 0.102% 2,461.01 9,840.98
Drummond 16 33.03 1.050 34.68 0.001% 35.25 69.93
Island Park 283 531.20 1.050 557.76 0.026% 623.51 1,181.27
Newdale 319 600.73 1.050 630.77 0.029% 702.83 1,333.60
Parker 301 377.18 1.050 396.04 0.028% 663.17 1,059.21
St. Anthony 3,009 13,740.08 1.050 14,427.08 0.276% 6,629.52 21,056.60
Teton 730 321.67 1.050 337.75 0.067% 1,608.36 1,946.11
Warm River 3 8.21 1.050 8.62 0.000% 6.61 15.23
Subtotal: 102,161.84 107,269.93 32,629.78 139,899.71
County and City Base and Excess Distribution (S-2)
Quarter Ending: September 30, 2012
Statewide Dollar Distribution Information:
City and County Total Actual Base:
County or City Population1
Population Information: Total City Excess Distribution:
Population all Counties July 2011 Total County Excess Distribution:
Population all Cities July 2011 City and County Distribution:
Note:Calculations may not agree due to rounding.
1-Most current census info.
2-Lesser of 1.05 or total City/Cnty dist divided by total City/Cnty hypo base.
3-Col. 2 divided by statwide pop. of Counties or Cities.
4-Col. 6 X total City or Cnty excess.
Page 22 of 44 EPB00676_10-19-2012
October 19, 2012
9,538,821.12
2,402,532.12
1,584,985 2,402,532.12
1,090,459 14,343,885.36
(1) (2) (3) (4) (5) (6) (7) (8)
Hypothetical Factor2
Actual % Based New Total to be
Base Base Distribution on Population3
Excess4
Distributed
Col 3 X Col 4 Col 5 + Col 7
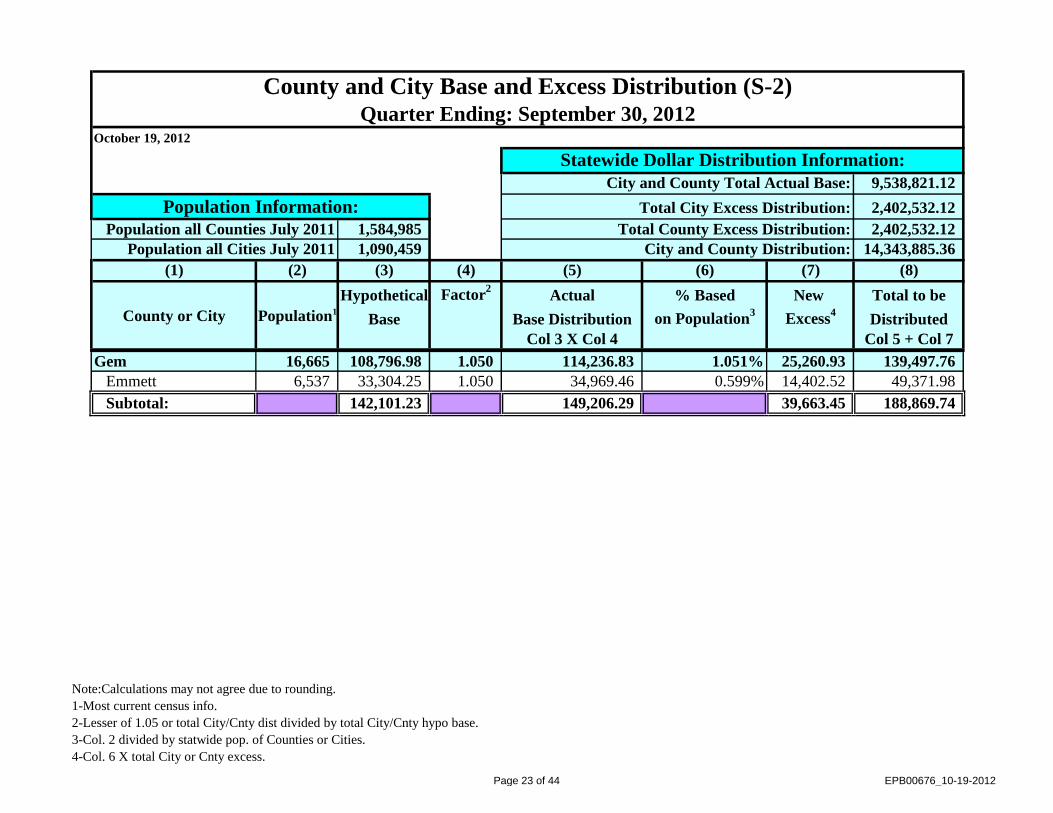
Gem 16,665 108,796.98 1.050 114,236.83 1.051% 25,260.93 139,497.76
Emmett 6,537 33,304.25 1.050 34,969.46 0.599% 14,402.52 49,371.98
Subtotal: 142,101.23 149,206.29 39,663.45 188,869.74
County and City Base and Excess Distribution (S-2)
Quarter Ending: September 30, 2012
Statewide Dollar Distribution Information:
City and County Total Actual Base:
County or City Population1
Population Information: Total City Excess Distribution:
Population all Counties July 2011 Total County Excess Distribution:
Population all Cities July 2011 City and County Distribution:
Note:Calculations may not agree due to rounding.
1-Most current census info.
2-Lesser of 1.05 or total City/Cnty dist divided by total City/Cnty hypo base.
3-Col. 2 divided by statwide pop. of Counties or Cities.
4-Col. 6 X total City or Cnty excess.
Page 23 of 44 EPB00676_10-19-2012

October 19, 2012
9,538,821.12
2,402,532.12
1,584,985 2,402,532.12
1,090,459 14,343,885.36
(1) (2) (3) (4) (5) (6) (7) (8)
Hypothetical Factor2
Actual % Based New Total to be
Base Base Distribution on Population3
Excess4
Distributed
Col 3 X Col 4 Col 5 + Col 7
Gooding 15,475 77,778.66 1.050 81,667.59 0.976% 23,457.12 105,124.71
Bliss 318 1,186.22 1.050 1,245.53 0.029% 700.63 1,946.16
Gooding 3,569 28,144.85 1.050 29,552.09 0.327% 7,863.33 37,415.42
Hagerman 873 3,264.43 1.050 3,427.65 0.080% 1,923.42 5,351.07
Wendell 2,784 11,039.10 1.050 11,591.06 0.255% 6,133.79 17,724.85
Subtotal: 121,413.26 127,483.92 40,078.29 167,562.21
County and City Base and Excess Distribution (S-2)
Quarter Ending: September 30, 2012
Statewide Dollar Distribution Information:
City and County Total Actual Base:
County or City Population1
Population Information: Total City Excess Distribution:
Population all Counties July 2011 Total County Excess Distribution:
Population all Cities July 2011 City and County Distribution:
Note:Calculations may not agree due to rounding.
1-Most current census info.
2-Lesser of 1.05 or total City/Cnty dist divided by total City/Cnty hypo base.
3-Col. 2 divided by statwide pop. of Counties or Cities.
4-Col. 6 X total City or Cnty excess.
Page 24 of 44 EPB00676_10-19-2012

October 19, 2012
9,538,821.12
2,402,532.12
1,584,985 2,402,532.12
1,090,459 14,343,885.36
(1) (2) (3) (4) (5) (6) (7) (8)
Hypothetical Factor2
Actual % Based New Total to be
Base Base Distribution on Population3
Excess4
Distributed
Col 3 X Col 4 Col 5 + Col 7
Idaho 16,446 162,896.70 1.050 171,041.54 1.038% 24,928.97 195,970.51
Cottonwood 910 11,116.38 1.050 11,672.20 0.083% 2,004.94 13,677.14
Ferdinand 161 954.86 1.050 1,002.60 0.015% 354.72 1,357.32
Grangeville 3,176 41,251.59 1.050 43,314.17 0.291% 6,997.46 50,311.63
Kamiah (part) 1,294 1.94 1.050 2.04 0.119% 2,850.98 2,853.02
Kooskia 614 5,448.77 1.050 5,721.21 0.056% 1,352.78 7,073.99
Riggins 424 3,745.47 1.050 3,932.74 0.039% 934.17 4,866.91
Stites 223 951.13 1.050 998.69 0.020% 491.32 1,490.01
White Bird 93 780.96 1.050 820.01 0.009% 204.90 1,024.91
Subtotal: 227,147.80 238,505.20 40,120.24 278,625.44
County and City Base and Excess Distribution (S-2)
Quarter Ending: September 30, 2012
Statewide Dollar Distribution Information:
City and County Total Actual Base:
County or City Population1
Population Information: Total City Excess Distribution:
Population all Counties July 2011 Total County Excess Distribution:
Population all Cities July 2011 City and County Distribution:
Note:Calculations may not agree due to rounding.
1-Most current census info.
2-Lesser of 1.05 or total City/Cnty dist divided by total City/Cnty hypo base.
3-Col. 2 divided by statwide pop. of Counties or Cities.
4-Col. 6 X total City or Cnty excess.
Page 25 of 44 EPB00676_10-19-2012

October 19, 2012
9,538,821.12
2,402,532.12
1,584,985 2,402,532.12
1,090,459 14,343,885.36
(1) (2) (3) (4) (5) (6) (7) (8)
Hypothetical Factor2
Actual % Based New Total to be
Base Base Distribution on Population3
Excess4
Distributed
Col 3 X Col 4 Col 5 + Col 7
Jefferson 26,301 85,113.58 1.050 89,369.26 1.659% 39,867.25 129,236.51
Hamer 48 3.19 1.050 3.35 0.004% 105.76 109.11
Lewisville 462 912.52 1.050 958.15 0.042% 1,017.89 1,976.04
Menan 745 1,590.72 1.050 1,670.26 0.068% 1,641.41 3,311.67
Mud Lake 361 907.55 1.050 952.93 0.033% 795.37 1,748.30
Rigby 3,988 20,918.08 1.050 21,963.98 0.366% 8,786.48 30,750.46
Ririe (part) 612 2,375.87 1.050 2,494.66 0.056% 1,348.38 3,843.04
Roberts 584 2,685.40 1.050 2,819.67 0.054% 1,286.69 4,106.36
Subtotal: 114,506.91 120,232.26 54,849.23 175,081.49
County and City Base and Excess Distribution (S-2)
Quarter Ending: September 30, 2012
Statewide Dollar Distribution Information:
City and County Total Actual Base:
County or City Population1
Population Information: Total City Excess Distribution:
Population all Counties July 2011 Total County Excess Distribution:
Population all Cities July 2011 City and County Distribution:
Note:Calculations may not agree due to rounding.
1-Most current census info.
2-Lesser of 1.05 or total City/Cnty dist divided by total City/Cnty hypo base.
3-Col. 2 divided by statwide pop. of Counties or Cities.
4-Col. 6 X total City or Cnty excess.
Page 26 of 44 EPB00676_10-19-2012

October 19, 2012
9,538,821.12
2,402,532.12
1,584,985 2,402,532.12
1,090,459 14,343,885.36
(1) (2) (3) (4) (5) (6) (7) (8)
Hypothetical Factor2
Actual % Based New Total to be
Base Base Distribution on Population3
Excess4
Distributed
Col 3 X Col 4 Col 5 + Col 7
Jerome 22,682 62,585.95 1.050 65,715.25 1.431% 34,381.55 100,096.80
Eden 410 902.13 1.050 947.24 0.038% 903.32 1,850.56
Hazelton 762 1,802.93 1.050 1,893.08 0.070% 1,678.86 3,571.94
Jerome 11,040 38,496.97 1.050 40,421.82 1.012% 24,323.66 64,745.48
Subtotal: 103,787.98 108,977.39 61,287.39 170,264.78
County and City Base and Excess Distribution (S-2)
Quarter Ending: September 30, 2012
Statewide Dollar Distribution Information:
City and County Total Actual Base:
County or City Population1
Population Information: Total City Excess Distribution:
Population all Counties July 2011 Total County Excess Distribution:
Population all Cities July 2011 City and County Distribution:
Note:Calculations may not agree due to rounding.
1-Most current census info.
2-Lesser of 1.05 or total City/Cnty dist divided by total City/Cnty hypo base.
3-Col. 2 divided by statwide pop. of Counties or Cities.
4-Col. 6 X total City or Cnty excess.
Page 27 of 44 EPB00676_10-19-2012

October 19, 2012
9,538,821.12
2,402,532.12
1,584,985 2,402,532.12
1,090,459 14,343,885.36
(1) (2) (3) (4) (5) (6) (7) (8)
Hypothetical Factor2
Actual % Based New Total to be
Base Base Distribution on Population3
Excess4
Distributed
Col 3 X Col 4 Col 5 + Col 7
Kootenai 141,132 160,835.74 1.050 168,877.53 8.904% 213,928.94 382,806.47
Athol 706 665.24 1.050 698.50 0.065% 1,555.48 2,253.98
Coeur d'Alene 44,962 93,802.91 1.050 98,493.06 4.123% 99,061.63 197,554.69
Dalton Gardens 2,381 855.88 1.050 898.67 0.218% 5,245.89 6,144.56
Fernan Lake Village 171 159.68 1.050 167.66 0.016% 376.75 544.41
Harrison 207 495.37 1.050 520.14 0.019% 456.07 976.21
Hauser Lake 692 66.06 1.050 69.36 0.063% 1,524.64 1,594.00
Hayden 13,550 3,361.25 1.050 3,529.31 1.243% 29,853.77 33,383.08
Hayden Lake 590 615.05 1.050 645.80 0.054% 1,299.91 1,945.71
Huetter 102 3.21 1.050 3.37 0.009% 224.73 228.10
Post Falls 28,104 27,390.66 1.050 28,760.19 2.577% 61,919.58 90,679.77
Rathdrum 6,969 3,489.50 1.050 3,663.98 0.639% 15,354.31 19,018.29
Spirit Lake 622 1,451.48 1.050 1,524.05 0.057% 1,370.41 2,894.46
State Line 38 7.00 1.050 7.35 0.003% 83.72 91.07
Worley 262 399.95 1.050 419.95 0.024% 577.25 997.20
Subtotal: 293,598.98 308,278.92 432,833.08 741,112.00
County and City Base and Excess Distribution (S-2)
Quarter Ending: September 30, 2012
Statewide Dollar Distribution Information:
City and County Total Actual Base:
County or City Population1
Population Information: Total City Excess Distribution:
Population all Counties July 2011 Total County Excess Distribution:
Population all Cities July 2011 City and County Distribution:
Note:Calculations may not agree due to rounding.
1-Most current census info.
2-Lesser of 1.05 or total City/Cnty dist divided by total City/Cnty hypo base.
3-Col. 2 divided by statwide pop. of Counties or Cities.
4-Col. 6 X total City or Cnty excess.
Page 28 of 44 EPB00676_10-19-2012
October 19, 2012
9,538,821.12
2,402,532.12
1,584,985 2,402,532.12
1,090,459 14,343,885.36
(1) (2) (3) (4) (5) (6) (7) (8)
Hypothetical Factor2
Actual % Based New Total to be
Base Base Distribution on Population3
Excess4
Distributed
Col 3 X Col 4 Col 5 + Col 7
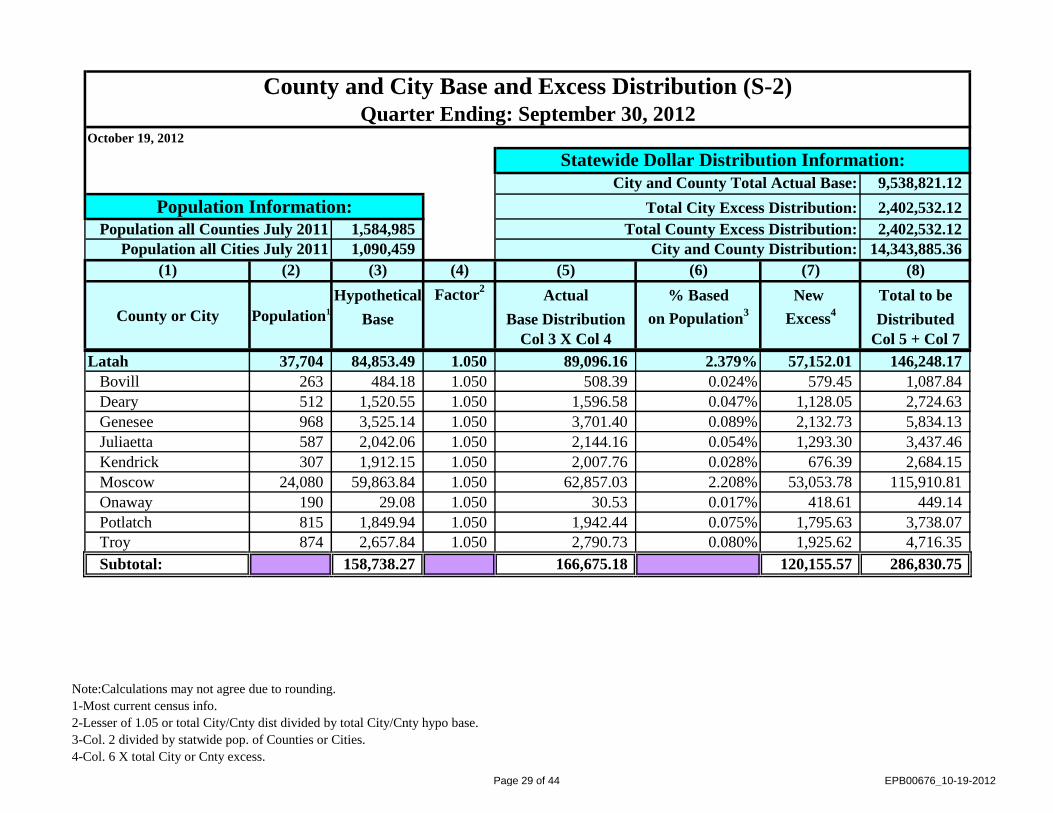
Latah 37,704 84,853.49 1.050 89,096.16 2.379% 57,152.01 146,248.17
Bovill 263 484.18 1.050 508.39 0.024% 579.45 1,087.84
Deary 512 1,520.55 1.050 1,596.58 0.047% 1,128.05 2,724.63
Genesee 968 3,525.14 1.050 3,701.40 0.089% 2,132.73 5,834.13
Juliaetta 587 2,042.06 1.050 2,144.16 0.054% 1,293.30 3,437.46
Kendrick 307 1,912.15 1.050 2,007.76 0.028% 676.39 2,684.15
Moscow 24,080 59,863.84 1.050 62,857.03 2.208% 53,053.78 115,910.81
Onaway 190 29.08 1.050 30.53 0.017% 418.61 449.14
Potlatch 815 1,849.94 1.050 1,942.44 0.075% 1,795.63 3,738.07
Troy 874 2,657.84 1.050 2,790.73 0.080% 1,925.62 4,716.35
Subtotal: 158,738.27 166,675.18 120,155.57 286,830.75
County and City Base and Excess Distribution (S-2)
Quarter Ending: September 30, 2012
Statewide Dollar Distribution Information:
City and County Total Actual Base:
County or City Population1
Population Information: Total City Excess Distribution:
Population all Counties July 2011 Total County Excess Distribution:
Population all Cities July 2011 City and County Distribution:
Note:Calculations may not agree due to rounding.
1-Most current census info.
2-Lesser of 1.05 or total City/Cnty dist divided by total City/Cnty hypo base.
3-Col. 2 divided by statwide pop. of Counties or Cities.
4-Col. 6 X total City or Cnty excess.
Page 29 of 44 EPB00676_10-19-2012

October 19, 2012
9,538,821.12
2,402,532.12
1,584,985 2,402,532.12
1,090,459 14,343,885.36
(1) (2) (3) (4) (5) (6) (7) (8)
Hypothetical Factor2
Actual % Based New Total to be
Base Base Distribution on Population3
Excess4
Distributed
Col 3 X Col 4 Col 5 + Col 7
Lemhi 7,967 94,798.48 1.050 99,538.40 0.503% 12,076.44 111,614.84
Leadore 105 448.49 1.050 470.91 0.010% 231.34 702.25
Salmon 3,514 49,335.28 1.050 51,802.04 0.322% 7,742.15 59,544.19
Subtotal: 144,582.25 151,811.35 20,049.93 171,861.28
County and City Base and Excess Distribution (S-2)
Quarter Ending: September 30, 2012
Statewide Dollar Distribution Information:
City and County Total Actual Base:
County or City Population1
Population Information: Total City Excess Distribution:
Population all Counties July 2011 Total County Excess Distribution:
Population all Cities July 2011 City and County Distribution:
Note:Calculations may not agree due to rounding.
1-Most current census info.
2-Lesser of 1.05 or total City/Cnty dist divided by total City/Cnty hypo base.
3-Col. 2 divided by statwide pop. of Counties or Cities.
4-Col. 6 X total City or Cnty excess.
Page 30 of 44 EPB00676_10-19-2012

October 19, 2012
9,538,821.12
2,402,532.12
1,584,985 2,402,532.12
1,090,459 14,343,885.36
(1) (2) (3) (4) (5) (6) (7) (8)
Hypothetical Factor2
Actual % Based New Total to be
Base Base Distribution on Population3
Excess4
Distributed
Col 3 X Col 4 Col 5 + Col 7
Lewis 3,822 30,283.70 1.050 31,797.89 0.241% 5,793.42 37,591.31
Craigmont 502 5,928.18 1.050 6,224.59 0.046% 1,106.02 7,330.61
Kamiah (part) 1 5,992.52 1.050 6,292.15 0.000% 2.20 6,294.35
Nezperce 465 4,301.35 1.050 4,516.42 0.043% 1,024.50 5,540.92
Reubens 71 188.66 1.050 198.09 0.007% 156.43 354.52
Winchester 340 1,936.86 1.050 2,033.70 0.031% 749.10 2,782.80
Subtotal: 48,631.27 51,062.84 8,831.67 59,894.51
County and City Base and Excess Distribution (S-2)
Quarter Ending: September 30, 2012
Statewide Dollar Distribution Information:
City and County Total Actual Base:
County or City Population1
Population Information: Total City Excess Distribution:
Population all Counties July 2011 Total County Excess Distribution:
Population all Cities July 2011 City and County Distribution:
Note:Calculations may not agree due to rounding.
1-Most current census info.
2-Lesser of 1.05 or total City/Cnty dist divided by total City/Cnty hypo base.
3-Col. 2 divided by statwide pop. of Counties or Cities.
4-Col. 6 X total City or Cnty excess.
Page 31 of 44 EPB00676_10-19-2012

October 19, 2012
9,538,821.12
2,402,532.12
1,584,985 2,402,532.12
1,090,459 14,343,885.36
(1) (2) (3) (4) (5) (6) (7) (8)
Hypothetical Factor2
Actual % Based New Total to be
Base Base Distribution on Population3
Excess4
Distributed
Col 3 X Col 4 Col 5 + Col 7
Lincoln 5,186 38,862.47 1.050 40,805.59 0.327% 7,860.98 48,666.57
Dietrich 329 442.48 1.050 464.60 0.030% 724.86 1,189.46
Richfield 480 2,548.39 1.050 2,675.81 0.044% 1,057.55 3,733.36
Shoshone 3,124 20,525.12 1.050 21,551.38 0.286% 6,882.89 28,434.27
Subtotal: 62,378.46 65,497.38 16,526.28 82,023.66
County and City Base and Excess Distribution (S-2)
Quarter Ending: September 30, 2012
Statewide Dollar Distribution Information:
City and County Total Actual Base:
County or City Population1
Population Information: Total City Excess Distribution:
Population all Counties July 2011 Total County Excess Distribution:
Population all Cities July 2011 City and County Distribution:
Note:Calculations may not agree due to rounding.
1-Most current census info.
2-Lesser of 1.05 or total City/Cnty dist divided by total City/Cnty hypo base.
3-Col. 2 divided by statwide pop. of Counties or Cities.
4-Col. 6 X total City or Cnty excess.
Page 32 of 44 EPB00676_10-19-2012

October 19, 2012
9,538,821.12
2,402,532.12
1,584,985 2,402,532.12
1,090,459 14,343,885.36
(1) (2) (3) (4) (5) (6) (7) (8)
Hypothetical Factor2
Actual % Based New Total to be
Base Base Distribution on Population3
Excess4
Distributed
Col 3 X Col 4 Col 5 + Col 7
Madison 37,864 68,357.92 1.050 71,775.82 2.389% 57,394.53 129,170.35
Rexburg 25,705 22,123.51 1.050 23,229.69 2.357% 56,634.03 79,863.72
Sugar City 1,528 1,163.54 1.050 1,221.72 0.140% 3,366.54 4,588.26
Subtotal: 91,644.97 96,227.23 117,395.10 213,622.33
County and City Base and Excess Distribution (S-2)
Quarter Ending: September 30, 2012
Statewide Dollar Distribution Information:
City and County Total Actual Base:
County or City Population1
Population Information: Total City Excess Distribution:
Population all Counties July 2011 Total County Excess Distribution:
Population all Cities July 2011 City and County Distribution:
Note:Calculations may not agree due to rounding.
1-Most current census info.
2-Lesser of 1.05 or total City/Cnty dist divided by total City/Cnty hypo base.
3-Col. 2 divided by statwide pop. of Counties or Cities.
4-Col. 6 X total City or Cnty excess.
Page 33 of 44 EPB00676_10-19-2012

October 19, 2012
9,538,821.12
2,402,532.12
1,584,985 2,402,532.12
1,090,459 14,343,885.36
(1) (2) (3) (4) (5) (6) (7) (8)
Hypothetical Factor2
Actual % Based New Total to be
Base Base Distribution on Population3
Excess4
Distributed
Col 3 X Col 4 Col 5 + Col 7
Minidoka 20,155 124,196.52 1.050 130,406.35 1.272% 30,551.10 160,957.45
Acequia 125 355.80 1.050 373.59 0.011% 275.40 648.99
Burley (part) 282 5,418.83 1.050 5,689.77 0.026% 621.31 6,311.08
Heyburn 3,100 7,954.48 1.050 8,352.20 0.284% 6,830.01 15,182.21
Minidoka 113 274.10 1.050 287.81 0.010% 248.97 536.78
Paul 1,174 3,448.87 1.050 3,621.31 0.108% 2,586.59 6,207.90
Rupert 5,578 22,478.30 1.050 23,602.22 0.512% 12,289.62 35,891.84
Subtotal: 164,126.90 172,333.25 53,403.00 225,736.25
County and City Base and Excess Distribution (S-2)
Quarter Ending: September 30, 2012
Statewide Dollar Distribution Information:
City and County Total Actual Base:
County or City Population1
Population Information: Total City Excess Distribution:
Population all Counties July 2011 Total County Excess Distribution:
Population all Cities July 2011 City and County Distribution:
Note:Calculations may not agree due to rounding.
1-Most current census info.
2-Lesser of 1.05 or total City/Cnty dist divided by total City/Cnty hypo base.
3-Col. 2 divided by statwide pop. of Counties or Cities.
4-Col. 6 X total City or Cnty excess.
Page 34 of 44 EPB00676_10-19-2012

October 19, 2012
9,538,821.12
2,402,532.12
1,584,985 2,402,532.12
1,090,459 14,343,885.36
(1) (2) (3) (4) (5) (6) (7) (8)
Hypothetical Factor2
Actual % Based New Total to be
Base Base Distribution on Population3
Excess4
Distributed
Col 3 X Col 4 Col 5 + Col 7
Nez Perce 39,543 210,437.17 1.050 220,959.03 2.495% 59,939.58 280,898.61
Culdesac 384 1,449.62 1.050 1,522.10 0.035% 846.04 2,368.14
Lapwai 1,144 1,086.51 1.050 1,140.84 0.105% 2,520.50 3,661.34
Lewiston 32,119 354,768.73 1.050 372,507.17 2.945% 70,765.55 443,272.72
Peck 198 495.57 1.050 520.35 0.018% 436.24 956.59
Subtotal: 568,237.60 596,649.49 134,507.91 731,157.40
County and City Base and Excess Distribution (S-2)
Quarter Ending: September 30, 2012
Statewide Dollar Distribution Information:
City and County Total Actual Base:
County or City Population1
Population Information: Total City Excess Distribution:
Population all Counties July 2011 Total County Excess Distribution:
Population all Cities July 2011 City and County Distribution:
Note:Calculations may not agree due to rounding.
1-Most current census info.
2-Lesser of 1.05 or total City/Cnty dist divided by total City/Cnty hypo base.
3-Col. 2 divided by statwide pop. of Counties or Cities.
4-Col. 6 X total City or Cnty excess.
Page 35 of 44 EPB00676_10-19-2012

October 19, 2012
9,538,821.12
2,402,532.12
1,584,985 2,402,532.12
1,090,459 14,343,885.36
(1) (2) (3) (4) (5) (6) (7) (8)
Hypothetical Factor2
Actual % Based New Total to be
Base Base Distribution on Population3
Excess4
Distributed
Col 3 X Col 4 Col 5 + Col 7
Oneida 4,215 48,505.51 1.050 50,930.79 0.266% 6,389.13 57,319.92
Malad City 817 18,390.19 1.050 19,309.70 0.075% 1,800.04 21,109.74
Subtotal: 66,895.70 70,240.49 8,189.17 78,429.66
County and City Base and Excess Distribution (S-2)
Quarter Ending: September 30, 2012
Statewide Dollar Distribution Information:
City and County Total Actual Base:
County or City Population1
Population Information: Total City Excess Distribution:
Population all Counties July 2011 Total County Excess Distribution:
Population all Cities July 2011 City and County Distribution:
Note:Calculations may not agree due to rounding.
1-Most current census info.
2-Lesser of 1.05 or total City/Cnty dist divided by total City/Cnty hypo base.
3-Col. 2 divided by statwide pop. of Counties or Cities.
4-Col. 6 X total City or Cnty excess.
Page 36 of 44 EPB00676_10-19-2012

October 19, 2012
9,538,821.12
2,402,532.12
1,584,985 2,402,532.12
1,090,459 14,343,885.36
(1) (2) (3) (4) (5) (6) (7) (8)
Hypothetical Factor2
Actual % Based New Total to be
Base Base Distribution on Population3
Excess4
Distributed
Col 3 X Col 4 Col 5 + Col 7
Owyhee 11,438 119,566.34 1.050 125,544.66 0.722% 17,337.81 142,882.47
Grand View 449 414.65 1.050 435.38 0.041% 989.25 1,424.63
Homedale 2,613 20,711.60 1.050 21,747.18 0.240% 5,757.04 27,504.22
Marsing 2,061 7,754.25 1.050 8,141.96 0.189% 4,540.86 12,682.82
Subtotal: 148,446.84 155,869.18 28,624.96 184,494.14
County and City Base and Excess Distribution (S-2)
Quarter Ending: September 30, 2012
Statewide Dollar Distribution Information:
City and County Total Actual Base:
County or City Population1
Population Information: Total City Excess Distribution:
Population all Counties July 2011 Total County Excess Distribution:
Population all Cities July 2011 City and County Distribution:
Note:Calculations may not agree due to rounding.
1-Most current census info.
2-Lesser of 1.05 or total City/Cnty dist divided by total City/Cnty hypo base.
3-Col. 2 divided by statwide pop. of Counties or Cities.
4-Col. 6 X total City or Cnty excess.
Page 37 of 44 EPB00676_10-19-2012
October 19, 2012
9,538,821.12
2,402,532.12
1,584,985 2,402,532.12
1,090,459 14,343,885.36
(1) (2) (3) (4) (5) (6) (7) (8)
Hypothetical Factor2
Actual % Based New Total to be
Base Base Distribution on Population3
Excess4
Distributed
Col 3 X Col 4 Col 5 + Col 7
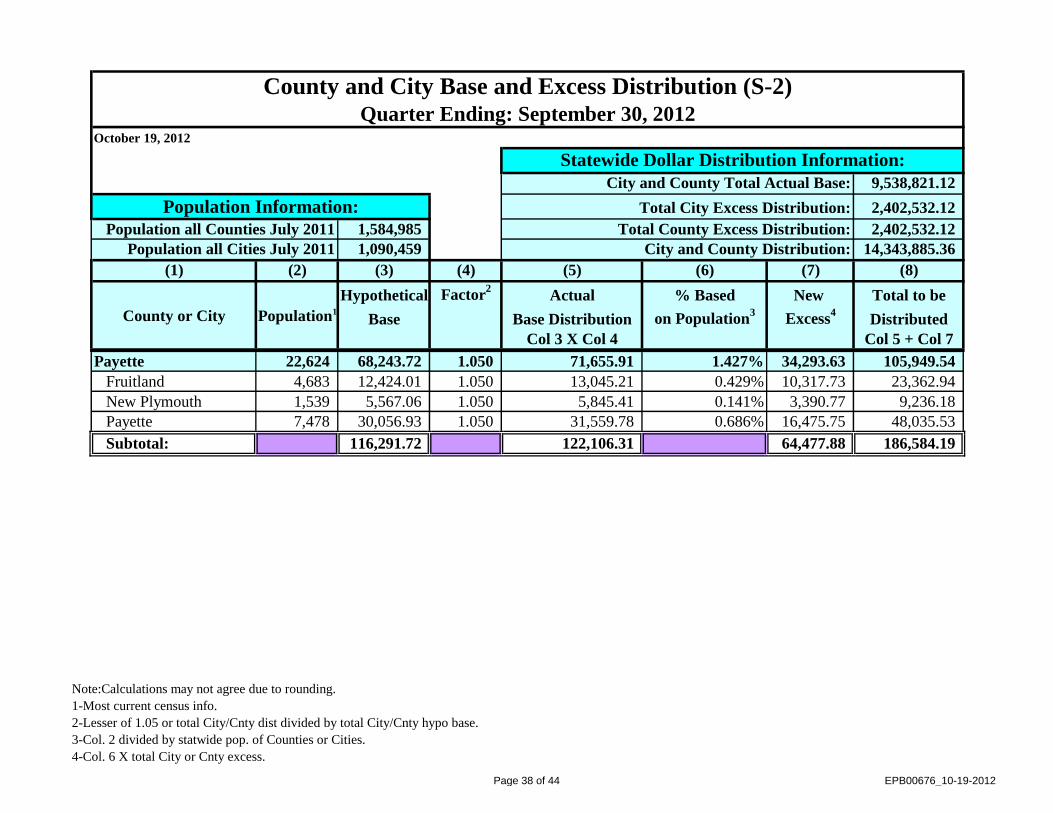
Payette 22,624 68,243.72 1.050 71,655.91 1.427% 34,293.63 105,949.54
Fruitland 4,683 12,424.01 1.050 13,045.21 0.429% 10,317.73 23,362.94
New Plymouth 1,539 5,567.06 1.050 5,845.41 0.141% 3,390.77 9,236.18
Payette 7,478 30,056.93 1.050 31,559.78 0.686% 16,475.75 48,035.53
Subtotal: 116,291.72 122,106.31 64,477.88 186,584.19
County and City Base and Excess Distribution (S-2)
Quarter Ending: September 30, 2012
Statewide Dollar Distribution Information:
City and County Total Actual Base:
County or City Population1
Population Information: Total City Excess Distribution:
Population all Counties July 2011 Total County Excess Distribution:
Population all Cities July 2011 City and County Distribution:
Note:Calculations may not agree due to rounding.
1-Most current census info.
2-Lesser of 1.05 or total City/Cnty dist divided by total City/Cnty hypo base.
3-Col. 2 divided by statwide pop. of Counties or Cities.
4-Col. 6 X total City or Cnty excess.
Page 38 of 44 EPB00676_10-19-2012

October 19, 2012
9,538,821.12
2,402,532.12
1,584,985 2,402,532.12
1,090,459 14,343,885.36
(1) (2) (3) (4) (5) (6) (7) (8)
Hypothetical Factor2
Actual % Based New Total to be
Base Base Distribution on Population3
Excess4
Distributed
Col 3 X Col 4 Col 5 + Col 7
Power 7,766 49,259.23 1.050 51,722.19 0.490% 11,771.76 63,493.95
American Falls 4,428 18,637.82 1.050 19,569.71 0.406% 9,755.90 29,325.61
Pocatello (part) 219 290.54 1.050 305.07 0.020% 482.51 787.58
Rockland 292 511.92 1.050 537.52 0.027% 643.34 1,180.86
Subtotal: 68,699.51 72,134.49 22,653.51 94,788.00
County and City Base and Excess Distribution (S-2)
Quarter Ending: September 30, 2012
Statewide Dollar Distribution Information:
City and County Total Actual Base:
County or City Population1
Population Information: Total City Excess Distribution:
Population all Counties July 2011 Total County Excess Distribution:
Population all Cities July 2011 City and County Distribution:
Note:Calculations may not agree due to rounding.
1-Most current census info.
2-Lesser of 1.05 or total City/Cnty dist divided by total City/Cnty hypo base.
3-Col. 2 divided by statwide pop. of Counties or Cities.
4-Col. 6 X total City or Cnty excess.
Page 39 of 44 EPB00676_10-19-2012

October 19, 2012
9,538,821.12
2,402,532.12
1,584,985 2,402,532.12
1,090,459 14,343,885.36
(1) (2) (3) (4) (5) (6) (7) (8)
Hypothetical Factor2
Actual % Based New Total to be
Base Base Distribution on Population3
Excess4
Distributed
Col 3 X Col 4 Col 5 + Col 7
Shoshone 12,672 113,754.15 1.050 119,441.86 0.800% 19,208.31 138,650.17
Kellogg 2,105 42,478.75 1.050 44,602.69 0.193% 4,637.80 49,240.49
Mullan 687 3,382.19 1.050 3,551.30 0.063% 1,513.62 5,064.92
Osburn 1,544 9,833.82 1.050 10,325.51 0.142% 3,401.79 13,727.30
Pinehurst 1,608 4,117.86 1.050 4,323.75 0.147% 3,542.79 7,866.54
Smelterville 7,354 1,216.12 1.050 1,276.93 0.674% 16,202.55 17,479.48
Wallace 778 23,541.94 1.050 24,719.04 0.071% 1,714.11 26,433.15
Wardner 186 1,064.76 1.050 1,118.00 0.017% 409.80 1,527.80
Subtotal: 199,389.59 209,359.08 50,630.77 259,989.85
County and City Base and Excess Distribution (S-2)
Quarter Ending: September 30, 2012
Statewide Dollar Distribution Information:
City and County Total Actual Base:
County or City Population1
Population Information: Total City Excess Distribution:
Population all Counties July 2011 Total County Excess Distribution:
Population all Cities July 2011 City and County Distribution:
Note:Calculations may not agree due to rounding.
1-Most current census info.
2-Lesser of 1.05 or total City/Cnty dist divided by total City/Cnty hypo base.
3-Col. 2 divided by statwide pop. of Counties or Cities.
4-Col. 6 X total City or Cnty excess.
Page 40 of 44 EPB00676_10-19-2012

October 19, 2012
9,538,821.12
2,402,532.12
1,584,985 2,402,532.12
1,090,459 14,343,885.36
(1) (2) (3) (4) (5) (6) (7) (8)
Hypothetical Factor2
Actual % Based New Total to be
Base Base Distribution on Population3
Excess4
Distributed
Col 3 X Col 4 Col 5 + Col 7
Teton 10,166 27,565.21 1.050 28,943.47 0.641% 15,409.70 44,353.17
Driggs 1,660 4,611.19 1.050 4,841.75 0.152% 3,657.36 8,499.11
Tetonia 269 606.12 1.050 636.43 0.025% 592.67 1,229.10
Victor 1,927 2,377.76 1.050 2,496.65 0.177% 4,245.62 6,742.27
Subtotal: 35,160.28 36,918.30 23,905.35 60,823.65
County and City Base and Excess Distribution (S-2)
Quarter Ending: September 30, 2012
Statewide Dollar Distribution Information:
City and County Total Actual Base:
County or City Population1
Population Information: Total City Excess Distribution:
Population all Counties July 2011 Total County Excess Distribution:
Population all Cities July 2011 City and County Distribution:
Note:Calculations may not agree due to rounding.
1-Most current census info.
2-Lesser of 1.05 or total City/Cnty dist divided by total City/Cnty hypo base.
3-Col. 2 divided by statwide pop. of Counties or Cities.
4-Col. 6 X total City or Cnty excess.
Page 41 of 44 EPB00676_10-19-2012
October 19, 2012
9,538,821.12
2,402,532.12
1,584,985 2,402,532.12
1,090,459 14,343,885.36
(1) (2) (3) (4) (5) (6) (7) (8)
Hypothetical Factor2
Actual % Based New Total to be
Base Base Distribution on Population3
Excess4
Distributed
Col 3 X Col 4 Col 5 + Col 7
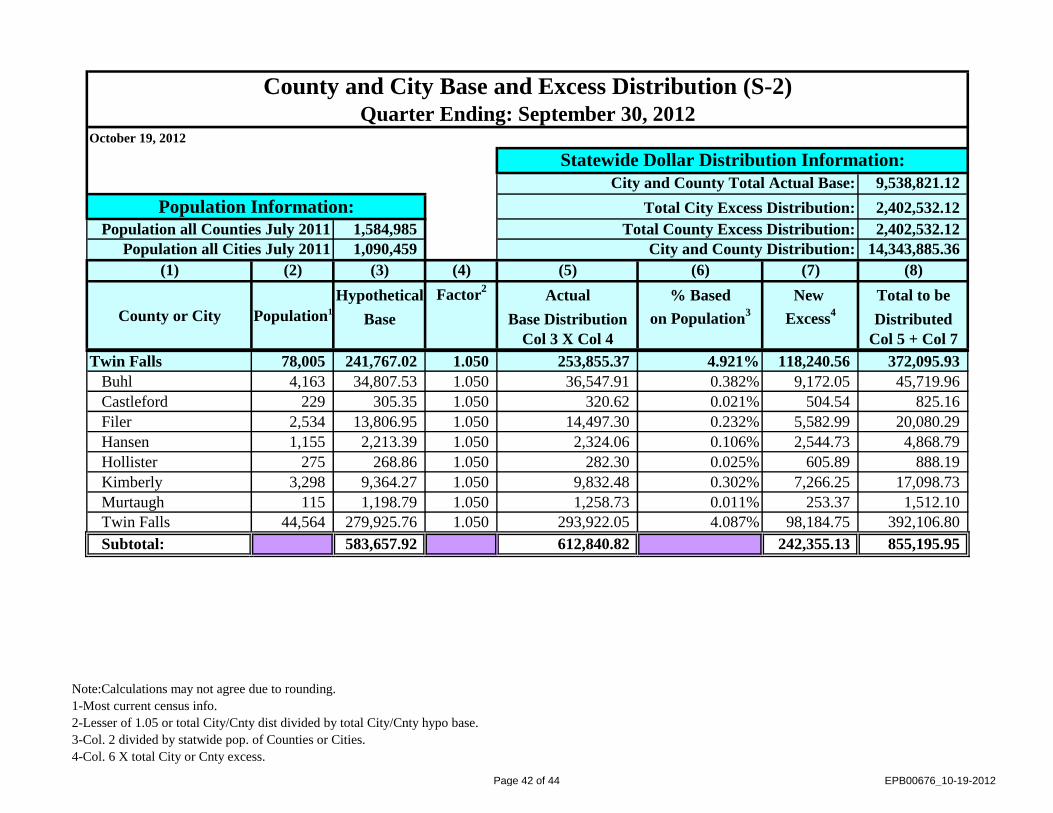
Twin Falls 78,005 241,767.02 1.050 253,855.37 4.921% 118,240.56 372,095.93
Buhl 4,163 34,807.53 1.050 36,547.91 0.382% 9,172.05 45,719.96
Castleford 229 305.35 1.050 320.62 0.021% 504.54 825.16
Filer 2,534 13,806.95 1.050 14,497.30 0.232% 5,582.99 20,080.29
Hansen 1,155 2,213.39 1.050 2,324.06 0.106% 2,544.73 4,868.79
Hollister 275 268.86 1.050 282.30 0.025% 605.89 888.19
Kimberly 3,298 9,364.27 1.050 9,832.48 0.302% 7,266.25 17,098.73
Murtaugh 115 1,198.79 1.050 1,258.73 0.011% 253.37 1,512.10
Twin Falls 44,564 279,925.76 1.050 293,922.05 4.087% 98,184.75 392,106.80
Subtotal: 583,657.92 612,840.82 242,355.13 855,195.95
County and City Base and Excess Distribution (S-2)
Quarter Ending: September 30, 2012
Statewide Dollar Distribution Information:
City and County Total Actual Base:
County or City Population1
Population Information: Total City Excess Distribution:
Population all Counties July 2011 Total County Excess Distribution:
Population all Cities July 2011 City and County Distribution:
Note:Calculations may not agree due to rounding.
1-Most current census info.
2-Lesser of 1.05 or total City/Cnty dist divided by total City/Cnty hypo base.
3-Col. 2 divided by statwide pop. of Counties or Cities.
4-Col. 6 X total City or Cnty excess.
Page 42 of 44 EPB00676_10-19-2012

October 19, 2012
9,538,821.12
2,402,532.12
1,584,985 2,402,532.12
1,090,459 14,343,885.36
(1) (2) (3) (4) (5) (6) (7) (8)
Hypothetical Factor2
Actual % Based New Total to be
Base Base Distribution on Population3
Excess4
Distributed
Col 3 X Col 4 Col 5 + Col 7
Valley 9,638 39,713.84 1.050 41,699.53 0.608% 14,609.35 56,308.88
Cascade 918 6,140.79 1.050 6,447.83 0.084% 2,022.57 8,470.40
Donnelly 148 473.99 1.050 497.69 0.014% 326.08 823.77
McCall 194 20,863.48 1.050 21,906.65 0.018% 427.43 22,334.08
Subtotal: 67,192.10 70,551.70 17,385.43 87,937.13
County and City Base and Excess Distribution (S-2)
Quarter Ending: September 30, 2012
Statewide Dollar Distribution Information:
City and County Total Actual Base:
County or City Population1
Population Information: Total City Excess Distribution:
Population all Counties July 2011 Total County Excess Distribution:
Population all Cities July 2011 City and County Distribution:
Note:Calculations may not agree due to rounding.
1-Most current census info.
2-Lesser of 1.05 or total City/Cnty dist divided by total City/Cnty hypo base.
3-Col. 2 divided by statwide pop. of Counties or Cities.
4-Col. 6 X total City or Cnty excess.
Page 43 of 44 EPB00676_10-19-2012

October 19, 2012
9,538,821.12
2,402,532.12
1,584,985 2,402,532.12
1,090,459 14,343,885.36
(1) (2) (3) (4) (5) (6) (7) (8)
Hypothetical Factor2
Actual % Based New Total to be
Base Base Distribution on Population3
Excess4
Distributed
Col 3 X Col 4 Col 5 + Col 7
Washington 10,255 94,870.92 1.050 99,614.47 0.647% 15,544.61 115,159.08
Cambridge 330 1,557.33 1.050 1,635.20 0.030% 727.07 2,362.27
Midvale 171 378.36 1.050 397.28 0.016% 376.75 774.03
Weiser 5,537 46,478.74 1.050 48,802.68 0.508% 12,199.29 61,001.97
Subtotal: 143,285.35 150,449.63 28,847.72 179,297.35
County or City Population1
Population Information: Total City Excess Distribution:
Population all Counties July 2011 Total County Excess Distribution:
County and City Base and Excess Distribution (S-2)
Quarter Ending: September 30, 2012
Statewide Dollar Distribution Information:
City and County Total Actual Base:
Population all Cities July 2011 City and County Distribution:
Note:Calculations may not agree due to rounding.
1-Most current census info.
2-Lesser of 1.05 or total City/Cnty dist divided by total City/Cnty hypo base.
3-Col. 2 divided by statwide pop. of Counties or Cities.
4-Col. 6 X total City or Cnty excess.
Page 44 of 44 EPB00676_10-19-2012