Embed Size (px)
Citation preview
50Glossary . . . . . . . . . . . . . . . . . . . . . . . . . . . . . . . . . . . . . . . . . . . . . .44Technical Note 2: Improved Employment Range . . . . . . . . . . . . . . . . . . . . .40Technical Note 1: Measures of Business Growth . . . . . . . . . . . . . . . . . . . .39Appendix 2: Supplementary Information . . . . . . . . . . . . . . . . . . . . . . . . . .36Appendix 1: ABS Business Counts . . . . . . . . . . . . . . . . . . . . . . . . . . . . .27Explanatory Notes . . . . . . . . . . . . . . . . . . . . . . . . . . . . . . . . . . . . . . . .
A D D I T I O N A L I N F O R M A T I O N
10List of Tables . . . . . . . . . . . . . . . . . . . . . . . . . . . . . . . . . . . . . . . . . . .6Summary of Findings . . . . . . . . . . . . . . . . . . . . . . . . . . . . . . . . . . . . . . .4Conceptual and Practical Basis for Counts . . . . . . . . . . . . . . . . . . . . . . . . .2Notes . . . . . . . . . . . . . . . . . . . . . . . . . . . . . . . . . . . . . . . . . . . . . . . .
page
C O N T E N T S
E M B A R G O : 1 1 . 3 0 A M ( C A N B E R R A T I M E ) M O N 2 M A R 2 0 1 5
COUNTS OF AUSTRALIANBUSINESSES, INCLUDINGENTRIES AND EXITS A U S T R A L I A
8165.0J U N E 2 0 1 0 T O J U N E 2 0 1 4
For further informationabout these and relatedstatistics, contact theNational Information andReferral Service on1300 135 070.
I N Q U I R I E S
w w w . a b s . g o v . a u

Da v i d Ka l i s c h
Au s t r a l i a n S t a t i s t i c i a n
The next release of Counts of Australian Businesses, including Entries and Exits is
scheduled for release in February 2016. A publication PDF will not be produced for
future releases of Counts of Australian Businesses, including Entries and Exits. At this
point in time, all future data and metadata released in Counts of Australian Businesses,
including Entries and Exits are expected to be published on the ABS website in Excel
spreadsheet, ABS.Stat and HTML webpage formats only.
FU T U R E RE L E A S E S
This publication presents counts of Australian businesses and is sourced from the
Australian Bureau of Statistics Business Register (ABSBR).
This publication represents the sixth update to Counts of Australian Businesses,
including Entries and Exits, initially released in February 2007.
This series replaces all previous business counts releases, which can be found on the ABS
website <www.abs.gov.au>.
I N T R O D U C T I O N
2 A B S • C O U N T S OF A U S T R A L I A N B U S I N E S S E S , I N C L U D I N G E N T R I E S A N D E X I T S • 8 1 6 5 . 0 • J U N 2 0 1 0 T O J U N 2 0 1 4
N O T E S

Type of Legal OrganisationTOLO
type of activity unitTAU
System of National AccountsSNA
statistical local areaSLA
Standard Institutional Sector Classification of AustraliaSISCA
Statistical Area Level 2SA2
numberno.
long term non-remittersLTNR
Labour Force SurveyLFS
income tax withholdingITW
income tax instalment payerITIP
goods and services taxGST
group employerGE
enterpriseEN
Census and Statistics Act 1905CSA
Characteristics of Small Business OperatorsCOSBO
Client Activity CentreCAC
Counts of Australian Businesses, including Entries and ExitsCABEE
cataloguecat.
Business Activity StatementBAS
Australian Taxation Office maintained populationATOMP
Australian Taxation OfficeATO
Australian Statistical Geography StandardASGS
Australian Standard Geographical ClassificationASGC
Australian and New Zealand Standard Industrial ClassificationANZSIC
Australian Bureau of Statistics maintained populationABSMP
Australian Bureau of Statistics Business RegisterABSBR
Australian Bureau of StatisticsABS
Australian Business RegisterABR
Australian Business NumberABN
million dollars$m
thousand dollars$k
A B S • C O U N T S OF A U S T R A L I A N B U S I N E S S E S , I N C L U D I N G E N T R I E S A N D E X I T S • 8 1 6 5 . 0 • J U N 2 0 1 0 T O J U N 2 0 1 4 3
A B B R E V I A T I O N S

Active ABNs on the ABR on 30 June 2014[7,667,896]
Businesses included in Counts ofAustralian Businesses, including Entries
and Exits[2,100,162]
Out of scope:Inactive / No ValidCACrole ABNs(a)
Active ABNs on ABSBusiness Register
[5,306,160]
Non-profiled population[2,091,782]
In scope profiledpopulation
[8,380 TAUs]
THE CONCEPTUAL AND PRACTICAL BASIS FOR COUNTS OFAUSTRALIAN BUSINESSES, INCLUDING ENTRIES AND EXITS
Reference Period June 2014(a)
No. of ABNs associatedwith complex business
structures[40,112]
Out of scope:selected classifications(b)
[3,174,266]
All registered entities with anactive ABN
Entities whose activity does not involvetrading in goods or services (e.g.investment vehicles)
Either not operating in the marketsector or where the majority of similarentities have already been made out ofscope. See paragraphs 14–17 of theExplanatory Notes
See paragraphs 6–10 ofthe Explanatory Notes
D I A G R A M 1 :
4 A B S • C O U N T S OF A U S T R A L I A N B U S I N E S S E S , I N C L U D I N G E N T R I E S A N D E X I T S • 8 1 6 5 . 0 • J U N 2 0 1 0 T O J U N 2 0 1 4
C O N C E P T U A L A N D P R A C T I C A L B A S I S F O R C O U N T S
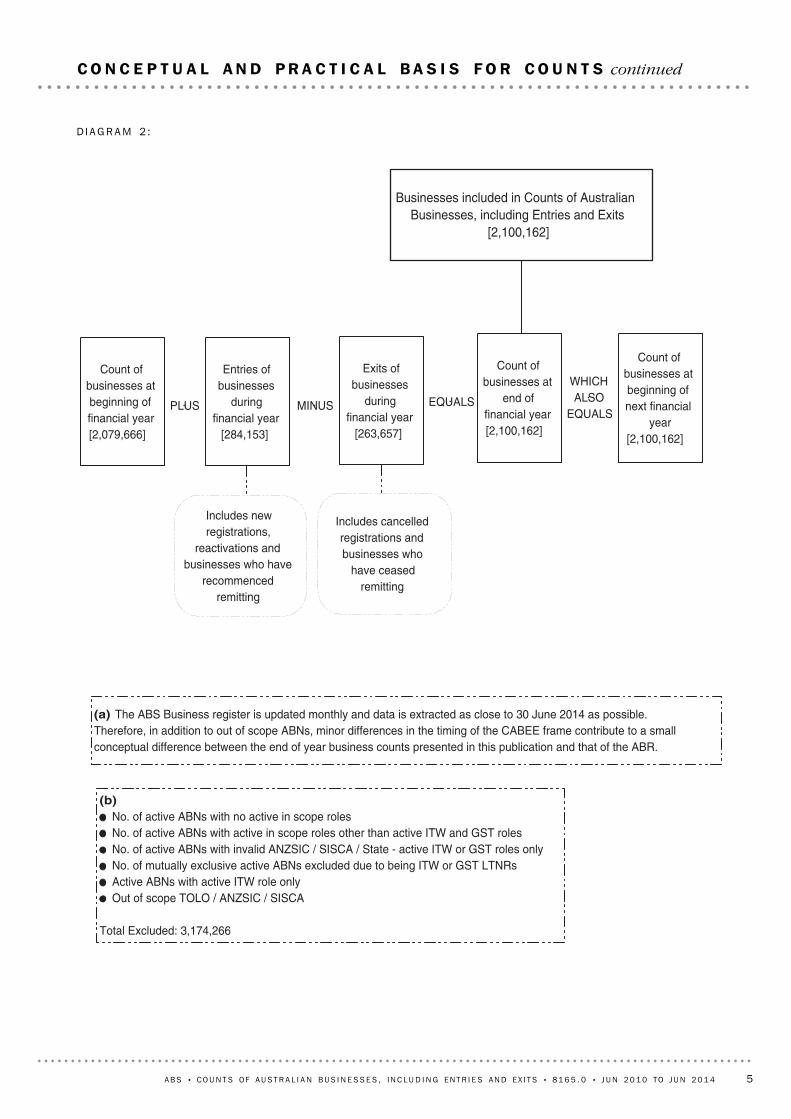
Count ofbusinesses atbeginning offinancial year[2,079,666]
Entries ofbusinesses
duringfinancial year [284,153]
Exits ofbusinesses
duringfinancial year [263,657]
Count ofbusinesses at
end offinancial year[2,100,162]
Count ofbusinesses atbeginning ofnext financial
year[2,100,162]
PLUS MINUS EQUALS
WHICHALSO
EQUALS
Includes newregistrations,
reactivations andbusinesses who have
recommencedremitting
Includes cancelledregistrations andbusinesses who
have ceasedremitting
(b)No. of active ABNs with no active in scope rolesNo. of active ABNs with active in scope roles other than active ITW and GST rolesNo. of active ABNs with invalid ANZSIC / SISCA / State - active ITW or GST roles onlyNo. of mutually exclusive active ABNs excluded due to being ITW or GST LTNRsActive ABNs with active ITW role onlyOut of scope TOLO / ANZSIC / SISCA
Total Excluded: 3,174,266
Businesses included in Counts of AustralianBusinesses, including Entries and Exits
[2,100,162]
(a) The ABS Business register is updated monthly and data is extracted as close to 30 June 2014 as possible.Therefore, in addition to out of scope ABNs, minor differences in the timing of the CABEE frame contribute to a smallconceptual difference between the end of year business counts presented in this publication and that of the ABR.
D I A G R A M 2 :
A B S • C O U N T S OF A U S T R A L I A N B U S I N E S S E S , I N C L U D I N G E N T R I E S A N D E X I T S • 8 1 6 5 . 0 • J U N 2 0 1 0 T O J U N 2 0 1 4 5
C O N C E P T U A L A N D P R A C T I C A L B A S I S F O R C O U N T S continued

2011 2012 2013 2014Still operating in June
%
0
20
40
60
80
100Health Care and Social Assistance businessesAll businessesPublic Administration and Safety businesses
SURVIVAL RATES OF BUSINESSES THAT STARTED IN 2010–11
Construction had the most businesses operating in Australia in June 2014.
Electricity, Gas, Water and Waste Services had the fewest businesses operating in
Australia in June 2014.
Accommodation and Food Services had the highest business entry rate in 2013–14.
Agriculture, Forestry and Fishing had the lowest business entry rate in 2013–14.
Public Administration and Safety had the highest business exit rate in 2013–14.
Health Care and Social Assistance had the lowest business exit rate in 2013–14.
Health Care and Social Assistance businesses were the most likely to survive from
June 2010 to June 2014.
Public Administration and Safety businesses were the least likely to survive from
June 2010 to June 2014.
OF TH E 19 IN D U S T R Y
D I V I S I O N S
There were 2,100,162 actively trading businesses in Australia in June 2014.
The number of actively trading businesses in Australia increased by 1% between June
2013 and June 2014.
The business entry rate increased from 11.2% in 2012–13 to 13.7% in 2013–14.
The business exit rate decreased from 14.0% in 2012–13 to 12.7% in 2013–14.
61.7% of the businesses that were actively trading in Australia in June 2010 were still
operating in June 2014.
Half of the businesses that started operating in 2010–11 were still operating in June
2014.
SU M M A R Y OF F I N D I N G S
6 A B S • C O U N T S OF A U S T R A L I A N B U S I N E S S E S , I N C L U D I N G E N T R I E S A N D E X I T S • 8 1 6 5 . 0 • J U N 2 0 1 0 T O J U N 2 0 1 4
S U M M A R Y O F F I N D I N G S
Non-FinancialCorporations
FinancialCorporations
Households
'000
0
200
400
600
800
1000
1200June 2013June 2014
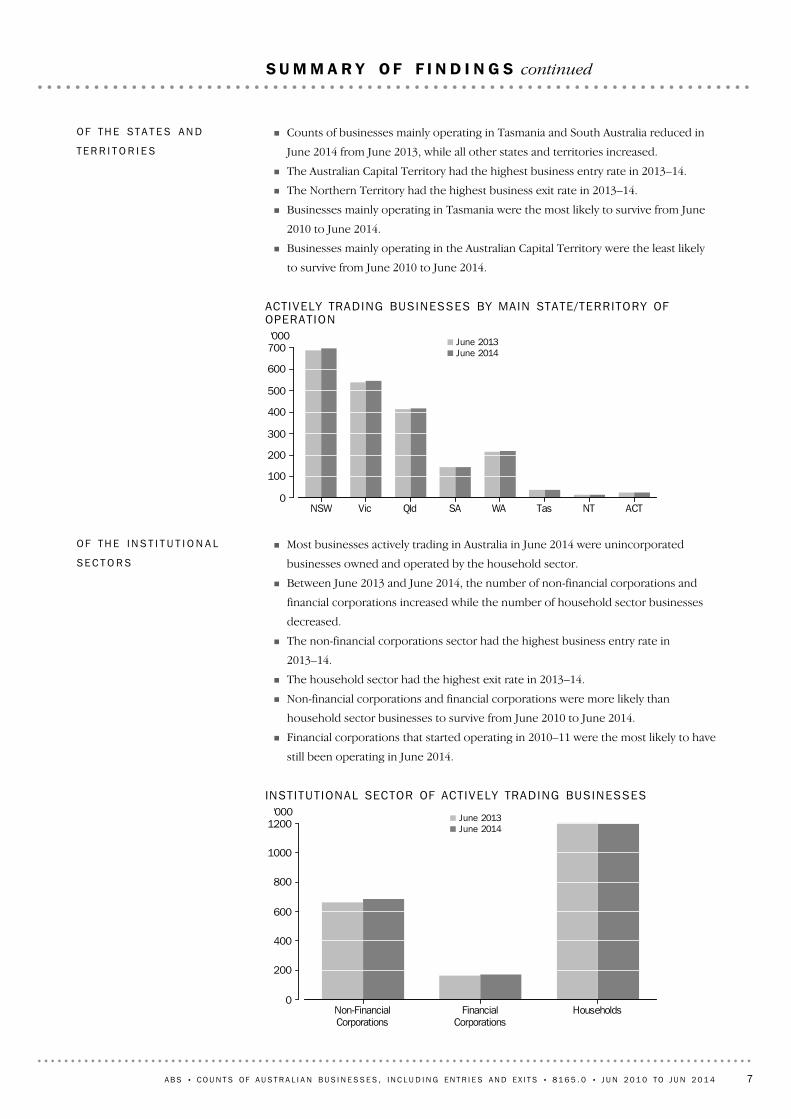
INSTITUT IONAL SECTOR OF ACTIVELY TRADING BUSINESSES
Most businesses actively trading in Australia in June 2014 were unincorporated
businesses owned and operated by the household sector.
Between June 2013 and June 2014, the number of non-financial corporations and
financial corporations increased while the number of household sector businesses
decreased.
The non-financial corporations sector had the highest business entry rate in
2013–14.
The household sector had the highest exit rate in 2013–14.
Non-financial corporations and financial corporations were more likely than
household sector businesses to survive from June 2010 to June 2014.
Financial corporations that started operating in 2010–11 were the most likely to have
still been operating in June 2014.
OF TH E IN S T I T U T I O N A L
SE C T O R S
NSW Vic Qld SA WA Tas NT ACT
'000
0
100
200
300
400
500
600
700June 2013June 2014
ACTIVELY TRADING BUSINESSES BY MAIN STATE/TERRITORY OFOPERAT ION
Counts of businesses mainly operating in Tasmania and South Australia reduced in
June 2014 from June 2013, while all other states and territories increased.
The Australian Capital Territory had the highest business entry rate in 2013–14.
The Northern Territory had the highest business exit rate in 2013–14.
Businesses mainly operating in Tasmania were the most likely to survive from June
2010 to June 2014.
Businesses mainly operating in the Australian Capital Territory were the least likely
to survive from June 2010 to June 2014.
OF TH E ST A T E S AN D
TE R R I T O R I E S
A B S • C O U N T S OF A U S T R A L I A N B U S I N E S S E S , I N C L U D I N G E N T R I E S A N D E X I T S • 8 1 6 5 . 0 • J U N 2 0 1 0 T O J U N 2 0 1 4 7
S U M M A R Y O F F I N D I N G S continued

0
1–4
5–19
20–199
200+
0 2 4 6 8 10 12 14 16%
entry rateexit rate
BUSINESS ENTRY AND EXIT RATES BY NUMBER OFEMPLOYEES— 2013–14
In June 2014, 61% of actively trading businesses in Australia had no employees, 27%
had 1–4, 10% had 5–19, 2% had 20–199, and less than 1% had 200 or more.
Among businesses operating in both June 2013 and June 2014, there was net
movement away from having 1–4 employees in June 2013 towards either having no
employees or having more than 4 employees in June 2014.
The more employees an ongoing business had in June 2010 the more likely it would
survive.
For a business that started operating in 2010–11, the more employees it had the
more likely it would survive.
In 2013–14, business entry and exit rates were highest for businesses with no
employees.
OF TH E EM P L O Y M E N T
S I Z E RA N G E S
(a) There were 572 actively trading public sector businesses in June 2013 and 516 in June 2014.
Companies Sole proprietors Partnerships Trusts Public sector (a)
'000
0
100
200
300
400
500
600
700
800June 2013June 2014
TYPE OF LEGAL ORGANISAT ION OF ACTIVELY TRADING BUSINESSES
Public sector businesses were the least common, with only 516 actively trading
goods or services in Australia in June 2014.
Between June 2013 and June 2014, the number of actively trading companies and
trusts increased while the number of actively trading sole proprietors, partnerships
and public sector businesses each decreased.
The business entry rate was highest for sole proprietors in 2013–14.
The business exit rate was highest for public sector businesses in 2013–14.
Trusts were the most likely to survive from June 2010 to June 2014.
OF TH E T Y P E S OF LE G A L
OR G A N I S A T I O N
8 A B S • C O U N T S OF A U S T R A L I A N B U S I N E S S E S , I N C L U D I N G E N T R I E S A N D E X I T S • 8 1 6 5 . 0 • J U N 2 0 1 0 T O J U N 2 0 1 4
S U M M A R Y O F F I N D I N G S continued

$0 to <$50k
$50k to <$200k
$200k to <$2m
$2m or more
0 5 10 15 20 25%
entry rateexit rate
BUSINESS ENTRY AND EXIT RATES BY ANNUAL TURNOVER— 2013–14
In June 2014, most actively trading businesses had annual turnover under $200,000.
Among businesses operating in both June 2013 and June 2014, there was net
movement away from having annual turnover of between $50,000 and under $2
million in June 2013, towards having annual turnover of either less than $50,000 or
at least $2 million in June 2014.
The more turnover a business had in June 2010 the more likely it would survive.
Businesses that started operating in 2010–11 and had higher turnover ranges were
more likely to survive.
In 2013–14, business entry rates were highest for businesses with annual turnover of
between $50,000 and $199,999 and lowest for businesses with annual turnover of $2
million or more.
In 2013–14, business exit rates were highest for businesses with annual turnover
under $50,000 and lowest for businesses with annual turnover of $2 million or more.
OF TH E TU R N O V E R S I Z E
RA N G E S
A B S • C O U N T S OF A U S T R A L I A N B U S I N E S S E S , I N C L U D I N G E N T R I E S A N D E X I T S • 8 1 6 5 . 0 • J U N 2 0 1 0 T O J U N 2 0 1 4 9
S U M M A R Y O F F I N D I N G S continued

26
Survival of entries by Annual Turnover Size Ranges,
June 2010–June 2014
20.. . . . . . . . . . . . . . . . . . . . . . . . . . . . . . . . . .
26
Survival of businesses by Annual Turnover Size Ranges,
June 2010–June 2014
19.. . . . . . . . . . . . . . . . . . . . . . . . . . . . . . . . . .
25
Change in business size over time for surviving businesses,
June 2010–June 2014
18.. . . . . . . . . . . . . . . . . . . . . . . . . . . . . . . . . .
24Businesses by Annual Turnover Size Ranges, June 2010–June 201417. . . . . . .BU S I N E S S CO U N T S BY AN N U A L TU R N O V E R S I Z E RA N G E S
23Survival of entries by Employment Size Ranges, June 2010–June 201416. . . . .23
Survival of businesses by Employment Size Ranges,
June 2010–June 2014
15.. . . . . . . . . . . . . . . . . . . . . . . . . . . . . . . . . .
22
Change in business size over time for surviving businesses,
June 2010–June 2014
14.. . . . . . . . . . . . . . . . . . . . . . . . . . . . . . . . . .
21Businesses by Employment Size Ranges, June 2010–June 201413. . . . . . . . .BU S I N E S S CO U N T S BY EM P L O Y M E N T S I Z E RA N G E S
20
Survival of entries by Type of Legal Organisation,
June 2010–June 2014
12.. . . . . . . . . . . . . . . . . . . . . . . . . . . . . . . . . .
20
Survival of businesses by Type of Legal Organisation,
June 2010–June 2014
11.. . . . . . . . . . . . . . . . . . . . . . . . . . . . . . . . . .
19Businesses by Type of Legal Organisation, June 2010–June 201410. . . . . . . .BU S I N E S S CO U N T S BY T Y P E OF LE G A L OR G A N I S A T I O N
18Survival of entries by Institutional Sector, June 2010–June 20149. . . . . . . . .18Survival of businesses by Institutional Sector, June 2010–June 20148. . . . . .17Businesses by Institutional Sector, June 2010–June 20147. . . . . . . . . . . . .
BU S I N E S S CO U N T S BY IN S T I T U T I O N A L SE C T O R
16Survival of entries by Main State, June 2010–June 20146. . . . . . . . . . . . . .16Survival of businesses by Main State, June 2010–June 20145. . . . . . . . . . . .15Businesses by Main State, June 2010–June 20144. . . . . . . . . . . . . . . . . .
BU S I N E S S CO U N T S BY MA I N ST A T E
14Survival of entries by Industry Division, June 2010–June 20143. . . . . . . . . .13Survival of businesses by Industry Division, June 2010–June 20142. . . . . . .11Businesses by Industry Division, June 2010–June 20141. . . . . . . . . . . . . .
BU S I N E S S CO U N T S BY IN D U S T R Y D I V I S I O N
page
10 A B S • C O U N T S OF A U S T R A L I A N B U S I N E S S E S , I N C L U D I N G E N T R I E S A N D E X I T S • 8 1 6 5 . 0 • J U N 2 0 1 0 T O J U N 2 0 1 4
L I S T O F T A B L E S
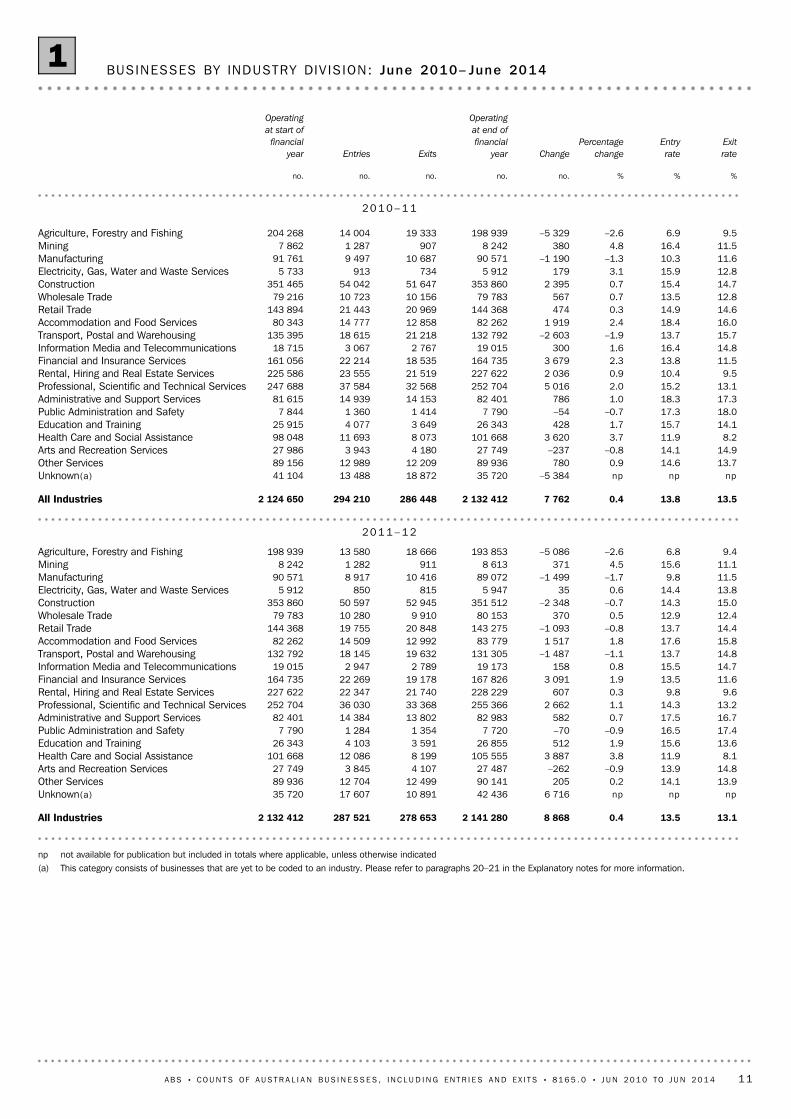
np not available for publication but included in totals where applicable, unless otherwise indicated(a) This category consists of businesses that are yet to be coded to an industry. Please refer to paragraphs 20–21 in the Explanatory notes for more information.
13.113.50.48 8682 141 280278 653287 5212 132 412All Industries
npnpnp6 71642 43610 89117 60735 720Unknown(a)13.914.10.220590 14112 49912 70489 936Other Services14.813.9–0.9–26227 4874 1073 84527 749Arts and Recreation Services
8.111.93.83 887105 5558 19912 086101 668Health Care and Social Assistance13.615.61.951226 8553 5914 10326 343Education and Training17.416.5–0.9–707 7201 3541 2847 790Public Administration and Safety16.717.50.758282 98313 80214 38482 401Administrative and Support Services13.214.31.12 662255 36633 36836 030252 704Professional, Scientific and Technical Services
9.69.80.3607228 22921 74022 347227 622Rental, Hiring and Real Estate Services11.613.51.93 091167 82619 17822 269164 735Financial and Insurance Services14.715.50.815819 1732 7892 94719 015Information Media and Telecommunications14.813.7–1.1–1 487131 30519 63218 145132 792Transport, Postal and Warehousing15.817.61.81 51783 77912 99214 50982 262Accommodation and Food Services14.413.7–0.8–1 093143 27520 84819 755144 368Retail Trade12.412.90.537080 1539 91010 28079 783Wholesale Trade15.014.3–0.7–2 348351 51252 94550 597353 860Construction13.814.40.6355 9478158505 912Electricity, Gas, Water and Waste Services11.59.8–1.7–1 49989 07210 4168 91790 571Manufacturing11.115.64.53718 6139111 2828 242Mining
9.46.8–2.6–5 086193 85318 66613 580198 939Agriculture, Forestry and Fishing
20 1 1 – 1 2
13.513.80.47 7622 132 412286 448294 2102 124 650All Industries
npnpnp–5 38435 72018 87213 48841 104Unknown(a)13.714.60.978089 93612 20912 98989 156Other Services14.914.1–0.8–23727 7494 1803 94327 986Arts and Recreation Services
8.211.93.73 620101 6688 07311 69398 048Health Care and Social Assistance14.115.71.742826 3433 6494 07725 915Education and Training18.017.3–0.7–547 7901 4141 3607 844Public Administration and Safety17.318.31.078682 40114 15314 93981 615Administrative and Support Services13.115.22.05 016252 70432 56837 584247 688Professional, Scientific and Technical Services
9.510.40.92 036227 62221 51923 555225 586Rental, Hiring and Real Estate Services11.513.82.33 679164 73518 53522 214161 056Financial and Insurance Services14.816.41.630019 0152 7673 06718 715Information Media and Telecommunications15.713.7–1.9–2 603132 79221 21818 615135 395Transport, Postal and Warehousing16.018.42.41 91982 26212 85814 77780 343Accommodation and Food Services14.614.90.3474144 36820 96921 443143 894Retail Trade12.813.50.756779 78310 15610 72379 216Wholesale Trade14.715.40.72 395353 86051 64754 042351 465Construction12.815.93.11795 9127349135 733Electricity, Gas, Water and Waste Services11.610.3–1.3–1 19090 57110 6879 49791 761Manufacturing11.516.44.83808 2429071 2877 862Mining
9.56.9–2.6–5 329198 93919 33314 004204 268Agriculture, Forestry and Fishing
20 1 0 – 1 1
%%%no.no.no.no.no.
Exit
rate
Entry
rate
Percentage
changeChange
Operating
at end of
financial
yearExitsEntries
Operating
at start of
financial
year
BUSINESSES BY INDUSTRY DIV IS ION: June 2010– June 20141
A B S • C O U N T S OF A U S T R A L I A N B U S I N E S S E S , I N C L U D I N G E N T R I E S A N D E X I T S • 8 1 6 5 . 0 • J U N 2 0 1 0 T O J U N 2 0 1 4 11

12.713.71.020 4962 100 162263 657284 1532 079 666All Industries(b)
npnpnp–2 58844 09918 24315 65546 687Unknown(a)12.813.71.083487 88711 13111 96587 053Other Services13.814.00.24126 1333 6013 64226 092Arts and Recreation Services
7.713.05.35 695113 2378 23413 929107 542Health Care and Social Assistance12.715.12.462826 4013 2633 89125 773Education and Training15.915.6–0.3–227 3301 1691 1477 352Public Administration and Safety15.816.30.646278 89212 35612 81878 430Administrative and Support Services13.014.31.43 353250 55432 04935 402247 201Professional, Scientific and Technical Services
8.410.31.94 261229 27718 97623 237225 016Rental, Hiring and Real Estate Services9.713.23.55 939174 68516 38522 324168 746Financial and Insurance Services
14.717.62.954419 0832 7173 26118 539Information Media and Telecommunications13.614.30.7846126 55417 08017 926125 708Transport, Postal and Warehousing14.919.14.23 40485 25712 21115 61581 853Accommodation and Food Services13.813.0–0.8–1 128134 46918 76517 637135 597Retail Trade11.912.00.212376 3499 0439 16676 226Wholesale Trade14.315.10.92 896338 22547 79350 689335 329Construction12.515.42.91695 9197178865 750Electricity, Gas, Water and Waste Services11.39.9–1.4–1 15983 7979 5768 41784 956Manufacturing10.710.5–0.2–148 2638858718 277Mining10.48.4–2.0–3 788183 75119 46315 675187 539Agriculture, Forestry and Fishing(b)
20 1 3 – 1 4
14.011.2–2.9–61 6142 079 666300 843239 2292 141 280All Industries
npnpnp4 25146 68715 84320 09442 436Unknown(a)14.811.3–3.4–3 08887 05313 30010 21290 141Other Services16.611.5–5.1–1 39526 0924 5593 16427 487Arts and Recreation Services
8.610.51.91 987107 5429 09611 083105 555Health Care and Social Assistance15.311.3–4.0–1 08225 7734 1053 02326 855Education and Training18.213.5–4.8–3687 3521 4081 0407 720Public Administration and Safety18.613.1–5.5–4 55378 43015 43210 87982 983Administrative and Support Services14.511.3–3.2–8 165247 20137 09028 925255 366Professional, Scientific and Technical Services
9.48.0–1.4–3 213225 01621 52018 307228 229Rental, Hiring and Real Estate Services11.111.70.5920168 74618 66119 581167 826Financial and Insurance Services16.713.4–3.3–63418 5393 1952 56119 173Information Media and Telecommunications15.611.3–4.3–5 597125 70820 50014 903131 305Transport, Postal and Warehousing17.114.8–2.3–1 92681 85314 32812 40283 779Accommodation and Food Services15.710.3–5.4–7 678135 59722 42914 751143 275Retail Trade14.09.1–4.9–3 92776 22611 2017 27480 153Wholesale Trade16.511.9–4.6–16 183335 32957 88741 704351 512Construction14.210.9–3.3–1975 7508466495 947Electricity, Gas, Water and Waste Services12.57.9–4.6–4 11684 95611 1687 05289 072Manufacturing12.38.4–3.9–3368 2771 0617258 613Mining
8.95.6–3.3–6 314187 53917 21410 900193 853Agriculture, Forestry and Fishing
20 1 2 – 1 3
%%%no.no.no.no.no.
Exit
rate
Entry
rate
Percentage
changeChange
Operating
at end of
financial
yearExitsEntries
Operating
at start of
financial
year
BUSINESSES BY INDUSTRY DIV IS ION: June 2010– June 2014 co n t i n u e d1
12 A B S • C O U N T S OF A U S T R A L I A N B U S I N E S S E S , I N C L U D I N G E N T R I E S A N D E X I T S • 8 1 6 5 . 0 • J U N 2 0 1 0 T O J U N 2 0 1 4
np not available for publication but included in totals where applicable, unless otherwise indicated(a) This category consists of businesses that are yet to be coded to an industry. Please refer to paragraphs 20–21 in the Explanatory notes for more information. (b) Changes to the statistical population maintained by the ABS in May 2014 have impacted upon the business entry and exit rates for the 2013-14 financial year (see
explanatory note 30 for more information).

np not available for publication but included in totals where applicable, unless otherwise indicated(a) This category consists of businesses that are yet to be coded to an industry. Please refer to paragraphs 20–21 in the Explanatory Notes for more information.
61.71 310 27468.31 452 11376.71 630 55786.51 838 2022 124 650All Industries
np9 833np12 501np16 554np22 23241 104Currently Unknown(a)60.153 59166.959 65675.867 61486.376 94789 156Other Services56.315 77063.517 76173.720 63385.123 80627 986Arts and Recreation Services74.673 17079.477 89985.383 58991.889 97598 048Health Care and Social Assistance60.115 57966.717 29175.819 63985.922 26625 915Education and Training53.34 18160.24 72370.15 50282.06 4307 844Public Administration and Safety53.543 62460.849 65370.957 85982.767 46281 615Administrative and Support Services60.8150 49767.8167 82576.8190 11686.9215 120247 688Professional, Scientific and Technical Services71.7161 75176.9173 52783.1187 39690.5204 067225 586Rental, Hiring and Real Estate Services66.1106 38371.9115 82679.3127 75088.5142 521161 056Financial and Insurance Services56.410 56364.111 98774.113 87185.215 94818 715Information Media and Telecommunications57.677 96164.587 36473.699 58584.3114 177135 395Transport, Postal and Warehousing54.243 54061.749 54872.057 88584.067 48580 343Accommodation and Food Services57.482 63664.993 36874.4107 11085.4122 925143 894Retail Trade62.749 70869.254 79777.861 63287.269 06079 216Wholesale Trade57.3201 29364.6227 02074.3261 06085.3299 818351 465Construction61.63 53068.93 94977.74 45287.24 9995 733Electricity, Gas, Water and Waste Services64.759 35171.365 38879.472 87288.481 07491 761Manufacturing66.75 24172.65 70780.26 30388.56 9557 862Mining69.6142 07276.5156 32382.8169 13590.5184 935204 268Agriculture, Forestry and Fishing
%no.%no.%no.%no.no.
Survival
rate
Survived to
June 2014
Survival
rate
Survived to
June 2013
Survival
rate
Survived to
June 2012
Survival
rate
Survived to
June 2011
Operating in
June 2010
SURVIVAL OF BUSINESSES BY INDUSTRY DIV IS ION: June 2010– June 20142
A B S • C O U N T S OF A U S T R A L I A N B U S I N E S S E S , I N C L U D I N G E N T R I E S A N D E X I T S • 8 1 6 5 . 0 • J U N 2 0 1 0 T O J U N 2 0 1 4 13

(a) This category consists of businesses that are yet to becoded to an industry. Please refer to paragraphs 20–21 inthe Explanatory Notes for more information.
np not available for publication but included in totals whereapplicable, unless otherwise indicated
50.0147 01859.3174 59475.9223 202294 210All Industries
np4 429np5 731np8 27513 488Currently Unknown(a)48.66 31058.57 59775.69 82312 989Other Services47.91 88758.12 29276.33 0093 943Arts and Recreation Services64.97 58872.48 46184.59 88011 693Health Care and Social Assistance47.81 94857.62 35076.43 1134 077Education and Training40.254750.168268.79341 360Public Administration and Safety41.66 21852.07 76371.910 74014 939Administrative and Support Services50.218 84960.422 69777.729 22037 584Professional, Scientific and Technical Services59.113 91765.915 52578.518 48623 555Rental, Hiring and Real Estate Services61.213 60368.515 21780.217 80722 214Financial and Insurance Services46.31 42158.31 78776.82 3553 067Information Media and Telecommunications46.08 55655.310 30072.913 57518 615Transport, Postal and Warehousing48.77 19959.68 80177.011 38514 777Accommodation and Food Services48.210 34559.012 66276.516 41021 443Retail Trade49.85 33759.36 36376.98 24110 723Wholesale Trade45.724 69255.429 95973.739 85554 042Construction45.841854.349670.6645913Electricity, Gas, Water and Waste Services50.34 77759.95 69076.77 2839 497Manufacturing57.373865.083779.91 0281 287Mining58.88 23967.09 38479.511 13814 004Agriculture, Forestry and Fishing
%no.%no.%no.no.
Survival
rate
Survived
to June
2014
Survival
rate
Survived
to June
2013
Survival
rate
Survived
to June
2012
Entries in
2010–11
SURVIVAL OF ENTRIES BY INDUSTRY DIV IS ION: June 2010– June 20143
14 A B S • C O U N T S OF A U S T R A L I A N B U S I N E S S E S , I N C L U D I N G E N T R I E S A N D E X I T S • 8 1 6 5 . 0 • J U N 2 0 1 0 T O J U N 2 0 1 4

(b) This category consists of businesses that are yet to be coded to a mainstate of operation. Please refer to paragraphs 20–21 in the ExplanatoryNotes for more information.
— nil or rounded to zero (including null cells)np not available for publication but included in totals where applicable,
unless otherwise indicated(a) Please refer to paragraphs 47–48 in the Explanatory Notes for more
information regarding businesses and their main state of operation.
12.713.71.020 4962 100 162263 657284 1532 079 666Australia
npnpnp31 3861921951 383Currently Unknown(b)13.714.91.229325 4873 4563 74925 194Australian Capital Territory14.414.60.23014 2892 0492 07914 259Northern Territory11.410.2–1.2–45937 0434 2923 83337 502Tasmania12.814.11.42 929218 80227 54930 478215 873Western Australia11.411.4—–14143 58516 36016 346143 599South Australia13.413.90.52 032416 69755 72757 759414 665Queensland12.313.71.37 160545 94866 41173 571538 788Victoria12.714.01.28 522696 92587 62196 143688 403New South Wales
20 1 3 – 1 4
14.011.2–2.9–61 6142 079 666300 843239 2292 141 280Australia
npnpnp–401 3832311911 423Currently Unknown(b)15.212.3–3.0–77225 1943 9573 18525 966Australian Capital Territory15.112.9–2.3–33114 2592 2091 87814 590Northern Territory12.09.1–2.9–1 13437 5024 6393 50538 636Tasmania14.111.4–2.7–6 005215 87331 30325 298221 878Western Australia12.59.3–3.2–4 730143 59918 54813 818148 329South Australia14.811.5–3.3–14 229414 66563 68149 452428 894Queensland13.611.4–2.2–12 330538 78875 14462 814551 118Victoria14.211.1–3.1–22 043688 403101 13179 088710 446New South Wales
20 1 2 – 1 3
13.113.50.48 8682 141 280278 653287 5212 132 412Australia
npnpnp1231 4232253481 300Currently Unknown(b)14.115.61.539025 9663 6093 99925 576Australian Capital Territory13.915.21.318114 5902 0072 18814 409Northern Territory11.110.6–0.5–19738 6364 3184 12138 833Tasmania13.913.6–0.3–724221 87830 98630 262222 602Western Australia11.511.5—–8148 32917 09017 082148 337South Australia14.013.5–0.5–1 956428 89460 11558 159430 850Queensland12.614.01.37 299551 11868 61675 915543 819Victoria13.013.50.53 760710 44691 68795 447706 686New South Wales
20 1 1 – 1 2
13.513.80.47 7622 132 412286 448294 2102 124 650Australia
npnpnp371 3002913281 263Currently Unknown(b)14.716.11.436425 5763 7074 07125 212Australian Capital Territory14.315.71.521014 4092 0262 23614 199Northern Territory11.611.2–0.4–15638 8334 5284 37238 989Tasmania13.514.30.81 717222 60229 85031 567220 885Western Australia12.111.9–0.2–331148 33718 06217 731148 668South Australia14.313.7–0.6–2 559430 85061 78959 230433 409Queensland13.114.41.26 557543 81970 54877 105537 262Victoria13.613.80.31 923706 68695 64797 570704 763New South Wales
20 1 0 – 1 1
%%%no.no.no.no.no.
Exit
rate
Entry
rate
Percentage
changeChange
Operating
at end of
financial
yearExitsEntries
Operating
at start of
financial
year
BUSINESSES BY MAIN STATE (a) : June 2010– June 20144
A B S • C O U N T S OF A U S T R A L I A N B U S I N E S S E S , I N C L U D I N G E N T R I E S A N D E X I T S • 8 1 6 5 . 0 • J U N 2 0 1 0 T O J U N 2 0 1 4 15

np not available for publication but included in totals where applicable, unless otherwise indicated(a) Please refer to paragraphs 47–48 in the Explanatory Notes for more information regarding businesses and their main state of operation.(b) This category consists of businesses that are yet to be coded to a main state of operation. Please refer to paragraphs 20–21 in the Explanatory
Notes for more information.
61.71 310 27468.31 452 11376.71 630 55786.51 838 2022 124 650Australia
np630np709np818np9721 263Currently Unknown(b)58.914 84365.916 61475.018 91985.321 50525 212Australian Capital Territory59.98 50666.99 50275.610 73985.712 17314 199Northern Territory65.025 35671.727 94079.631 04788.434 46138 989Tasmania60.9134 53767.5149 16075.9167 62286.5191 035220 885Western Australia64.796 23471.1105 70779.0117 41487.9130 606148 668South Australia59.4257 53566.4287 95375.3326 45485.7371 620433 409Queensland62.9337 70669.3372 37477.4415 96286.9466 714537 262Victoria61.7434 92768.4482 15476.8541 58286.4609 116704 763New South Wales
%no.%no.%no.%no.no.
Survival
rate
Survived to
June 2014
Survival
rate
Survived to
June 2013
Survival
rate
Survived to
June 2012
Survival
rate
Survived to
June 2011
Operating in
June 2010
SURVIVAL OF BUSINESSES BY MAIN STATE (a) : June 2010– June 20145
np not available for publication but included in totals where applicable, unless otherwise indicated(a) Please refer to paragraphs 47–48 in the Explanatory Notes for more information regarding businesses and their
main state of operation.(b) This category consists of businesses that are yet to be coded to a main state of operation. Please refer to
paragraphs 20–21 of the Explanatory Notes for more information.
50.0147 01859.3174 59475.9223 202294 210Australia
np188np216np257328Currently Unknown(b)48.81 98858.22 36974.93 0484 071Australian Capital Territory45.71 02255.91 25174.41 6632 236Northern Territory56.32 46065.22 85179.33 4684 372Tasmania50.115 83059.418 74076.023 99431 567Western Australia53.09 39262.311 03878.013 83317 731South Australia48.728 82558.034 38374.844 28159 230Queensland51.139 38960.646 72876.859 24177 105Victoria49.147 92458.457 01875.273 41797 570New South Wales
%no.%no.%no.no.
Survival
rate
Survived to
June 2014
Survival
rate
June 2013
Survival Survived torate
Survived to
June 2012
Entries in
2010–11
SURVIVAL OF ENTRIES BY MAIN STATE (a) : June 2010– June 20146
16 A B S • C O U N T S OF A U S T R A L I A N B U S I N E S S E S , I N C L U D I N G E N T R I E S A N D E X I T S • 8 1 6 5 . 0 • J U N 2 0 1 0 T O J U N 2 0 1 4

(a) This category consists of businesses that are yet to be coded to aninstitutional sector. Please refer to paragraphs 20–21 in the ExplanatoryNotes for more information.
np not available for publication but included in totals where applicable, unlessotherwise indicated
12.713.71.020 4962 100 162263 657284 1532 079 666All Sectors
npnpnp–2 58944 09718 24415 65546 686Currently Unknown(a)13.112.5–0.6–6 9961 197 978157 782150 7861 204 974Households
9.513.33.86 330171 29915 63621 966164 969Financial Corporations10.914.43.623 751686 78871 99595 746663 037Non–Financial Corporations
20 1 3 – 1 4
14.011.2–2.9–61 6142 079 666300 843239 2292 141 280All Sectors
npnpnp4 25346 68615 84120 09442 433Currently Unknown(a)14.69.8–4.8–60 7321 204 974184 589123 8571 265 706Households10.911.80.91 533164 96917 74919 282163 436Financial Corporations12.311.3–1.0–6 668663 03782 66475 996669 705Non–Financial Corporations
20 1 2 – 1 3
13.113.50.48 8682 141 280278 653287 5212 132 412All Sectors
npnpnp6 71742 43310 89017 60735 716Currently Unknown(a)14.112.3–1.8–22 6681 265 706181 396158 7281 288 374Households11.313.62.33 672163 43618 11121 783159 764Financial Corporations10.513.83.321 147669 70568 25689 403648 558Non–Financial Corporations
20 1 1 – 1 2
13.513.80.47 7622 132 412286 448294 2102 124 650All Sectors
npnpnp–5 38435 71618 87213 48841 100Currently Unknown(a)13.913.5–0.4–4 8971 288 374180 114175 2171 293 271Households11.213.92.74 137159 76417 48721 624155 627Financial Corporations11.013.22.213 906648 55869 97583 881634 652Non–Financial Corporations
20 1 0 – 1 1
%%%no.no.no.no.no.
Exit
rate
Entry
rate
Percentage
changeChange
Operating
at end of
financial
yearExitsEntries
Operating
at start of
financial
year
BUSINESSES BY INST ITUT IONAL SECTOR: June 2010– June 20147
A B S • C O U N T S OF A U S T R A L I A N B U S I N E S S E S , I N C L U D I N G E N T R I E S A N D E X I T S • 8 1 6 5 . 0 • J U N 2 0 1 0 T O J U N 2 0 1 4 17

(a) This category consists of businesses that are yet to be coded to aninstitutional sector. Please refer to paragraphs 20–21 in theExplanatory Notes for more information.
np not available for publication but included in totals where applicable,unless otherwise indicated
61.71 310 27468.31 452 11376.71 630 55786.51 838 2022 124 650All Sectors
np9 831np12 499np16 551np22 22841 100Currently Unknown(a)59.8772 77966.8863 84775.5976 10386.11 113 1571 293 271Households66.8103 97572.6112 92579.8124 21188.8138 140155 627Financial Corporations66.8423 68972.9462 84280.9513 69289.0564 677634 652Non–Financial Corporations
%no.%no.%no.%no.no.
Survival
rate
Survived to
June 2014
Survival
rate
Survived to
June 2013
Survival
rate
Survived to
June 2012
Survival
rate
Survived to
June 2011
Operating in
June 2010
SURVIVAL OF BUSINESSES BY INST ITUT IONAL SECTOR: June 2010– June 20148
np not available for publication but included in totals where applicable, unless otherwise indicated(a) This category consists of businesses that are yet to be coded to an institutional sector. Please refer to paragraphs
20–21 in the Explanatory Notes for more information.
50.0147 01859.3174 59475.9223 202294 210All Sectors
np4 429np5 731np8 27513 488Currently Unknown(a)47.683 41757.4100 51774.7130 875175 217Households62.013 41269.214 95380.717 44221 624Financial Corporations54.645 76063.753 39379.466 61083 881Non–Financial Corporations
%no.%no.%no.no.
Survival
rate
Survived to
June 2014
Survival
rate
Survived to
June 2013
Survival
rate
Survived to
June 2012
Entries in
2010–11
SURVIVAL OF ENTRIES BY INST ITUT IONAL SECTOR: June 2010– June 20149
18 A B S • C O U N T S OF A U S T R A L I A N B U S I N E S S E S , I N C L U D I N G E N T R I E S A N D E X I T S • 8 1 6 5 . 0 • J U N 2 0 1 0 T O J U N 2 0 1 4
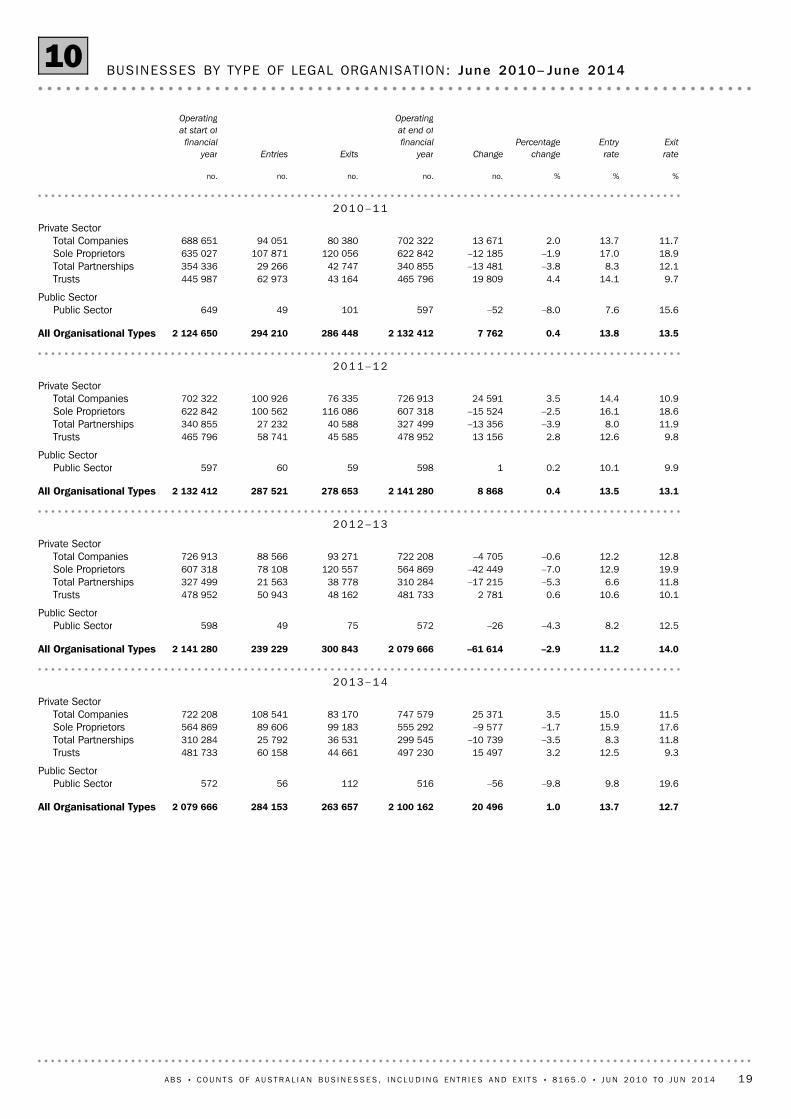
12.713.71.020 4962 100 162263 657284 1532 079 666All Organisational Types
19.69.8–9.8–5651611256572Public SectorPublic Sector
9.312.53.215 497497 23044 66160 158481 733Trusts11.88.3–3.5–10 739299 54536 53125 792310 284Total Partnerships17.615.9–1.7–9 577555 29299 18389 606564 869Sole Proprietors11.515.03.525 371747 57983 170108 541722 208Total Companies
Private Sector
20 1 3 – 1 4
14.011.2–2.9–61 6142 079 666300 843239 2292 141 280All Organisational Types
12.58.2–4.3–265727549598Public SectorPublic Sector
10.110.60.62 781481 73348 16250 943478 952Trusts11.86.6–5.3–17 215310 28438 77821 563327 499Total Partnerships19.912.9–7.0–42 449564 869120 55778 108607 318Sole Proprietors12.812.2–0.6–4 705722 20893 27188 566726 913Total Companies
Private Sector
20 1 2 – 1 3
13.113.50.48 8682 141 280278 653287 5212 132 412All Organisational Types
9.910.10.215985960597Public SectorPublic Sector
9.812.62.813 156478 95245 58558 741465 796Trusts11.98.0–3.9–13 356327 49940 58827 232340 855Total Partnerships18.616.1–2.5–15 524607 318116 086100 562622 842Sole Proprietors10.914.43.524 591726 91376 335100 926702 322Total Companies
Private Sector
20 1 1 – 1 2
13.513.80.47 7622 132 412286 448294 2102 124 650All Organisational Types
15.67.6–8.0–5259710149649Public SectorPublic Sector
9.714.14.419 809465 79643 16462 973445 987Trusts12.18.3–3.8–13 481340 85542 74729 266354 336Total Partnerships18.917.0–1.9–12 185622 842120 056107 871635 027Sole Proprietors11.713.72.013 671702 32280 38094 051688 651Total Companies
Private Sector
20 1 0 – 1 1
%%%no.no.no.no.no.
Exit
rate
Entry
rate
Percentage
changeChange
Operating
at end of
financial
yearExitsEntries
Operating
at start of
financial
year
BUSINESSES BY TYPE OF LEGAL ORGANISAT ION: June 2010– June 201410
A B S • C O U N T S OF A U S T R A L I A N B U S I N E S S E S , I N C L U D I N G E N T R I E S A N D E X I T S • 8 1 6 5 . 0 • J U N 2 0 1 0 T O J U N 2 0 1 4 19

61.71 310 27468.31 452 11376.71 630 55786.51 838 2022 124 650All Organisational Types
58.938270.946077.050084.4548649Public SectorPublic Sector
70.2313 00375.9338 29282.6368 38290.3402 823445 987Trusts63.4224 64870.5249 73978.4277 75187.9311 589354 336Total Partnerships50.0317 78457.8366 97168.0431 82981.1514 971635 027Sole Proprietors66.0454 45772.1496 65180.2552 09588.3608 271688 651Total Companies
Private Sector
%no.%no.%no.%no.no.
Survival
rate
Survived to
June 2014
Survival
rate
Survived to
June 2013
Survival
rate
Survived to
June 2012
Survival
rate
Survived to
June 2011
Operating in
June 2010
SURVIVAL OF BUSINESSES BY TYPE OF LEGAL ORGANISAT ION: June 2010– June 201411
50.0147 01859.3174 59475.9223 202294 210All Organisational Types
61.23067.33377.63849Public SectorPublic Sector
63.439 93970.744 52882.351 82962 973Trusts52.115 24861.718 07176.922 51629 266Total Partnerships38.541 53549.353 14669.574 927107 871Sole Proprietors53.450 26662.558 81678.673 89294 051Total Companies
Private Sector
%no.%no.%no.no.
Survival
rate
Survived to
June 2014
Survival
rate
Survived to
June 2013
Survival
rate
Survived to
June 2012
Entries in
2010–11
SURVIVAL OF ENTRIES BY TYPE OF LEGAL ORGANISAT ION: June 2010– June 201412
20 A B S • C O U N T S OF A U S T R A L I A N B U S I N E S S E S , I N C L U D I N G E N T R I E S A N D E X I T S • 8 1 6 5 . 0 • J U N 2 0 1 0 T O J U N 2 0 1 4
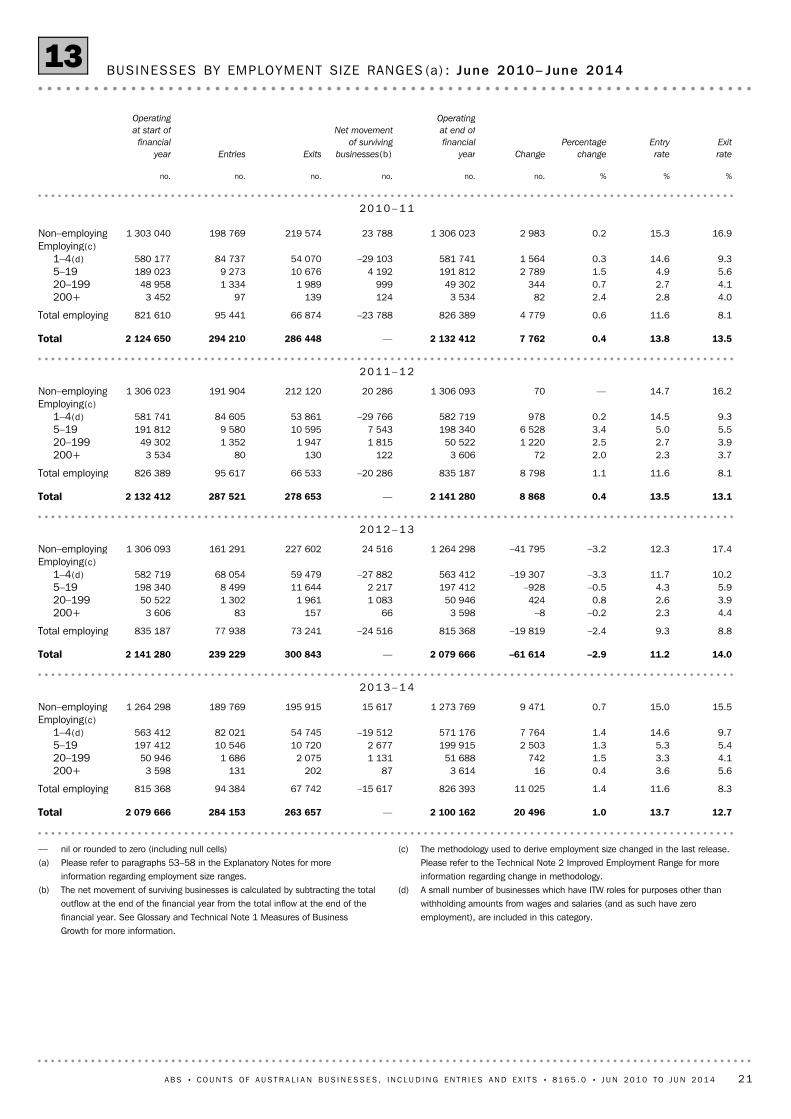
(c) The methodology used to derive employment size changed in the last release.Please refer to the Technical Note 2 Improved Employment Range for moreinformation regarding change in methodology.
(d) A small number of businesses which have ITW roles for purposes other thanwithholding amounts from wages and salaries (and as such have zeroemployment), are included in this category.
— nil or rounded to zero (including null cells)(a) Please refer to paragraphs 53–58 in the Explanatory Notes for more
information regarding employment size ranges.(b) The net movement of surviving businesses is calculated by subtracting the total
outflow at the end of the financial year from the total inflow at the end of thefinancial year. See Glossary and Technical Note 1 Measures of BusinessGrowth for more information.
12.713.71.020 4962 100 162—263 657284 1532 079 666Total
8.311.61.411 025826 393–15 61767 74294 384815 368Total employing
5.63.60.4163 614872021313 598200+4.13.31.574251 6881 1312 0751 68650 94620–1995.45.31.32 503199 9152 67710 72010 546197 4125–199.714.61.47 764571 176–19 51254 74582 021563 4121–4(d)
Employing(c)15.515.00.79 4711 273 76915 617195 915189 7691 264 298Non–employing
20 1 3 – 1 4
14.011.2–2.9–61 6142 079 666—300 843239 2292 141 280Total
8.89.3–2.4–19 819815 368–24 51673 24177 938835 187Total employing
4.42.3–0.2–83 59866157833 606200+3.92.60.842450 9461 0831 9611 30250 52220–1995.94.3–0.5–928197 4122 21711 6448 499198 3405–19
10.211.7–3.3–19 307563 412–27 88259 47968 054582 7191–4(d)Employing(c)
17.412.3–3.2–41 7951 264 29824 516227 602161 2911 306 093Non–employing
20 1 2 – 1 3
13.113.50.48 8682 141 280—278 653287 5212 132 412Total
8.111.61.18 798835 187–20 28666 53395 617826 389Total employing
3.72.32.0723 606122130803 534200+3.92.72.51 22050 5221 8151 9471 35249 30220–1995.55.03.46 528198 3407 54310 5959 580191 8125–199.314.50.2978582 719–29 76653 86184 605581 7411–4(d)
Employing(c)16.214.7—701 306 09320 286212 120191 9041 306 023Non–employing
20 1 1 – 1 2
13.513.80.47 7622 132 412—286 448294 2102 124 650Total
8.111.60.64 779826 389–23 78866 87495 441821 610Total employing
4.02.82.4823 534124139973 452200+4.12.70.734449 3029991 9891 33448 95820–1995.64.91.52 789191 8124 19210 6769 273189 0235–199.314.60.31 564581 741–29 10354 07084 737580 1771–4(d)
Employing(c)16.915.30.22 9831 306 02323 788219 574198 7691 303 040Non–employing
20 1 0 – 1 1
%%%no.no.no.no.no.no.
Exit
rate
Entry
rate
Percentage
changeChange
Operating
at end of
financial
year
Net movement
of surviving
businesses(b)ExitsEntries
Operating
at start of
financial
year
BUSINESSES BY EMPLOYMENT SIZE RANGES (a) : June 2010– June 201413
A B S • C O U N T S OF A U S T R A L I A N B U S I N E S S E S , I N C L U D I N G E N T R I E S A N D E X I T S • 8 1 6 5 . 0 • J U N 2 0 1 0 T O J U N 2 0 1 4 21

(c) A small number of businesses which have ITW roles for purposes other thanwithholding amounts from wages and salaries (and as such have zeroemployment), are included in this category.
(d) The methodology used to derive employment size changed in the last release.Please refer to the Technical Note 2 Improved Employment Range for moreinformation regarding change in methodology.
— nil or rounded to zero (including null cells)(a) Please refer to paragraphs 53–58 in the Explanatory Notes for more
information regarding employment size ranges.(b) The net movement of surviving businesses is calculated by subtracting the
total outflow at the end of the financial year from the total inflow at the endof the financial year. See Glossary and Technical Note 1 Measures ofBusiness Growth for more information.
—174 052174 0523 48350 002189 369489 1551 084 000Total
872873743 10923462819200+1 1318 2169 34732840 6555 6008171 47120–1992 67737 14539 822147 545149 54723 5106 0765–19
–19 51285 06565 553251 31632 334423 60251 3901–4(c)Employing
15 61743 33958 95672521 88241 1981 025 044Non–employing(Employment Size Ranges)(d)
BUSINESS SIZE CATEGORY AT JUNE 2013
CH A N G E D BU S I N E S S S I Z E CA T E G O R Y AT JU N E 20 1 4
—177 853177 8533 51549 644188 913495 3581 103 007Total
662613273 188204133113200+1 0837 9068 98928440 6555 2938681 46120–1992 21737 65639 873127 540149 04023 4106 6945–19
–27 88291 17263 290271 02232 917432 06857 2061–4(c)Employing
24 51640 85865 37442231 65038 9811 037 633Non–employing(Employment Size Ranges)(d)
BUSINESS SIZE CATEGORY AT JUNE 2012
CH A N G E D BU S I N E S S S I Z E CA T E G O R Y AT JU N E 20 1 3
—177 530177 5303 52649 170188 760498 1141 114 189Total
1222663883 138220101521200+1 8157 8349 64936139 5215 1279961 35020–1997 54335 64843 191117 965145 56921 4026 2705–19
–29 76691 98162 215141 24236 279435 89954 4461–4(c)Employing
20 28641 80162 08722221 77539 8021 052 102Non–employing(Employment Size Ranges)(d)
BUSINESS SIZE CATEGORY AT JUNE 2011
CH A N G E D BU S I N E S S S I Z E CA T E G O R Y AT JU N E 20 1 2
—180 695180 6953 43747 968182 539497 0041 107 254Total
1243064303 00724573321200+9998 4249 42334238 5455 6611 0751 34620–199
4 19238 34942 541257 657139 99824 2456 4225–19–29 10393 12164 018581 28335 286432 98656 4941–4(c)
Employing23 78840 49564 28352381 58738 6651 042 971Non–employing
(Employment Size Ranges)(d)
BUSINESS SIZE CATEGORY AT JUNE 2010
CH A N G E D BU S I N E S S S I Z E CA T E G O R Y AT JU N E 20 1 1
no.no.no.no.no.no.no.no.
200+20–1995–191–4(c)Non–employing
Net movement
of surviving
businesses(b)
Outflow
at end of
financial
year
Inflow at
end of
financial
year
CHANGED BUSINESS SIZE CATEGORY(EMPLOYMENT SIZE RANGES)
CHANGE IN BUSINESS SIZE OVER TIME FOR SURVIV ING BUSINESSES (a) : June 2010– June
201414
22 A B S • C O U N T S OF A U S T R A L I A N B U S I N E S S E S , I N C L U D I N G E N T R I E S A N D E X I T S • 8 1 6 5 . 0 • J U N 2 0 1 0 T O J U N 2 0 1 4

(a) Please refer to paragraphs 53–58 in the Explanatory Notes for more information regarding employment size ranges.(b) The methodology used to derive employment size changed in the last release. Please refer to the Technical Note 2 Improved
Employment Range for more information regarding change in methodology.(c) A small number of businesses which have ITW roles for purporses other than withholding amounts from wages and salaries (and as
such have zero emploment), are included in this category.
61.71 310 27468.31 452 11376.71 630 55786.51 838 2022 124 650Total
70.9582 30877.2634 43084.9697 85591.9754 736821 610Total employing
83.72 88888.43 05092.53 19396.03 3133 452200+81.439 87686.542 34791.544 78695.946 96948 95820–19976.9145 27382.4155 80288.8167 76494.4178 347189 0235–1968.0394 27174.7433 23183.1482 11290.7526 107580 1771–4(c)
Employing55.9727 96662.8817 68371.6932 70283.11 083 4661 303 040Non-employing(b)
%no.%no.%no.%no.no.
Survival
rate
Survived to
June 2014
Survival
rate
Survived to
June 2013
Survival
rate
Survived to
June 2012
Survival
rate
Survived to
June 2011
Operating in
June 2010
SURVIVAL OF BUSINESSES BY EMPLOYMENT SIZE RANGES (a) : June 2010– June 201415
(a) Please refer to paragraphs 53–58 in the Explanatory Notes for more information regardingemployment size ranges.
(b) The methodology used to derive employment size changed in the last release. Please refer to theTechnical Note 2 Improved Employment Range for more information regarding change inmethodology.
(c) A small number of businesses which have ITW roles for purporses other than withholding amountsfrom wages and salaries (and as such have zero emploment), are included in this category.
50.0147 01859.3174 59475.9223 202294 210Total
59.056 26367.964 80282.578 70695 441Total employing
76.37484.58293.89197200+69.392476.81 02587.21 1631 33420–19965.46 06173.76 83185.27 8989 2735–1958.149 20467.156 86482.169 55484 7371–4(c)
Employing45.790 75555.2109 79272.7144 496198 769Non-employing(b)
%no.%no.%no.no.
Survival
rate
Survived
to June
2014
Survival
rate
Survived
to June
2013
Survival
rate
Survived
to June
2012
Entries in
2010–11
SURVIVAL OF ENTRIES BY EMPLOYMENT SIZE RANGES (a) : June 2010– June 201416
A B S • C O U N T S OF A U S T R A L I A N B U S I N E S S E S , I N C L U D I N G E N T R I E S A N D E X I T S • 8 1 6 5 . 0 • J U N 2 0 1 0 T O J U N 2 0 1 4 23

(b) The net movement of surviving businesses is calculated by subtracting the totaloutflow at the end of the financial year from the total inflow at the end of thefinancial year. See Glossary and Technical Note 1 Measures of Business Growthfor more information.
— nil or rounded to zero (including null cells)(a) Please refer to paragraphs 59–61 in the Explanatory Notes for more information
regarding annual turnover size ranges.
12.713.71.020 4962 100 162—263 657284 1532 079 666Total
4.44.21.72 271135 2782 5835 9145 602133 007$2m or more7.510.92.214 563686 713–8 26750 46373 293672 150$200k to less than $2m
13.217.30.64 560722 565–25 15694 586124 302718 005$50k to less than $200k20.314.5–0.2–898555 60630 840112 69480 956556 504Zero to less than $50k
20 1 3 – 1 4
14.011.2–2.9–61 6142 079 666—300 843239 2292 141 280Total
3.83.22.02 591133 0073 3704 9354 156130 416$2m or more8.08.8–0.1–915672 150–6 26153 74659 092673 065$200k to less than $2m
14.915.0–3.0–21 864718 005–22 419110 146110 701739 869$50k to less than $200k22.110.9–6.9–41 426556 50425 310132 01665 280597 930Zero to less than $50k
20 1 2 – 1 3
13.113.50.48 8682 141 280—278 653287 5212 132 412Total
3.93.64.25 312130 4165 6884 8824 506125 104$2m or more7.510.63.119 970673 065–12149 30869 399653 095$200k to less than $2m
13.517.30.53 644739 869–24 39599 068127 107736 225$50k to less than $200k20.314.0–3.2–20 058597 93018 828125 39586 509617 988Zero to less than $50k
20 1 1 – 1 2
13.513.80.47 7622 132 412—286 448294 2102 124 650Total
3.93.73.54 225125 1044 4744 7744 525120 879$2m or more7.810.72.516 104653 095–2 78849 50268 394636 991$200k to less than $2m
13.816.8–0.5–3 795736 225–26 151102 294124 650740 020$50k to less than $200k20.715.4–1.4–8 772617 98824 465129 87896 641626 760Zero to less than $50k
20 1 0 – 1 1
%%%no.no.no.no.no.no.
Exit
rate
Entry
rate
Percentage
changeChange
Operating
at end of
financial
year
Net movement
of surviving
businesses(b)ExitsEntries
Operating
at start of
financial
year
BUSINESSES BY ANNUAL TURNOVER SIZE RANGES (a) : June 2010– June 201417
24 A B S • C O U N T S OF A U S T R A L I A N B U S I N E S S E S , I N C L U D I N G E N T R I E S A N D E X I T S • 8 1 6 5 . 0 • J U N 2 0 1 0 T O J U N 2 0 1 4

(b) The net movement of surviving businesses is calculated by subtractingthe total outflow at the end of the financial year from the total inflow atthe end of the financial year. See Glossary and Technical Note 1Measures of Business Growth for more information.
— nil or rounded to zero (including null cells)(a) Please refer to paragraphs 59–61 in the Explanatory Notes for more
information regarding annual turnover size ranges.
—373 223373 223129 676613 420598 263474 650Total
2 58318 02620 609109 06715 0081 1721 846$2m or more–8 267109 018100 75117 878512 66971 21119 929$200k to less than $2m
–25 156165 365140 2091 35374 133458 05489 879$50k to less than $200k30 84080 814111 6541 37811 61067 826362 996Zero to less than $50k
(Annual Turnover Size Ranges)
BUSINESS SIZE CATEGORY AT JUNE 2013
CH A N G E D BU S I N E S S S I Z E CA T E G O R Y AT JU N E 20 1 4
—383 316383 316128 851613 058607 304491 224Total
3 37017 32920 699108 15214 2651 2041 860$2m or more–6 261109 951103 69018 222509 36870 36021 369$200k to less than $2m
–22 419168 218145 7991 23677 083461 50589 899$50k to less than $200k25 31087 818113 1281 24112 34274 235378 096Zero to less than $50k
(Annual Turnover Size Ranges)
BUSINESS SIZE CATEGORY AT JUNE 2012
CH A N G E D BU S I N E S S S I Z E CA T E G O R Y AT JU N E 20 1 3
—389 784389 784125 910603 666612 762511 421Total
5 68816 08421 772104 13813 0101 1591 915$2m or more–121107 724107 60319 336496 06365 90622 482$200k to less than $2m
–24 395171 492147 0971 21681 361465 66588 915$50k to less than $200k18 82894 484113 3121 22013 23280 032398 109Zero to less than $50k
(Annual Turnover Size Ranges)
BUSINESS SIZE CATEGORY AT JUNE 2011
CH A N G E D BU S I N E S S S I Z E CA T E G O R Y AT JU N E 20 1 2
—391 613391 613120 579584 701611 575521 347Total
4 47416 03420 508100 07113 1381 0601 836$2m or more–2 788106 384103 59618 042481 10566 55521 787$200k to less than $2m
–26 151174 481148 3301 19177 734463 24595 556$50k to less than $200k24 46594 714119 1791 27512 72480 715402 168Zero to less than $50k
(Annual Turnover Size Ranges)
BUSINESS SIZE CATEGORY AT JUNE 2010
CH A N G E D BU S I N E S S S I Z E CA T E G O R Y AT JU N E 20 1 1
no.no.no.no.no.no.no.
$2m
or
more
$200k to
less than
$2m
$50k to
less than
$200k
Zero to
less than
$50k
Net movement
of surviving
businesses(b)
Outflow
at end of
financial
year
Inflow at
end of
financial
year
CHANGED BUSINESS SIZE CATEGORY(ANNUAL TURNOVER SIZE RANGES)
CHANGE IN BUSINESS SIZE OVER TIME FOR SURVIV ING BUSINESSES (a) : June 2010– June
201418
A B S • C O U N T S OF A U S T R A L I A N B U S I N E S S E S , I N C L U D I N G E N T R I E S A N D E X I T S • 8 1 6 5 . 0 • J U N 2 0 1 0 T O J U N 2 0 1 4 25

(a) Please refer to paragraphs 59–61 in the Explanatory Notes for more information regarding annual turnover size ranges.
61.71 310 27468.31 452 11376.71 630 55786.51 838 2022 124 650Total
82.099 09687.0105 19791.7110 88496.1116 105120 879$2m or more72.8463 86378.7501 29185.5544 85192.2587 489636 991$200k to less than $2m60.3445 91167.2497 00575.9561 92986.2637 726740 020$50k to less than $200k48.1301 40455.6348 62065.9412 89379.3496 882626 760Zero to less than $50k
%no.%no.%no.%no.no.
Survival
rate
Survived to
June 2014
Survival
rate
Survived to
June 2013
Survival
rate
Survived to
June 2012
Survival
rate
Survived to
June 2011
Operating in
June 2010
SURVIVAL OF BUSINESSES BY ANNUAL TURNOVER SIZE RANGES (a) : June 2010– June
201419
(a) Please refer to paragraphs 59–61 in the Explanatory Notes for more information regarding annual turnover sizeranges.
50.0147 01859.3174 59475.9223 202294 210Total
68.23 08877.93 52387.03 9384 525$2m or more57.539 34365.945 08680.455 01168 394$200k to less than $2m47.759 48757.171 20074.893 178124 650$50k to less than $200k46.745 10056.754 78573.571 07596 641Zero to less than $50k
%no.%no.%no.no.
Survival
rate
Survived to
June 2014
Survival
rate
Survived to
June 2013
Survival
rate
Survived to
June 2012
Entries in
2010–11
SURVIVAL OF ENTRIES BY ANNUAL TURNOVER SIZE RANGES (a) : June 2010– June 201420
26 A B S • C O U N T S OF A U S T R A L I A N B U S I N E S S E S , I N C L U D I N G E N T R I E S A N D E X I T S • 8 1 6 5 . 0 • J U N 2 0 1 0 T O J U N 2 0 1 4

6 In mid 2002, the ABS commenced sourcing its register information from the ABR and
at that time changed its business register to a two population model. The two
populations are known as the profiled population and the non-profiled population,
formerly known as the Australian Bureau of Statistics maintained population (ABSMP)
and the ATO maintained population (ATOMP). The main distinction between businesses
in the two populations relates to the complexity of the business structure and the degree
of intervention required to reflect the business structure for statistical purposes.
7 The vast majority of businesses included on the ABSBR are in the non-profiled
population. Most of these businesses are understood to have simple structures. After
some system processes are applied to the unit registered for an ABN, the resulting
statistical unit is a good approximation satisfying ABS statistical requirements. For these
businesses, the ABS statistical units structure directly aligns with the ABN unit: one ABN
equates to one business.
ST A T I S T I C A L UN I T
1 This publication presents counts of businesses based on snapshots of actively trading
businesses as at June 2010, 2011, 2012, 2013 and 2014 from the Australian Bureau of
Statistics Business Register (ABSBR). This publication contains counts and rates of
business entries and exits from the Australian economy as well as counts and rates
pertaining to the survival of businesses.
2 The scope of Counts of Australian Businesses, including Entries and Exits (CABEE)
(cat. no. 8165.0) is significantly different to previously released, but now discontinued
ABS business counts publications. In particular, the publication only includes businesses
which actively traded in goods or services during the reference period in question,
whereas the scope of the discontinued releases focused on different populations. Refer
to the section entitled 'Scope' and 'Appendix 1 ABS Businesses Counts' for further
information.
3 The following Explanatory Notes contain further information about the collection
methods used in compiling CABEE. This includes information about the data source, the
Australian Business Register (ABR) and the Australian Taxation Office (ATO) and
processes or transformations which have been applied to the data.
4 Most businesses in Australia need to obtain an Australian Business Number (ABN).
These businesses are then included on the whole of government register of businesses,
the Australian Business Register (ABR). The results in this CABEE publication are based,
in part, on tax data supplied by the Australian Tax Office (ATO) under the Taxation
Administration Act 1953 and ABR data supplied by the Registrar under A New Tax
System (Australian Business Number) Act 1999. The Taxation Administration Act 1953
requires that such data is only used for the purpose of administering the Census and
Statistics Act 1905 and the Australian Business Number Act 1999 requires that such data
is only used for the purpose of carrying out functions of the ABS. Further information
about the two Acts can be found at <www.comlaw.gov.au>. Information about the ABR
can be obtained from the ABR website <www.abr.gov.au> or the ATO website
<www.ato.gov.au/business>. The ABS uses information from the ABR to populate its
internal register of businesses, the Australian Bureau of Statistics Business Register
(ABSBR), which is used as a source for business survey frames and business counts.
5 Legislative requirements to ensure privacy and secrecy of these data have been
followed. Only people authorised under the Australian Bureau of Statistics Act 1975
have been allowed to view data about any particular firm in conducting these analyses.
Results have been confidentialised in accordance with the Census and Statistics Act 1905,
to ensure that they are not likely to enable identification of a particular person or
organisation.
I N T R O D U C T I O N
A B S • C O U N T S OF A U S T R A L I A N B U S I N E S S E S , I N C L U D I N G E N T R I E S A N D E X I T S • 8 1 6 5 . 0 • J U N 2 0 1 0 T O J U N 2 0 1 4 27
E X P L A N A T O R Y N O T E S

11 Counts of businesses produced from the ABSBR are comprised of actively trading
businesses in the Australian economy. Actively trading businesses are:
TAUs from the profiled population (where activity is monitored by direct contact by
ABS)
ABNs from the non-profiled population which are actively remitting in respect of a
Goods and Services Tax (GST) role.
12 Limiting the scope to only businesses with a GST role means that only entities
which are actively trading in goods or services are included. Businesses which have not
submitted a Business Activity Statement (BAS) and/or have reported zero dollar amounts
over five consecutive quarters (or three consecutive years for annual remitters) are
treated as 'long term non-remitters' (LTNRs). These businesses are not considered to be
actively trading and are excluded from the counts as they are not remitting GST.
13 Units contained on the ABSBR have been allocated within the following
classifications:
Standard Institutional Sector Classification of Australia (SISCA) 2008
Type of Legal Organisation (TOLO)
Australian and New Zealand Industry Classification (ANZSIC) 2006.
14 Entities which are not considered to be actively trading in the market sector are not
considered to be businesses and, as such, are excluded from the business counts.
15 Entities classified to the following categories of SISCA are excluded:
2110 Reserve Bank of Australia
3000 General Government
5000 Not For Profit Institutions Serving Households
6000 Rest of the World.
16 Entities classified to the following TOLO categories are excluded:
12 Charitable Institution
15 Social and Sporting Clubs
16 Trade Unions and Other Associations
20 Other Unincorporated Entity
41 Diplomatic or Trade Missions
42 Other Foreign Government.
17 Entities classified to the following 4 digit ANZSIC classes are excluded:
7711 Police Services
7713 Fire Protection and Other Emergency Services
SC O P E
8 For a relatively small number of businesses, the ABN unit is not suitable for ABS
economic statistics purposes and the ABS maintains its own units structure through
direct contact with businesses. These businesses constitute the profiled population. This
population consists typically of large, complex and diverse groups of businesses. In the
profiled population, a type of activity unit (TAU) equates to one business.
9 The TAU is comprised of one or more business entities, sub entities, or branches of a
business entity within an enterprise group that can report production and employment
data for similar economic activities. When a minimum set of data items are available, a
TAU is created which covers all the operations within an industry subdivision. Where a
business cannot supply adequate information for each industry, a TAU is formed which
contains activity in more than one industry subdivision. These TAUs are classified
according to the industry subdivision of the main activity. TAUs may have operations in
one or more states / territories.
10 The statistical unit referred to as a 'business' thus consists of ABNs from the
non-profiled population and TAUs from the profiled population. For a comprehensive
definition of a business, refer to the publication's Glossary.
ST A T I S T I C A L UN I T continued
28 A B S • C O U N T S OF A U S T R A L I A N B U S I N E S S E S , I N C L U D I N G E N T R I E S A N D E X I T S • 8 1 6 5 . 0 • J U N 2 0 1 0 T O J U N 2 0 1 4
E X P L A N A T O R Y N O T E S continued
9540 Religious Services
9551 Business and Professional Associations
9552 Labour Association Services
9559 Other Interest Group Services n.e.c.
9601 Private Households Employing Staff
9602 Undifferentiated Goods Producing Activities of Private Household for Own Use
9603 Undifferentiated Service Producing Activities of Private Household for Own
Use.
18 The exclusion of the General Government Institutional Sector particularly impacts
on counts for the 'Public Administration and Safety', 'Education and Training' and 'Health
Care and Social Assistance' ANZSIC divisions (O, P and Q respectively). This focuses the
business counts in these divisions on private sector and public corporations activity only.
19 Most unincorporated entities (known as Sole Proprietors/Traders) are included in
the 'Households' sector. An unincorporated entity is an entity which has not become a
corporation under the Corporation Act 2001. Unincorporated entities can choose to
remain 'unincorporated', whereby the business does not possess a separate legal identity
to that of its owner, or it can choose the limited liability status of a company where the
business assets are legally separate to that of the owners. Some unincorporated
businesses are excluded from CABEE because these are operated/controlled by other
SISCA categories such as General Government or the Not for Profit Institutions Serving
Household (NPISH) sectors which are out of scope of CABEE.
20 In addition, the scope for business counts includes those businesses that are yet to
be coded by the ATO to an industry, sector and/or main state of operation through the
Australian Business Register (ABR) new business registration process. Analysis conducted
on these businesses indicates that, despite not having a complete set of characteristics
data, these businesses were actively trading and also met the other scoping criteria of the
collection (refer to the 'Conceptual and Practical Basis for Counts' section for further
details). It was therefore considered appropriate that they be included within scope of
CABEE.
21 These actively trading businesses have been grouped together into 'Currently
Unknown' codes in the publication tables and the forthcoming data cubes. The inclusion
of these businesses in CABEE provides a more accurate annual snapshot of businesses
that are actively trading in the Australian economy.
22 In June 2010, the ABS implemented a new methodology for identifying annual long
term non-remitters (LTNRs). For annual remitters, the LTNR period was increased from 5
consecutive quarters to 3 consecutive years. This change in LTNR methodology resulted
in a more accurate count of active businesses, particularly in the small business sector.
However, the change resulted in a noticeable and identifiable increase in business counts
in June 2010. It also led to an increase in business entries, because some businesses who
would have previously been excluded were brought back into scope, and therefore
appeared as business entries. An estimated 20,909 of the 342,753 business entries in
2009–10 can be attributed to the new LTNR methodology, and the majority are clustered
in the 'Non-employing' size category. They are also clustered in the Households category
of Standard Institutional Sector Classification of Australia (SISCA) and the Sole Proprietor
and Partnerships categories of Type of Legal Organisation (TOLO). As such, users should
exercise care when comparing June 2010 business counts and 2009–10 business entries
with business counts and entries from earlier or later periods.
SC O P E continued
A B S • C O U N T S OF A U S T R A L I A N B U S I N E S S E S , I N C L U D I N G E N T R I E S A N D E X I T S • 8 1 6 5 . 0 • J U N 2 0 1 0 T O J U N 2 0 1 4 29
E X P L A N A T O R Y N O T E S continued

29 This release contains snapshots of counts of active businesses at regular points in
time. These data also assist in providing a point in time 'snapshot' of those businesses
that are entering and exiting the Australian economy, as well as those businesses that
continue to survive. For further information, refer to the publication's Technical Notes.
30 Business entry and exit counts are restricted to new or ceasing businesses. The
movement of businesses between the profiled and non-profiled populations can also
have an impact, though this is usually minor. In 2013–14, the ABS undertook some
maintenance activity to improve the recording of businesses with agriculture related
activity. The net impact of these movements was to increase the number of businesses
operating in June 2014 by 383. This represents less than 2% of the 20,496 increase in
businesses operating in June 2014 compared with June 2013. These movements inflated
the 2013–14 business entry rate from 13.5% to 13.7% and the 2013–14 business exit rate
BU S I N E S S EV E N T S
26 The data presented in this publication were produced on a similar conceptual basis
to the data included in previous publications. In terms of time series, at an aggregate
level, data comparability is considered high between this and previous publications.
Refer to the section entitled 'Scope' for further information.
27 However, users should exercise caution when comparing geographical data
between this publication and publications released prior to the June 2007 to June 2011
publication. The ABS has implemented a new geographical framework, namely the
Australian Statistical Geography Standard (ASGS). With the move to the new
geography framework, both national data and state based data will remain unchanged.
Refer to section entitled 'ASGS' for further information.
28 Users should also exercise caution when making data comparisons between this
publication and previous publications containing ANZSIC 1993 industry detail and annual
turnover size ranges which will not be directly comparable with the data included in this
publication.
T I M E SE R I E S
25 Counts of businesses provided in the CABEE suite of products are based on annual
snapshots of the ABSBR from 30 June 2010 to 30 June 2014 (inclusive) and also reflect
changes and continuity between those periods.
RE F E R E N C E PE R I O D
24 The basis for business counts in this release is broadly consistent with that used for
frames in most ABS business surveys. There are two exceptions to this:
The scope with regard to industry, sector, or type of legal organisation can vary
according to the requirements of the survey. In some cases, classifications excluded
from these business counts are included in a survey frame in order to measure a
particular part of the economy more comprehensively. Other survey frames may
only include a subset of these classifications such as excluding businesses with
invalid ANZSIC codes. Most frames currently include 'Employing' businesses only.
Most survey frames include entities with a tax role to withhold income tax from their
employees (ITW role) but without a GST role. There are approximately 41,000 such
entities. Investigations indicate that units with an ITW role but no GST role are likely
to be part of a complex business structure. Such entities are excluded from these
counts as they are not considered to be actively trading in goods and services. For
business surveys designed to, amongst other things, provide estimates of wages and
salaries paid (irrespective of whether the entity is actively trading or not), it is
important that these entities are included on frames.
CO M P A R A B I L I T Y W I T H
FR A M E S FO R AB S BU S I N E S S
SU R V E Y S
23 There are actively trading businesses which have not registered for an ABN, either
because they do not have any obligations under the Goods and Services Tax (GST)
legislation or are under the threshold for registration and have chosen not to register.
These businesses have not been identified or quantified and are not included in counts
presented in this publication.
CO V E R A G E
30 A B S • C O U N T S OF A U S T R A L I A N B U S I N E S S E S , I N C L U D I N G E N T R I E S A N D E X I T S • 8 1 6 5 . 0 • J U N 2 0 1 0 T O J U N 2 0 1 4
E X P L A N A T O R Y N O T E S continued
37 A surviving business is defined as a business which is active on the ABSBR at 30
June of the current year and was also active in the previous year. In this release, two
types of survivors are recorded:
businesses that were on the ABSBR at 30 June 2010. Due to the changed basis of the
ABSBR in 2003, the ABS has determined that it is not feasible to ascertain the age of
these businesses. The survival of these businesses is measured in terms of whether
they were still on the ABSBR at 30 June 2011, 30 June 2012, 30 June 2013 and 30
June 2014
businesses that were entries in 2010–11. That is, they were not on the ABSBR at 30
June 2010 but were on 30 June 2011. The survival of these businesses is measured in
terms of whether they were still on the ABSBR at 30 June 2012, 30 June 2013 and 30
June 2014.
38 One of the enhancements to the business counts data in recent publications
involves the provision of data which indicates the growth of business survivals (in terms
of employment and annual turnover classifications) over time. For further information,
refer to the publication's Technical Notes.
SU R V I V A L S
34 A business exit event is the cancellation of a business' ABN or GST role and/or when
a business ceases to remit GST for at least five consecutive quarters in respect of that
ABN (or 3 consecutive years for annual remitters).
35 Thus, a business exit is defined as a business which was actively trading on the
business register at 30 June in the previous year but was not actively trading at 30 June in
the reference year.
36 It is important to note that a business exit event does not necessarily equate to a
business 'failure'. There may be a number of other reasons why a business exit event has
occurred, including events relating to selling a business (e.g. due to an owner/operator
retiring), and events relating to changes in a business' structure (e.g. due to merger or
takeover activities), etc. Such events may result in one or more business exit events
occurring, and in some cases, no net loss of businesses.
EX I T S
31 A business entry event is the registration of a new business for an ABN and the
allocation of a GST role, or the allocation of a GST role to an existing ABN which
previously did not have this role.
32 This also includes businesses which had either:
their ABN or GST role cancelled and subsequently recommenced activity under their
original ABN and GST role
ceased remitting BAS for at least five consecutive quarters (or three consecutive
years for annual remitters) but had recommenced remitting prior to the next
reference period.
33 Thus, a business entry is defined as a business which is actively trading on the
business register at 30 June in the reference year but was not actively trading at 30 June
the previous year.
EN T R I E S
from 12.5% to 12.7% because they were counted as business exits and entries. The
effects of the movements were more pronounced for the Agriculture, Forestry and
Fishing industry, the household sector, and partnerships, because the movements were
fairly concentrated in these business subpopulations. For example, the movements
reduced the decrease in Agriculture, Forestry and Fishing industry businesses during
2013–14 from 2.1% to 2.0%, increased this industry's 2013–14 business entry rate from
6.4% to 8.4%, and increased its 2013–14 business exit rate from 8.5% to 10.4%.
BU S I N E S S EV E N T S continued
A B S • C O U N T S OF A U S T R A L I A N B U S I N E S S E S , I N C L U D I N G E N T R I E S A N D E X I T S • 8 1 6 5 . 0 • J U N 2 0 1 0 T O J U N 2 0 1 4 31
E X P L A N A T O R Y N O T E S continued

47 Businesses can operate in more than one state or territory. For businesses in the
non-profiled population, Main State is derived from the main business address. For
businesses in the profiled population, Main State is the state or territory with the highest
employment. Therefore, for some businesses in the profiled population, Main State is
not necessarily the state or territory of the main business address.
MA I N ST A T E
44 The ASGS is the new geographical framework used by the ABS. It brings together all
regions for which the ABS publishes statistics within the one framework and has been
used for the collection and dissemination of geographically classified statistics since
1 July 2011.
45 The ASGS replaces the Australian Standard Geographical Classification (ASGC),
which is no longer produced. While there are superficial similarities between the ASGS
and the ASGC, it is important to recognise that the two are fundamentally different and
there are significant differences between their respective regions, both in their
geographical extent and their conceptual foundation. As a whole, the ASGS represents a
more comprehensive, flexible and consistent way of defining Australia's statistical
geography than the ASGC. For further information to assist users move from the ASGC
to the ASGS refer to the ABS website <www.abs.gov.au/geography>.
46 Since the move to the new geography framework in the June 2007 to June 2011
edition of CABEE, state and territory level data have remained unchanged. However
small area data have been produced using the ASGS. In terms of business counts data,
the base unit of the ASGS is the Statistical Area Level 2 (SA2). This SA2 data replaced the
previously published Statistical Local Area (SLA) business counts data. Refer to section
entitled 'Statistical Area Level 2' for further information.
AS G S AU S T R A L I A N
ST A T I S T I C A L GE O G R A P H Y
ST A N D A R D ( A S G S )
42 Each business (either an ABN unit or TAU on the ABSBR) has been classified to a
single ANZSIC 2006 industry class, irrespective of any diversity of activities undertaken.
The industry class allocated is the activity which provides the main source of industry
value added (sales of goods and services, wages and salaries or number of employees as
a proxy), which is generally based on a description provided by the business.
43 For further information on ANZSIC 2006, users may wish to consult the Australian
and New Zealand Standard Industrial Classification (ANZSIC), 2006 (cat. no. 1292.0)
on the ABS website <www.abs.gov.au>.
I N D U S T R Y
41 Ideally, the ABS would capture all economically active entities in Australia. These
would then be split by actively trading businesses and other entities. However, it is not
possible to capture all such entities accurately at this stage as there are a number of
options open to these entities with regard to registration or participation in the tax
system using existing data sources. Only partial coverage of these entities is possible
using existing data sources and it is not possible to quantify the extent of this partial
coverage.
A CO M P R E H E N S I V E CO U N T
OF AL L EC O N O M I C A L L Y
AC T I V E EN T I T I E S
40 The counts in this publication are subject to non-sampling error and the cyclical
administrative workflows of the ATO may impact on data interpretability. The counts are
not subject to sampling error as they represent a complete enumeration of those
'economically active' businesses on the ABSBR. For further information on this and other
likely sources of error in this release, refer to the Quality Declaration associated with
CABEE.
DA T A QU A L I T Y
39 It is possible that a business can enter after 30 June in a given year and exit before
30 June in the following year. A small number of these instances occur in any given year.
This release excludes those instances in order to assist interpretation of results.
I N T R A - Y E A R EN T R I E S AN D
EX I T S
32 A B S • C O U N T S OF A U S T R A L I A N B U S I N E S S E S , I N C L U D I N G E N T R I E S A N D E X I T S • 8 1 6 5 . 0 • J U N 2 0 1 0 T O J U N 2 0 1 4
E X P L A N A T O R Y N O T E S continued
53 The methodology used to derive the non-profiled population business counts for
employment size changed in the last edition of CABEE to provide a more accurate
representation of the size of businesses. A more detailed description of the new
methodology and its affects are described in this CABEE publication. See Technical Note
2 Improved Employment Range for more detail.
54 Prior to the previous release, the method used to quantify employment varied
depending on where (i.e. in which population) a business resided in the ABSBR.
55 The technical definition of employing units depends upon whether the unit resides
in the profiled or non-profiled population. Employing units are defined as:
profiled population – businesses with greater than zero employees
non-profiled population – businesses with a non-cancelled Income Tax Withholding
(ITW) role and which have remitted to the ATO at least once in the preceding five
quarters (or three years for annual remitters). This may include a small number of
businesses which have ITW roles for purposes other than withholding amounts from
wages and salaries, and as such have zero employment.
EM P L O Y M E N T S I Z E
52 The sizing classifications presented in this release are based on employment and
turnover reported by businesses, as defined below. The Technical Note 1 Measures of
Business Growth contains additional information on business size and how business
growth is represented.
BU S I N E S S S I Z E
49 SA2s are general-purpose, medium-sized areas built from whole SA1s. Their aim is
to represent a community that interacts together socially and economically. SA2s are the
base spatial units used to disseminate ABS business counts data and replace the
previously used SLAs. In aggregate, 2,214 SA2s cover the whole of Australia without gaps
or overlaps. Further, SA2 data can be aggregated to larger geographical areas, including
SA3, SA4 and states and territories, as part of the ASGS.
50 Small area level data cubes will be released using SA2 as the base spatial unit. For
further information to assist users with the transition from the ASGC to the ASGS refer to
the ABS website <www.abs.gov.au/geography>.
51 The issues of geocoding multi location business locations are more pronounced for
count data at the SA2 level, as multi location businesses (i.e. in respect of businesses
registered under a single ABN/TAU) will only be attributed to a single SA2. As such, care
should be taken not to assume that business counts at the SA2 level reflect all business
operations within that SA2. For further information, refer to the data quality declaration
associated with CABEE.
ST A T I S T I C A L AR E A LE V E L 2
48 The Australian taxation system provides flexibility during the new business
registration process, as it allows businesses operating in single or multiple states or
territories to register on the ABR and report taxation obligations in a variety of ways. For
instance, it is possible for a business entity to register for a single ABN regardless of the
number of commercial activities it undertakes (sometimes visible in the number of
physical shopfronts it may operate from). Alternatively, multiple commercial activities of
a single business enterprise may be registered for separate ABNs, depending on the legal
structure adopted by the enterprise. Hence, where commercial activities are carried out
by a number of different but related entities, each entity may register for a separate ABN.
As this publication defines a business on the basis of an ABN (or TAU in the profiled
population), the counts may be regarded as providing partial coverage of businesses in a
given state. For further information, refer to the data Quality Declaration associated with
CABEE.
MA I N ST A T E continued
A B S • C O U N T S OF A U S T R A L I A N B U S I N E S S E S , I N C L U D I N G E N T R I E S A N D E X I T S • 8 1 6 5 . 0 • J U N 2 0 1 0 T O J U N 2 0 1 4 33
E X P L A N A T O R Y N O T E S continued
64 The confidentialising process applied is expected to maximise the availability of
data without introducing any bias to the estimates.
CO N F I D E N T I A L I T Y
62 The ABS Business Register receives updated information when a business entity
reports changes to either the ABR or the ATO, such as a new registration, revised payee
information, or when the business entity reports changes in its business structure or
activity. These reporting changes can impact upon the business entity's industry
classification (ANZSIC); institutional classification (SISCA); legal classification (TOLO);
geographic classifications (state / territory); or business size (Employment or Turnover
categories). These changes to the register generate revisions to data previously
published in earlier editions of CABEE.
63 Some of the revisions to 'Currently Unknown' categories are attributable to updated
classificatory information, such as ANZSIC, SISCA or TOLO, where this information did
not previously exist for the business entity. Revisions to the 'Currently Unknown'
category can be more substantial as new information comes to hand from the ABR and
the ATO.
RE V I S I O N S
59 Annual turnover values are based on data reported to the ATO through Business
Activity Statements (BASs) and include imputation for missing periods for all businesses
in the non-profiled population. For businesses in the profiled population, turnover
reported on BAS for ABNs is aggregated to Enterprise (EN) level and is apportioned to
the relevant TAUs.
60 Where businesses report zero values on their BAS or have failed to report at all,
these data are compared with auxiliary BAS data, which are then used for the purposes
of assigning annual turnover values for each in scope business. In cases where auxiliary
BAS data are not available, an imputation based on auxiliary ABSBR data (including wages
and salaries and employment data) is used.
61 The imputation technique described therefore classifies all in scope businesses to a
single annual turnover size range in CABEE.
AN N U A L TU R N O V E R S I Z E
56 In the profiled population, businesses report 'employment' as defined by the
number of persons who are employed by a public or private employer and receive
remuneration in wages or salaries (including working proprietors and working partners),
or are paid a retainer fee by their employer. Employment excludes non-salaried directors,
volunteers, persons paid by commission only, and self employed persons such as
consultants and contractors. These data are collected through direct contact with
businesses in the profiled population and reflect a 'point in time headcount' of current
employees.
57 In the non-profiled population, payees estimates are updated monthly for those
ITWs whose reported payees and/or ANZSIC has changed, and yearly for those ITWs that
haven't changed throughout the past two years. The new process uses Business Activity
Statement wages and salaries information and ABS survey information to bring the
counts into closer alignment with the target variable (i.e. number of employees at the
end of the financial year). Adjustment factors are calculated, based upon unit record
differences between reported employment in ABS business surveys and information
from the ATO, including payment summaries. These factors, along with payment
summary information, form the inputs into the derived employment variable and, in
turn, the employment size range.
58 The employment data extracted from the ABSBR are generally suitable for the
purposes of attributing an employment size classification to each in scope business.
EM P L O Y M E N T S I Z E continued
34 A B S • C O U N T S OF A U S T R A L I A N B U S I N E S S E S , I N C L U D I N G E N T R I E S A N D E X I T S • 8 1 6 5 . 0 • J U N 2 0 1 0 T O J U N 2 0 1 4
E X P L A N A T O R Y N O T E S continued

71 The next release of CABEE is currently scheduled for February 2016.NE X T RE L E A S E
70 Information regarding previous releases of CABEE may be accessed on the ABS
website <www.abs.gov.au>.
PR E V I O U S RE L E A S E S
66 Estimates of the number of businesses operating in the Australian economy may be
derived from a number of sources within the ABS or from non-ABS sources. They may
relate to a point in time, or may be average annual data. These estimates will not always
show the same results. Variations occur because of the differing data sources, differing
definitions of a business, differing scope and coverage as well as variations due to
sampling and non-sampling errors.
67 The definition of Employing/Non-employing in the ABS can also vary according to
collection methodology, data sources, and user requirements.
68 Users comparing data from this publication with other ABS data should do so with
care, as some other ABS publications may exclude 'Non-employing' businesses or
particular industries or sectors.
69 For further details see the Explanatory Notes section of the relevant publications.
CO M P A R I S O N W I T H OT H E R
BU S I N E S S CO U N T S DA T A
65 The confidentiality process perturbs data in such a way that the data presented at
these detailed levels will not always be additive. That is, opening stock from the
beginning of the financial year, plus entries, minus exits, may not be equal to the closing
stock for the end of the financial year. This is due to the fact that each of those
components are individually perturbed.
CO N F I D E N T I A L I T Y continued
A B S • C O U N T S OF A U S T R A L I A N B U S I N E S S E S , I N C L U D I N G E N T R I E S A N D E X I T S • 8 1 6 5 . 0 • J U N 2 0 1 0 T O J U N 2 0 1 4 35
E X P L A N A T O R Y N O T E S continued

The ABS first released Small Business in Australia (cat. no. 1321.0) in 1988. This
compendium release included a range of statistics about small businesses.
'Non-employing' businesses (such as self employed tradespeople) are a significant
component of the small business sector. As such, it was important to include both
counts and characteristics of these in Small Business in Australia.
These counts were derived from the monthly Labour Force Survey (LFS) and were
progressively updated until the final issue of Small Business in Australia (cat. no.
1321.0) in 2001. To produce a comprehensive count of small businesses, the LFS-sourced
counts of non-employers were added to counts of employing businesses sourced from
the Survey of Employment and Earnings (which used the ABSBR as a frame). The counts
of small businesses stood at approximately 1.2 million in 2001.
The counts of 'Non-employing' businesses were almost certainly significantly understated
for two reasons:
Those counts did not fully capture businesses operated by people whose
predominant labour force status was other than a small business operator.
Those counts did not fully capture multiple businesses owned by one operator. It
has not been possible to accurately quantify this underestimate.
Counts from Smal l Business
in Austral ia (1988 to 2001)
The ABS has maintained an integrated business register (ABSBR) since the development
phase of the first Integrated Economic Censuses conducted in respect of 1968–69.
From the amendment of the Income Tax Assessment Act in 1986 until 2002, this was
primarily sourced from Group Employer (GE) registrations with the Australian Taxation
Office (ATO). When a business commenced employing staff, a GE registration was
required to enable the business to deduct income tax from its employees.
No comprehensive register of 'Non-employing' businesses was maintained by any
government organisation and the ABS did not seek to create such a register.
As such, any business counts produced from the ABSBR prior to 2002 included
employing businesses only.
A further short coming in these counts was that proper recording of businesses which
had commenced, ceased or continued operation did not occur consistently over time.
For example, a units survey in 1991 identified a significant number of businesses which
had previously been included on the ABSBR but had ceased operation. These businesses
were subsequently removed from the ABSBR. In 1996, a survey of businesses which had
been removed as a result of feedback from survey processing identified a significant
number of businesses which were in fact still operating.
In both these cases and in other similar instances over time, ABS economic statistics
were backcast to adjust for these effects over time.
D I S C O N T I N U E D AB S
BU S I N E S S CO U N T S
Counts from the ABS Business
Register (Prior to 2002)
The ABS has been producing business counts for many years, either as direct counts of
businesses, as a by product from survey processing, or as a combination of the two.
Over time, the scope and coverage of businesses included in these counts has changed
significantly.
Business counts included in this release are a relevant source for users interested in
understanding the number of businesses actively producing or distributing goods or
providing services in the Australian economy. Nevertheless, these counts are still subject
to information gaps, mainly due to difficulties in accurately identifying when businesses
have ceased trading. While the ABS will retain the conceptual basis of these counts in
future releases, continuing refinements will be made in an effort to improve the
alignment between the conceptual basis of the counts and available information. The
Explanatory Notes discusses these factors and ABS plans to improve information sources
over time.
I N T R O D U C T I O N
36 A B S • C O U N T S OF A U S T R A L I A N B U S I N E S S E S , I N C L U D I N G E N T R I E S A N D E X I T S • 8 1 6 5 . 0 • J U N 2 0 1 0 T O J U N 2 0 1 4
A P P E N D I X 1 A B S B U S I N E S S C O U N T S
Feedback from users since the 2005 release indicated that counts of actively trading
businesses, rather than all entities carrying out economic activity, were more valuable for
the various uses to which business counts were being put.
This resulted in the development of Counts of Australian Businesses, including Entries
and Exits (cat. no. 8165.0), first released in February 2007.
The counts showed that there were approximately 1.9 million actively trading businesses
at that time. The differences between the count of 1.9 million and the count of
approximately 3.0 million from the 2005 release was due to the exclusion of:
CU R R E N T AB S BU S I N E S S
CO U N T S
Counts of Austral ian
Businesses, including Entr ies
and Exi ts (2007 to current)
From 2002, the ABS changed the basis of the ABSBR from GE registrations to ABN
registrations sourced from the Australian Business Register (ABR). From the introduction
of the new tax system in July 2000, businesses required to remit GST, deduct income tax
from employees or to participate in several other aspects of the tax system were required
to register for an ABN on the ABR.
The ABS released experimental estimates of business entries and exits and the first
counts from the ABR based ABSBR in 2005.
The release of Australian Bureau of Statistics Business Register, Counts of Businesses
(cat. no. 8161.0.55.001) in October 2005 showed 3.0 million businesses operating as at
June 2004, 2.9 million of which were small businesses.
These counts significantly overstated the number of businesses actively producing or
distributing goods or providing services in the Australian economy for two reasons:
They included businesses which did not have a GST role and whose only tax role
was to enable the payment of Income Tax Instalment Provisions. Subsequent
investigations indicate that these entities tend to be investment vehicles rather than
actively trading businesses.
They also included businesses with a GST role but which had not remitted GST
obligations for at least five successive quarters. These businesses have been termed
"long term non-remitters" (LTNRs). Subsequent investigations indicate that the
majority of these businesses were no longer active.
Both categories of businesses, which in combination (noting some overlap) contributed
over 1 million to these previously released counts, have been excluded from the counts
in this release.
Counts from Austral ian
Bureau of Stat ist ics Business
Register, Counts of
Businesses (2005)
The ABS first released Characteristics of Small Business (cat. no. 8127.0) in 1995. This
compendium release also included a range of information about small businesses,
including counts of small businesses and small business operators.
The decision to discontinue Characteristics of Small Business Operators (COSBO) was
driven by the development of superior data sources, and the findings of a
methodological review of the 2005 and 2006 COSBO surveys.
The review compared data from the 2005 and 2006 COSBO surveys with data from the
2006 Census of Population and Housing and a range of Labour Force Supplementary
Surveys. It concluded that, while some data items collected continue to provide an
ongoing and accurate picture of the changing nature of the Australian small business and
small business operator populations, a more consistent picture was provided by the
alternate data sources.
Users should note that since the discontinuation of COSBO, the ABS has developed a
new publication focussing exclusively on Australian business operators. Counts of
Australian Business Operators (cat. no. 8175.0) was first released in October 2008 and
again in October 2013 and utilises data from the ABS Census of Population and Housing
and the ABS Forms of Employment Survey to present a range of demographic data.
Further information can be obtained from the ABS website <www.abs.gov.au>.
Counts from Character ist ics of
Small Business (1995–2006)
A B S • C O U N T S OF A U S T R A L I A N B U S I N E S S E S , I N C L U D I N G E N T R I E S A N D E X I T S • 8 1 6 5 . 0 • J U N 2 0 1 0 T O J U N 2 0 1 4 37
A P P E N D I X 1 A B S B U S I N E S S C O U N T S continued

Since 1968, several ABS business surveys, using the ABSBR to provide a survey frame,
produced counts of businesses as by product from survey processing.
These counts were consistent with business counts sourced directly from the ABSBR
except they were adjusted to account for businesses identified in survey processing as no
longer operating. However, the scope of these counts aligned with the scope of the
respective surveys.
Therefore, counts of business entities derived from ABS surveys may not necessarily be
comparable with the counts of actively trading businesses included in CABEE. Users
should refer to the Explanatory Notes of the respective publications for further
information.
Counts Produced from ABS
Business Surveys (1968 to
current)
Entities which had an active ABN but which did not have a GST role. While
economically active, these entities were mainly businesses with asset holdings and
consequent income flows but had not traded in goods and services.
Businesses with a GST role which had not returned a Business Activity Statement
(BAS) for more than five quarters or had returned a BAS reporting zero dollar
amounts. These businesses were likely to be no longer trading.
In combination (noting some overlap) there were approximately 1 million businesses in
the above categories.
CABEE was released again in December 2007 and showed that Australia's population of
actively trading businesses had exceeded 2 million. A third release of CABEE in October
2010 showed that business counts had dropped slightly, but still remained above 2
million.
In January 2012, a fourth release of CABEE showed that business counts increased over
the 2009–10 (3.6%) and 2010–11 (0.4%) years.
In May 2013, a fifth release of CABEE showed that business counts increased over the
2010–11 (0.4%) and 2011–12 (0.4%) years.
The sixth release of CABEE in June 2014 reported a 2.9% decrease in the number of
actively trading businesses in Australia between June 2012 and June 2013.
The ABS plans to continue releasing CABEE. The publication is expected to provide
users with a regular snapshot of Australia's population of actively trading businesses.
Counts of Austral ian
Businesses, including Entr ies
and Exi ts (2007 to current)
continued
38 A B S • C O U N T S OF A U S T R A L I A N B U S I N E S S E S , I N C L U D I N G E N T R I E S A N D E X I T S • 8 1 6 5 . 0 • J U N 2 0 1 0 T O J U N 2 0 1 4
A P P E N D I X 1 A B S B U S I N E S S C O U N T S continued

ABS publications draw extensively on information provided freely by individuals,
businesses, governments and other organisations. Their continued cooperation is very
much appreciated: without it, the wide range of statistics published by the ABS would
not be available. Information received by the ABS is treated in strict confidence and are
subject as required by the Census and Statistics Act 1905.
AC K N O W L E D G E M E N T
As well as the statistics included in this and related publications, the ABS may have other
relevant data available on request and for a charge. Inquiries should be made to the ABS
National Information and Referral Service on 1300 135 070.
Information is also available online via a selection of economic-specific theme pages. To
access these theme pages, go to the ABS website home page <www.abs.gov.au>, open
the Economy link shown under 'Key Products' (located in the left side navigator), then
select one of the links shown under 'Business Demography'.
AB S DA T A AV A I L A B L E ON
RE Q U E S T
Further detailed data are available through ABS.Stat and data cubes which will
accompany the release of this publication through the ABS website <www.abs.gov.au>.
These data cubes include detailed cross classified information using industry,
geographical and business size dimensions.
Users may also be interested in accessing data from other collections. Please refer to the
section below entitled 'ABS Data Available on Request' for further information.
AD D I T I O N A L DA T A
ABS publications which may be of interest to users of Counts of Australian Businesses,
including Entries and Exits are listed below.
Business Demography Publications:
Australian Industry, 2012–13 (cat. no. 8155.0)
Selected Characteristics of Australian Business, 2012–13 (cat. no. 8167.0)
Counts of Australian Business Operators, 2011 to 2012 (cat. no. 8175.0)
Australian Bureau of Statistics Business Register, Counts of Businesses – Summary
Tables, June 2004 (cat. no. 8161.0.55.001), replaced by 8165.0
Australian Small Business Operators – Findings from the 2005 and 2006
Characteristics of Small Business Surveys, 2005–06 (cat. no. 8127.0), replaced by
8165.0 and 8175.0
Experimental Estimates, Entries and Exits of Business Entities, Australia, 2001–02
to 2003–04 (cat. no. 8160.0.55.001), replaced by 8165.0
Small Business in Australia, 2001 (cat. no. 1321.0), replaced by 8165.0
Experimental Estimates, Regional Small Business Statistics, Australia, 1995–96 to
2000–01 (cat. no. 5675.0), replaced by 8165.0.
Information Technology Publications:
Summary of IT Use and Innovation in Australian Business, 2012–13 (cat. no.
8166.0)
Business Use of Information Technology, 2011–12 (cat. no. 8129.0)
Innovation in Australian Business, 2012–13 (cat. no. 8158.0).
Current publications and other products released by the ABS are available from the ABS
website <www.abs.gov.au>. The ABS also issues a daily Release Advice on the website
which details products to be released in the week ahead. There is a link from this
Release Advice to a six month release schedule.
I N T R O D U C T I O N
A B S • C O U N T S OF A U S T R A L I A N B U S I N E S S E S , I N C L U D I N G E N T R I E S A N D E X I T S • 8 1 6 5 . 0 • J U N 2 0 1 0 T O J U N 2 0 1 4 39
A P P E N D I X 2 S U P P L E M E N T A R Y I N F O R M A T I O N

1010005–19 employees0100011–4 employees000000Non–employing business
20 1 1 – 1 2
0000005–19 employees1010001–4 employees010001Non–employing business
20 1 0 – 1 1
Operating
at end of
financial
year
Minus
Outflows
Plus
Inflows
Minus
Exits
Plus
Entries
Operating
at start of
financial
year
6 Consider the following example involving a small business which is active during the
2010–11 and 2011–12 financial years. During this two year period, the business:
Did not employ any staff at the start of 2010–11 financial year
Took on 2 employees during 2010–11
Grew to 6 employees over 2011–12.
7 Under publications where classifications were held constant for each business at
their latest available value, this business would have been included in the '5–19'
employees category for June 2010, June 2011 and June 2012. This can result in some
misunderstanding regarding the size of the businesses in earlier time periods.
8 Now, under the new approach, the business would be classified according to its size
for the respective year:
EX A M P L E
1 In CABEE, the stock of businesses is updated each year according to a standard
equation:
2 Operating at start of financial year + Entries – Exits = Operating at end of financial
year
3 In previous releases of CABEE, all data was presented in accordance with this
equation at both a national level, and for selected classifications: Industry; Main State;
Institutional Sector; Type of Legal Organisation; Employment Size; and Annual Turnover
Size.
4 To ensure additivity, the classification values (e.g. industry code, main state,
employment size range, etc.) attributed to each business were held constant over the
lifetime of the business in previous editions. Specifically, for each business, the latest
available data were used to overwrite any periods of conflicting or missing data.
5 The main issue with this approach is that it is possible for businesses to change their
characteristics over time, particularly for employment size and annual turnover size. In
fact, this change can be of interest in itself as business growth can be considered in terms
of whether a business is increasing with respect to that characteristic, remaining stable,
or decreasing in size over time. To address this, recent releases of CABEE have extended
the standard equation for employment size and annual turnover size to:
Operating at start of financial year + Entries – Exits + Inflow – Outflow = Operating
at end of financial year, where:
Inflow = the number of surviving businesses that have changed their classification
to the classification of interest; and
Outflow = the number of surviving businesses that have changed their classification
from the classification of interest.
I N T R O D U C T I O N
40 A B S • C O U N T S OF A U S T R A L I A N B U S I N E S S E S , I N C L U D I N G E N T R I E S A N D E X I T S • 8 1 6 5 . 0 • J U N 2 0 1 0 T O J U N 2 0 1 4
T E C H N I C A L N O T E 1 ME A S U R E S O F B U S I N E S S GR O W T H

(c) A small number of businesses which have ITW roles for purposes otherthan withholding amounts from wages and salaries (and as such havezero employment), are included in this category.
(d) The methodology used to derive employment size changed in theprevious release. Please refer to the Technical Note 2 ImprovedEmployment Range for more information regarding change inmethodology.
— nil or rounded to zero (including null cells)(a) Please refer to paragraphs 53–58 in the Explanatory Notes for more
information regarding employment size ranges.(b) The net movement of surviving businesses is calculated by subtracting
the total outflow at the end of the financial year from the total inflow atthe end of the financial year. See Glossary and Technical Note 1Measures of Business Growth for more information.
—174 052174 0523 48350 002189 369489 1551 084 000Total
872873743 10923462819200+1 1318 2169 34732840 6555 6008171 47120–1992 67737 14539 822147 545149 54723 5106 0765–19
–19 51285 06565 553251 31632 334423 60251 3901–4(c)15 61743 33958 95672521 88241 1981 025 044Non–employing
(Employment Size Ranges)(d)
BUSINESS SIZE CATEGORY ATJUNE 2013
CH A N G E D BU S I N E S S S I Z E CA T E G O R Y AT JU N E 20 1 4
—177 853177 8533 51549 644188 913495 3581 103 007Total
662613273 188204133113200+1 0837 9068 98928440 6555 2938681 46120–1992 21737 65639 873127 540149 04023 4106 6945–19
–27 88291 17263 290271 02232 917432 06857 2061–4(c)24 51640 85865 37442231 65038 9811 037 633Non–employing
(Employment Size Ranges)(d)
BUSINESS SIZE CATEGORY ATJUNE 2012
CH A N G E D BU S I N E S S S I Z E CA T E G O R Y AT JU N E 20 1 3
no.no.no.no.no.no.no.no.
200+20–1995–191–4(c)Non–employing
Net movement
of surviving
businesses(b)
Outflow
at end of
financial
year
Inflow at
end of
financial
year
CHANGED BUSINESS SIZE CATEGORY(EMPLOYMENT SIZE RANGES)
CHANGE IN BUSINESS SIZE OVER TIME FOR SURVIV ING BUSINESSES (a) : June 2012– June 2014
9 Using this approach, it is possible to present the change in business numbers (of
surviving businesses) for different classifications (of employment size and annual
turnover). For example, consider the following partial extract from the publication's
Growth of Business Survivals by Employment Size Range table below.
EX A M P L E continued
A B S • C O U N T S OF A U S T R A L I A N B U S I N E S S E S , I N C L U D I N G E N T R I E S A N D E X I T S • 8 1 6 5 . 0 • J U N 2 0 1 0 T O J U N 2 0 1 4 41
T E C H N I C A L N O T E 1 ME A S U R E S O F B U S I N E S S GR O W T H continued

14 The net movement of surviving businesses for each range, i.e. accounting for all
businesses that moved into (inflow) and out of (outflow) a particular size range.
15 The net movement of surviving businesses is calculated by taking total inflow at the
end of the financial year minus total outflow at the end of the financial year.
16 The above information (particularly the last column) can then be included in the
traditional business counts tables. A partial extract from the publication's Businesses by
Employment Size Ranges table is included below.
Net Movement of Surv iv ing
Businesses
13 This column accounts for the total number of business that moved out of a size
range into another range. Note that these businesses may have come from larger or
smaller size ranges (depending on the range being analysed).
Outf low at End of Financial
Year
12 The total number of business that moved into a size range from another range.
Note that these businesses may have come from larger or smaller size range (depending
on the range being analysed).
Inf low at End of Financial
Year
10 The primary purpose of the table is to quantify the businesses which grow or
contract between financial years. The first five columns provide a cross-classified matrix
which shows how many businesses were classified to one business size at the start of the
financial year, and a different business size at the end of the financial year.
11 Note that the majority of businesses do not change their size category between
years, and the counts of these businesses are represented along the main diagonal of the
table. For example, 1,025,044 'Non-employing' businesses at the end of June 2013,
remained 'Non-employing' at the end of June 2014. Equally, 3,109 businesses in the
largest size category at the end of June 2013, remained in the largest size category at the
end of June 2014. In the above table, it can be seen that:
51,390 businesses had '1–4' employees at the start of the financial year and
contracted to be 'Non-employing' by the end of the financial year (negative growth)
423,602 businesses had '1–4' employees at the start of the financial year and
continued to have '1–4' employees at the end of the financial year (stability)
32,334 businesses had '1–4' employees at the start of the financial year and expanded
to have '5–19' employees at the end of the financial year (growth).
EX P L A N A T I O N OF CO N T E N T S
Business Size Range Matr ix
42 A B S • C O U N T S OF A U S T R A L I A N B U S I N E S S E S , I N C L U D I N G E N T R I E S A N D E X I T S • 8 1 6 5 . 0 • J U N 2 0 1 0 T O J U N 2 0 1 4
T E C H N I C A L N O T E 1 ME A S U R E S O F B U S I N E S S GR O W T H continued

18 While it is possible to develop similar tables and data cubes for the other
classifications (industry, main state of operation, institutional sector and type of legal
organisation) used in CABEE, ABS investigations have determined that relatively few
businesses tend to change these classifications values from year to year. Thus, allowing
for the classifications to change over time appears to offer limited additional information
while increasing the complexity of the tables (including introducing a need to
confidentialise data for those rare changes in classifications). For these reasons,
additional tables for the non-business size range topics have not been created in this
version of CABEE.
Appl icat ion within Other
Tables
17 Including the net movement of surviving businesses column in the employment
size ranges table provides more detailed (point in time) information about the
movement of businesses within specific business size ranges, whilst maintaining
additivity within each business size table. For example, the table above demonstrates that
during 2013–14, the 16 change recorded for businesses employing 200 employees or
more was partly driven by the 87 net movement of surviving businesses in this
employment size range. That is, during 2013–14, there was a positive net movement of
87 existing small or medium businesses which grew to become large businesses.
Net Movement of Surv iv ing
Businesses continued
— nil or rounded to zero (including null cells)(a) Please refer to paragraphs 53–58 in the Explanatory Notes for more information regarding employment size ranges.(b) The net movement of surviving businesses is calculated by subtracting the total outflow at the end of the financial year from the total inflow
at the end of the financial year. See Glossary and Technical Note 1 Measures of Business Growth for more information.(c) A small number of businesses which have ITW roles for purposes other than withholding amounts from wages and salaries (and as such
have zero employment), are included in this category.
1.020 4962 100 162—263 657284 1532 079 666Total
1.411 025826 393–15 61767 74294 384815 368Total employing
0.4163 614872021313 598200+1.574251 6881 1312 0751 68650 94620–1991.32 503199 9152 67710 72010 546197 4125–191.47 764571 176–19 51254 74582 021563 4121–4(c)
Employing0.79 4711 273 76915 617195 915189 7691 264 298Non–employing
20 1 3 – 1 4
–2.9–61 6142 079 666—300 843239 2292 141 280Total
–2.4–19 819815 368–24 51673 24177 938835 187Total employing
–0.2–83 59866157833 606200+0.842450 9461 0831 9611 30250 52220–199
–0.5–928197 4122 21711 6448 499198 3405–19–3.3–19 307563 412–27 88259 47968 054582 7191–4(c)
Employing–3.2–41 7951 264 29824 516227 602161 2911 306 093Non–employing
20 1 2 – 1 3
%no.no.no.no.no.no.
Percentage
changeChange
Operating
at end of
financial
year
Net movement
of surviving
businesses(b)ExitsEntries
Operating
at start of
financial
year
BUSINESSES BY EMPLOYMENT SIZE RANGES (a) : June 2012– June 2014
A B S • C O U N T S OF A U S T R A L I A N B U S I N E S S E S , I N C L U D I N G E N T R I E S A N D E X I T S • 8 1 6 5 . 0 • J U N 2 0 1 0 T O J U N 2 0 1 4 43
T E C H N I C A L N O T E 1 ME A S U R E S O F B U S I N E S S GR O W T H continued

5 Table 1 shows that the bulk of total movement (92.1%) is due to businesses moving
from the '5–19' to the '1–4' employment size range (69,414 businesses) and businesses
moving from the '20–199' to '5–19' employment size range (34,770 businesses).
6 A small number of businesses moved from the '1–4' to '200+' range (113 businesses)
and also from the '200+' range to the '1–4' (597 businesses). These changes reflect the
wider range of additional information sources (particularly Business Activity Statement
wages and salaries), used to derive the employment variable and in turn, calculate a
more accurate business size range.
7 The results in Table 1 included business entries in the 2013–14 financial year and
showed minimal relative change when entries were excluded from the analysis.
TO T A L IM P A C T ON BU S I N E S S
S I Z E RA N G E S
4 The use of this new employment derivation method has resulted in changes in the
number of businesses allocated to the various employment range categories.
The revised methodology for calculating employment size ranges has resulted in
113,147 of the total 2,100,162 businesses (5.4%) changing employment size
categories for the 2013–14 financial year.
The majority of this movement was businesses moving from the:
'5–19' range to the '1–4' range (69,414 businesses)
'20–199' range to the '5–19' range (34,770 businesses)
The 'Accommodation and Food Services' and 'Retail Trade' industries exhibited the
greatest percentage movement in numbers (15,553 – 18.2% and 14,098 – 10.5%
respectively).
OV E R V I E W OF RE S U L T S
1 The methodology used to derive business counts, based upon employment size
ranges, has changed on the ABS Business Register and is reflected in this and the
previous edition of Counts of Australian Businesses, including Entries and Exits
(CABEE). Prior to the previous edition, employment size ranges were based on
businesses' payee information, which is the estimated number of employees to whom
payment summaries are issued during the financial year. That number reflects the total
number of people employed by a business throughout a given year, rather than the
number of people employed by a business at a point in time (end of the financial year).
Hence, business size will be overstated if there is any turnover of employees during the
year.
2 The new employment derivation method uses a statistical adjustment to provide the
ABS' best estimate of the number of employees at the end of the financial year. This
statistical adjustment is based on the most recent and consistent information from
surveys, the Australian Business Register (ABR) and the Australian Tax Office (ATO). As
such, the new derivation is a more representative view of business size than a cumulative
total number of employees throughout the year. The adjustment is applied to the payees
data using Business Activity Statement (BAS) wages and salaries data and ABS survey
information to bring the counts closer into alignment with the target variable (i.e.
number of employees at the end of the financial year). Adjustment factors are calculated,
based upon unit record differences between reported employment in ABS business
surveys and information from the ATO, including payment summaries. These factors,
along with payment summary information, form the inputs into the derived employment
variable and, in turn, the employment size range. For a minor proportion of businesses,
the employment estimate derived from BAS data will be higher than that derived from
payees.
3 The new employment derivation method has no impact on the number of
'Non-employing' businesses.
BA C K G R O U N D
44 A B S • C O U N T S OF A U S T R A L I A N B U S I N E S S E S , I N C L U D I N G E N T R I E S A N D E X I T S • 8 1 6 5 . 0 • J U N 2 0 1 0 T O J U N 2 0 1 4
T E C H N I C A L N O T E 2 I M P R O V E D EM P L O Y M E N T RA N G E

8 The net impact upon business size ranges was analysed for the financial years
2010–11, 2011–12, 2012–13 and 2013–14. The '1–4' employment size range increased in
each of the four years analysed (2011, 2012, 2013, 2014) on average by 13.6%. The '5–19',
'20–199' and '200+' employment size ranges all resulted in a decrease in business counts.
These decreases are proportionally consistent through the '5–19', '20–199' and '200+'
employment size ranges. The smallest number of businesses changing size categories
was the '200+' size range, where 2,824 businesses were categorised to smaller size
ranges on the basis of the revised methodology (See Table 2, 2013–14).
NE T IM P A C T ON BU S I N E S S
S I Z E RA N G E S
— nil or rounded to zero (including null cells)
100.02 100 162Total
5.4113 147Total Movement0.12 299Moved from (200+ to 20–199)—59Moved from (200+ to 5–19)—597Moved from (200+ to 1–4)—11Moved from (20–199 to 200+)
1.734 770Moved from (20–199 to 5–19)0.11 891Moved from (20–199 to 1–4)—7Moved from (5–19 to 200+)—64Moved from (5–19 to 20–199)
3.369 414Moved from (5–19 to 1–4)—113Moved from (1–4 to 200+)
0.11 422Moved from (1–4 to 20–199)0.12 500Moved from (1–4 to 5–19)
94.61 987 015Did not change categories
%no.
Movements
Number of
businesses
changing
size
Di r e c t i on of Movemen t
TABLE 1. IMPACT UPON BUSINESS SIZE RANGE - DERIVEDEMPLOYMENT METHOD: 2013– 14
TO T A L IM P A C T ON BU S I N E S S
S I Z E RA N G E S continued
A B S • C O U N T S OF A U S T R A L I A N B U S I N E S S E S , I N C L U D I N G E N T R I E S A N D E X I T S • 8 1 6 5 . 0 • J U N 2 0 1 0 T O J U N 2 0 1 4 45
T E C H N I C A L N O T E 2 I M P R O V E D EM P L O Y M E N T RA N G E continued
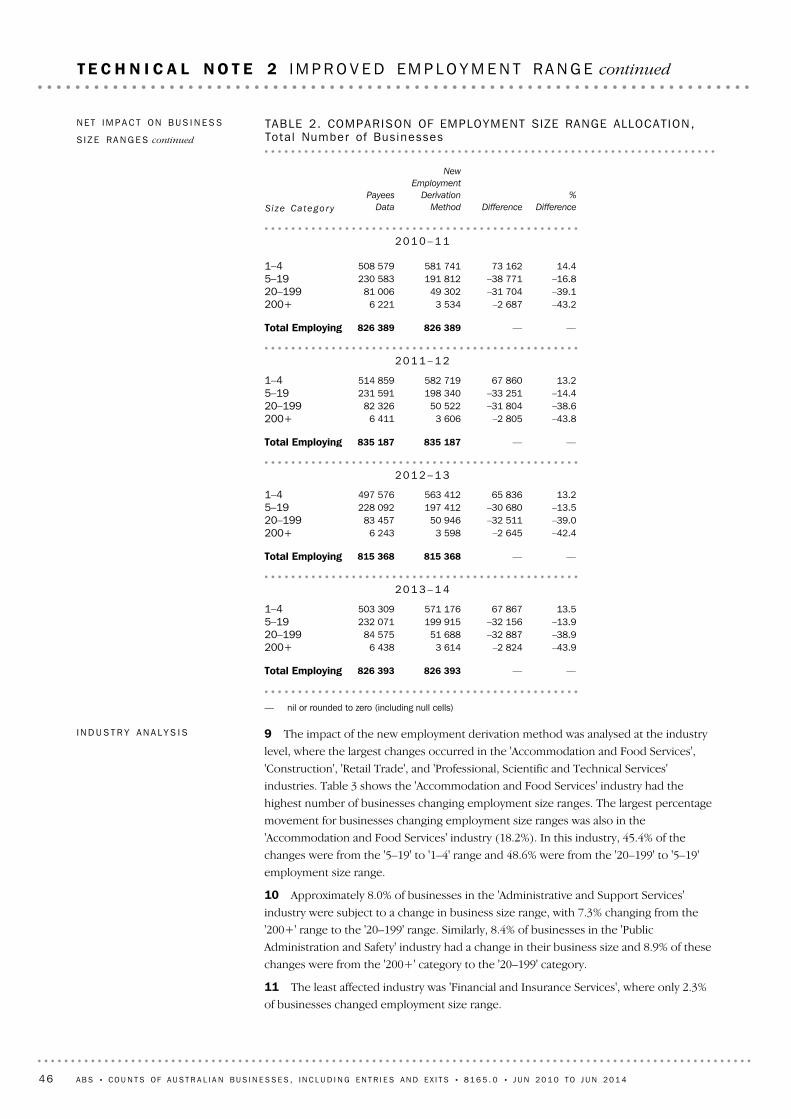
9 The impact of the new employment derivation method was analysed at the industry
level, where the largest changes occurred in the 'Accommodation and Food Services',
'Construction', 'Retail Trade', and 'Professional, Scientific and Technical Services'
industries. Table 3 shows the 'Accommodation and Food Services' industry had the
highest number of businesses changing employment size ranges. The largest percentage
movement for businesses changing employment size ranges was also in the
'Accommodation and Food Services' industry (18.2%). In this industry, 45.4% of the
changes were from the '5–19' to '1–4' range and 48.6% were from the '20–199' to '5–19'
employment size range.
10 Approximately 8.0% of businesses in the 'Administrative and Support Services'
industry were subject to a change in business size range, with 7.3% changing from the
'200+' range to the '20–199' range. Similarly, 8.4% of businesses in the 'Public
Administration and Safety' industry had a change in their business size and 8.9% of these
changes were from the '200+' category to the '20–199' category.
11 The least affected industry was 'Financial and Insurance Services', where only 2.3%
of businesses changed employment size range.
I N D U S T R Y AN A L Y S I S
— nil or rounded to zero (including null cells)
——826 393826 393Total Employing
–43.9–2 8243 6146 438200+–38.9–32 88751 68884 57520–199–13.9–32 156199 915232 0715–1913.567 867571 176503 3091–4
20 1 3 – 1 4
——815 368815 368Total Employing
–42.4–2 6453 5986 243200+–39.0–32 51150 94683 45720–199–13.5–30 680197 412228 0925–1913.265 836563 412497 5761–4
20 1 2 – 1 3
——835 187835 187Total Employing
–43.8–2 8053 6066 411200+–38.6–31 80450 52282 32620–199–14.4–33 251198 340231 5915–1913.267 860582 719514 8591–4
20 1 1 – 1 2
——826 389826 389Total Employing
–43.2–2 6873 5346 221200+–39.1–31 70449 30281 00620–199–16.8–38 771191 812230 5835–1914.473 162581 741508 5791–4
20 1 0 – 1 1
%
DifferenceDifference
New
Employment
Derivation
Method
Payees
DataSi ze Ca tego r y
TABLE 2. COMPARISON OF EMPLOYMENT SIZE RANGE ALLOCAT ION,Tota l Number of Bus inesses
NE T IM P A C T ON BU S I N E S S
S I Z E RA N G E S continued
46 A B S • C O U N T S OF A U S T R A L I A N B U S I N E S S E S , I N C L U D I N G E N T R I E S A N D E X I T S • 8 1 6 5 . 0 • J U N 2 0 1 0 T O J U N 2 0 1 4
T E C H N I C A L N O T E 2 I M P R O V E D EM P L O Y M E N T RA N G E continued

12 The business entries and exit subpopulations were also analysed to assess the
impact of the new employment derivation method, with the results presented in Tables
4 and 5 respectively. The impact on business entries and exits is consistent over time,
and also consistent with the impact on the total business stock, presented in Table 2.
13 Of the total business entries in the 2013–14 financial year (284,153), approximately
3.6% or 10,273 were impacted by the new employment derivation. The '1–4' employment
size range increased by approximately 10.6% across the four years analysed, with the
larger business size categories all decreasing. The '5–19', '20–199' and '200+' employment
ranges decreased in a manner consistent with the total business stock impacts presented
in Table 2. The '200+' category decreased by 384 businesses in 2013–14, with an average
decrease of 75.8% over the four years, however these large percentage changes reflect
the much smaller business counts in this size category.
AN A L Y S I S OF EN T R I E S
5.4113 147All Industries
3.41 488Currently UnknownX8.17 127Other ServicesS5.41 422Arts and Recreation ServicesR4.75 270Health Care and Social AssistanceQ8.12 134Education and TrainingP8.4616Public Administration and SafetyO8.06 304Administrative and Support ServicesN3.58 767Professional, Scientific and Technical ServicesM2.45 450Rental, Hiring and Real Estate ServicesL2.34 013Financial and Insurance ServicesK4.6886Information, Media and TelecommunicationsJ3.54 378Transport, Postal and WarehousingI
18.215 553Accommodation and Food ServicesH10.514 098Retail TradeG
5.94 467Wholesale TradeF4.414 997ConstructionE6.8402Electricity, Gas, Water and Waste ServicesD8.06 699ManufacturingC6.8563Mining B4.68 513Agriculture, Forestry and FishingA
% of
businesses
changing
size
Total
MovementLabe l
Indus t r y
Code
TABLE 3. IMPACT OF NEW EMPLOYMENT DERIVAT ION METHOD AT THEINDUSTRY LEVEL , Summary Ana lys i s : 2013– 14
I N D U S T R Y AN A L Y S I S continued
A B S • C O U N T S OF A U S T R A L I A N B U S I N E S S E S , I N C L U D I N G E N T R I E S A N D E X I T S • 8 1 6 5 . 0 • J U N 2 0 1 0 T O J U N 2 0 1 4 47
T E C H N I C A L N O T E 2 I M P R O V E D EM P L O Y M E N T RA N G E continued
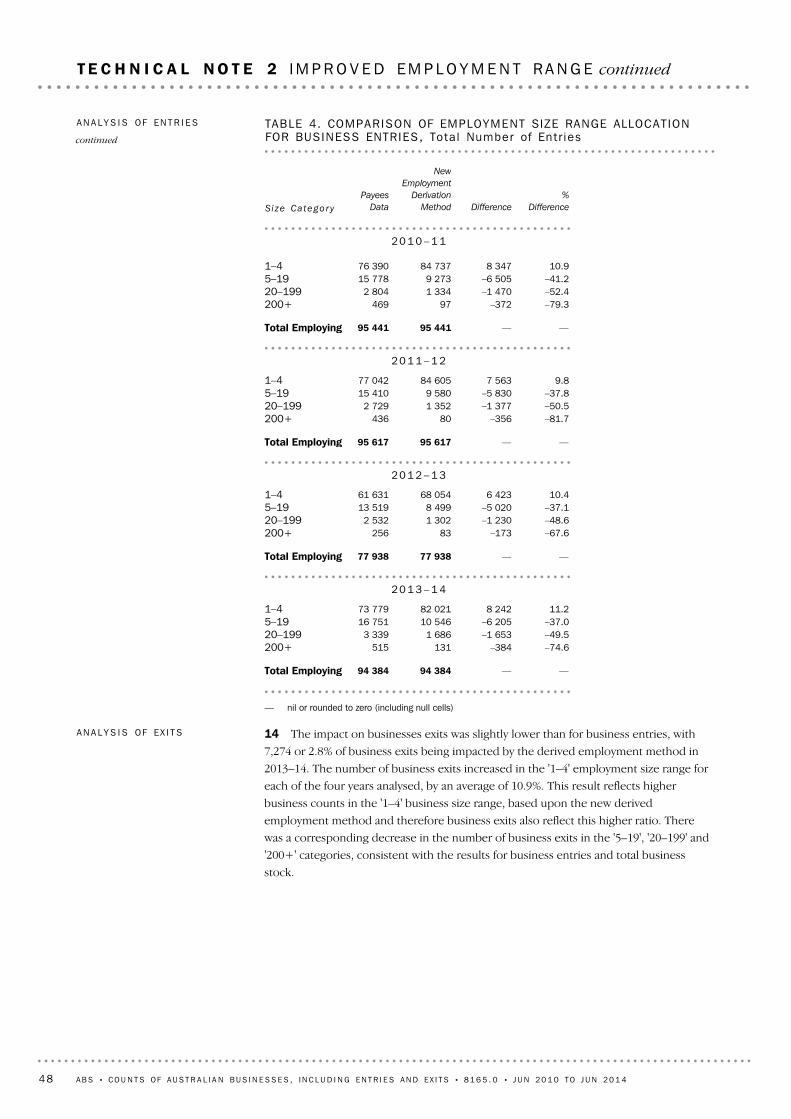
14 The impact on businesses exits was slightly lower than for business entries, with
7,274 or 2.8% of business exits being impacted by the derived employment method in
2013–14. The number of business exits increased in the '1–4' employment size range for
each of the four years analysed, by an average of 10.9%. This result reflects higher
business counts in the '1–4' business size range, based upon the new derived
employment method and therefore business exits also reflect this higher ratio. There
was a corresponding decrease in the number of business exits in the '5–19', '20–199' and
'200+' categories, consistent with the results for business entries and total business
stock.
AN A L Y S I S OF EX I T S
— nil or rounded to zero (including null cells)
——94 38494 384Total Employing
–74.6–384131515200+–49.5–1 6531 6863 33920–199–37.0–6 20510 54616 7515–1911.28 24282 02173 7791–4
20 1 3 – 1 4
——77 93877 938Total Employing
–67.6–17383256200+–48.6–1 2301 3022 53220–199–37.1–5 0208 49913 5195–1910.46 42368 05461 6311–4
20 1 2 – 1 3
——95 61795 617Total Employing
–81.7–35680436200+–50.5–1 3771 3522 72920–199–37.8–5 8309 58015 4105–19
9.87 56384 60577 0421–4
20 1 1 – 1 2
——95 44195 441Total Employing
–79.3–37297469200+–52.4–1 4701 3342 80420–199–41.2–6 5059 27315 7785–1910.98 34784 73776 3901–4
20 1 0 – 1 1
%
DifferenceDifference
New
Employment
Derivation
Method
Payees
DataSi ze Ca tego r y
TABLE 4. COMPARISON OF EMPLOYMENT SIZE RANGE ALLOCAT IONFOR BUSINESS ENTRIES, Tota l Number of Ent r ies
AN A L Y S I S OF EN T R I E S
continued
48 A B S • C O U N T S OF A U S T R A L I A N B U S I N E S S E S , I N C L U D I N G E N T R I E S A N D E X I T S • 8 1 6 5 . 0 • J U N 2 0 1 0 T O J U N 2 0 1 4
T E C H N I C A L N O T E 2 I M P R O V E D EM P L O Y M E N T RA N G E continued

15 There has been a relatively modest overall impact on the number of businesses
allocated to the various employment size categories resulting from the introduction of
the derived employment method (113,147 business or 5.4%). The impact is consistent
across existing businesses, business entries, business exits and consistent across time.
16 In light of these results, the ABS does not recommend comparing employment
based business size counts within this June 2010 to June 2014 release of CABEE, with
releases earlier than the June 2009 to June 2013 release of CABEE.
CO N C L U S I O N FO R US E R S
— nil or rounded to zero (including null cells)
——67 74267 742Total Employing
–45.1–166202368200+–43.3–1 5842 0753 65920–199–21.4–2 91810 72013 6385–19
9.34 66854 74550 0771–4
20 1 3 – 1 4
——73 24173 241Total Employing
–58.9–225157382200+–46.8–1 7231 9613 68420–199–24.3–3 73111 64415 3755–1910.65 67959 47953 8001–4
20 1 2 – 1 3
——66 53366 533Total Employing
–61.3–206130336200+–48.3–1 8221 9473 76920–199–25.7–3 65810 59514 2535–1911.85 68653 86148 1751–4
20 1 1 – 1 2
——66 87466 874Total Employing
–58.9–199139338200+–46.7–1 7451 9893 73420–199–26.6–3 87210 67614 5485–1912.15 81654 07048 2541–4
20 1 0 – 1 1
%
DifferenceDifference
New
Employment
Derivation
Method
Payees
DataSi ze Ca tego r y
TABLE 5. COMPARISON OF EMPLOYMENT SIZE RANGE ALLOCAT IONFOR BUSINESS EXITS , Tota l Number of Ex i ts
AN A L Y S I S OF EX I T S continued
A B S • C O U N T S OF A U S T R A L I A N B U S I N E S S E S , I N C L U D I N G E N T R I E S A N D E X I T S • 8 1 6 5 . 0 • J U N 2 0 1 0 T O J U N 2 0 1 4 49
T E C H N I C A L N O T E 2 I M P R O V E D EM P L O Y M E N T RA N G E continued

The ASGS is the new geographical framework used by the ABS. It brings together allregions for which the ABS publishes statistics within the one framework and will be usedfor the collection and dissemination of geographically classified statistics from 1 July2011.
The ASGS replaces the ASGC, which will no longer be produced. While there aresuperficial similarities between the ASGS and the ASGC, it is important to recognise thatthe two are fundamentally different and there are significant differences between theirrespective regions, both in their geographical extent and their conceptual foundation. Asa whole, the ASGS represents a more comprehensive, flexible and consistent way ofdefining Australia's statistical geography than the ASGC. For further information to assistusers move from the ASGC to the ASGS please refer to the ABS website<www.abs.gov.au/geography>.
With the move to the new geography framework, state based data will remainunchanged, however small area data will be affected, as it will now be produced usingthe new ASGS. In terms of business counts data, the base unit of the ASGS will be theStatistical Area Level 2 (SA2). This SA2 data will replace the previously published SLAbusiness counts data. Please refer to section entitled 'Statistical Area Level 2' for furtherinformation.
Australian StatisticalGeography Standard (ASGS)
The Australian Standard Geographical Classification (ASGC) is the formerclassification used to disseminate ABS business counts data. However, this has now beenreplaced by the Australian Statistical Geography Standard (ASGS). Please refer tosection entitled 'Australian Statistical Geography Standard' for further information.
Australian StandardGeographical Classification
(ASGC)
Businesses have been classified according to their description of activities. Businesses arecoded to industries in the Australian and New Zealand Standard IndustrialClassification 2006 (ANZSIC06) which is a classification system for grouping producingbusinesses (of both goods and services) in Australia and New Zealand to permitcomparability of data. Within ANZSIC, there is a structure comprising four levels rangingfrom industry division (broadest level) to the industry class (finest level). For moreinformation, users should refer to the Australian and New Zealand StandardIndustrial Classification 2006 (cat. no. 1292.0).
Australian and New ZealandStandard Industrial
Classification (ANZSIC)
The ABSBR is a register of all Australian businesses and contains identifying andclassificatory data for each business. Information to populate the ABSBR is largelysourced from the ABR. The ABSBR is used as a source for survey frames and counts.
The ABSBR consists of two sub populations, namely the profiled population and thenon-profiled population. The ABSBR uses an economic statistics unit model to describethe characteristics of businesses and the structural relationships between relatedbusinesses. For details, refer to paragraphs 6 to 10 of the Explanatory Notes.
Australian Bureau of StatisticsBusiness Register (ABSBR)
The Australian Business Number (ABN) is a unique business entity identifier introducedto assist with dealing with the Australian Government. An entity is entitled to an ABN if itmeets one of the following criteria:
it is carrying on an enterprise in Australiain the course of carrying on an enterprise, it makes supplies connected with Australiait has undertaken sufficient commencement activities for an enterprise.
The ABN is the statistical unit used to represent businesses, and for which statistics arereported, in most cases. The ABN unit is the business unit which has registered for anABN, and thus appears on the Australian Taxation Office (ATO) administered AustralianBusiness Register (ABR). In most cases, the ABN unit represents the legal entity. Thisunit is suitable for ABS statistical needs when the business is simple in structure. Formore significant and diverse businesses where the ABN unit is not suitable for ABSstatistical needs, the statistical unit used is the Type of Activity Unit (TAU).
Australian Business Number(ABN)
50 A B S • C O U N T S OF A U S T R A L I A N B U S I N E S S E S , I N C L U D I N G E N T R I E S A N D E X I T S • 8 1 6 5 . 0 • J U N 2 0 1 0 T O J U N 2 0 1 4
G L O S S A R Y

For the purposes of the CABEE publication, businesses are categorised as:Employment size ranges
The Client Activity Centre is the level where all client contact with the ATO happens. Forsmall businesses that have registered for GST purposes only, they will probably notrealise there is a difference between the ABN and the CAC. Most of the roles can beincluded in one CAC. The ATO determines how best to set the structure up for reportingpurposes.
Each ABN has at least one CAC attached to it, from which tax obligations are assessed. AClient Activity Centre (CAC) can have a number of roles with each role representing aspecific taxation obligation. There are eleven different roles:
DAFG – Diesel and alternative fuels grant scheme (invalid from July 2003)DCIP – Deferred Company Instalments PayerDGST – Deferred Goods and Services TaxEGCS – Energy Grants Credit Scheme (valid from July 2003, replaces DAFG and DFRS)FBTI – Fringe Benefits Tax InstalmentsFTCG – Fuel Tax Credit GrantGSTP – Goods & Services Tax PayerITIP – Income Tax Instalment PayerITW – Income Tax WithholdingLCTP – Luxury Car Tax PayerWETP – Wine Equalisation Tax Payer.
Client Activity Centre
A business for which the ABN or GST role has been cancelled and/or which has ceased toremit GST for at least five consecutive quarters (or three consecutive years for annualremitters) is considered a business exit. Business exit rates are calculated by taking thetotal business exits during the financial year, dividing by the total businesses operating atthe start of the financial year, then multiplying by 100.
It should be noted that a business exit event does not necessarily equate to a business'failure'. For details, refer to paragraphs 34–36 of the Explanatory Notes.
Business exit
A business which has newly registered for an ABN and which has a GST role allocated isconsidered a business entry. Business entry rates are calculated by taking the totalbusiness entries during a financial year, dividing by the total businesses operating at thestart of the financial year, then multiplying by 100.
Business entry
For the purposes of the Counts of Australian Businesses, including Entries and Exits(CABEE) publication, a business is defined as 'a legal entity engaging in productiveactivity and/or other forms of economic activity in the market sector. Such entitiesaccumulate assets on their own account and/or hold assets on behalf of others, and mayincur liabilities. Excluded are the economic activities of individuals (except whereindividuals engage in productive activity either as sole traders or in partnership) andentities mainly engaged in hobby activities'. For more information on the ABS definitionof a business, users should refer to Information Paper: A Statistical View of Counts ofBusinesses in Australia (cat. no. 8162.0).
In line with this definition, the business counts in this publication are derived from theABSBR. The starting point is all economically active entities in Australia. From here,various entities are excluded, such as those without an active ABN, those without anactive GST role, those no longer actively remitting Goods and Services Tax (GST) andthose not operating in the market sector. These exclusions aim to ensure that only thosebusinesses that are actively trading in the economy are included in the counts. Pleaserefer to the section entitled 'Conceptual and Practical Basis for Counts' of this publicationfor further information.
The statistical unit referred to as a 'business' consists of ABNs from the non-profiledpopulation and TAUs from the profiled population.
Business
A B S • C O U N T S OF A U S T R A L I A N B U S I N E S S E S , I N C L U D I N G E N T R I E S A N D E X I T S • 8 1 6 5 . 0 • J U N 2 0 1 0 T O J U N 2 0 1 4 51
G L O S S A R Y continued

The main business address of a business relates to the physical address where the mainbusiness activity takes place. The individual addresses of businesses with multiplelocations are not available.
Main business address
A business which employs and pays a salary to (or plans to employ and pay a salary to)one or more persons, is required to register as such with the ATO. These business arerequired to deduct payments from salaries and wages from their employees and send theamounts to the ATO. This is known as Pay As You Go (PAYG) tax.
ITW role
The count of surviving businesses that moved from one size range to another size rangein a financial year (i.e. an employment or turnover size range). This does not includeentries and exits.
Inflow
This is the broadest level category within an industry division of ANZSIC and isrecognised by a two digit code, e.g. Industry Subdivision 39 for Motor Vehicle and MotorVehicle Parts Retailing. Industry subdivisions are built up from industry groups which, inturn, are built up from industry classes.
Industry subdivision
This is the intermediate level within an industry division of ANZSIC and is recognised bya three digit code, e.g. Industry Group 391 for Motor Vehicle Retailing. It gives moredetail than the industry subdivision and is created in a way that groups like industryclasses together.
Industry group
The main purpose of the industry division level is to provide a limited number ofcategories which give a broad overall picture of the economy. There are 19 divisionswithin ANZSIC06 each identified by an alphabetical letter, that is, 'A' for Agriculture,Forestry and Fishing, 'B' for Mining, 'C' for Manufacturing, etc.
Industry division
At the industry class level, the activities of businesses are narrowly defined andrecognised by a four digit code, e.g. Industry Class 3911 for Car Retailing.
Industry class
See the entry for 'Australian and New Zealand Standard Industrial Classification'.Industry
A household is a group of persons who share the same living accommodation, who poolsome, or all, of their income and wealth and who consume certain types of goods andservices collectively, mainly housing and food. For additional information refer to Standard Economic Sector Classifications of Australia (SESCA) (cat. no. 1218.0).
Households
A business entity having a role in producing or distributing goods or providing services.GST role
This sector consists of all resident corporations and institutional units mainly engaged infinancial intermediation and provision of auxiliary financial services.
Financial corporations
employing businesses– businesses employing 200 or more people– businesses employing between 20 and 199 people– businesses employing between 5 and 19 people– businesses employing between 1 and 4 people
non-employing businesses.
The methods used to quantify employment for Australian businesses in ABS economicstatistics are based on the concept of a 'headcount', rather than a measure of Full TimeEquivalent persons. For further information, refer to paragraphs 53–57 in theExplanatory Notes.
In the non-profiled population, businesses with an active Income Tax Withholding (ITW)role are considered to be employing, resulting in some employing businesses havingzero employment.
Employing businesses in the non-profiled population that have not remitted BusinessActivity Statement (BAS) data for their ITW role for five consecutive quarters (or threeconsecutive years for annual remitters) prior to the reference period are deemed to belong term non-remitters. These businesses are counted as non-employing businesses.
Employment size rangescontinued
52 A B S • C O U N T S OF A U S T R A L I A N B U S I N E S S E S , I N C L U D I N G E N T R I E S A N D E X I T S • 8 1 6 5 . 0 • J U N 2 0 1 0 T O J U N 2 0 1 4
G L O S S A R Y continued
The Statistical Area Level 2 (SA2) is a general purpose spatial unit. It is the base spatialunit used to disseminate ABS business counts data, and replaces the previous StatisticalLocal Area (SLA). In aggregate, SA2s cover the whole of Australia without gaps oroverlaps.
Small area data cubes will be released using SA2 as the base spatial unit. The SA2 datacubes replace the previously published SLA based data cubes.
Statistical Area 2 (SA2)
SISCA is the central classification among ABS Standard Economic Sector Classifications. Itis based on the System of National Accounts 2008 (SNA08) institutional sectorclassification, and includes the following sectors: non-financial corporations, financialcorporations, general government, households, not for profit institutions servinghouseholds, and rest of the world (which includes only non-resident units, these beingexcluded from all other sectors). For more information, users should refer to the Standard Economic Sector Classifications of Australia (SESCA) (cat. no. 1218.0).
Standard Institutional SectorClassification of Australia
(SISCA)
Refers to a business which operates from locations in only one state or territory.Single state
The profiled population is one of two business populations of the ABSBR. Thispopulation is comprised of a relatively small number of businesses who have large,complex structures and the ABN unit is not suitable for ABS statistical purposes. As such,the ABS maintains its own unit structure through direct contact with these businesses. Inthe profiled population, a type of activity unit (TAU) equates to one business. For moredetails, refer to paragraphs 6 to 10 of the Explanatory Notes.
Profiled population
The count of surviving businesses that have moved out of a size range (i.e. anemployment or turnover size range) and into another size range. This does not includeentries and exits.
Outflow
The count of businesses operating at the beginning of the financial year, also referred toas 'opening stock'.
Operating at start of financialyear
The count of businesses operating at the end of the financial year, also referred to as'closing stock'.
Operating at end of financialyear
One of two business populations of the ABSBR. The vast majority of businesses are in thenon-profiled population. These businesses have simple structures and the unit registeredfor an ABN satisfies ABS statistical requirements. As such, one ABN equates to onebusiness. For more details, refer to paragraphs 6 to 10 of the Explanatory Notes.
Non-profiled population
This sector comprises all resident corporations and quasi-corporations mainly engaged inthe production of market goods and/or non-financial services.
Non-financial corporations
A business without an active Income Tax Withholding (ITW) role or which has notremitted ITW for five consecutive quarters (or three consecutive years for annualremitters).
Non-employing business
The net count of surviving businesses for each size range (i.e. employment or turnoversize ranges). The net movement of surviving businesses is calculated by taking the totalinflow at the end of the financial year minus the total outflow at the end of the financialyear.
Net movement of survivingbusinesses
Refers to those businesses which operate from locations in more than one state orterritory.
Multi state
For businesses in the non-profiled population, main state refers to the state or territoryof the main business address. For businesses in the profiled population, main state refersto the state or territory where the business has the highest employment.
Main state
A B S • C O U N T S OF A U S T R A L I A N B U S I N E S S E S , I N C L U D I N G E N T R I E S A N D E X I T S • 8 1 6 5 . 0 • J U N 2 0 1 0 T O J U N 2 0 1 4 53
G L O S S A R Y continued
An unincorporated entity is an entity which has not become a corporation under theCorporations Act 2001. Unincorporated entities can choose to remain 'unincorporated',whereby the business does not possess a separate legal identity to that of its owner(s), orit can choose the limited liability status of a company where the business assets arelegally separate to that of the owner(s).
Unincorporated entity
All legal entities on the ABSBR are classified according to their Type of LegalOrganisation (TOLO). Examples of types of legal entities recognised for statisticalpurposes are companies, partnerships, trusts, sole proprietorships, governmentdepartments and statutory authorities. TOLO indicates whether a business is part of theprivate or public sector, and the type of ownership structure it has.
Type of Legal Organisation(TOLO)
The TAU, residing in the profiled population, is comprised of one or more businessentities, sub entities or branches of a business entity within an enterprise group. Theseentities can report production and employment data for similar economic activities whena minimum set of data items are available. For further information, refer to paragraphs6–10 of the Explanatory Notes.
Type of activity unit (TAU)
The total revenue generated by a business from the provision of goods and/or servicesfor a given accounting period.
Turnover
A business which was actively trading at 30 June in the reference year and continuedtrading to 30 June in the following year is considered a surviving business.
Surviving business
The SLA is the former base spatial unit used to disseminate ABS business counts data.However, with the move to the new ASGS, SLA business counts data will no longer beproduced. Instead, the base spatial unit will be that of the SA2. Please refer to thesections entitled 'Australian Statistical Geography Standard' and 'Statistical Area Level 2'for further information.
Statistical Local Area (SLA)
54 A B S • C O U N T S OF A U S T R A L I A N B U S I N E S S E S , I N C L U D I N G E N T R I E S A N D E X I T S • 8 1 6 5 . 0 • J U N 2 0 1 0 T O J U N 2 0 1 4
G L O S S A R Y continued


www.abs.gov.auWEB ADDRESS
All statistics on the ABS website can be downloaded freeof charge.
F R E E A C C E S S T O S T A T I S T I C S
Client Services, ABS, GPO Box 796, Sydney NSW 2001POST
1300 135 211FAX
1300 135 070PHONE
Our consultants can help you access the full range ofinformation published by the ABS that is available free ofcharge from our website. Information tailored to yourneeds can also be requested as a 'user pays' service.Specialists are on hand to help you with analytical ormethodological advice.
I N F O R M A T I O N A N D R E F E R R A L S E R V I C E
www.abs.gov.au the ABS website is the best place fordata from our publications and information about the ABS.
INTERNET
F O R M O R E I N F O R M A T I O N . . .
© Commonwealth of Australia 2015Produced by the Australian Bureau of Statistics
81
65
.0
•
CO
UN
TS
O
F A
US
TR
AL
IA
N
BU
SI
NE
SS
ES
, IN
CL
UD
IN
G
EN
TR
IE
S
AN
D
EX
IT
S,
AU
ST
RA
LI
A
• J
un
e
20
10
to J
un
e 2
01
4
ISSN 1833–7503