Embed Size (px)
Citation preview
Country Snapshots (Click here for Notes)Quick Links: USA JPN GBR IRL FRA GER ITA RUS SWE
CHN IND KOR THA TUR / ARG BRA MEX / BWA ETH KEN NGA
AfghanistanAlbaniaAlgeriaAndorraAngolaNetherlands AntillesArgentinaArubaArmeniaAmerican SamoaAntiguaAustraliaAustriaAzerbaijanBurundiBelgiumBeninBurkina FasoBangladeshBulgariaBahrainBahamasBosnia and HerzegovinaBelarusBelizeBermudaBoliviaBrazilBarbadosBruneiBhutanBotswanaCentral African RepublicCanadaChannel IslandsChileChinaCote d Ivoire
CameroonCongo, Republic ofColombiaComorosCape VerdeCosta RicaCubaCayman IslandsCyprusCzech RepublicDjiboutiDominicaDenmarkDominican RepublicEcuadorEgyptEl SalvadorEritreaEstoniaEthiopiaFinlandFijiFranceFaeroe IslandsMicronesia, Fed. Sts.GabonUnited KingdomGeorgiaGermanyGhanaGuineaGambia, TheGuinea-BissauEquatorial GuineaGreeceGrenadaGreenlandGuatemala
GuamGuyanaHong KongHondurasCroatiaHaitiHungaryIndonesiaIsle of ManIndiaIrelandIranIraqIcelandIsraelItalyJamaicaJordanJapanKazakhstanKenyaKyrgyzstanCambodiaKiribatiSt. Kitts NevisKorea, NorthKorea, SouthKuwaitLaosLebanonLiberiaLibyaSt. LuciaLiechtensteinSri LankaLesothoLithuaniaLuxembourg
1
LatviaMacaoMoroccoMonacoMoldovaMadagascarMaldivesMexicoMarshall IslandsMacedoniaMaliMaltaMyanmarMongoliaNorthern Mariana IslandsMozambiqueMauritaniaMauritiusMalawiMalaysiaMayotteNamibiaNew CaledoniaNigerNigeriaNicaraguaNetherlandsNorwayNepalNew ZealandOmanPakistan
PanamaPeruPhilippinesPalauPapua New GuineaPolandPuerto RicoPortugalParaguayFrench PolynesiaQatarRomaniaRussiaRwandaSaudi ArabiaSudanSenegalSingaporeSolomon IslandsSierra LeoneSan MarinoSomaliaSao Tome and PrincipeSurinameSlovak RepublicSloveniaSpainSwedenSwazilandSwitzerlandSeychellesSyria
ChadTogoThailandTajikistanTurkmenistanTongaTrinidad + TobagoTunisiaTurkeyTaiwanTanzaniaUgandaUkraineUruguayUnited Arab EmiratesUnited StatesUzbekistanSt.Vincent + GrenadinesVenezuelaVirgin Islands (U.S.)VietnamVanuatuWest Bank and GazaSamoaYemenYugoslaviaSouth AfricaCongo, Dem. Rep.ZambiaZimbabwe
2
Notes on the figures and sources, etc.Charles I. Jones
Department of Economics, U.C. Berkeleyhttp://elsa.berkeley.edu/˜chad
August 24, 2005
Notes
• From a country page, click on the country name to return to the main index page.
• From a country page, click on (data) in order to open a xls spreadsheet file of the datafor that particular country. This file is an an older Excel format that any spreadsheetprogram should be able to read (in fact, you can set up your web browser’s preferencesto open the .xls file with your spreadsheet program automatically). The notes belowalso apply to the data file. “NaN” in the file denotes a missing observation.
• The first graph of GDP per capita and GDP per worker is drawn on a “ratio scale” (alsocalled a “log scale”). For all countries other than the United States, values are relativeto the United States (US=100). For the United States, these variables are reported inchained 1996 international dollars.
• The titles to the graphs include a value for each variable in parentheses. This is themost recent value available for each series (often corresponding to the year 2000).
• Population is reported for the most recent year available in millions next to the countryname.
• The growth rate in the second graph is for per capita GDP; in the spreadsheet file, it iscalculated as the percentage change.
• In graphs with 2 data series, the title lists the name of the two series. The first titlecorresponds to the solid blue line. The second title corresponds to the green dashedline.
• The ratios of investment to GDP (I/Y) and government purchases to GDP (G/Y) arebased on the constant-price series in the Penn World Tables. The trade balance (NX/Y)and total trade share (X+M/Y) are based on the current price series.
• All of the Penn World Tables variables (which is all other than educational attainment)are in international prices. This means the variables will differ from the correspondingvariables from country national accounts data.
• Additional copies of this file and a history of changes may be obtained fromhttp://elsa.berkeley.edu/˜chad/snapshots.html
(continued next page)3
Sources
• Data on all variables other than educational attainment are taken from the Penn WorldTables: Alan Heston, Robert Summers and Bettina Aten, Penn World Table Version6.1, Center for International Comparisons at the University of Pennsylvania (CICUP),October 2002. http://pwt.econ.upenn.edu/
• Data on educational attainment is from Barro, Robert J. and Jong-Wha Lee, Interna-tional Data on Educational Attainment: Updates and Implications (CID Working Paperno. 42) April 2000. http://www.cid.harvard.edu/ciddata/ciddata.html
4
Aruba (Population = NaNm) (data)
0 0.2 0.4 0.6 0.8 1 1
2
4 6 8
12 16 24 32 40 50 60 70 80 90100120
GDP Per Capita ( NaN) and Per Worker ( NaN)
1950 1960 1970 1980 1990 20000
0.2
0.4
0.6
0.8
1Growth Rate (Average is NaN)
1950 1960 1970 1980 1990 20000
0.2
0.4
0.6
0.8
1Investment/GDP ( NaN) and GovtPurchases/GDP ( NaN)
1960 1970 1980 1990 20000
0.2
0.4
0.6
0.8
1Educational Attainment ( NaN years)
1950 1960 1970 1980 1990 20000
0.2
0.4
0.6
0.8
1NetExports/GDP ( NaN) and X+M/GDP ( NaN)
1950 1960 1970 1980 1990 20000
0.2
0.4
0.6
0.8
1
1950 1960 1970 1980 1990 20000
0.2
0.4
0.6
0.8
1Exchange Rate per Dollar ( NaN)
5

Andorra (Population = 0.0m) (data)
0 0.2 0.4 0.6 0.8 11
GDP Per Capita ( 0.0) and Per Worker ( 0.0)
1950 1960 1970 1980 1990 20000
0.2
0.4
0.6
0.8
1Growth Rate (Average is NaN)
1950 1960 1970 1980 1990 2000−1
−0.5
0
0.5
1Investment/GDP ( 0.0) and GovtPurchases/GDP ( 0.0)
1960 1970 1980 1990 20000
0.2
0.4
0.6
0.8
1Educational Attainment ( NaN years)
1950 1960 1970 1980 1990 200099
99.5
100
100.5
101NetExports/GDP (100.0) and X+M/GDP ( 0.0)
1950 1960 1970 1980 1990 2000−1
−0.5
0
0.5
1
1950 1960 1970 1980 1990 2000−1
−0.5
0
0.5
1Exchange Rate per Dollar ( 0.00)
6
Afghanistan (Population = 0.0m) (data)
0 0.2 0.4 0.6 0.8 11
GDP Per Capita ( 0.0) and Per Worker ( 0.0)
1950 1960 1970 1980 1990 20000
0.2
0.4
0.6
0.8
1Growth Rate (Average is NaN)
1950 1960 1970 1980 1990 2000−1
−0.5
0
0.5
1Investment/GDP ( 0.0) and GovtPurchases/GDP ( 0.0)
1960 1970 1980 1990 20000
0.2
0.4
0.6
0.8
1Educational Attainment ( NaN years)
1950 1960 1970 1980 1990 200099
99.5
100
100.5
101NetExports/GDP (100.0) and X+M/GDP ( 0.0)
1950 1960 1970 1980 1990 2000−1
−0.5
0
0.5
1
1950 1960 1970 1980 1990 2000−1
−0.5
0
0.5
1Exchange Rate per Dollar ( 0.00)
7
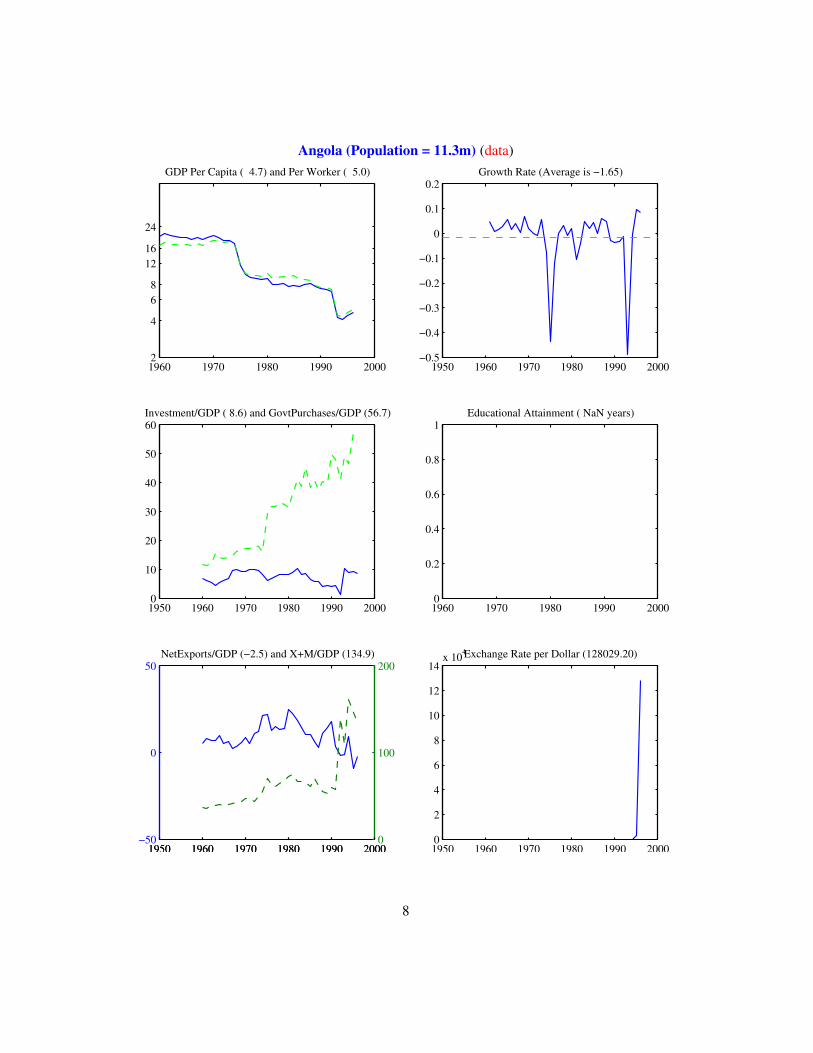
Angola (Population = 11.3m) (data)
1960 1970 1980 1990 2000 2
4
6 8
1216
24
GDP Per Capita ( 4.7) and Per Worker ( 5.0)
1950 1960 1970 1980 1990 2000−0.5
−0.4
−0.3
−0.2
−0.1
0
0.1
0.2Growth Rate (Average is −1.65)
1950 1960 1970 1980 1990 20000
10
20
30
40
50
60Investment/GDP ( 8.6) and GovtPurchases/GDP (56.7)
1960 1970 1980 1990 20000
0.2
0.4
0.6
0.8
1Educational Attainment ( NaN years)
1950 1960 1970 1980 1990 2000−50
0
50NetExports/GDP (−2.5) and X+M/GDP (134.9)
1950 1960 1970 1980 1990 20000
100
200
1950 1960 1970 1980 1990 20000
2
4
6
8
10
12
14x 104Exchange Rate per Dollar (128029.20)
8
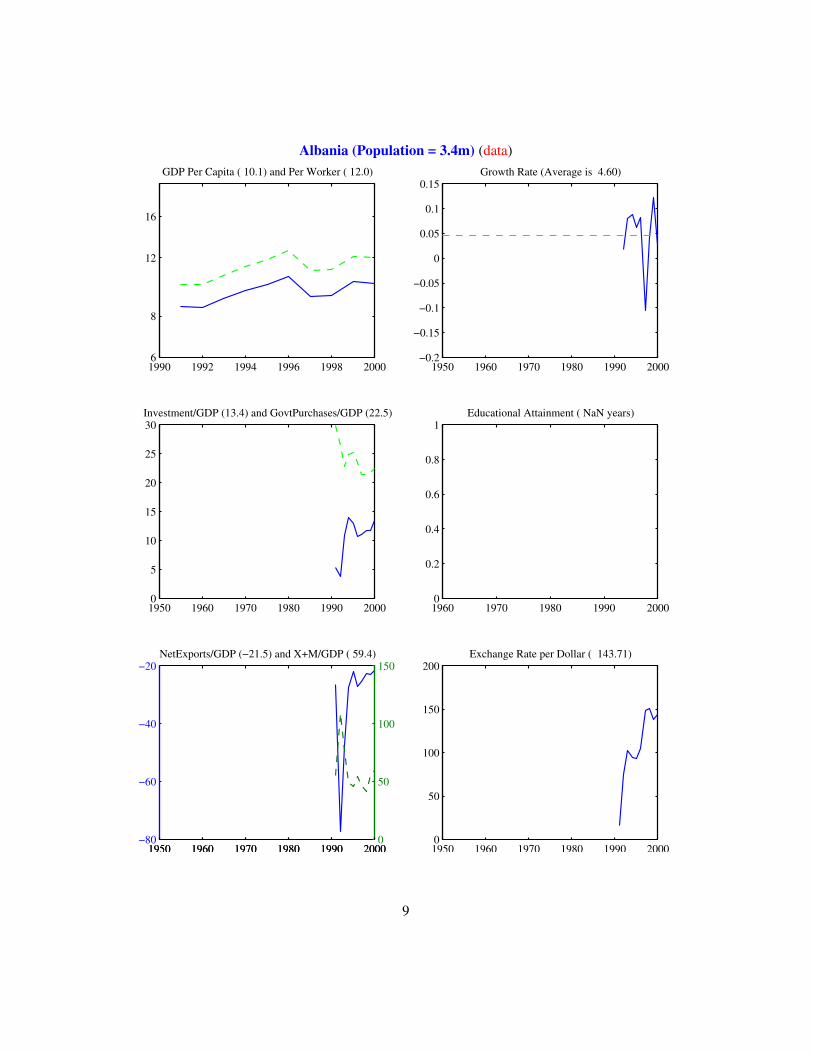
Albania (Population = 3.4m) (data)
1990 1992 1994 1996 1998 2000 6
8
12
16
GDP Per Capita ( 10.1) and Per Worker ( 12.0)
1950 1960 1970 1980 1990 2000−0.2
−0.15
−0.1
−0.05
0
0.05
0.1
0.15Growth Rate (Average is 4.60)
1950 1960 1970 1980 1990 20000
5
10
15
20
25
30Investment/GDP (13.4) and GovtPurchases/GDP (22.5)
1960 1970 1980 1990 20000
0.2
0.4
0.6
0.8
1Educational Attainment ( NaN years)
1950 1960 1970 1980 1990 2000−80
−60
−40
−20NetExports/GDP (−21.5) and X+M/GDP ( 59.4)
1950 1960 1970 1980 1990 20000
50
100
150
1950 1960 1970 1980 1990 20000
50
100
150
200Exchange Rate per Dollar ( 143.71)
9
Netherlands Antilles (Population = 0.0m) (data)
0 0.2 0.4 0.6 0.8 11
GDP Per Capita ( 0.0) and Per Worker ( 0.0)
1950 1960 1970 1980 1990 20000
0.2
0.4
0.6
0.8
1Growth Rate (Average is NaN)
1950 1960 1970 1980 1990 2000−1
−0.5
0
0.5
1Investment/GDP ( 0.0) and GovtPurchases/GDP ( 0.0)
1960 1970 1980 1990 20000
0.2
0.4
0.6
0.8
1Educational Attainment ( NaN years)
1950 1960 1970 1980 1990 200099
99.5
100
100.5
101NetExports/GDP (100.0) and X+M/GDP ( 0.0)
1950 1960 1970 1980 1990 2000−1
−0.5
0
0.5
1
1950 1960 1970 1980 1990 2000−1
−0.5
0
0.5
1Exchange Rate per Dollar ( 0.00)
10
United Arab Emirates (Population = 0.0m) (data)
0 0.2 0.4 0.6 0.8 11
GDP Per Capita ( 0.0) and Per Worker ( 0.0)
1950 1960 1970 1980 1990 20000
0.2
0.4
0.6
0.8
1Growth Rate (Average is NaN)
1950 1960 1970 1980 1990 2000−1
−0.5
0
0.5
1Investment/GDP ( 0.0) and GovtPurchases/GDP ( 0.0)
1960 1970 1980 1990 20001.5
2
2.5
3
3.5
4Educational Attainment ( 2.9 years)
1950 1960 1970 1980 1990 200099
99.5
100
100.5
101NetExports/GDP (100.0) and X+M/GDP ( 0.0)
1950 1960 1970 1980 1990 2000−1
−0.5
0
0.5
1
1950 1960 1970 1980 1990 2000−1
−0.5
0
0.5
1Exchange Rate per Dollar ( 0.00)
11
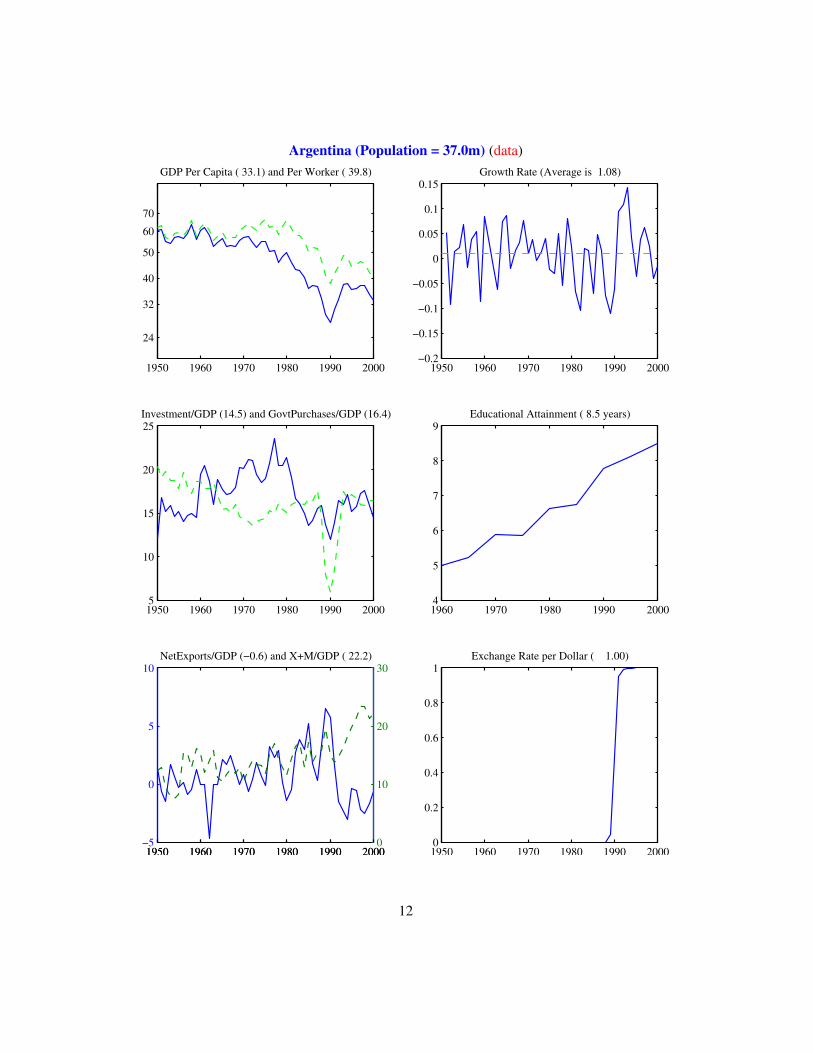
Argentina (Population = 37.0m) (data)
1950 1960 1970 1980 1990 2000
24
32
40
50
60
70
GDP Per Capita ( 33.1) and Per Worker ( 39.8)
1950 1960 1970 1980 1990 2000−0.2
−0.15
−0.1
−0.05
0
0.05
0.1
0.15Growth Rate (Average is 1.08)
1950 1960 1970 1980 1990 20005
10
15
20
25Investment/GDP (14.5) and GovtPurchases/GDP (16.4)
1960 1970 1980 1990 20004
5
6
7
8
9Educational Attainment ( 8.5 years)
1950 1960 1970 1980 1990 2000−5
0
5
10NetExports/GDP (−0.6) and X+M/GDP ( 22.2)
1950 1960 1970 1980 1990 20000
10
20
30
1950 1960 1970 1980 1990 20000
0.2
0.4
0.6
0.8
1Exchange Rate per Dollar ( 1.00)
12
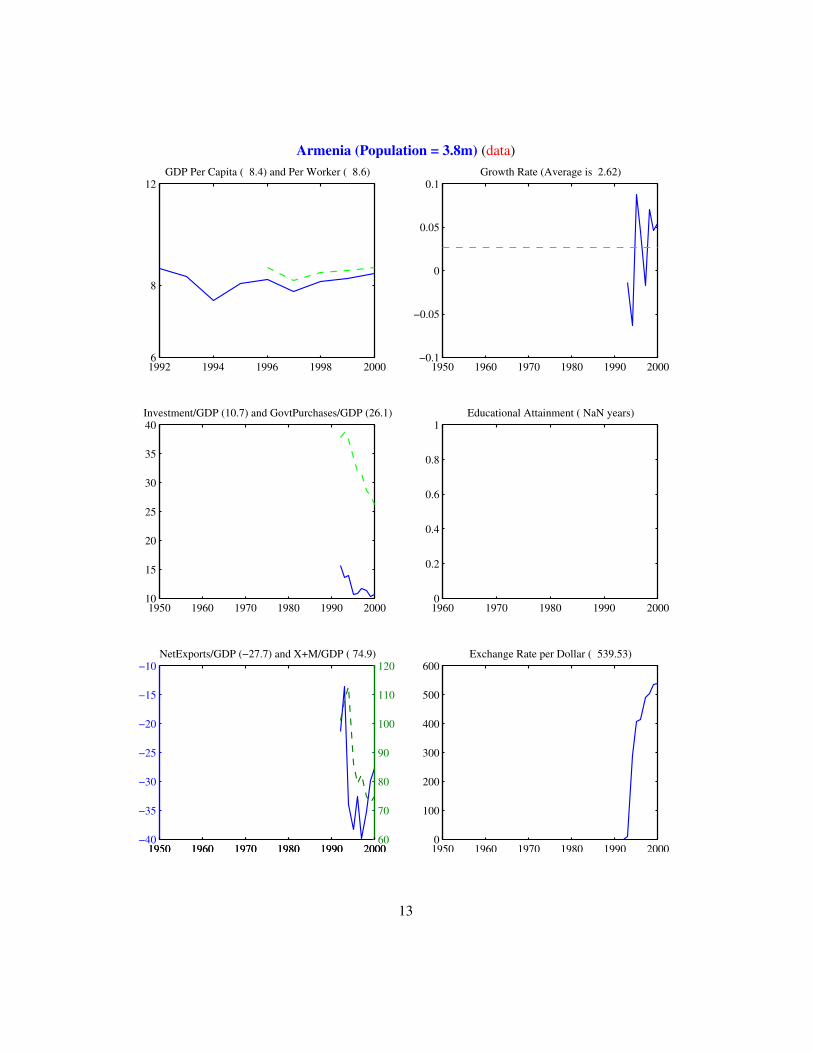
Armenia (Population = 3.8m) (data)
1992 1994 1996 1998 2000 6
8
12GDP Per Capita ( 8.4) and Per Worker ( 8.6)
1950 1960 1970 1980 1990 2000−0.1
−0.05
0
0.05
0.1Growth Rate (Average is 2.62)
1950 1960 1970 1980 1990 200010
15
20
25
30
35
40Investment/GDP (10.7) and GovtPurchases/GDP (26.1)
1960 1970 1980 1990 20000
0.2
0.4
0.6
0.8
1Educational Attainment ( NaN years)
1950 1960 1970 1980 1990 2000−40
−35
−30
−25
−20
−15
−10NetExports/GDP (−27.7) and X+M/GDP ( 74.9)
1950 1960 1970 1980 1990 200060
70
80
90
100
110
120
1950 1960 1970 1980 1990 20000
100
200
300
400
500
600Exchange Rate per Dollar ( 539.53)
13
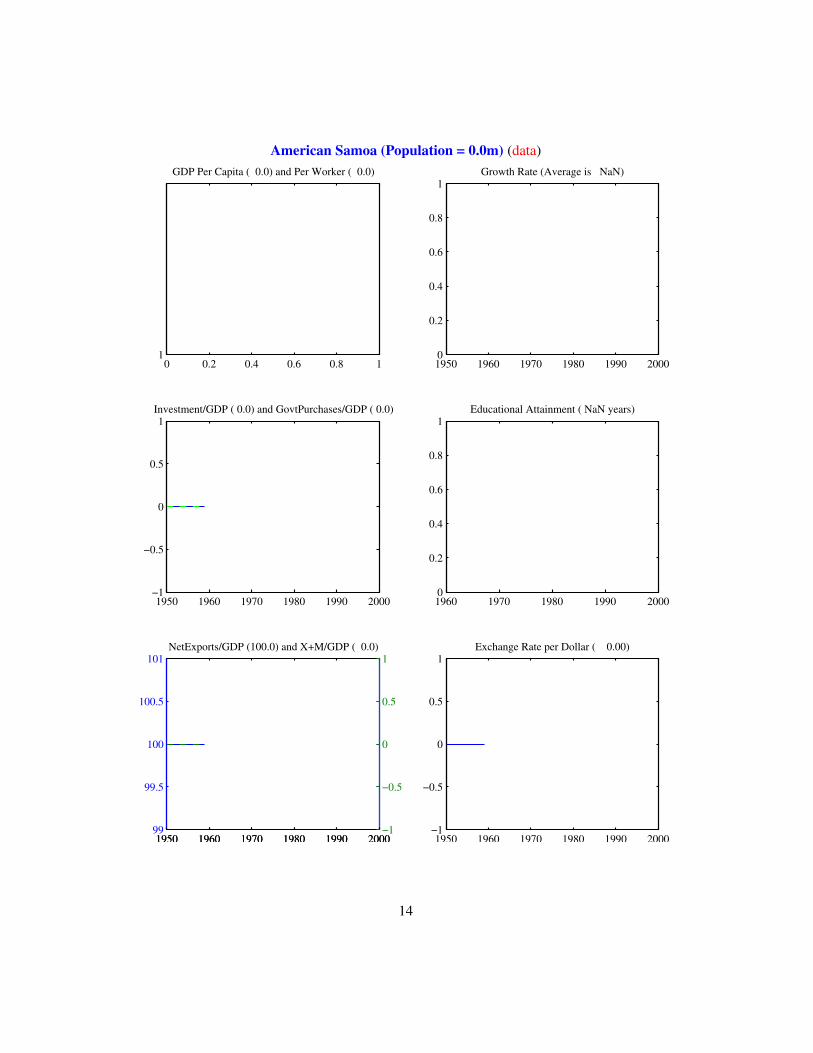
American Samoa (Population = 0.0m) (data)
0 0.2 0.4 0.6 0.8 11
GDP Per Capita ( 0.0) and Per Worker ( 0.0)
1950 1960 1970 1980 1990 20000
0.2
0.4
0.6
0.8
1Growth Rate (Average is NaN)
1950 1960 1970 1980 1990 2000−1
−0.5
0
0.5
1Investment/GDP ( 0.0) and GovtPurchases/GDP ( 0.0)
1960 1970 1980 1990 20000
0.2
0.4
0.6
0.8
1Educational Attainment ( NaN years)
1950 1960 1970 1980 1990 200099
99.5
100
100.5
101NetExports/GDP (100.0) and X+M/GDP ( 0.0)
1950 1960 1970 1980 1990 2000−1
−0.5
0
0.5
1
1950 1960 1970 1980 1990 2000−1
−0.5
0
0.5
1Exchange Rate per Dollar ( 0.00)
14
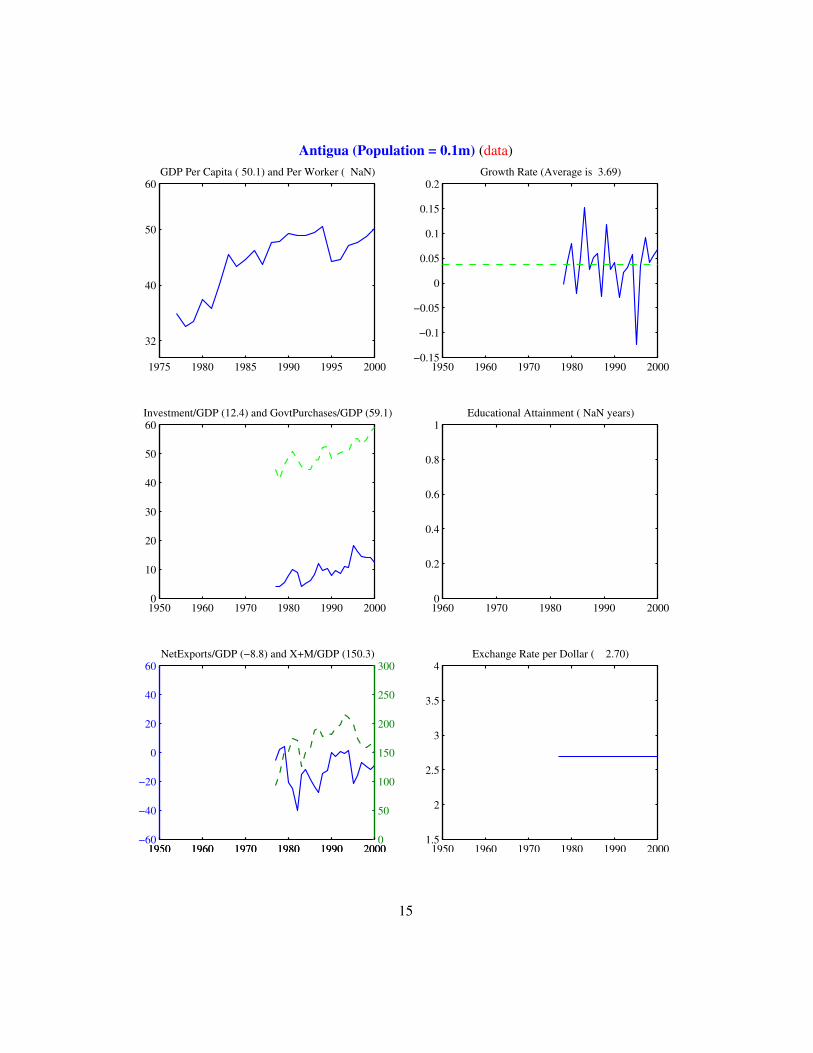
Antigua (Population = 0.1m) (data)
1975 1980 1985 1990 1995 2000
32
40
50
60GDP Per Capita ( 50.1) and Per Worker ( NaN)
1950 1960 1970 1980 1990 2000−0.15
−0.1
−0.05
0
0.05
0.1
0.15
0.2Growth Rate (Average is 3.69)
1950 1960 1970 1980 1990 20000
10
20
30
40
50
60Investment/GDP (12.4) and GovtPurchases/GDP (59.1)
1960 1970 1980 1990 20000
0.2
0.4
0.6
0.8
1Educational Attainment ( NaN years)
1950 1960 1970 1980 1990 2000−60
−40
−20
0
20
40
60NetExports/GDP (−8.8) and X+M/GDP (150.3)
1950 1960 1970 1980 1990 20000
50
100
150
200
250
300
1950 1960 1970 1980 1990 20001.5
2
2.5
3
3.5
4Exchange Rate per Dollar ( 2.70)
15
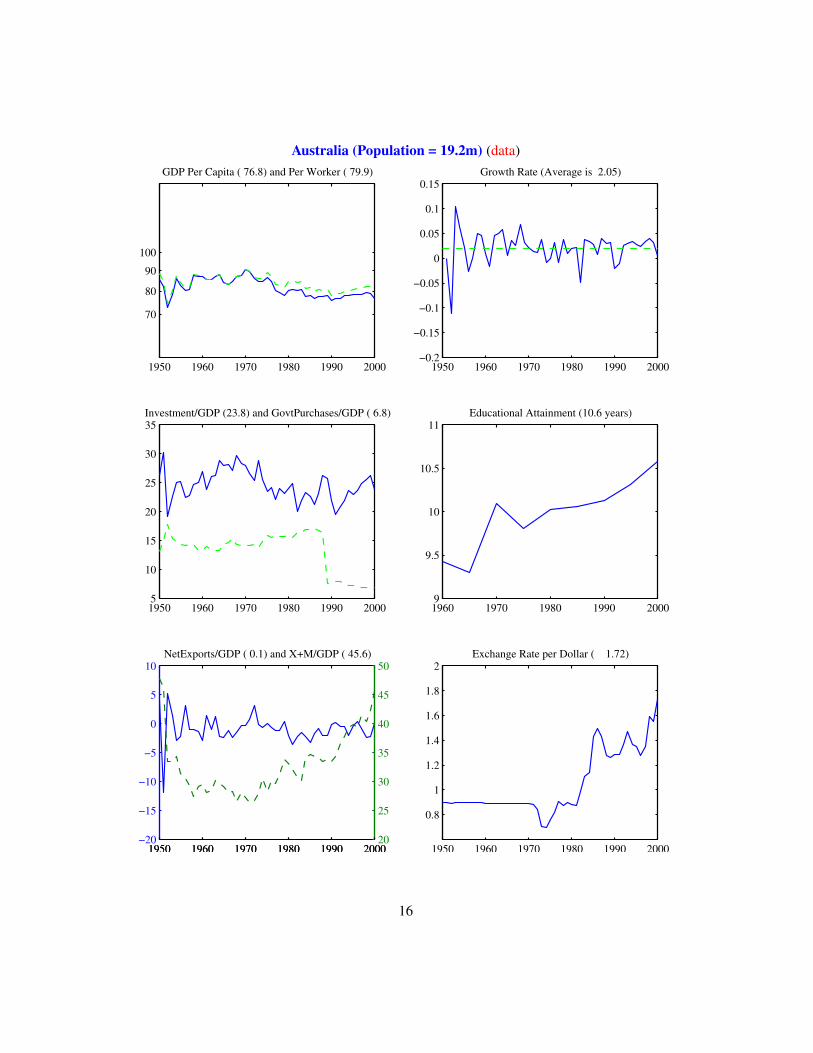
Australia (Population = 19.2m) (data)
1950 1960 1970 1980 1990 2000
70
80
90
100
GDP Per Capita ( 76.8) and Per Worker ( 79.9)
1950 1960 1970 1980 1990 2000−0.2
−0.15
−0.1
−0.05
0
0.05
0.1
0.15Growth Rate (Average is 2.05)
1950 1960 1970 1980 1990 20005
10
15
20
25
30
35Investment/GDP (23.8) and GovtPurchases/GDP ( 6.8)
1960 1970 1980 1990 20009
9.5
10
10.5
11Educational Attainment (10.6 years)
1950 1960 1970 1980 1990 2000−20
−15
−10
−5
0
5
10NetExports/GDP ( 0.1) and X+M/GDP ( 45.6)
1950 1960 1970 1980 1990 200020
25
30
35
40
45
50
1950 1960 1970 1980 1990 2000
0.8
1
1.2
1.4
1.6
1.8
2Exchange Rate per Dollar ( 1.72)
16
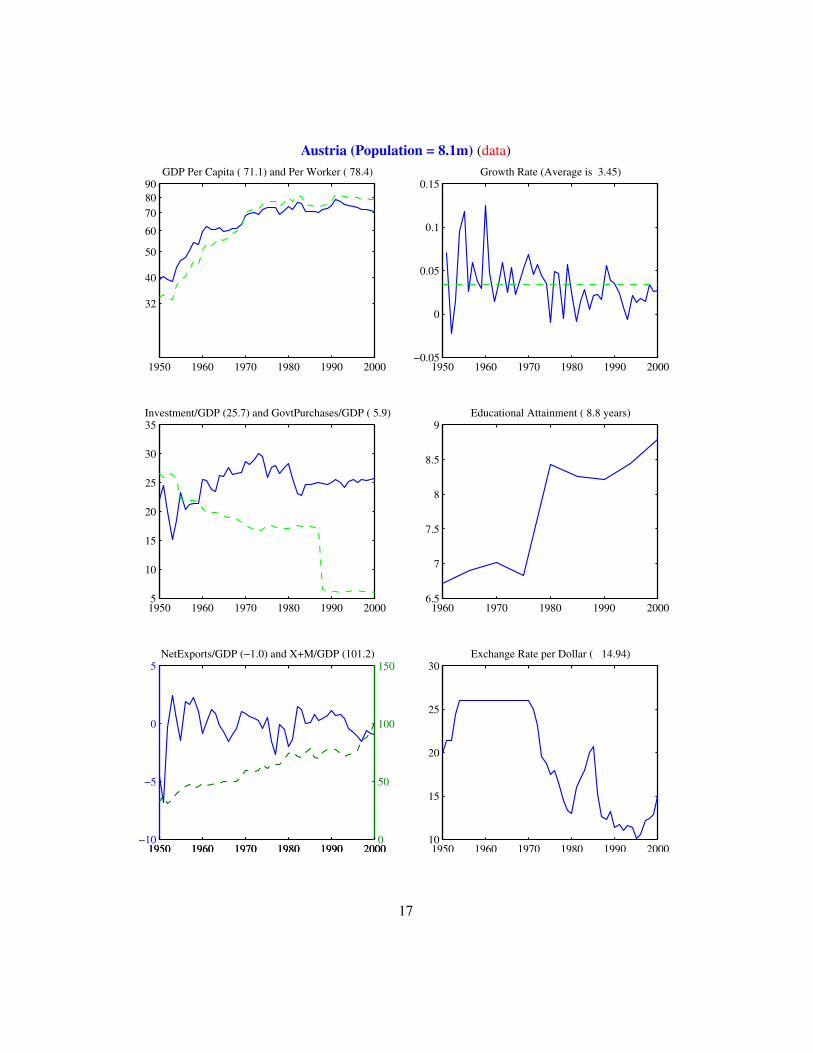
Austria (Population = 8.1m) (data)
1950 1960 1970 1980 1990 2000
32
40
50
60
708090
GDP Per Capita ( 71.1) and Per Worker ( 78.4)
1950 1960 1970 1980 1990 2000−0.05
0
0.05
0.1
0.15Growth Rate (Average is 3.45)
1950 1960 1970 1980 1990 20005
10
15
20
25
30
35Investment/GDP (25.7) and GovtPurchases/GDP ( 5.9)
1960 1970 1980 1990 20006.5
7
7.5
8
8.5
9Educational Attainment ( 8.8 years)
1950 1960 1970 1980 1990 2000−10
−5
0
5NetExports/GDP (−1.0) and X+M/GDP (101.2)
1950 1960 1970 1980 1990 20000
50
100
150
1950 1960 1970 1980 1990 200010
15
20
25
30Exchange Rate per Dollar ( 14.94)
17
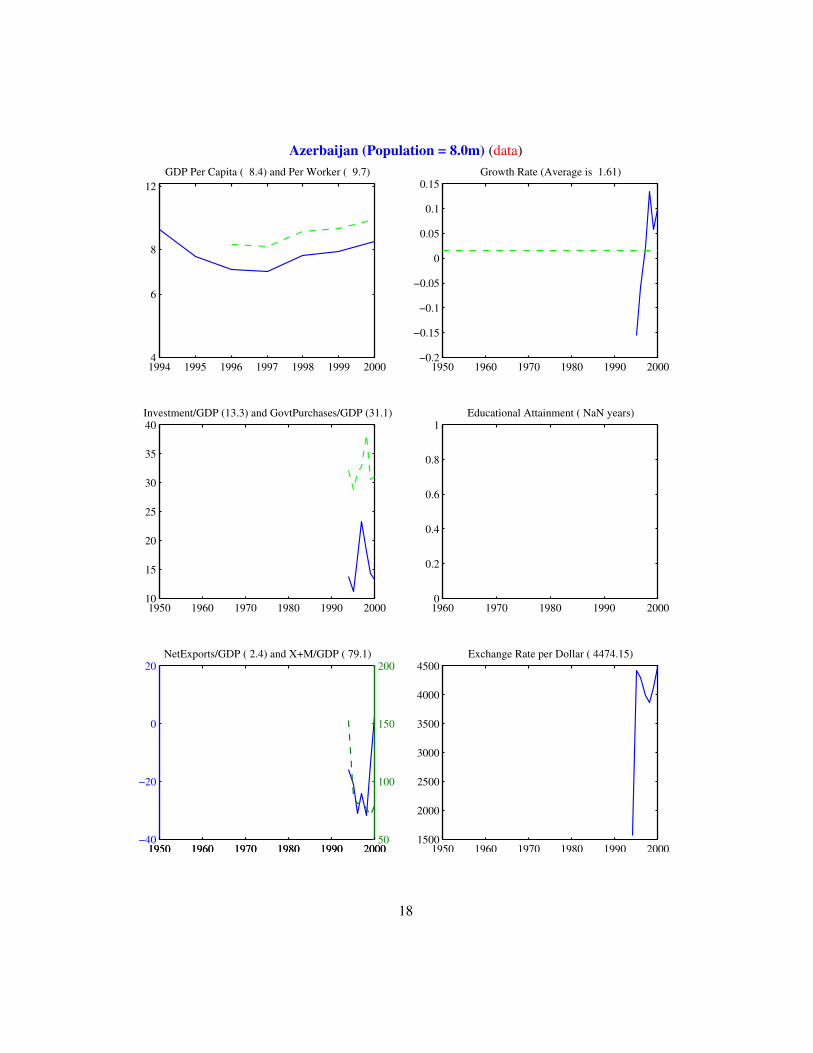
Azerbaijan (Population = 8.0m) (data)
1994 1995 1996 1997 1998 1999 2000 4
6
8
12GDP Per Capita ( 8.4) and Per Worker ( 9.7)
1950 1960 1970 1980 1990 2000−0.2
−0.15
−0.1
−0.05
0
0.05
0.1
0.15Growth Rate (Average is 1.61)
1950 1960 1970 1980 1990 200010
15
20
25
30
35
40Investment/GDP (13.3) and GovtPurchases/GDP (31.1)
1960 1970 1980 1990 20000
0.2
0.4
0.6
0.8
1Educational Attainment ( NaN years)
1950 1960 1970 1980 1990 2000−40
−20
0
20NetExports/GDP ( 2.4) and X+M/GDP ( 79.1)
1950 1960 1970 1980 1990 200050
100
150
200
1950 1960 1970 1980 1990 20001500
2000
2500
3000
3500
4000
4500Exchange Rate per Dollar ( 4474.15)
18

Burundi (Population = 6.8m) (data)
1960 1970 1980 1990 2000
2
4
6
8GDP Per Capita ( 1.6) and Per Worker ( 1.5)
1950 1960 1970 1980 1990 2000−0.4
−0.3
−0.2
−0.1
0
0.1
0.2
0.3Growth Rate (Average is −0.06)
1950 1960 1970 1980 1990 20000
10
20
30
40
50Investment/GDP ( 4.8) and GovtPurchases/GDP (22.8)
1960 1970 1980 1990 20000
0.5
1
1.5
2
2.5Educational Attainment ( 1.2 years)
1950 1960 1970 1980 1990 2000−40
−30
−20
−10
0
10
20NetExports/GDP (−13.6) and X+M/GDP ( 30.5)
1950 1960 1970 1980 1990 200020
25
30
35
40
45
50
1950 1960 1970 1980 1990 20000
200
400
600
800Exchange Rate per Dollar ( 720.67)
19
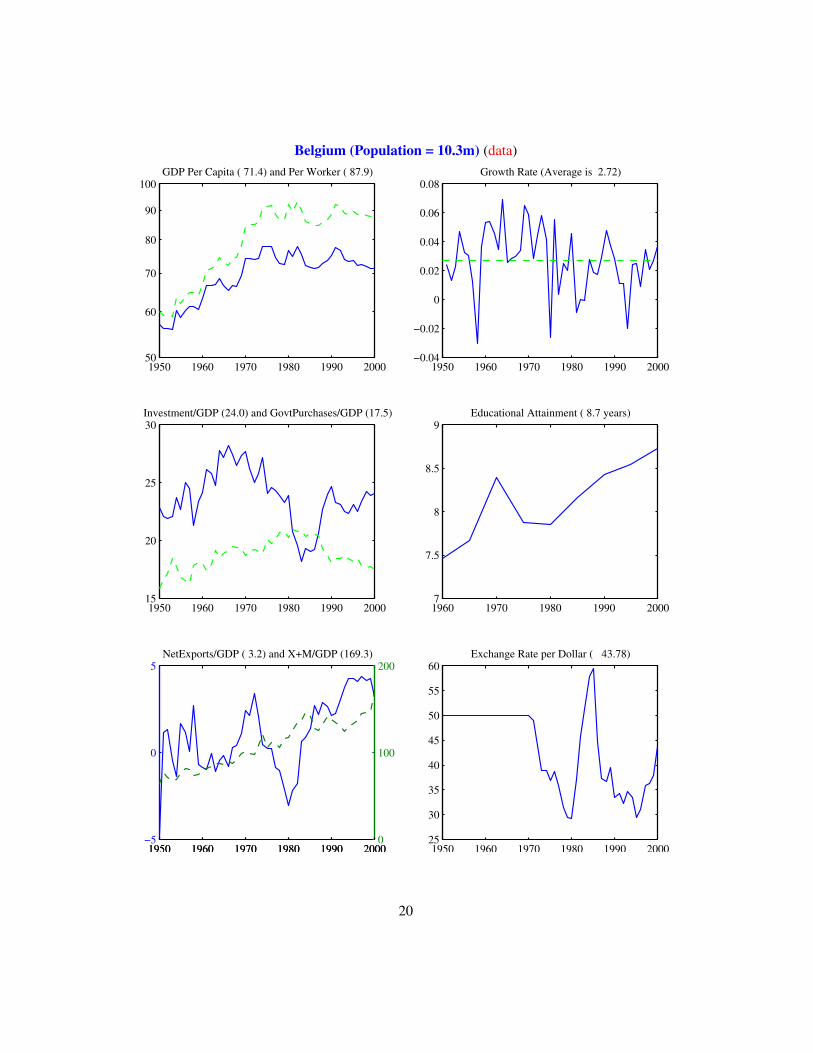
Belgium (Population = 10.3m) (data)
1950 1960 1970 1980 1990 2000 50
60
70
80
90
100GDP Per Capita ( 71.4) and Per Worker ( 87.9)
1950 1960 1970 1980 1990 2000−0.04
−0.02
0
0.02
0.04
0.06
0.08Growth Rate (Average is 2.72)
1950 1960 1970 1980 1990 200015
20
25
30Investment/GDP (24.0) and GovtPurchases/GDP (17.5)
1960 1970 1980 1990 20007
7.5
8
8.5
9Educational Attainment ( 8.7 years)
1950 1960 1970 1980 1990 2000−5
0
5NetExports/GDP ( 3.2) and X+M/GDP (169.3)
1950 1960 1970 1980 1990 20000
100
200
1950 1960 1970 1980 1990 200025
30
35
40
45
50
55
60Exchange Rate per Dollar ( 43.78)
20
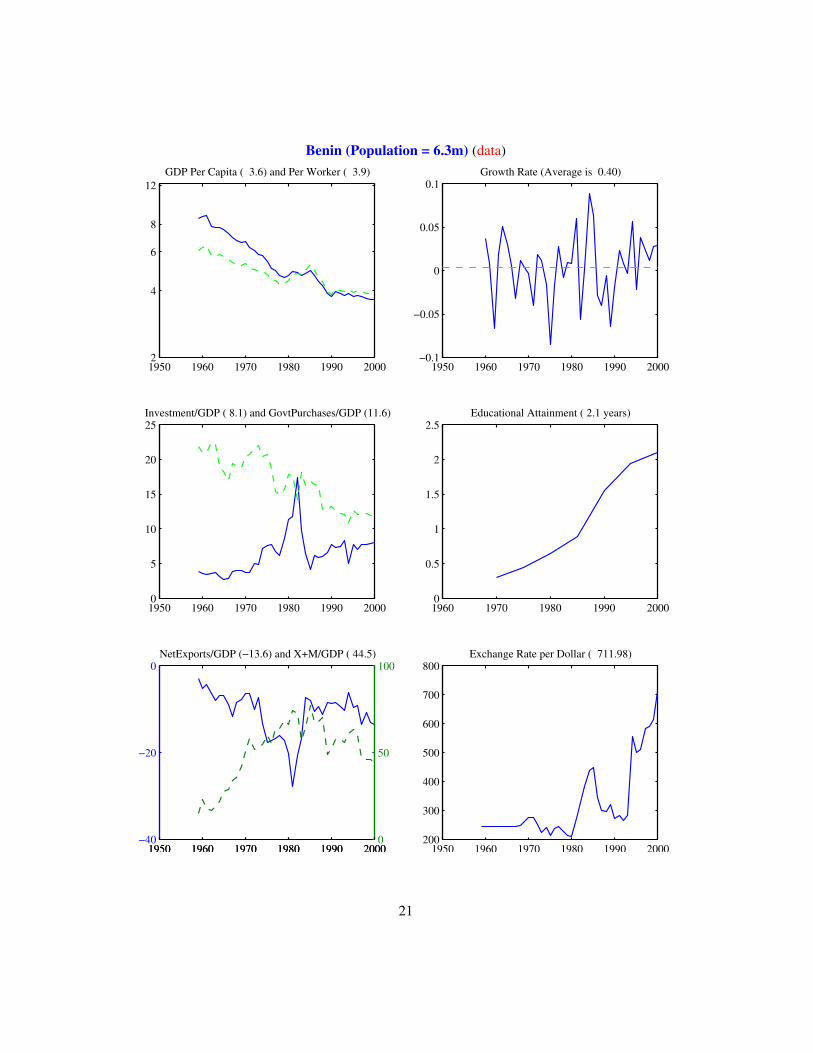
Benin (Population = 6.3m) (data)
1950 1960 1970 1980 1990 2000 2
4
6
8
12GDP Per Capita ( 3.6) and Per Worker ( 3.9)
1950 1960 1970 1980 1990 2000−0.1
−0.05
0
0.05
0.1Growth Rate (Average is 0.40)
1950 1960 1970 1980 1990 20000
5
10
15
20
25Investment/GDP ( 8.1) and GovtPurchases/GDP (11.6)
1960 1970 1980 1990 20000
0.5
1
1.5
2
2.5Educational Attainment ( 2.1 years)
1950 1960 1970 1980 1990 2000−40
−20
0NetExports/GDP (−13.6) and X+M/GDP ( 44.5)
1950 1960 1970 1980 1990 20000
50
100
1950 1960 1970 1980 1990 2000200
300
400
500
600
700
800Exchange Rate per Dollar ( 711.98)
21

Burkina Faso (Population = 11.3m) (data)
1950 1960 1970 1980 1990 20001
2
4
6
8GDP Per Capita ( 2.9) and Per Worker ( 3.1)
1950 1960 1970 1980 1990 2000−0.2
−0.15
−0.1
−0.05
0
0.05
0.1
0.15Growth Rate (Average is 0.46)
1950 1960 1970 1980 1990 20000
5
10
15
20
25
30Investment/GDP (14.8) and GovtPurchases/GDP (24.9)
1960 1970 1980 1990 20000
0.2
0.4
0.6
0.8
1Educational Attainment ( NaN years)
1950 1960 1970 1980 1990 2000−100
−50
0NetExports/GDP (−18.8) and X+M/GDP ( 40.3)
1950 1960 1970 1980 1990 20000
50
100
1950 1960 1970 1980 1990 2000200
300
400
500
600
700
800Exchange Rate per Dollar ( 711.98)
22
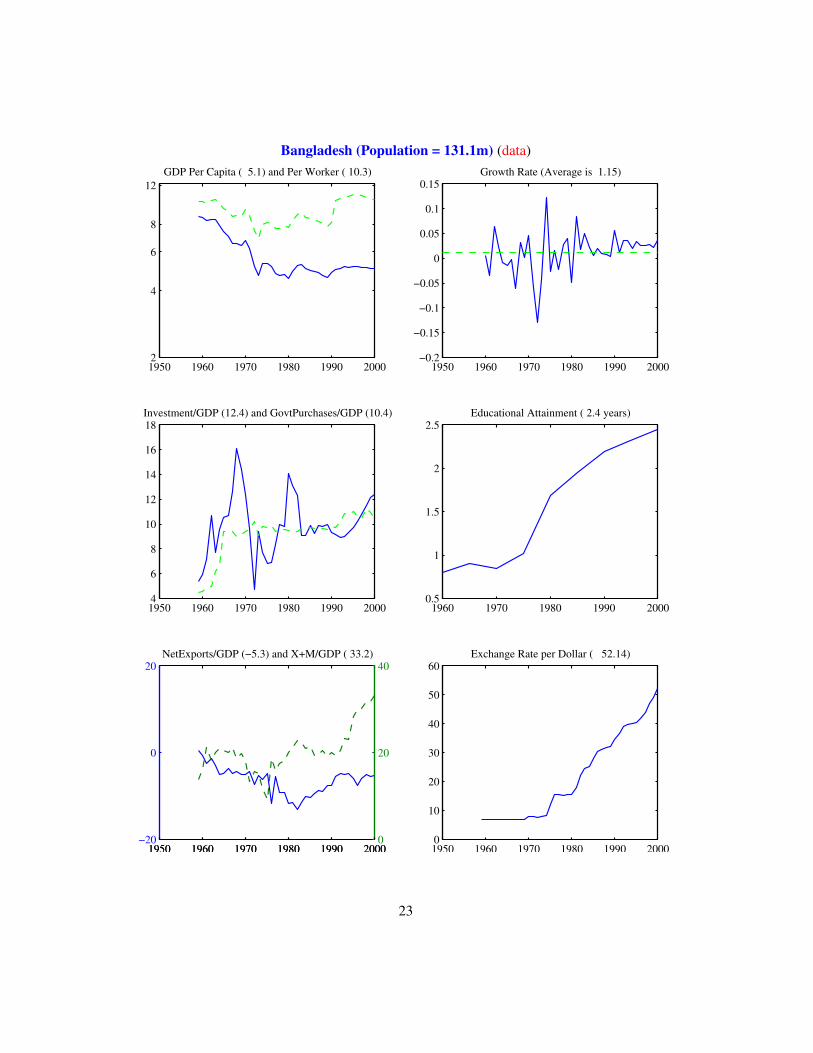
Bangladesh (Population = 131.1m) (data)
1950 1960 1970 1980 1990 2000 2
4
6
8
12GDP Per Capita ( 5.1) and Per Worker ( 10.3)
1950 1960 1970 1980 1990 2000−0.2
−0.15
−0.1
−0.05
0
0.05
0.1
0.15Growth Rate (Average is 1.15)
1950 1960 1970 1980 1990 20004
6
8
10
12
14
16
18Investment/GDP (12.4) and GovtPurchases/GDP (10.4)
1960 1970 1980 1990 20000.5
1
1.5
2
2.5Educational Attainment ( 2.4 years)
1950 1960 1970 1980 1990 2000−20
0
20NetExports/GDP (−5.3) and X+M/GDP ( 33.2)
1950 1960 1970 1980 1990 20000
20
40
1950 1960 1970 1980 1990 20000
10
20
30
40
50
60Exchange Rate per Dollar ( 52.14)
23

Bulgaria (Population = 8.2m) (data)
1990 1992 1994 1996 1998 200012
16
24
32
GDP Per Capita ( 17.4) and Per Worker ( 18.4)
1950 1960 1970 1980 1990 2000−0.15
−0.1
−0.05
0
0.05
0.1Growth Rate (Average is −2.61)
1950 1960 1970 1980 1990 20000
10
20
30
40
50Investment/GDP ( 7.4) and GovtPurchases/GDP (30.2)
1960 1970 1980 1990 20000
0.2
0.4
0.6
0.8
1Educational Attainment ( NaN years)
1950 1960 1970 1980 1990 2000−10
0
10NetExports/GDP (−5.5) and X+M/GDP (121.5)
1950 1960 1970 1980 1990 200050
100
150
1950 1960 1970 1980 1990 20000
50
100
150
200Exchange Rate per Dollar ( 2.12)
24
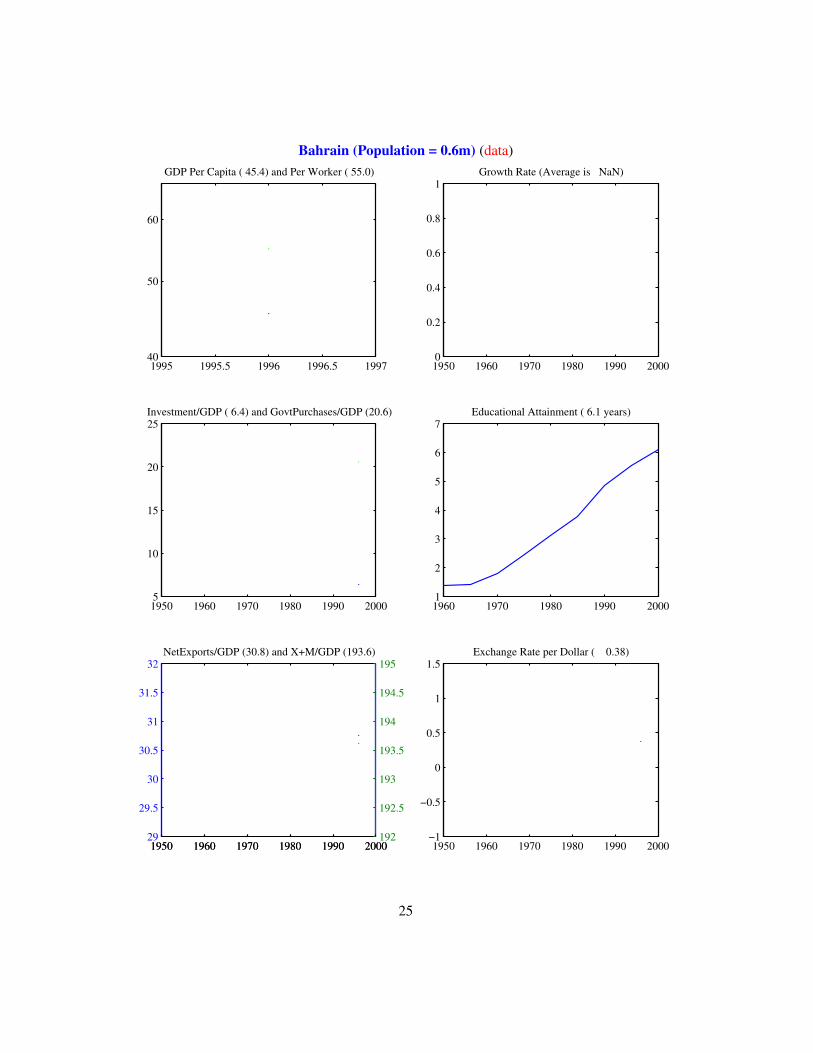
Bahrain (Population = 0.6m) (data)
1995 1995.5 1996 1996.5 199740
50
60
GDP Per Capita ( 45.4) and Per Worker ( 55.0)
1950 1960 1970 1980 1990 20000
0.2
0.4
0.6
0.8
1Growth Rate (Average is NaN)
1950 1960 1970 1980 1990 20005
10
15
20
25Investment/GDP ( 6.4) and GovtPurchases/GDP (20.6)
1960 1970 1980 1990 20001
2
3
4
5
6
7Educational Attainment ( 6.1 years)
1950 1960 1970 1980 1990 200029
29.5
30
30.5
31
31.5
32NetExports/GDP (30.8) and X+M/GDP (193.6)
1950 1960 1970 1980 1990 2000192
192.5
193
193.5
194
194.5
195
1950 1960 1970 1980 1990 2000−1
−0.5
0
0.5
1
1.5Exchange Rate per Dollar ( 0.38)
25
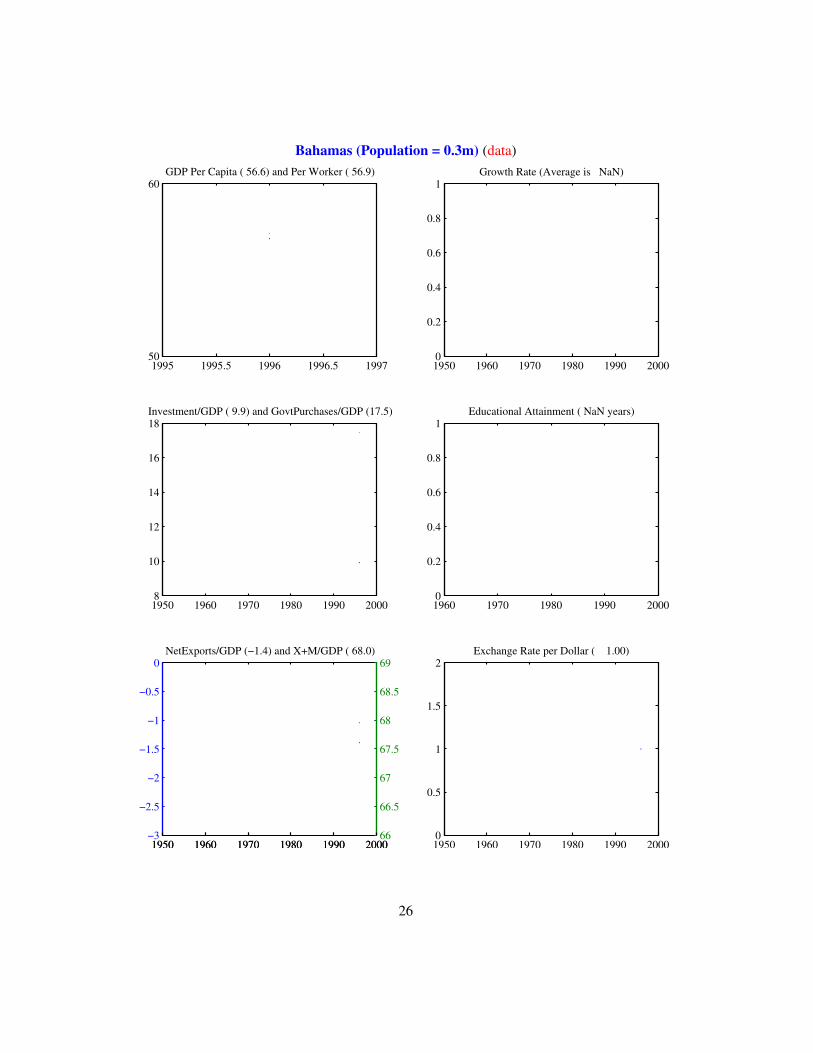
Bahamas (Population = 0.3m) (data)
1995 1995.5 1996 1996.5 199750
60GDP Per Capita ( 56.6) and Per Worker ( 56.9)
1950 1960 1970 1980 1990 20000
0.2
0.4
0.6
0.8
1Growth Rate (Average is NaN)
1950 1960 1970 1980 1990 20008
10
12
14
16
18Investment/GDP ( 9.9) and GovtPurchases/GDP (17.5)
1960 1970 1980 1990 20000
0.2
0.4
0.6
0.8
1Educational Attainment ( NaN years)
1950 1960 1970 1980 1990 2000−3
−2.5
−2
−1.5
−1
−0.5
0NetExports/GDP (−1.4) and X+M/GDP ( 68.0)
1950 1960 1970 1980 1990 200066
66.5
67
67.5
68
68.5
69
1950 1960 1970 1980 1990 20000
0.5
1
1.5
2Exchange Rate per Dollar ( 1.00)
26
Bosnia and Herzegovina (Population = 0.0m) (data)
0 0.2 0.4 0.6 0.8 11
GDP Per Capita ( 0.0) and Per Worker ( 0.0)
1950 1960 1970 1980 1990 20000
0.2
0.4
0.6
0.8
1Growth Rate (Average is NaN)
1950 1960 1970 1980 1990 2000−1
−0.5
0
0.5
1Investment/GDP ( 0.0) and GovtPurchases/GDP ( 0.0)
1960 1970 1980 1990 20000
0.2
0.4
0.6
0.8
1Educational Attainment ( NaN years)
1950 1960 1970 1980 1990 200099
99.5
100
100.5
101NetExports/GDP (100.0) and X+M/GDP ( 0.0)
1950 1960 1970 1980 1990 2000−1
−0.5
0
0.5
1
1950 1960 1970 1980 1990 2000−1
−0.5
0
0.5
1Exchange Rate per Dollar ( 0.00)
27
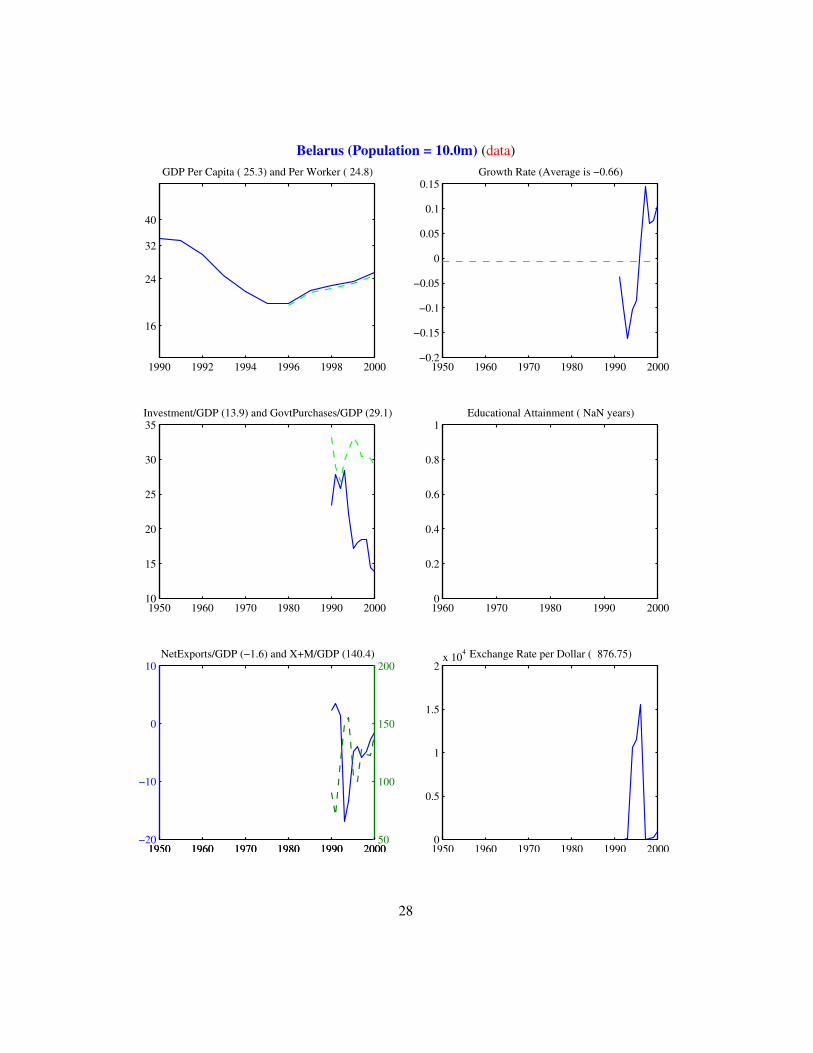
Belarus (Population = 10.0m) (data)
1990 1992 1994 1996 1998 2000
16
24
32
40
GDP Per Capita ( 25.3) and Per Worker ( 24.8)
1950 1960 1970 1980 1990 2000−0.2
−0.15
−0.1
−0.05
0
0.05
0.1
0.15Growth Rate (Average is −0.66)
1950 1960 1970 1980 1990 200010
15
20
25
30
35Investment/GDP (13.9) and GovtPurchases/GDP (29.1)
1960 1970 1980 1990 20000
0.2
0.4
0.6
0.8
1Educational Attainment ( NaN years)
1950 1960 1970 1980 1990 2000−20
−10
0
10NetExports/GDP (−1.6) and X+M/GDP (140.4)
1950 1960 1970 1980 1990 200050
100
150
200
1950 1960 1970 1980 1990 20000
0.5
1
1.5
2x 10⁴ Exchange Rate per Dollar ( 876.75)
28
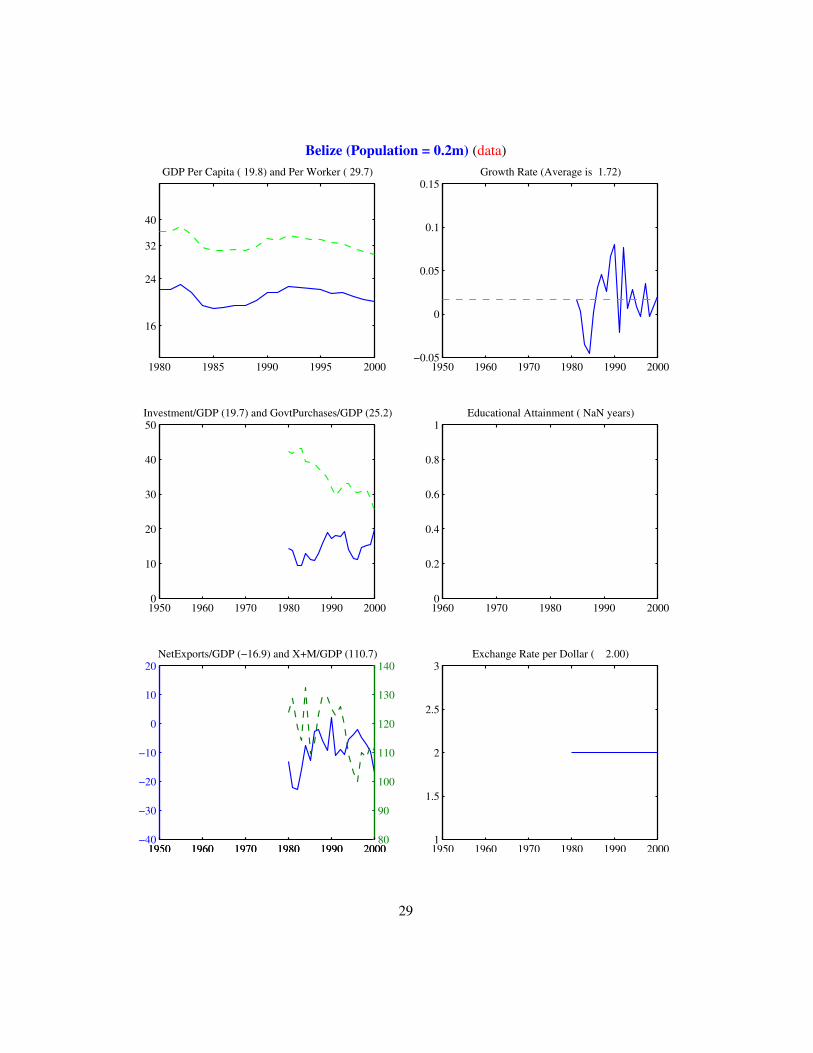
Belize (Population = 0.2m) (data)
1980 1985 1990 1995 2000
16
24
32
40
GDP Per Capita ( 19.8) and Per Worker ( 29.7)
1950 1960 1970 1980 1990 2000−0.05
0
0.05
0.1
0.15Growth Rate (Average is 1.72)
1950 1960 1970 1980 1990 20000
10
20
30
40
50Investment/GDP (19.7) and GovtPurchases/GDP (25.2)
1960 1970 1980 1990 20000
0.2
0.4
0.6
0.8
1Educational Attainment ( NaN years)
1950 1960 1970 1980 1990 2000−40
−30
−20
−10
0
10
20NetExports/GDP (−16.9) and X+M/GDP (110.7)
1950 1960 1970 1980 1990 200080
90
100
110
120
130
140
1950 1960 1970 1980 1990 20001
1.5
2
2.5
3Exchange Rate per Dollar ( 2.00)
29
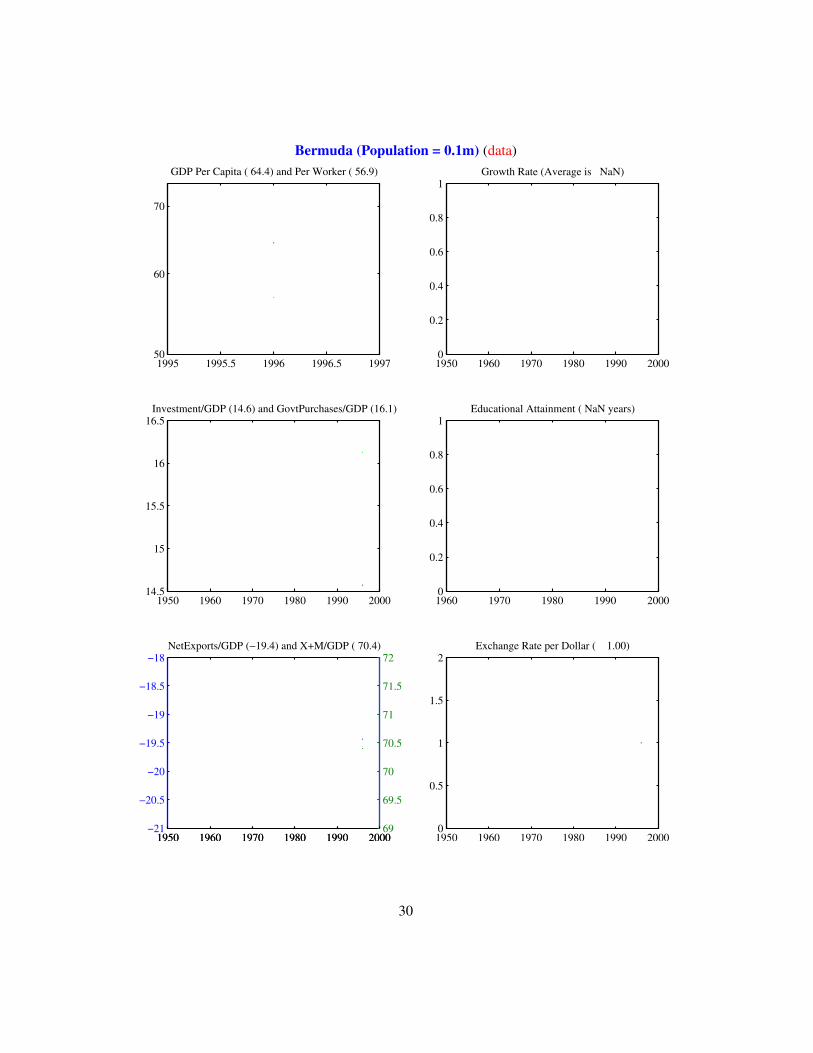
Bermuda (Population = 0.1m) (data)
1995 1995.5 1996 1996.5 199750
60
70
GDP Per Capita ( 64.4) and Per Worker ( 56.9)
1950 1960 1970 1980 1990 20000
0.2
0.4
0.6
0.8
1Growth Rate (Average is NaN)
1950 1960 1970 1980 1990 200014.5
15
15.5
16
16.5Investment/GDP (14.6) and GovtPurchases/GDP (16.1)
1960 1970 1980 1990 20000
0.2
0.4
0.6
0.8
1Educational Attainment ( NaN years)
1950 1960 1970 1980 1990 2000−21
−20.5
−20
−19.5
−19
−18.5
−18NetExports/GDP (−19.4) and X+M/GDP ( 70.4)
1950 1960 1970 1980 1990 200069
69.5
70
70.5
71
71.5
72
1950 1960 1970 1980 1990 20000
0.5
1
1.5
2Exchange Rate per Dollar ( 1.00)
30
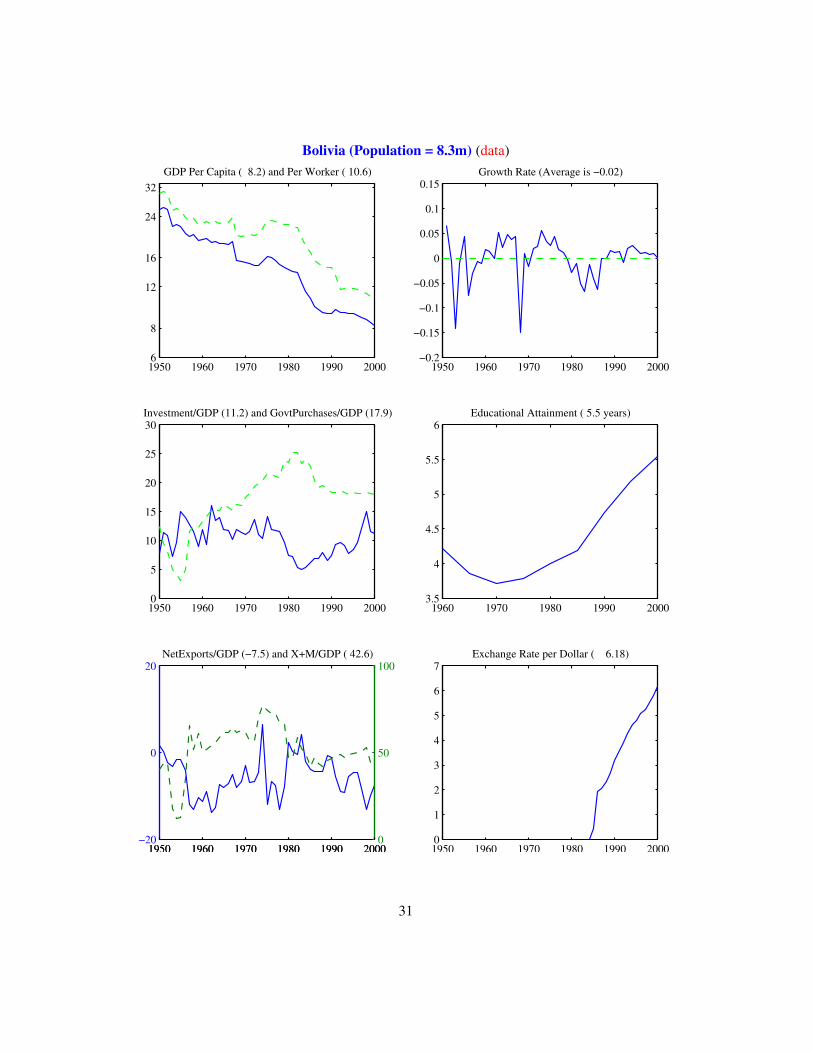
Bolivia (Population = 8.3m) (data)
1950 1960 1970 1980 1990 2000 6
8
12
16
24
32GDP Per Capita ( 8.2) and Per Worker ( 10.6)
1950 1960 1970 1980 1990 2000−0.2
−0.15
−0.1
−0.05
0
0.05
0.1
0.15Growth Rate (Average is −0.02)
1950 1960 1970 1980 1990 20000
5
10
15
20
25
30Investment/GDP (11.2) and GovtPurchases/GDP (17.9)
1960 1970 1980 1990 20003.5
4
4.5
5
5.5
6Educational Attainment ( 5.5 years)
1950 1960 1970 1980 1990 2000−20
0
20NetExports/GDP (−7.5) and X+M/GDP ( 42.6)
1950 1960 1970 1980 1990 20000
50
100
1950 1960 1970 1980 1990 20000
1
2
3
4
5
6
7Exchange Rate per Dollar ( 6.18)
31
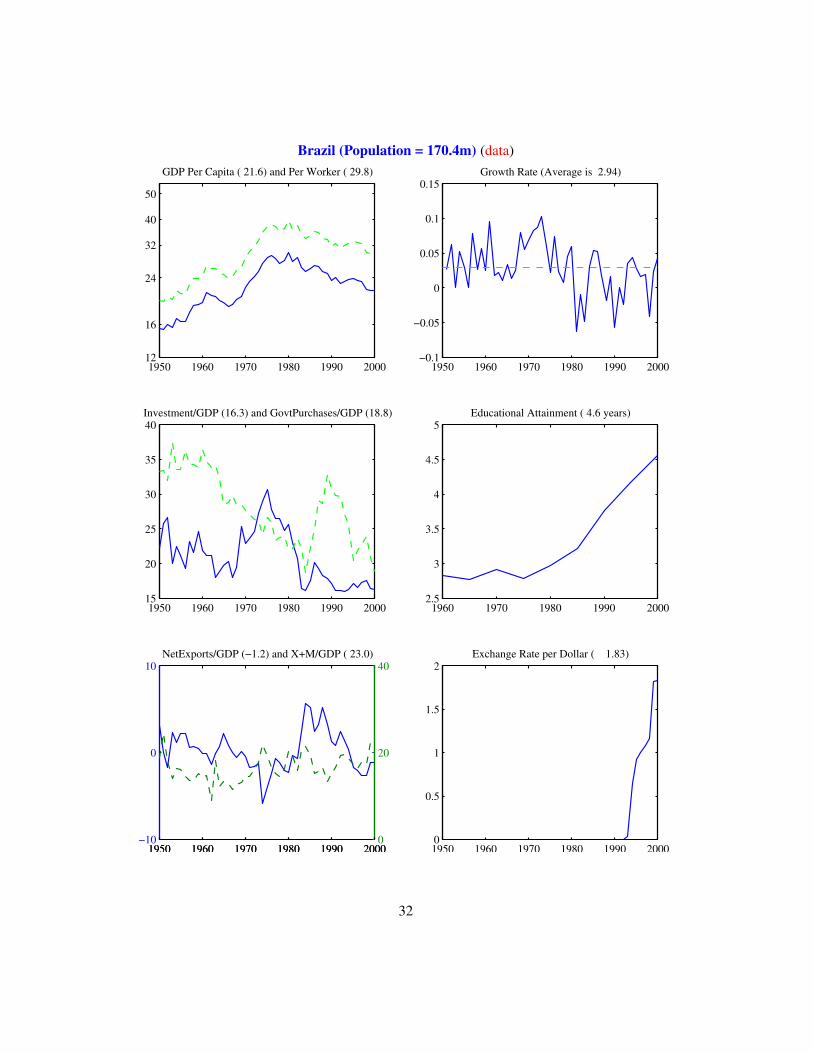
Brazil (Population = 170.4m) (data)
1950 1960 1970 1980 1990 200012
16
24
32
40
50
GDP Per Capita ( 21.6) and Per Worker ( 29.8)
1950 1960 1970 1980 1990 2000−0.1
−0.05
0
0.05
0.1
0.15Growth Rate (Average is 2.94)
1950 1960 1970 1980 1990 200015
20
25
30
35
40Investment/GDP (16.3) and GovtPurchases/GDP (18.8)
1960 1970 1980 1990 20002.5
3
3.5
4
4.5
5Educational Attainment ( 4.6 years)
1950 1960 1970 1980 1990 2000−10
0
10NetExports/GDP (−1.2) and X+M/GDP ( 23.0)
1950 1960 1970 1980 1990 20000
20
40
1950 1960 1970 1980 1990 20000
0.5
1
1.5
2Exchange Rate per Dollar ( 1.83)
32
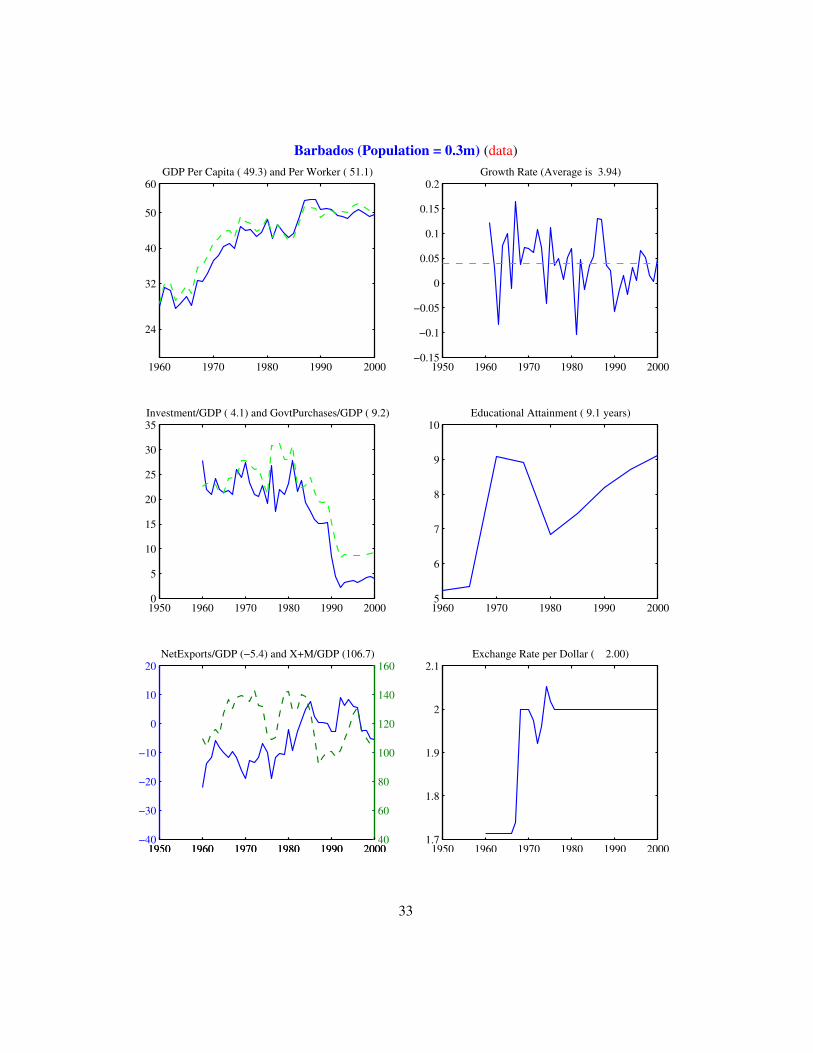
Barbados (Population = 0.3m) (data)
1960 1970 1980 1990 2000
24
32
40
50
60GDP Per Capita ( 49.3) and Per Worker ( 51.1)
1950 1960 1970 1980 1990 2000−0.15
−0.1
−0.05
0
0.05
0.1
0.15
0.2Growth Rate (Average is 3.94)
1950 1960 1970 1980 1990 20000
5
10
15
20
25
30
35Investment/GDP ( 4.1) and GovtPurchases/GDP ( 9.2)
1960 1970 1980 1990 20005
6
7
8
9
10Educational Attainment ( 9.1 years)
1950 1960 1970 1980 1990 2000−40
−30
−20
−10
0
10
20NetExports/GDP (−5.4) and X+M/GDP (106.7)
1950 1960 1970 1980 1990 200040
60
80
100
120
140
160
1950 1960 1970 1980 1990 20001.7
1.8
1.9
2
2.1Exchange Rate per Dollar ( 2.00)
33
Brunei (Population = 0.0m) (data)
0 0.2 0.4 0.6 0.8 11
GDP Per Capita ( 0.0) and Per Worker ( 0.0)
1950 1960 1970 1980 1990 20000
0.2
0.4
0.6
0.8
1Growth Rate (Average is NaN)
1950 1960 1970 1980 1990 2000−1
−0.5
0
0.5
1Investment/GDP ( 0.0) and GovtPurchases/GDP ( 0.0)
1960 1970 1980 1990 20000
0.2
0.4
0.6
0.8
1Educational Attainment ( NaN years)
1950 1960 1970 1980 1990 200099
99.5
100
100.5
101NetExports/GDP (100.0) and X+M/GDP ( 0.0)
1950 1960 1970 1980 1990 2000−1
−0.5
0
0.5
1
1950 1960 1970 1980 1990 2000−1
−0.5
0
0.5
1Exchange Rate per Dollar ( 0.00)
34
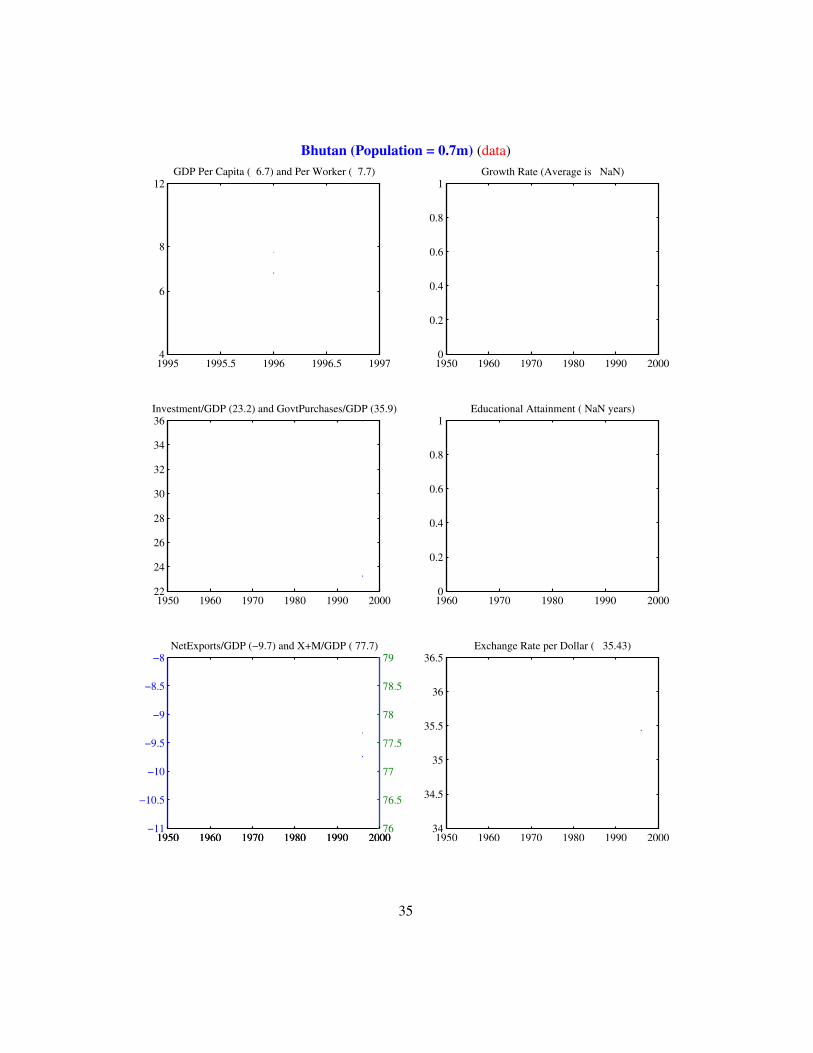
Bhutan (Population = 0.7m) (data)
1995 1995.5 1996 1996.5 1997 4
6
8
12GDP Per Capita ( 6.7) and Per Worker ( 7.7)
1950 1960 1970 1980 1990 20000
0.2
0.4
0.6
0.8
1Growth Rate (Average is NaN)
1950 1960 1970 1980 1990 200022
24
26
28
30
32
34
36Investment/GDP (23.2) and GovtPurchases/GDP (35.9)
1960 1970 1980 1990 20000
0.2
0.4
0.6
0.8
1Educational Attainment ( NaN years)
1950 1960 1970 1980 1990 2000−11
−10.5
−10
−9.5
−9
−8.5
−8NetExports/GDP (−9.7) and X+M/GDP ( 77.7)
1950 1960 1970 1980 1990 200076
76.5
77
77.5
78
78.5
79
1950 1960 1970 1980 1990 200034
34.5
35
35.5
36
36.5Exchange Rate per Dollar ( 35.43)
35
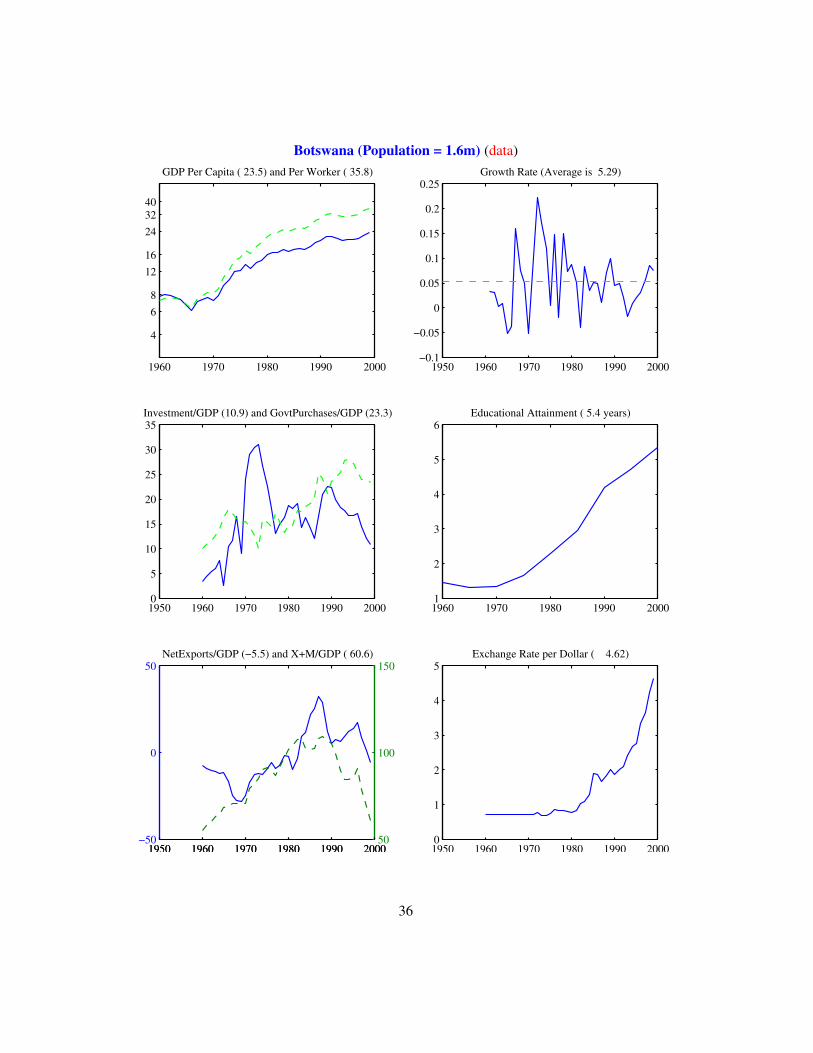
Botswana (Population = 1.6m) (data)
1960 1970 1980 1990 2000
4
6 8
1216
243240
GDP Per Capita ( 23.5) and Per Worker ( 35.8)
1950 1960 1970 1980 1990 2000−0.1
−0.05
0
0.05
0.1
0.15
0.2
0.25Growth Rate (Average is 5.29)
1950 1960 1970 1980 1990 20000
5
10
15
20
25
30
35Investment/GDP (10.9) and GovtPurchases/GDP (23.3)
1960 1970 1980 1990 20001
2
3
4
5
6Educational Attainment ( 5.4 years)
1950 1960 1970 1980 1990 2000−50
0
50NetExports/GDP (−5.5) and X+M/GDP ( 60.6)
1950 1960 1970 1980 1990 200050
100
150
1950 1960 1970 1980 1990 20000
1
2
3
4
5Exchange Rate per Dollar ( 4.62)
36
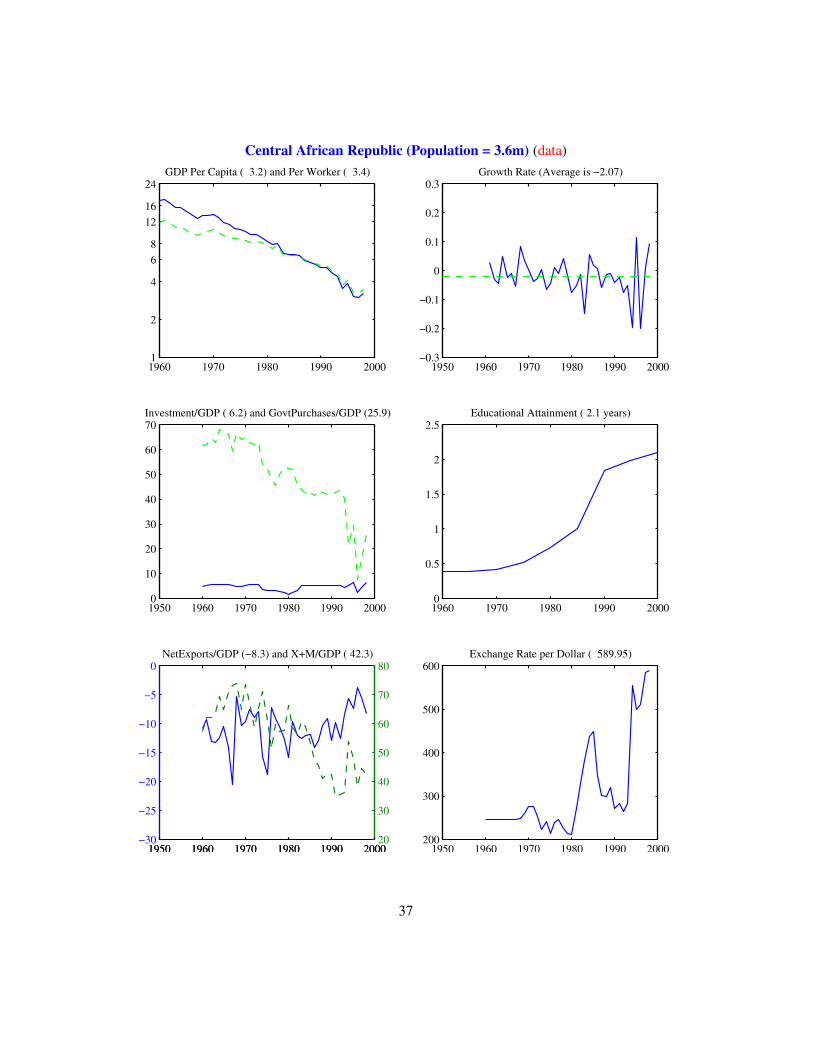
Central African Republic (Population = 3.6m) (data)
1960 1970 1980 1990 2000 1
2
4
6 8
1216
24GDP Per Capita ( 3.2) and Per Worker ( 3.4)
1950 1960 1970 1980 1990 2000−0.3
−0.2
−0.1
0
0.1
0.2
0.3Growth Rate (Average is −2.07)
1950 1960 1970 1980 1990 20000
10
20
30
40
50
60
70Investment/GDP ( 6.2) and GovtPurchases/GDP (25.9)
1960 1970 1980 1990 20000
0.5
1
1.5
2
2.5Educational Attainment ( 2.1 years)
1950 1960 1970 1980 1990 2000−30
−25
−20
−15
−10
−5
0NetExports/GDP (−8.3) and X+M/GDP ( 42.3)
1950 1960 1970 1980 1990 200020
30
40
50
60
70
80
1950 1960 1970 1980 1990 2000200
300
400
500
600Exchange Rate per Dollar ( 589.95)
37
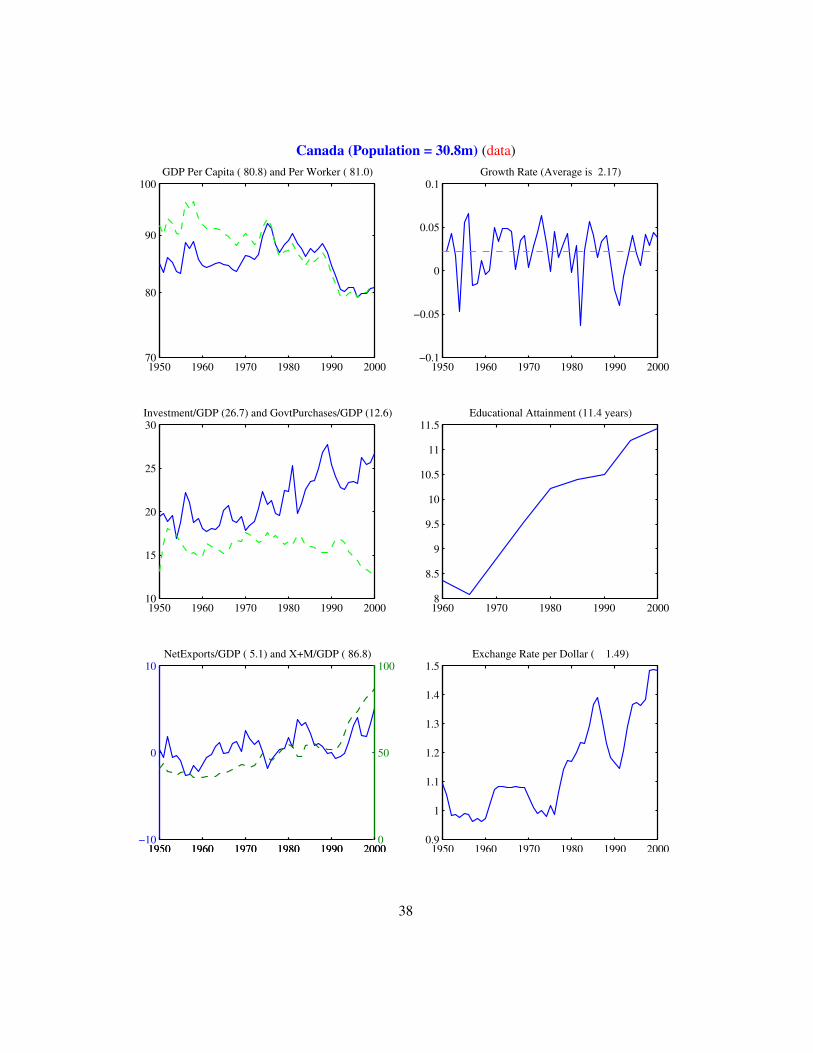
Canada (Population = 30.8m) (data)
1950 1960 1970 1980 1990 2000 70
80
90
100GDP Per Capita ( 80.8) and Per Worker ( 81.0)
1950 1960 1970 1980 1990 2000−0.1
−0.05
0
0.05
0.1Growth Rate (Average is 2.17)
1950 1960 1970 1980 1990 200010
15
20
25
30Investment/GDP (26.7) and GovtPurchases/GDP (12.6)
1960 1970 1980 1990 20008
8.5
9
9.5
10
10.5
11
11.5Educational Attainment (11.4 years)
1950 1960 1970 1980 1990 2000−10
0
10NetExports/GDP ( 5.1) and X+M/GDP ( 86.8)
1950 1960 1970 1980 1990 20000
50
100
1950 1960 1970 1980 1990 20000.9
1
1.1
1.2
1.3
1.4
1.5Exchange Rate per Dollar ( 1.49)
38
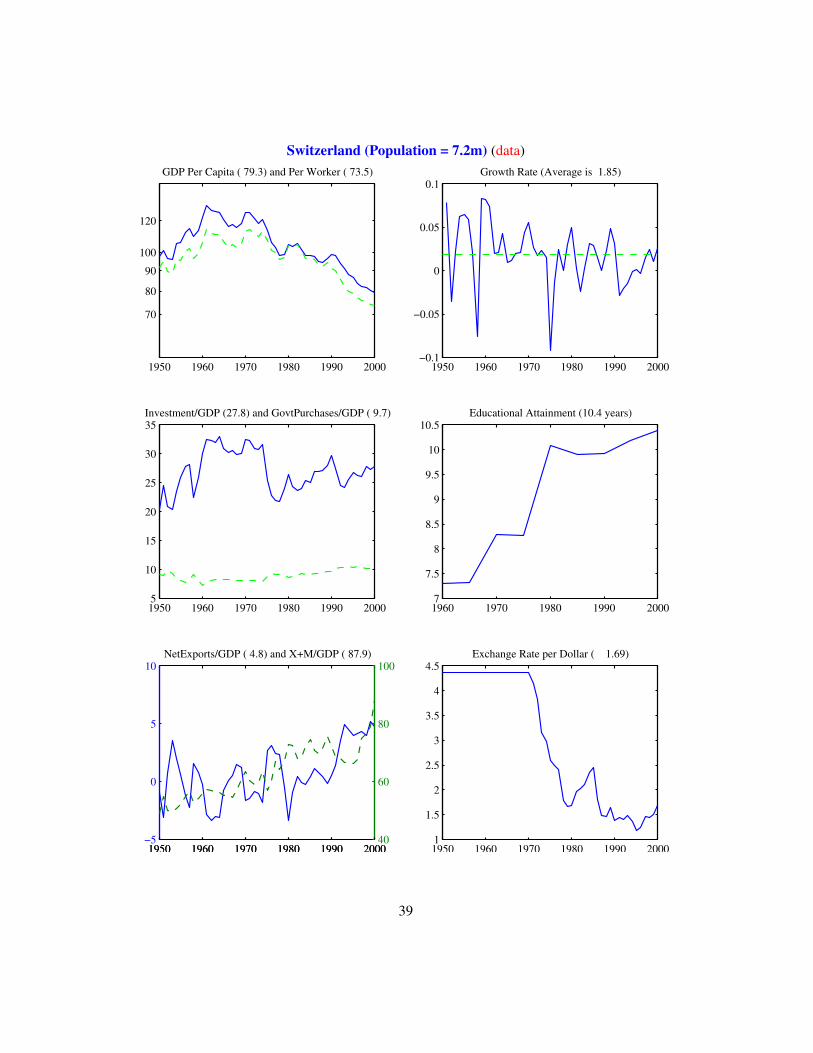
Switzerland (Population = 7.2m) (data)
1950 1960 1970 1980 1990 2000
70
80
90
100
120
GDP Per Capita ( 79.3) and Per Worker ( 73.5)
1950 1960 1970 1980 1990 2000−0.1
−0.05
0
0.05
0.1Growth Rate (Average is 1.85)
1950 1960 1970 1980 1990 20005
10
15
20
25
30
35Investment/GDP (27.8) and GovtPurchases/GDP ( 9.7)
1960 1970 1980 1990 20007
7.5
8
8.5
9
9.5
10
10.5Educational Attainment (10.4 years)
1950 1960 1970 1980 1990 2000−5
0
5
10NetExports/GDP ( 4.8) and X+M/GDP ( 87.9)
1950 1960 1970 1980 1990 200040
60
80
100
1950 1960 1970 1980 1990 20001
1.5
2
2.5
3
3.5
4
4.5Exchange Rate per Dollar ( 1.69)
39
Channel Islands (Population = 0.0m) (data)
0 0.2 0.4 0.6 0.8 11
GDP Per Capita ( 0.0) and Per Worker ( 0.0)
1950 1960 1970 1980 1990 20000
0.2
0.4
0.6
0.8
1Growth Rate (Average is NaN)
1950 1960 1970 1980 1990 2000−1
−0.5
0
0.5
1Investment/GDP ( 0.0) and GovtPurchases/GDP ( 0.0)
1960 1970 1980 1990 20000
0.2
0.4
0.6
0.8
1Educational Attainment ( NaN years)
1950 1960 1970 1980 1990 200099
99.5
100
100.5
101NetExports/GDP (100.0) and X+M/GDP ( 0.0)
1950 1960 1970 1980 1990 2000−1
−0.5
0
0.5
1
1950 1960 1970 1980 1990 2000−1
−0.5
0
0.5
1Exchange Rate per Dollar ( 0.00)
40
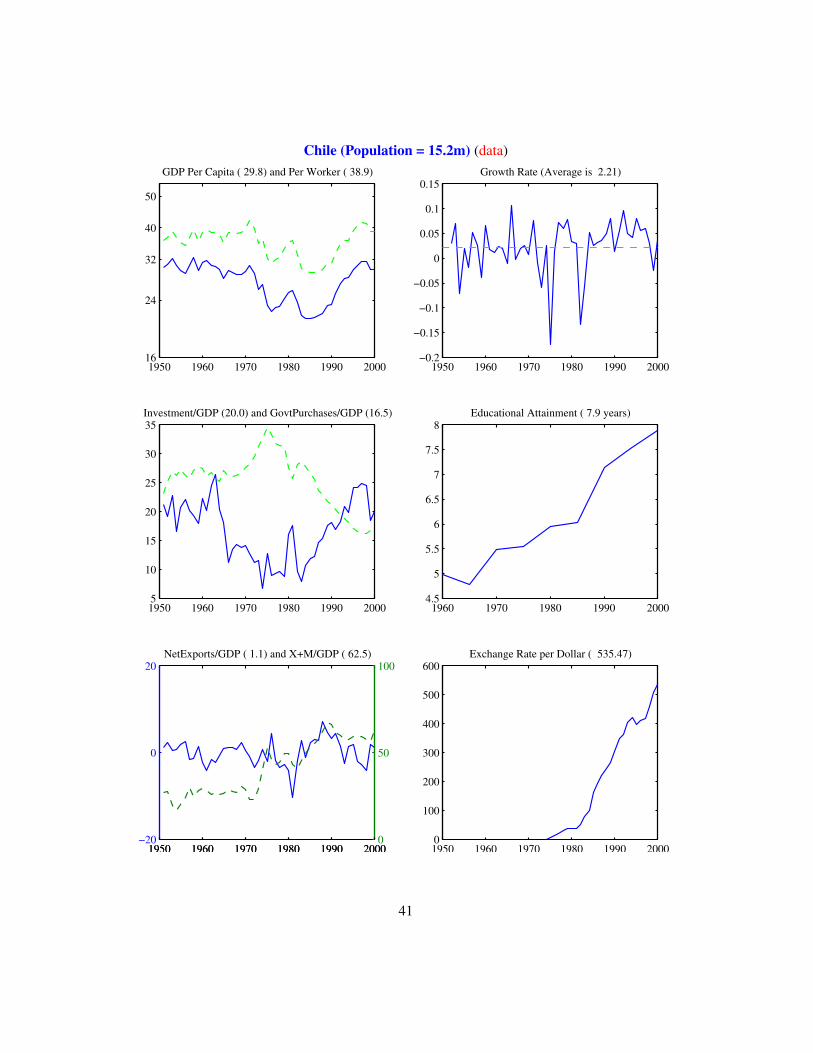
Chile (Population = 15.2m) (data)
1950 1960 1970 1980 1990 200016
24
32
40
50
GDP Per Capita ( 29.8) and Per Worker ( 38.9)
1950 1960 1970 1980 1990 2000−0.2
−0.15
−0.1
−0.05
0
0.05
0.1
0.15Growth Rate (Average is 2.21)
1950 1960 1970 1980 1990 20005
10
15
20
25
30
35Investment/GDP (20.0) and GovtPurchases/GDP (16.5)
1960 1970 1980 1990 20004.5
5
5.5
6
6.5
7
7.5
8Educational Attainment ( 7.9 years)
1950 1960 1970 1980 1990 2000−20
0
20NetExports/GDP ( 1.1) and X+M/GDP ( 62.5)
1950 1960 1970 1980 1990 20000
50
100
1950 1960 1970 1980 1990 20000
100
200
300
400
500
600Exchange Rate per Dollar ( 535.47)
41
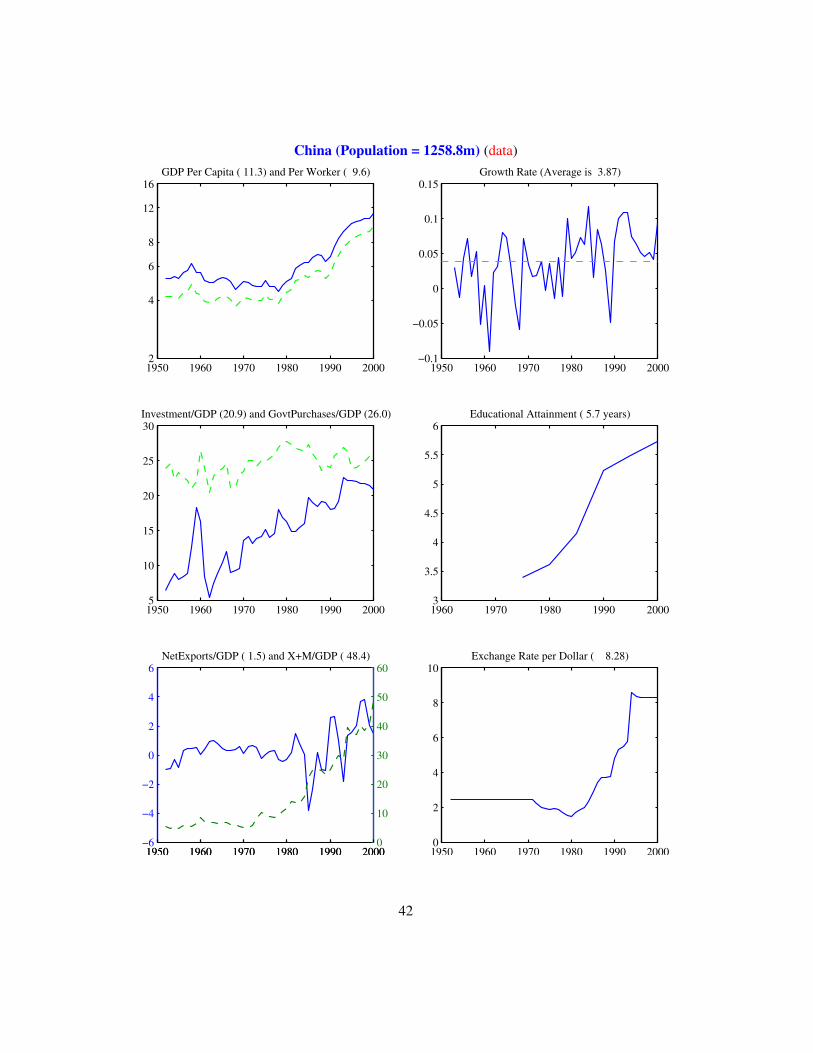
China (Population = 1258.8m) (data)
1950 1960 1970 1980 1990 2000 2
4
6
8
12
16GDP Per Capita ( 11.3) and Per Worker ( 9.6)
1950 1960 1970 1980 1990 2000−0.1
−0.05
0
0.05
0.1
0.15Growth Rate (Average is 3.87)
1950 1960 1970 1980 1990 20005
10
15
20
25
30Investment/GDP (20.9) and GovtPurchases/GDP (26.0)
1960 1970 1980 1990 20003
3.5
4
4.5
5
5.5
6Educational Attainment ( 5.7 years)
1950 1960 1970 1980 1990 2000−6
−4
−2
0
2
4
6NetExports/GDP ( 1.5) and X+M/GDP ( 48.4)
1950 1960 1970 1980 1990 20000
10
20
30
40
50
60
1950 1960 1970 1980 1990 20000
2
4
6
8
10Exchange Rate per Dollar ( 8.28)
42
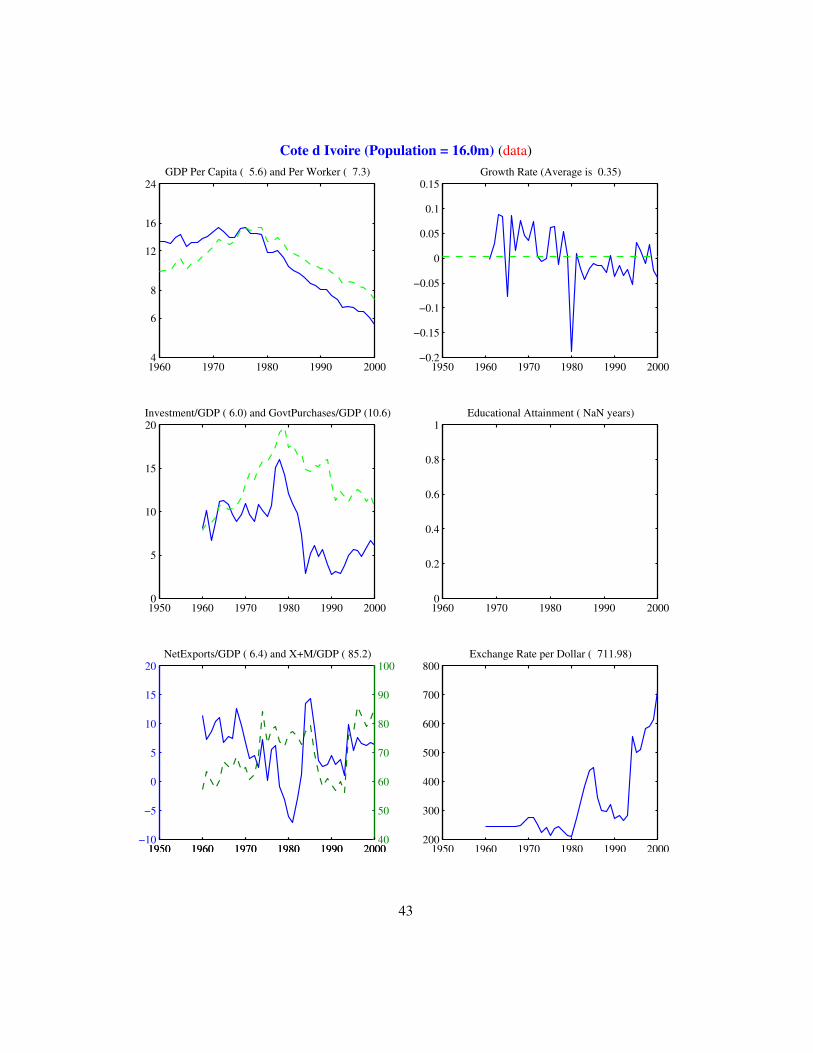
Cote d Ivoire (Population = 16.0m) (data)
1960 1970 1980 1990 2000 4
6
8
12
16
24GDP Per Capita ( 5.6) and Per Worker ( 7.3)
1950 1960 1970 1980 1990 2000−0.2
−0.15
−0.1
−0.05
0
0.05
0.1
0.15Growth Rate (Average is 0.35)
1950 1960 1970 1980 1990 20000
5
10
15
20Investment/GDP ( 6.0) and GovtPurchases/GDP (10.6)
1960 1970 1980 1990 20000
0.2
0.4
0.6
0.8
1Educational Attainment ( NaN years)
1950 1960 1970 1980 1990 2000−10
−5
0
5
10
15
20NetExports/GDP ( 6.4) and X+M/GDP ( 85.2)
1950 1960 1970 1980 1990 200040
50
60
70
80
90
100
1950 1960 1970 1980 1990 2000200
300
400
500
600
700
800Exchange Rate per Dollar ( 711.98)
43
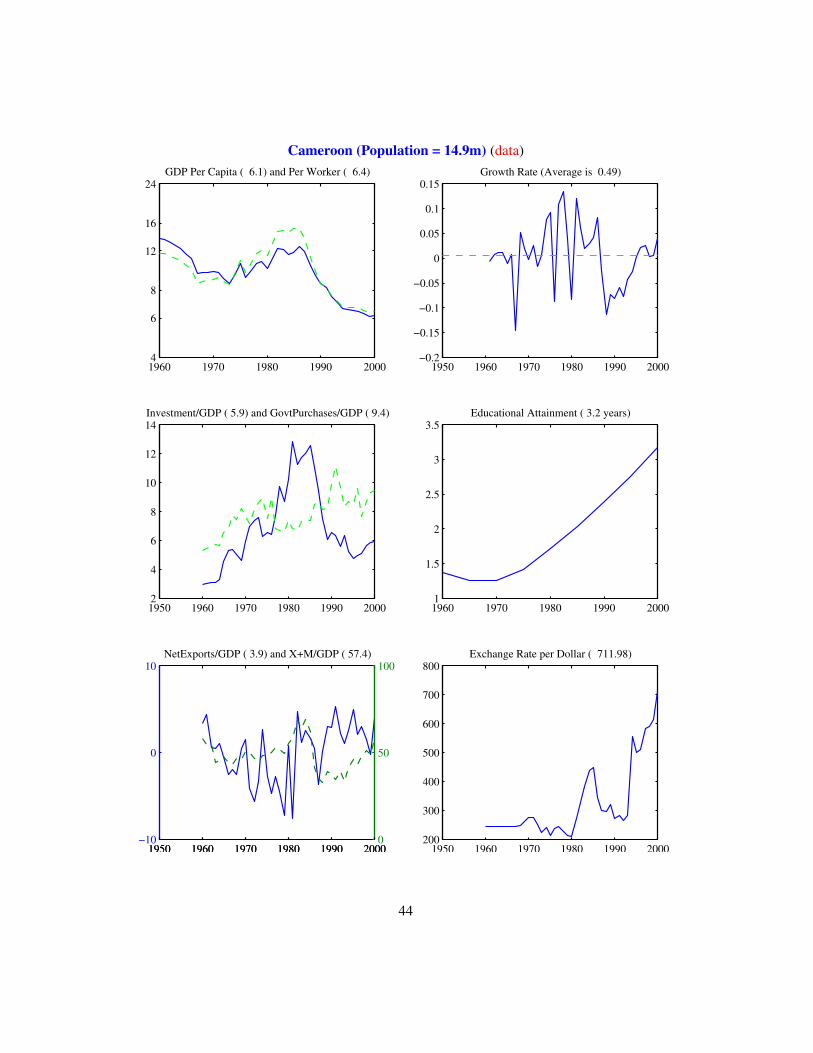
Cameroon (Population = 14.9m) (data)
1960 1970 1980 1990 2000 4
6
8
12
16
24GDP Per Capita ( 6.1) and Per Worker ( 6.4)
1950 1960 1970 1980 1990 2000−0.2
−0.15
−0.1
−0.05
0
0.05
0.1
0.15Growth Rate (Average is 0.49)
1950 1960 1970 1980 1990 20002
4
6
8
10
12
14Investment/GDP ( 5.9) and GovtPurchases/GDP ( 9.4)
1960 1970 1980 1990 20001
1.5
2
2.5
3
3.5Educational Attainment ( 3.2 years)
1950 1960 1970 1980 1990 2000−10
0
10NetExports/GDP ( 3.9) and X+M/GDP ( 57.4)
1950 1960 1970 1980 1990 20000
50
100
1950 1960 1970 1980 1990 2000200
300
400
500
600
700
800Exchange Rate per Dollar ( 711.98)
44
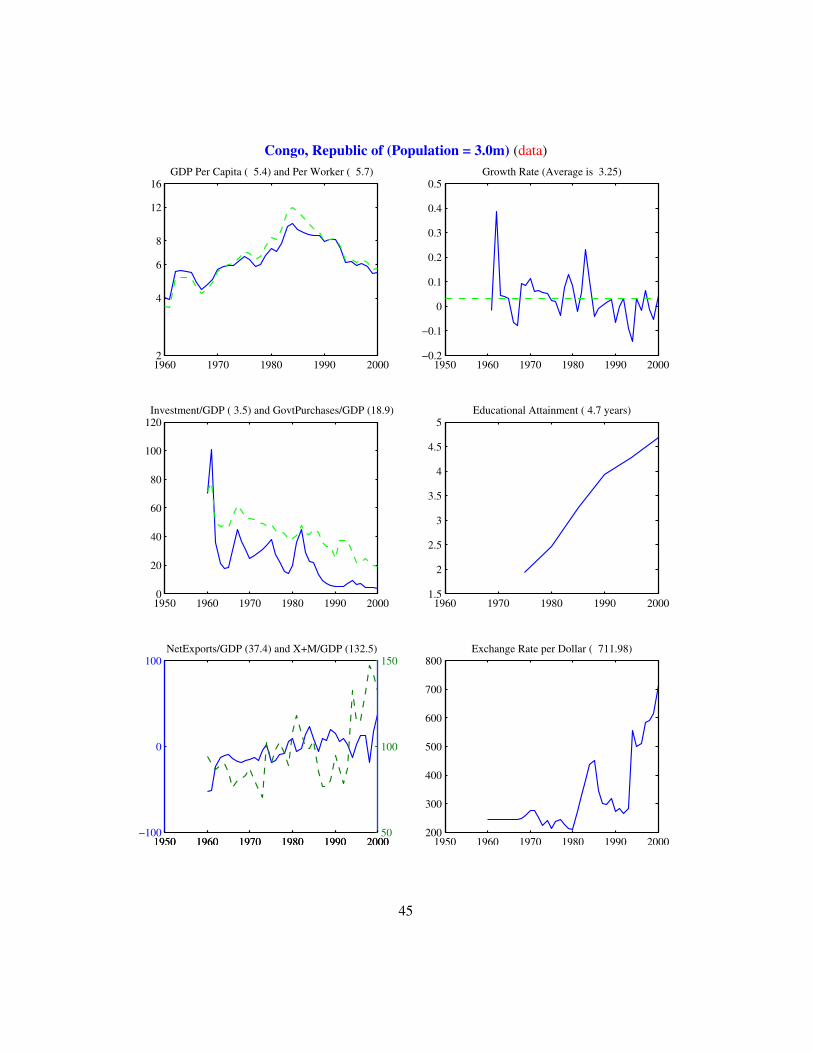
Congo, Republic of (Population = 3.0m) (data)
1960 1970 1980 1990 2000 2
4
6
8
12
16GDP Per Capita ( 5.4) and Per Worker ( 5.7)
1950 1960 1970 1980 1990 2000−0.2
−0.1
0
0.1
0.2
0.3
0.4
0.5Growth Rate (Average is 3.25)
1950 1960 1970 1980 1990 20000
20
40
60
80
100
120Investment/GDP ( 3.5) and GovtPurchases/GDP (18.9)
1960 1970 1980 1990 20001.5
2
2.5
3
3.5
4
4.5
5Educational Attainment ( 4.7 years)
1950 1960 1970 1980 1990 2000−100
0
100NetExports/GDP (37.4) and X+M/GDP (132.5)
1950 1960 1970 1980 1990 200050
100
150
1950 1960 1970 1980 1990 2000200
300
400
500
600
700
800Exchange Rate per Dollar ( 711.98)
45
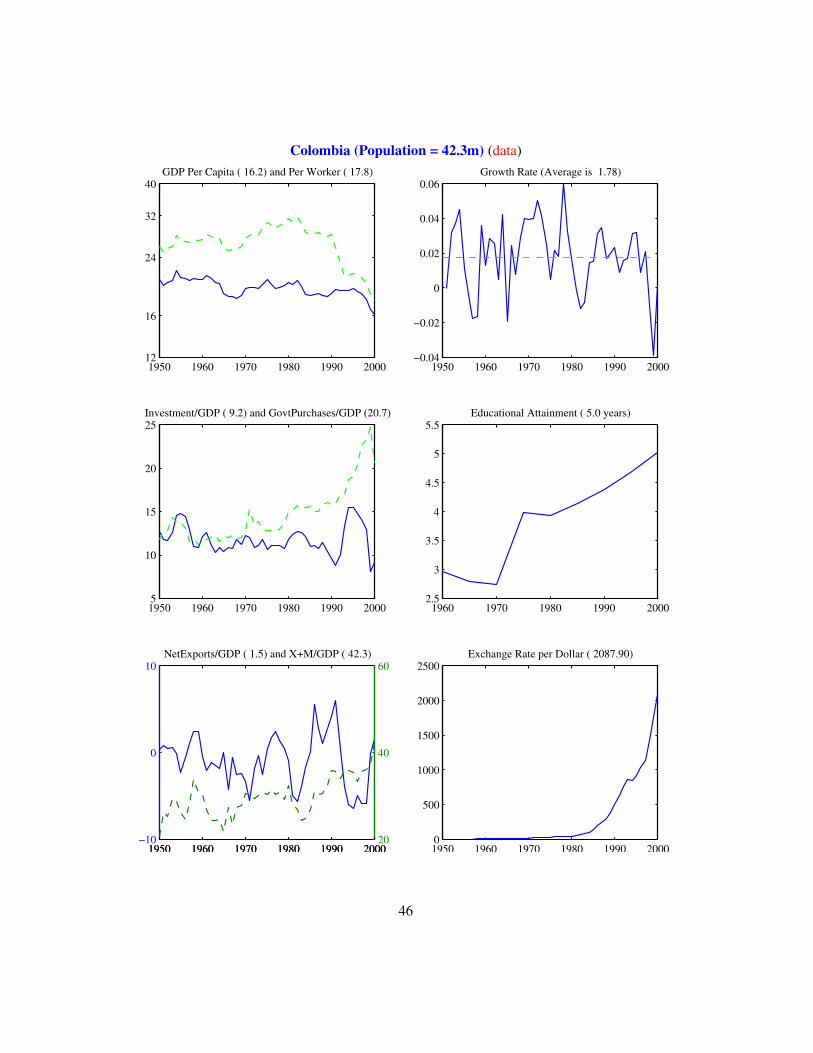
Colombia (Population = 42.3m) (data)
1950 1960 1970 1980 1990 200012
16
24
32
40GDP Per Capita ( 16.2) and Per Worker ( 17.8)
1950 1960 1970 1980 1990 2000−0.04
−0.02
0
0.02
0.04
0.06Growth Rate (Average is 1.78)
1950 1960 1970 1980 1990 20005
10
15
20
25Investment/GDP ( 9.2) and GovtPurchases/GDP (20.7)
1960 1970 1980 1990 20002.5
3
3.5
4
4.5
5
5.5Educational Attainment ( 5.0 years)
1950 1960 1970 1980 1990 2000−10
0
10NetExports/GDP ( 1.5) and X+M/GDP ( 42.3)
1950 1960 1970 1980 1990 200020
40
60
1950 1960 1970 1980 1990 20000
500
1000
1500
2000
2500Exchange Rate per Dollar ( 2087.90)
46
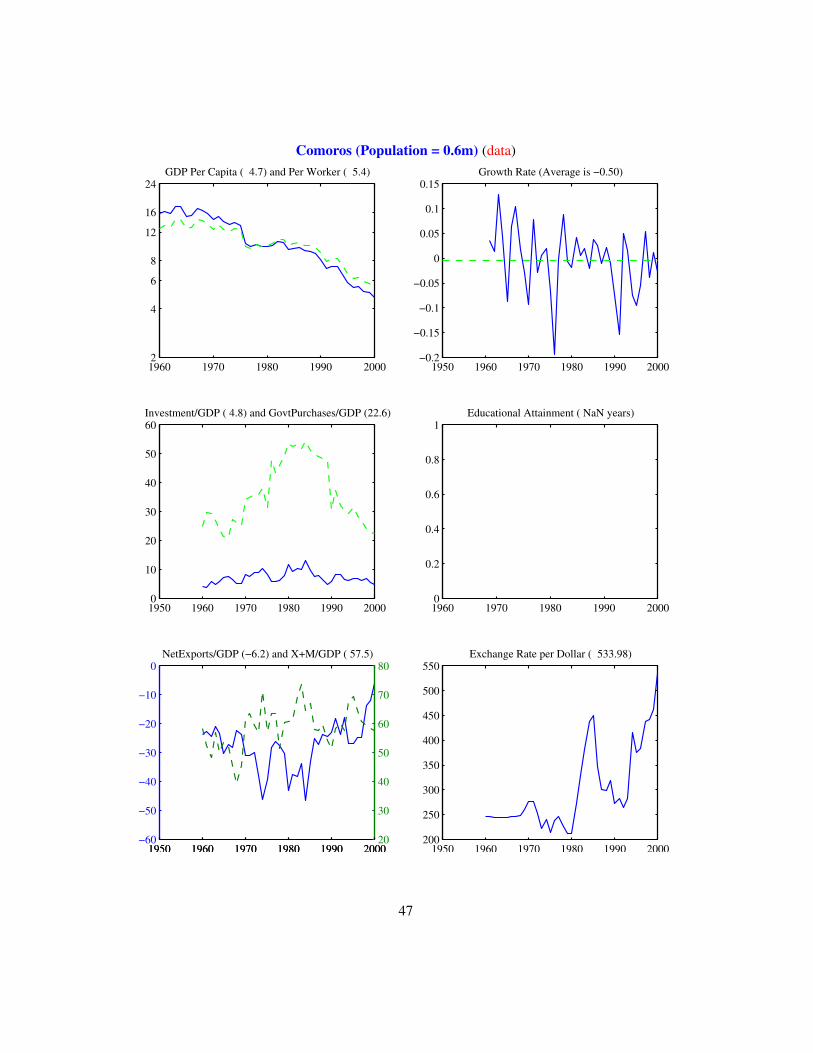
Comoros (Population = 0.6m) (data)
1960 1970 1980 1990 2000 2
4
6
8
12
16
24GDP Per Capita ( 4.7) and Per Worker ( 5.4)
1950 1960 1970 1980 1990 2000−0.2
−0.15
−0.1
−0.05
0
0.05
0.1
0.15Growth Rate (Average is −0.50)
1950 1960 1970 1980 1990 20000
10
20
30
40
50
60Investment/GDP ( 4.8) and GovtPurchases/GDP (22.6)
1960 1970 1980 1990 20000
0.2
0.4
0.6
0.8
1Educational Attainment ( NaN years)
1950 1960 1970 1980 1990 2000−60
−50
−40
−30
−20
−10
0NetExports/GDP (−6.2) and X+M/GDP ( 57.5)
1950 1960 1970 1980 1990 200020
30
40
50
60
70
80
1950 1960 1970 1980 1990 2000200
250
300
350
400
450
500
550Exchange Rate per Dollar ( 533.98)
47
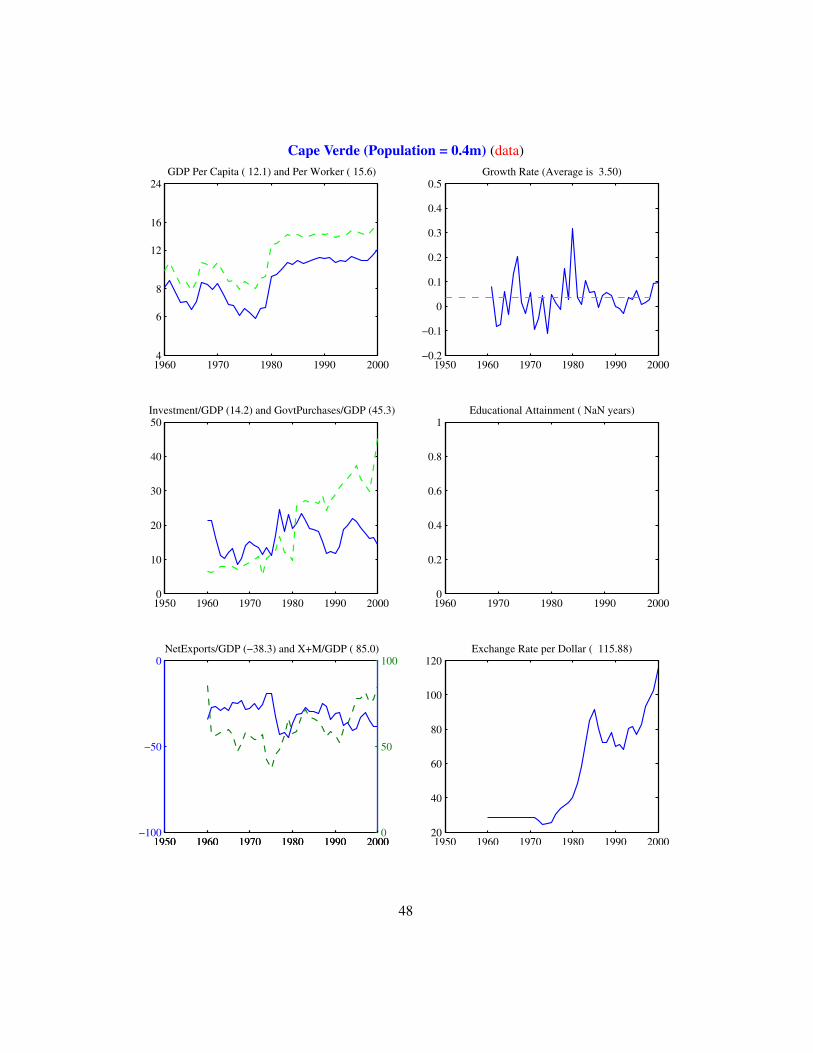
Cape Verde (Population = 0.4m) (data)
1960 1970 1980 1990 2000 4
6
8
12
16
24GDP Per Capita ( 12.1) and Per Worker ( 15.6)
1950 1960 1970 1980 1990 2000−0.2
−0.1
0
0.1
0.2
0.3
0.4
0.5Growth Rate (Average is 3.50)
1950 1960 1970 1980 1990 20000
10
20
30
40
50Investment/GDP (14.2) and GovtPurchases/GDP (45.3)
1960 1970 1980 1990 20000
0.2
0.4
0.6
0.8
1Educational Attainment ( NaN years)
1950 1960 1970 1980 1990 2000−100
−50
0NetExports/GDP (−38.3) and X+M/GDP ( 85.0)
1950 1960 1970 1980 1990 20000
50
100
1950 1960 1970 1980 1990 200020
40
60
80
100
120Exchange Rate per Dollar ( 115.88)
48
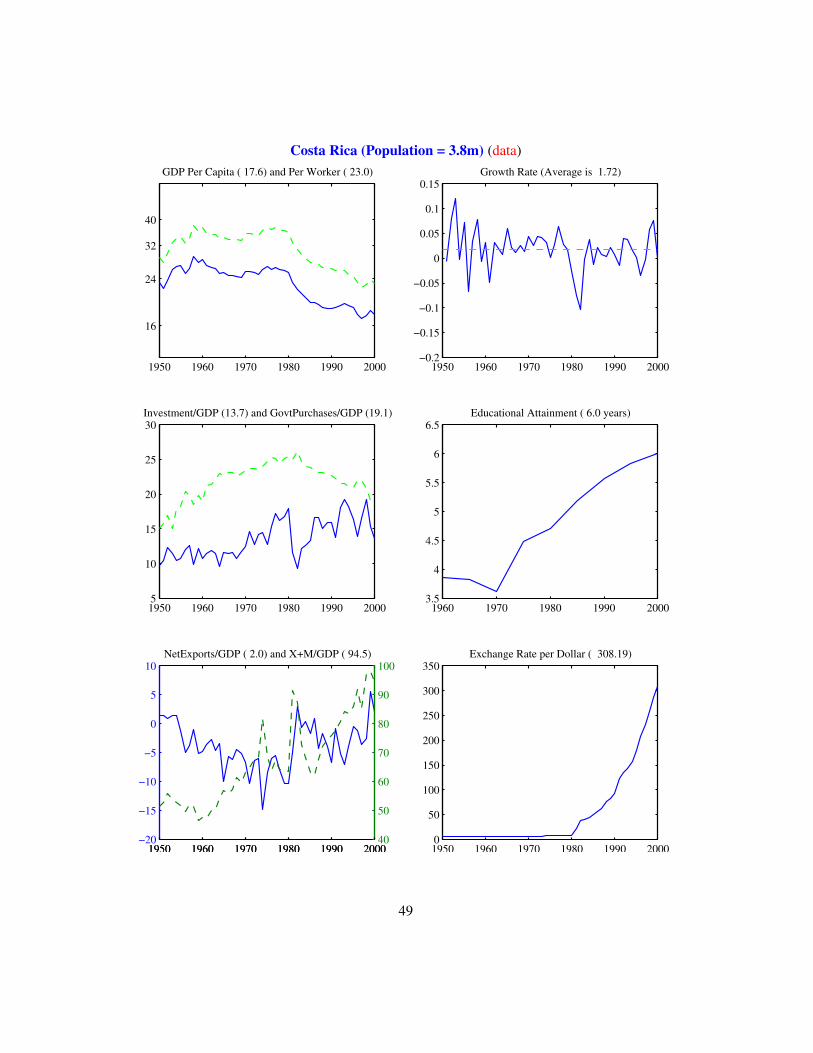
Costa Rica (Population = 3.8m) (data)
1950 1960 1970 1980 1990 2000
16
24
32
40
GDP Per Capita ( 17.6) and Per Worker ( 23.0)
1950 1960 1970 1980 1990 2000−0.2
−0.15
−0.1
−0.05
0
0.05
0.1
0.15Growth Rate (Average is 1.72)
1950 1960 1970 1980 1990 20005
10
15
20
25
30Investment/GDP (13.7) and GovtPurchases/GDP (19.1)
1960 1970 1980 1990 20003.5
4
4.5
5
5.5
6
6.5Educational Attainment ( 6.0 years)
1950 1960 1970 1980 1990 2000−20
−15
−10
−5
0
5
10NetExports/GDP ( 2.0) and X+M/GDP ( 94.5)
1950 1960 1970 1980 1990 200040
50
60
70
80
90
100
1950 1960 1970 1980 1990 20000
50
100
150
200
250
300
350Exchange Rate per Dollar ( 308.19)
49
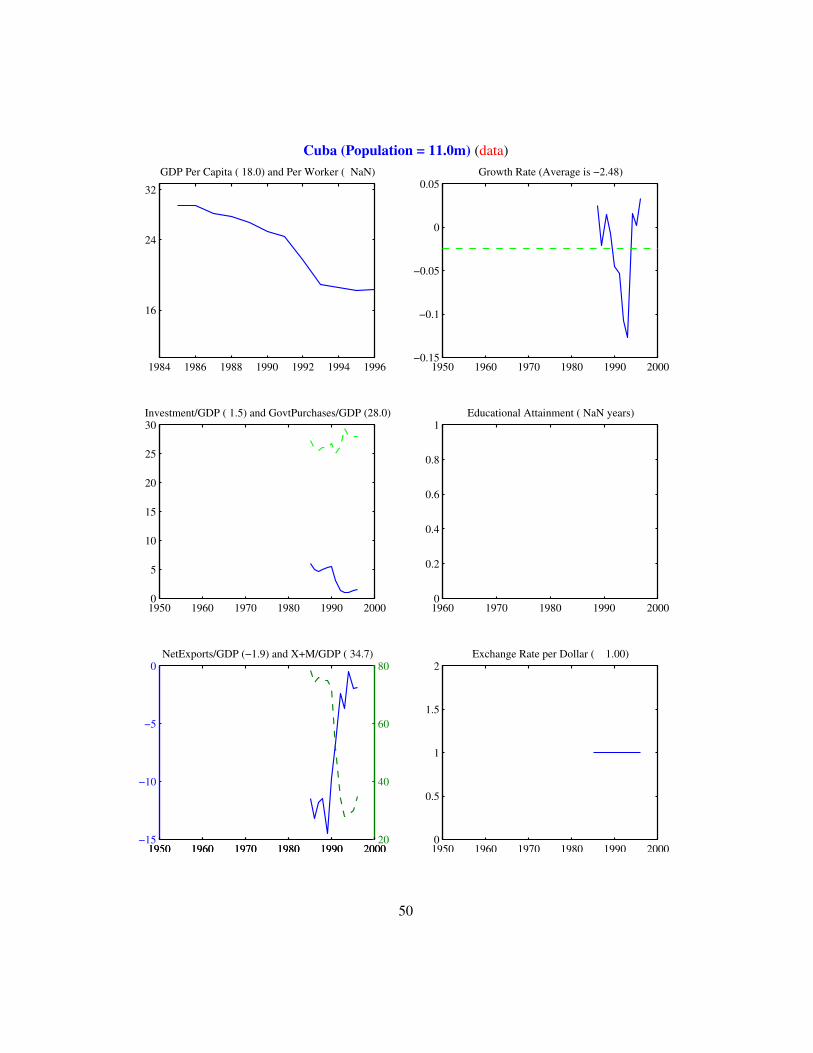
Cuba (Population = 11.0m) (data)
1984 1986 1988 1990 1992 1994 1996
16
24
32
GDP Per Capita ( 18.0) and Per Worker ( NaN)
1950 1960 1970 1980 1990 2000−0.15
−0.1
−0.05
0
0.05Growth Rate (Average is −2.48)
1950 1960 1970 1980 1990 20000
5
10
15
20
25
30Investment/GDP ( 1.5) and GovtPurchases/GDP (28.0)
1960 1970 1980 1990 20000
0.2
0.4
0.6
0.8
1Educational Attainment ( NaN years)
1950 1960 1970 1980 1990 2000−15
−10
−5
0NetExports/GDP (−1.9) and X+M/GDP ( 34.7)
1950 1960 1970 1980 1990 200020
40
60
80
1950 1960 1970 1980 1990 20000
0.5
1
1.5
2Exchange Rate per Dollar ( 1.00)
50
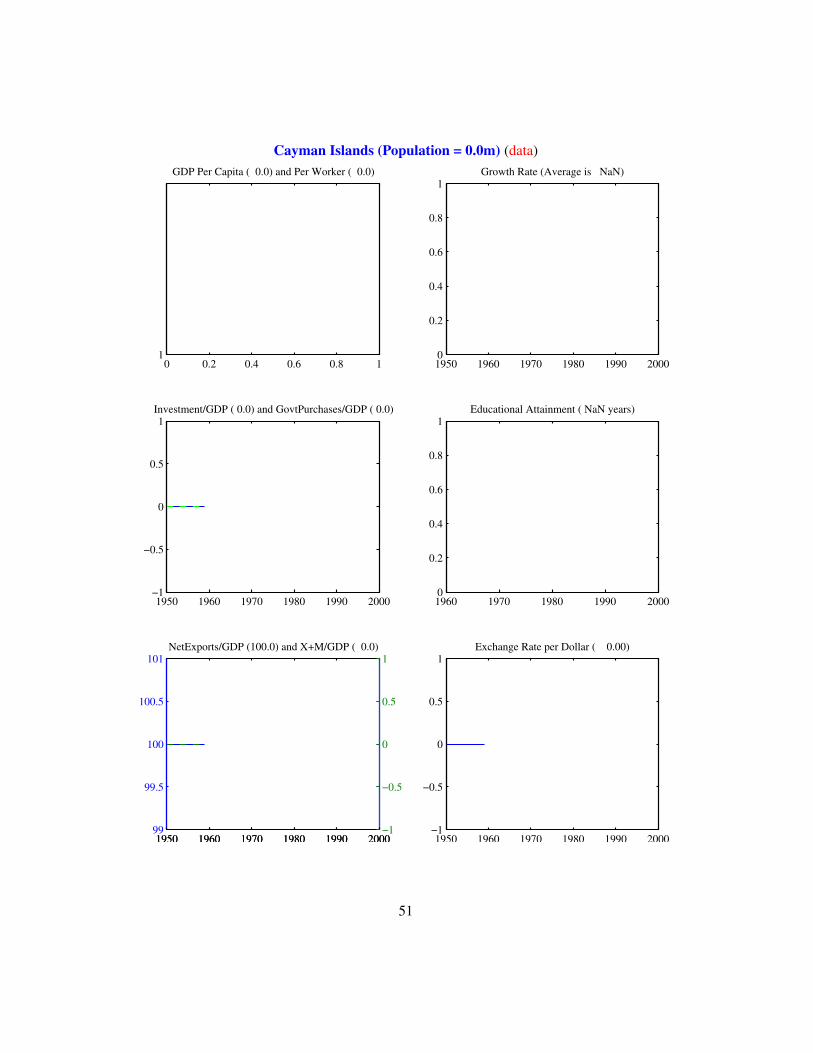
Cayman Islands (Population = 0.0m) (data)
0 0.2 0.4 0.6 0.8 11
GDP Per Capita ( 0.0) and Per Worker ( 0.0)
1950 1960 1970 1980 1990 20000
0.2
0.4
0.6
0.8
1Growth Rate (Average is NaN)
1950 1960 1970 1980 1990 2000−1
−0.5
0
0.5
1Investment/GDP ( 0.0) and GovtPurchases/GDP ( 0.0)
1960 1970 1980 1990 20000
0.2
0.4
0.6
0.8
1Educational Attainment ( NaN years)
1950 1960 1970 1980 1990 200099
99.5
100
100.5
101NetExports/GDP (100.0) and X+M/GDP ( 0.0)
1950 1960 1970 1980 1990 2000−1
−0.5
0
0.5
1
1950 1960 1970 1980 1990 2000−1
−0.5
0
0.5
1Exchange Rate per Dollar ( 0.00)
51
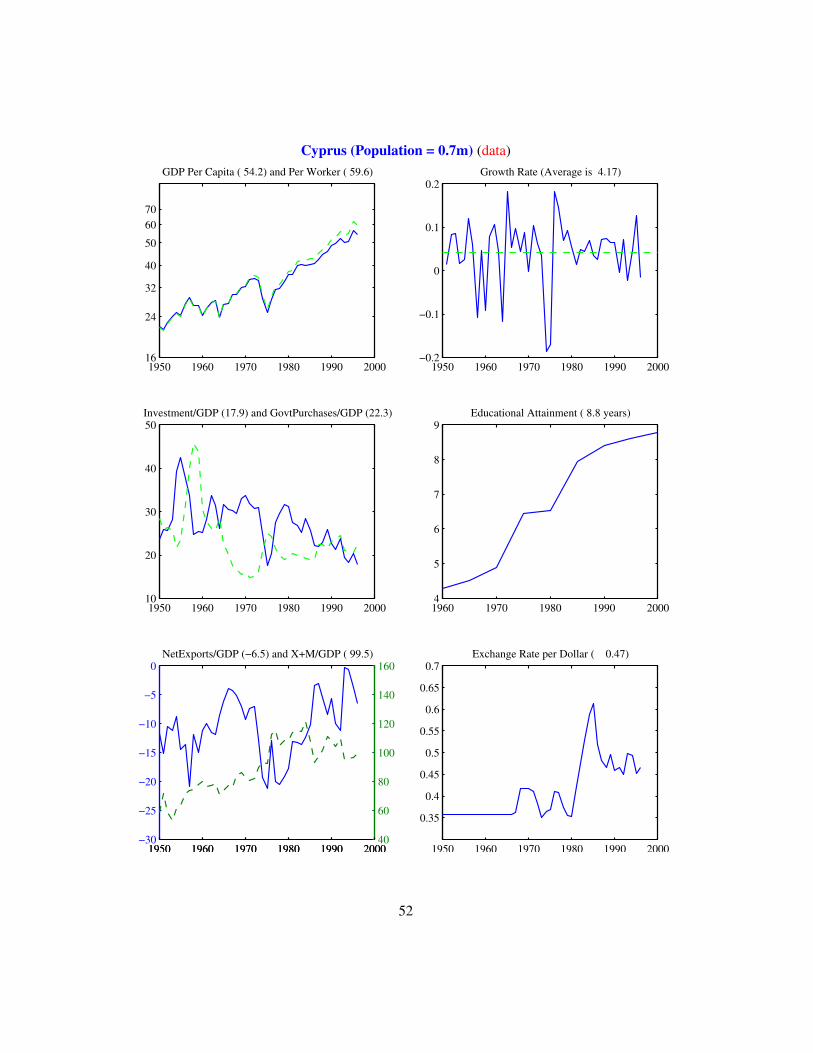
Cyprus (Population = 0.7m) (data)
1950 1960 1970 1980 1990 200016
24
32
40
50
6070
GDP Per Capita ( 54.2) and Per Worker ( 59.6)
1950 1960 1970 1980 1990 2000−0.2
−0.1
0
0.1
0.2Growth Rate (Average is 4.17)
1950 1960 1970 1980 1990 200010
20
30
40
50Investment/GDP (17.9) and GovtPurchases/GDP (22.3)
1960 1970 1980 1990 20004
5
6
7
8
9Educational Attainment ( 8.8 years)
1950 1960 1970 1980 1990 2000−30
−25
−20
−15
−10
−5
0NetExports/GDP (−6.5) and X+M/GDP ( 99.5)
1950 1960 1970 1980 1990 200040
60
80
100
120
140
160
1950 1960 1970 1980 1990 2000
0.35
0.4
0.45
0.5
0.55
0.6
0.65
0.7Exchange Rate per Dollar ( 0.47)
52
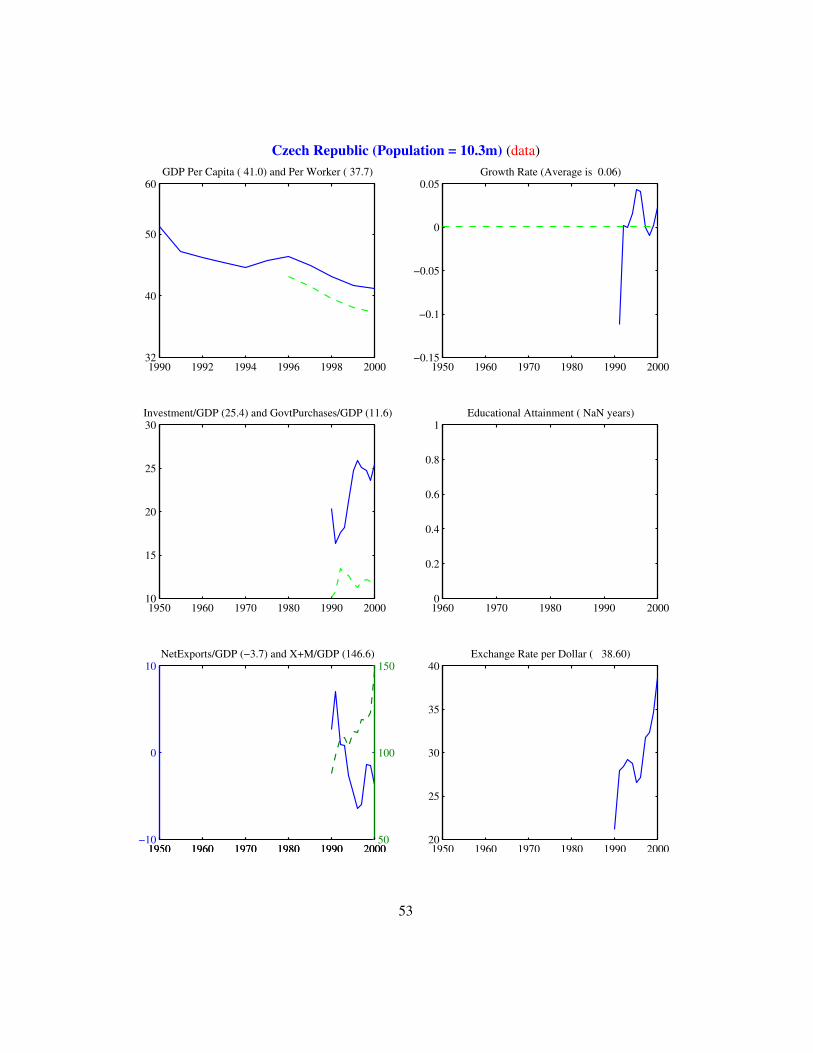
Czech Republic (Population = 10.3m) (data)
1990 1992 1994 1996 1998 200032
40
50
60GDP Per Capita ( 41.0) and Per Worker ( 37.7)
1950 1960 1970 1980 1990 2000−0.15
−0.1
−0.05
0
0.05Growth Rate (Average is 0.06)
1950 1960 1970 1980 1990 200010
15
20
25
30Investment/GDP (25.4) and GovtPurchases/GDP (11.6)
1960 1970 1980 1990 20000
0.2
0.4
0.6
0.8
1Educational Attainment ( NaN years)
1950 1960 1970 1980 1990 2000−10
0
10NetExports/GDP (−3.7) and X+M/GDP (146.6)
1950 1960 1970 1980 1990 200050
100
150
1950 1960 1970 1980 1990 200020
25
30
35
40Exchange Rate per Dollar ( 38.60)
53
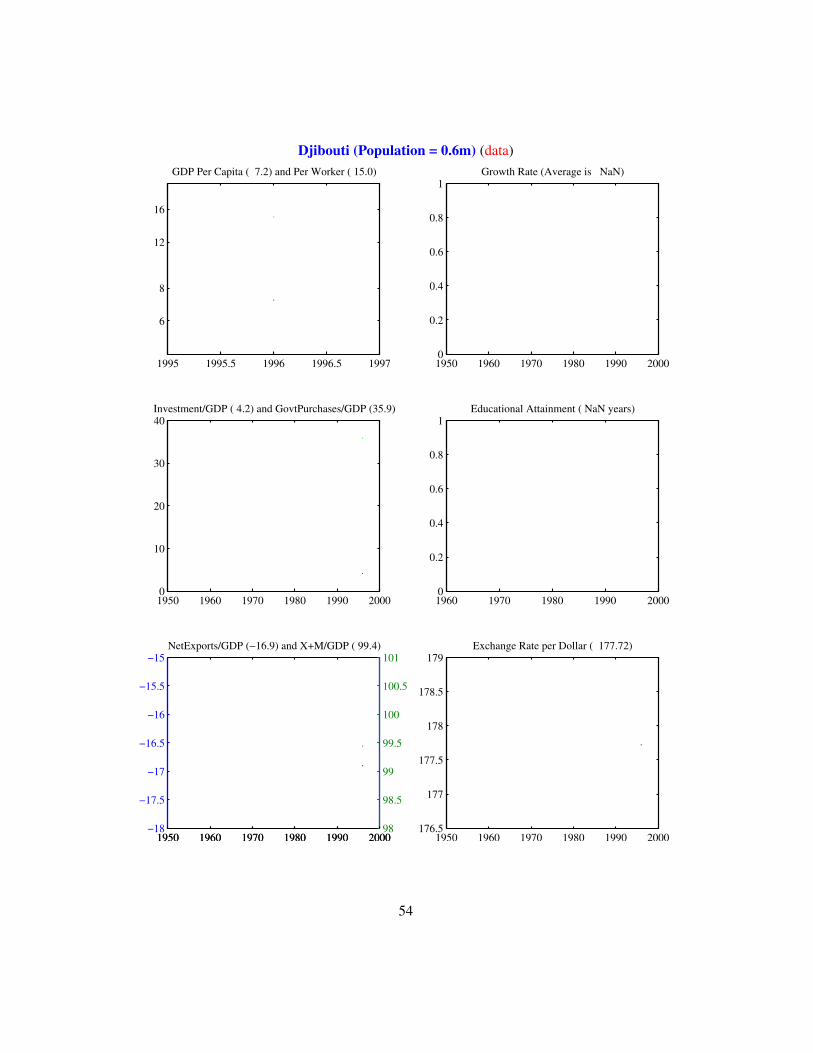
Djibouti (Population = 0.6m) (data)
1995 1995.5 1996 1996.5 1997
6
8
12
16
GDP Per Capita ( 7.2) and Per Worker ( 15.0)
1950 1960 1970 1980 1990 20000
0.2
0.4
0.6
0.8
1Growth Rate (Average is NaN)
1950 1960 1970 1980 1990 20000
10
20
30
40Investment/GDP ( 4.2) and GovtPurchases/GDP (35.9)
1960 1970 1980 1990 20000
0.2
0.4
0.6
0.8
1Educational Attainment ( NaN years)
1950 1960 1970 1980 1990 2000−18
−17.5
−17
−16.5
−16
−15.5
−15NetExports/GDP (−16.9) and X+M/GDP ( 99.4)
1950 1960 1970 1980 1990 200098
98.5
99
99.5
100
100.5
101
1950 1960 1970 1980 1990 2000176.5
177
177.5
178
178.5
179Exchange Rate per Dollar ( 177.72)
54
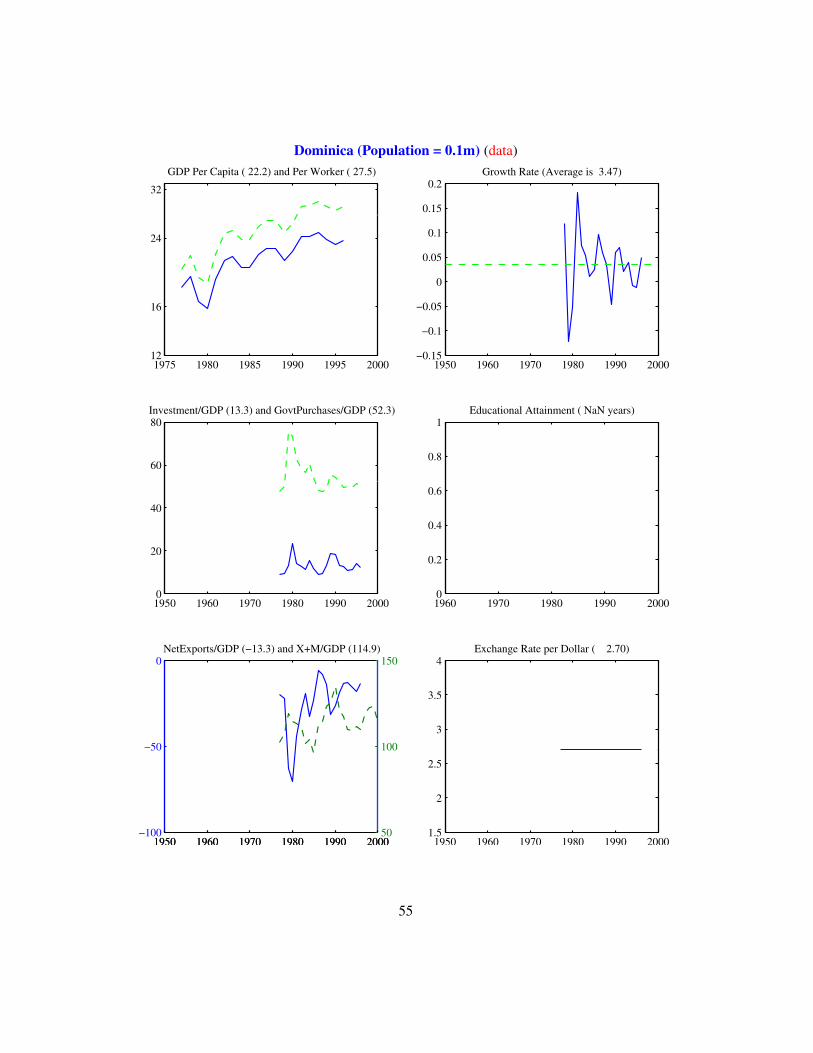
Dominica (Population = 0.1m) (data)
1975 1980 1985 1990 1995 200012
16
24
32
GDP Per Capita ( 22.2) and Per Worker ( 27.5)
1950 1960 1970 1980 1990 2000−0.15
−0.1
−0.05
0
0.05
0.1
0.15
0.2Growth Rate (Average is 3.47)
1950 1960 1970 1980 1990 20000
20
40
60
80Investment/GDP (13.3) and GovtPurchases/GDP (52.3)
1960 1970 1980 1990 20000
0.2
0.4
0.6
0.8
1Educational Attainment ( NaN years)
1950 1960 1970 1980 1990 2000−100
−50
0NetExports/GDP (−13.3) and X+M/GDP (114.9)
1950 1960 1970 1980 1990 200050
100
150
1950 1960 1970 1980 1990 20001.5
2
2.5
3
3.5
4Exchange Rate per Dollar ( 2.70)
55
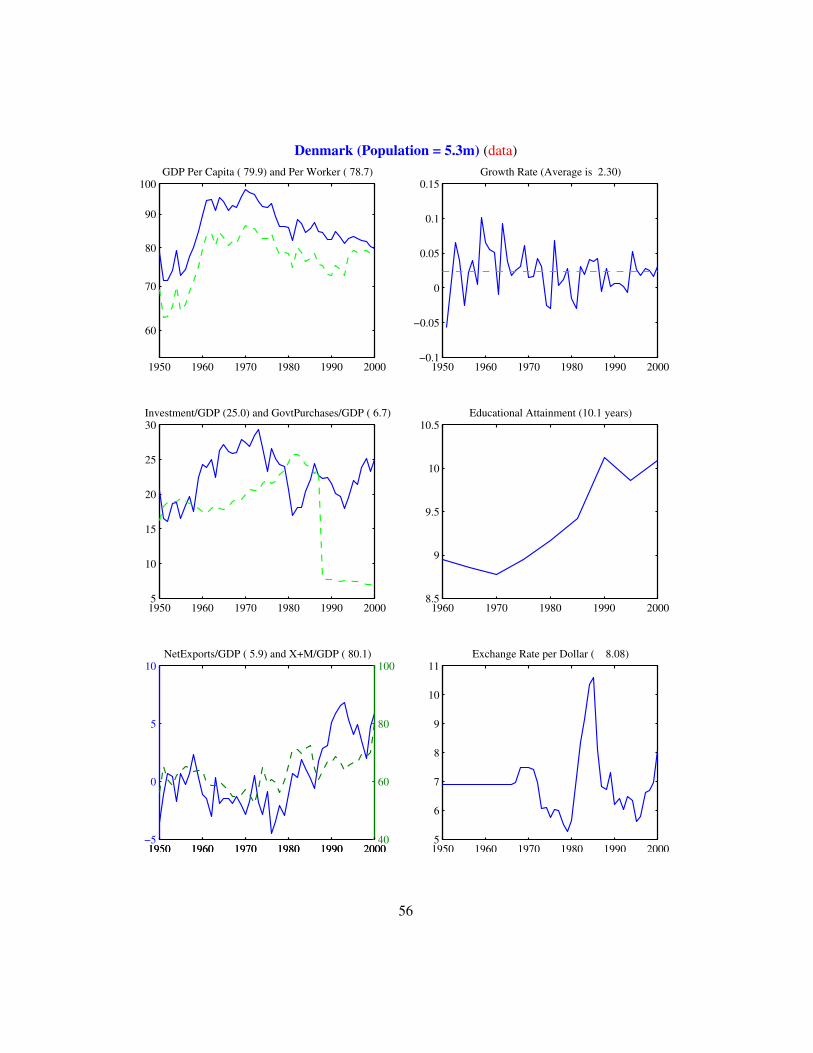
Denmark (Population = 5.3m) (data)
1950 1960 1970 1980 1990 2000
60
70
80
90
100GDP Per Capita ( 79.9) and Per Worker ( 78.7)
1950 1960 1970 1980 1990 2000−0.1
−0.05
0
0.05
0.1
0.15Growth Rate (Average is 2.30)
1950 1960 1970 1980 1990 20005
10
15
20
25
30Investment/GDP (25.0) and GovtPurchases/GDP ( 6.7)
1960 1970 1980 1990 20008.5
9
9.5
10
10.5Educational Attainment (10.1 years)
1950 1960 1970 1980 1990 2000−5
0
5
10NetExports/GDP ( 5.9) and X+M/GDP ( 80.1)
1950 1960 1970 1980 1990 200040
60
80
100
1950 1960 1970 1980 1990 20005
6
7
8
9
10
11Exchange Rate per Dollar ( 8.08)
56
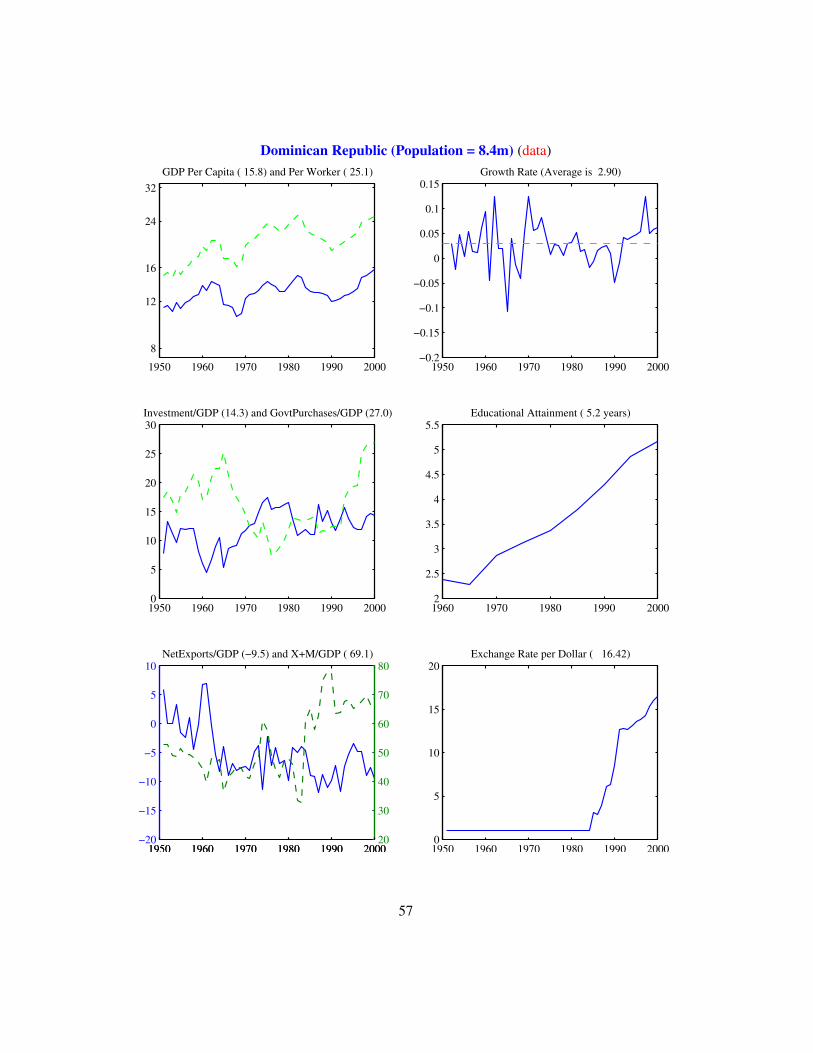
Dominican Republic (Population = 8.4m) (data)
1950 1960 1970 1980 1990 2000
8
12
16
24
32GDP Per Capita ( 15.8) and Per Worker ( 25.1)
1950 1960 1970 1980 1990 2000−0.2
−0.15
−0.1
−0.05
0
0.05
0.1
0.15Growth Rate (Average is 2.90)
1950 1960 1970 1980 1990 20000
5
10
15
20
25
30Investment/GDP (14.3) and GovtPurchases/GDP (27.0)
1960 1970 1980 1990 20002
2.5
3
3.5
4
4.5
5
5.5Educational Attainment ( 5.2 years)
1950 1960 1970 1980 1990 2000−20
−15
−10
−5
0
5
10NetExports/GDP (−9.5) and X+M/GDP ( 69.1)
1950 1960 1970 1980 1990 200020
30
40
50
60
70
80
1950 1960 1970 1980 1990 20000
5
10
15
20Exchange Rate per Dollar ( 16.42)
57
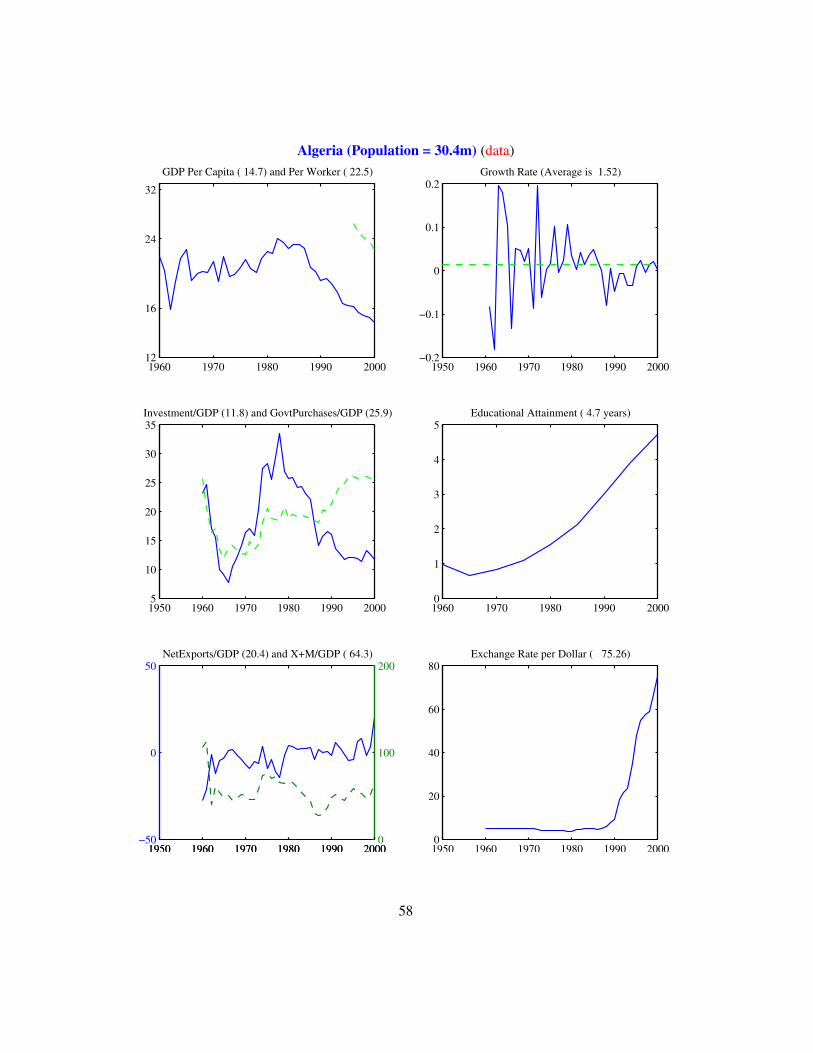
Algeria (Population = 30.4m) (data)
1960 1970 1980 1990 200012
16
24
32
GDP Per Capita ( 14.7) and Per Worker ( 22.5)
1950 1960 1970 1980 1990 2000−0.2
−0.1
0
0.1
0.2Growth Rate (Average is 1.52)
1950 1960 1970 1980 1990 20005
10
15
20
25
30
35Investment/GDP (11.8) and GovtPurchases/GDP (25.9)
1960 1970 1980 1990 20000
1
2
3
4
5Educational Attainment ( 4.7 years)
1950 1960 1970 1980 1990 2000−50
0
50NetExports/GDP (20.4) and X+M/GDP ( 64.3)
1950 1960 1970 1980 1990 20000
100
200
1950 1960 1970 1980 1990 20000
20
40
60
80Exchange Rate per Dollar ( 75.26)
58
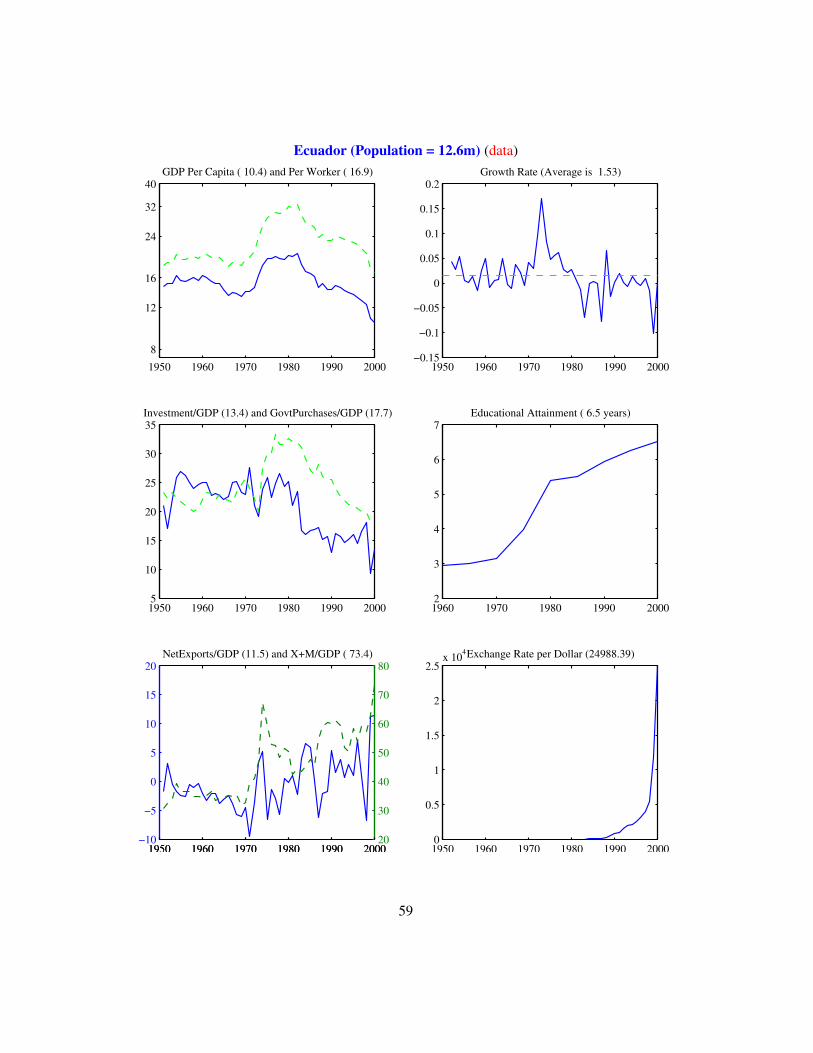
Ecuador (Population = 12.6m) (data)
1950 1960 1970 1980 1990 2000
8
12
16
24
32
40GDP Per Capita ( 10.4) and Per Worker ( 16.9)
1950 1960 1970 1980 1990 2000−0.15
−0.1
−0.05
0
0.05
0.1
0.15
0.2Growth Rate (Average is 1.53)
1950 1960 1970 1980 1990 20005
10
15
20
25
30
35Investment/GDP (13.4) and GovtPurchases/GDP (17.7)
1960 1970 1980 1990 20002
3
4
5
6
7Educational Attainment ( 6.5 years)
1950 1960 1970 1980 1990 2000−10
−5
0
5
10
15
20NetExports/GDP (11.5) and X+M/GDP ( 73.4)
1950 1960 1970 1980 1990 200020
30
40
50
60
70
80
1950 1960 1970 1980 1990 20000
0.5
1
1.5
2
2.5x 10⁴Exchange Rate per Dollar (24988.39)
59
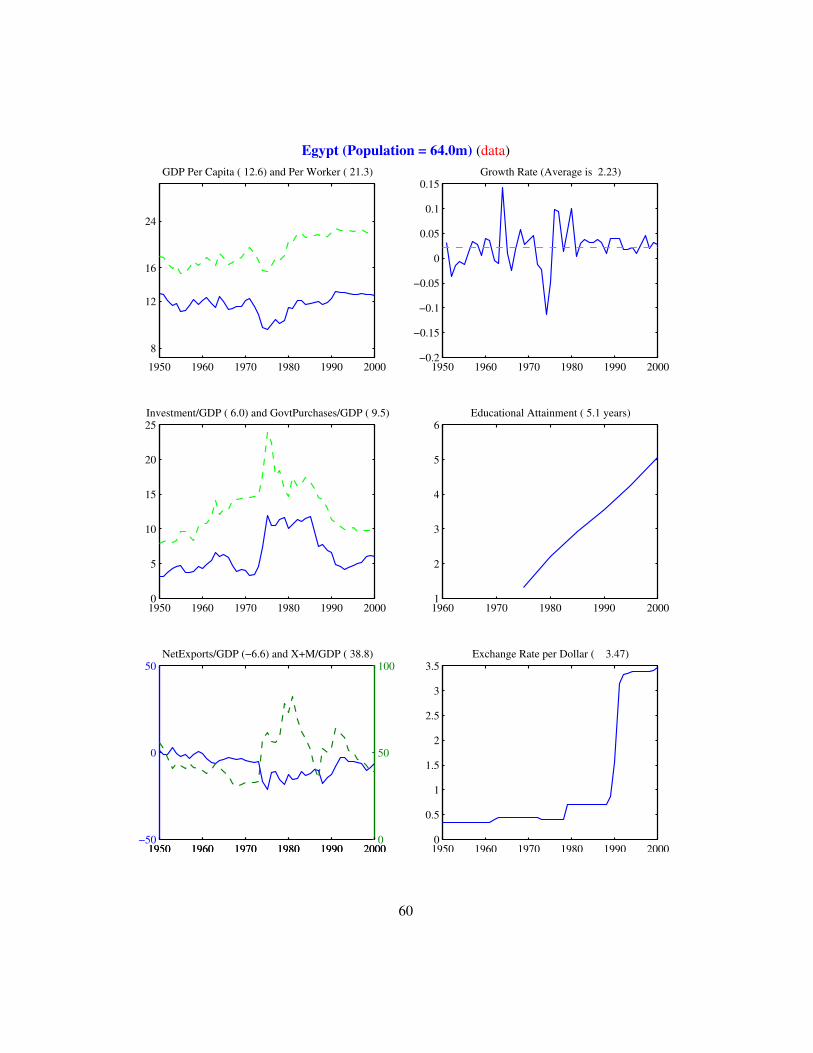
Egypt (Population = 64.0m) (data)
1950 1960 1970 1980 1990 2000
8
12
16
24
GDP Per Capita ( 12.6) and Per Worker ( 21.3)
1950 1960 1970 1980 1990 2000−0.2
−0.15
−0.1
−0.05
0
0.05
0.1
0.15Growth Rate (Average is 2.23)
1950 1960 1970 1980 1990 20000
5
10
15
20
25Investment/GDP ( 6.0) and GovtPurchases/GDP ( 9.5)
1960 1970 1980 1990 20001
2
3
4
5
6Educational Attainment ( 5.1 years)
1950 1960 1970 1980 1990 2000−50
0
50NetExports/GDP (−6.6) and X+M/GDP ( 38.8)
1950 1960 1970 1980 1990 20000
50
100
1950 1960 1970 1980 1990 20000
0.5
1
1.5
2
2.5
3
3.5Exchange Rate per Dollar ( 3.47)
60
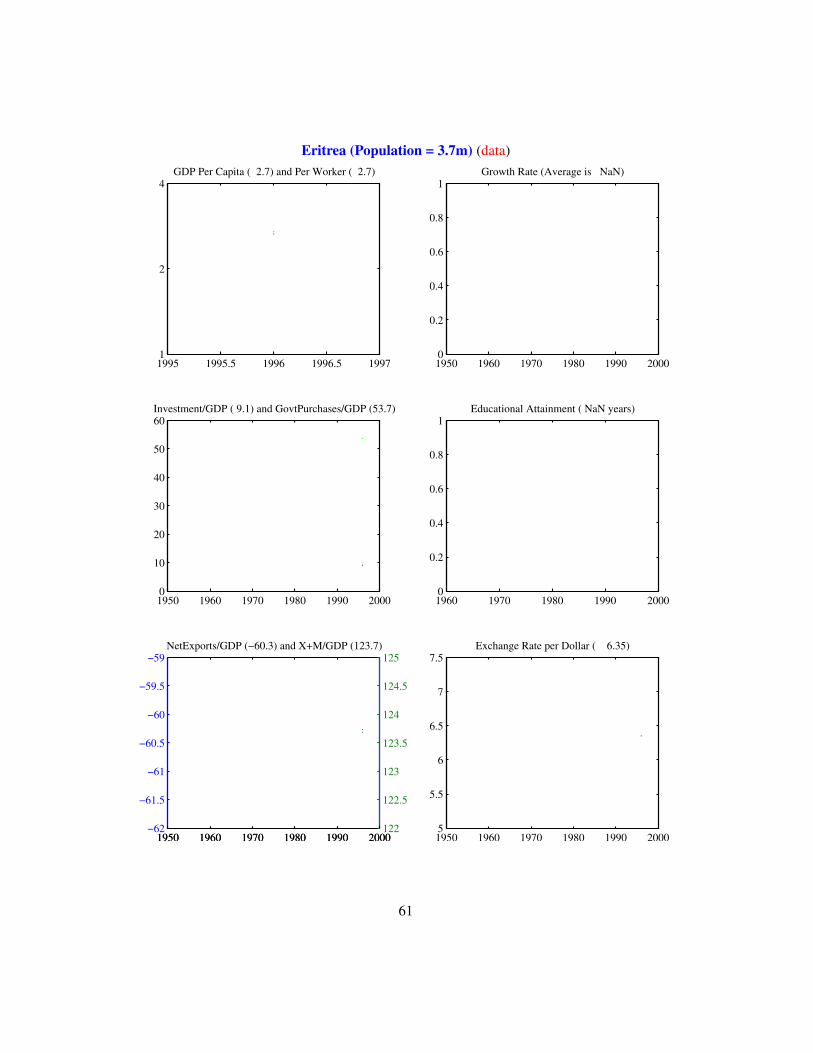
Eritrea (Population = 3.7m) (data)
1995 1995.5 1996 1996.5 19971
2
4GDP Per Capita ( 2.7) and Per Worker ( 2.7)
1950 1960 1970 1980 1990 20000
0.2
0.4
0.6
0.8
1Growth Rate (Average is NaN)
1950 1960 1970 1980 1990 20000
10
20
30
40
50
60Investment/GDP ( 9.1) and GovtPurchases/GDP (53.7)
1960 1970 1980 1990 20000
0.2
0.4
0.6
0.8
1Educational Attainment ( NaN years)
1950 1960 1970 1980 1990 2000−62
−61.5
−61
−60.5
−60
−59.5
−59NetExports/GDP (−60.3) and X+M/GDP (123.7)
1950 1960 1970 1980 1990 2000122
122.5
123
123.5
124
124.5
125
1950 1960 1970 1980 1990 20005
5.5
6
6.5
7
7.5Exchange Rate per Dollar ( 6.35)
61
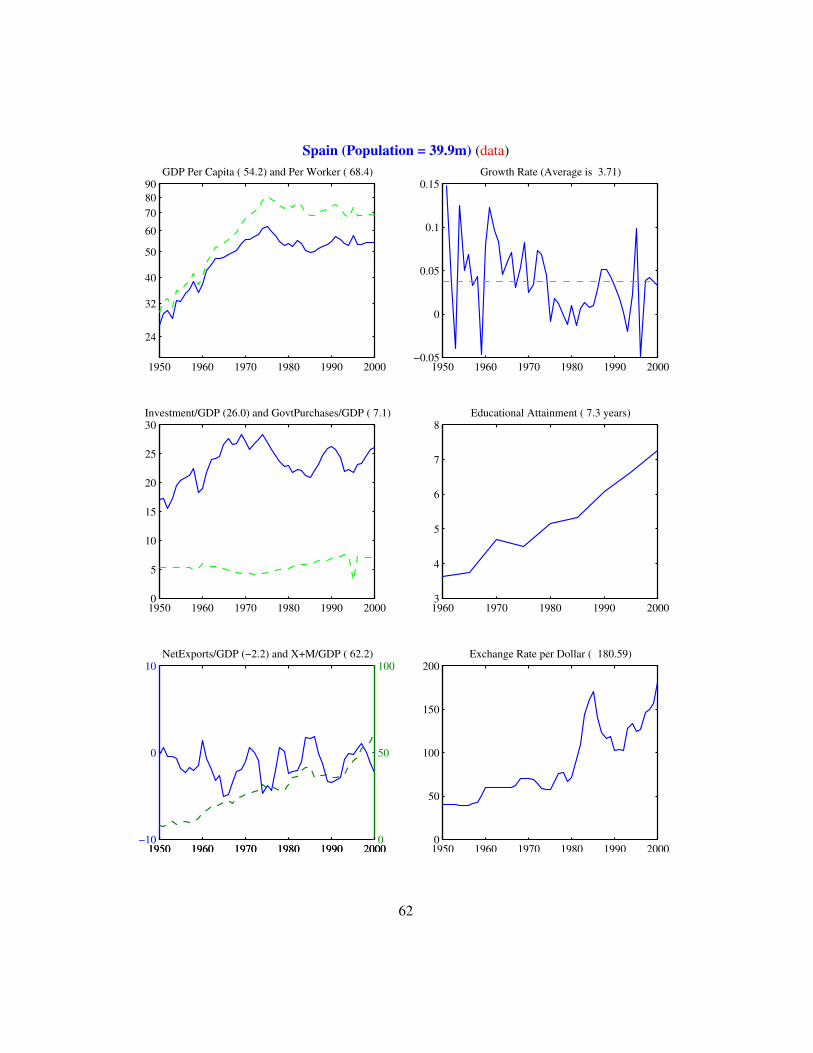
Spain (Population = 39.9m) (data)
1950 1960 1970 1980 1990 2000
24
32
40
50
60
708090
GDP Per Capita ( 54.2) and Per Worker ( 68.4)
1950 1960 1970 1980 1990 2000−0.05
0
0.05
0.1
0.15Growth Rate (Average is 3.71)
1950 1960 1970 1980 1990 20000
5
10
15
20
25
30Investment/GDP (26.0) and GovtPurchases/GDP ( 7.1)
1960 1970 1980 1990 20003
4
5
6
7
8Educational Attainment ( 7.3 years)
1950 1960 1970 1980 1990 2000−10
0
10NetExports/GDP (−2.2) and X+M/GDP ( 62.2)
1950 1960 1970 1980 1990 20000
50
100
1950 1960 1970 1980 1990 20000
50
100
150
200Exchange Rate per Dollar ( 180.59)
62
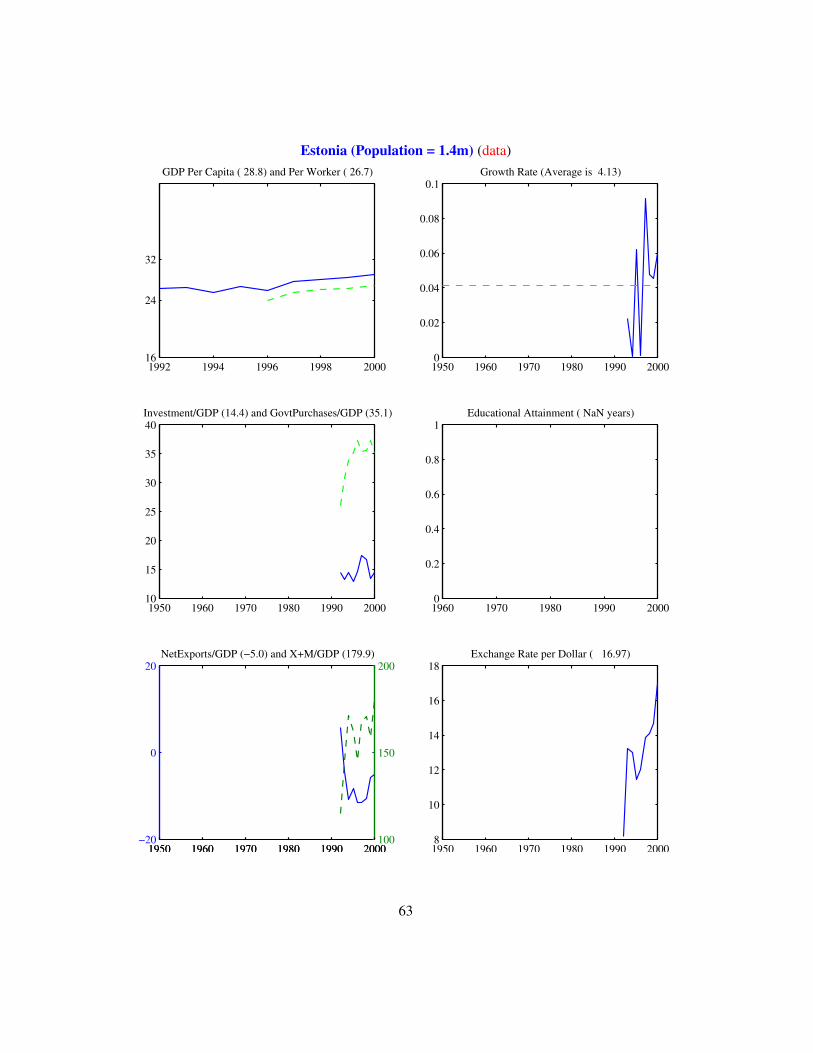
Estonia (Population = 1.4m) (data)
1992 1994 1996 1998 200016
24
32
GDP Per Capita ( 28.8) and Per Worker ( 26.7)
1950 1960 1970 1980 1990 20000
0.02
0.04
0.06
0.08
0.1Growth Rate (Average is 4.13)
1950 1960 1970 1980 1990 200010
15
20
25
30
35
40Investment/GDP (14.4) and GovtPurchases/GDP (35.1)
1960 1970 1980 1990 20000
0.2
0.4
0.6
0.8
1Educational Attainment ( NaN years)
1950 1960 1970 1980 1990 2000−20
0
20NetExports/GDP (−5.0) and X+M/GDP (179.9)
1950 1960 1970 1980 1990 2000100
150
200
1950 1960 1970 1980 1990 20008
10
12
14
16
18Exchange Rate per Dollar ( 16.97)
63
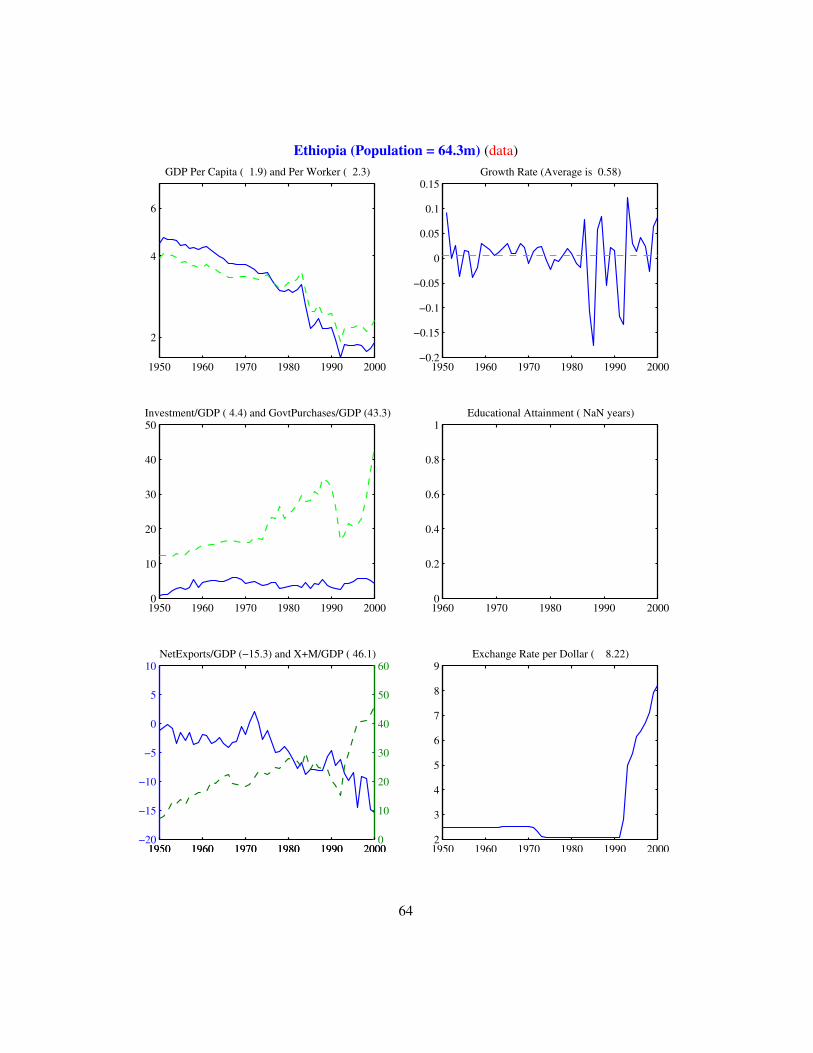
Ethiopia (Population = 64.3m) (data)
1950 1960 1970 1980 1990 2000
2
4
6
GDP Per Capita ( 1.9) and Per Worker ( 2.3)
1950 1960 1970 1980 1990 2000−0.2
−0.15
−0.1
−0.05
0
0.05
0.1
0.15Growth Rate (Average is 0.58)
1950 1960 1970 1980 1990 20000
10
20
30
40
50Investment/GDP ( 4.4) and GovtPurchases/GDP (43.3)
1960 1970 1980 1990 20000
0.2
0.4
0.6
0.8
1Educational Attainment ( NaN years)
1950 1960 1970 1980 1990 2000−20
−15
−10
−5
0
5
10NetExports/GDP (−15.3) and X+M/GDP ( 46.1)
1950 1960 1970 1980 1990 20000
10
20
30
40
50
60
1950 1960 1970 1980 1990 20002
3
4
5
6
7
8
9Exchange Rate per Dollar ( 8.22)
64
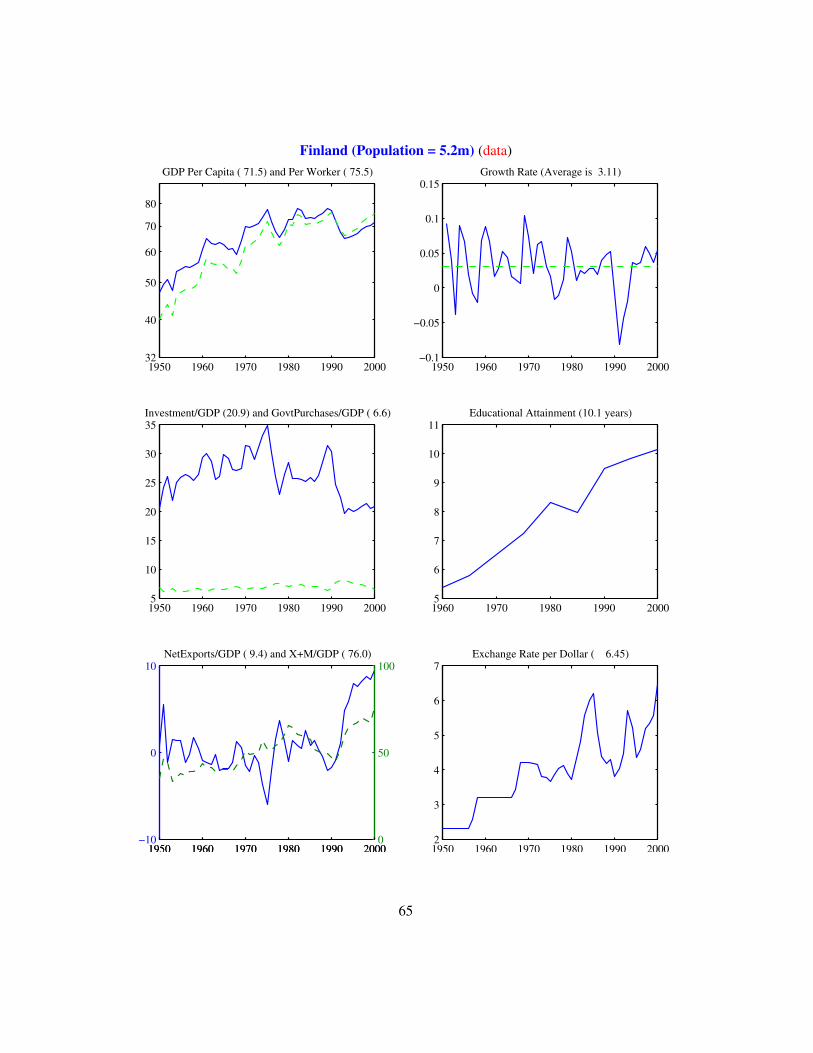
Finland (Population = 5.2m) (data)
1950 1960 1970 1980 1990 200032
40
50
60
70
80
GDP Per Capita ( 71.5) and Per Worker ( 75.5)
1950 1960 1970 1980 1990 2000−0.1
−0.05
0
0.05
0.1
0.15Growth Rate (Average is 3.11)
1950 1960 1970 1980 1990 20005
10
15
20
25
30
35Investment/GDP (20.9) and GovtPurchases/GDP ( 6.6)
1960 1970 1980 1990 20005
6
7
8
9
10
11Educational Attainment (10.1 years)
1950 1960 1970 1980 1990 2000−10
0
10NetExports/GDP ( 9.4) and X+M/GDP ( 76.0)
1950 1960 1970 1980 1990 20000
50
100
1950 1960 1970 1980 1990 20002
3
4
5
6
7Exchange Rate per Dollar ( 6.45)
65
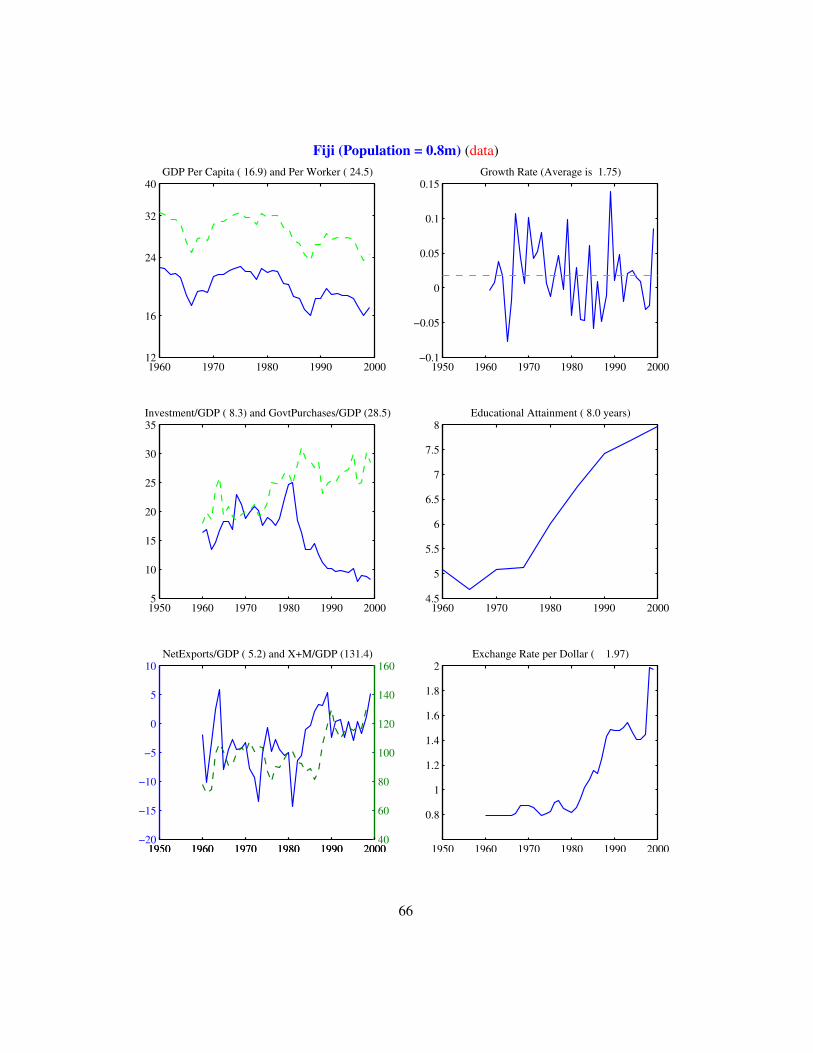
Fiji (Population = 0.8m) (data)
1960 1970 1980 1990 200012
16
24
32
40GDP Per Capita ( 16.9) and Per Worker ( 24.5)
1950 1960 1970 1980 1990 2000−0.1
−0.05
0
0.05
0.1
0.15Growth Rate (Average is 1.75)
1950 1960 1970 1980 1990 20005
10
15
20
25
30
35Investment/GDP ( 8.3) and GovtPurchases/GDP (28.5)
1960 1970 1980 1990 20004.5
5
5.5
6
6.5
7
7.5
8Educational Attainment ( 8.0 years)
1950 1960 1970 1980 1990 2000−20
−15
−10
−5
0
5
10NetExports/GDP ( 5.2) and X+M/GDP (131.4)
1950 1960 1970 1980 1990 200040
60
80
100
120
140
160
1950 1960 1970 1980 1990 2000
0.8
1
1.2
1.4
1.6
1.8
2Exchange Rate per Dollar ( 1.97)
66
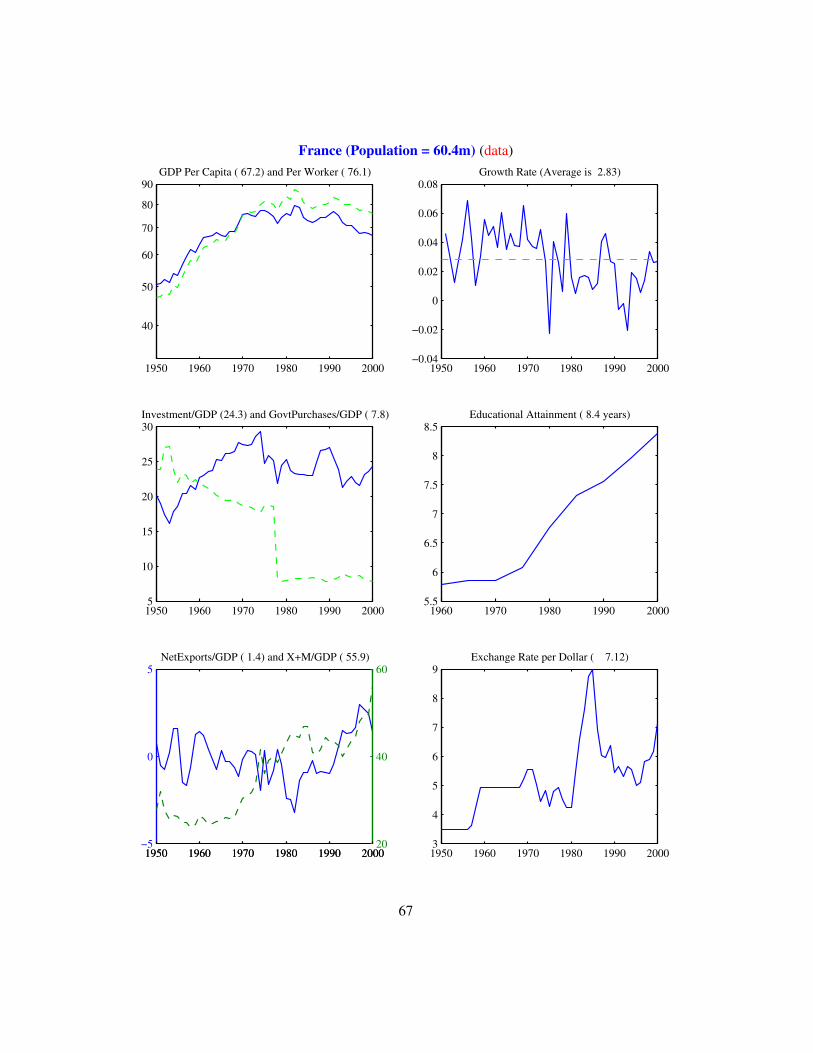
France (Population = 60.4m) (data)
1950 1960 1970 1980 1990 2000
40
50
60
70
80
90GDP Per Capita ( 67.2) and Per Worker ( 76.1)
1950 1960 1970 1980 1990 2000−0.04
−0.02
0
0.02
0.04
0.06
0.08Growth Rate (Average is 2.83)
1950 1960 1970 1980 1990 20005
10
15
20
25
30Investment/GDP (24.3) and GovtPurchases/GDP ( 7.8)
1960 1970 1980 1990 20005.5
6
6.5
7
7.5
8
8.5Educational Attainment ( 8.4 years)
1950 1960 1970 1980 1990 2000−5
0
5NetExports/GDP ( 1.4) and X+M/GDP ( 55.9)
1950 1960 1970 1980 1990 200020
40
60
1950 1960 1970 1980 1990 20003
4
5
6
7
8
9Exchange Rate per Dollar ( 7.12)
67

Faeroe Islands (Population = 0.0m) (data)
0 0.2 0.4 0.6 0.8 11
GDP Per Capita ( 0.0) and Per Worker ( 0.0)
1950 1960 1970 1980 1990 20000
0.2
0.4
0.6
0.8
1Growth Rate (Average is NaN)
1950 1960 1970 1980 1990 2000−1
−0.5
0
0.5
1Investment/GDP ( 0.0) and GovtPurchases/GDP ( 0.0)
1960 1970 1980 1990 20000
0.2
0.4
0.6
0.8
1Educational Attainment ( NaN years)
1950 1960 1970 1980 1990 200099
99.5
100
100.5
101NetExports/GDP (100.0) and X+M/GDP ( 0.0)
1950 1960 1970 1980 1990 2000−1
−0.5
0
0.5
1
1950 1960 1970 1980 1990 2000−1
−0.5
0
0.5
1Exchange Rate per Dollar ( 0.00)
68
Micronesia, Fed. Sts. (Population = 0.0m) (data)
0 0.2 0.4 0.6 0.8 11
GDP Per Capita ( 0.0) and Per Worker ( 0.0)
1950 1960 1970 1980 1990 20000
0.2
0.4
0.6
0.8
1Growth Rate (Average is NaN)
1950 1960 1970 1980 1990 2000−1
−0.5
0
0.5
1Investment/GDP ( 0.0) and GovtPurchases/GDP ( 0.0)
1960 1970 1980 1990 20000
0.2
0.4
0.6
0.8
1Educational Attainment ( NaN years)
1950 1960 1970 1980 1990 200099
99.5
100
100.5
101NetExports/GDP (100.0) and X+M/GDP ( 0.0)
1950 1960 1970 1980 1990 2000−1
−0.5
0
0.5
1
1950 1960 1970 1980 1990 2000−1
−0.5
0
0.5
1Exchange Rate per Dollar ( 0.00)
69
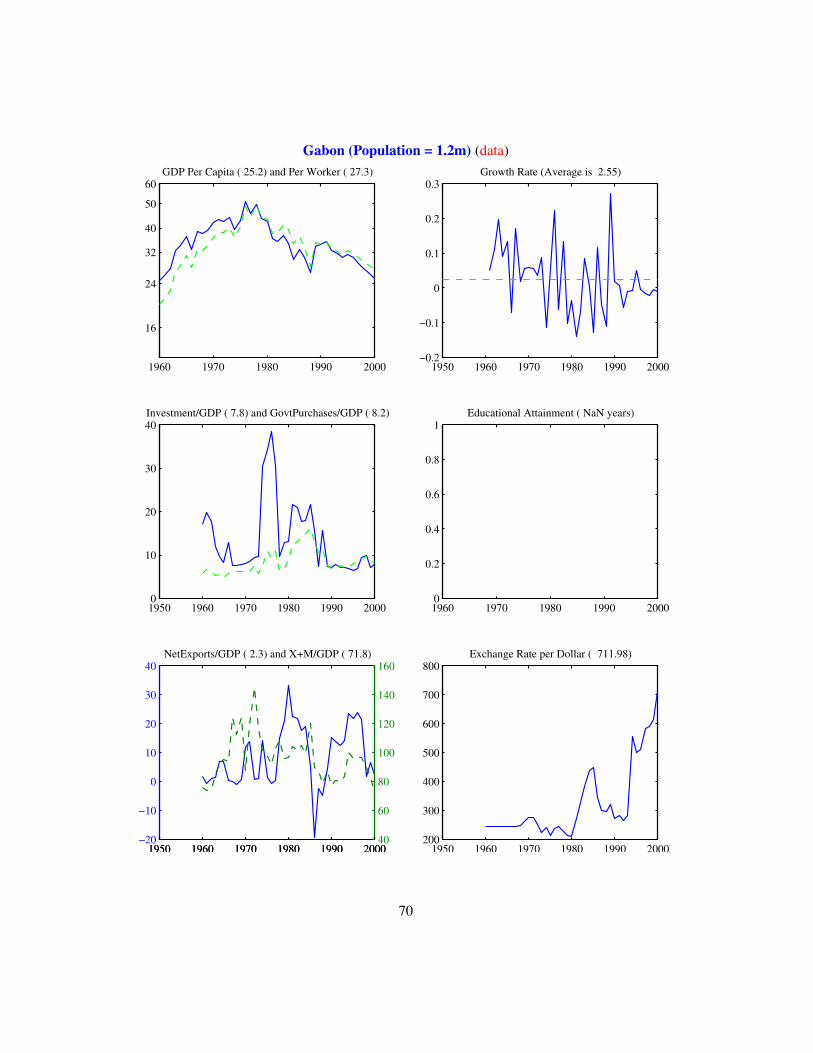
Gabon (Population = 1.2m) (data)
1960 1970 1980 1990 2000
16
24
32
40
50
60GDP Per Capita ( 25.2) and Per Worker ( 27.3)
1950 1960 1970 1980 1990 2000−0.2
−0.1
0
0.1
0.2
0.3Growth Rate (Average is 2.55)
1950 1960 1970 1980 1990 20000
10
20
30
40Investment/GDP ( 7.8) and GovtPurchases/GDP ( 8.2)
1960 1970 1980 1990 20000
0.2
0.4
0.6
0.8
1Educational Attainment ( NaN years)
1950 1960 1970 1980 1990 2000−20
−10
0
10
20
30
40NetExports/GDP ( 2.3) and X+M/GDP ( 71.8)
1950 1960 1970 1980 1990 200040
60
80
100
120
140
160
1950 1960 1970 1980 1990 2000200
300
400
500
600
700
800Exchange Rate per Dollar ( 711.98)
70
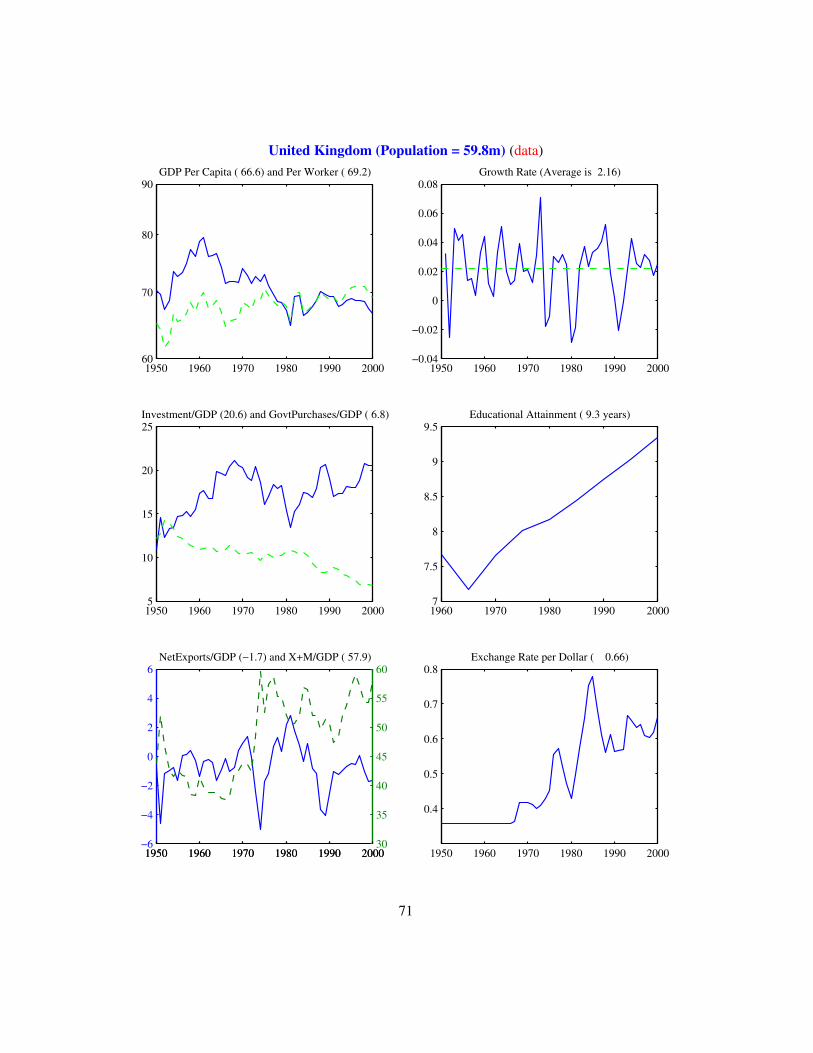
United Kingdom (Population = 59.8m) (data)
1950 1960 1970 1980 1990 200060
70
80
90GDP Per Capita ( 66.6) and Per Worker ( 69.2)
1950 1960 1970 1980 1990 2000−0.04
−0.02
0
0.02
0.04
0.06
0.08Growth Rate (Average is 2.16)
1950 1960 1970 1980 1990 20005
10
15
20
25Investment/GDP (20.6) and GovtPurchases/GDP ( 6.8)
1960 1970 1980 1990 20007
7.5
8
8.5
9
9.5Educational Attainment ( 9.3 years)
1950 1960 1970 1980 1990 2000−6
−4
−2
0
2
4
6NetExports/GDP (−1.7) and X+M/GDP ( 57.9)
1950 1960 1970 1980 1990 200030
35
40
45
50
55
60
1950 1960 1970 1980 1990 2000
0.4
0.5
0.6
0.7
0.8Exchange Rate per Dollar ( 0.66)
71
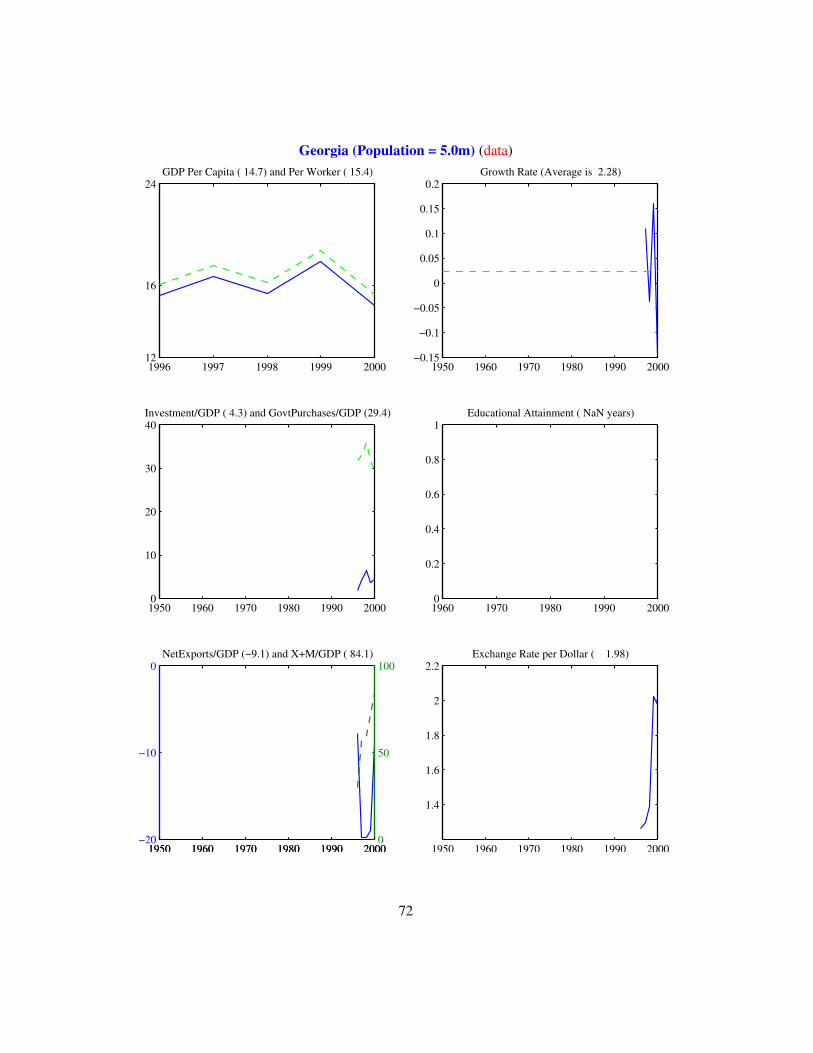
Georgia (Population = 5.0m) (data)
1996 1997 1998 1999 200012
16
24GDP Per Capita ( 14.7) and Per Worker ( 15.4)
1950 1960 1970 1980 1990 2000−0.15
−0.1
−0.05
0
0.05
0.1
0.15
0.2Growth Rate (Average is 2.28)
1950 1960 1970 1980 1990 20000
10
20
30
40Investment/GDP ( 4.3) and GovtPurchases/GDP (29.4)
1960 1970 1980 1990 20000
0.2
0.4
0.6
0.8
1Educational Attainment ( NaN years)
1950 1960 1970 1980 1990 2000−20
−10
0NetExports/GDP (−9.1) and X+M/GDP ( 84.1)
1950 1960 1970 1980 1990 20000
50
100
1950 1960 1970 1980 1990 2000
1.4
1.6
1.8
2
2.2Exchange Rate per Dollar ( 1.98)
72
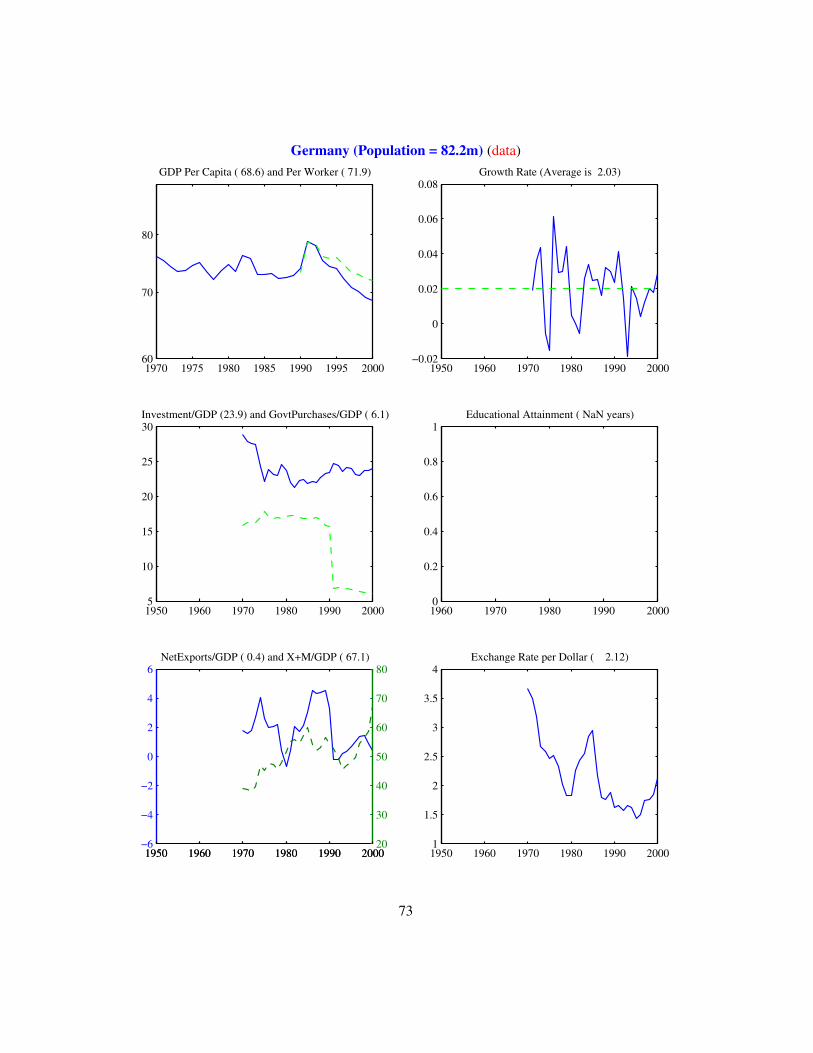
Germany (Population = 82.2m) (data)
1970 1975 1980 1985 1990 1995 200060
70
80
GDP Per Capita ( 68.6) and Per Worker ( 71.9)
1950 1960 1970 1980 1990 2000−0.02
0
0.02
0.04
0.06
0.08Growth Rate (Average is 2.03)
1950 1960 1970 1980 1990 20005
10
15
20
25
30Investment/GDP (23.9) and GovtPurchases/GDP ( 6.1)
1960 1970 1980 1990 20000
0.2
0.4
0.6
0.8
1Educational Attainment ( NaN years)
1950 1960 1970 1980 1990 2000−6
−4
−2
0
2
4
6NetExports/GDP ( 0.4) and X+M/GDP ( 67.1)
1950 1960 1970 1980 1990 200020
30
40
50
60
70
80
1950 1960 1970 1980 1990 20001
1.5
2
2.5
3
3.5
4Exchange Rate per Dollar ( 2.12)
73
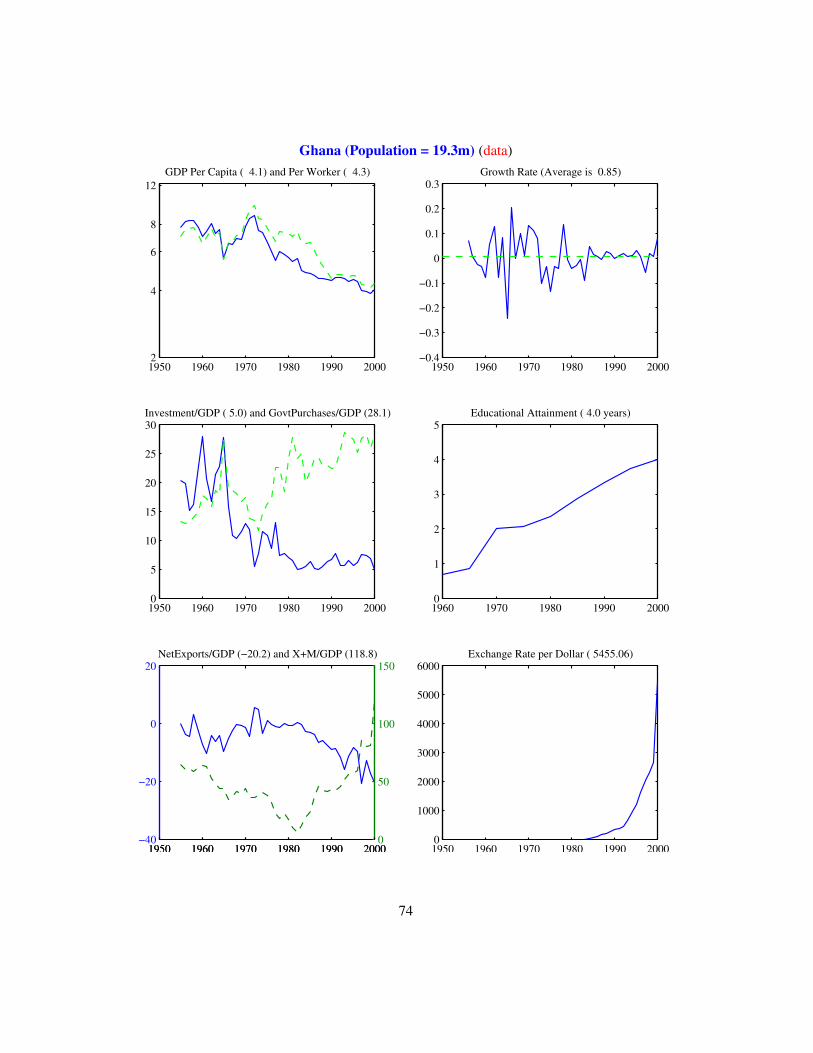
Ghana (Population = 19.3m) (data)
1950 1960 1970 1980 1990 2000 2
4
6
8
12GDP Per Capita ( 4.1) and Per Worker ( 4.3)
1950 1960 1970 1980 1990 2000−0.4
−0.3
−0.2
−0.1
0
0.1
0.2
0.3Growth Rate (Average is 0.85)
1950 1960 1970 1980 1990 20000
5
10
15
20
25
30Investment/GDP ( 5.0) and GovtPurchases/GDP (28.1)
1960 1970 1980 1990 20000
1
2
3
4
5Educational Attainment ( 4.0 years)
1950 1960 1970 1980 1990 2000−40
−20
0
20NetExports/GDP (−20.2) and X+M/GDP (118.8)
1950 1960 1970 1980 1990 20000
50
100
150
1950 1960 1970 1980 1990 20000
1000
2000
3000
4000
5000
6000Exchange Rate per Dollar ( 5455.06)
74
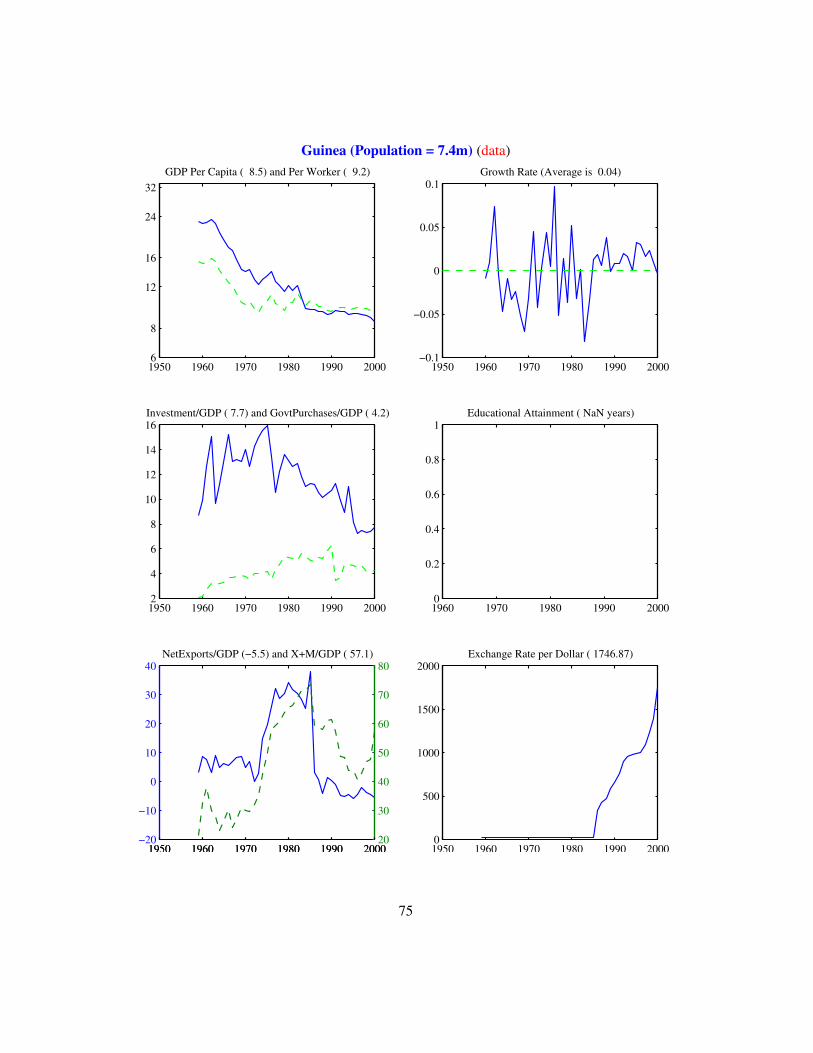
Guinea (Population = 7.4m) (data)
1950 1960 1970 1980 1990 2000 6
8
12
16
24
32GDP Per Capita ( 8.5) and Per Worker ( 9.2)
1950 1960 1970 1980 1990 2000−0.1
−0.05
0
0.05
0.1Growth Rate (Average is 0.04)
1950 1960 1970 1980 1990 20002
4
6
8
10
12
14
16Investment/GDP ( 7.7) and GovtPurchases/GDP ( 4.2)
1960 1970 1980 1990 20000
0.2
0.4
0.6
0.8
1Educational Attainment ( NaN years)
1950 1960 1970 1980 1990 2000−20
−10
0
10
20
30
40NetExports/GDP (−5.5) and X+M/GDP ( 57.1)
1950 1960 1970 1980 1990 200020
30
40
50
60
70
80
1950 1960 1970 1980 1990 20000
500
1000
1500
2000Exchange Rate per Dollar ( 1746.87)
75
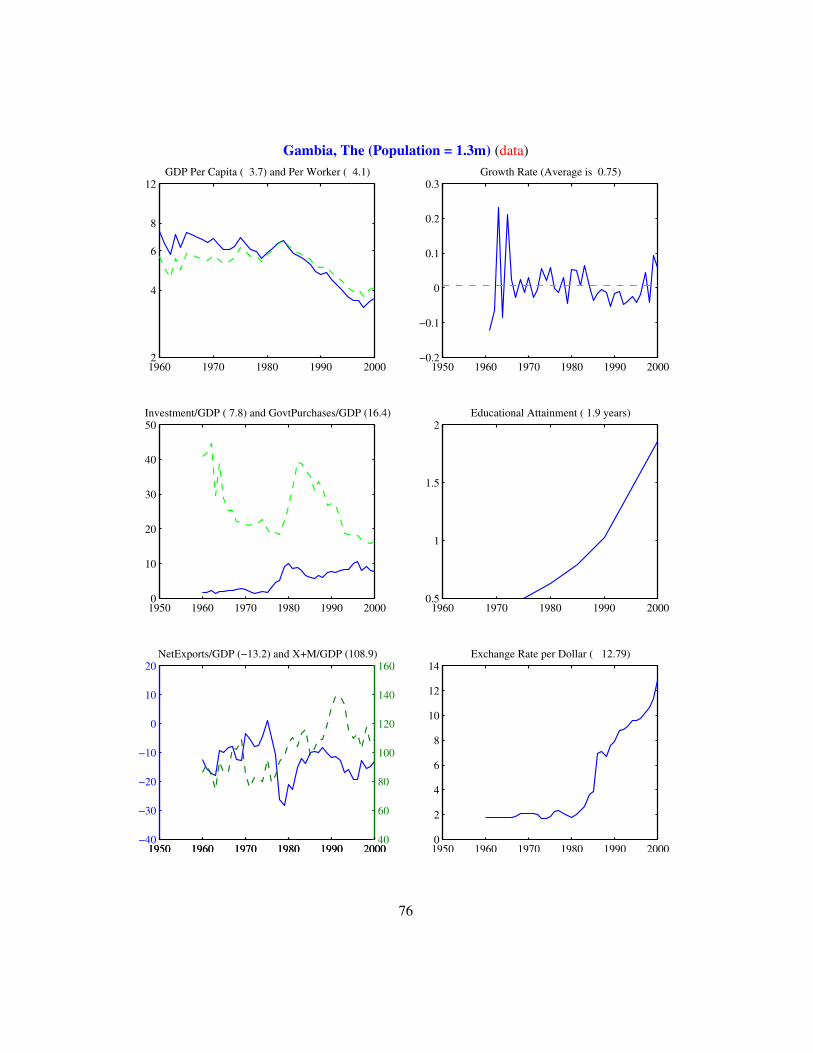
Gambia, The (Population = 1.3m) (data)
1960 1970 1980 1990 2000 2
4
6
8
12GDP Per Capita ( 3.7) and Per Worker ( 4.1)
1950 1960 1970 1980 1990 2000−0.2
−0.1
0
0.1
0.2
0.3Growth Rate (Average is 0.75)
1950 1960 1970 1980 1990 20000
10
20
30
40
50Investment/GDP ( 7.8) and GovtPurchases/GDP (16.4)
1960 1970 1980 1990 20000.5
1
1.5
2Educational Attainment ( 1.9 years)
1950 1960 1970 1980 1990 2000−40
−30
−20
−10
0
10
20NetExports/GDP (−13.2) and X+M/GDP (108.9)
1950 1960 1970 1980 1990 200040
60
80
100
120
140
160
1950 1960 1970 1980 1990 20000
2
4
6
8
10
12
14Exchange Rate per Dollar ( 12.79)
76
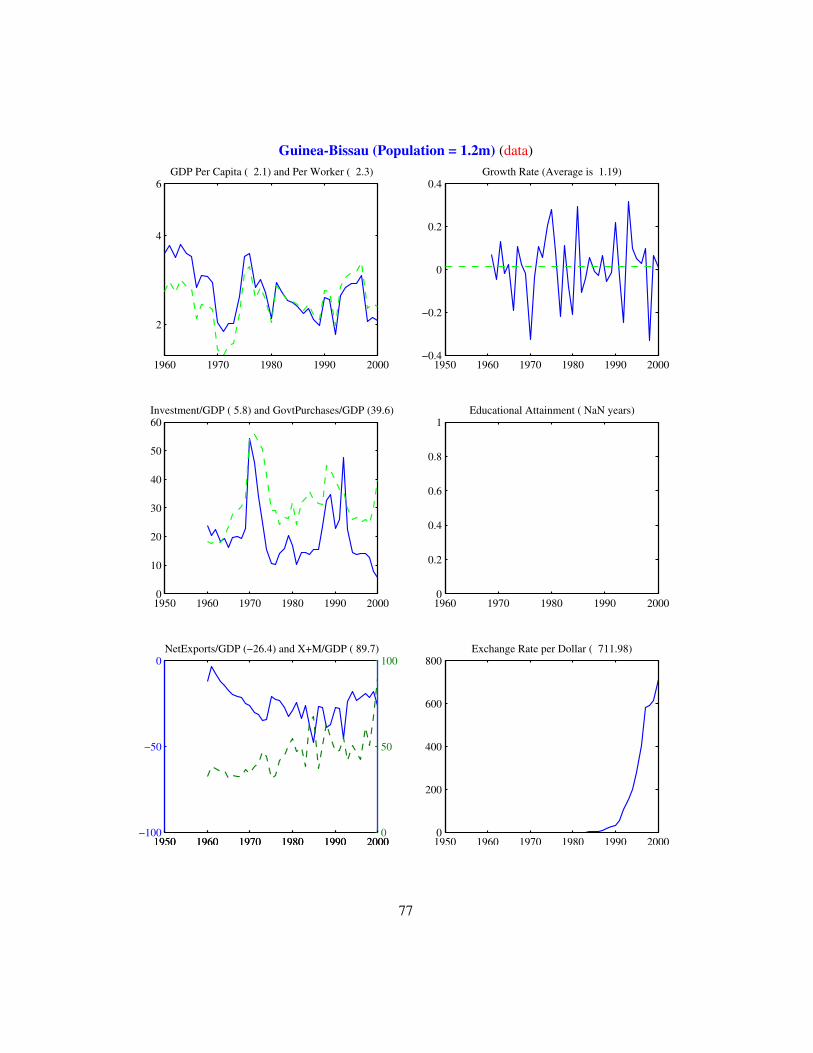
Guinea-Bissau (Population = 1.2m) (data)
1960 1970 1980 1990 2000
2
4
6GDP Per Capita ( 2.1) and Per Worker ( 2.3)
1950 1960 1970 1980 1990 2000−0.4
−0.2
0
0.2
0.4Growth Rate (Average is 1.19)
1950 1960 1970 1980 1990 20000
10
20
30
40
50
60Investment/GDP ( 5.8) and GovtPurchases/GDP (39.6)
1960 1970 1980 1990 20000
0.2
0.4
0.6
0.8
1Educational Attainment ( NaN years)
1950 1960 1970 1980 1990 2000−100
−50
0NetExports/GDP (−26.4) and X+M/GDP ( 89.7)
1950 1960 1970 1980 1990 20000
50
100
1950 1960 1970 1980 1990 20000
200
400
600
800Exchange Rate per Dollar ( 711.98)
77
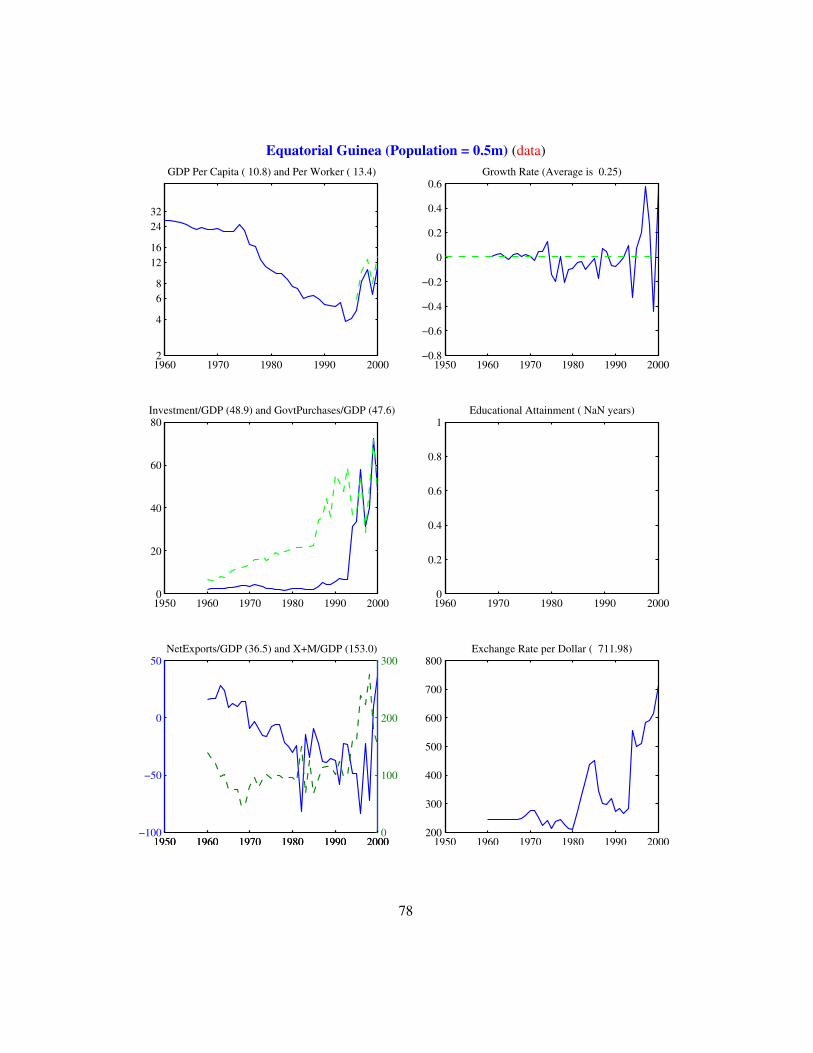
Equatorial Guinea (Population = 0.5m) (data)
1960 1970 1980 1990 2000 2
4
6 8
1216
2432
GDP Per Capita ( 10.8) and Per Worker ( 13.4)
1950 1960 1970 1980 1990 2000−0.8
−0.6
−0.4
−0.2
0
0.2
0.4
0.6Growth Rate (Average is 0.25)
1950 1960 1970 1980 1990 20000
20
40
60
80Investment/GDP (48.9) and GovtPurchases/GDP (47.6)
1960 1970 1980 1990 20000
0.2
0.4
0.6
0.8
1Educational Attainment ( NaN years)
1950 1960 1970 1980 1990 2000−100
−50
0
50NetExports/GDP (36.5) and X+M/GDP (153.0)
1950 1960 1970 1980 1990 20000
100
200
300
1950 1960 1970 1980 1990 2000200
300
400
500
600
700
800Exchange Rate per Dollar ( 711.98)
78
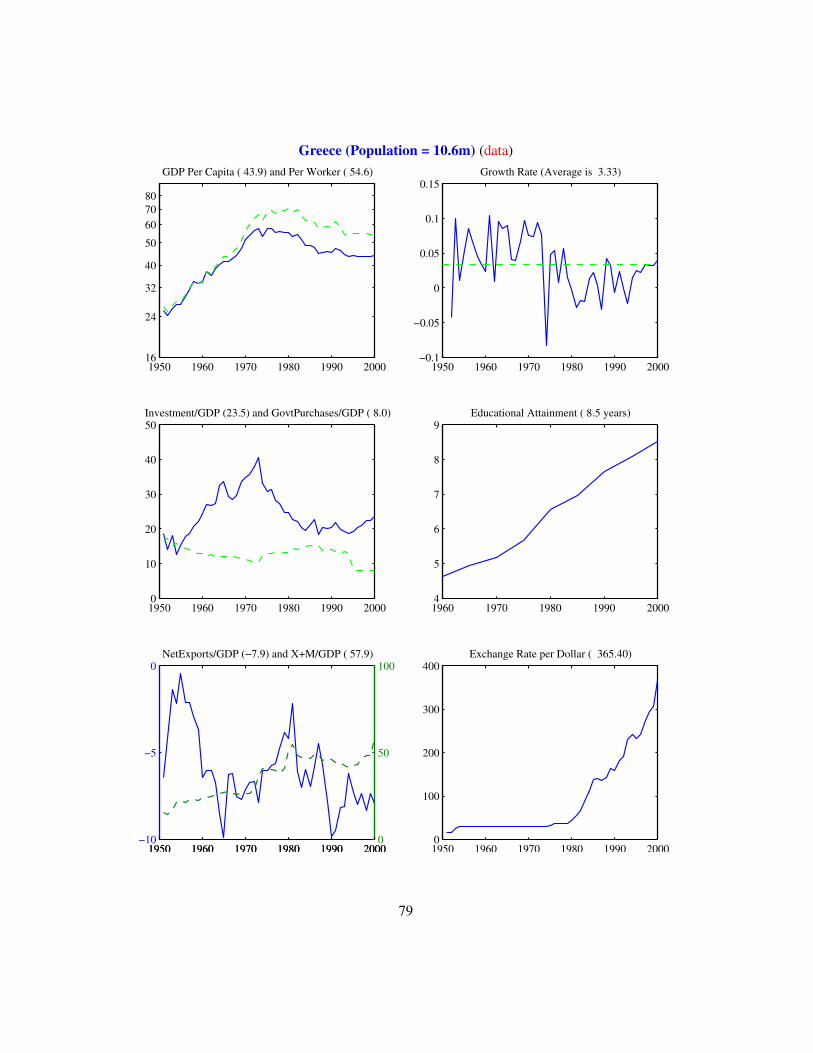
Greece (Population = 10.6m) (data)
1950 1960 1970 1980 1990 200016
24
32
40
50
607080
GDP Per Capita ( 43.9) and Per Worker ( 54.6)
1950 1960 1970 1980 1990 2000−0.1
−0.05
0
0.05
0.1
0.15Growth Rate (Average is 3.33)
1950 1960 1970 1980 1990 20000
10
20
30
40
50Investment/GDP (23.5) and GovtPurchases/GDP ( 8.0)
1960 1970 1980 1990 20004
5
6
7
8
9Educational Attainment ( 8.5 years)
1950 1960 1970 1980 1990 2000−10
−5
0NetExports/GDP (−7.9) and X+M/GDP ( 57.9)
1950 1960 1970 1980 1990 20000
50
100
1950 1960 1970 1980 1990 20000
100
200
300
400Exchange Rate per Dollar ( 365.40)
79
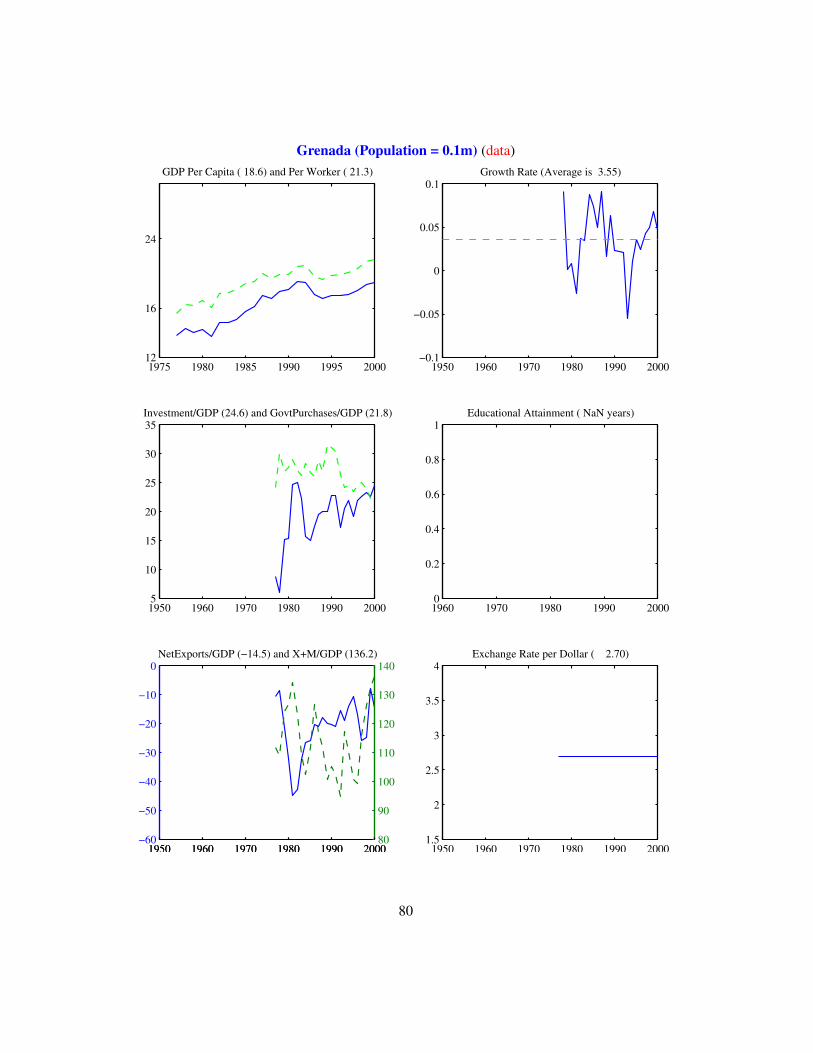
Grenada (Population = 0.1m) (data)
1975 1980 1985 1990 1995 200012
16
24
GDP Per Capita ( 18.6) and Per Worker ( 21.3)
1950 1960 1970 1980 1990 2000−0.1
−0.05
0
0.05
0.1Growth Rate (Average is 3.55)
1950 1960 1970 1980 1990 20005
10
15
20
25
30
35Investment/GDP (24.6) and GovtPurchases/GDP (21.8)
1960 1970 1980 1990 20000
0.2
0.4
0.6
0.8
1Educational Attainment ( NaN years)
1950 1960 1970 1980 1990 2000−60
−50
−40
−30
−20
−10
0NetExports/GDP (−14.5) and X+M/GDP (136.2)
1950 1960 1970 1980 1990 200080
90
100
110
120
130
140
1950 1960 1970 1980 1990 20001.5
2
2.5
3
3.5
4Exchange Rate per Dollar ( 2.70)
80
Greenland (Population = 0.0m) (data)
0 0.2 0.4 0.6 0.8 11
GDP Per Capita ( 0.0) and Per Worker ( 0.0)
1950 1960 1970 1980 1990 20000
0.2
0.4
0.6
0.8
1Growth Rate (Average is NaN)
1950 1960 1970 1980 1990 2000−1
−0.5
0
0.5
1Investment/GDP ( 0.0) and GovtPurchases/GDP ( 0.0)
1960 1970 1980 1990 20000
0.2
0.4
0.6
0.8
1Educational Attainment ( NaN years)
1950 1960 1970 1980 1990 200099
99.5
100
100.5
101NetExports/GDP (100.0) and X+M/GDP ( 0.0)
1950 1960 1970 1980 1990 2000−1
−0.5
0
0.5
1
1950 1960 1970 1980 1990 2000−1
−0.5
0
0.5
1Exchange Rate per Dollar ( 0.00)
81
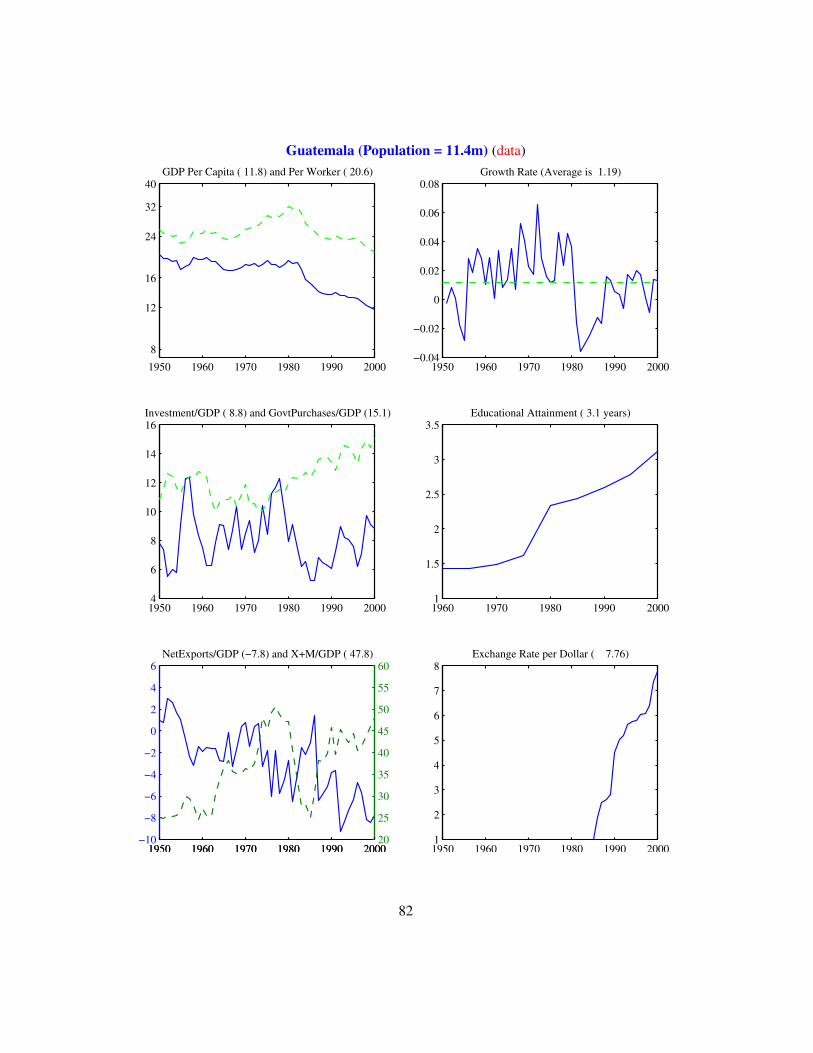
Guatemala (Population = 11.4m) (data)
1950 1960 1970 1980 1990 2000
8
12
16
24
32
40GDP Per Capita ( 11.8) and Per Worker ( 20.6)
1950 1960 1970 1980 1990 2000−0.04
−0.02
0
0.02
0.04
0.06
0.08Growth Rate (Average is 1.19)
1950 1960 1970 1980 1990 20004
6
8
10
12
14
16Investment/GDP ( 8.8) and GovtPurchases/GDP (15.1)
1960 1970 1980 1990 20001
1.5
2
2.5
3
3.5Educational Attainment ( 3.1 years)
1950 1960 1970 1980 1990 2000−10
−8
−6
−4
−2
0
2
4
6NetExports/GDP (−7.8) and X+M/GDP ( 47.8)
1950 1960 1970 1980 1990 200020
25
30
35
40
45
50
55
60
1950 1960 1970 1980 1990 20001
2
3
4
5
6
7
8Exchange Rate per Dollar ( 7.76)
82

Guam (Population = 0.0m) (data)
0 0.2 0.4 0.6 0.8 11
GDP Per Capita ( 0.0) and Per Worker ( 0.0)
1950 1960 1970 1980 1990 20000
0.2
0.4
0.6
0.8
1Growth Rate (Average is NaN)
1950 1960 1970 1980 1990 2000−1
−0.5
0
0.5
1Investment/GDP ( 0.0) and GovtPurchases/GDP ( 0.0)
1960 1970 1980 1990 20000
0.2
0.4
0.6
0.8
1Educational Attainment ( NaN years)
1950 1960 1970 1980 1990 200099
99.5
100
100.5
101NetExports/GDP (100.0) and X+M/GDP ( 0.0)
1950 1960 1970 1980 1990 2000−1
−0.5
0
0.5
1
1950 1960 1970 1980 1990 2000−1
−0.5
0
0.5
1Exchange Rate per Dollar ( 0.00)
83
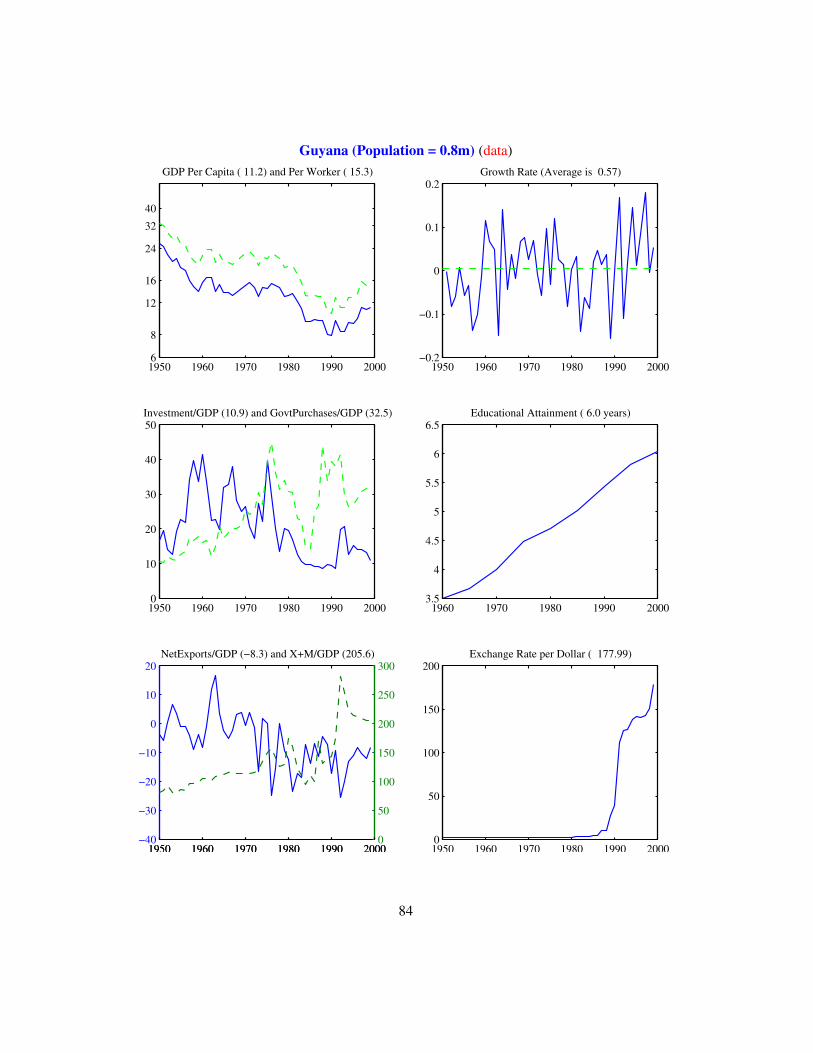
Guyana (Population = 0.8m) (data)
1950 1960 1970 1980 1990 2000 6
8
12
16
24
32
40
GDP Per Capita ( 11.2) and Per Worker ( 15.3)
1950 1960 1970 1980 1990 2000−0.2
−0.1
0
0.1
0.2Growth Rate (Average is 0.57)
1950 1960 1970 1980 1990 20000
10
20
30
40
50Investment/GDP (10.9) and GovtPurchases/GDP (32.5)
1960 1970 1980 1990 20003.5
4
4.5
5
5.5
6
6.5Educational Attainment ( 6.0 years)
1950 1960 1970 1980 1990 2000−40
−30
−20
−10
0
10
20NetExports/GDP (−8.3) and X+M/GDP (205.6)
1950 1960 1970 1980 1990 20000
50
100
150
200
250
300
1950 1960 1970 1980 1990 20000
50
100
150
200Exchange Rate per Dollar ( 177.99)
84
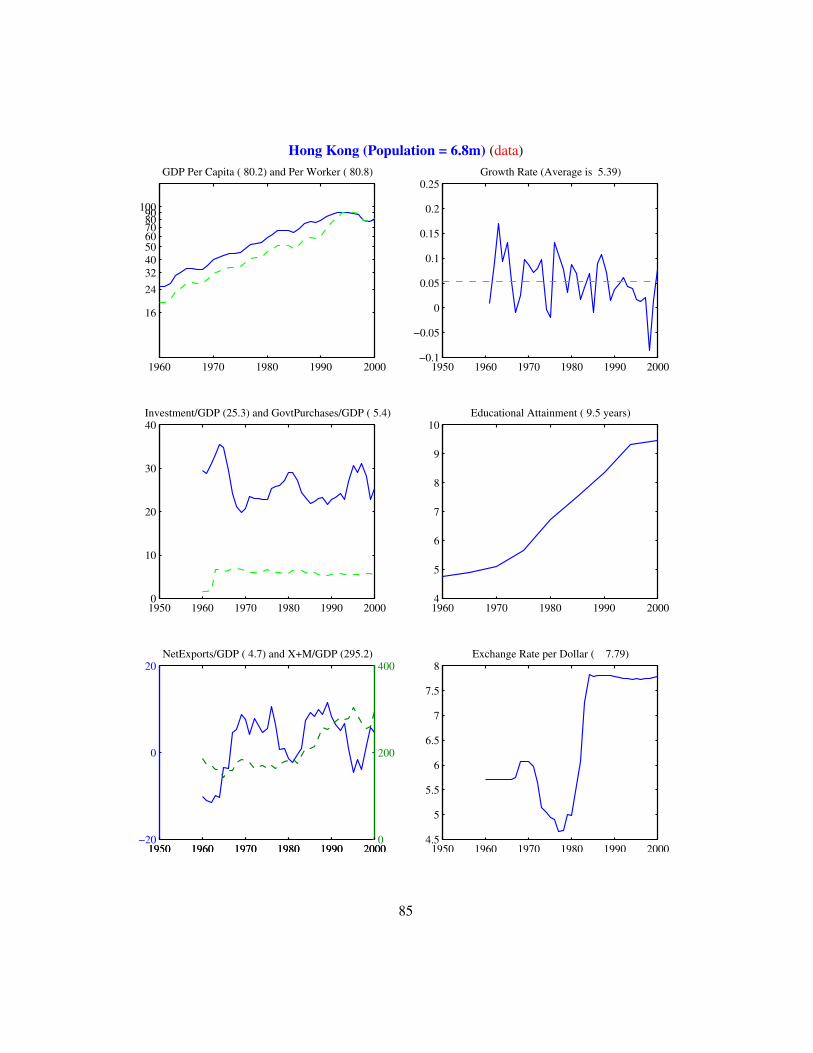
Hong Kong (Population = 6.8m) (data)
1960 1970 1980 1990 2000
16
24 32 40 50 60 70 80 90100
GDP Per Capita ( 80.2) and Per Worker ( 80.8)
1950 1960 1970 1980 1990 2000−0.1
−0.05
0
0.05
0.1
0.15
0.2
0.25Growth Rate (Average is 5.39)
1950 1960 1970 1980 1990 20000
10
20
30
40Investment/GDP (25.3) and GovtPurchases/GDP ( 5.4)
1960 1970 1980 1990 20004
5
6
7
8
9
10Educational Attainment ( 9.5 years)
1950 1960 1970 1980 1990 2000−20
0
20NetExports/GDP ( 4.7) and X+M/GDP (295.2)
1950 1960 1970 1980 1990 20000
200
400
1950 1960 1970 1980 1990 20004.5
5
5.5
6
6.5
7
7.5
8Exchange Rate per Dollar ( 7.79)
85
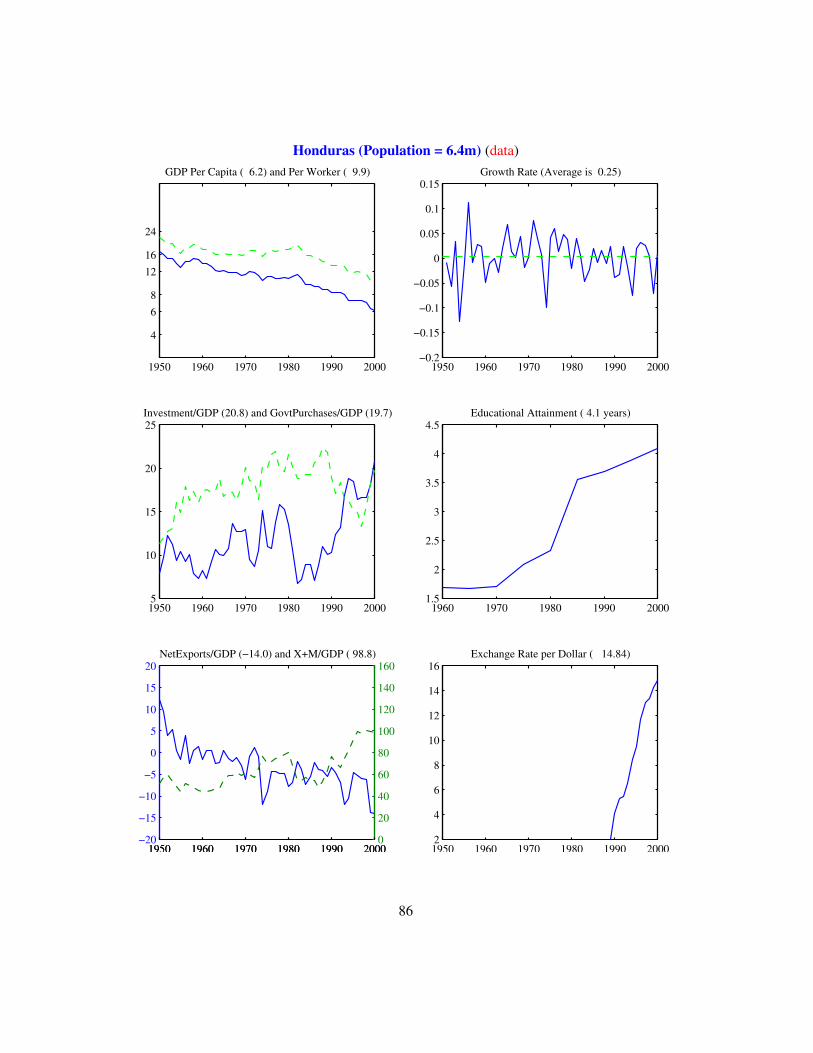
Honduras (Population = 6.4m) (data)
1950 1960 1970 1980 1990 2000
4
6 8
1216
24
GDP Per Capita ( 6.2) and Per Worker ( 9.9)
1950 1960 1970 1980 1990 2000−0.2
−0.15
−0.1
−0.05
0
0.05
0.1
0.15Growth Rate (Average is 0.25)
1950 1960 1970 1980 1990 20005
10
15
20
25Investment/GDP (20.8) and GovtPurchases/GDP (19.7)
1960 1970 1980 1990 20001.5
2
2.5
3
3.5
4
4.5Educational Attainment ( 4.1 years)
1950 1960 1970 1980 1990 2000−20
−15
−10
−5
0
5
10
15
20NetExports/GDP (−14.0) and X+M/GDP ( 98.8)
1950 1960 1970 1980 1990 20000
20
40
60
80
100
120
140
160
1950 1960 1970 1980 1990 20002
4
6
8
10
12
14
16Exchange Rate per Dollar ( 14.84)
86
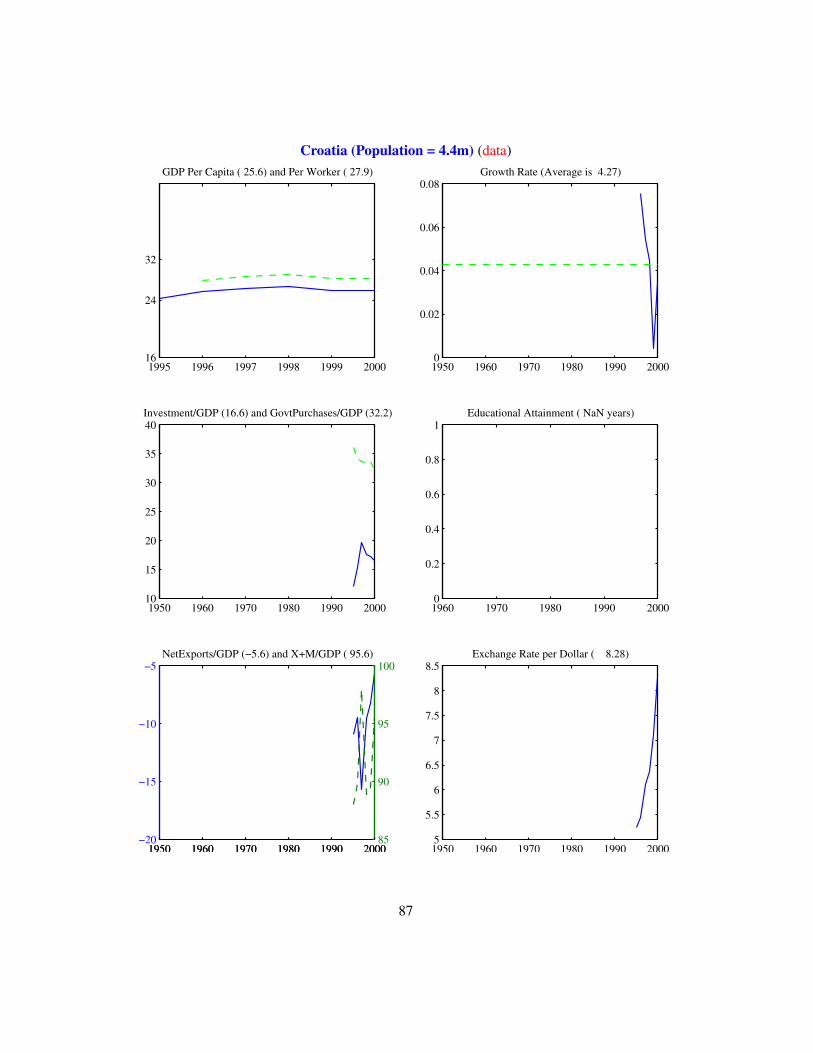
Croatia (Population = 4.4m) (data)
1995 1996 1997 1998 1999 200016
24
32
GDP Per Capita ( 25.6) and Per Worker ( 27.9)
1950 1960 1970 1980 1990 20000
0.02
0.04
0.06
0.08Growth Rate (Average is 4.27)
1950 1960 1970 1980 1990 200010
15
20
25
30
35
40Investment/GDP (16.6) and GovtPurchases/GDP (32.2)
1960 1970 1980 1990 20000
0.2
0.4
0.6
0.8
1Educational Attainment ( NaN years)
1950 1960 1970 1980 1990 2000−20
−15
−10
−5NetExports/GDP (−5.6) and X+M/GDP ( 95.6)
1950 1960 1970 1980 1990 200085
90
95
100
1950 1960 1970 1980 1990 20005
5.5
6
6.5
7
7.5
8
8.5Exchange Rate per Dollar ( 8.28)
87
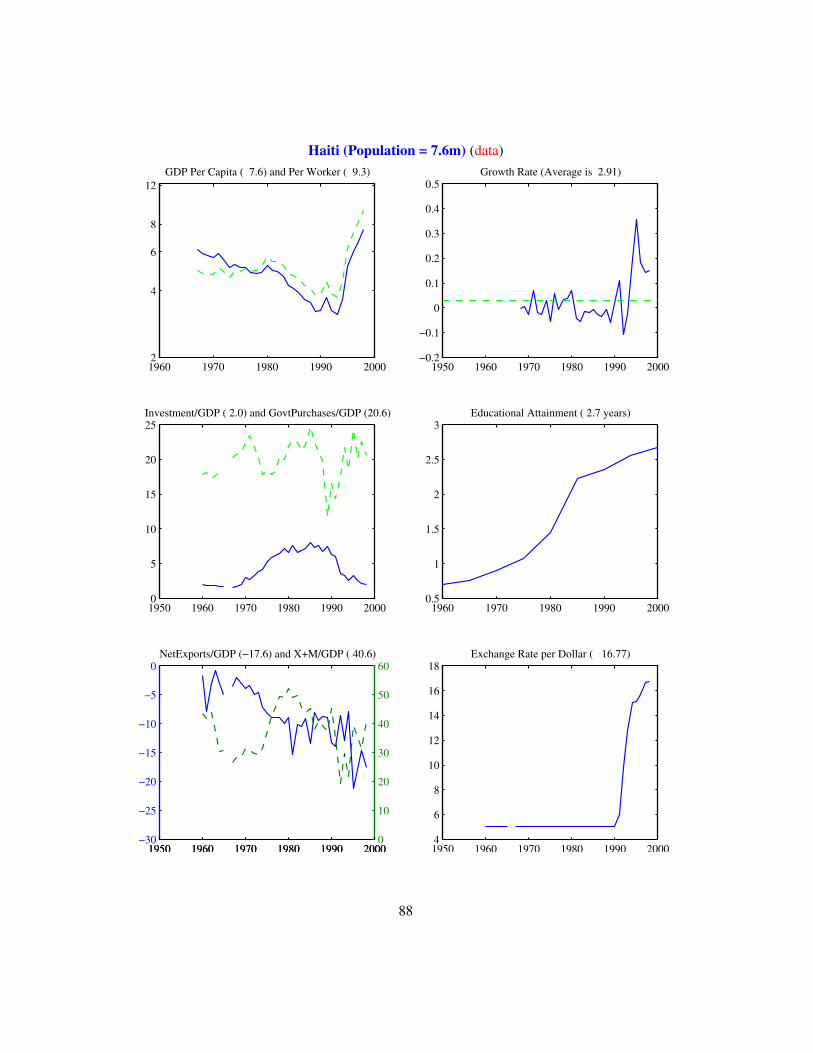
Haiti (Population = 7.6m) (data)
1960 1970 1980 1990 2000 2
4
6
8
12GDP Per Capita ( 7.6) and Per Worker ( 9.3)
1950 1960 1970 1980 1990 2000−0.2
−0.1
0
0.1
0.2
0.3
0.4
0.5Growth Rate (Average is 2.91)
1950 1960 1970 1980 1990 20000
5
10
15
20
25Investment/GDP ( 2.0) and GovtPurchases/GDP (20.6)
1960 1970 1980 1990 20000.5
1
1.5
2
2.5
3Educational Attainment ( 2.7 years)
1950 1960 1970 1980 1990 2000−30
−25
−20
−15
−10
−5
0NetExports/GDP (−17.6) and X+M/GDP ( 40.6)
1950 1960 1970 1980 1990 20000
10
20
30
40
50
60
1950 1960 1970 1980 1990 20004
6
8
10
12
14
16
18Exchange Rate per Dollar ( 16.77)
88
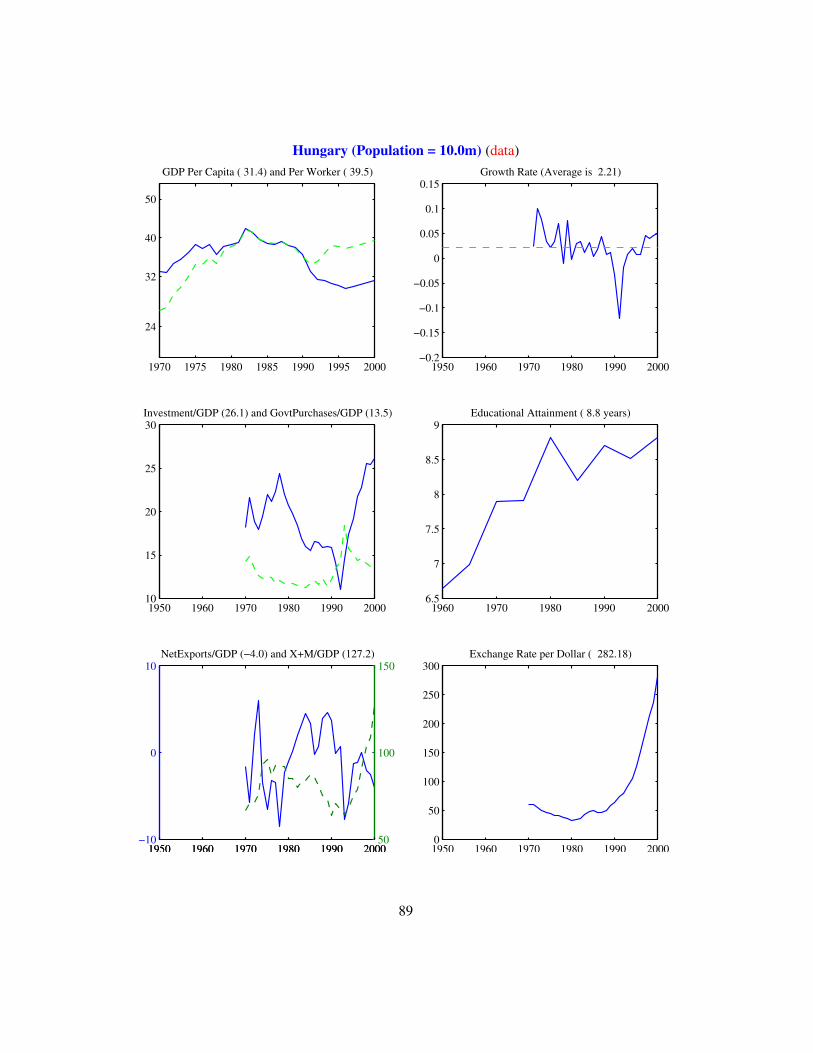
Hungary (Population = 10.0m) (data)
1970 1975 1980 1985 1990 1995 2000
24
32
40
50
GDP Per Capita ( 31.4) and Per Worker ( 39.5)
1950 1960 1970 1980 1990 2000−0.2
−0.15
−0.1
−0.05
0
0.05
0.1
0.15Growth Rate (Average is 2.21)
1950 1960 1970 1980 1990 200010
15
20
25
30Investment/GDP (26.1) and GovtPurchases/GDP (13.5)
1960 1970 1980 1990 20006.5
7
7.5
8
8.5
9Educational Attainment ( 8.8 years)
1950 1960 1970 1980 1990 2000−10
0
10NetExports/GDP (−4.0) and X+M/GDP (127.2)
1950 1960 1970 1980 1990 200050
100
150
1950 1960 1970 1980 1990 20000
50
100
150
200
250
300Exchange Rate per Dollar ( 282.18)
89
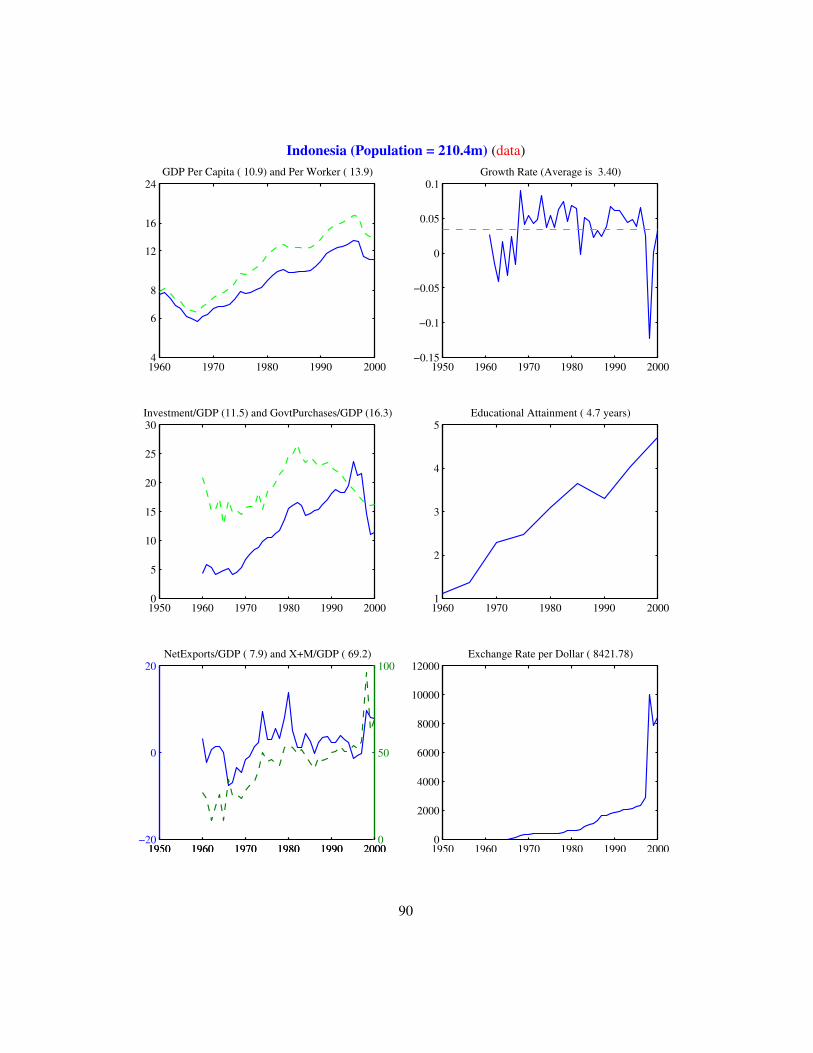
Indonesia (Population = 210.4m) (data)
1960 1970 1980 1990 2000 4
6
8
12
16
24GDP Per Capita ( 10.9) and Per Worker ( 13.9)
1950 1960 1970 1980 1990 2000−0.15
−0.1
−0.05
0
0.05
0.1Growth Rate (Average is 3.40)
1950 1960 1970 1980 1990 20000
5
10
15
20
25
30Investment/GDP (11.5) and GovtPurchases/GDP (16.3)
1960 1970 1980 1990 20001
2
3
4
5Educational Attainment ( 4.7 years)
1950 1960 1970 1980 1990 2000−20
0
20NetExports/GDP ( 7.9) and X+M/GDP ( 69.2)
1950 1960 1970 1980 1990 20000
50
100
1950 1960 1970 1980 1990 20000
2000
4000
6000
8000
10000
12000Exchange Rate per Dollar ( 8421.78)
90

Isle of Man (Population = 0.0m) (data)
0 0.2 0.4 0.6 0.8 11
GDP Per Capita ( 0.0) and Per Worker ( 0.0)
1950 1960 1970 1980 1990 20000
0.2
0.4
0.6
0.8
1Growth Rate (Average is NaN)
1950 1960 1970 1980 1990 2000−1
−0.5
0
0.5
1Investment/GDP ( 0.0) and GovtPurchases/GDP ( 0.0)
1960 1970 1980 1990 20000
0.2
0.4
0.6
0.8
1Educational Attainment ( NaN years)
1950 1960 1970 1980 1990 200099
99.5
100
100.5
101NetExports/GDP (100.0) and X+M/GDP ( 0.0)
1950 1960 1970 1980 1990 2000−1
−0.5
0
0.5
1
1950 1960 1970 1980 1990 2000−1
−0.5
0
0.5
1Exchange Rate per Dollar ( 0.00)
91
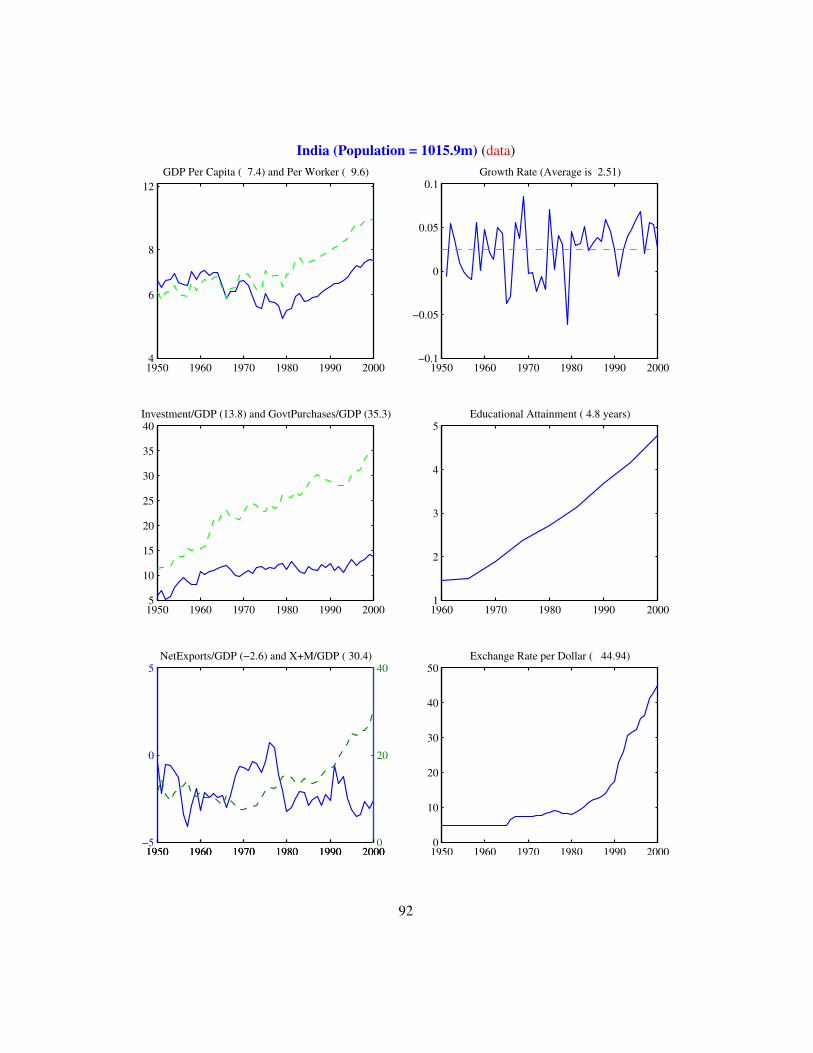
India (Population = 1015.9m) (data)
1950 1960 1970 1980 1990 2000 4
6
8
12GDP Per Capita ( 7.4) and Per Worker ( 9.6)
1950 1960 1970 1980 1990 2000−0.1
−0.05
0
0.05
0.1Growth Rate (Average is 2.51)
1950 1960 1970 1980 1990 20005
10
15
20
25
30
35
40Investment/GDP (13.8) and GovtPurchases/GDP (35.3)
1960 1970 1980 1990 20001
2
3
4
5Educational Attainment ( 4.8 years)
1950 1960 1970 1980 1990 2000−5
0
5NetExports/GDP (−2.6) and X+M/GDP ( 30.4)
1950 1960 1970 1980 1990 20000
20
40
1950 1960 1970 1980 1990 20000
10
20
30
40
50Exchange Rate per Dollar ( 44.94)
92
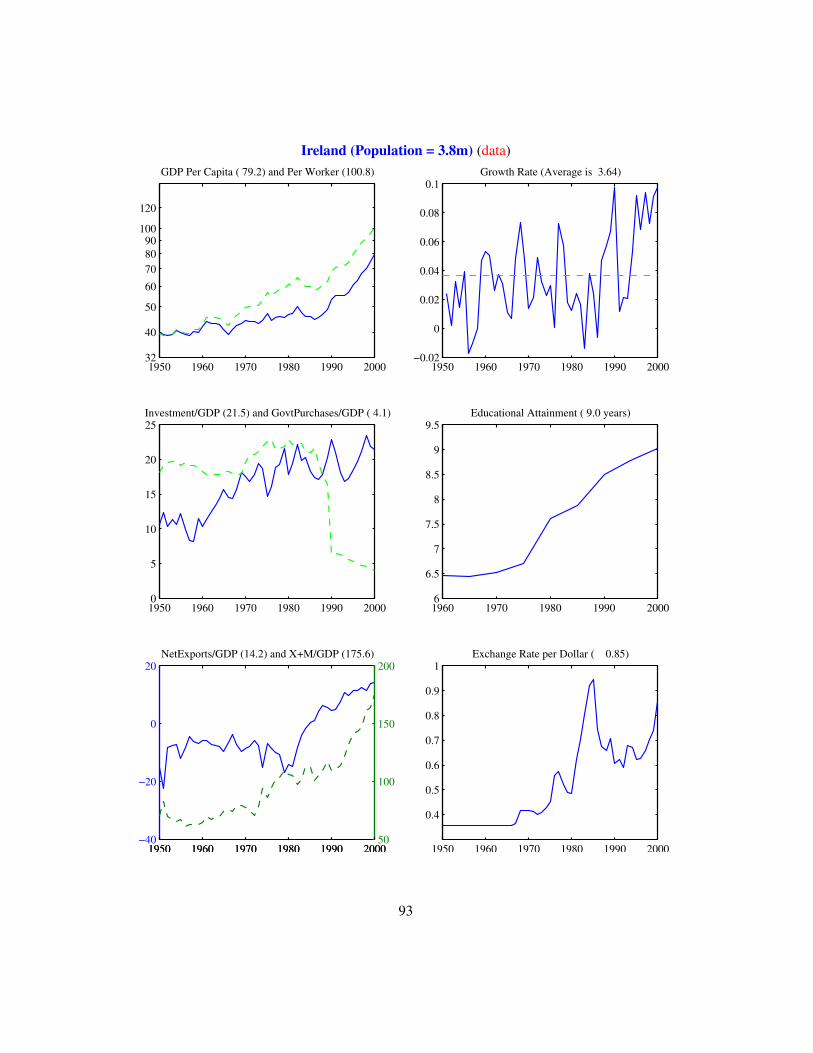
Ireland (Population = 3.8m) (data)
1950 1960 1970 1980 1990 2000 32
40
50
60
70 80 90
100
120
GDP Per Capita ( 79.2) and Per Worker (100.8)
1950 1960 1970 1980 1990 2000−0.02
0
0.02
0.04
0.06
0.08
0.1Growth Rate (Average is 3.64)
1950 1960 1970 1980 1990 20000
5
10
15
20
25Investment/GDP (21.5) and GovtPurchases/GDP ( 4.1)
1960 1970 1980 1990 20006
6.5
7
7.5
8
8.5
9
9.5Educational Attainment ( 9.0 years)
1950 1960 1970 1980 1990 2000−40
−20
0
20NetExports/GDP (14.2) and X+M/GDP (175.6)
1950 1960 1970 1980 1990 200050
100
150
200
1950 1960 1970 1980 1990 2000
0.4
0.5
0.6
0.7
0.8
0.9
1Exchange Rate per Dollar ( 0.85)
93
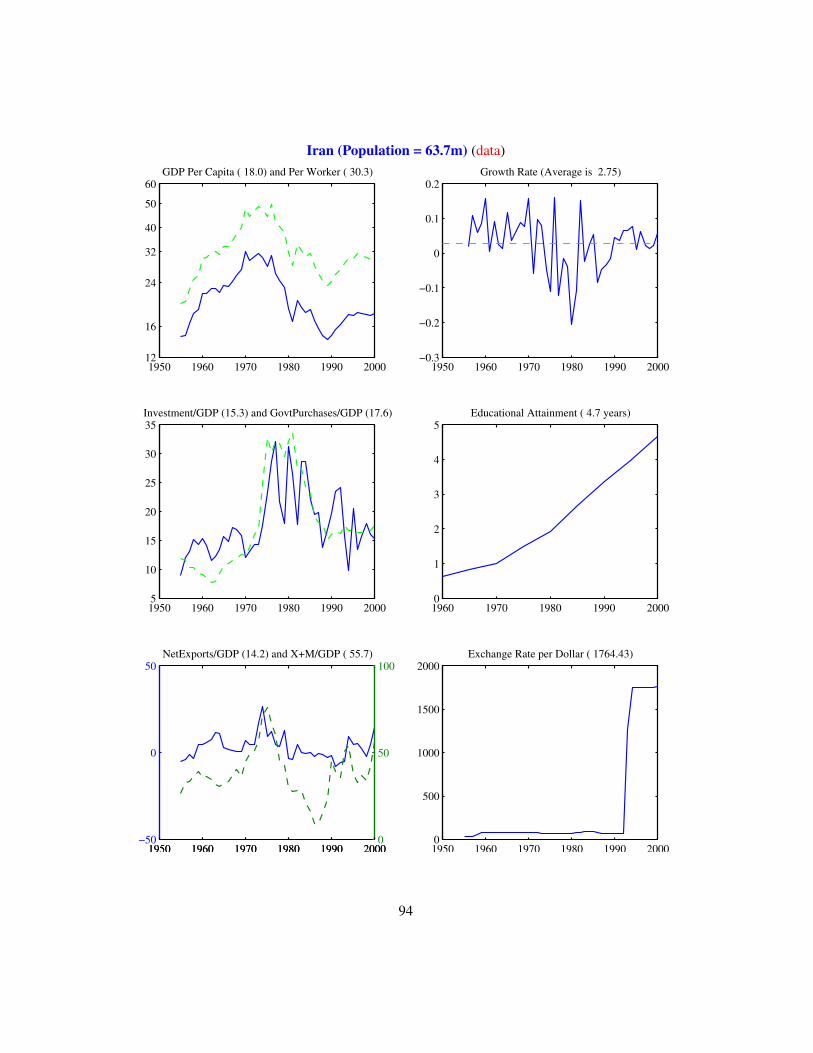
Iran (Population = 63.7m) (data)
1950 1960 1970 1980 1990 200012
16
24
32
40
50
60GDP Per Capita ( 18.0) and Per Worker ( 30.3)
1950 1960 1970 1980 1990 2000−0.3
−0.2
−0.1
0
0.1
0.2Growth Rate (Average is 2.75)
1950 1960 1970 1980 1990 20005
10
15
20
25
30
35Investment/GDP (15.3) and GovtPurchases/GDP (17.6)
1960 1970 1980 1990 20000
1
2
3
4
5Educational Attainment ( 4.7 years)
1950 1960 1970 1980 1990 2000−50
0
50NetExports/GDP (14.2) and X+M/GDP ( 55.7)
1950 1960 1970 1980 1990 20000
50
100
1950 1960 1970 1980 1990 20000
500
1000
1500
2000Exchange Rate per Dollar ( 1764.43)
94
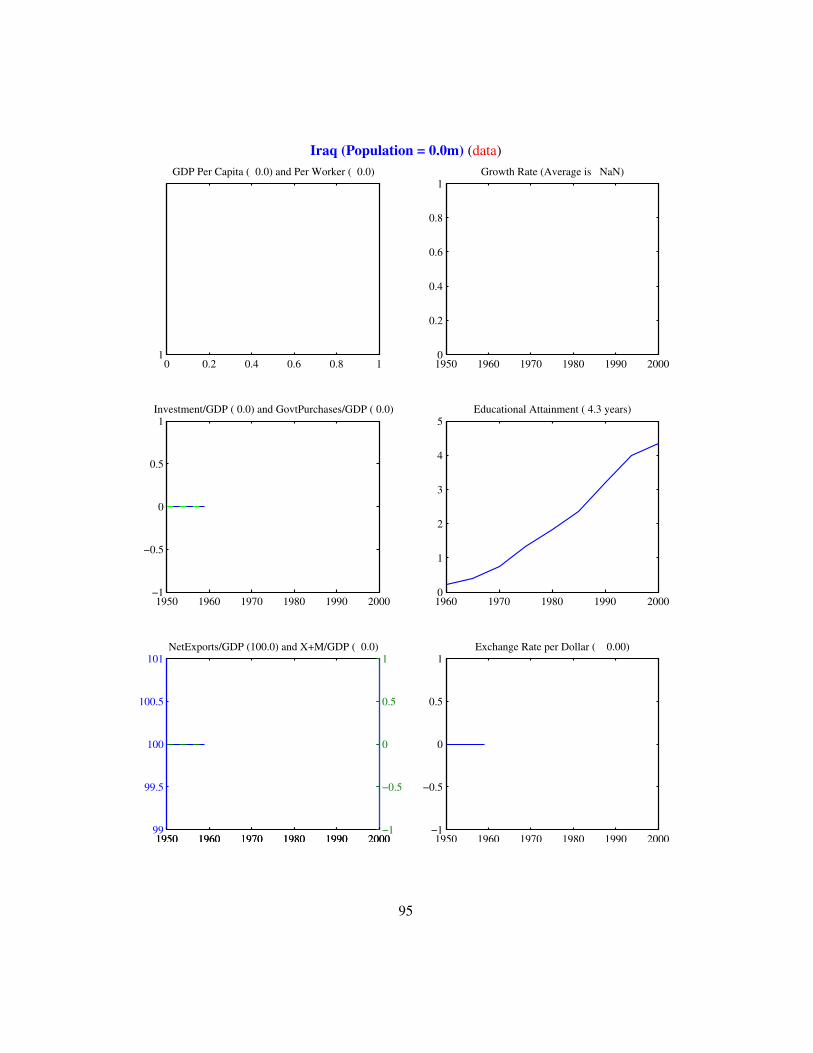
Iraq (Population = 0.0m) (data)
0 0.2 0.4 0.6 0.8 11
GDP Per Capita ( 0.0) and Per Worker ( 0.0)
1950 1960 1970 1980 1990 20000
0.2
0.4
0.6
0.8
1Growth Rate (Average is NaN)
1950 1960 1970 1980 1990 2000−1
−0.5
0
0.5
1Investment/GDP ( 0.0) and GovtPurchases/GDP ( 0.0)
1960 1970 1980 1990 20000
1
2
3
4
5Educational Attainment ( 4.3 years)
1950 1960 1970 1980 1990 200099
99.5
100
100.5
101NetExports/GDP (100.0) and X+M/GDP ( 0.0)
1950 1960 1970 1980 1990 2000−1
−0.5
0
0.5
1
1950 1960 1970 1980 1990 2000−1
−0.5
0
0.5
1Exchange Rate per Dollar ( 0.00)
95
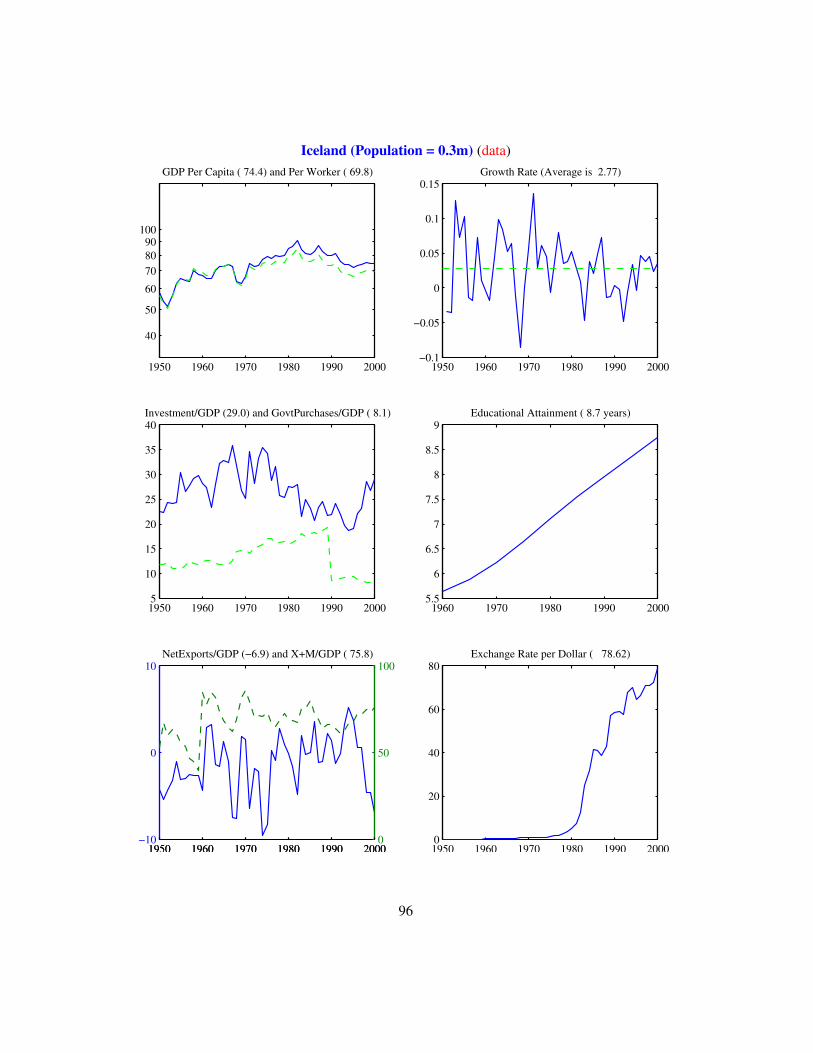
Iceland (Population = 0.3m) (data)
1950 1960 1970 1980 1990 2000
40
50
60
70 80 90
100
GDP Per Capita ( 74.4) and Per Worker ( 69.8)
1950 1960 1970 1980 1990 2000−0.1
−0.05
0
0.05
0.1
0.15Growth Rate (Average is 2.77)
1950 1960 1970 1980 1990 20005
10
15
20
25
30
35
40Investment/GDP (29.0) and GovtPurchases/GDP ( 8.1)
1960 1970 1980 1990 20005.5
6
6.5
7
7.5
8
8.5
9Educational Attainment ( 8.7 years)
1950 1960 1970 1980 1990 2000−10
0
10NetExports/GDP (−6.9) and X+M/GDP ( 75.8)
1950 1960 1970 1980 1990 20000
50
100
1950 1960 1970 1980 1990 20000
20
40
60
80Exchange Rate per Dollar ( 78.62)
96
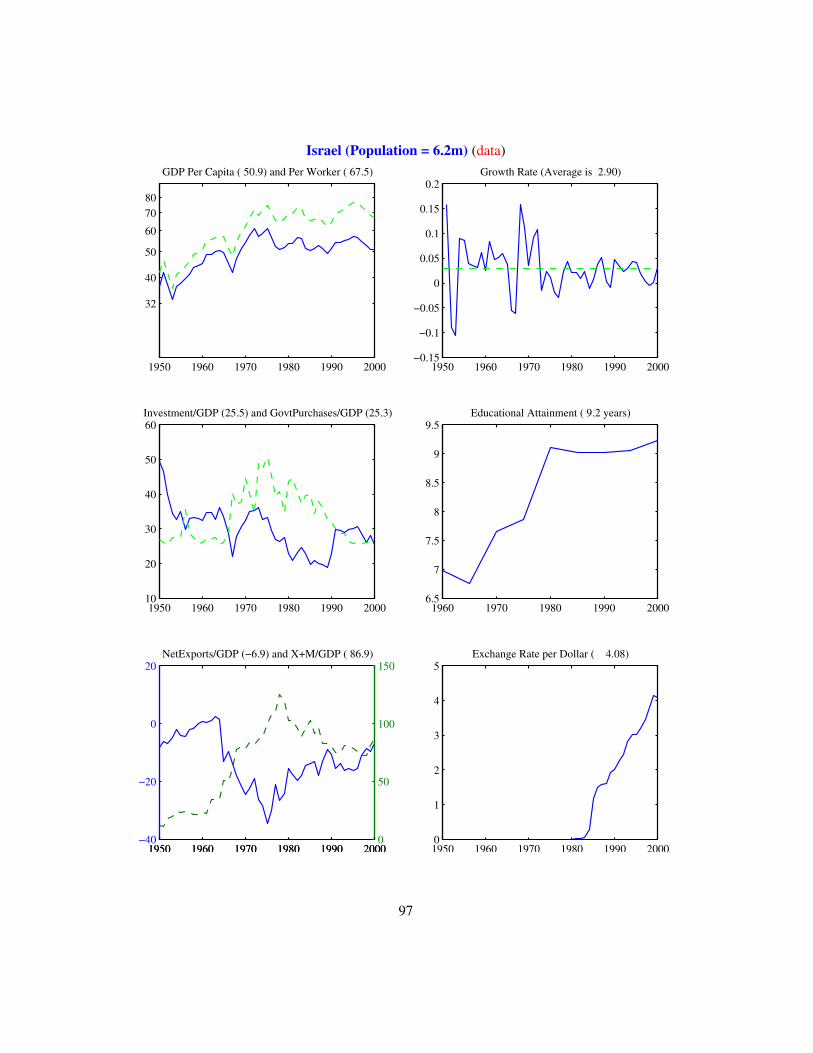
Israel (Population = 6.2m) (data)
1950 1960 1970 1980 1990 2000
32
40
50
60
7080
GDP Per Capita ( 50.9) and Per Worker ( 67.5)
1950 1960 1970 1980 1990 2000−0.15
−0.1
−0.05
0
0.05
0.1
0.15
0.2Growth Rate (Average is 2.90)
1950 1960 1970 1980 1990 200010
20
30
40
50
60Investment/GDP (25.5) and GovtPurchases/GDP (25.3)
1960 1970 1980 1990 20006.5
7
7.5
8
8.5
9
9.5Educational Attainment ( 9.2 years)
1950 1960 1970 1980 1990 2000−40
−20
0
20NetExports/GDP (−6.9) and X+M/GDP ( 86.9)
1950 1960 1970 1980 1990 20000
50
100
150
1950 1960 1970 1980 1990 20000
1
2
3
4
5Exchange Rate per Dollar ( 4.08)
97
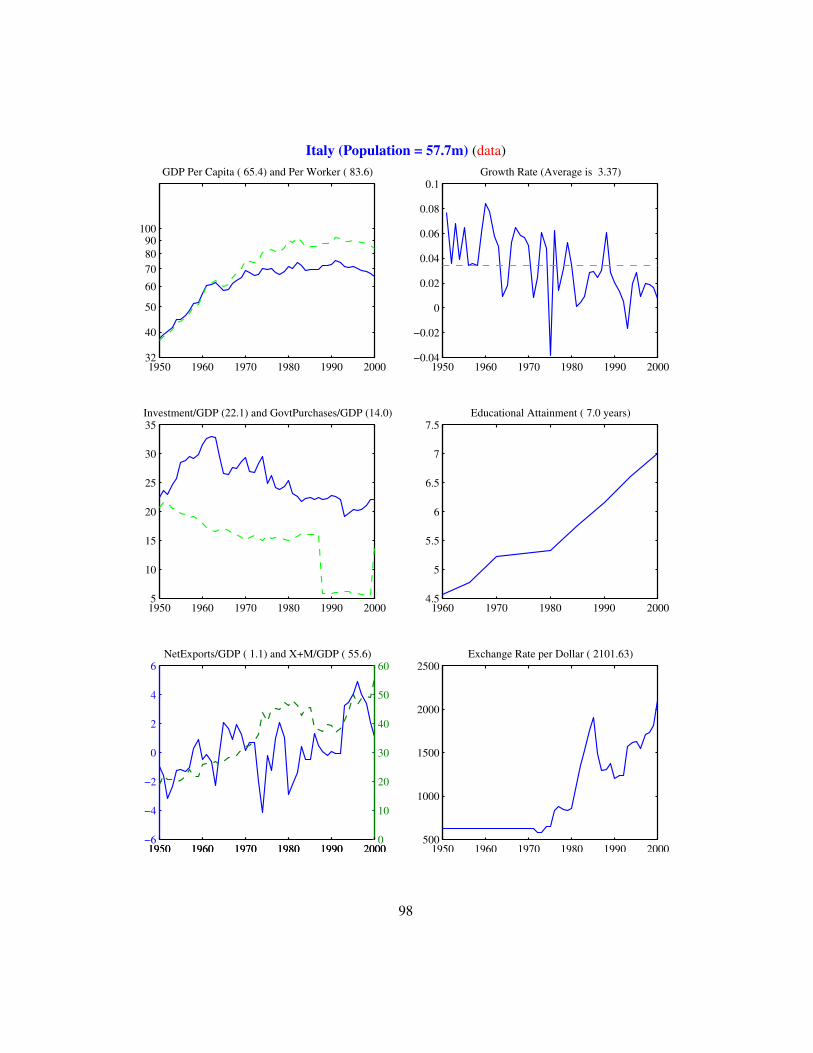
Italy (Population = 57.7m) (data)
1950 1960 1970 1980 1990 2000 32
40
50
60
70 80 90
100
GDP Per Capita ( 65.4) and Per Worker ( 83.6)
1950 1960 1970 1980 1990 2000−0.04
−0.02
0
0.02
0.04
0.06
0.08
0.1Growth Rate (Average is 3.37)
1950 1960 1970 1980 1990 20005
10
15
20
25
30
35Investment/GDP (22.1) and GovtPurchases/GDP (14.0)
1960 1970 1980 1990 20004.5
5
5.5
6
6.5
7
7.5Educational Attainment ( 7.0 years)
1950 1960 1970 1980 1990 2000−6
−4
−2
0
2
4
6NetExports/GDP ( 1.1) and X+M/GDP ( 55.6)
1950 1960 1970 1980 1990 20000
10
20
30
40
50
60
1950 1960 1970 1980 1990 2000500
1000
1500
2000
2500Exchange Rate per Dollar ( 2101.63)
98
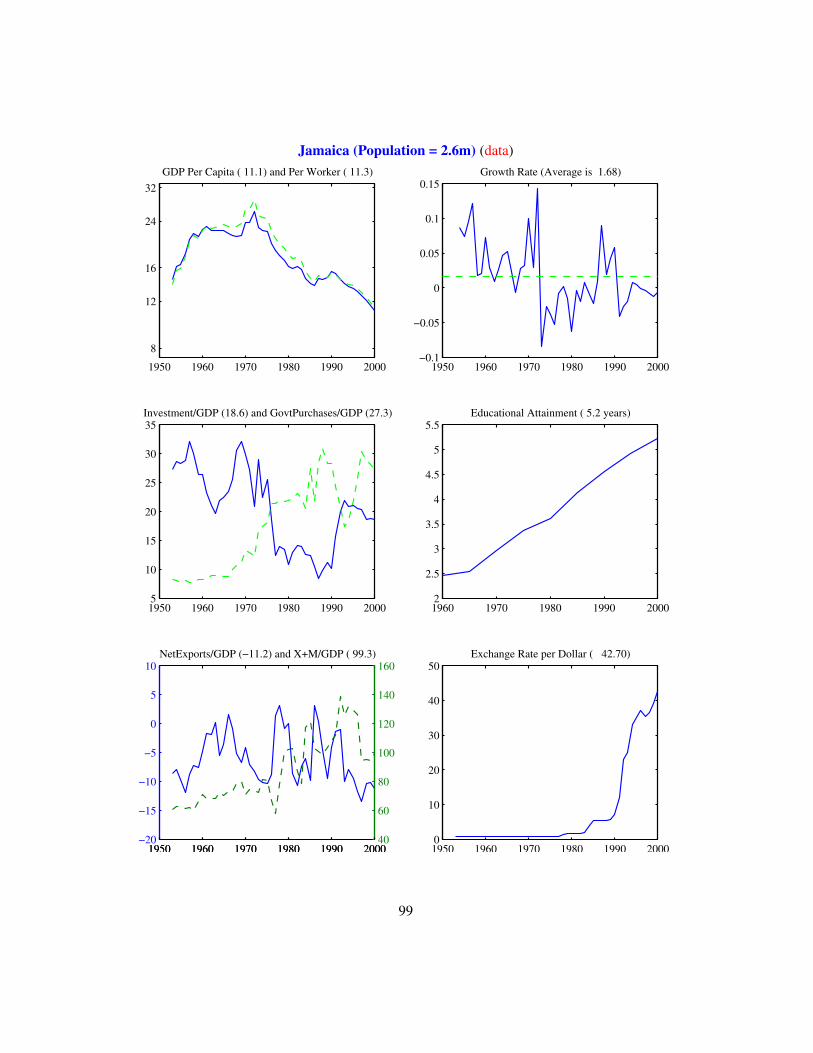
Jamaica (Population = 2.6m) (data)
1950 1960 1970 1980 1990 2000
8
12
16
24
32GDP Per Capita ( 11.1) and Per Worker ( 11.3)
1950 1960 1970 1980 1990 2000−0.1
−0.05
0
0.05
0.1
0.15Growth Rate (Average is 1.68)
1950 1960 1970 1980 1990 20005
10
15
20
25
30
35Investment/GDP (18.6) and GovtPurchases/GDP (27.3)
1960 1970 1980 1990 20002
2.5
3
3.5
4
4.5
5
5.5Educational Attainment ( 5.2 years)
1950 1960 1970 1980 1990 2000−20
−15
−10
−5
0
5
10NetExports/GDP (−11.2) and X+M/GDP ( 99.3)
1950 1960 1970 1980 1990 200040
60
80
100
120
140
160
1950 1960 1970 1980 1990 20000
10
20
30
40
50Exchange Rate per Dollar ( 42.70)
99
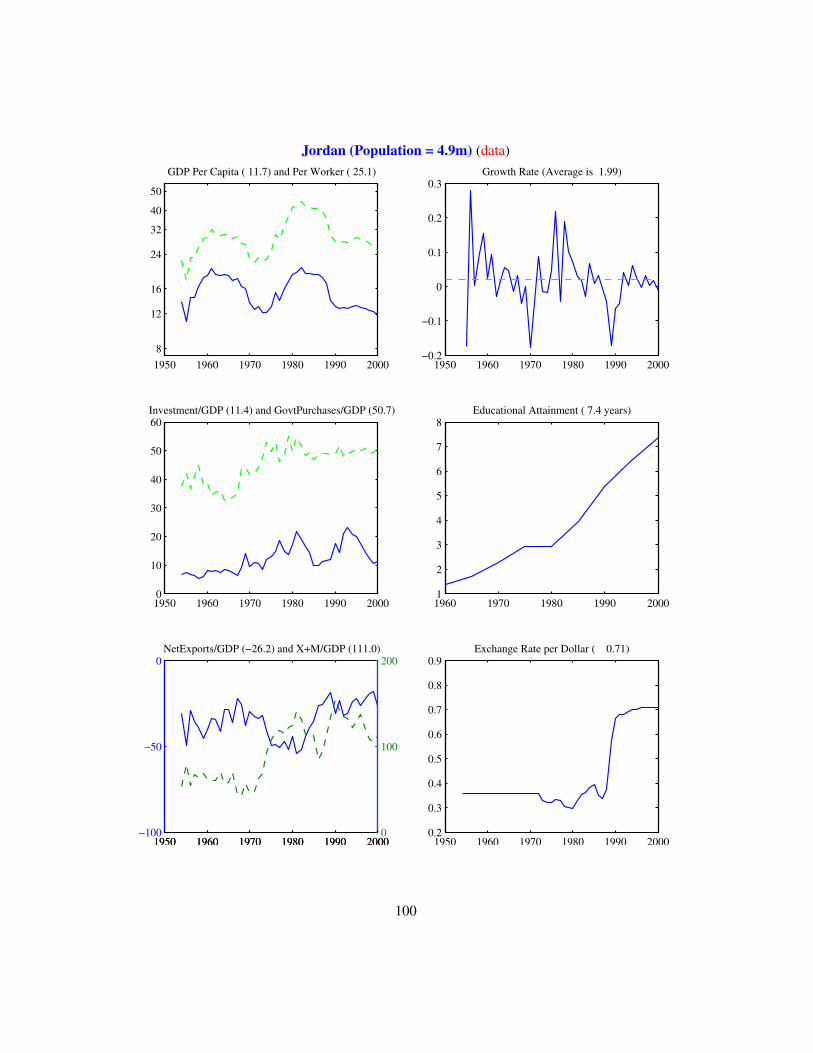
Jordan (Population = 4.9m) (data)
1950 1960 1970 1980 1990 2000 8
12
16
24
32
40
50
GDP Per Capita ( 11.7) and Per Worker ( 25.1)
1950 1960 1970 1980 1990 2000−0.2
−0.1
0
0.1
0.2
0.3Growth Rate (Average is 1.99)
1950 1960 1970 1980 1990 20000
10
20
30
40
50
60Investment/GDP (11.4) and GovtPurchases/GDP (50.7)
1960 1970 1980 1990 20001
2
3
4
5
6
7
8Educational Attainment ( 7.4 years)
1950 1960 1970 1980 1990 2000−100
−50
0NetExports/GDP (−26.2) and X+M/GDP (111.0)
1950 1960 1970 1980 1990 20000
100
200
1950 1960 1970 1980 1990 20000.2
0.3
0.4
0.5
0.6
0.7
0.8
0.9Exchange Rate per Dollar ( 0.71)
100
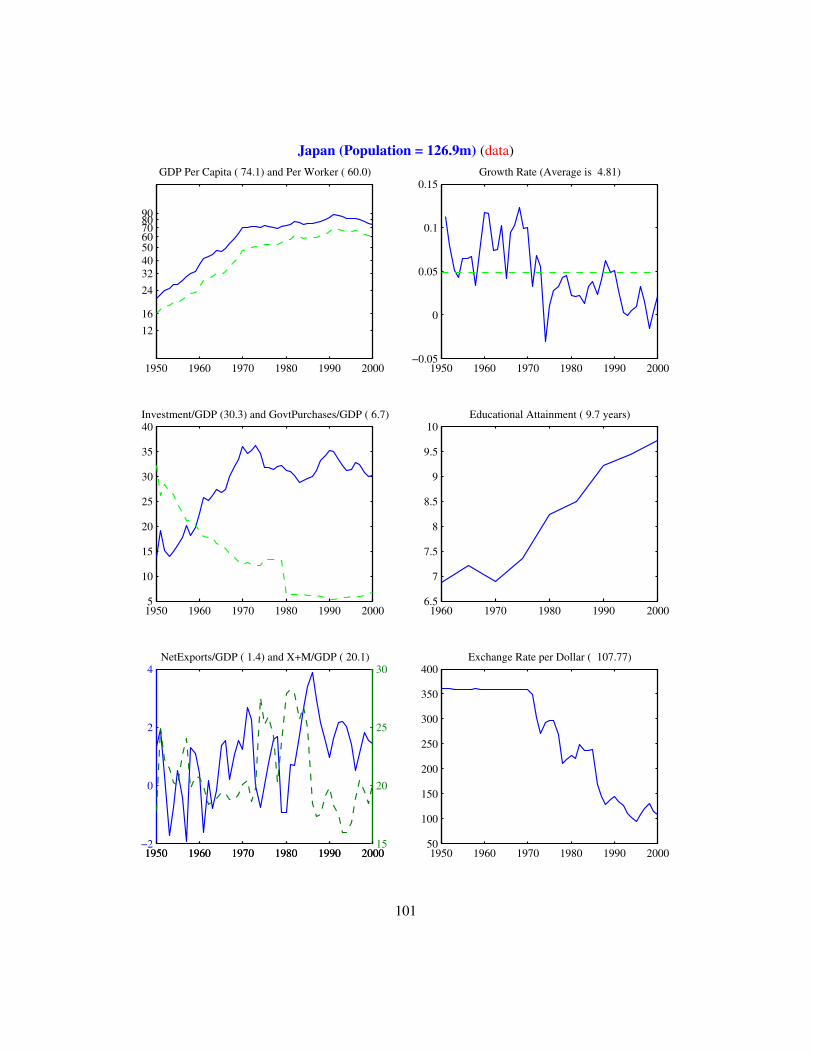
Japan (Population = 126.9m) (data)
1950 1960 1970 1980 1990 2000
1216
2432405060708090
GDP Per Capita ( 74.1) and Per Worker ( 60.0)
1950 1960 1970 1980 1990 2000−0.05
0
0.05
0.1
0.15Growth Rate (Average is 4.81)
1950 1960 1970 1980 1990 20005
10
15
20
25
30
35
40Investment/GDP (30.3) and GovtPurchases/GDP ( 6.7)
1960 1970 1980 1990 20006.5
7
7.5
8
8.5
9
9.5
10Educational Attainment ( 9.7 years)
1950 1960 1970 1980 1990 2000−2
0
2
4NetExports/GDP ( 1.4) and X+M/GDP ( 20.1)
1950 1960 1970 1980 1990 200015
20
25
30
1950 1960 1970 1980 1990 200050
100
150
200
250
300
350
400Exchange Rate per Dollar ( 107.77)
101
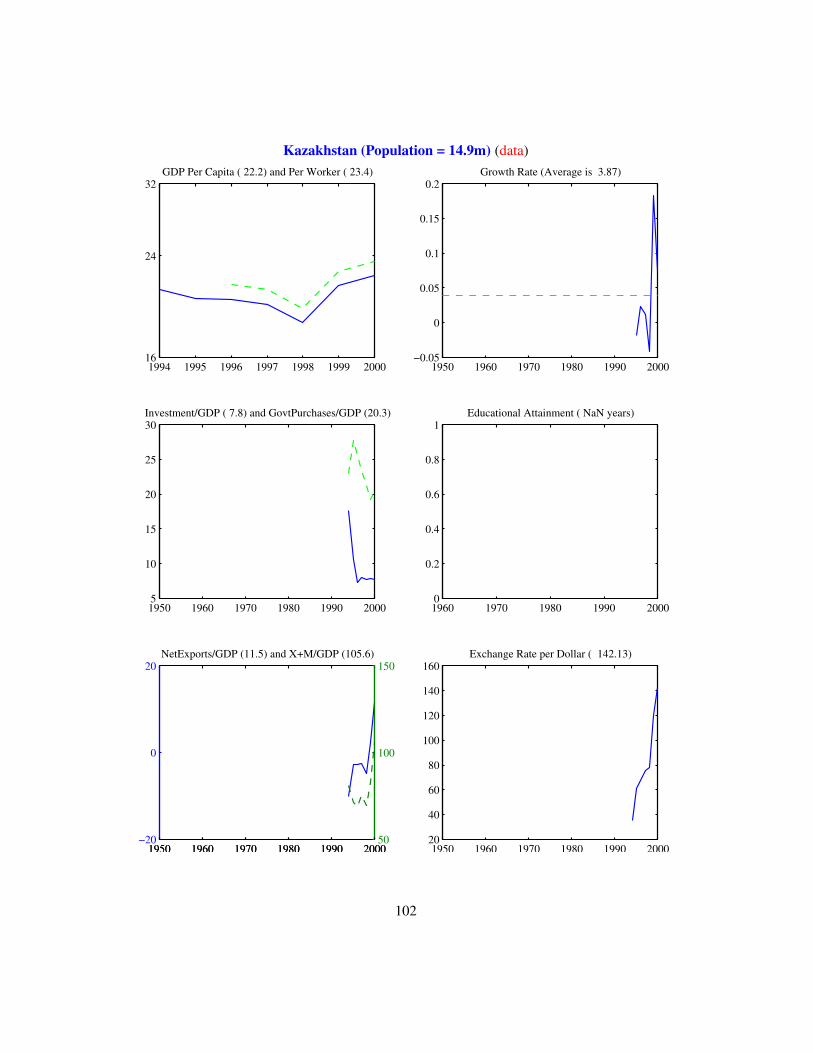
Kazakhstan (Population = 14.9m) (data)
1994 1995 1996 1997 1998 1999 200016
24
32GDP Per Capita ( 22.2) and Per Worker ( 23.4)
1950 1960 1970 1980 1990 2000−0.05
0
0.05
0.1
0.15
0.2Growth Rate (Average is 3.87)
1950 1960 1970 1980 1990 20005
10
15
20
25
30Investment/GDP ( 7.8) and GovtPurchases/GDP (20.3)
1960 1970 1980 1990 20000
0.2
0.4
0.6
0.8
1Educational Attainment ( NaN years)
1950 1960 1970 1980 1990 2000−20
0
20NetExports/GDP (11.5) and X+M/GDP (105.6)
1950 1960 1970 1980 1990 200050
100
150
1950 1960 1970 1980 1990 200020
40
60
80
100
120
140
160Exchange Rate per Dollar ( 142.13)
102
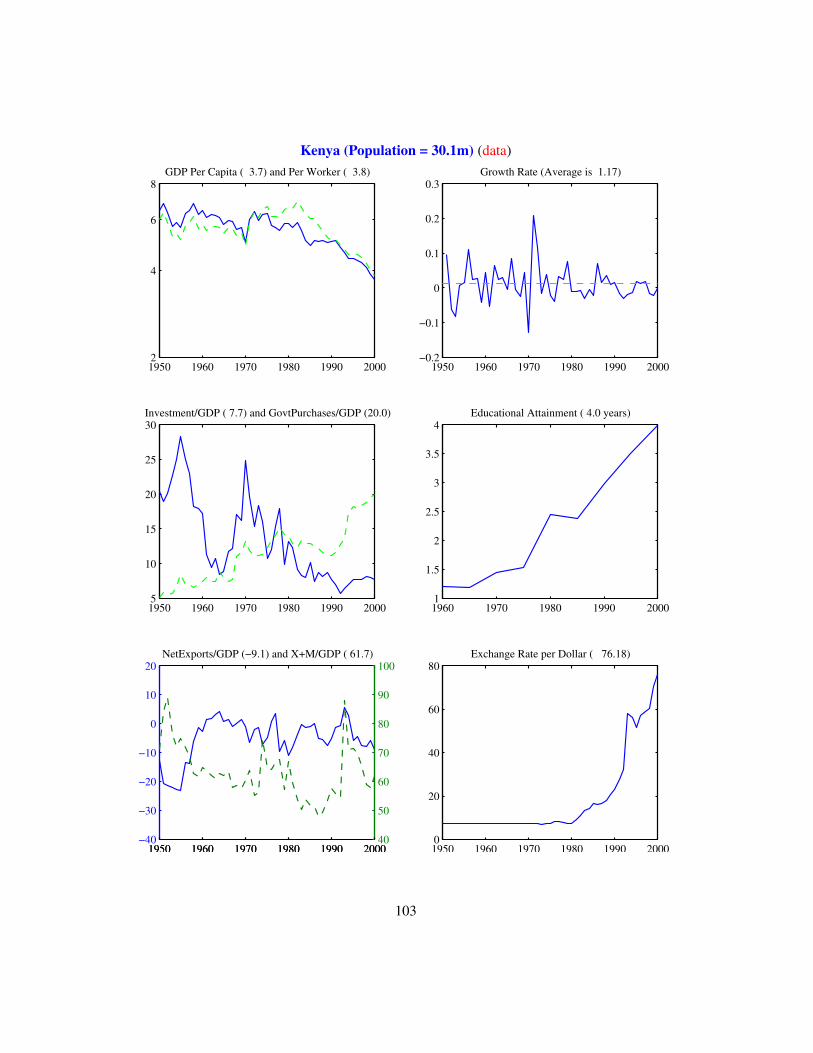
Kenya (Population = 30.1m) (data)
1950 1960 1970 1980 1990 20002
4
6
8GDP Per Capita ( 3.7) and Per Worker ( 3.8)
1950 1960 1970 1980 1990 2000−0.2
−0.1
0
0.1
0.2
0.3Growth Rate (Average is 1.17)
1950 1960 1970 1980 1990 20005
10
15
20
25
30Investment/GDP ( 7.7) and GovtPurchases/GDP (20.0)
1960 1970 1980 1990 20001
1.5
2
2.5
3
3.5
4Educational Attainment ( 4.0 years)
1950 1960 1970 1980 1990 2000−40
−30
−20
−10
0
10
20NetExports/GDP (−9.1) and X+M/GDP ( 61.7)
1950 1960 1970 1980 1990 200040
50
60
70
80
90
100
1950 1960 1970 1980 1990 20000
20
40
60
80Exchange Rate per Dollar ( 76.18)
103
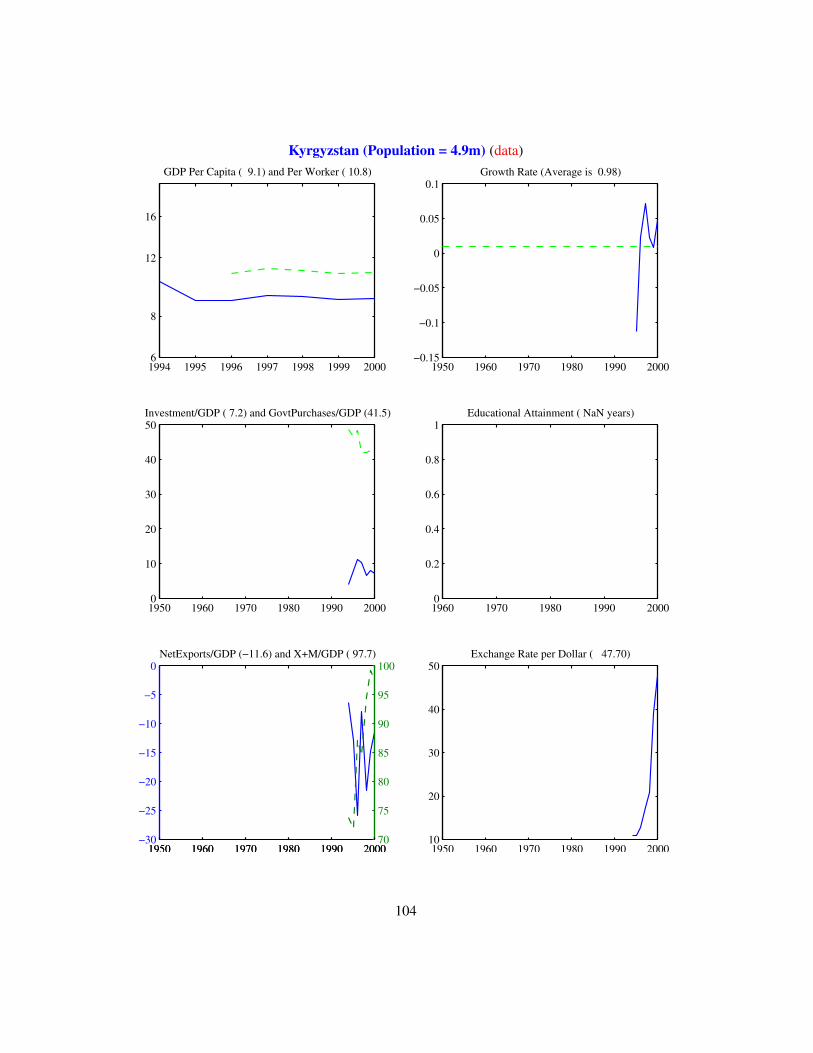
Kyrgyzstan (Population = 4.9m) (data)
1994 1995 1996 1997 1998 1999 2000 6
8
12
16
GDP Per Capita ( 9.1) and Per Worker ( 10.8)
1950 1960 1970 1980 1990 2000−0.15
−0.1
−0.05
0
0.05
0.1Growth Rate (Average is 0.98)
1950 1960 1970 1980 1990 20000
10
20
30
40
50Investment/GDP ( 7.2) and GovtPurchases/GDP (41.5)
1960 1970 1980 1990 20000
0.2
0.4
0.6
0.8
1Educational Attainment ( NaN years)
1950 1960 1970 1980 1990 2000−30
−25
−20
−15
−10
−5
0NetExports/GDP (−11.6) and X+M/GDP ( 97.7)
1950 1960 1970 1980 1990 200070
75
80
85
90
95
100
1950 1960 1970 1980 1990 200010
20
30
40
50Exchange Rate per Dollar ( 47.70)
104
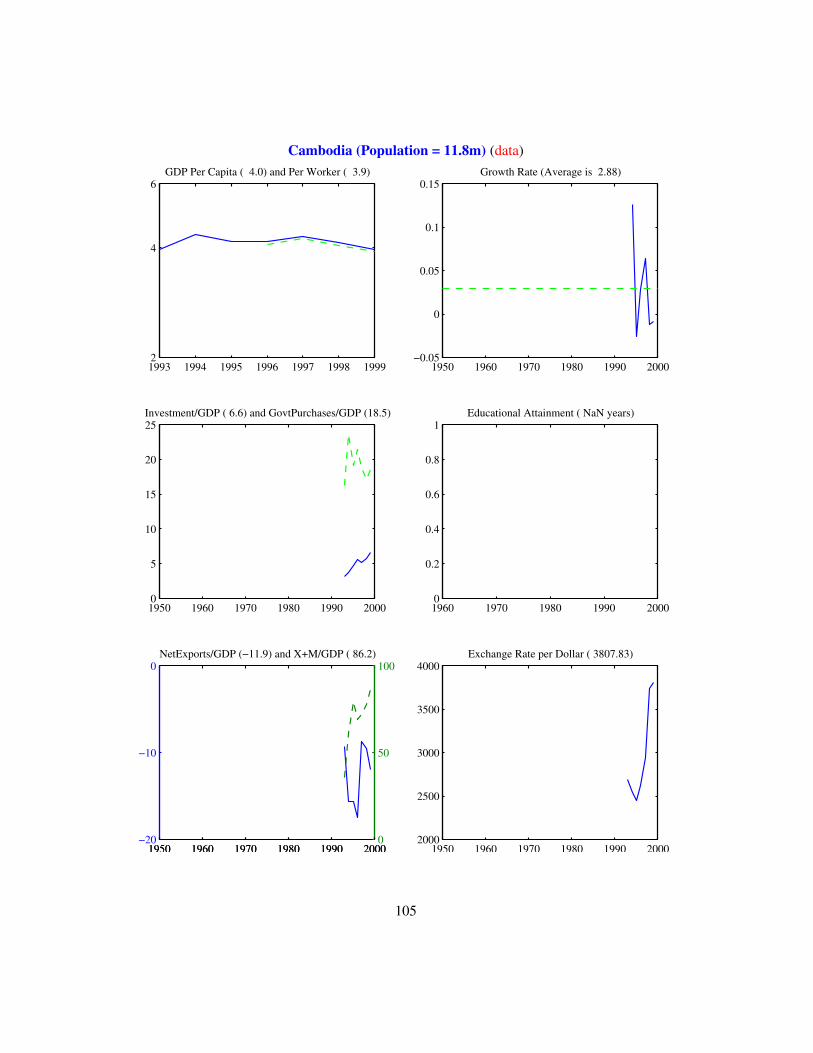
Cambodia (Population = 11.8m) (data)
1993 1994 1995 1996 1997 1998 19992
4
6GDP Per Capita ( 4.0) and Per Worker ( 3.9)
1950 1960 1970 1980 1990 2000−0.05
0
0.05
0.1
0.15Growth Rate (Average is 2.88)
1950 1960 1970 1980 1990 20000
5
10
15
20
25Investment/GDP ( 6.6) and GovtPurchases/GDP (18.5)
1960 1970 1980 1990 20000
0.2
0.4
0.6
0.8
1Educational Attainment ( NaN years)
1950 1960 1970 1980 1990 2000−20
−10
0NetExports/GDP (−11.9) and X+M/GDP ( 86.2)
1950 1960 1970 1980 1990 20000
50
100
1950 1960 1970 1980 1990 20002000
2500
3000
3500
4000Exchange Rate per Dollar ( 3807.83)
105
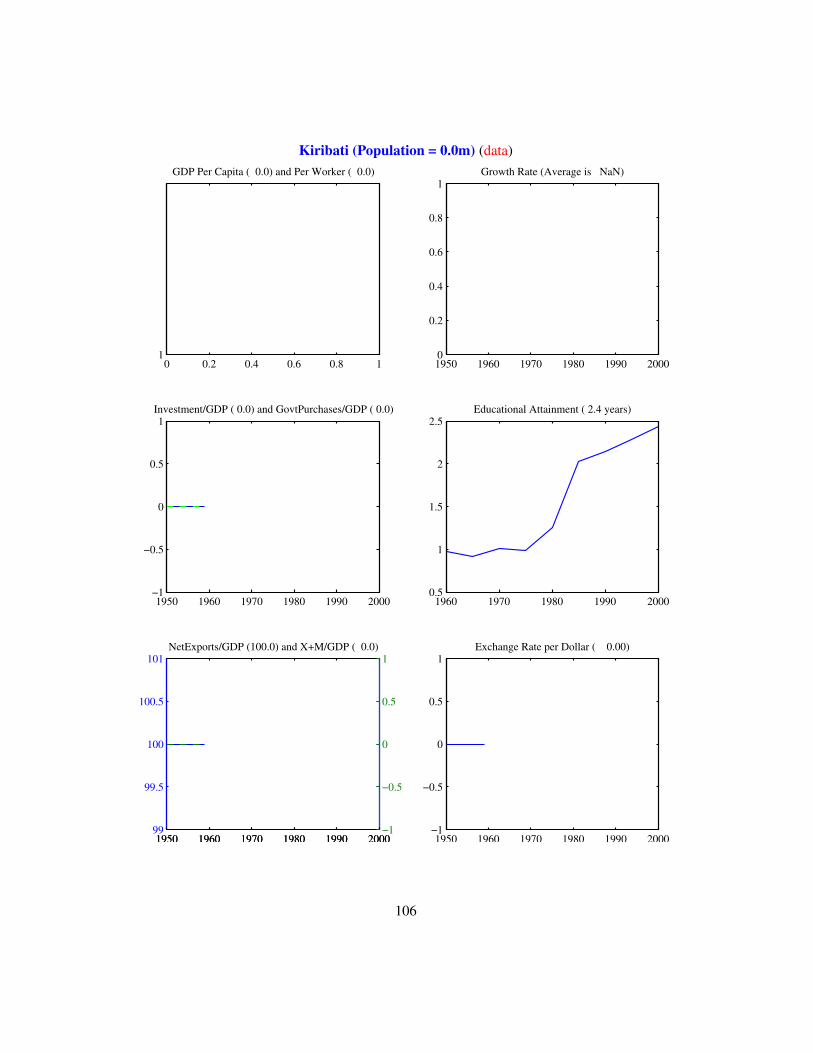
Kiribati (Population = 0.0m) (data)
0 0.2 0.4 0.6 0.8 11
GDP Per Capita ( 0.0) and Per Worker ( 0.0)
1950 1960 1970 1980 1990 20000
0.2
0.4
0.6
0.8
1Growth Rate (Average is NaN)
1950 1960 1970 1980 1990 2000−1
−0.5
0
0.5
1Investment/GDP ( 0.0) and GovtPurchases/GDP ( 0.0)
1960 1970 1980 1990 20000.5
1
1.5
2
2.5Educational Attainment ( 2.4 years)
1950 1960 1970 1980 1990 200099
99.5
100
100.5
101NetExports/GDP (100.0) and X+M/GDP ( 0.0)
1950 1960 1970 1980 1990 2000−1
−0.5
0
0.5
1
1950 1960 1970 1980 1990 2000−1
−0.5
0
0.5
1Exchange Rate per Dollar ( 0.00)
106
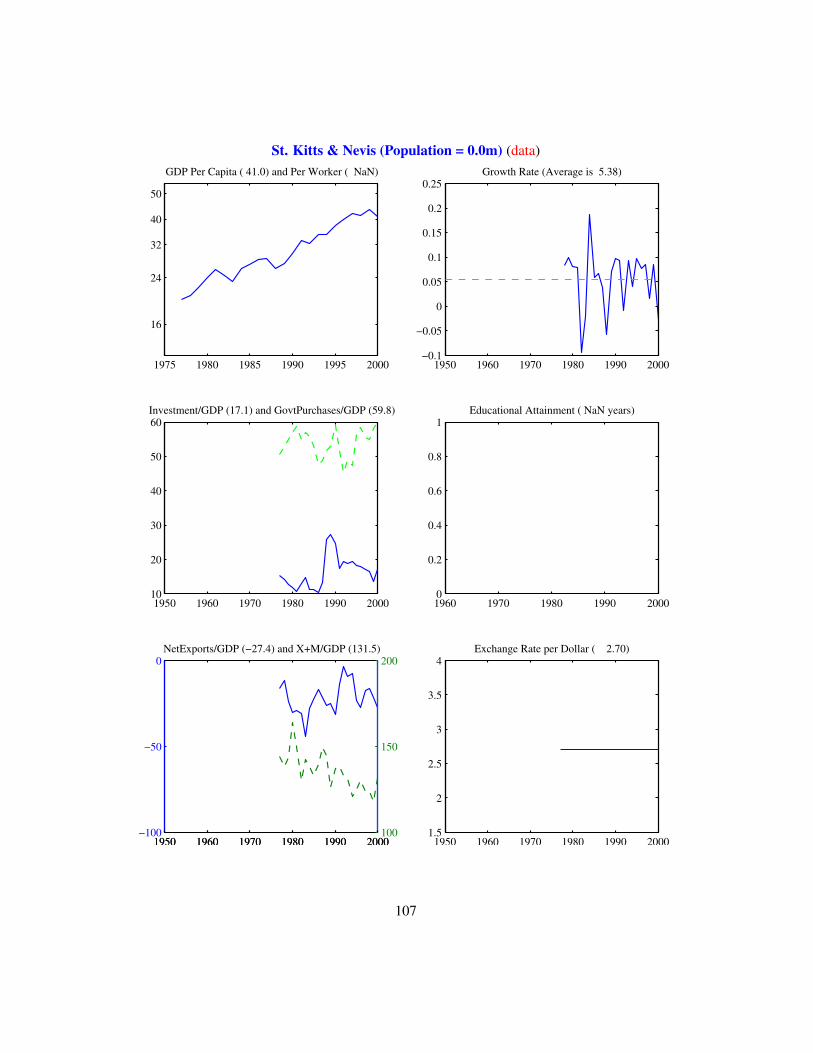
St. Kitts & Nevis (Population = 0.0m) (data)
1975 1980 1985 1990 1995 2000
16
24
32
40
50
GDP Per Capita ( 41.0) and Per Worker ( NaN)
1950 1960 1970 1980 1990 2000−0.1
−0.05
0
0.05
0.1
0.15
0.2
0.25Growth Rate (Average is 5.38)
1950 1960 1970 1980 1990 200010
20
30
40
50
60Investment/GDP (17.1) and GovtPurchases/GDP (59.8)
1960 1970 1980 1990 20000
0.2
0.4
0.6
0.8
1Educational Attainment ( NaN years)
1950 1960 1970 1980 1990 2000−100
−50
0NetExports/GDP (−27.4) and X+M/GDP (131.5)
1950 1960 1970 1980 1990 2000100
150
200
1950 1960 1970 1980 1990 20001.5
2
2.5
3
3.5
4Exchange Rate per Dollar ( 2.70)
107
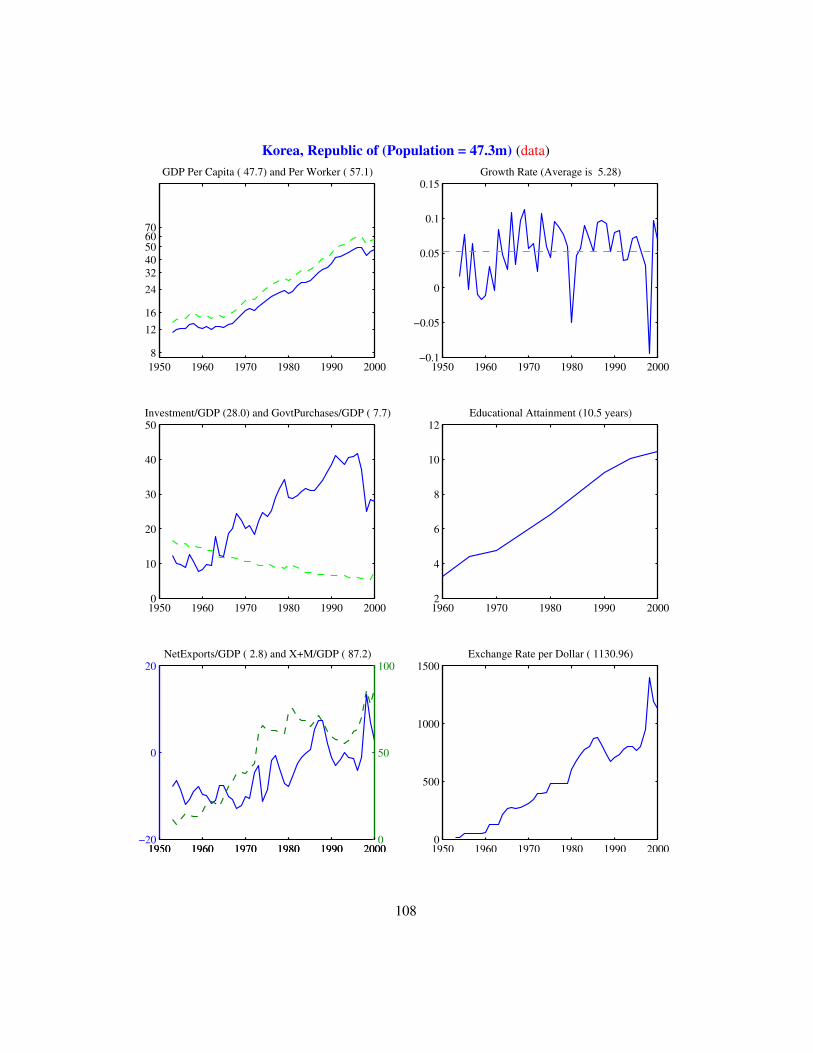
Korea, Republic of (Population = 47.3m) (data)
1950 1960 1970 1980 1990 2000 8
1216
243240506070
GDP Per Capita ( 47.7) and Per Worker ( 57.1)
1950 1960 1970 1980 1990 2000−0.1
−0.05
0
0.05
0.1
0.15Growth Rate (Average is 5.28)
1950 1960 1970 1980 1990 20000
10
20
30
40
50Investment/GDP (28.0) and GovtPurchases/GDP ( 7.7)
1960 1970 1980 1990 20002
4
6
8
10
12Educational Attainment (10.5 years)
1950 1960 1970 1980 1990 2000−20
0
20NetExports/GDP ( 2.8) and X+M/GDP ( 87.2)
1950 1960 1970 1980 1990 20000
50
100
1950 1960 1970 1980 1990 20000
500
1000
1500Exchange Rate per Dollar ( 1130.96)
108
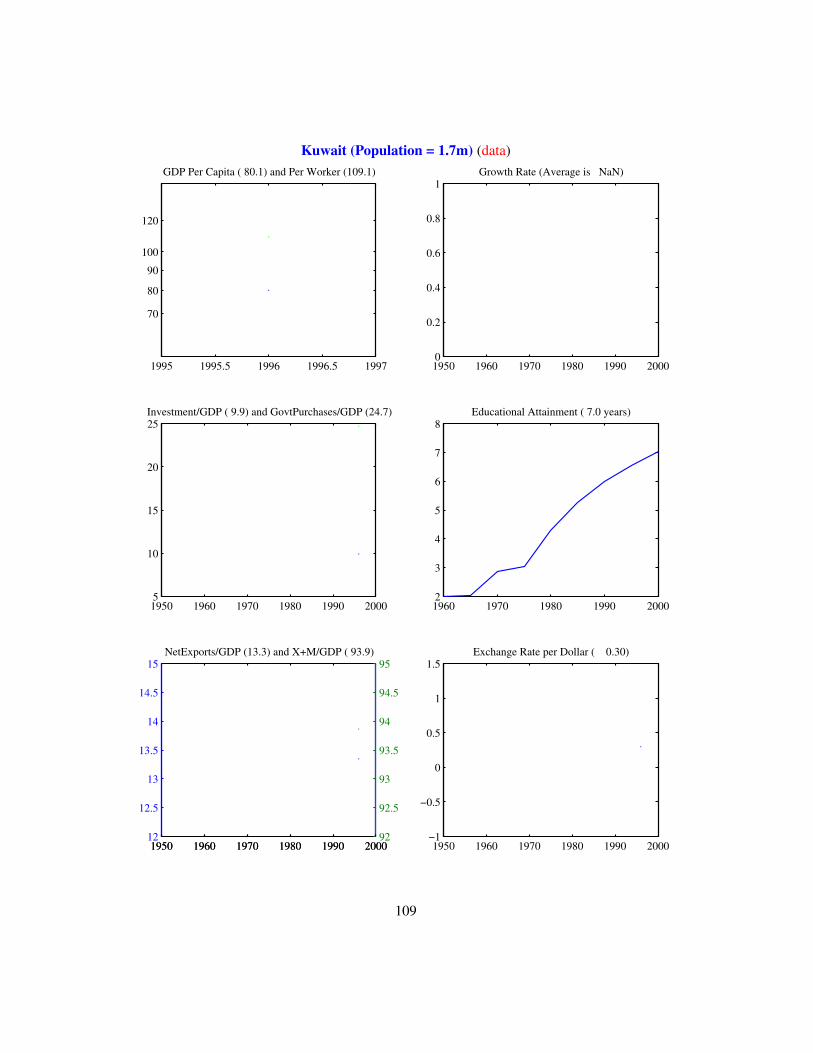
Kuwait (Population = 1.7m) (data)
1995 1995.5 1996 1996.5 1997
70
80
90
100
120
GDP Per Capita ( 80.1) and Per Worker (109.1)
1950 1960 1970 1980 1990 20000
0.2
0.4
0.6
0.8
1Growth Rate (Average is NaN)
1950 1960 1970 1980 1990 20005
10
15
20
25Investment/GDP ( 9.9) and GovtPurchases/GDP (24.7)
1960 1970 1980 1990 20002
3
4
5
6
7
8Educational Attainment ( 7.0 years)
1950 1960 1970 1980 1990 200012
12.5
13
13.5
14
14.5
15NetExports/GDP (13.3) and X+M/GDP ( 93.9)
1950 1960 1970 1980 1990 200092
92.5
93
93.5
94
94.5
95
1950 1960 1970 1980 1990 2000−1
−0.5
0
0.5
1
1.5Exchange Rate per Dollar ( 0.30)
109
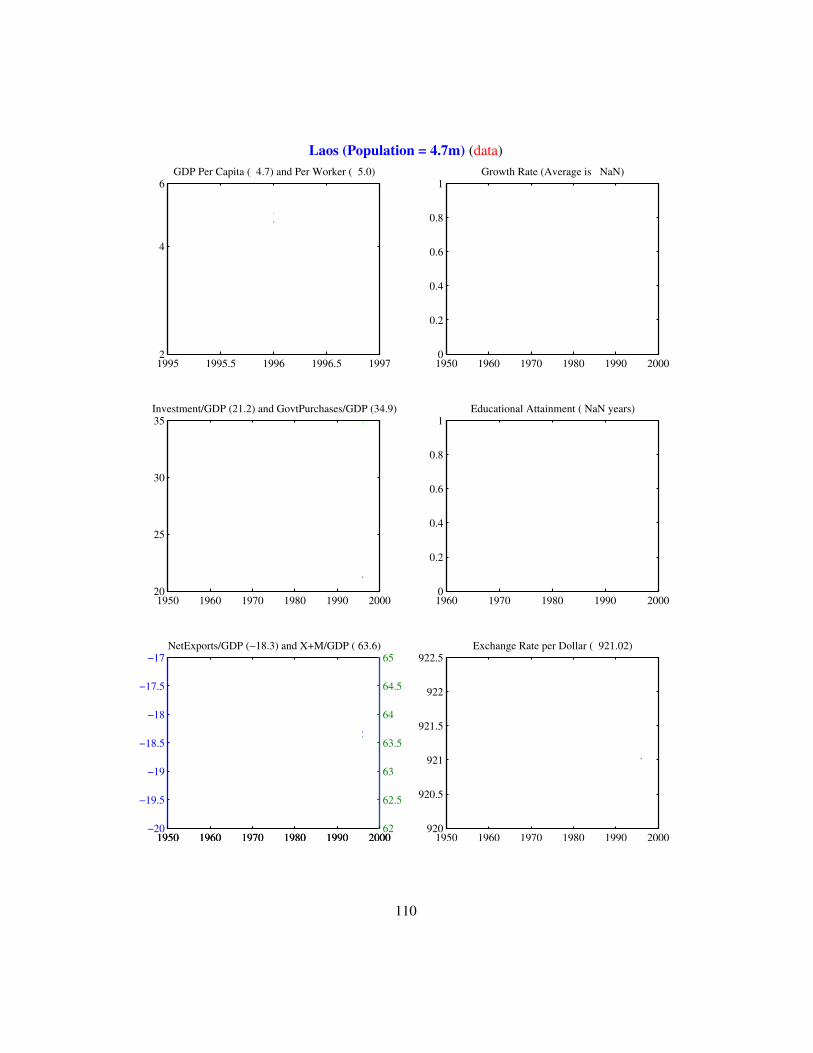
Laos (Population = 4.7m) (data)
1995 1995.5 1996 1996.5 19972
4
6GDP Per Capita ( 4.7) and Per Worker ( 5.0)
1950 1960 1970 1980 1990 20000
0.2
0.4
0.6
0.8
1Growth Rate (Average is NaN)
1950 1960 1970 1980 1990 200020
25
30
35Investment/GDP (21.2) and GovtPurchases/GDP (34.9)
1960 1970 1980 1990 20000
0.2
0.4
0.6
0.8
1Educational Attainment ( NaN years)
1950 1960 1970 1980 1990 2000−20
−19.5
−19
−18.5
−18
−17.5
−17NetExports/GDP (−18.3) and X+M/GDP ( 63.6)
1950 1960 1970 1980 1990 200062
62.5
63
63.5
64
64.5
65
1950 1960 1970 1980 1990 2000920
920.5
921
921.5
922
922.5Exchange Rate per Dollar ( 921.02)
110
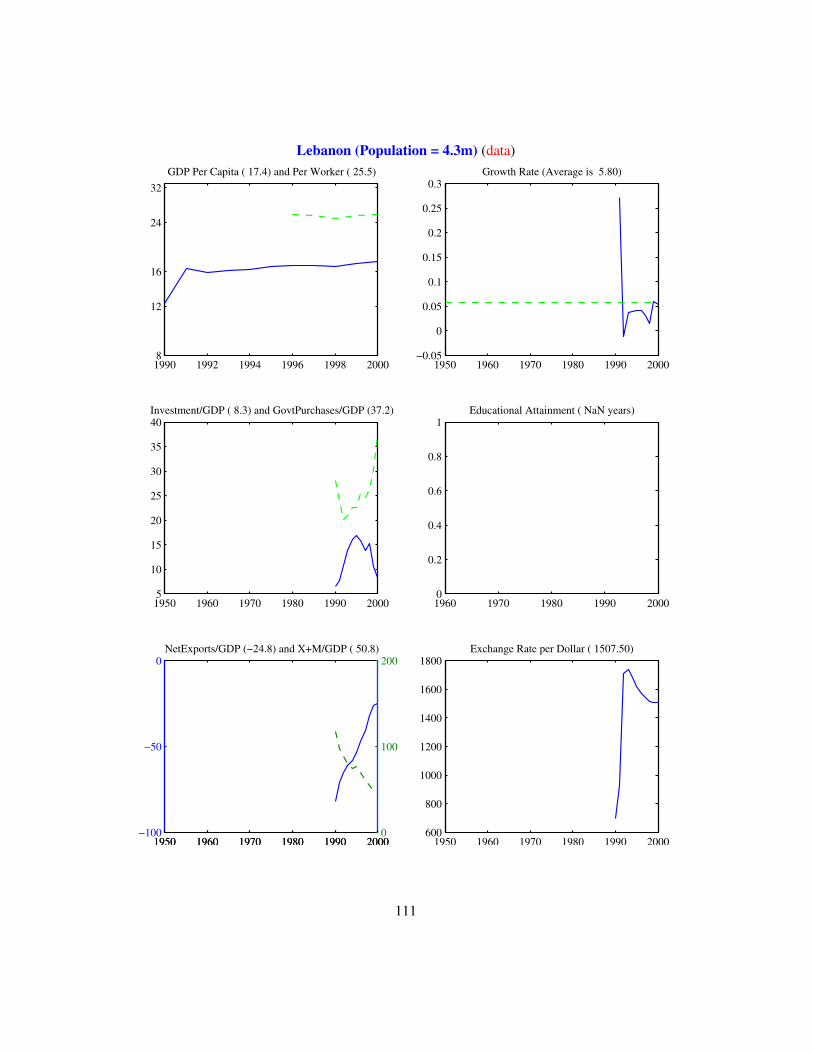
Lebanon (Population = 4.3m) (data)
1990 1992 1994 1996 1998 2000 8
12
16
24
32GDP Per Capita ( 17.4) and Per Worker ( 25.5)
1950 1960 1970 1980 1990 2000−0.05
0
0.05
0.1
0.15
0.2
0.25
0.3Growth Rate (Average is 5.80)
1950 1960 1970 1980 1990 20005
10
15
20
25
30
35
40Investment/GDP ( 8.3) and GovtPurchases/GDP (37.2)
1960 1970 1980 1990 20000
0.2
0.4
0.6
0.8
1Educational Attainment ( NaN years)
1950 1960 1970 1980 1990 2000−100
−50
0NetExports/GDP (−24.8) and X+M/GDP ( 50.8)
1950 1960 1970 1980 1990 20000
100
200
1950 1960 1970 1980 1990 2000600
800
1000
1200
1400
1600
1800Exchange Rate per Dollar ( 1507.50)
111

Liberia (Population = 0.0m) (data)
0 0.2 0.4 0.6 0.8 11
GDP Per Capita ( 0.0) and Per Worker ( 0.0)
1950 1960 1970 1980 1990 20000
0.2
0.4
0.6
0.8
1Growth Rate (Average is NaN)
1950 1960 1970 1980 1990 2000−1
−0.5
0
0.5
1Investment/GDP ( 0.0) and GovtPurchases/GDP ( 0.0)
1960 1970 1980 1990 20000.5
1
1.5
2
2.5Educational Attainment ( 2.3 years)
1950 1960 1970 1980 1990 200099
99.5
100
100.5
101NetExports/GDP (100.0) and X+M/GDP ( 0.0)
1950 1960 1970 1980 1990 2000−1
−0.5
0
0.5
1
1950 1960 1970 1980 1990 2000−1
−0.5
0
0.5
1Exchange Rate per Dollar ( 0.00)
112

Libya (Population = 0.0m) (data)
0 0.2 0.4 0.6 0.8 11
GDP Per Capita ( 0.0) and Per Worker ( 0.0)
1950 1960 1970 1980 1990 20000
0.2
0.4
0.6
0.8
1Growth Rate (Average is NaN)
1950 1960 1970 1980 1990 2000−1
−0.5
0
0.5
1Investment/GDP ( 0.0) and GovtPurchases/GDP ( 0.0)
1960 1970 1980 1990 20000
0.2
0.4
0.6
0.8
1Educational Attainment ( NaN years)
1950 1960 1970 1980 1990 200099
99.5
100
100.5
101NetExports/GDP (100.0) and X+M/GDP ( 0.0)
1950 1960 1970 1980 1990 2000−1
−0.5
0
0.5
1
1950 1960 1970 1980 1990 2000−1
−0.5
0
0.5
1Exchange Rate per Dollar ( 0.00)
113
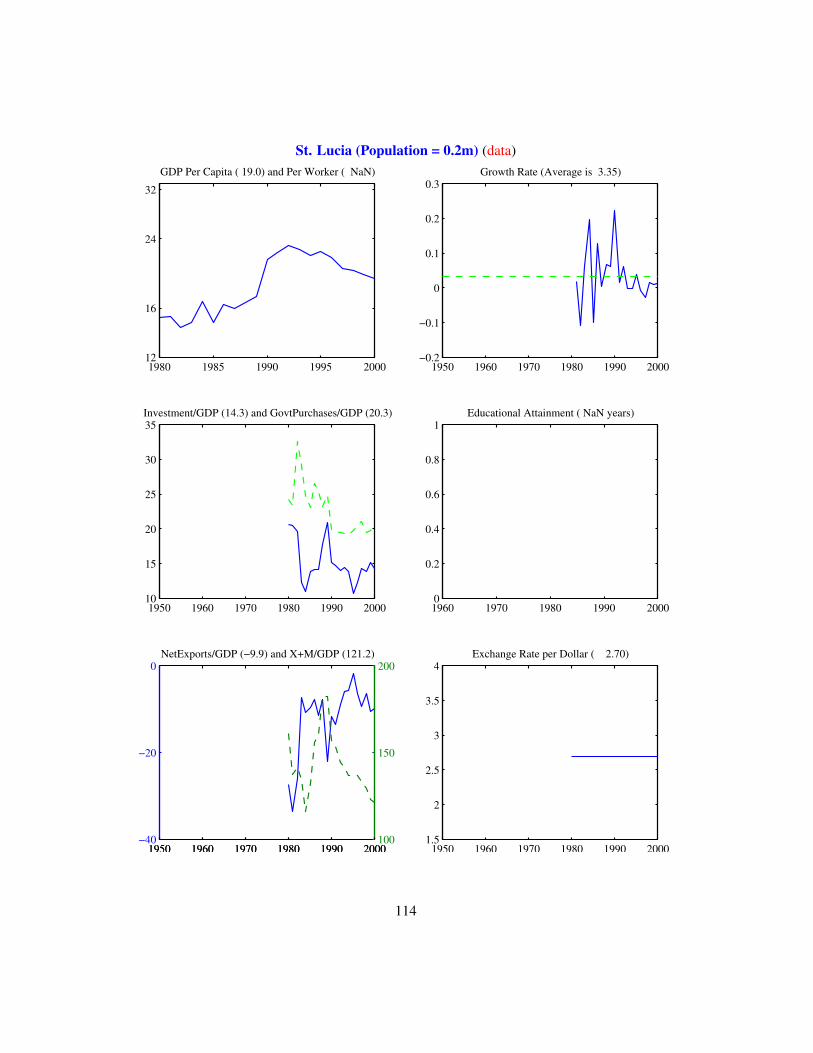
St. Lucia (Population = 0.2m) (data)
1980 1985 1990 1995 200012
16
24
32
GDP Per Capita ( 19.0) and Per Worker ( NaN)
1950 1960 1970 1980 1990 2000−0.2
−0.1
0
0.1
0.2
0.3Growth Rate (Average is 3.35)
1950 1960 1970 1980 1990 200010
15
20
25
30
35Investment/GDP (14.3) and GovtPurchases/GDP (20.3)
1960 1970 1980 1990 20000
0.2
0.4
0.6
0.8
1Educational Attainment ( NaN years)
1950 1960 1970 1980 1990 2000−40
−20
0NetExports/GDP (−9.9) and X+M/GDP (121.2)
1950 1960 1970 1980 1990 2000100
150
200
1950 1960 1970 1980 1990 20001.5
2
2.5
3
3.5
4Exchange Rate per Dollar ( 2.70)
114

Liechtenstein (Population = 0.0m) (data)
0 0.2 0.4 0.6 0.8 11
GDP Per Capita ( 0.0) and Per Worker ( 0.0)
1950 1960 1970 1980 1990 20000
0.2
0.4
0.6
0.8
1Growth Rate (Average is NaN)
1950 1960 1970 1980 1990 2000−1
−0.5
0
0.5
1Investment/GDP ( 0.0) and GovtPurchases/GDP ( 0.0)
1960 1970 1980 1990 20000
0.2
0.4
0.6
0.8
1Educational Attainment ( NaN years)
1950 1960 1970 1980 1990 200099
99.5
100
100.5
101NetExports/GDP (100.0) and X+M/GDP ( 0.0)
1950 1960 1970 1980 1990 2000−1
−0.5
0
0.5
1
1950 1960 1970 1980 1990 2000−1
−0.5
0
0.5
1Exchange Rate per Dollar ( 0.00)
115
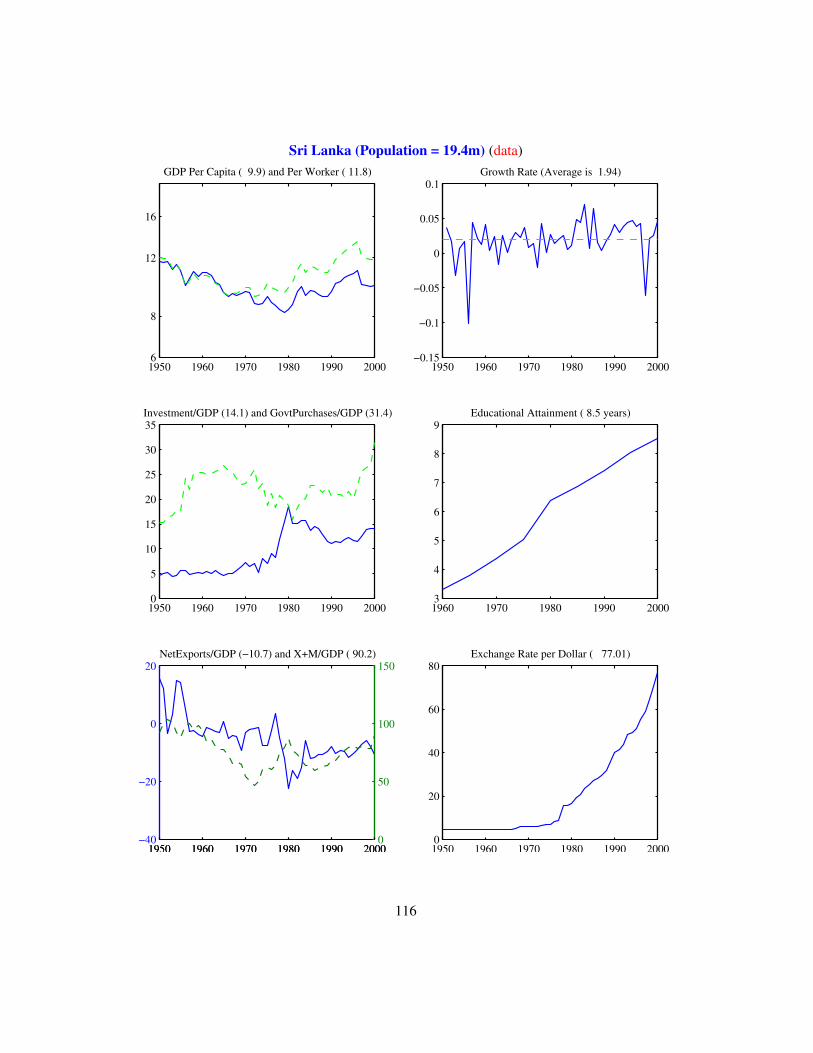
Sri Lanka (Population = 19.4m) (data)
1950 1960 1970 1980 1990 2000 6
8
12
16
GDP Per Capita ( 9.9) and Per Worker ( 11.8)
1950 1960 1970 1980 1990 2000−0.15
−0.1
−0.05
0
0.05
0.1Growth Rate (Average is 1.94)
1950 1960 1970 1980 1990 20000
5
10
15
20
25
30
35Investment/GDP (14.1) and GovtPurchases/GDP (31.4)
1960 1970 1980 1990 20003
4
5
6
7
8
9Educational Attainment ( 8.5 years)
1950 1960 1970 1980 1990 2000−40
−20
0
20NetExports/GDP (−10.7) and X+M/GDP ( 90.2)
1950 1960 1970 1980 1990 20000
50
100
150
1950 1960 1970 1980 1990 20000
20
40
60
80Exchange Rate per Dollar ( 77.01)
116
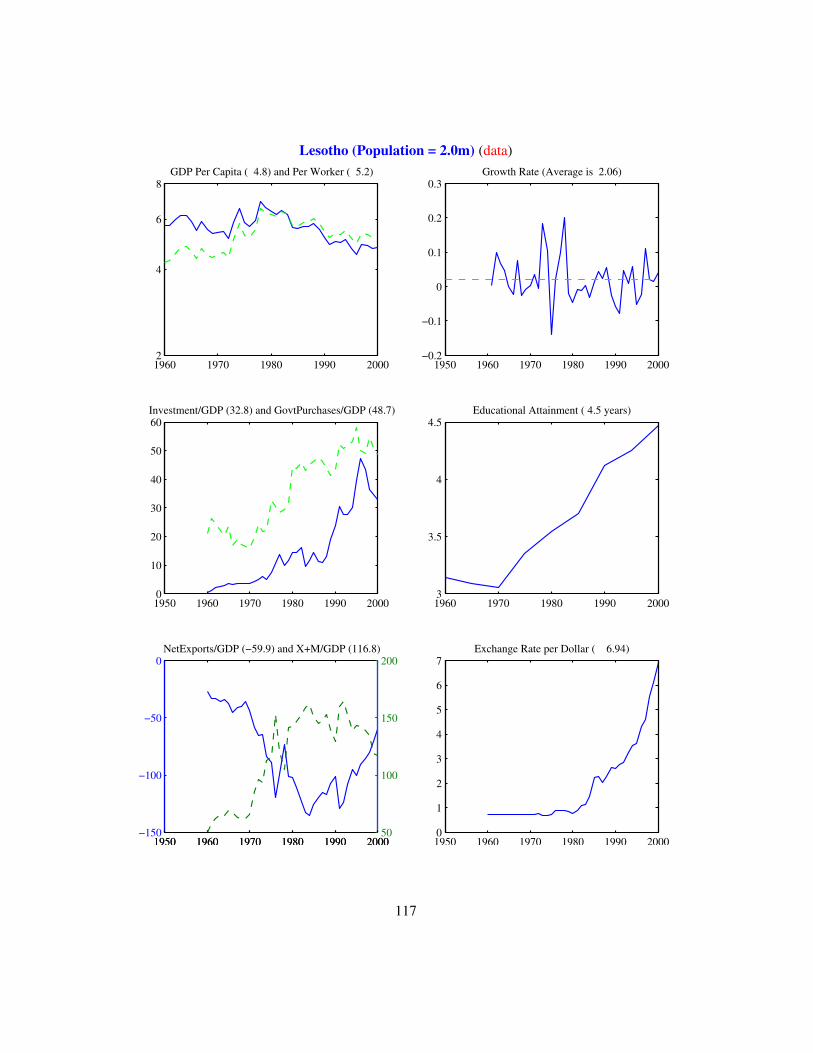
Lesotho (Population = 2.0m) (data)
1960 1970 1980 1990 20002
4
6
8GDP Per Capita ( 4.8) and Per Worker ( 5.2)
1950 1960 1970 1980 1990 2000−0.2
−0.1
0
0.1
0.2
0.3Growth Rate (Average is 2.06)
1950 1960 1970 1980 1990 20000
10
20
30
40
50
60Investment/GDP (32.8) and GovtPurchases/GDP (48.7)
1960 1970 1980 1990 20003
3.5
4
4.5Educational Attainment ( 4.5 years)
1950 1960 1970 1980 1990 2000−150
−100
−50
0NetExports/GDP (−59.9) and X+M/GDP (116.8)
1950 1960 1970 1980 1990 200050
100
150
200
1950 1960 1970 1980 1990 20000
1
2
3
4
5
6
7Exchange Rate per Dollar ( 6.94)
117
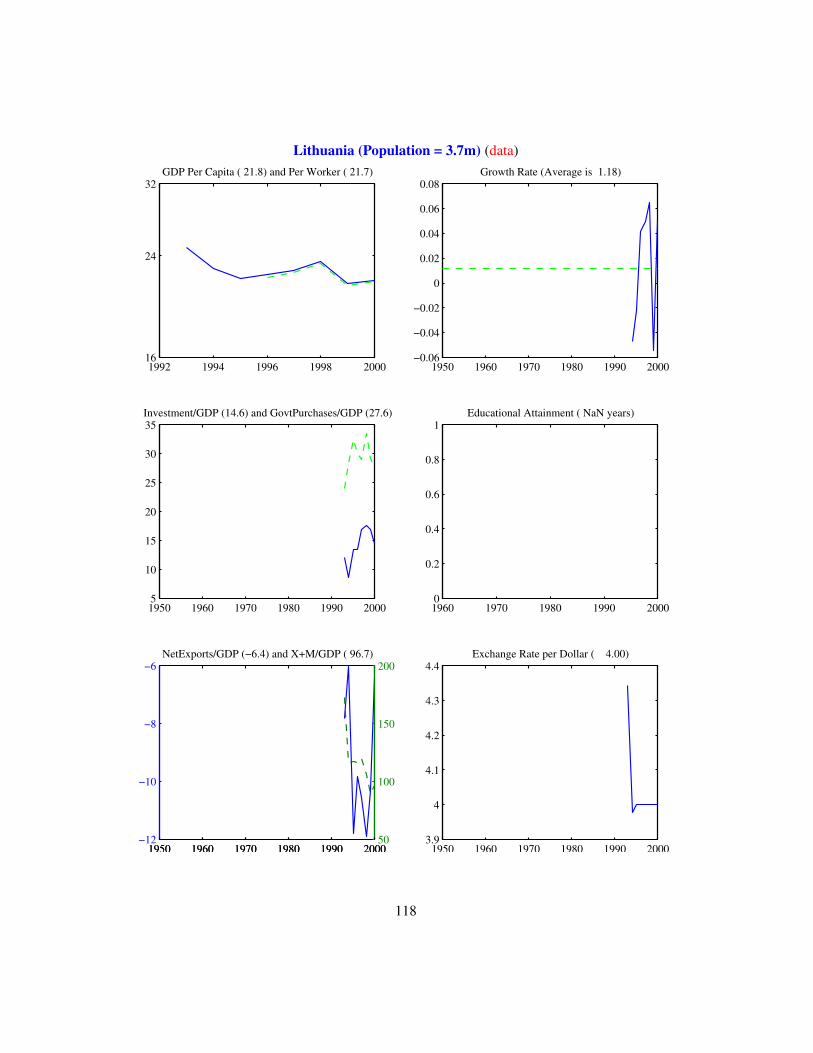
Lithuania (Population = 3.7m) (data)
1992 1994 1996 1998 200016
24
32GDP Per Capita ( 21.8) and Per Worker ( 21.7)
1950 1960 1970 1980 1990 2000−0.06
−0.04
−0.02
0
0.02
0.04
0.06
0.08Growth Rate (Average is 1.18)
1950 1960 1970 1980 1990 20005
10
15
20
25
30
35Investment/GDP (14.6) and GovtPurchases/GDP (27.6)
1960 1970 1980 1990 20000
0.2
0.4
0.6
0.8
1Educational Attainment ( NaN years)
1950 1960 1970 1980 1990 2000−12
−10
−8
−6NetExports/GDP (−6.4) and X+M/GDP ( 96.7)
1950 1960 1970 1980 1990 200050
100
150
200
1950 1960 1970 1980 1990 20003.9
4
4.1
4.2
4.3
4.4Exchange Rate per Dollar ( 4.00)
118
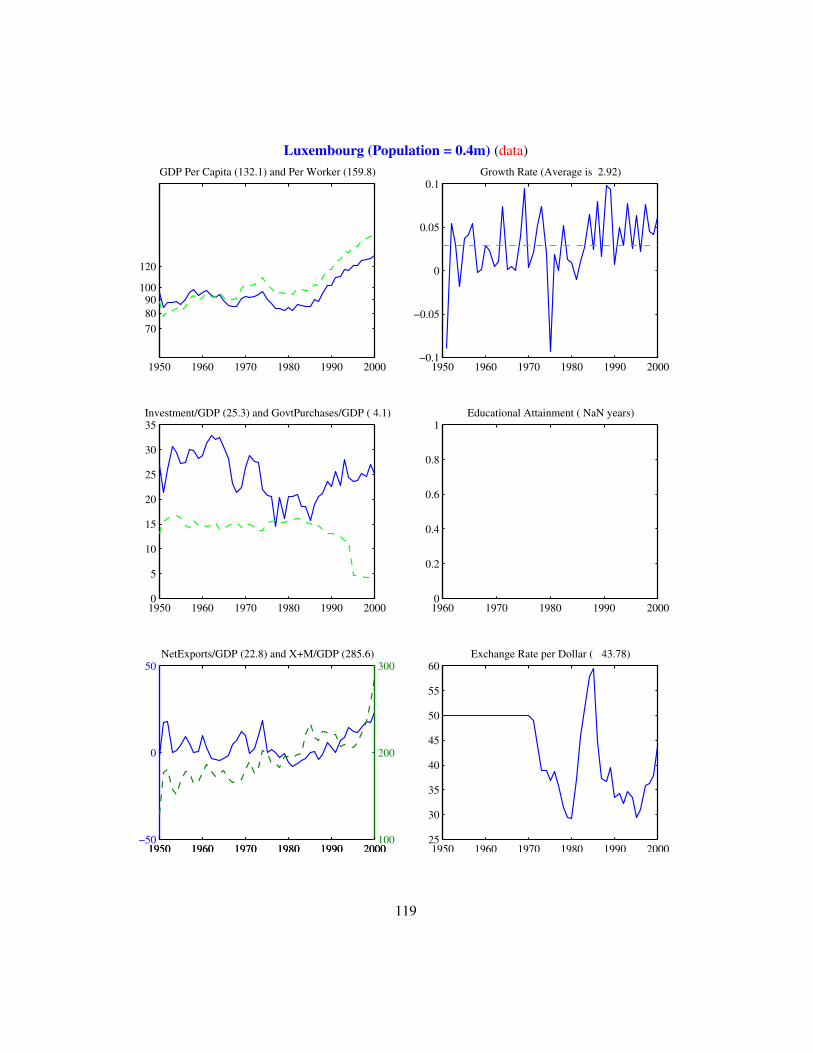
Luxembourg (Population = 0.4m) (data)
1950 1960 1970 1980 1990 2000
70 80 90
100
120
GDP Per Capita (132.1) and Per Worker (159.8)
1950 1960 1970 1980 1990 2000−0.1
−0.05
0
0.05
0.1Growth Rate (Average is 2.92)
1950 1960 1970 1980 1990 20000
5
10
15
20
25
30
35Investment/GDP (25.3) and GovtPurchases/GDP ( 4.1)
1960 1970 1980 1990 20000
0.2
0.4
0.6
0.8
1Educational Attainment ( NaN years)
1950 1960 1970 1980 1990 2000−50
0
50NetExports/GDP (22.8) and X+M/GDP (285.6)
1950 1960 1970 1980 1990 2000100
200
300
1950 1960 1970 1980 1990 200025
30
35
40
45
50
55
60Exchange Rate per Dollar ( 43.78)
119
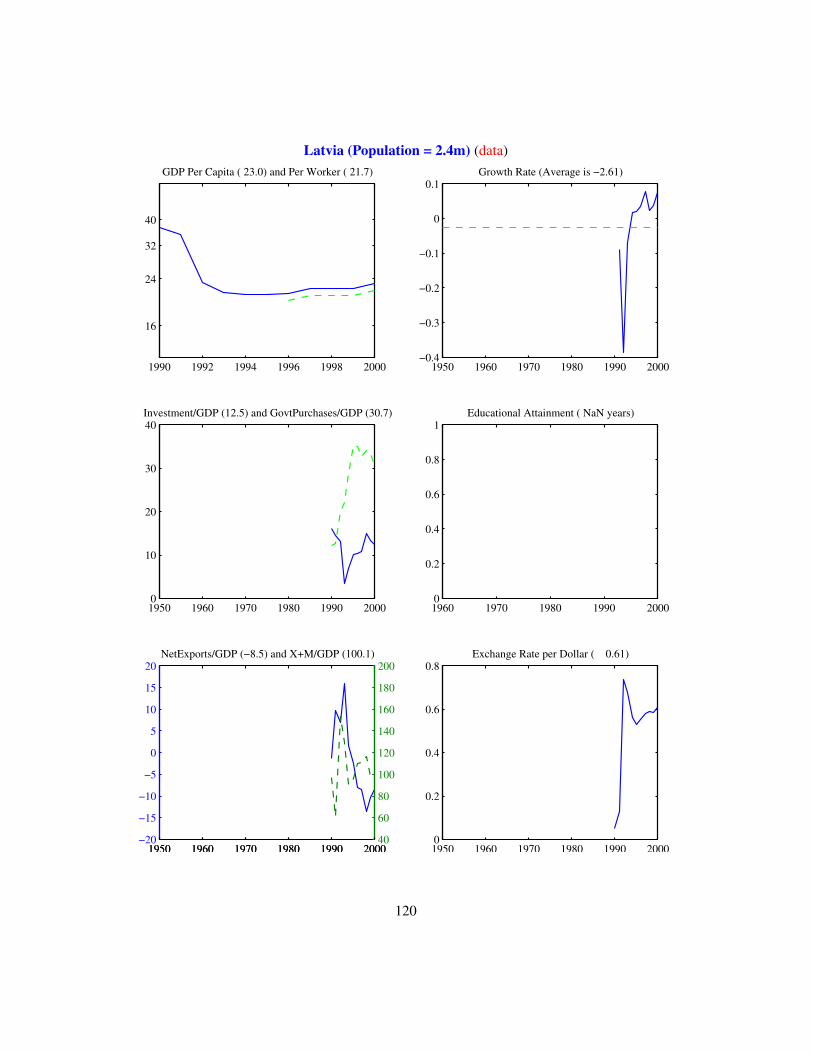
Latvia (Population = 2.4m) (data)
1990 1992 1994 1996 1998 2000
16
24
32
40
GDP Per Capita ( 23.0) and Per Worker ( 21.7)
1950 1960 1970 1980 1990 2000−0.4
−0.3
−0.2
−0.1
0
0.1Growth Rate (Average is −2.61)
1950 1960 1970 1980 1990 20000
10
20
30
40Investment/GDP (12.5) and GovtPurchases/GDP (30.7)
1960 1970 1980 1990 20000
0.2
0.4
0.6
0.8
1Educational Attainment ( NaN years)
1950 1960 1970 1980 1990 2000−20
−15
−10
−5
0
5
10
15
20NetExports/GDP (−8.5) and X+M/GDP (100.1)
1950 1960 1970 1980 1990 200040
60
80
100
120
140
160
180
200
1950 1960 1970 1980 1990 20000
0.2
0.4
0.6
0.8Exchange Rate per Dollar ( 0.61)
120
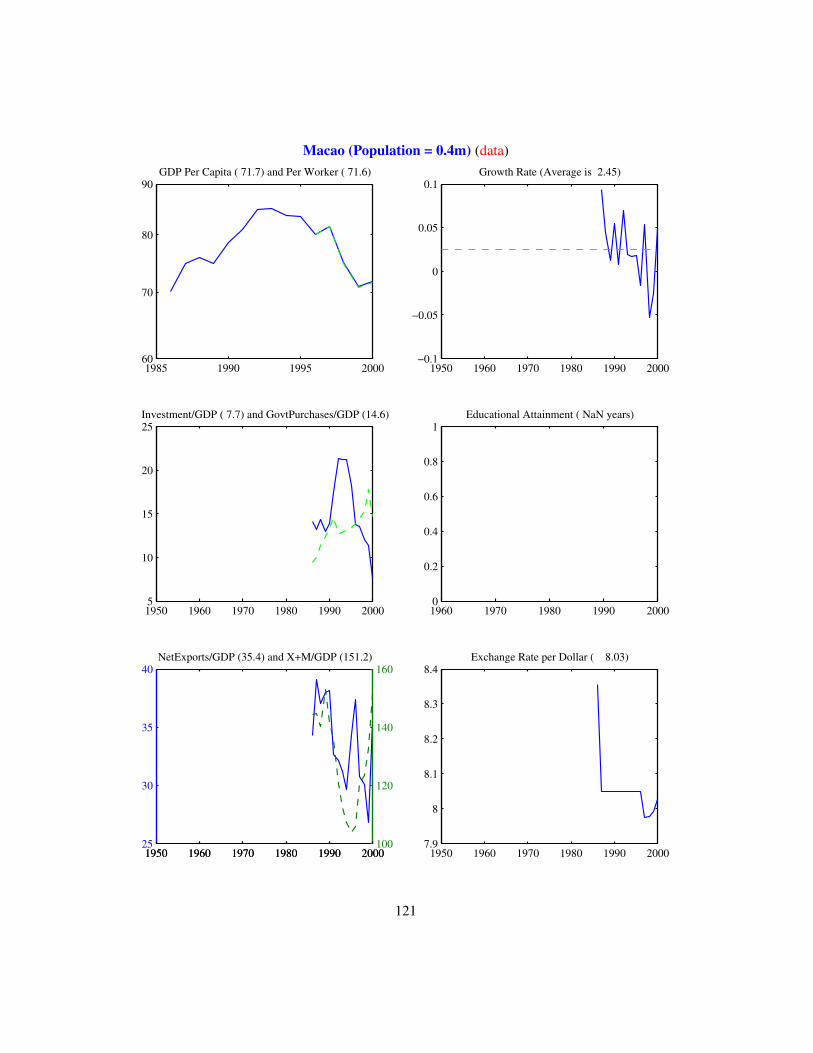
Macao (Population = 0.4m) (data)
1985 1990 1995 200060
70
80
90GDP Per Capita ( 71.7) and Per Worker ( 71.6)
1950 1960 1970 1980 1990 2000−0.1
−0.05
0
0.05
0.1Growth Rate (Average is 2.45)
1950 1960 1970 1980 1990 20005
10
15
20
25Investment/GDP ( 7.7) and GovtPurchases/GDP (14.6)
1960 1970 1980 1990 20000
0.2
0.4
0.6
0.8
1Educational Attainment ( NaN years)
1950 1960 1970 1980 1990 200025
30
35
40NetExports/GDP (35.4) and X+M/GDP (151.2)
1950 1960 1970 1980 1990 2000100
120
140
160
1950 1960 1970 1980 1990 20007.9
8
8.1
8.2
8.3
8.4Exchange Rate per Dollar ( 8.03)
121
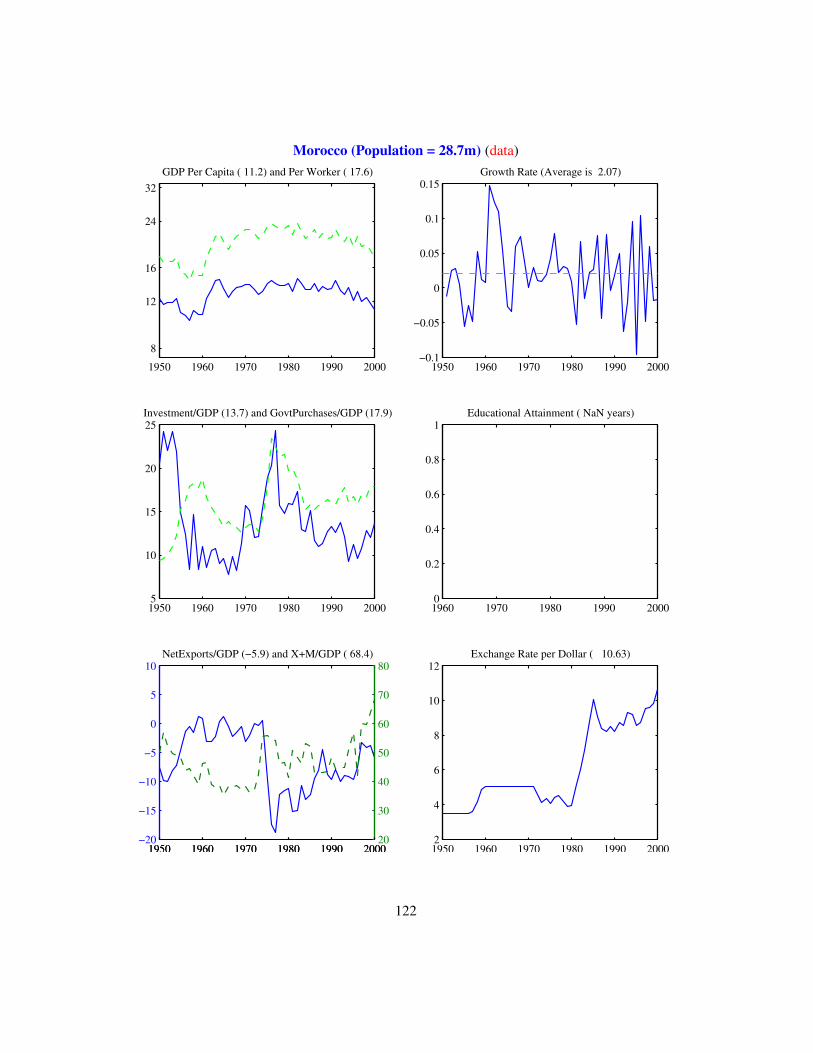
Morocco (Population = 28.7m) (data)
1950 1960 1970 1980 1990 2000
8
12
16
24
32GDP Per Capita ( 11.2) and Per Worker ( 17.6)
1950 1960 1970 1980 1990 2000−0.1
−0.05
0
0.05
0.1
0.15Growth Rate (Average is 2.07)
1950 1960 1970 1980 1990 20005
10
15
20
25Investment/GDP (13.7) and GovtPurchases/GDP (17.9)
1960 1970 1980 1990 20000
0.2
0.4
0.6
0.8
1Educational Attainment ( NaN years)
1950 1960 1970 1980 1990 2000−20
−15
−10
−5
0
5
10NetExports/GDP (−5.9) and X+M/GDP ( 68.4)
1950 1960 1970 1980 1990 200020
30
40
50
60
70
80
1950 1960 1970 1980 1990 20002
4
6
8
10
12Exchange Rate per Dollar ( 10.63)
122

Monaco (Population = 0.0m) (data)
0 0.2 0.4 0.6 0.8 11
GDP Per Capita ( 0.0) and Per Worker ( 0.0)
1950 1960 1970 1980 1990 20000
0.2
0.4
0.6
0.8
1Growth Rate (Average is NaN)
1950 1960 1970 1980 1990 2000−1
−0.5
0
0.5
1Investment/GDP ( 0.0) and GovtPurchases/GDP ( 0.0)
1960 1970 1980 1990 20000
0.2
0.4
0.6
0.8
1Educational Attainment ( NaN years)
1950 1960 1970 1980 1990 200099
99.5
100
100.5
101NetExports/GDP (100.0) and X+M/GDP ( 0.0)
1950 1960 1970 1980 1990 2000−1
−0.5
0
0.5
1
1950 1960 1970 1980 1990 2000−1
−0.5
0
0.5
1Exchange Rate per Dollar ( 0.00)
123
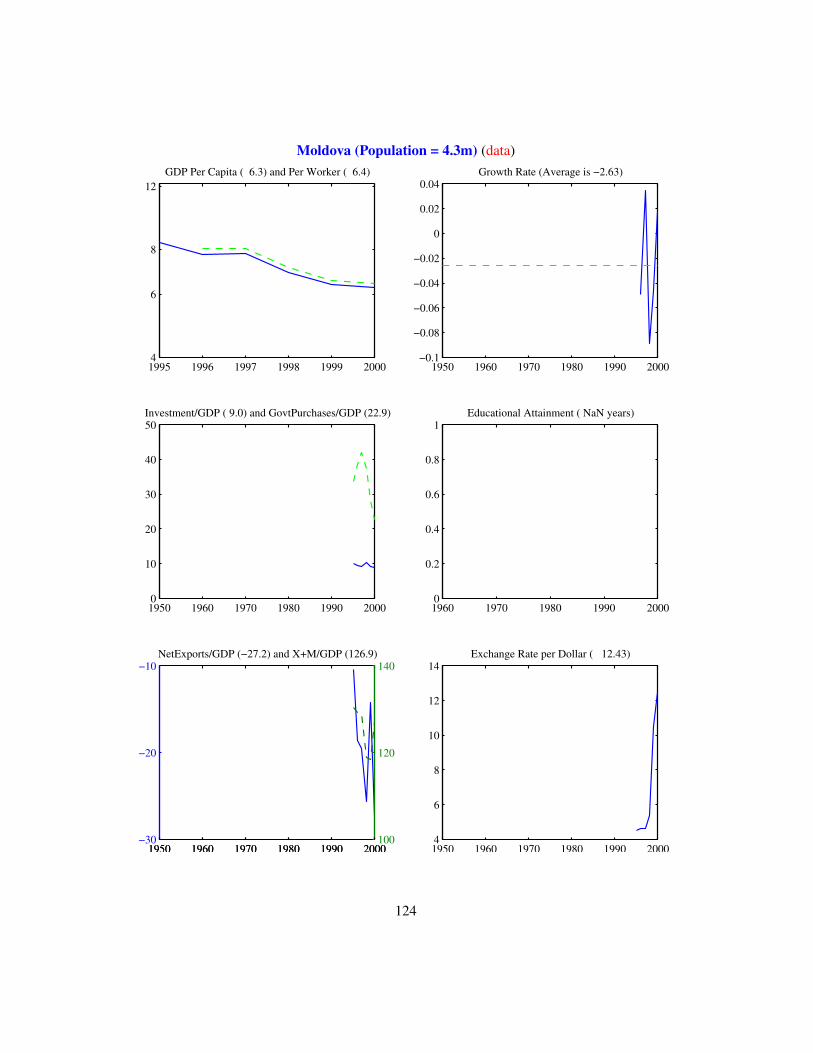
Moldova (Population = 4.3m) (data)
1995 1996 1997 1998 1999 2000 4
6
8
12GDP Per Capita ( 6.3) and Per Worker ( 6.4)
1950 1960 1970 1980 1990 2000−0.1
−0.08
−0.06
−0.04
−0.02
0
0.02
0.04Growth Rate (Average is −2.63)
1950 1960 1970 1980 1990 20000
10
20
30
40
50Investment/GDP ( 9.0) and GovtPurchases/GDP (22.9)
1960 1970 1980 1990 20000
0.2
0.4
0.6
0.8
1Educational Attainment ( NaN years)
1950 1960 1970 1980 1990 2000−30
−20
−10NetExports/GDP (−27.2) and X+M/GDP (126.9)
1950 1960 1970 1980 1990 2000100
120
140
1950 1960 1970 1980 1990 20004
6
8
10
12
14Exchange Rate per Dollar ( 12.43)
124
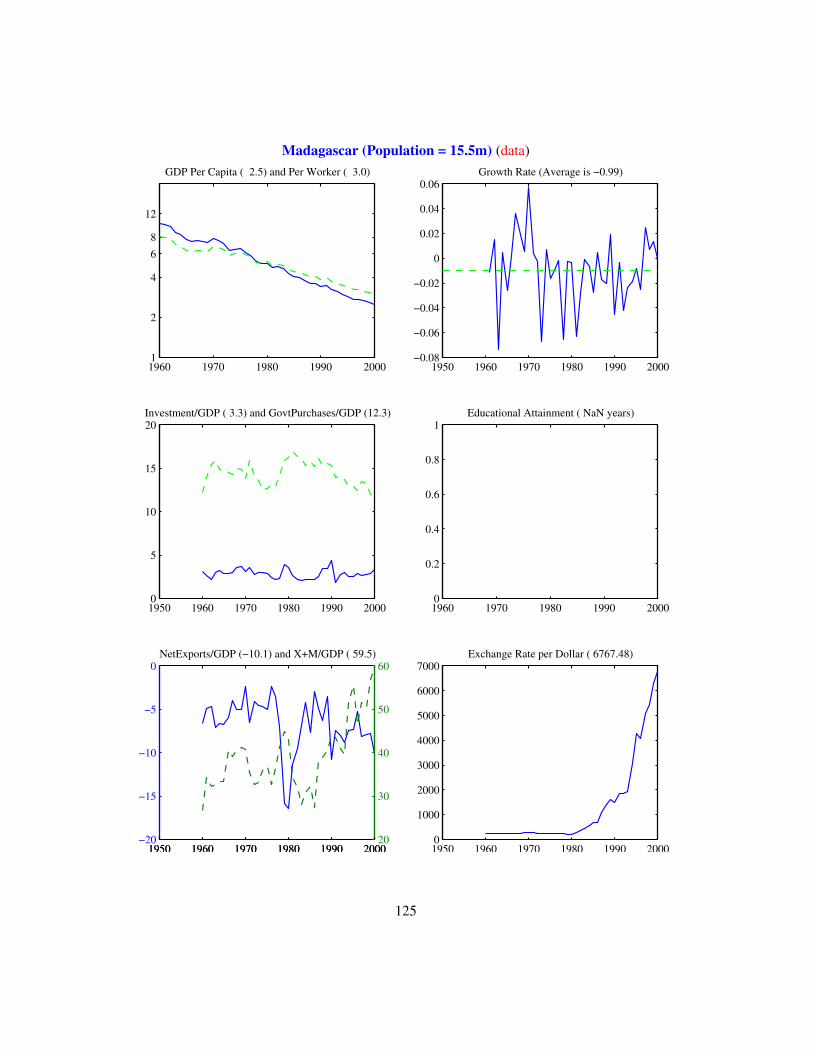
Madagascar (Population = 15.5m) (data)
1960 1970 1980 1990 2000 1
2
4
6 8
12
GDP Per Capita ( 2.5) and Per Worker ( 3.0)
1950 1960 1970 1980 1990 2000−0.08
−0.06
−0.04
−0.02
0
0.02
0.04
0.06Growth Rate (Average is −0.99)
1950 1960 1970 1980 1990 20000
5
10
15
20Investment/GDP ( 3.3) and GovtPurchases/GDP (12.3)
1960 1970 1980 1990 20000
0.2
0.4
0.6
0.8
1Educational Attainment ( NaN years)
1950 1960 1970 1980 1990 2000−20
−15
−10
−5
0NetExports/GDP (−10.1) and X+M/GDP ( 59.5)
1950 1960 1970 1980 1990 200020
30
40
50
60
1950 1960 1970 1980 1990 20000
1000
2000
3000
4000
5000
6000
7000Exchange Rate per Dollar ( 6767.48)
125

Maldives (Population = 0.0m) (data)
0 0.2 0.4 0.6 0.8 11
GDP Per Capita ( 0.0) and Per Worker ( 0.0)
1950 1960 1970 1980 1990 20000
0.2
0.4
0.6
0.8
1Growth Rate (Average is NaN)
1950 1960 1970 1980 1990 2000−1
−0.5
0
0.5
1Investment/GDP ( 0.0) and GovtPurchases/GDP ( 0.0)
1960 1970 1980 1990 20000
0.2
0.4
0.6
0.8
1Educational Attainment ( NaN years)
1950 1960 1970 1980 1990 200099
99.5
100
100.5
101NetExports/GDP (100.0) and X+M/GDP ( 0.0)
1950 1960 1970 1980 1990 2000−1
−0.5
0
0.5
1
1950 1960 1970 1980 1990 2000−1
−0.5
0
0.5
1Exchange Rate per Dollar ( 0.00)
126
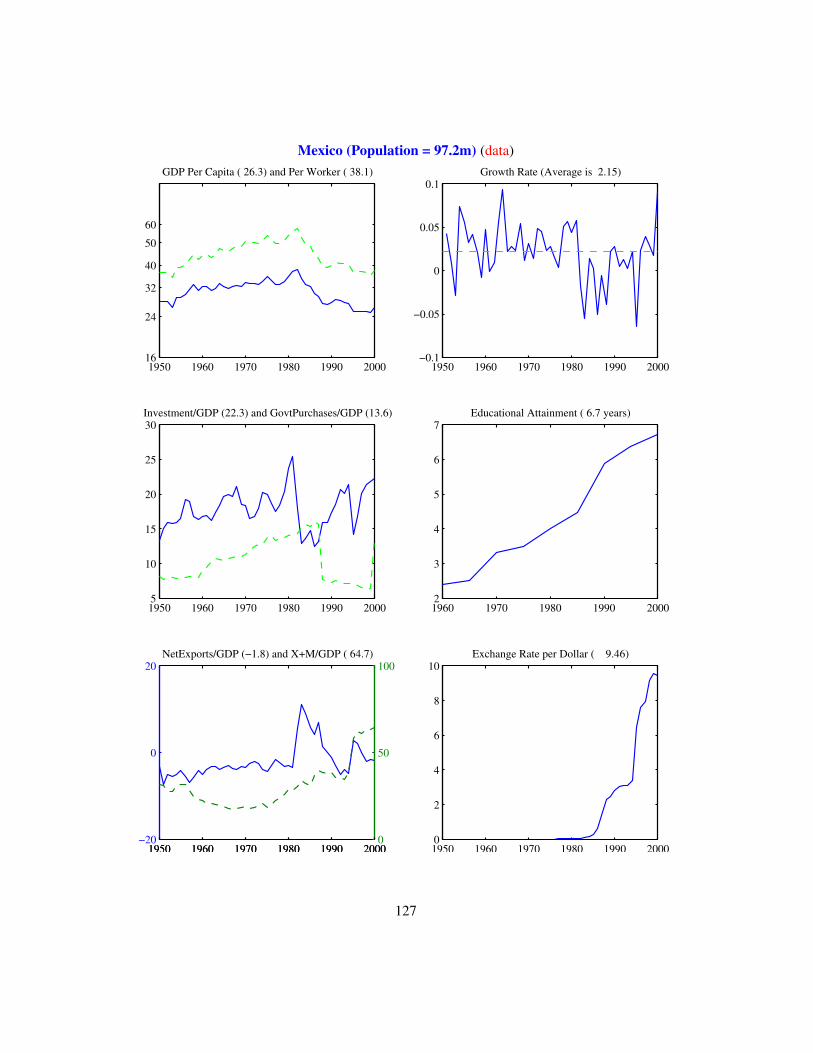
Mexico (Population = 97.2m) (data)
1950 1960 1970 1980 1990 200016
24
32
40
50
60
GDP Per Capita ( 26.3) and Per Worker ( 38.1)
1950 1960 1970 1980 1990 2000−0.1
−0.05
0
0.05
0.1Growth Rate (Average is 2.15)
1950 1960 1970 1980 1990 20005
10
15
20
25
30Investment/GDP (22.3) and GovtPurchases/GDP (13.6)
1960 1970 1980 1990 20002
3
4
5
6
7Educational Attainment ( 6.7 years)
1950 1960 1970 1980 1990 2000−20
0
20NetExports/GDP (−1.8) and X+M/GDP ( 64.7)
1950 1960 1970 1980 1990 20000
50
100
1950 1960 1970 1980 1990 20000
2
4
6
8
10Exchange Rate per Dollar ( 9.46)
127

Marshall Islands (Population = 0.0m) (data)
0 0.2 0.4 0.6 0.8 11
GDP Per Capita ( 0.0) and Per Worker ( 0.0)
1950 1960 1970 1980 1990 20000
0.2
0.4
0.6
0.8
1Growth Rate (Average is NaN)
1950 1960 1970 1980 1990 2000−1
−0.5
0
0.5
1Investment/GDP ( 0.0) and GovtPurchases/GDP ( 0.0)
1960 1970 1980 1990 20000
0.2
0.4
0.6
0.8
1Educational Attainment ( NaN years)
1950 1960 1970 1980 1990 200099
99.5
100
100.5
101NetExports/GDP (100.0) and X+M/GDP ( 0.0)
1950 1960 1970 1980 1990 2000−1
−0.5
0
0.5
1
1950 1960 1970 1980 1990 2000−1
−0.5
0
0.5
1Exchange Rate per Dollar ( 0.00)
128
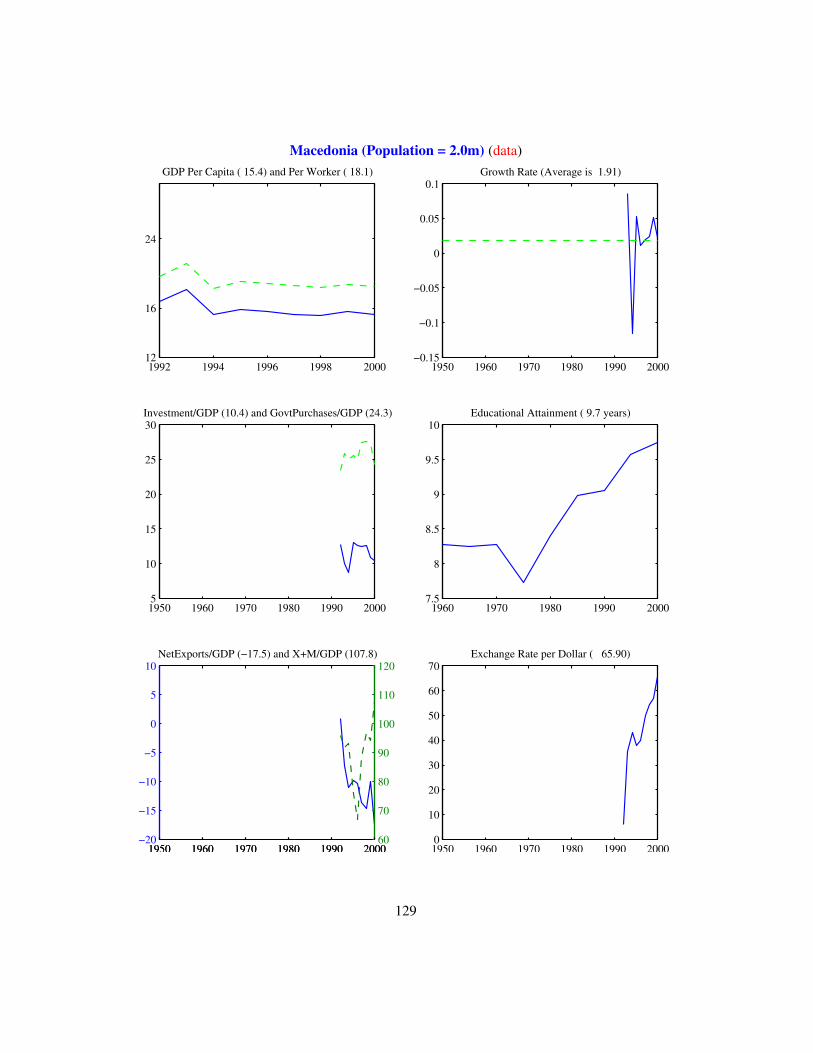
Macedonia (Population = 2.0m) (data)
1992 1994 1996 1998 200012
16
24
GDP Per Capita ( 15.4) and Per Worker ( 18.1)
1950 1960 1970 1980 1990 2000−0.15
−0.1
−0.05
0
0.05
0.1Growth Rate (Average is 1.91)
1950 1960 1970 1980 1990 20005
10
15
20
25
30Investment/GDP (10.4) and GovtPurchases/GDP (24.3)
1960 1970 1980 1990 20007.5
8
8.5
9
9.5
10Educational Attainment ( 9.7 years)
1950 1960 1970 1980 1990 2000−20
−15
−10
−5
0
5
10NetExports/GDP (−17.5) and X+M/GDP (107.8)
1950 1960 1970 1980 1990 200060
70
80
90
100
110
120
1950 1960 1970 1980 1990 20000
10
20
30
40
50
60
70Exchange Rate per Dollar ( 65.90)
129
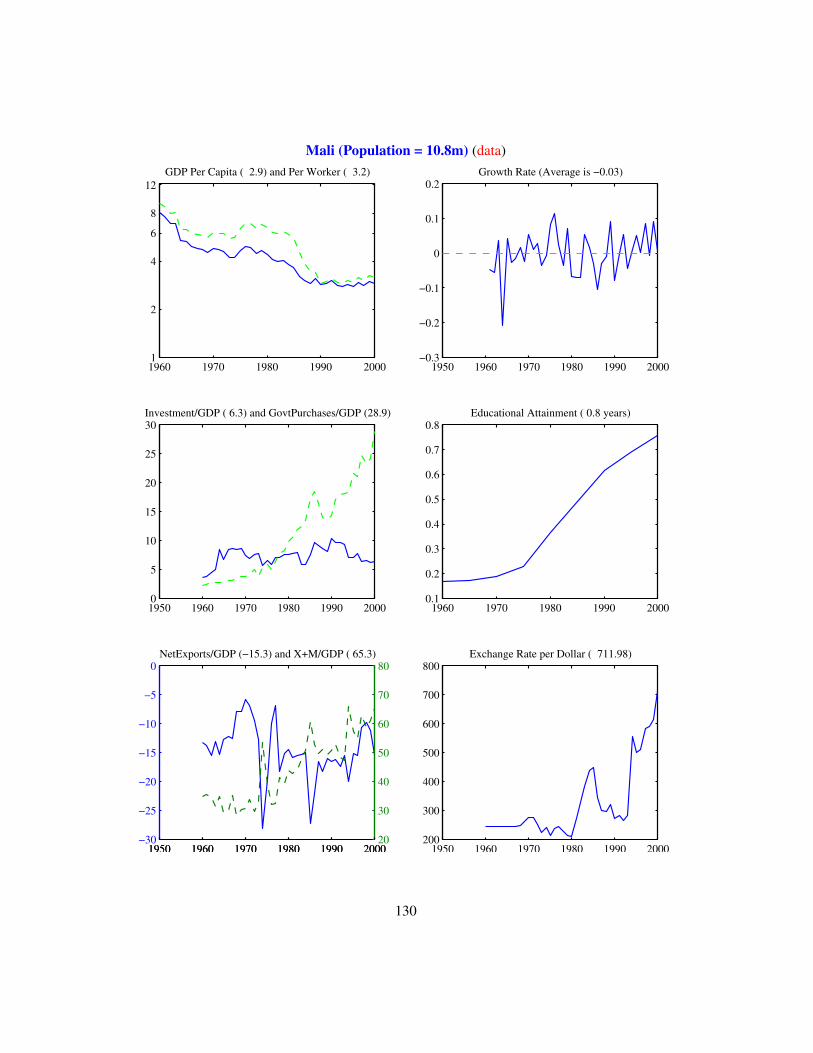
Mali (Population = 10.8m) (data)
1960 1970 1980 1990 2000 1
2
4
6
8
12GDP Per Capita ( 2.9) and Per Worker ( 3.2)
1950 1960 1970 1980 1990 2000−0.3
−0.2
−0.1
0
0.1
0.2Growth Rate (Average is −0.03)
1950 1960 1970 1980 1990 20000
5
10
15
20
25
30Investment/GDP ( 6.3) and GovtPurchases/GDP (28.9)
1960 1970 1980 1990 20000.1
0.2
0.3
0.4
0.5
0.6
0.7
0.8Educational Attainment ( 0.8 years)
1950 1960 1970 1980 1990 2000−30
−25
−20
−15
−10
−5
0NetExports/GDP (−15.3) and X+M/GDP ( 65.3)
1950 1960 1970 1980 1990 200020
30
40
50
60
70
80
1950 1960 1970 1980 1990 2000200
300
400
500
600
700
800Exchange Rate per Dollar ( 711.98)
130
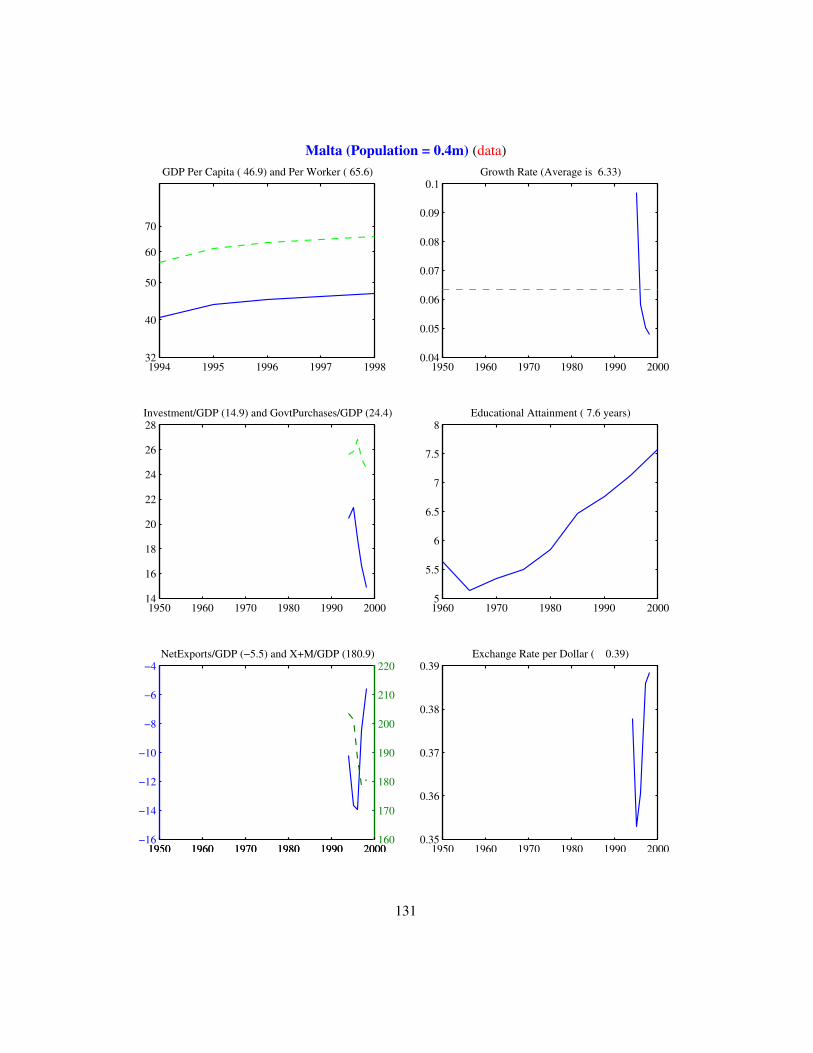
Malta (Population = 0.4m) (data)
1994 1995 1996 1997 199832
40
50
60
70
GDP Per Capita ( 46.9) and Per Worker ( 65.6)
1950 1960 1970 1980 1990 20000.04
0.05
0.06
0.07
0.08
0.09
0.1Growth Rate (Average is 6.33)
1950 1960 1970 1980 1990 200014
16
18
20
22
24
26
28Investment/GDP (14.9) and GovtPurchases/GDP (24.4)
1960 1970 1980 1990 20005
5.5
6
6.5
7
7.5
8Educational Attainment ( 7.6 years)
1950 1960 1970 1980 1990 2000−16
−14
−12
−10
−8
−6
−4NetExports/GDP (−5.5) and X+M/GDP (180.9)
1950 1960 1970 1980 1990 2000160
170
180
190
200
210
220
1950 1960 1970 1980 1990 20000.35
0.36
0.37
0.38
0.39Exchange Rate per Dollar ( 0.39)
131

Myanmar (Population = 0.0m) (data)
0 0.2 0.4 0.6 0.8 11
GDP Per Capita ( 0.0) and Per Worker ( 0.0)
1950 1960 1970 1980 1990 20000
0.2
0.4
0.6
0.8
1Growth Rate (Average is NaN)
1950 1960 1970 1980 1990 2000−1
−0.5
0
0.5
1Investment/GDP ( 0.0) and GovtPurchases/GDP ( 0.0)
1960 1970 1980 1990 20000
0.2
0.4
0.6
0.8
1Educational Attainment ( NaN years)
1950 1960 1970 1980 1990 200099
99.5
100
100.5
101NetExports/GDP (100.0) and X+M/GDP ( 0.0)
1950 1960 1970 1980 1990 2000−1
−0.5
0
0.5
1
1950 1960 1970 1980 1990 2000−1
−0.5
0
0.5
1Exchange Rate per Dollar ( 0.00)
132
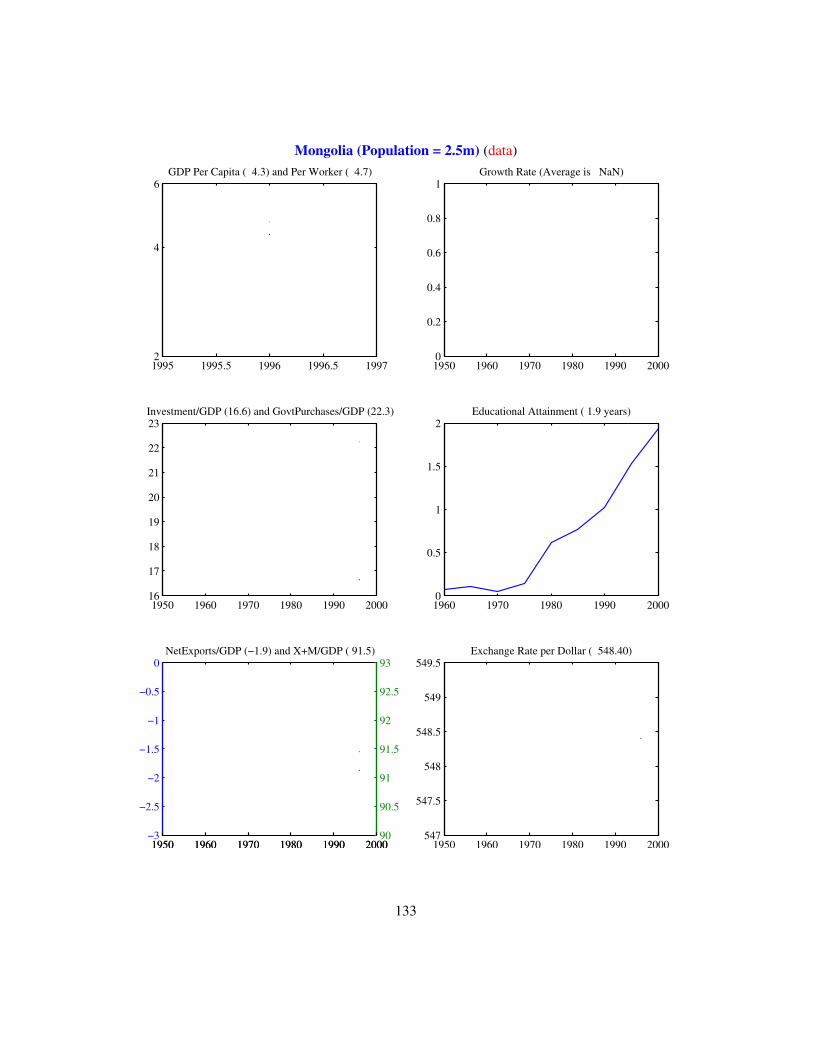
Mongolia (Population = 2.5m) (data)
1995 1995.5 1996 1996.5 19972
4
6GDP Per Capita ( 4.3) and Per Worker ( 4.7)
1950 1960 1970 1980 1990 20000
0.2
0.4
0.6
0.8
1Growth Rate (Average is NaN)
1950 1960 1970 1980 1990 200016
17
18
19
20
21
22
23Investment/GDP (16.6) and GovtPurchases/GDP (22.3)
1960 1970 1980 1990 20000
0.5
1
1.5
2Educational Attainment ( 1.9 years)
1950 1960 1970 1980 1990 2000−3
−2.5
−2
−1.5
−1
−0.5
0NetExports/GDP (−1.9) and X+M/GDP ( 91.5)
1950 1960 1970 1980 1990 200090
90.5
91
91.5
92
92.5
93
1950 1960 1970 1980 1990 2000547
547.5
548
548.5
549
549.5Exchange Rate per Dollar ( 548.40)
133
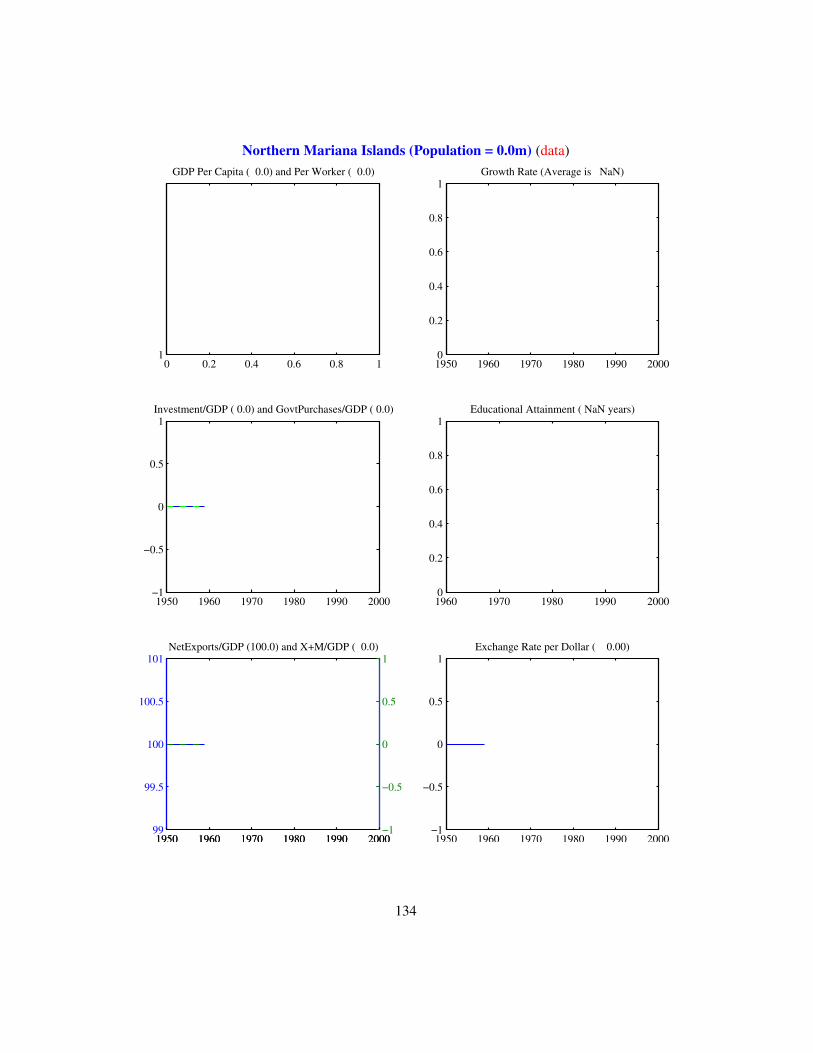
Northern Mariana Islands (Population = 0.0m) (data)
0 0.2 0.4 0.6 0.8 11
GDP Per Capita ( 0.0) and Per Worker ( 0.0)
1950 1960 1970 1980 1990 20000
0.2
0.4
0.6
0.8
1Growth Rate (Average is NaN)
1950 1960 1970 1980 1990 2000−1
−0.5
0
0.5
1Investment/GDP ( 0.0) and GovtPurchases/GDP ( 0.0)
1960 1970 1980 1990 20000
0.2
0.4
0.6
0.8
1Educational Attainment ( NaN years)
1950 1960 1970 1980 1990 200099
99.5
100
100.5
101NetExports/GDP (100.0) and X+M/GDP ( 0.0)
1950 1960 1970 1980 1990 2000−1
−0.5
0
0.5
1
1950 1960 1970 1980 1990 2000−1
−0.5
0
0.5
1Exchange Rate per Dollar ( 0.00)
134
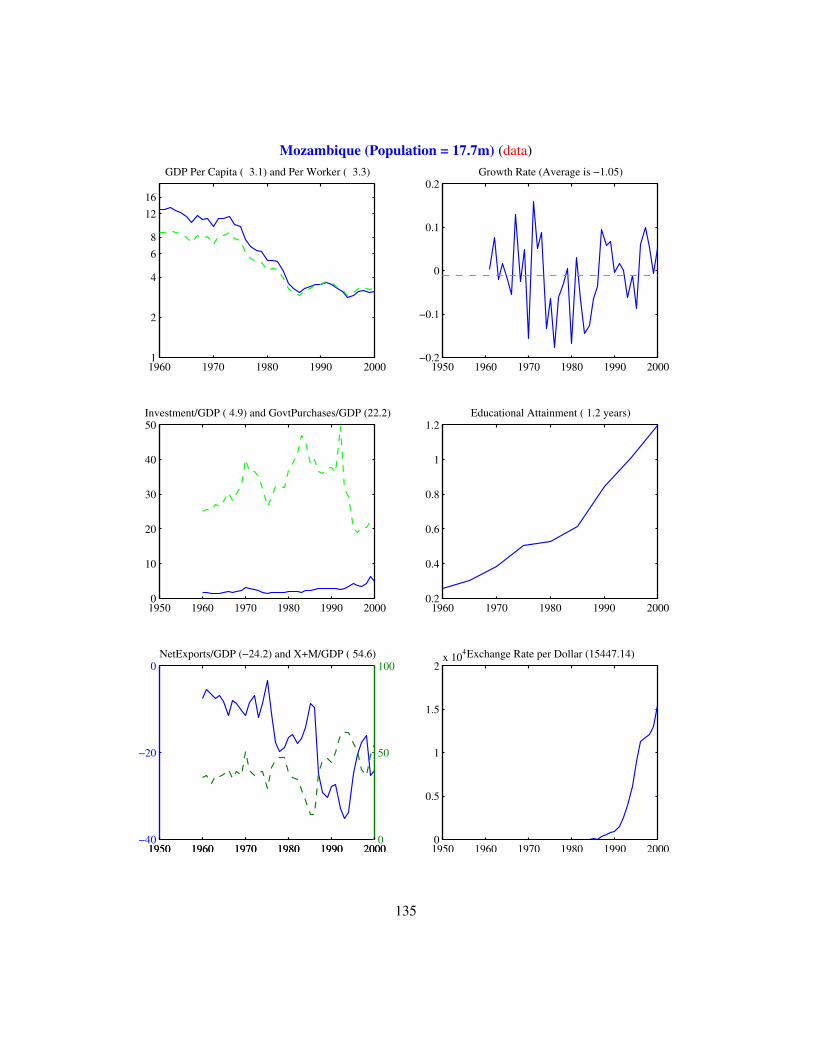
Mozambique (Population = 17.7m) (data)
1960 1970 1980 1990 2000 1
2
4
6 8
1216
GDP Per Capita ( 3.1) and Per Worker ( 3.3)
1950 1960 1970 1980 1990 2000−0.2
−0.1
0
0.1
0.2Growth Rate (Average is −1.05)
1950 1960 1970 1980 1990 20000
10
20
30
40
50Investment/GDP ( 4.9) and GovtPurchases/GDP (22.2)
1960 1970 1980 1990 20000.2
0.4
0.6
0.8
1
1.2Educational Attainment ( 1.2 years)
1950 1960 1970 1980 1990 2000−40
−20
0NetExports/GDP (−24.2) and X+M/GDP ( 54.6)
1950 1960 1970 1980 1990 20000
50
100
1950 1960 1970 1980 1990 20000
0.5
1
1.5
2x 10⁴Exchange Rate per Dollar (15447.14)
135
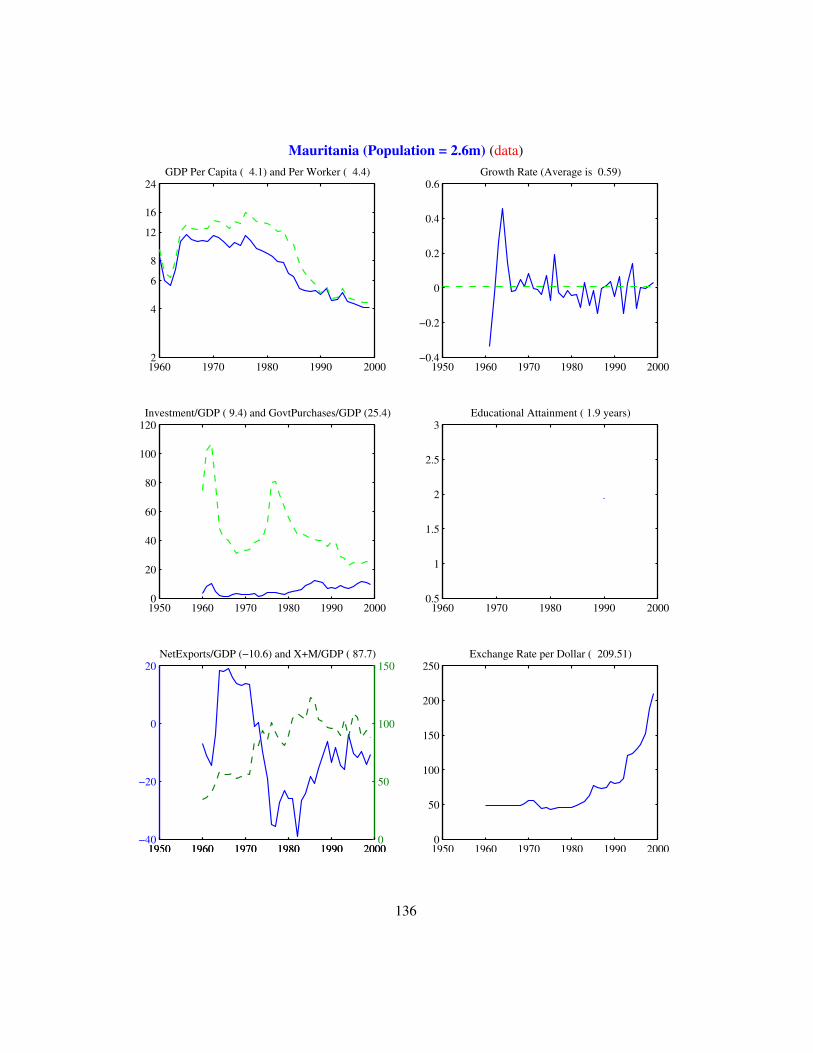
Mauritania (Population = 2.6m) (data)
1960 1970 1980 1990 2000 2
4
6
8
12
16
24GDP Per Capita ( 4.1) and Per Worker ( 4.4)
1950 1960 1970 1980 1990 2000−0.4
−0.2
0
0.2
0.4
0.6Growth Rate (Average is 0.59)
1950 1960 1970 1980 1990 20000
20
40
60
80
100
120Investment/GDP ( 9.4) and GovtPurchases/GDP (25.4)
1960 1970 1980 1990 20000.5
1
1.5
2
2.5
3Educational Attainment ( 1.9 years)
1950 1960 1970 1980 1990 2000−40
−20
0
20NetExports/GDP (−10.6) and X+M/GDP ( 87.7)
1950 1960 1970 1980 1990 20000
50
100
150
1950 1960 1970 1980 1990 20000
50
100
150
200
250Exchange Rate per Dollar ( 209.51)
136
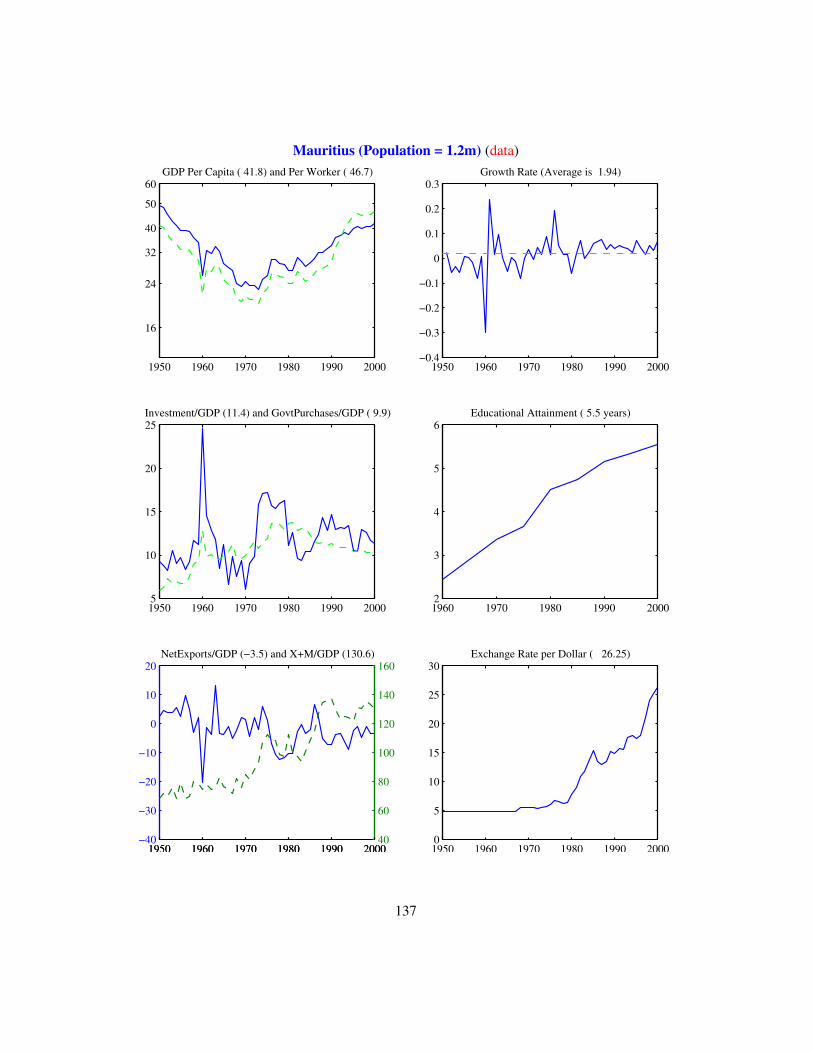
Mauritius (Population = 1.2m) (data)
1950 1960 1970 1980 1990 2000
16
24
32
40
50
60GDP Per Capita ( 41.8) and Per Worker ( 46.7)
1950 1960 1970 1980 1990 2000−0.4
−0.3
−0.2
−0.1
0
0.1
0.2
0.3Growth Rate (Average is 1.94)
1950 1960 1970 1980 1990 20005
10
15
20
25Investment/GDP (11.4) and GovtPurchases/GDP ( 9.9)
1960 1970 1980 1990 20002
3
4
5
6Educational Attainment ( 5.5 years)
1950 1960 1970 1980 1990 2000−40
−30
−20
−10
0
10
20NetExports/GDP (−3.5) and X+M/GDP (130.6)
1950 1960 1970 1980 1990 200040
60
80
100
120
140
160
1950 1960 1970 1980 1990 20000
5
10
15
20
25
30Exchange Rate per Dollar ( 26.25)
137
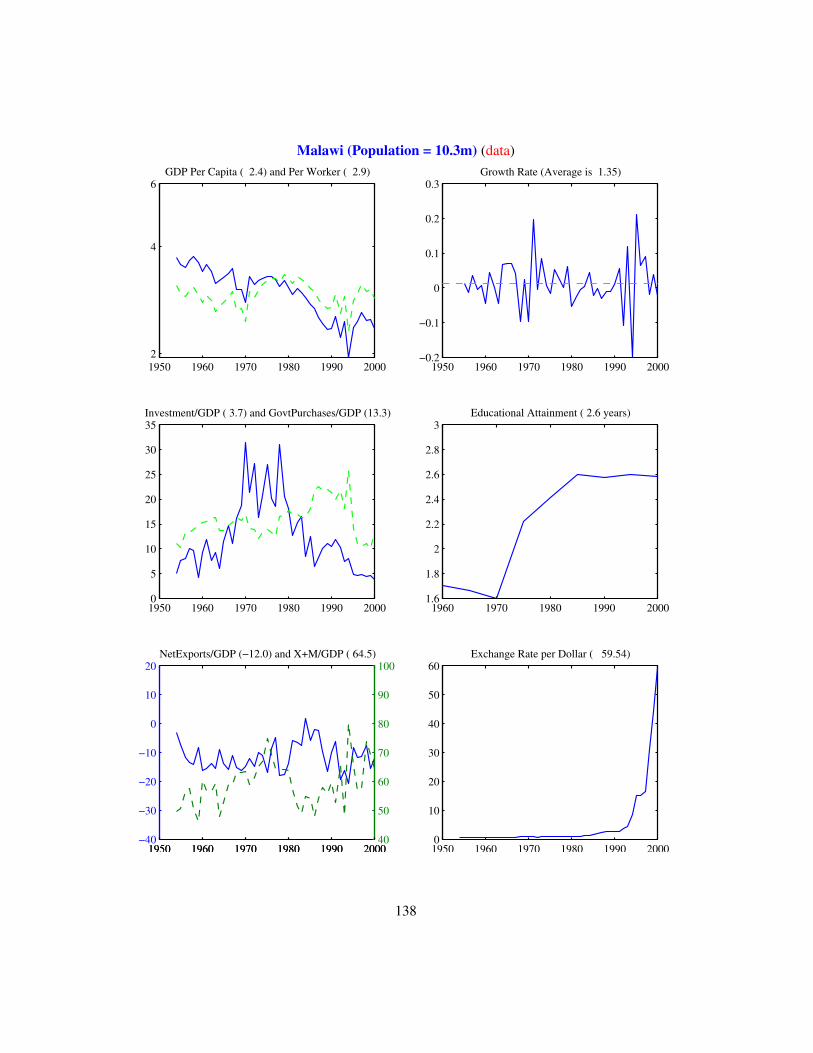
Malawi (Population = 10.3m) (data)
1950 1960 1970 1980 1990 20002
4
6GDP Per Capita ( 2.4) and Per Worker ( 2.9)
1950 1960 1970 1980 1990 2000−0.2
−0.1
0
0.1
0.2
0.3Growth Rate (Average is 1.35)
1950 1960 1970 1980 1990 20000
5
10
15
20
25
30
35Investment/GDP ( 3.7) and GovtPurchases/GDP (13.3)
1960 1970 1980 1990 20001.6
1.8
2
2.2
2.4
2.6
2.8
3Educational Attainment ( 2.6 years)
1950 1960 1970 1980 1990 2000−40
−30
−20
−10
0
10
20NetExports/GDP (−12.0) and X+M/GDP ( 64.5)
1950 1960 1970 1980 1990 200040
50
60
70
80
90
100
1950 1960 1970 1980 1990 20000
10
20
30
40
50
60Exchange Rate per Dollar ( 59.54)
138
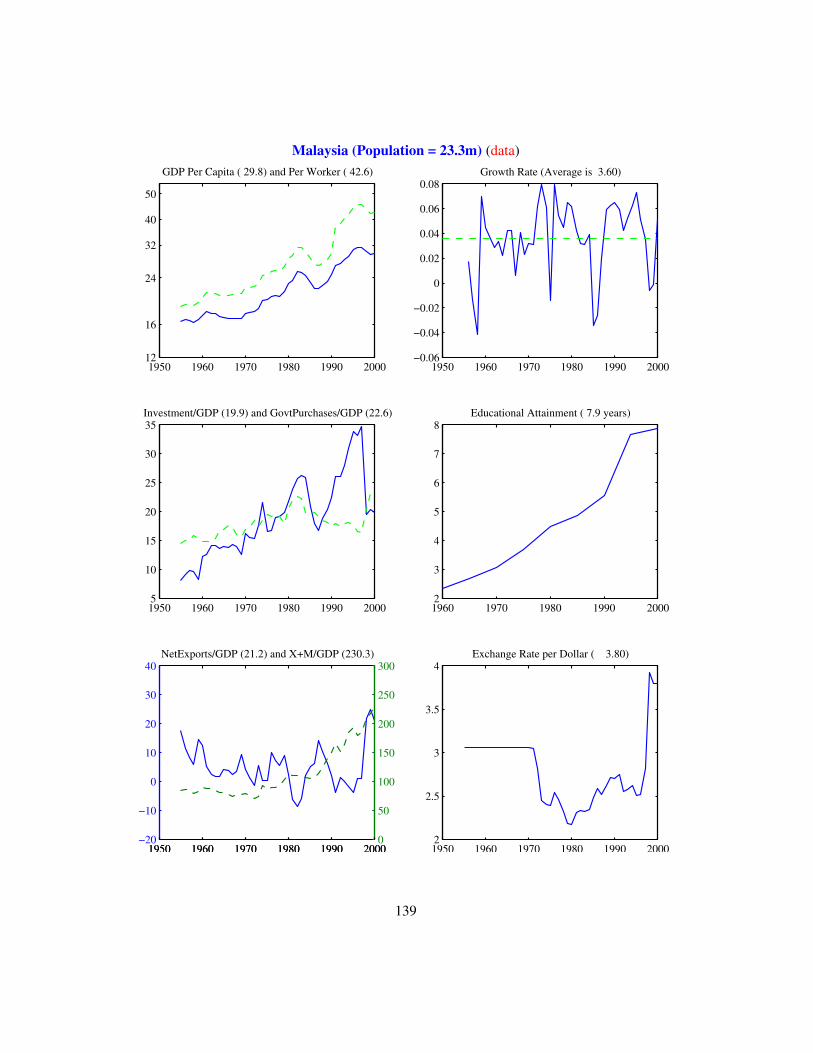
Malaysia (Population = 23.3m) (data)
1950 1960 1970 1980 1990 200012
16
24
32
40
50
GDP Per Capita ( 29.8) and Per Worker ( 42.6)
1950 1960 1970 1980 1990 2000−0.06
−0.04
−0.02
0
0.02
0.04
0.06
0.08Growth Rate (Average is 3.60)
1950 1960 1970 1980 1990 20005
10
15
20
25
30
35Investment/GDP (19.9) and GovtPurchases/GDP (22.6)
1960 1970 1980 1990 20002
3
4
5
6
7
8Educational Attainment ( 7.9 years)
1950 1960 1970 1980 1990 2000−20
−10
0
10
20
30
40NetExports/GDP (21.2) and X+M/GDP (230.3)
1950 1960 1970 1980 1990 20000
50
100
150
200
250
300
1950 1960 1970 1980 1990 20002
2.5
3
3.5
4Exchange Rate per Dollar ( 3.80)
139

Mayotte (Population = 0.0m) (data)
0 0.2 0.4 0.6 0.8 11
GDP Per Capita ( 0.0) and Per Worker ( 0.0)
1950 1960 1970 1980 1990 20000
0.2
0.4
0.6
0.8
1Growth Rate (Average is NaN)
1950 1960 1970 1980 1990 2000−1
−0.5
0
0.5
1Investment/GDP ( 0.0) and GovtPurchases/GDP ( 0.0)
1960 1970 1980 1990 20000
0.2
0.4
0.6
0.8
1Educational Attainment ( NaN years)
1950 1960 1970 1980 1990 200099
99.5
100
100.5
101NetExports/GDP (100.0) and X+M/GDP ( 0.0)
1950 1960 1970 1980 1990 2000−1
−0.5
0
0.5
1
1950 1960 1970 1980 1990 2000−1
−0.5
0
0.5
1Exchange Rate per Dollar ( 0.00)
140
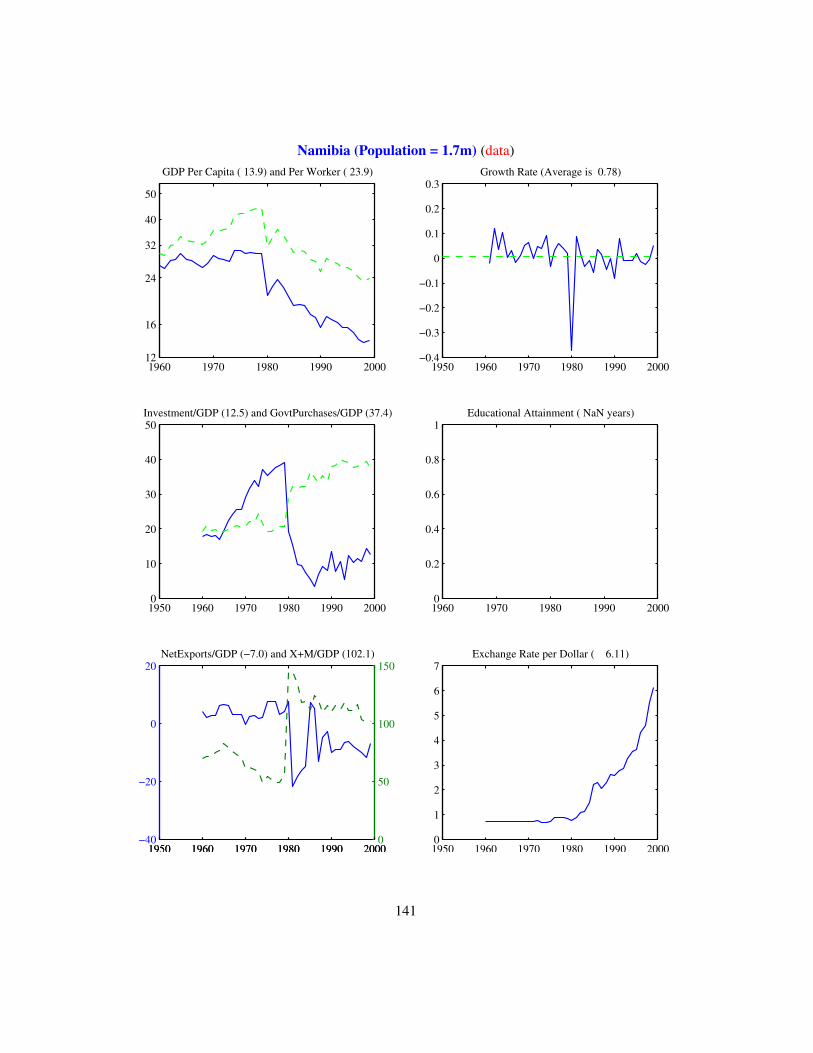
Namibia (Population = 1.7m) (data)
1960 1970 1980 1990 200012
16
24
32
40
50
GDP Per Capita ( 13.9) and Per Worker ( 23.9)
1950 1960 1970 1980 1990 2000−0.4
−0.3
−0.2
−0.1
0
0.1
0.2
0.3Growth Rate (Average is 0.78)
1950 1960 1970 1980 1990 20000
10
20
30
40
50Investment/GDP (12.5) and GovtPurchases/GDP (37.4)
1960 1970 1980 1990 20000
0.2
0.4
0.6
0.8
1Educational Attainment ( NaN years)
1950 1960 1970 1980 1990 2000−40
−20
0
20NetExports/GDP (−7.0) and X+M/GDP (102.1)
1950 1960 1970 1980 1990 20000
50
100
150
1950 1960 1970 1980 1990 20000
1
2
3
4
5
6
7Exchange Rate per Dollar ( 6.11)
141

New Caledonia (Population = 0.0m) (data)
0 0.2 0.4 0.6 0.8 11
GDP Per Capita ( 0.0) and Per Worker ( 0.0)
1950 1960 1970 1980 1990 20000
0.2
0.4
0.6
0.8
1Growth Rate (Average is NaN)
1950 1960 1970 1980 1990 2000−1
−0.5
0
0.5
1Investment/GDP ( 0.0) and GovtPurchases/GDP ( 0.0)
1960 1970 1980 1990 20000
0.2
0.4
0.6
0.8
1Educational Attainment ( NaN years)
1950 1960 1970 1980 1990 200099
99.5
100
100.5
101NetExports/GDP (100.0) and X+M/GDP ( 0.0)
1950 1960 1970 1980 1990 2000−1
−0.5
0
0.5
1
1950 1960 1970 1980 1990 2000−1
−0.5
0
0.5
1Exchange Rate per Dollar ( 0.00)
142
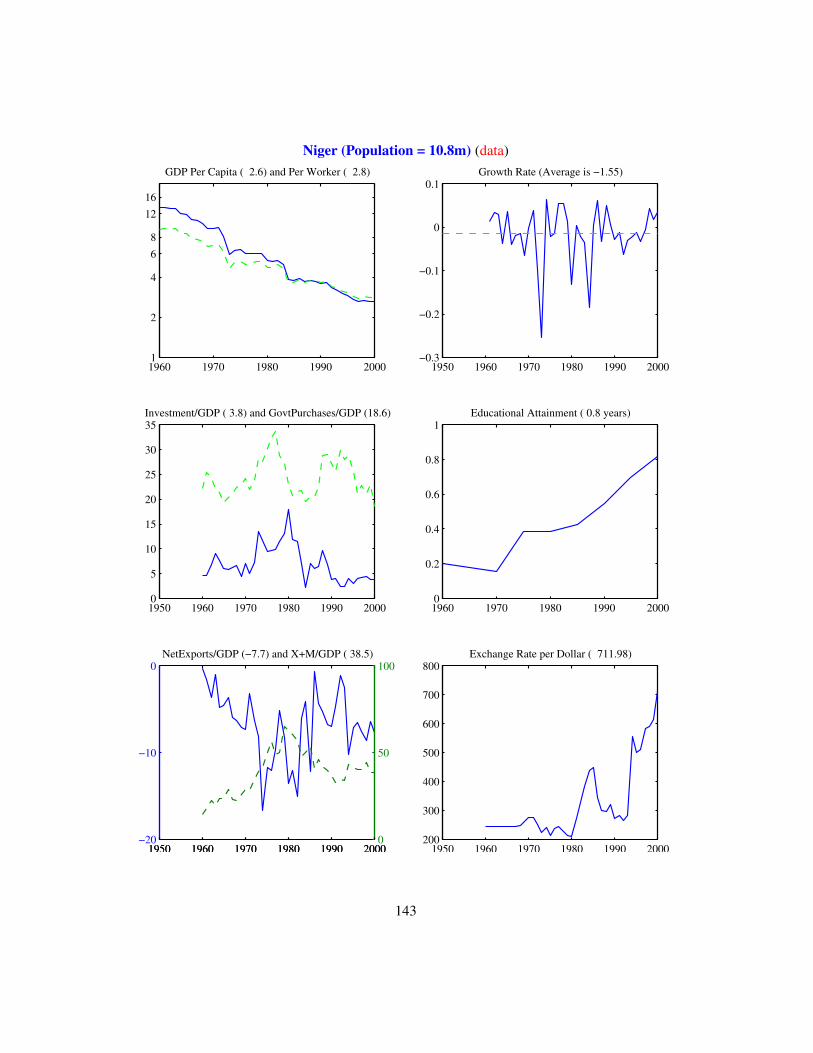
Niger (Population = 10.8m) (data)
1960 1970 1980 1990 2000 1
2
4
6 8
1216
GDP Per Capita ( 2.6) and Per Worker ( 2.8)
1950 1960 1970 1980 1990 2000−0.3
−0.2
−0.1
0
0.1Growth Rate (Average is −1.55)
1950 1960 1970 1980 1990 20000
5
10
15
20
25
30
35Investment/GDP ( 3.8) and GovtPurchases/GDP (18.6)
1960 1970 1980 1990 20000
0.2
0.4
0.6
0.8
1Educational Attainment ( 0.8 years)
1950 1960 1970 1980 1990 2000−20
−10
0NetExports/GDP (−7.7) and X+M/GDP ( 38.5)
1950 1960 1970 1980 1990 20000
50
100
1950 1960 1970 1980 1990 2000200
300
400
500
600
700
800Exchange Rate per Dollar ( 711.98)
143
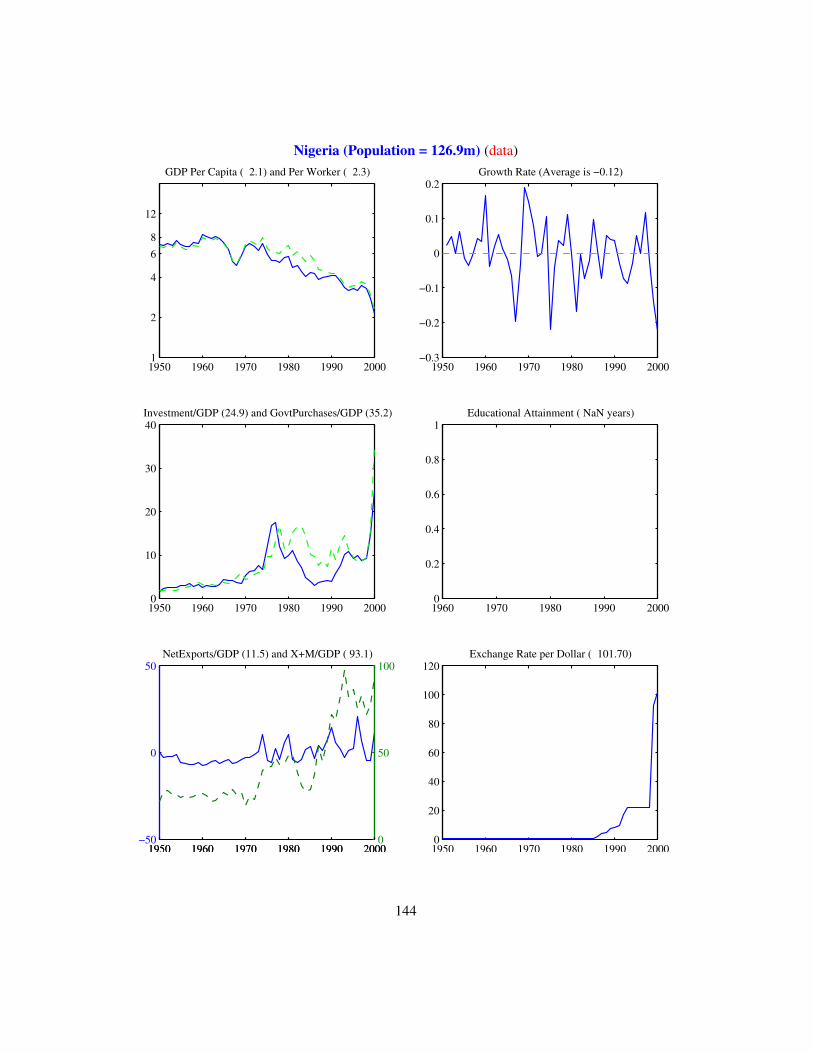
Nigeria (Population = 126.9m) (data)
1950 1960 1970 1980 1990 2000 1
2
4
6 8
12
GDP Per Capita ( 2.1) and Per Worker ( 2.3)
1950 1960 1970 1980 1990 2000−0.3
−0.2
−0.1
0
0.1
0.2Growth Rate (Average is −0.12)
1950 1960 1970 1980 1990 20000
10
20
30
40Investment/GDP (24.9) and GovtPurchases/GDP (35.2)
1960 1970 1980 1990 20000
0.2
0.4
0.6
0.8
1Educational Attainment ( NaN years)
1950 1960 1970 1980 1990 2000−50
0
50NetExports/GDP (11.5) and X+M/GDP ( 93.1)
1950 1960 1970 1980 1990 20000
50
100
1950 1960 1970 1980 1990 20000
20
40
60
80
100
120Exchange Rate per Dollar ( 101.70)
144
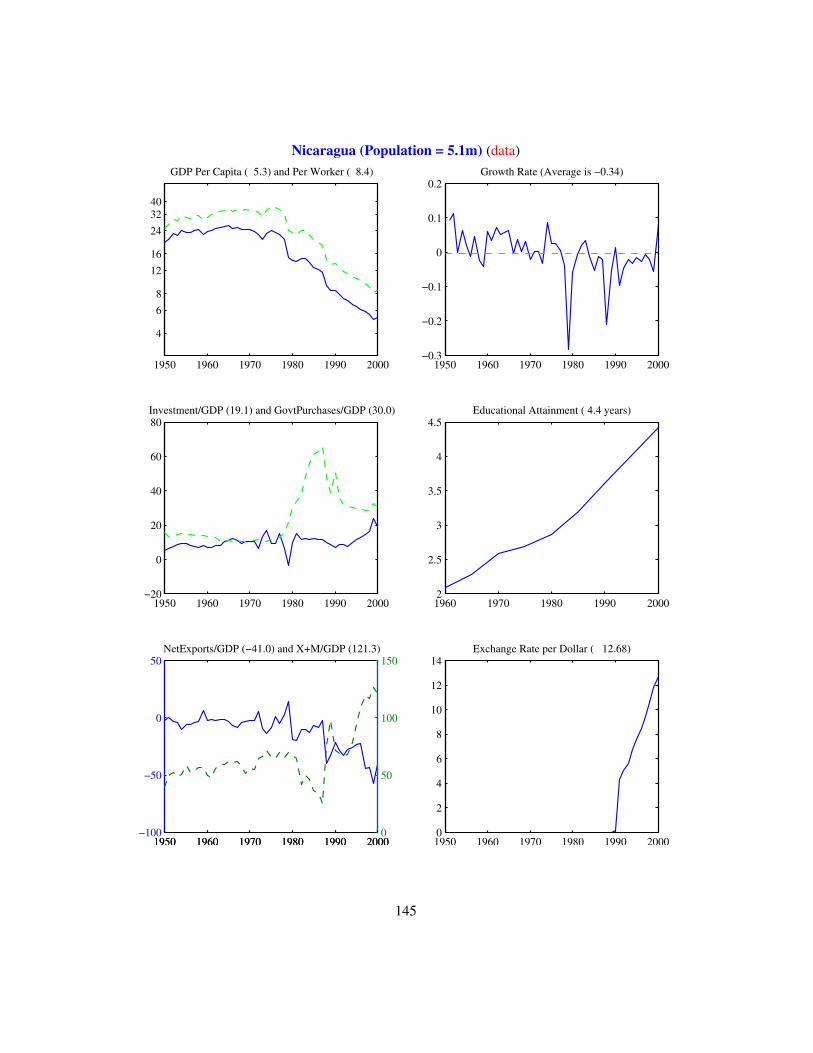
Nicaragua (Population = 5.1m) (data)
1950 1960 1970 1980 1990 2000
4
6 8
1216
243240
GDP Per Capita ( 5.3) and Per Worker ( 8.4)
1950 1960 1970 1980 1990 2000−0.3
−0.2
−0.1
0
0.1
0.2Growth Rate (Average is −0.34)
1950 1960 1970 1980 1990 2000−20
0
20
40
60
80Investment/GDP (19.1) and GovtPurchases/GDP (30.0)
1960 1970 1980 1990 20002
2.5
3
3.5
4
4.5Educational Attainment ( 4.4 years)
1950 1960 1970 1980 1990 2000−100
−50
0
50NetExports/GDP (−41.0) and X+M/GDP (121.3)
1950 1960 1970 1980 1990 20000
50
100
150
1950 1960 1970 1980 1990 20000
2
4
6
8
10
12
14Exchange Rate per Dollar ( 12.68)
145
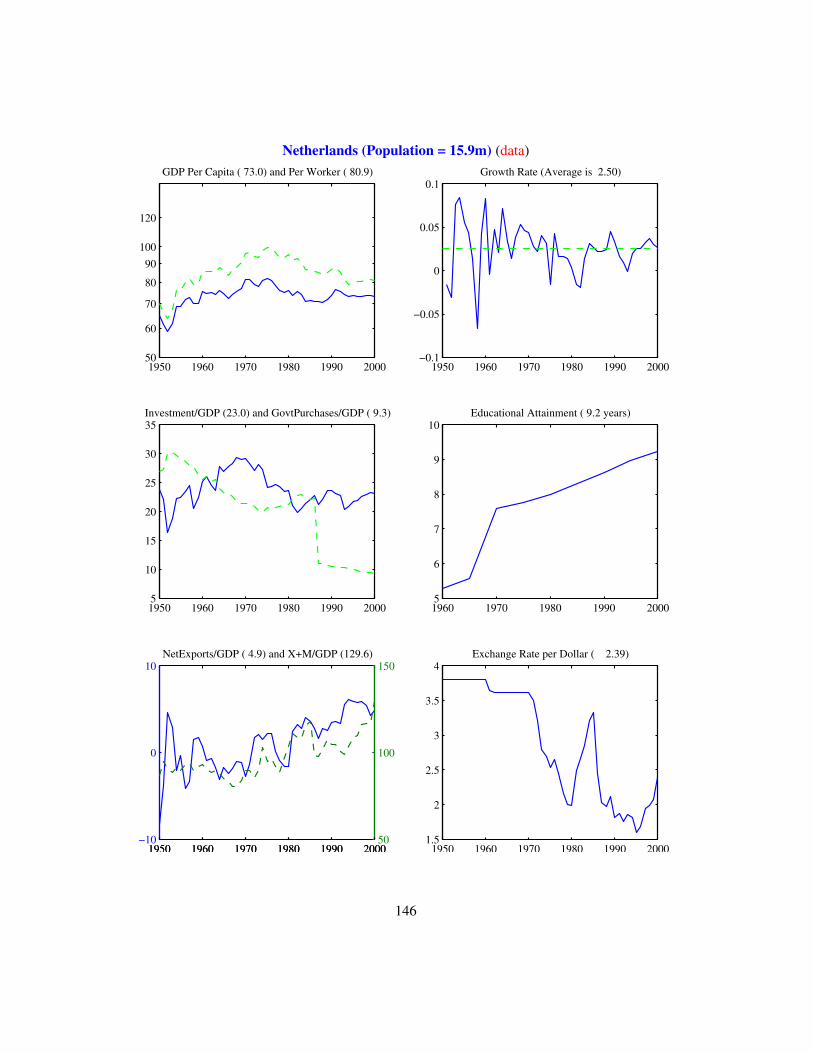
Netherlands (Population = 15.9m) (data)
1950 1960 1970 1980 1990 2000 50
60
70
80
90100
120
GDP Per Capita ( 73.0) and Per Worker ( 80.9)
1950 1960 1970 1980 1990 2000−0.1
−0.05
0
0.05
0.1Growth Rate (Average is 2.50)
1950 1960 1970 1980 1990 20005
10
15
20
25
30
35Investment/GDP (23.0) and GovtPurchases/GDP ( 9.3)
1960 1970 1980 1990 20005
6
7
8
9
10Educational Attainment ( 9.2 years)
1950 1960 1970 1980 1990 2000−10
0
10NetExports/GDP ( 4.9) and X+M/GDP (129.6)
1950 1960 1970 1980 1990 200050
100
150
1950 1960 1970 1980 1990 20001.5
2
2.5
3
3.5
4Exchange Rate per Dollar ( 2.39)
146
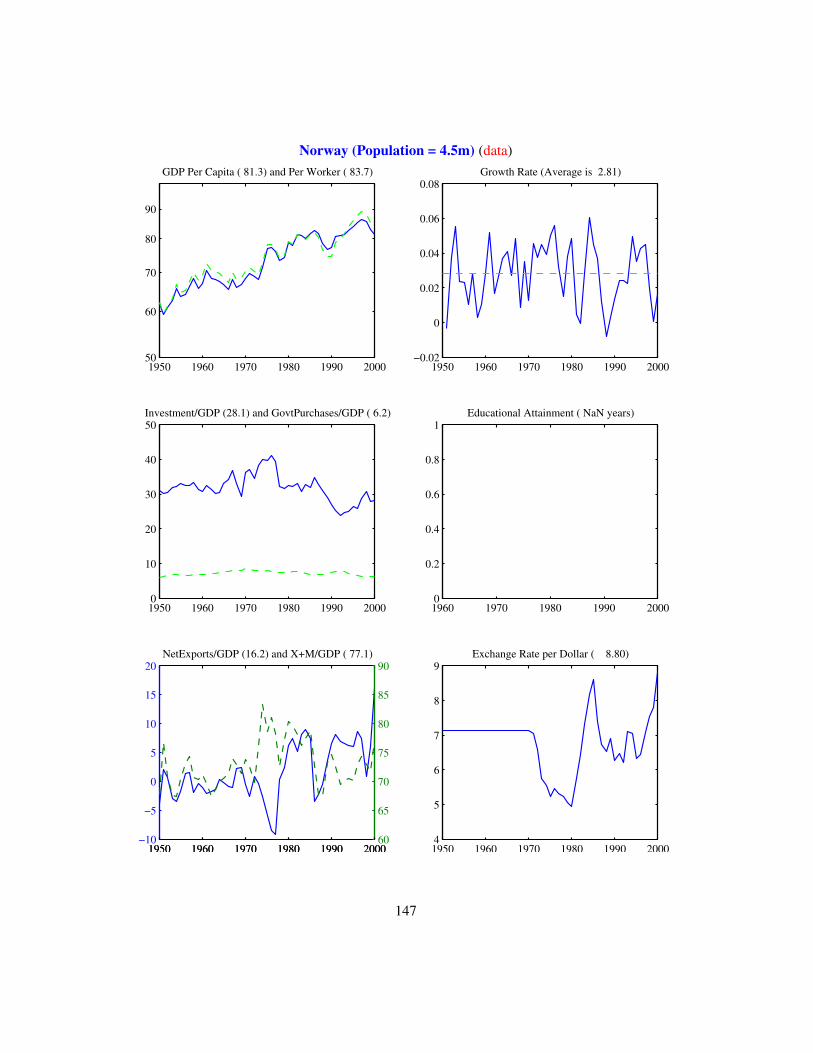
Norway (Population = 4.5m) (data)
1950 1960 1970 1980 1990 200050
60
70
80
90
GDP Per Capita ( 81.3) and Per Worker ( 83.7)
1950 1960 1970 1980 1990 2000−0.02
0
0.02
0.04
0.06
0.08Growth Rate (Average is 2.81)
1950 1960 1970 1980 1990 20000
10
20
30
40
50Investment/GDP (28.1) and GovtPurchases/GDP ( 6.2)
1960 1970 1980 1990 20000
0.2
0.4
0.6
0.8
1Educational Attainment ( NaN years)
1950 1960 1970 1980 1990 2000−10
−5
0
5
10
15
20NetExports/GDP (16.2) and X+M/GDP ( 77.1)
1950 1960 1970 1980 1990 200060
65
70
75
80
85
90
1950 1960 1970 1980 1990 20004
5
6
7
8
9Exchange Rate per Dollar ( 8.80)
147
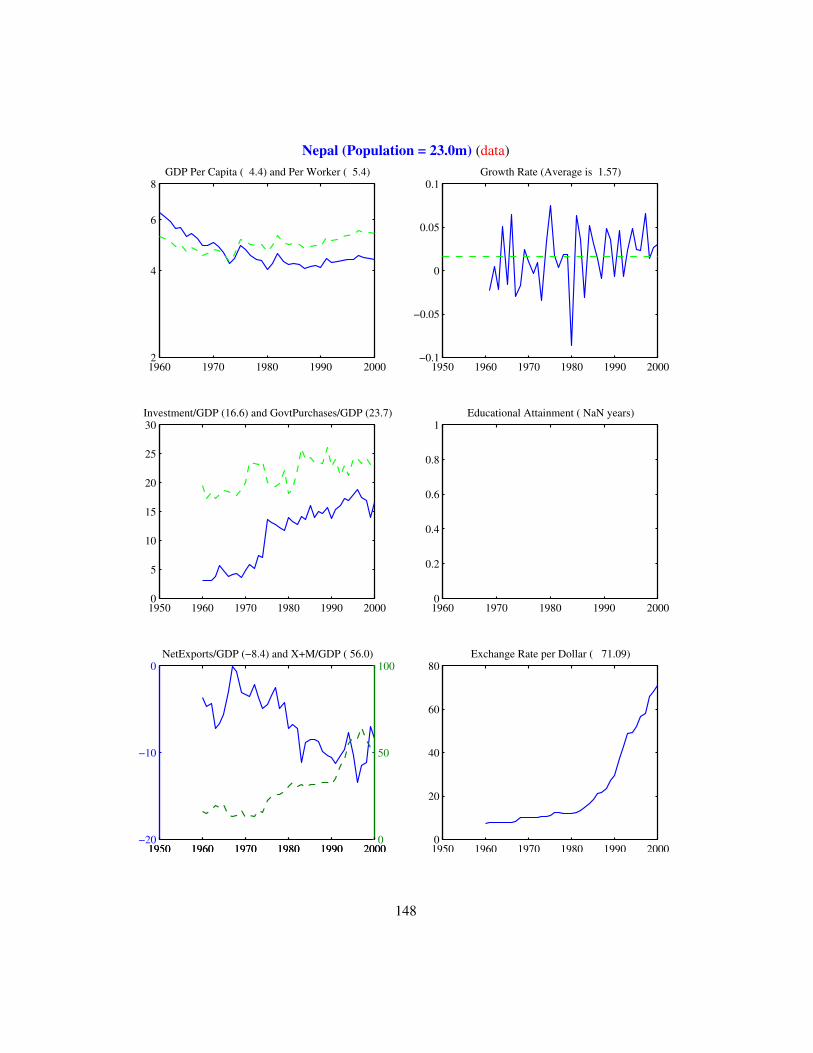
Nepal (Population = 23.0m) (data)
1960 1970 1980 1990 20002
4
6
8GDP Per Capita ( 4.4) and Per Worker ( 5.4)
1950 1960 1970 1980 1990 2000−0.1
−0.05
0
0.05
0.1Growth Rate (Average is 1.57)
1950 1960 1970 1980 1990 20000
5
10
15
20
25
30Investment/GDP (16.6) and GovtPurchases/GDP (23.7)
1960 1970 1980 1990 20000
0.2
0.4
0.6
0.8
1Educational Attainment ( NaN years)
1950 1960 1970 1980 1990 2000−20
−10
0NetExports/GDP (−8.4) and X+M/GDP ( 56.0)
1950 1960 1970 1980 1990 20000
50
100
1950 1960 1970 1980 1990 20000
20
40
60
80Exchange Rate per Dollar ( 71.09)
148
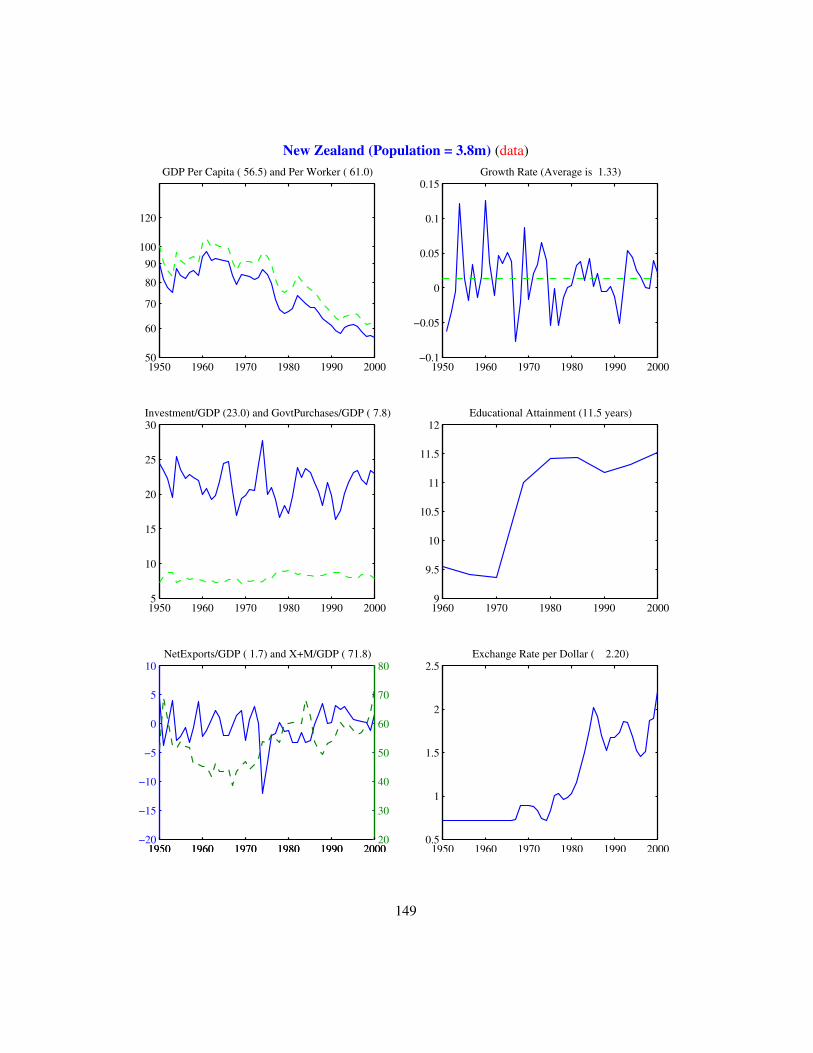
New Zealand (Population = 3.8m) (data)
1950 1960 1970 1980 1990 2000 50
60
70
80
90100
120
GDP Per Capita ( 56.5) and Per Worker ( 61.0)
1950 1960 1970 1980 1990 2000−0.1
−0.05
0
0.05
0.1
0.15Growth Rate (Average is 1.33)
1950 1960 1970 1980 1990 20005
10
15
20
25
30Investment/GDP (23.0) and GovtPurchases/GDP ( 7.8)
1960 1970 1980 1990 20009
9.5
10
10.5
11
11.5
12Educational Attainment (11.5 years)
1950 1960 1970 1980 1990 2000−20
−15
−10
−5
0
5
10NetExports/GDP ( 1.7) and X+M/GDP ( 71.8)
1950 1960 1970 1980 1990 200020
30
40
50
60
70
80
1950 1960 1970 1980 1990 20000.5
1
1.5
2
2.5Exchange Rate per Dollar ( 2.20)
149
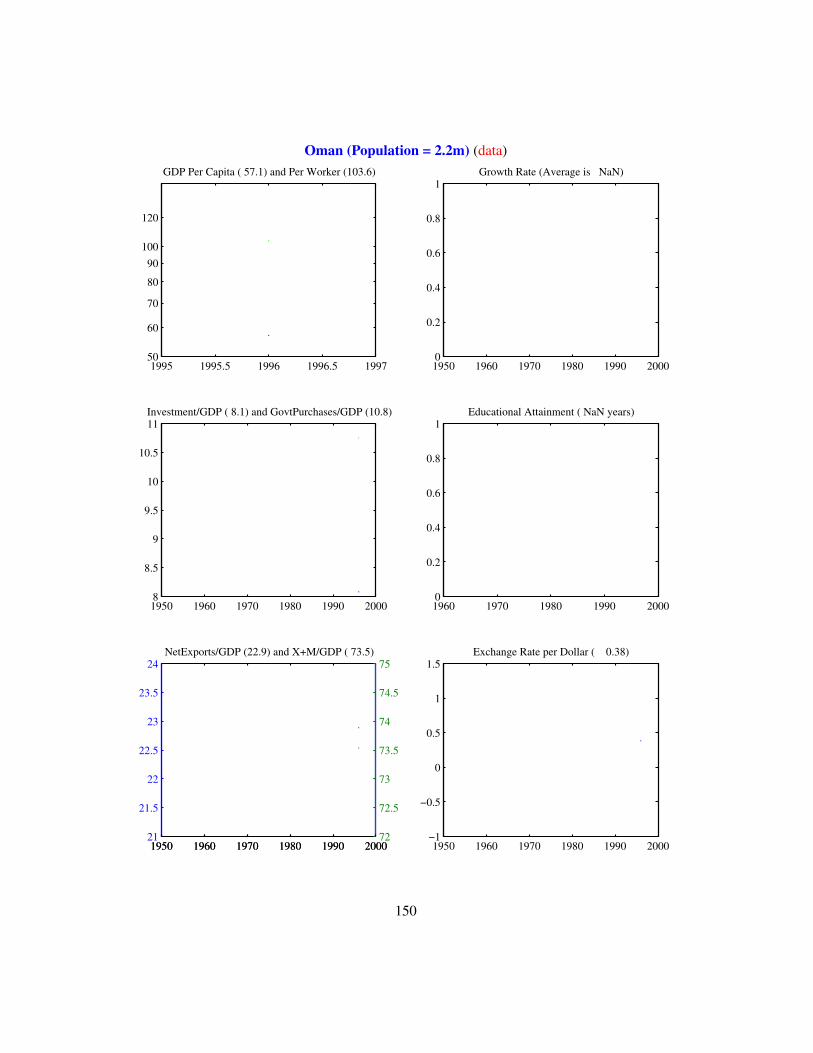
Oman (Population = 2.2m) (data)
1995 1995.5 1996 1996.5 1997 50
60
70
80
90100
120
GDP Per Capita ( 57.1) and Per Worker (103.6)
1950 1960 1970 1980 1990 20000
0.2
0.4
0.6
0.8
1Growth Rate (Average is NaN)
1950 1960 1970 1980 1990 20008
8.5
9
9.5
10
10.5
11Investment/GDP ( 8.1) and GovtPurchases/GDP (10.8)
1960 1970 1980 1990 20000
0.2
0.4
0.6
0.8
1Educational Attainment ( NaN years)
1950 1960 1970 1980 1990 200021
21.5
22
22.5
23
23.5
24NetExports/GDP (22.9) and X+M/GDP ( 73.5)
1950 1960 1970 1980 1990 200072
72.5
73
73.5
74
74.5
75
1950 1960 1970 1980 1990 2000−1
−0.5
0
0.5
1
1.5Exchange Rate per Dollar ( 0.38)
150
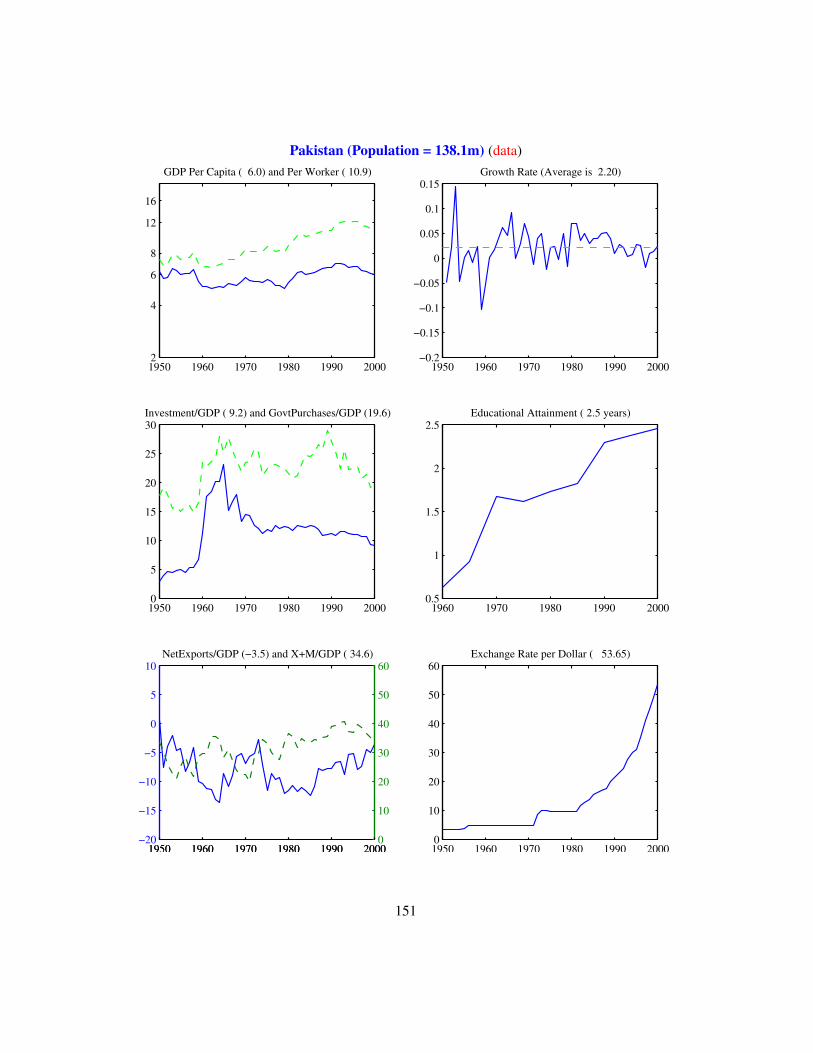
Pakistan (Population = 138.1m) (data)
1950 1960 1970 1980 1990 2000 2
4
6
8
12
16
GDP Per Capita ( 6.0) and Per Worker ( 10.9)
1950 1960 1970 1980 1990 2000−0.2
−0.15
−0.1
−0.05
0
0.05
0.1
0.15Growth Rate (Average is 2.20)
1950 1960 1970 1980 1990 20000
5
10
15
20
25
30Investment/GDP ( 9.2) and GovtPurchases/GDP (19.6)
1960 1970 1980 1990 20000.5
1
1.5
2
2.5Educational Attainment ( 2.5 years)
1950 1960 1970 1980 1990 2000−20
−15
−10
−5
0
5
10NetExports/GDP (−3.5) and X+M/GDP ( 34.6)
1950 1960 1970 1980 1990 20000
10
20
30
40
50
60
1950 1960 1970 1980 1990 20000
10
20
30
40
50
60Exchange Rate per Dollar ( 53.65)
151
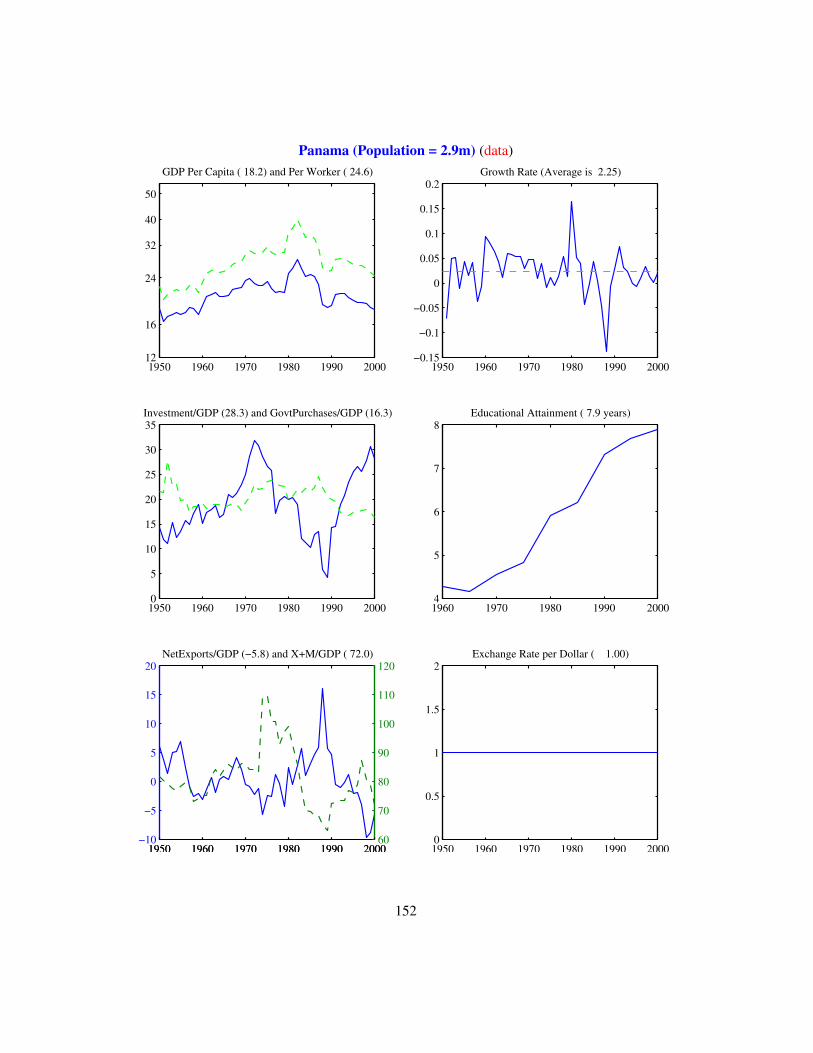
Panama (Population = 2.9m) (data)
1950 1960 1970 1980 1990 200012
16
24
32
40
50
GDP Per Capita ( 18.2) and Per Worker ( 24.6)
1950 1960 1970 1980 1990 2000−0.15
−0.1
−0.05
0
0.05
0.1
0.15
0.2Growth Rate (Average is 2.25)
1950 1960 1970 1980 1990 20000
5
10
15
20
25
30
35Investment/GDP (28.3) and GovtPurchases/GDP (16.3)
1960 1970 1980 1990 20004
5
6
7
8Educational Attainment ( 7.9 years)
1950 1960 1970 1980 1990 2000−10
−5
0
5
10
15
20NetExports/GDP (−5.8) and X+M/GDP ( 72.0)
1950 1960 1970 1980 1990 200060
70
80
90
100
110
120
1950 1960 1970 1980 1990 20000
0.5
1
1.5
2Exchange Rate per Dollar ( 1.00)
152
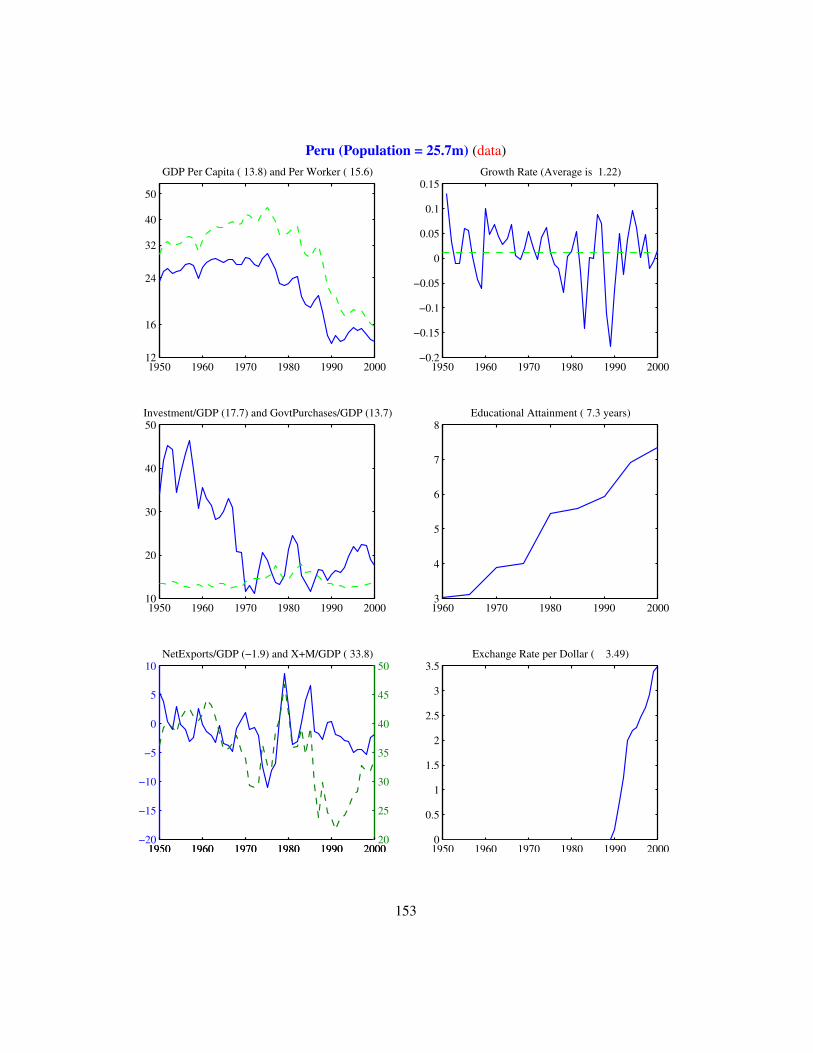
Peru (Population = 25.7m) (data)
1950 1960 1970 1980 1990 200012
16
24
32
40
50
GDP Per Capita ( 13.8) and Per Worker ( 15.6)
1950 1960 1970 1980 1990 2000−0.2
−0.15
−0.1
−0.05
0
0.05
0.1
0.15Growth Rate (Average is 1.22)
1950 1960 1970 1980 1990 200010
20
30
40
50Investment/GDP (17.7) and GovtPurchases/GDP (13.7)
1960 1970 1980 1990 20003
4
5
6
7
8Educational Attainment ( 7.3 years)
1950 1960 1970 1980 1990 2000−20
−15
−10
−5
0
5
10NetExports/GDP (−1.9) and X+M/GDP ( 33.8)
1950 1960 1970 1980 1990 200020
25
30
35
40
45
50
1950 1960 1970 1980 1990 20000
0.5
1
1.5
2
2.5
3
3.5Exchange Rate per Dollar ( 3.49)
153
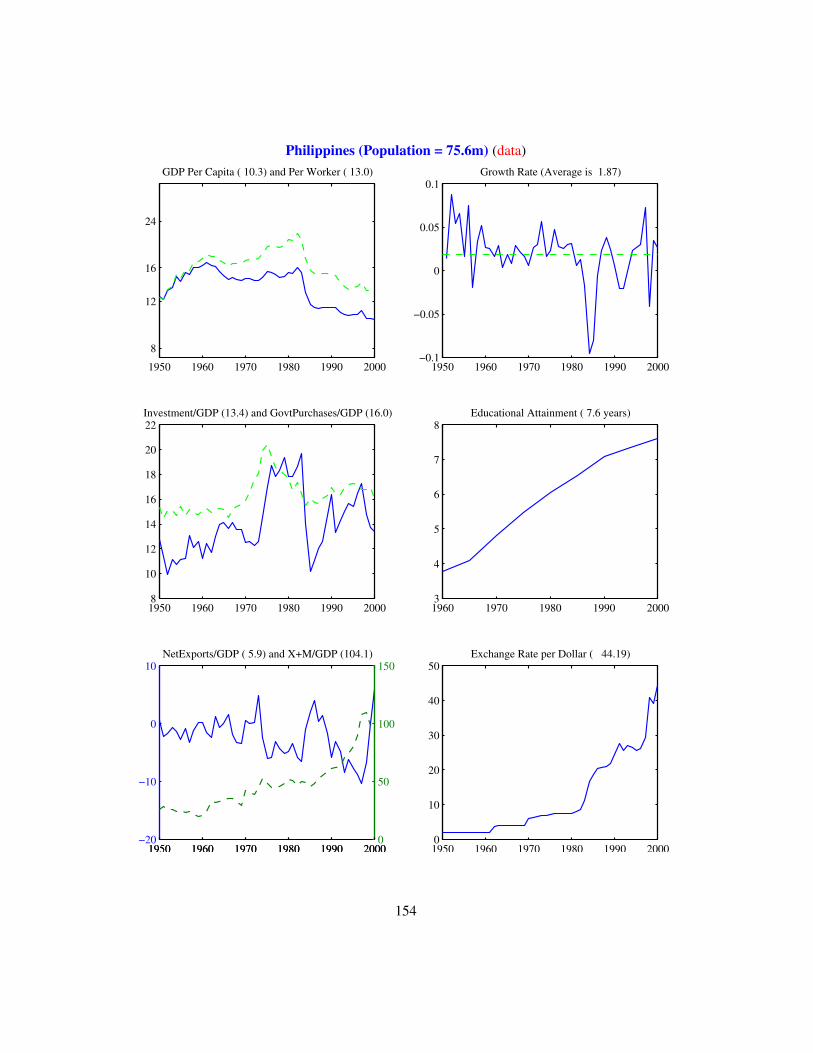
Philippines (Population = 75.6m) (data)
1950 1960 1970 1980 1990 2000
8
12
16
24
GDP Per Capita ( 10.3) and Per Worker ( 13.0)
1950 1960 1970 1980 1990 2000−0.1
−0.05
0
0.05
0.1Growth Rate (Average is 1.87)
1950 1960 1970 1980 1990 20008
10
12
14
16
18
20
22Investment/GDP (13.4) and GovtPurchases/GDP (16.0)
1960 1970 1980 1990 20003
4
5
6
7
8Educational Attainment ( 7.6 years)
1950 1960 1970 1980 1990 2000−20
−10
0
10NetExports/GDP ( 5.9) and X+M/GDP (104.1)
1950 1960 1970 1980 1990 20000
50
100
150
1950 1960 1970 1980 1990 20000
10
20
30
40
50Exchange Rate per Dollar ( 44.19)
154

Palau (Population = 0.0m) (data)
0 0.2 0.4 0.6 0.8 11
GDP Per Capita ( 0.0) and Per Worker ( 0.0)
1950 1960 1970 1980 1990 20000
0.2
0.4
0.6
0.8
1Growth Rate (Average is NaN)
1950 1960 1970 1980 1990 2000−1
−0.5
0
0.5
1Investment/GDP ( 0.0) and GovtPurchases/GDP ( 0.0)
1960 1970 1980 1990 20000
0.2
0.4
0.6
0.8
1Educational Attainment ( NaN years)
1950 1960 1970 1980 1990 200099
99.5
100
100.5
101NetExports/GDP (100.0) and X+M/GDP ( 0.0)
1950 1960 1970 1980 1990 2000−1
−0.5
0
0.5
1
1950 1960 1970 1980 1990 2000−1
−0.5
0
0.5
1Exchange Rate per Dollar ( 0.00)
155
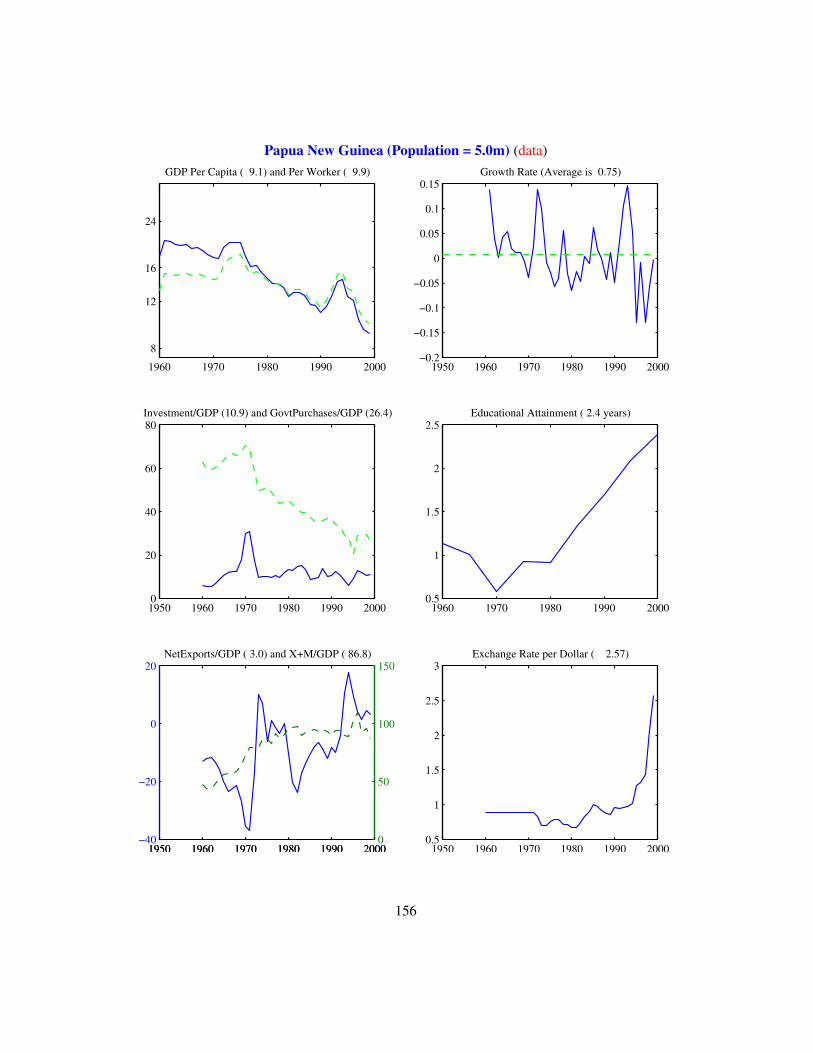
Papua New Guinea (Population = 5.0m) (data)
1960 1970 1980 1990 2000
8
12
16
24
GDP Per Capita ( 9.1) and Per Worker ( 9.9)
1950 1960 1970 1980 1990 2000−0.2
−0.15
−0.1
−0.05
0
0.05
0.1
0.15Growth Rate (Average is 0.75)
1950 1960 1970 1980 1990 20000
20
40
60
80Investment/GDP (10.9) and GovtPurchases/GDP (26.4)
1960 1970 1980 1990 20000.5
1
1.5
2
2.5Educational Attainment ( 2.4 years)
1950 1960 1970 1980 1990 2000−40
−20
0
20NetExports/GDP ( 3.0) and X+M/GDP ( 86.8)
1950 1960 1970 1980 1990 20000
50
100
150
1950 1960 1970 1980 1990 20000.5
1
1.5
2
2.5
3Exchange Rate per Dollar ( 2.57)
156
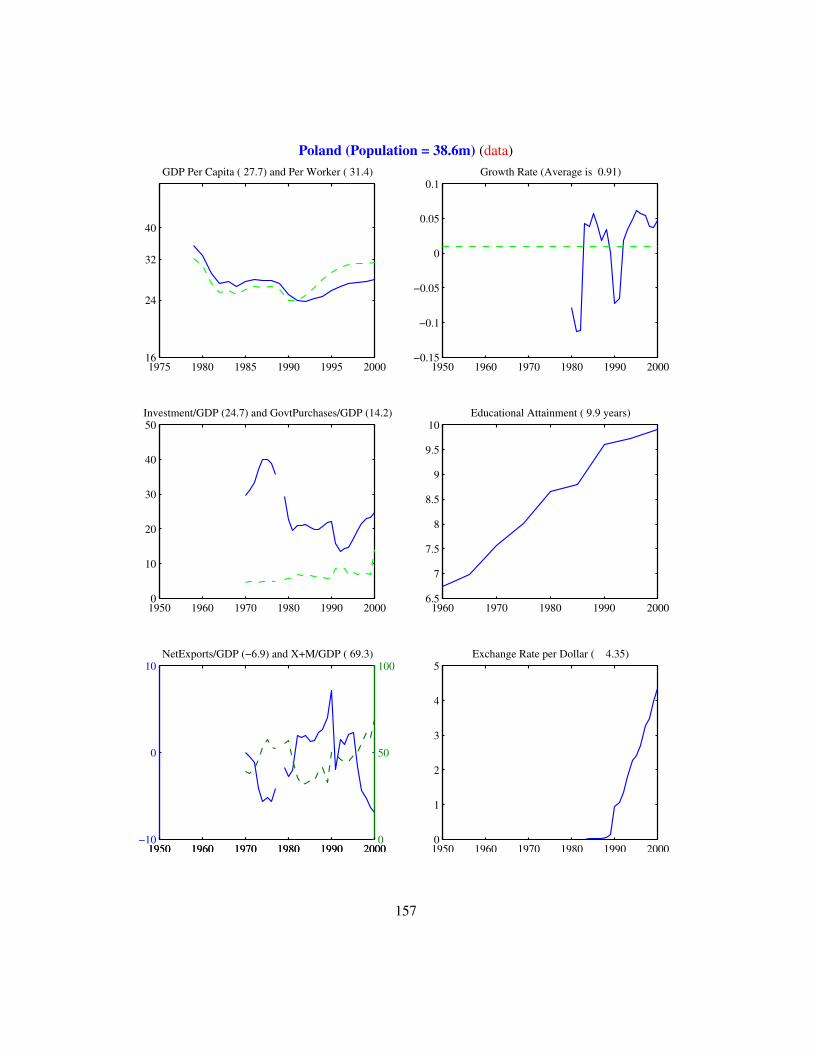
Poland (Population = 38.6m) (data)
1975 1980 1985 1990 1995 200016
24
32
40
GDP Per Capita ( 27.7) and Per Worker ( 31.4)
1950 1960 1970 1980 1990 2000−0.15
−0.1
−0.05
0
0.05
0.1Growth Rate (Average is 0.91)
1950 1960 1970 1980 1990 20000
10
20
30
40
50Investment/GDP (24.7) and GovtPurchases/GDP (14.2)
1960 1970 1980 1990 20006.5
7
7.5
8
8.5
9
9.5
10Educational Attainment ( 9.9 years)
1950 1960 1970 1980 1990 2000−10
0
10NetExports/GDP (−6.9) and X+M/GDP ( 69.3)
1950 1960 1970 1980 1990 20000
50
100
1950 1960 1970 1980 1990 20000
1
2
3
4
5Exchange Rate per Dollar ( 4.35)
157
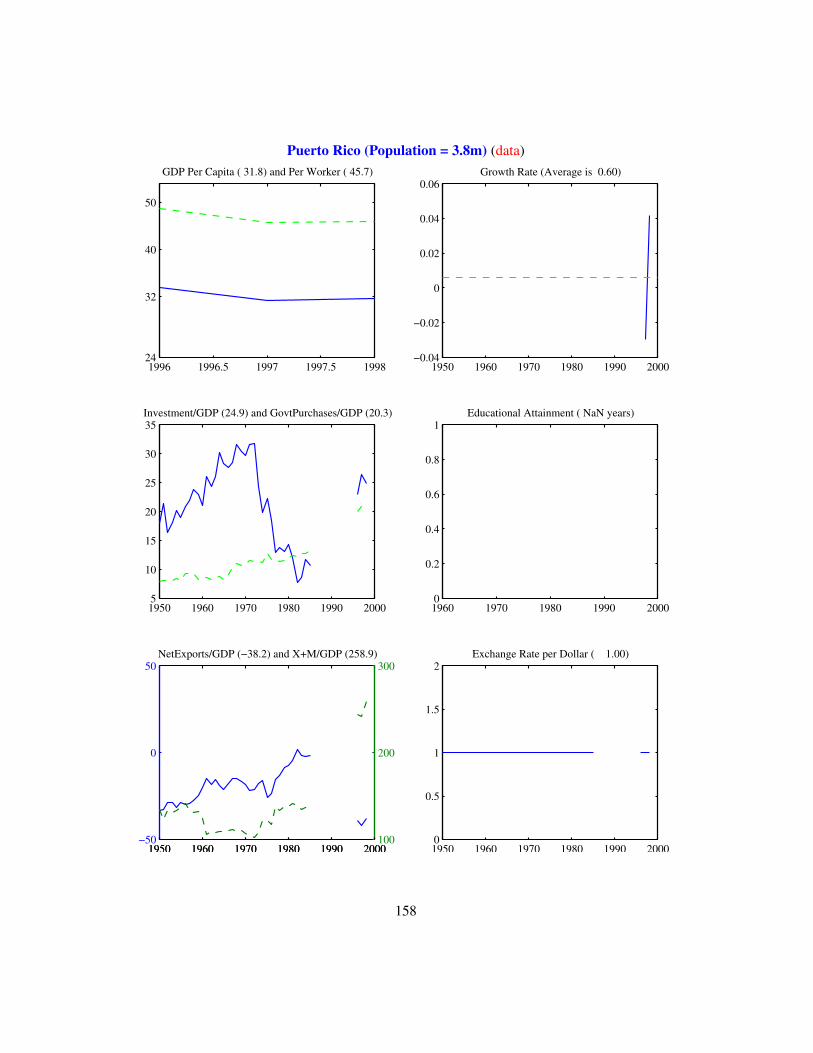
Puerto Rico (Population = 3.8m) (data)
1996 1996.5 1997 1997.5 199824
32
40
50
GDP Per Capita ( 31.8) and Per Worker ( 45.7)
1950 1960 1970 1980 1990 2000−0.04
−0.02
0
0.02
0.04
0.06Growth Rate (Average is 0.60)
1950 1960 1970 1980 1990 20005
10
15
20
25
30
35Investment/GDP (24.9) and GovtPurchases/GDP (20.3)
1960 1970 1980 1990 20000
0.2
0.4
0.6
0.8
1Educational Attainment ( NaN years)
1950 1960 1970 1980 1990 2000−50
0
50NetExports/GDP (−38.2) and X+M/GDP (258.9)
1950 1960 1970 1980 1990 2000100
200
300
1950 1960 1970 1980 1990 20000
0.5
1
1.5
2Exchange Rate per Dollar ( 1.00)
158
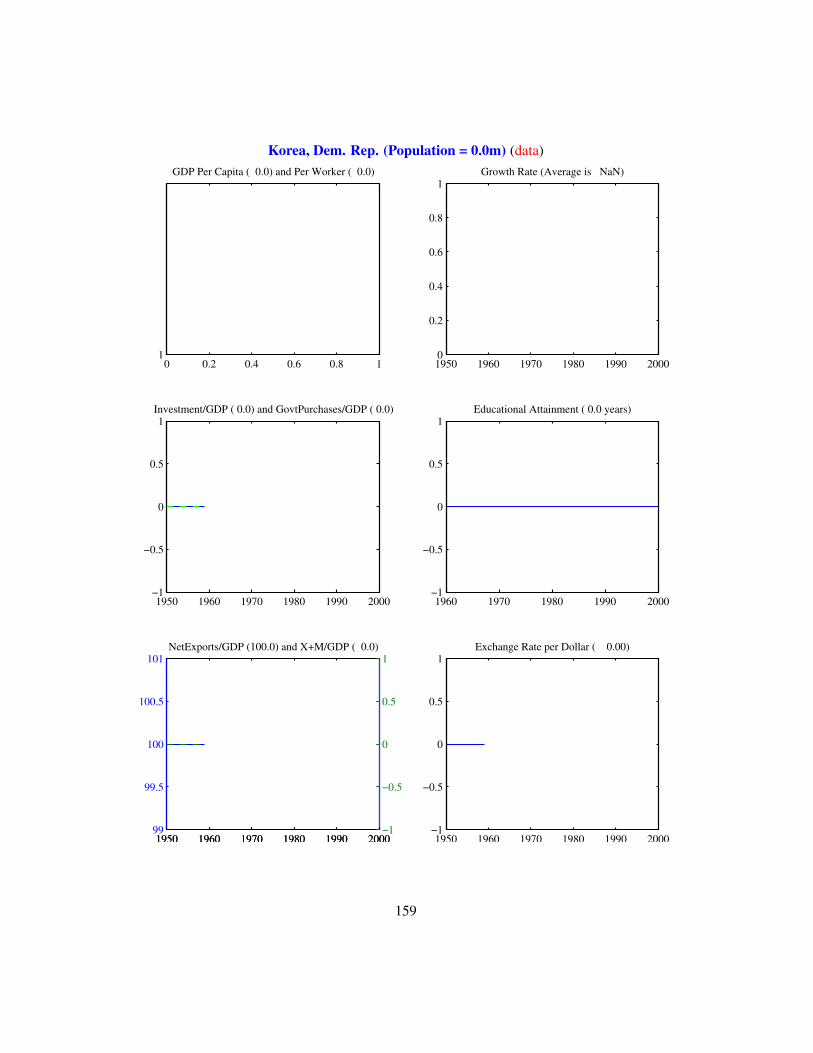
Korea, Dem. Rep. (Population = 0.0m) (data)
0 0.2 0.4 0.6 0.8 11
GDP Per Capita ( 0.0) and Per Worker ( 0.0)
1950 1960 1970 1980 1990 20000
0.2
0.4
0.6
0.8
1Growth Rate (Average is NaN)
1950 1960 1970 1980 1990 2000−1
−0.5
0
0.5
1Investment/GDP ( 0.0) and GovtPurchases/GDP ( 0.0)
1960 1970 1980 1990 2000−1
−0.5
0
0.5
1Educational Attainment ( 0.0 years)
1950 1960 1970 1980 1990 200099
99.5
100
100.5
101NetExports/GDP (100.0) and X+M/GDP ( 0.0)
1950 1960 1970 1980 1990 2000−1
−0.5
0
0.5
1
1950 1960 1970 1980 1990 2000−1
−0.5
0
0.5
1Exchange Rate per Dollar ( 0.00)
159
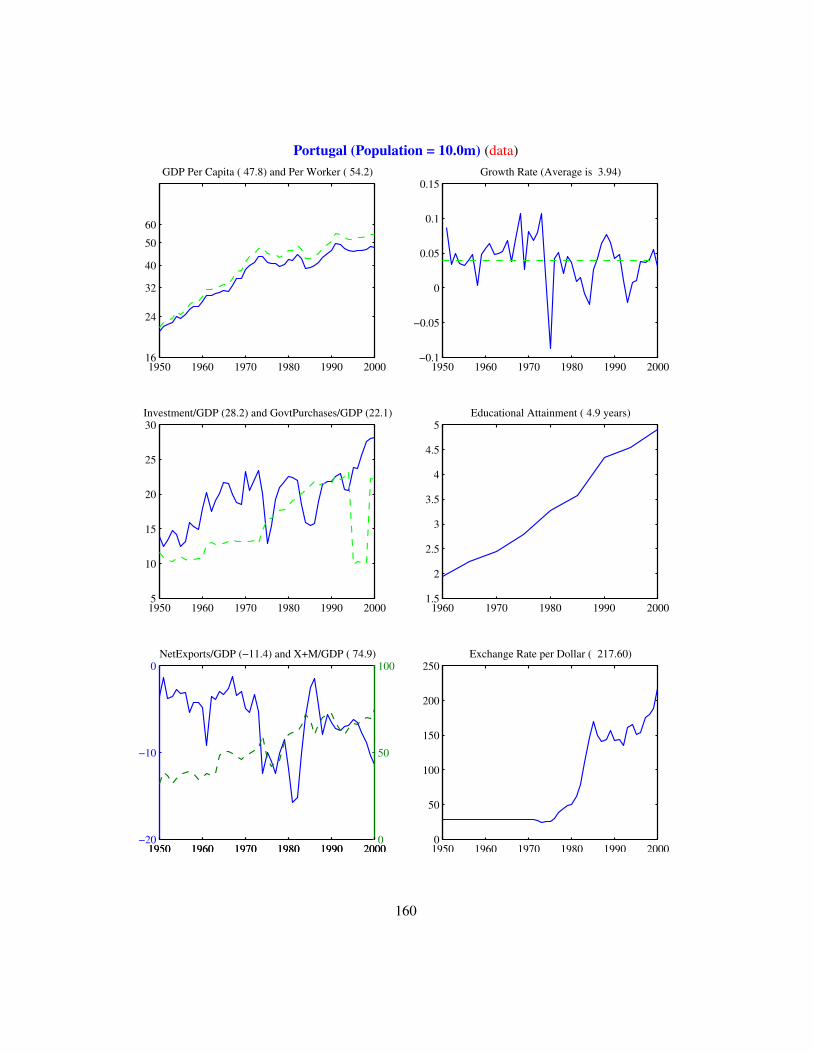
Portugal (Population = 10.0m) (data)
1950 1960 1970 1980 1990 200016
24
32
40
50
60
GDP Per Capita ( 47.8) and Per Worker ( 54.2)
1950 1960 1970 1980 1990 2000−0.1
−0.05
0
0.05
0.1
0.15Growth Rate (Average is 3.94)
1950 1960 1970 1980 1990 20005
10
15
20
25
30Investment/GDP (28.2) and GovtPurchases/GDP (22.1)
1960 1970 1980 1990 20001.5
2
2.5
3
3.5
4
4.5
5Educational Attainment ( 4.9 years)
1950 1960 1970 1980 1990 2000−20
−10
0NetExports/GDP (−11.4) and X+M/GDP ( 74.9)
1950 1960 1970 1980 1990 20000
50
100
1950 1960 1970 1980 1990 20000
50
100
150
200
250Exchange Rate per Dollar ( 217.60)
160
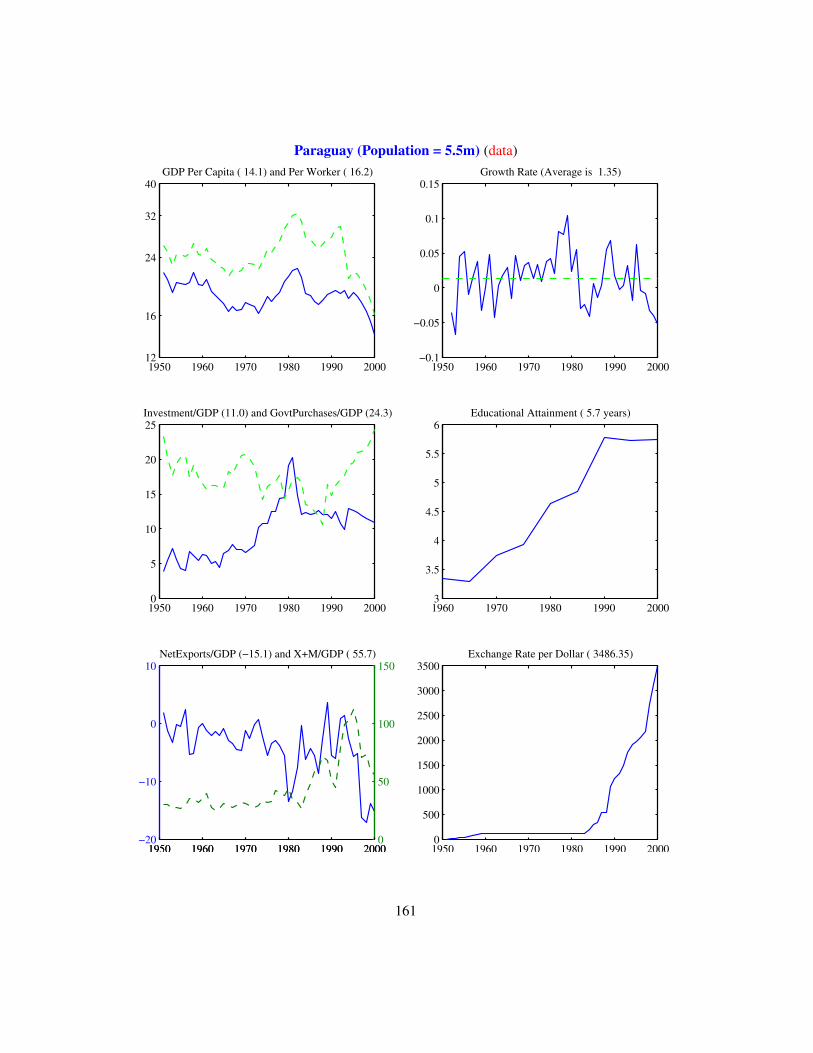
Paraguay (Population = 5.5m) (data)
1950 1960 1970 1980 1990 200012
16
24
32
40GDP Per Capita ( 14.1) and Per Worker ( 16.2)
1950 1960 1970 1980 1990 2000−0.1
−0.05
0
0.05
0.1
0.15Growth Rate (Average is 1.35)
1950 1960 1970 1980 1990 20000
5
10
15
20
25Investment/GDP (11.0) and GovtPurchases/GDP (24.3)
1960 1970 1980 1990 20003
3.5
4
4.5
5
5.5
6Educational Attainment ( 5.7 years)
1950 1960 1970 1980 1990 2000−20
−10
0
10NetExports/GDP (−15.1) and X+M/GDP ( 55.7)
1950 1960 1970 1980 1990 20000
50
100
150
1950 1960 1970 1980 1990 20000
500
1000
1500
2000
2500
3000
3500Exchange Rate per Dollar ( 3486.35)
161
French Polynesia (Population = 0.0m) (data)
0 0.2 0.4 0.6 0.8 11
GDP Per Capita ( 0.0) and Per Worker ( 0.0)
1950 1960 1970 1980 1990 20000
0.2
0.4
0.6
0.8
1Growth Rate (Average is NaN)
1950 1960 1970 1980 1990 2000−1
−0.5
0
0.5
1Investment/GDP ( 0.0) and GovtPurchases/GDP ( 0.0)
1960 1970 1980 1990 2000−1
−0.5
0
0.5
1Educational Attainment ( 0.0 years)
1950 1960 1970 1980 1990 200099
99.5
100
100.5
101NetExports/GDP (100.0) and X+M/GDP ( 0.0)
1950 1960 1970 1980 1990 2000−1
−0.5
0
0.5
1
1950 1960 1970 1980 1990 2000−1
−0.5
0
0.5
1Exchange Rate per Dollar ( 0.00)
162
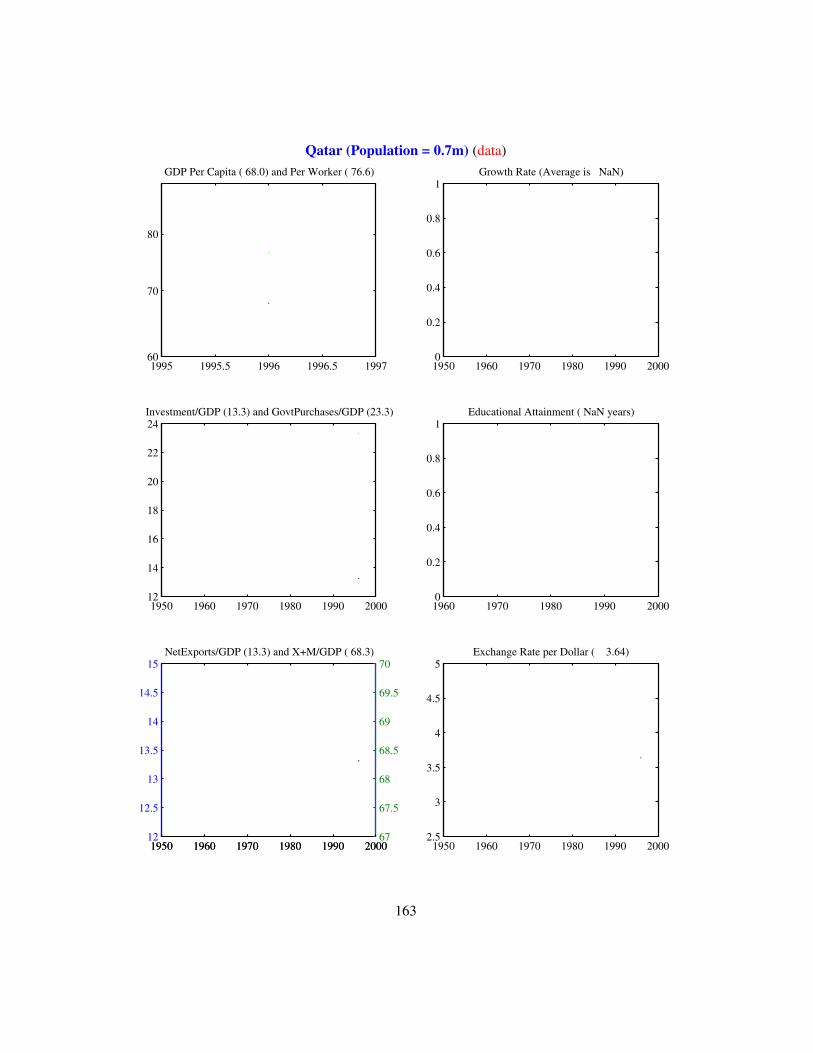
Qatar (Population = 0.7m) (data)
1995 1995.5 1996 1996.5 199760
70
80
GDP Per Capita ( 68.0) and Per Worker ( 76.6)
1950 1960 1970 1980 1990 20000
0.2
0.4
0.6
0.8
1Growth Rate (Average is NaN)
1950 1960 1970 1980 1990 200012
14
16
18
20
22
24Investment/GDP (13.3) and GovtPurchases/GDP (23.3)
1960 1970 1980 1990 20000
0.2
0.4
0.6
0.8
1Educational Attainment ( NaN years)
1950 1960 1970 1980 1990 200012
12.5
13
13.5
14
14.5
15NetExports/GDP (13.3) and X+M/GDP ( 68.3)
1950 1960 1970 1980 1990 200067
67.5
68
68.5
69
69.5
70
1950 1960 1970 1980 1990 20002.5
3
3.5
4
4.5
5Exchange Rate per Dollar ( 3.64)
163
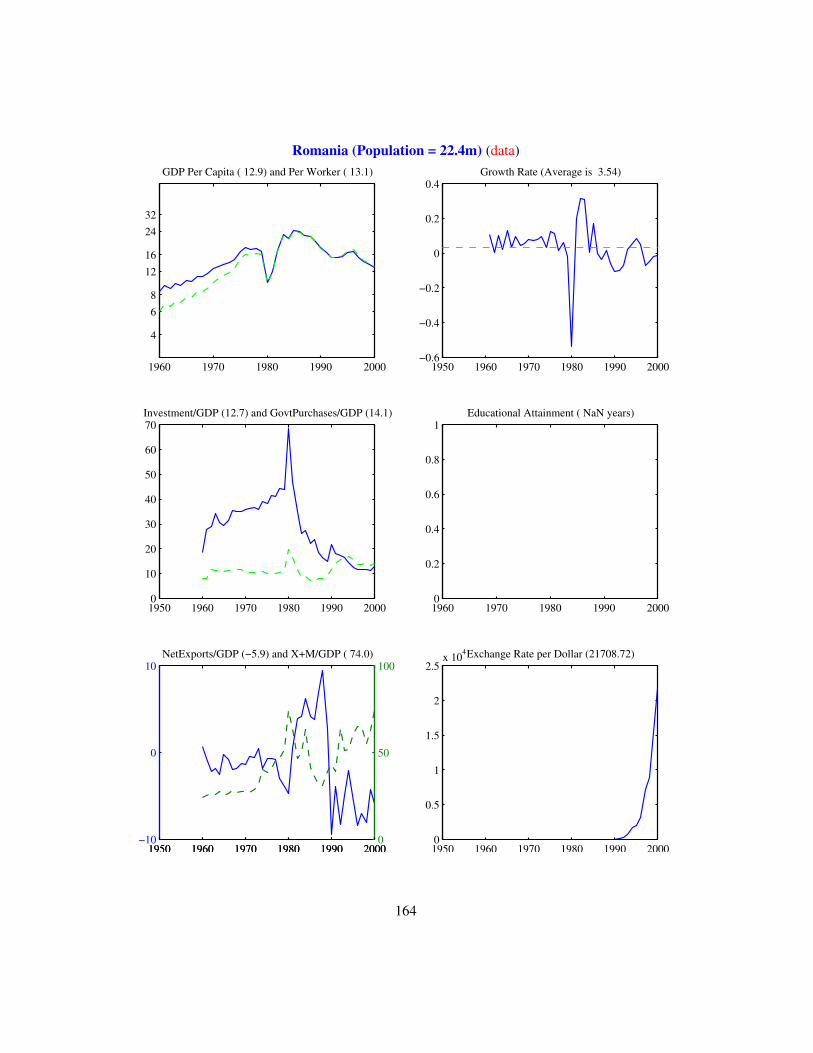
Romania (Population = 22.4m) (data)
1960 1970 1980 1990 2000
4
6 8
1216
2432
GDP Per Capita ( 12.9) and Per Worker ( 13.1)
1950 1960 1970 1980 1990 2000−0.6
−0.4
−0.2
0
0.2
0.4Growth Rate (Average is 3.54)
1950 1960 1970 1980 1990 20000
10
20
30
40
50
60
70Investment/GDP (12.7) and GovtPurchases/GDP (14.1)
1960 1970 1980 1990 20000
0.2
0.4
0.6
0.8
1Educational Attainment ( NaN years)
1950 1960 1970 1980 1990 2000−10
0
10NetExports/GDP (−5.9) and X+M/GDP ( 74.0)
1950 1960 1970 1980 1990 20000
50
100
1950 1960 1970 1980 1990 20000
0.5
1
1.5
2
2.5x 10⁴Exchange Rate per Dollar (21708.72)
164
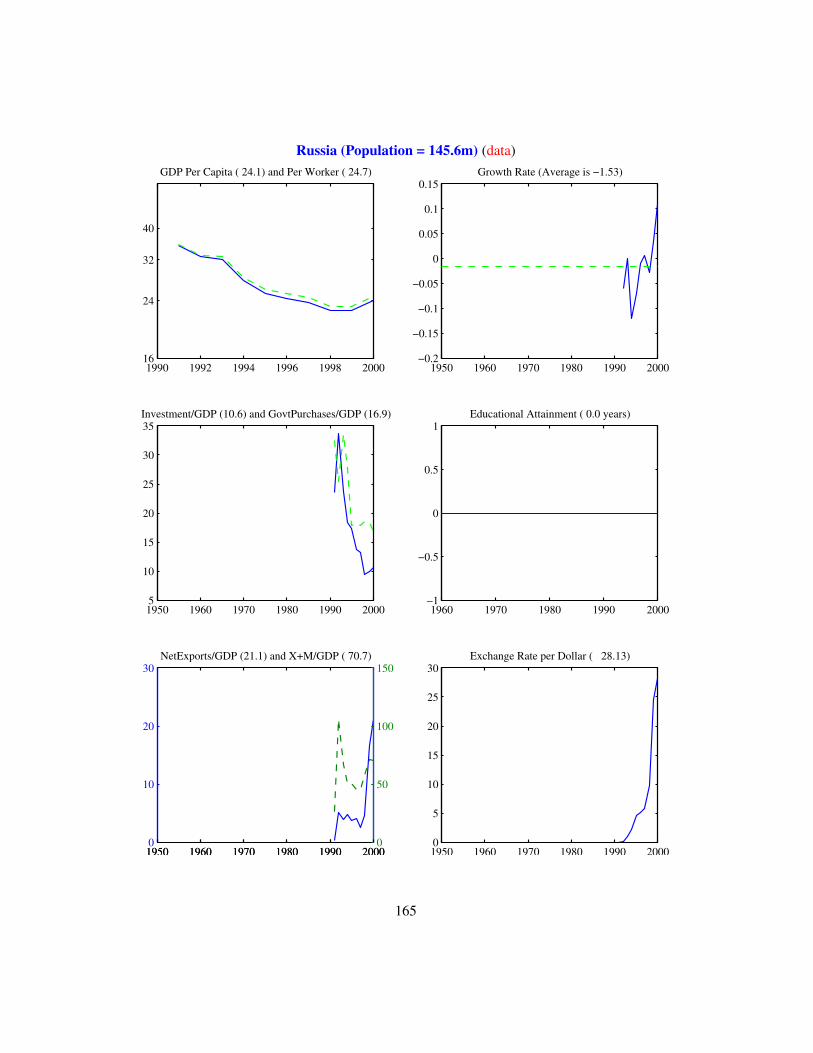
Russia (Population = 145.6m) (data)
1990 1992 1994 1996 1998 200016
24
32
40
GDP Per Capita ( 24.1) and Per Worker ( 24.7)
1950 1960 1970 1980 1990 2000−0.2
−0.15
−0.1
−0.05
0
0.05
0.1
0.15Growth Rate (Average is −1.53)
1950 1960 1970 1980 1990 20005
10
15
20
25
30
35Investment/GDP (10.6) and GovtPurchases/GDP (16.9)
1960 1970 1980 1990 2000−1
−0.5
0
0.5
1Educational Attainment ( 0.0 years)
1950 1960 1970 1980 1990 20000
10
20
30NetExports/GDP (21.1) and X+M/GDP ( 70.7)
1950 1960 1970 1980 1990 20000
50
100
150
1950 1960 1970 1980 1990 20000
5
10
15
20
25
30Exchange Rate per Dollar ( 28.13)
165
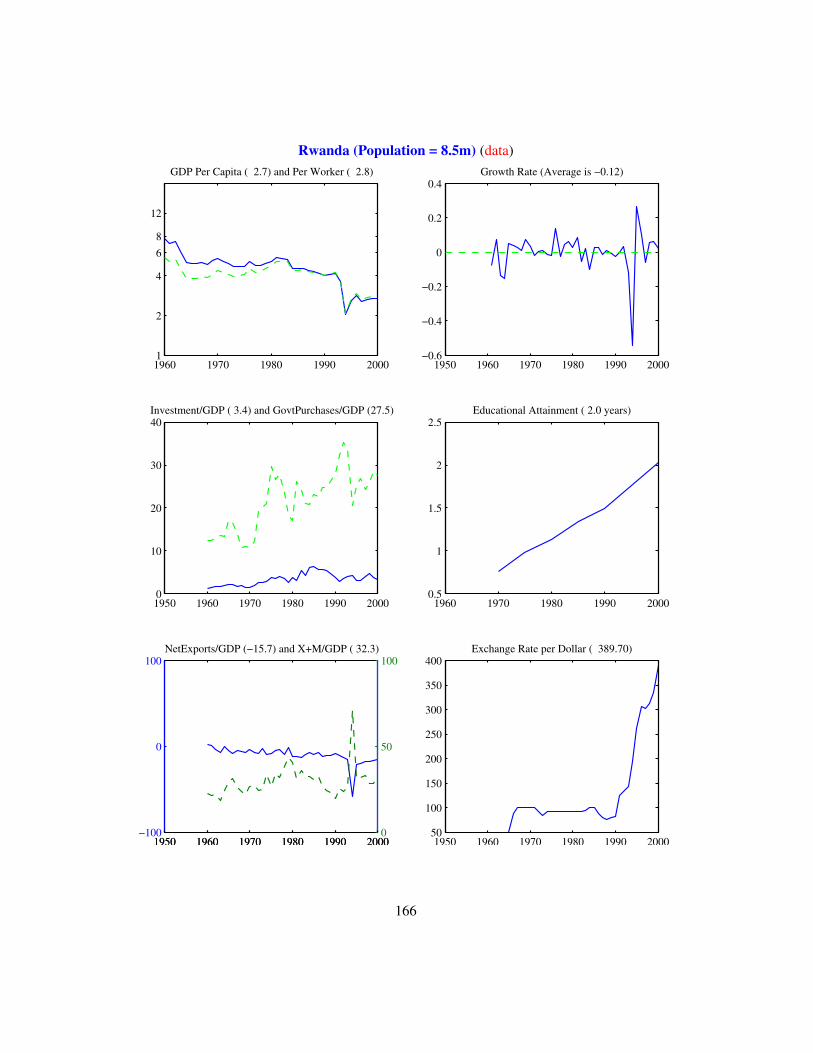
Rwanda (Population = 8.5m) (data)
1960 1970 1980 1990 2000 1
2
4
6 8
12
GDP Per Capita ( 2.7) and Per Worker ( 2.8)
1950 1960 1970 1980 1990 2000−0.6
−0.4
−0.2
0
0.2
0.4Growth Rate (Average is −0.12)
1950 1960 1970 1980 1990 20000
10
20
30
40Investment/GDP ( 3.4) and GovtPurchases/GDP (27.5)
1960 1970 1980 1990 20000.5
1
1.5
2
2.5Educational Attainment ( 2.0 years)
1950 1960 1970 1980 1990 2000−100
0
100NetExports/GDP (−15.7) and X+M/GDP ( 32.3)
1950 1960 1970 1980 1990 20000
50
100
1950 1960 1970 1980 1990 200050
100
150
200
250
300
350
400Exchange Rate per Dollar ( 389.70)
166
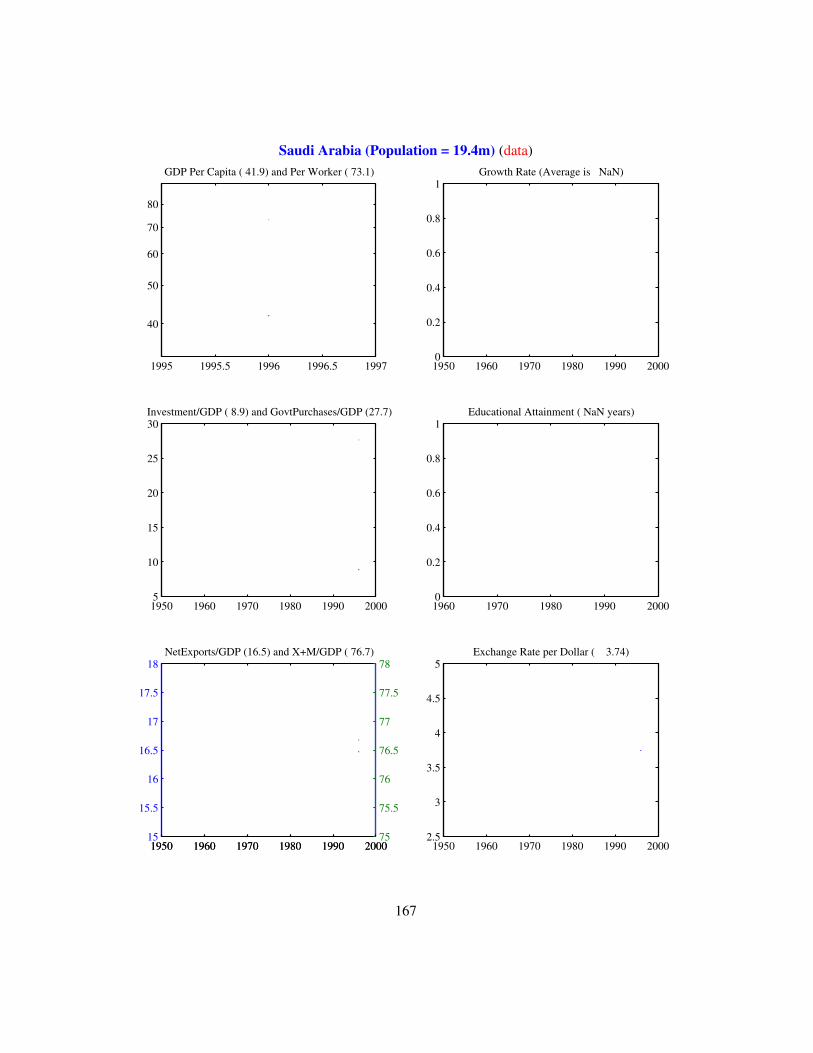
Saudi Arabia (Population = 19.4m) (data)
1995 1995.5 1996 1996.5 1997
40
50
60
70
80
GDP Per Capita ( 41.9) and Per Worker ( 73.1)
1950 1960 1970 1980 1990 20000
0.2
0.4
0.6
0.8
1Growth Rate (Average is NaN)
1950 1960 1970 1980 1990 20005
10
15
20
25
30Investment/GDP ( 8.9) and GovtPurchases/GDP (27.7)
1960 1970 1980 1990 20000
0.2
0.4
0.6
0.8
1Educational Attainment ( NaN years)
1950 1960 1970 1980 1990 200015
15.5
16
16.5
17
17.5
18NetExports/GDP (16.5) and X+M/GDP ( 76.7)
1950 1960 1970 1980 1990 200075
75.5
76
76.5
77
77.5
78
1950 1960 1970 1980 1990 20002.5
3
3.5
4
4.5
5Exchange Rate per Dollar ( 3.74)
167

Sudan (Population = 27.2m) (data)
1995 1995.5 1996 1996.5 19972
4
6
8GDP Per Capita ( 4.0) and Per Worker ( 5.2)
1950 1960 1970 1980 1990 20000
0.2
0.4
0.6
0.8
1Growth Rate (Average is NaN)
1950 1960 1970 1980 1990 20005
10
15
20
25Investment/GDP ( 9.6) and GovtPurchases/GDP (22.8)
1960 1970 1980 1990 20000
0.5
1
1.5
2Educational Attainment ( 1.9 years)
1950 1960 1970 1980 1990 2000−13
−12.5
−12
−11.5
−11
−10.5
−10NetExports/GDP (−11.6) and X+M/GDP ( 27.9)
1950 1960 1970 1980 1990 200026
26.5
27
27.5
28
28.5
29
1950 1960 1970 1980 1990 20001249.5
1250
1250.5
1251
1251.5
1252Exchange Rate per Dollar ( 1250.79)
168
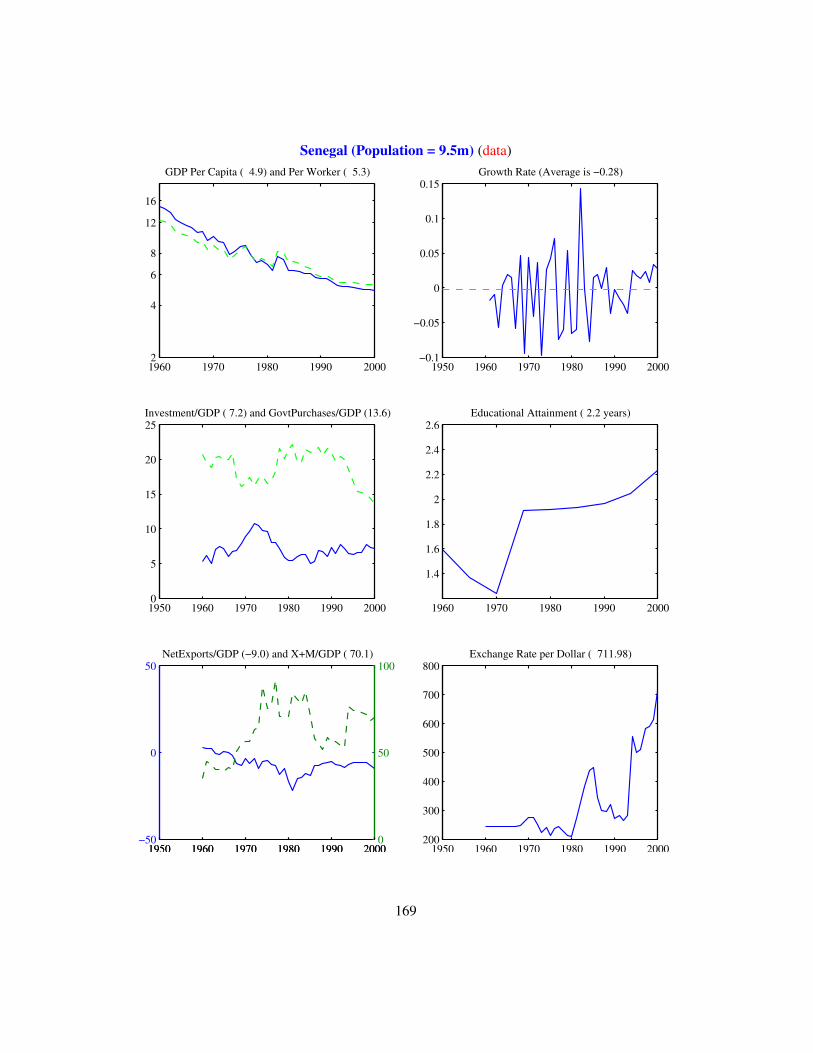
Senegal (Population = 9.5m) (data)
1960 1970 1980 1990 2000 2
4
6
8
12
16
GDP Per Capita ( 4.9) and Per Worker ( 5.3)
1950 1960 1970 1980 1990 2000−0.1
−0.05
0
0.05
0.1
0.15Growth Rate (Average is −0.28)
1950 1960 1970 1980 1990 20000
5
10
15
20
25Investment/GDP ( 7.2) and GovtPurchases/GDP (13.6)
1960 1970 1980 1990 2000
1.4
1.6
1.8
2
2.2
2.4
2.6Educational Attainment ( 2.2 years)
1950 1960 1970 1980 1990 2000−50
0
50NetExports/GDP (−9.0) and X+M/GDP ( 70.1)
1950 1960 1970 1980 1990 20000
50
100
1950 1960 1970 1980 1990 2000200
300
400
500
600
700
800Exchange Rate per Dollar ( 711.98)
169
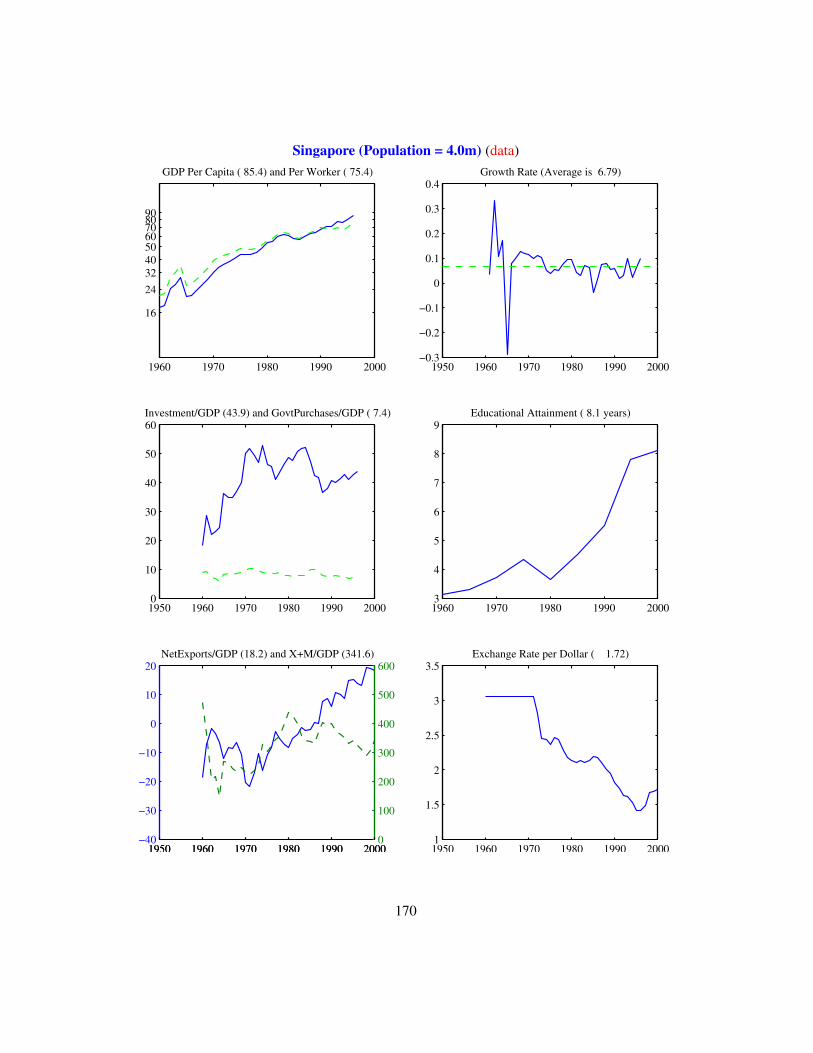
Singapore (Population = 4.0m) (data)
1960 1970 1980 1990 2000
16
2432405060708090
GDP Per Capita ( 85.4) and Per Worker ( 75.4)
1950 1960 1970 1980 1990 2000−0.3
−0.2
−0.1
0
0.1
0.2
0.3
0.4Growth Rate (Average is 6.79)
1950 1960 1970 1980 1990 20000
10
20
30
40
50
60Investment/GDP (43.9) and GovtPurchases/GDP ( 7.4)
1960 1970 1980 1990 20003
4
5
6
7
8
9Educational Attainment ( 8.1 years)
1950 1960 1970 1980 1990 2000−40
−30
−20
−10
0
10
20NetExports/GDP (18.2) and X+M/GDP (341.6)
1950 1960 1970 1980 1990 20000
100
200
300
400
500
600
1950 1960 1970 1980 1990 20001
1.5
2
2.5
3
3.5Exchange Rate per Dollar ( 1.72)
170

Solomon Islands (Population = 0.0m) (data)
0 0.2 0.4 0.6 0.8 11
GDP Per Capita ( 0.0) and Per Worker ( 0.0)
1950 1960 1970 1980 1990 20000
0.2
0.4
0.6
0.8
1Growth Rate (Average is NaN)
1950 1960 1970 1980 1990 2000−1
−0.5
0
0.5
1Investment/GDP ( 0.0) and GovtPurchases/GDP ( 0.0)
1960 1970 1980 1990 20000
0.2
0.4
0.6
0.8
1Educational Attainment ( NaN years)
1950 1960 1970 1980 1990 200099
99.5
100
100.5
101NetExports/GDP (100.0) and X+M/GDP ( 0.0)
1950 1960 1970 1980 1990 2000−1
−0.5
0
0.5
1
1950 1960 1970 1980 1990 2000−1
−0.5
0
0.5
1Exchange Rate per Dollar ( 0.00)
171
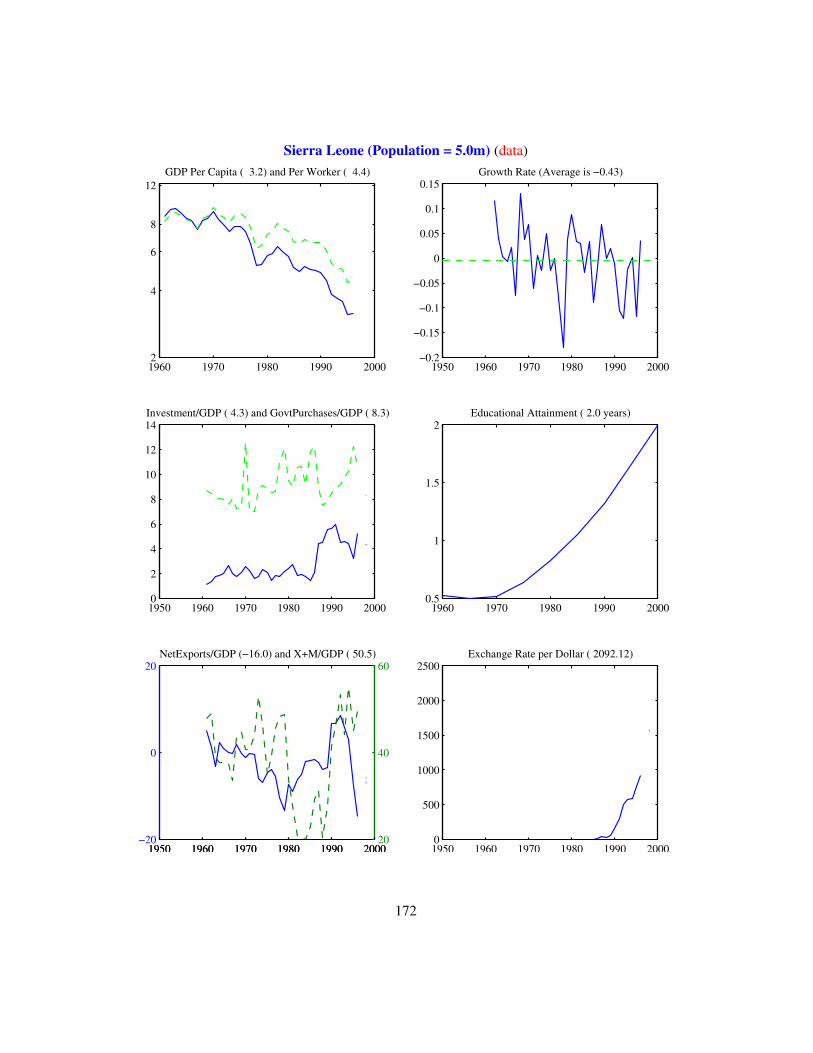
Sierra Leone (Population = 5.0m) (data)
1960 1970 1980 1990 2000 2
4
6
8
12GDP Per Capita ( 3.2) and Per Worker ( 4.4)
1950 1960 1970 1980 1990 2000−0.2
−0.15
−0.1
−0.05
0
0.05
0.1
0.15Growth Rate (Average is −0.43)
1950 1960 1970 1980 1990 20000
2
4
6
8
10
12
14Investment/GDP ( 4.3) and GovtPurchases/GDP ( 8.3)
1960 1970 1980 1990 20000.5
1
1.5
2Educational Attainment ( 2.0 years)
1950 1960 1970 1980 1990 2000−20
0
20NetExports/GDP (−16.0) and X+M/GDP ( 50.5)
1950 1960 1970 1980 1990 200020
40
60
1950 1960 1970 1980 1990 20000
500
1000
1500
2000
2500Exchange Rate per Dollar ( 2092.12)
172
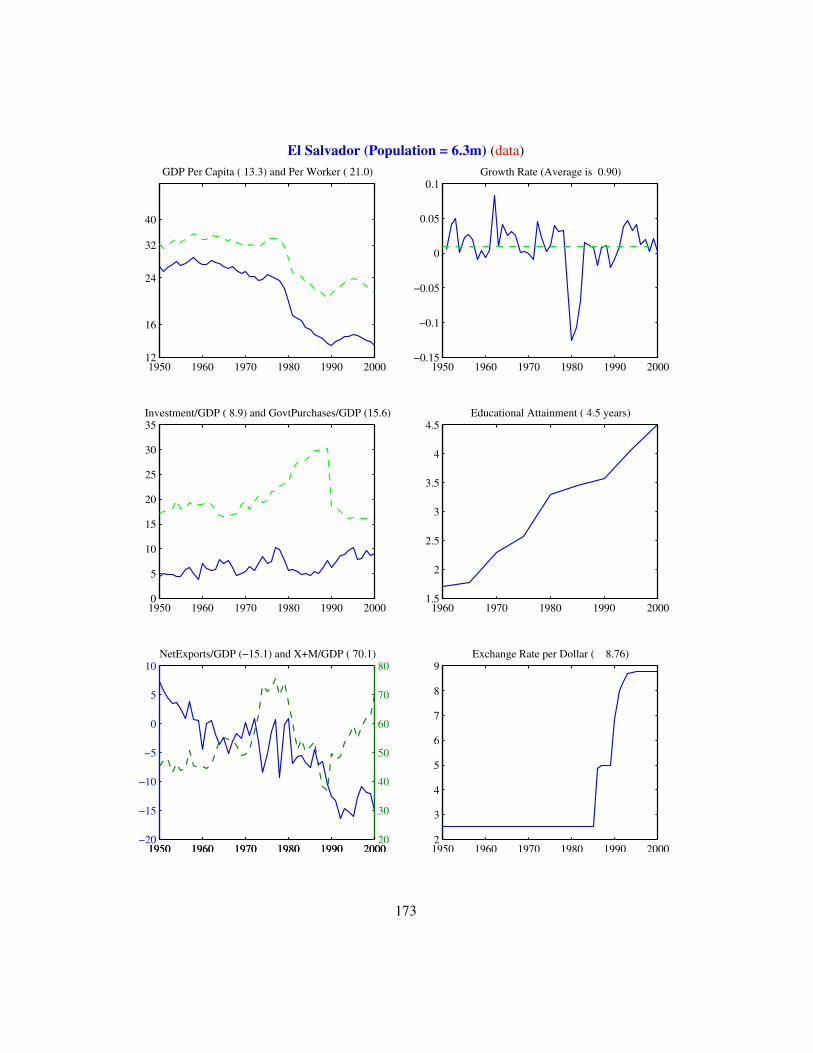
El Salvador (Population = 6.3m) (data)
1950 1960 1970 1980 1990 200012
16
24
32
40
GDP Per Capita ( 13.3) and Per Worker ( 21.0)
1950 1960 1970 1980 1990 2000−0.15
−0.1
−0.05
0
0.05
0.1Growth Rate (Average is 0.90)
1950 1960 1970 1980 1990 20000
5
10
15
20
25
30
35Investment/GDP ( 8.9) and GovtPurchases/GDP (15.6)
1960 1970 1980 1990 20001.5
2
2.5
3
3.5
4
4.5Educational Attainment ( 4.5 years)
1950 1960 1970 1980 1990 2000−20
−15
−10
−5
0
5
10NetExports/GDP (−15.1) and X+M/GDP ( 70.1)
1950 1960 1970 1980 1990 200020
30
40
50
60
70
80
1950 1960 1970 1980 1990 20002
3
4
5
6
7
8
9Exchange Rate per Dollar ( 8.76)
173
San Marino (Population = 0.0m) (data)
0 0.2 0.4 0.6 0.8 11
GDP Per Capita ( 0.0) and Per Worker ( 0.0)
1950 1960 1970 1980 1990 20000
0.2
0.4
0.6
0.8
1Growth Rate (Average is NaN)
1950 1960 1970 1980 1990 2000−1
−0.5
0
0.5
1Investment/GDP ( 0.0) and GovtPurchases/GDP ( 0.0)
1960 1970 1980 1990 2000−1
−0.5
0
0.5
1Educational Attainment ( 0.0 years)
1950 1960 1970 1980 1990 200099
99.5
100
100.5
101NetExports/GDP (100.0) and X+M/GDP ( 0.0)
1950 1960 1970 1980 1990 2000−1
−0.5
0
0.5
1
1950 1960 1970 1980 1990 2000−1
−0.5
0
0.5
1Exchange Rate per Dollar ( 0.00)
174

Somalia (Population = 0.0m) (data)
0 0.2 0.4 0.6 0.8 11
GDP Per Capita ( 0.0) and Per Worker ( 0.0)
1950 1960 1970 1980 1990 20000
0.2
0.4
0.6
0.8
1Growth Rate (Average is NaN)
1950 1960 1970 1980 1990 2000−1
−0.5
0
0.5
1Investment/GDP ( 0.0) and GovtPurchases/GDP ( 0.0)
1960 1970 1980 1990 20000
0.2
0.4
0.6
0.8
1Educational Attainment ( NaN years)
1950 1960 1970 1980 1990 200099
99.5
100
100.5
101NetExports/GDP (100.0) and X+M/GDP ( 0.0)
1950 1960 1970 1980 1990 2000−1
−0.5
0
0.5
1
1950 1960 1970 1980 1990 2000−1
−0.5
0
0.5
1Exchange Rate per Dollar ( 0.00)
175
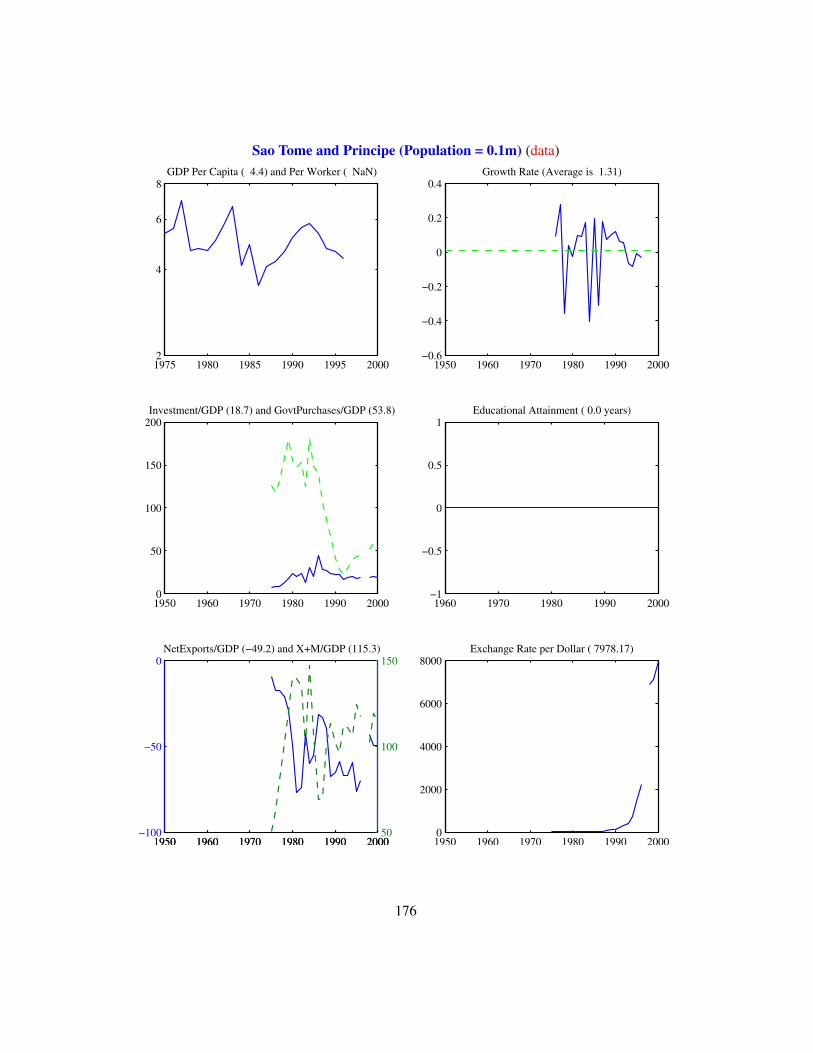
Sao Tome and Principe (Population = 0.1m) (data)
1975 1980 1985 1990 1995 20002
4
6
8GDP Per Capita ( 4.4) and Per Worker ( NaN)
1950 1960 1970 1980 1990 2000−0.6
−0.4
−0.2
0
0.2
0.4Growth Rate (Average is 1.31)
1950 1960 1970 1980 1990 20000
50
100
150
200Investment/GDP (18.7) and GovtPurchases/GDP (53.8)
1960 1970 1980 1990 2000−1
−0.5
0
0.5
1Educational Attainment ( 0.0 years)
1950 1960 1970 1980 1990 2000−100
−50
0NetExports/GDP (−49.2) and X+M/GDP (115.3)
1950 1960 1970 1980 1990 200050
100
150
1950 1960 1970 1980 1990 20000
2000
4000
6000
8000Exchange Rate per Dollar ( 7978.17)
176

Suriname (Population = 0.0m) (data)
0 0.2 0.4 0.6 0.8 11
GDP Per Capita ( 0.0) and Per Worker ( 0.0)
1950 1960 1970 1980 1990 20000
0.2
0.4
0.6
0.8
1Growth Rate (Average is NaN)
1950 1960 1970 1980 1990 2000−1
−0.5
0
0.5
1Investment/GDP ( 0.0) and GovtPurchases/GDP ( 0.0)
1960 1970 1980 1990 20000
0.2
0.4
0.6
0.8
1Educational Attainment ( NaN years)
1950 1960 1970 1980 1990 200099
99.5
100
100.5
101NetExports/GDP (100.0) and X+M/GDP ( 0.0)
1950 1960 1970 1980 1990 2000−1
−0.5
0
0.5
1
1950 1960 1970 1980 1990 2000−1
−0.5
0
0.5
1Exchange Rate per Dollar ( 0.00)
177
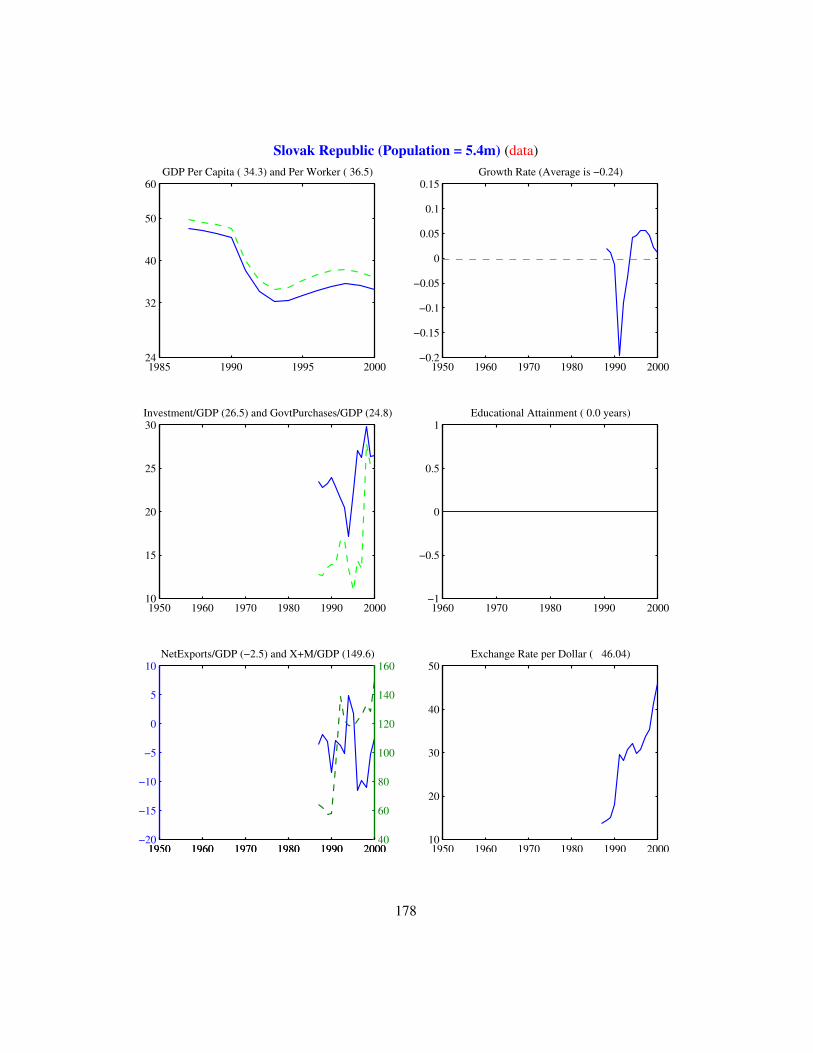
Slovak Republic (Population = 5.4m) (data)
1985 1990 1995 200024
32
40
50
60GDP Per Capita ( 34.3) and Per Worker ( 36.5)
1950 1960 1970 1980 1990 2000−0.2
−0.15
−0.1
−0.05
0
0.05
0.1
0.15Growth Rate (Average is −0.24)
1950 1960 1970 1980 1990 200010
15
20
25
30Investment/GDP (26.5) and GovtPurchases/GDP (24.8)
1960 1970 1980 1990 2000−1
−0.5
0
0.5
1Educational Attainment ( 0.0 years)
1950 1960 1970 1980 1990 2000−20
−15
−10
−5
0
5
10NetExports/GDP (−2.5) and X+M/GDP (149.6)
1950 1960 1970 1980 1990 200040
60
80
100
120
140
160
1950 1960 1970 1980 1990 200010
20
30
40
50Exchange Rate per Dollar ( 46.04)
178
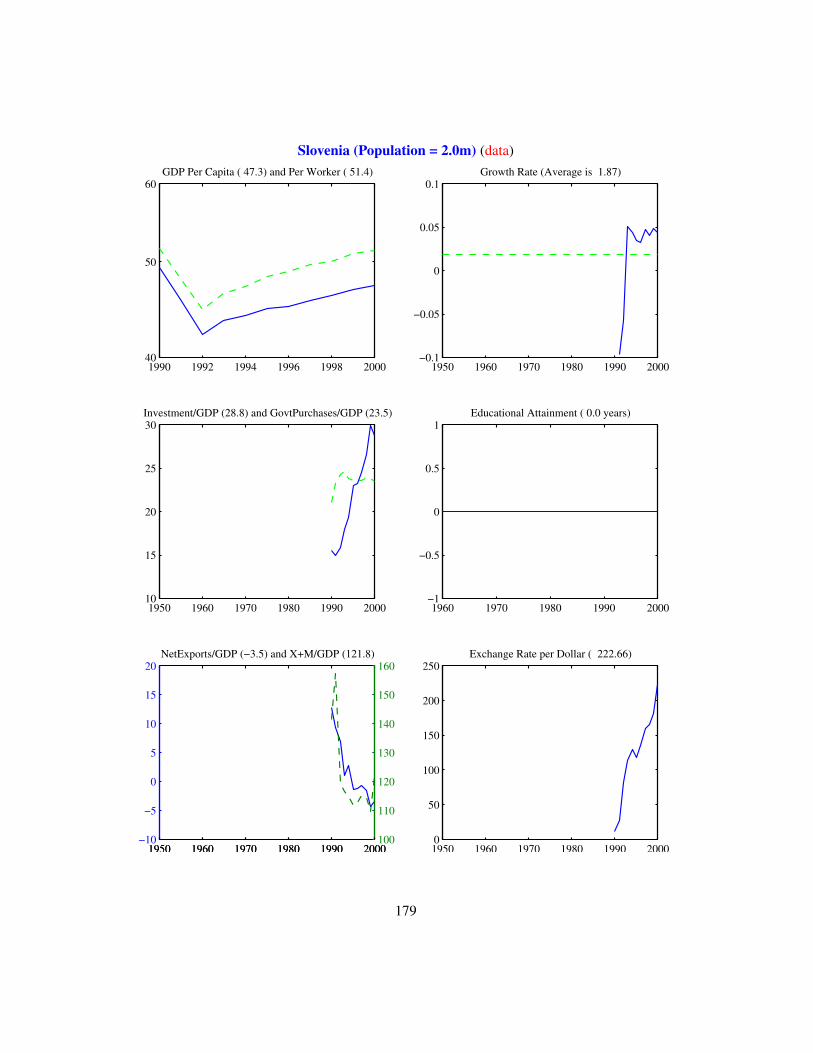
Slovenia (Population = 2.0m) (data)
1990 1992 1994 1996 1998 200040
50
60GDP Per Capita ( 47.3) and Per Worker ( 51.4)
1950 1960 1970 1980 1990 2000−0.1
−0.05
0
0.05
0.1Growth Rate (Average is 1.87)
1950 1960 1970 1980 1990 200010
15
20
25
30Investment/GDP (28.8) and GovtPurchases/GDP (23.5)
1960 1970 1980 1990 2000−1
−0.5
0
0.5
1Educational Attainment ( 0.0 years)
1950 1960 1970 1980 1990 2000−10
−5
0
5
10
15
20NetExports/GDP (−3.5) and X+M/GDP (121.8)
1950 1960 1970 1980 1990 2000100
110
120
130
140
150
160
1950 1960 1970 1980 1990 20000
50
100
150
200
250Exchange Rate per Dollar ( 222.66)
179
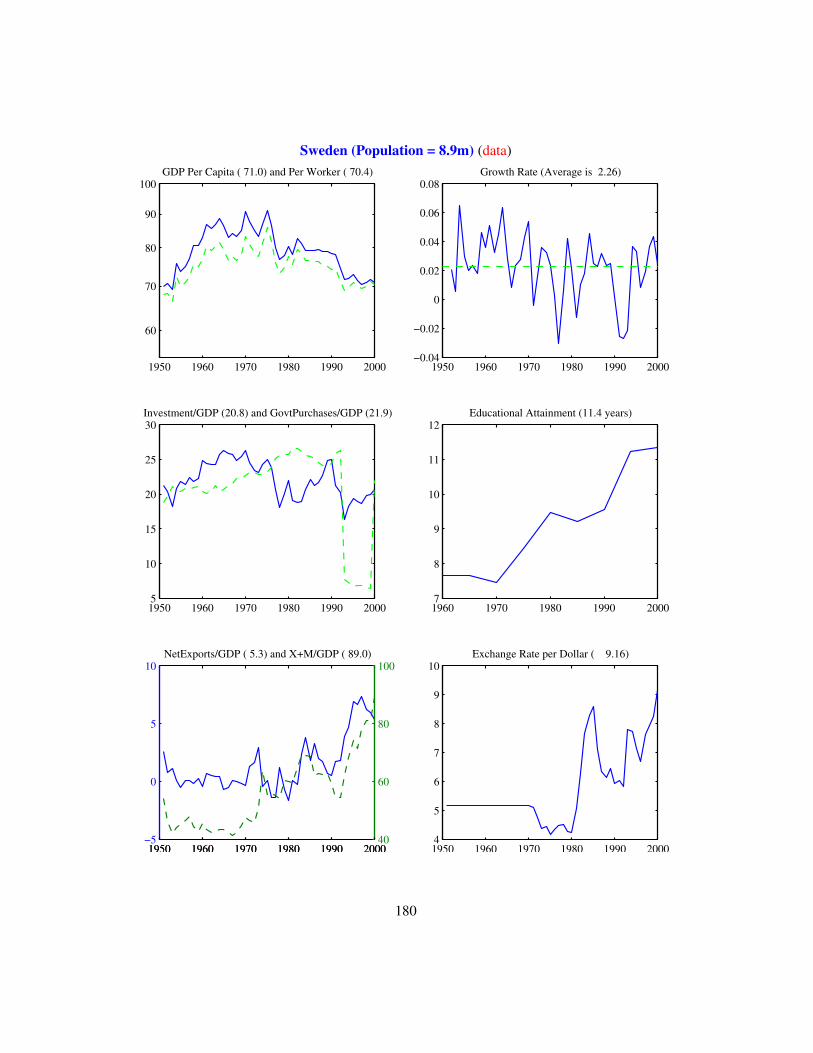
Sweden (Population = 8.9m) (data)
1950 1960 1970 1980 1990 2000
60
70
80
90
100GDP Per Capita ( 71.0) and Per Worker ( 70.4)
1950 1960 1970 1980 1990 2000−0.04
−0.02
0
0.02
0.04
0.06
0.08Growth Rate (Average is 2.26)
1950 1960 1970 1980 1990 20005
10
15
20
25
30Investment/GDP (20.8) and GovtPurchases/GDP (21.9)
1960 1970 1980 1990 20007
8
9
10
11
12Educational Attainment (11.4 years)
1950 1960 1970 1980 1990 2000−5
0
5
10NetExports/GDP ( 5.3) and X+M/GDP ( 89.0)
1950 1960 1970 1980 1990 200040
60
80
100
1950 1960 1970 1980 1990 20004
5
6
7
8
9
10Exchange Rate per Dollar ( 9.16)
180
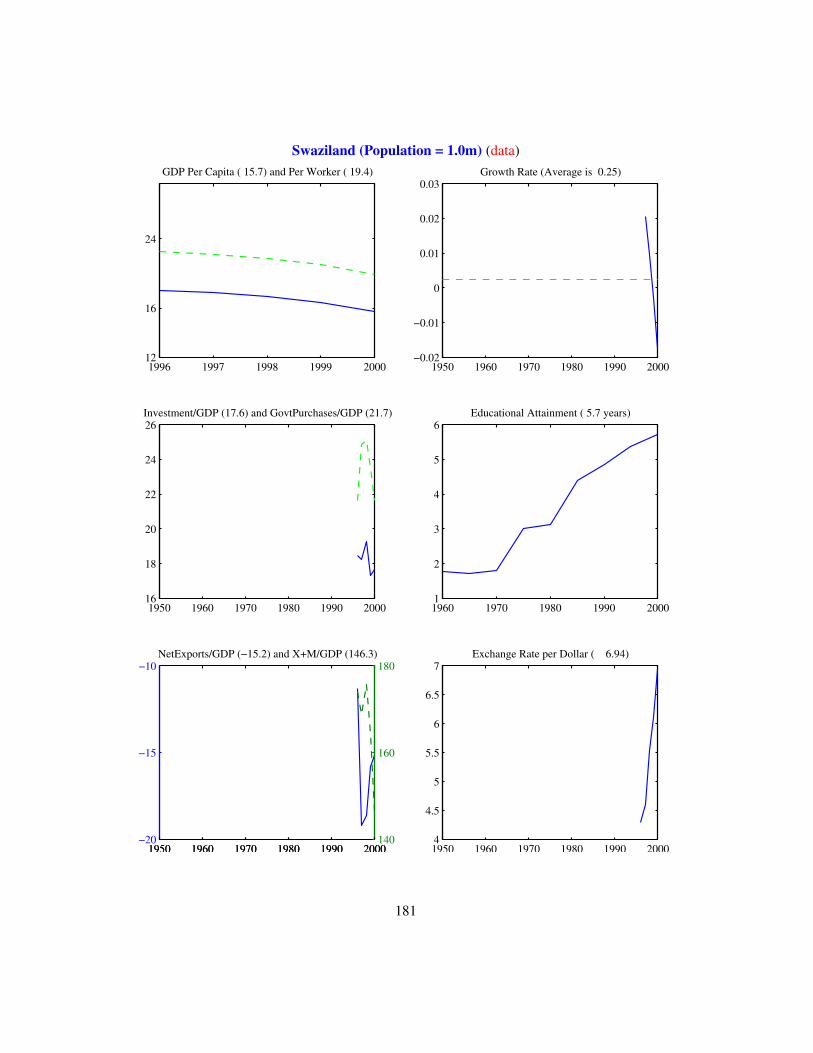
Swaziland (Population = 1.0m) (data)
1996 1997 1998 1999 200012
16
24
GDP Per Capita ( 15.7) and Per Worker ( 19.4)
1950 1960 1970 1980 1990 2000−0.02
−0.01
0
0.01
0.02
0.03Growth Rate (Average is 0.25)
1950 1960 1970 1980 1990 200016
18
20
22
24
26Investment/GDP (17.6) and GovtPurchases/GDP (21.7)
1960 1970 1980 1990 20001
2
3
4
5
6Educational Attainment ( 5.7 years)
1950 1960 1970 1980 1990 2000−20
−15
−10NetExports/GDP (−15.2) and X+M/GDP (146.3)
1950 1960 1970 1980 1990 2000140
160
180
1950 1960 1970 1980 1990 20004
4.5
5
5.5
6
6.5
7Exchange Rate per Dollar ( 6.94)
181
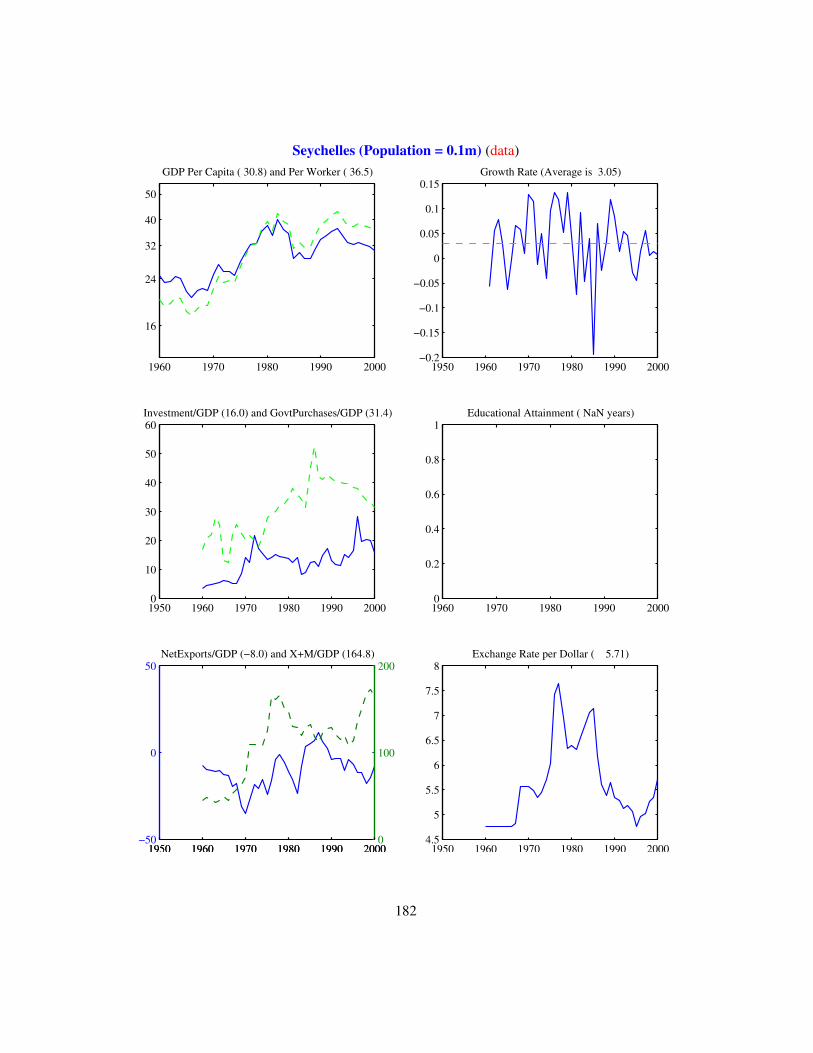
Seychelles (Population = 0.1m) (data)
1960 1970 1980 1990 2000
16
24
32
40
50
GDP Per Capita ( 30.8) and Per Worker ( 36.5)
1950 1960 1970 1980 1990 2000−0.2
−0.15
−0.1
−0.05
0
0.05
0.1
0.15Growth Rate (Average is 3.05)
1950 1960 1970 1980 1990 20000
10
20
30
40
50
60Investment/GDP (16.0) and GovtPurchases/GDP (31.4)
1960 1970 1980 1990 20000
0.2
0.4
0.6
0.8
1Educational Attainment ( NaN years)
1950 1960 1970 1980 1990 2000−50
0
50NetExports/GDP (−8.0) and X+M/GDP (164.8)
1950 1960 1970 1980 1990 20000
100
200
1950 1960 1970 1980 1990 20004.5
5
5.5
6
6.5
7
7.5
8Exchange Rate per Dollar ( 5.71)
182
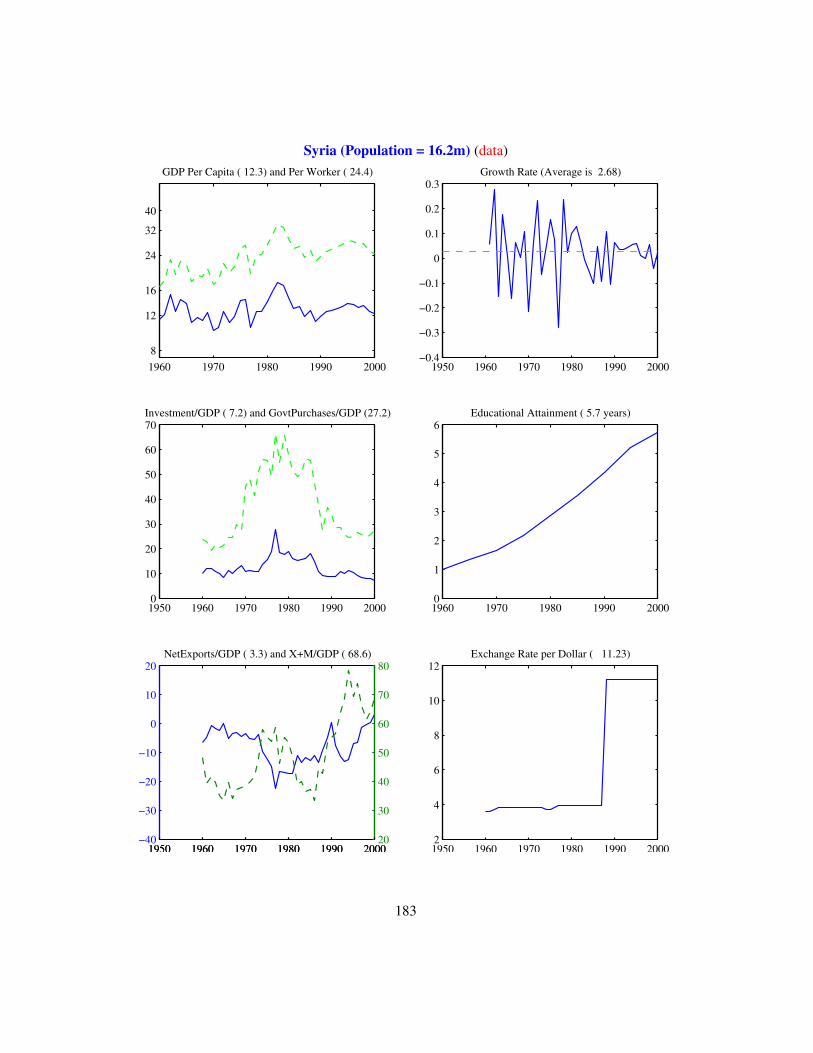
Syria (Population = 16.2m) (data)
1960 1970 1980 1990 2000 8
12
16
24
32
40
GDP Per Capita ( 12.3) and Per Worker ( 24.4)
1950 1960 1970 1980 1990 2000−0.4
−0.3
−0.2
−0.1
0
0.1
0.2
0.3Growth Rate (Average is 2.68)
1950 1960 1970 1980 1990 20000
10
20
30
40
50
60
70Investment/GDP ( 7.2) and GovtPurchases/GDP (27.2)
1960 1970 1980 1990 20000
1
2
3
4
5
6Educational Attainment ( 5.7 years)
1950 1960 1970 1980 1990 2000−40
−30
−20
−10
0
10
20NetExports/GDP ( 3.3) and X+M/GDP ( 68.6)
1950 1960 1970 1980 1990 200020
30
40
50
60
70
80
1950 1960 1970 1980 1990 20002
4
6
8
10
12Exchange Rate per Dollar ( 11.23)
183
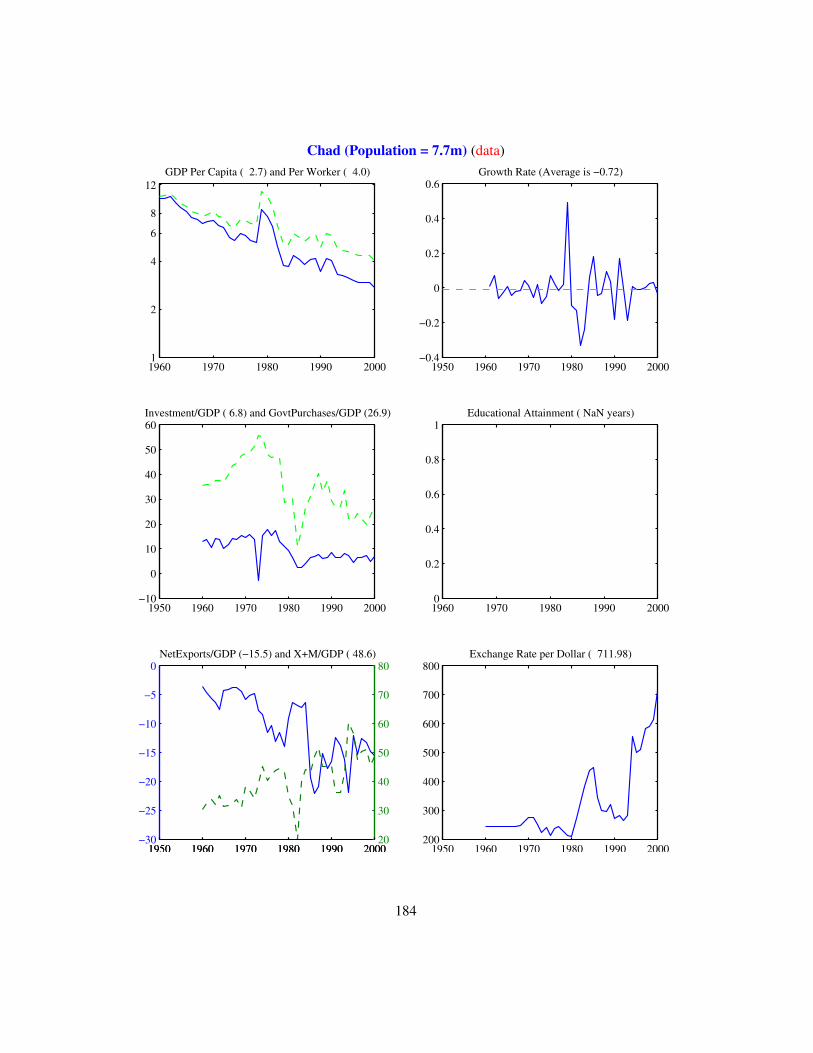
Chad (Population = 7.7m) (data)
1960 1970 1980 1990 2000 1
2
4
6
8
12GDP Per Capita ( 2.7) and Per Worker ( 4.0)
1950 1960 1970 1980 1990 2000−0.4
−0.2
0
0.2
0.4
0.6Growth Rate (Average is −0.72)
1950 1960 1970 1980 1990 2000−10
0
10
20
30
40
50
60Investment/GDP ( 6.8) and GovtPurchases/GDP (26.9)
1960 1970 1980 1990 20000
0.2
0.4
0.6
0.8
1Educational Attainment ( NaN years)
1950 1960 1970 1980 1990 2000−30
−25
−20
−15
−10
−5
0NetExports/GDP (−15.5) and X+M/GDP ( 48.6)
1950 1960 1970 1980 1990 200020
30
40
50
60
70
80
1950 1960 1970 1980 1990 2000200
300
400
500
600
700
800Exchange Rate per Dollar ( 711.98)
184
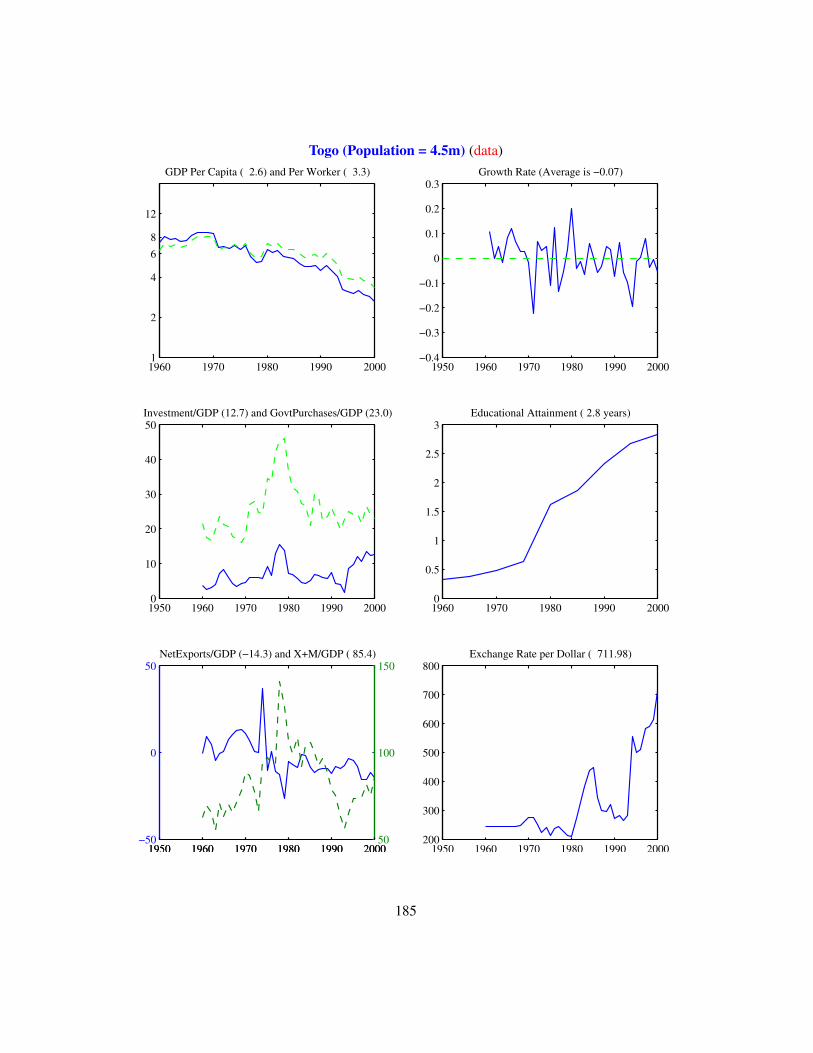
Togo (Population = 4.5m) (data)
1960 1970 1980 1990 2000 1
2
4
6 8
12
GDP Per Capita ( 2.6) and Per Worker ( 3.3)
1950 1960 1970 1980 1990 2000−0.4
−0.3
−0.2
−0.1
0
0.1
0.2
0.3Growth Rate (Average is −0.07)
1950 1960 1970 1980 1990 20000
10
20
30
40
50Investment/GDP (12.7) and GovtPurchases/GDP (23.0)
1960 1970 1980 1990 20000
0.5
1
1.5
2
2.5
3Educational Attainment ( 2.8 years)
1950 1960 1970 1980 1990 2000−50
0
50NetExports/GDP (−14.3) and X+M/GDP ( 85.4)
1950 1960 1970 1980 1990 200050
100
150
1950 1960 1970 1980 1990 2000200
300
400
500
600
700
800Exchange Rate per Dollar ( 711.98)
185
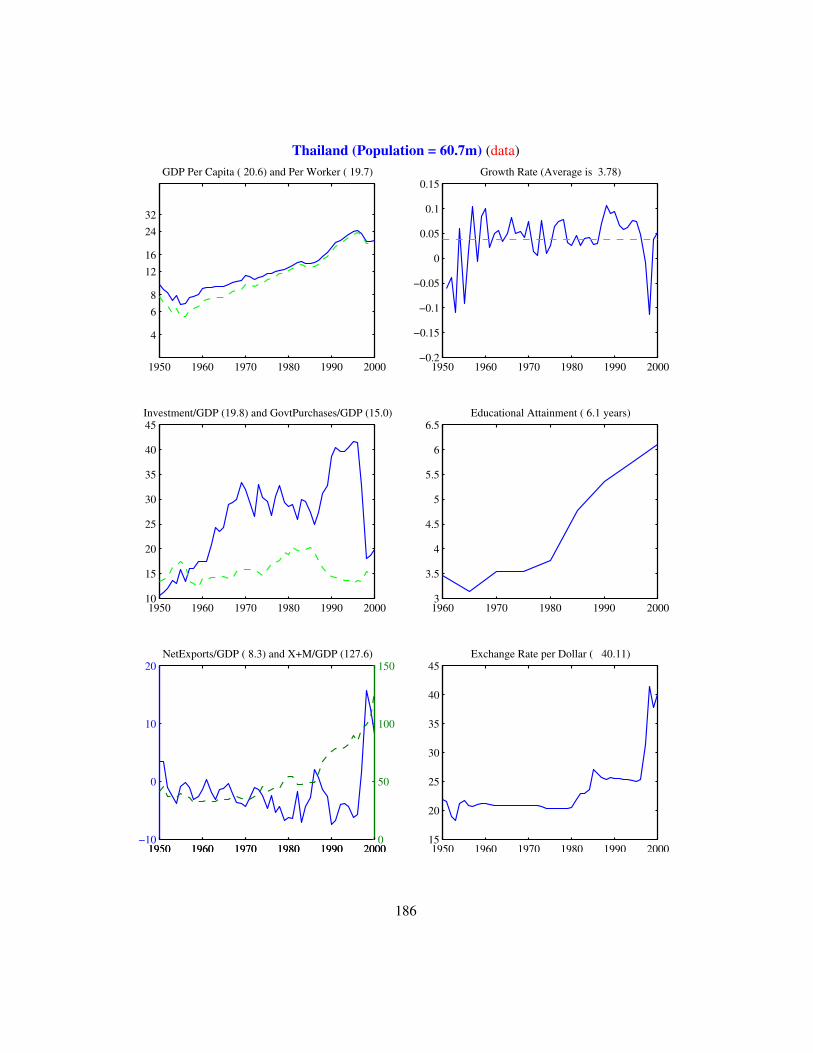
Thailand (Population = 60.7m) (data)
1950 1960 1970 1980 1990 2000
4
6 8
1216
2432
GDP Per Capita ( 20.6) and Per Worker ( 19.7)
1950 1960 1970 1980 1990 2000−0.2
−0.15
−0.1
−0.05
0
0.05
0.1
0.15Growth Rate (Average is 3.78)
1950 1960 1970 1980 1990 200010
15
20
25
30
35
40
45Investment/GDP (19.8) and GovtPurchases/GDP (15.0)
1960 1970 1980 1990 20003
3.5
4
4.5
5
5.5
6
6.5Educational Attainment ( 6.1 years)
1950 1960 1970 1980 1990 2000−10
0
10
20NetExports/GDP ( 8.3) and X+M/GDP (127.6)
1950 1960 1970 1980 1990 20000
50
100
150
1950 1960 1970 1980 1990 200015
20
25
30
35
40
45Exchange Rate per Dollar ( 40.11)
186
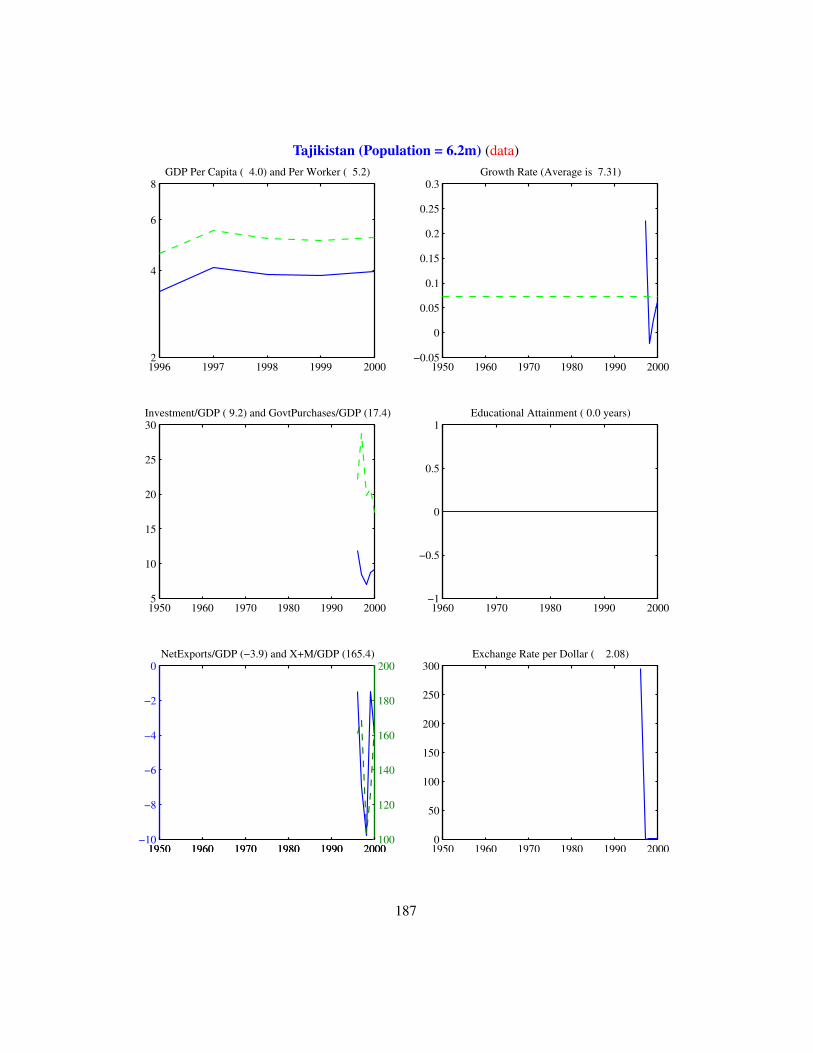
Tajikistan (Population = 6.2m) (data)
1996 1997 1998 1999 20002
4
6
8GDP Per Capita ( 4.0) and Per Worker ( 5.2)
1950 1960 1970 1980 1990 2000−0.05
0
0.05
0.1
0.15
0.2
0.25
0.3Growth Rate (Average is 7.31)
1950 1960 1970 1980 1990 20005
10
15
20
25
30Investment/GDP ( 9.2) and GovtPurchases/GDP (17.4)
1960 1970 1980 1990 2000−1
−0.5
0
0.5
1Educational Attainment ( 0.0 years)
1950 1960 1970 1980 1990 2000−10
−8
−6
−4
−2
0NetExports/GDP (−3.9) and X+M/GDP (165.4)
1950 1960 1970 1980 1990 2000100
120
140
160
180
200
1950 1960 1970 1980 1990 20000
50
100
150
200
250
300Exchange Rate per Dollar ( 2.08)
187
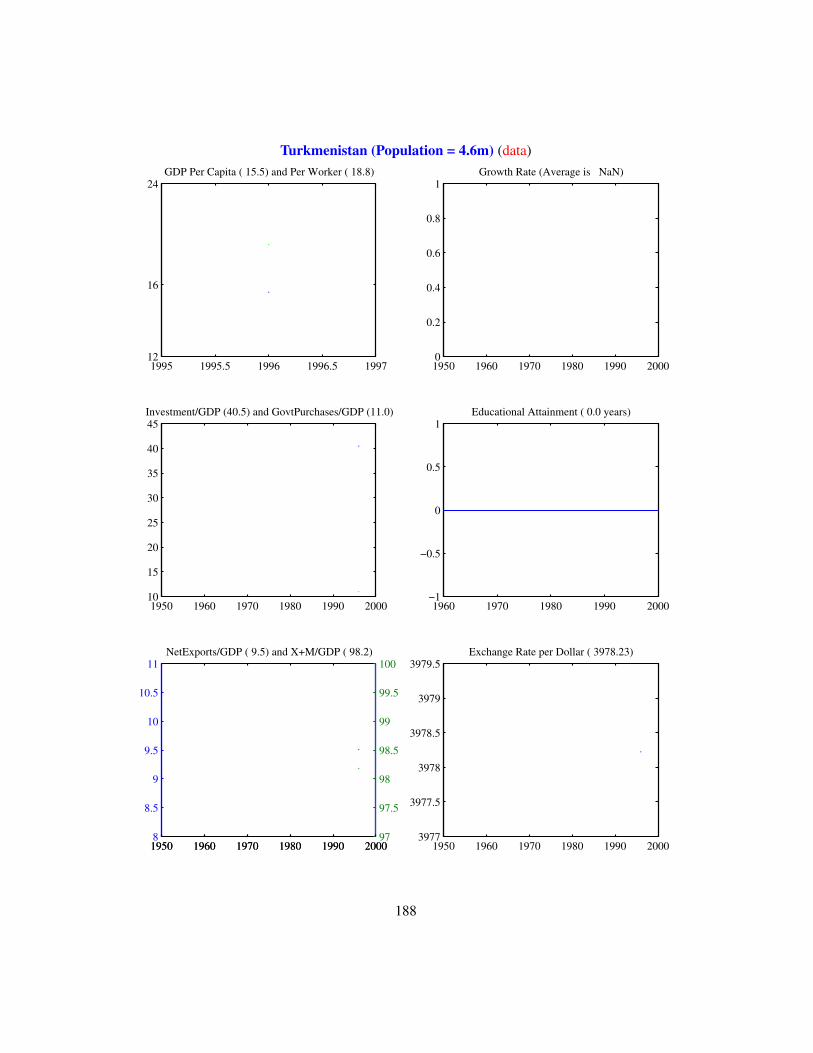
Turkmenistan (Population = 4.6m) (data)
1995 1995.5 1996 1996.5 199712
16
24GDP Per Capita ( 15.5) and Per Worker ( 18.8)
1950 1960 1970 1980 1990 20000
0.2
0.4
0.6
0.8
1Growth Rate (Average is NaN)
1950 1960 1970 1980 1990 200010
15
20
25
30
35
40
45Investment/GDP (40.5) and GovtPurchases/GDP (11.0)
1960 1970 1980 1990 2000−1
−0.5
0
0.5
1Educational Attainment ( 0.0 years)
1950 1960 1970 1980 1990 20008
8.5
9
9.5
10
10.5
11NetExports/GDP ( 9.5) and X+M/GDP ( 98.2)
1950 1960 1970 1980 1990 200097
97.5
98
98.5
99
99.5
100
1950 1960 1970 1980 1990 20003977
3977.5
3978
3978.5
3979
3979.5Exchange Rate per Dollar ( 3978.23)
188

Tonga (Population = 0.0m) (data)
0 0.2 0.4 0.6 0.8 11
GDP Per Capita ( 0.0) and Per Worker ( 0.0)
1950 1960 1970 1980 1990 20000
0.2
0.4
0.6
0.8
1Growth Rate (Average is NaN)
1950 1960 1970 1980 1990 2000−1
−0.5
0
0.5
1Investment/GDP ( 0.0) and GovtPurchases/GDP ( 0.0)
1960 1970 1980 1990 20000
0.2
0.4
0.6
0.8
1Educational Attainment ( NaN years)
1950 1960 1970 1980 1990 200099
99.5
100
100.5
101NetExports/GDP (100.0) and X+M/GDP ( 0.0)
1950 1960 1970 1980 1990 2000−1
−0.5
0
0.5
1
1950 1960 1970 1980 1990 2000−1
−0.5
0
0.5
1Exchange Rate per Dollar ( 0.00)
189

Trinidad &Tobago (Population = 1.3m) (data)
1950 1960 1970 1980 1990 200016
24
32
40
50
607080
GDP Per Capita ( 33.6) and Per Worker ( 41.9)
1950 1960 1970 1980 1990 2000−0.2
−0.1
0
0.1
0.2Growth Rate (Average is 3.09)
1950 1960 1970 1980 1990 20000
5
10
15
20
25
30Investment/GDP ( 8.9) and GovtPurchases/GDP (10.8)
1960 1970 1980 1990 20004
5
6
7
8Educational Attainment ( 7.6 years)
1950 1960 1970 1980 1990 2000−20
−10
0
10
20
30
40NetExports/GDP (12.8) and X+M/GDP (116.2)
1950 1960 1970 1980 1990 200040
60
80
100
120
140
160
1950 1960 1970 1980 1990 20001
2
3
4
5
6
7Exchange Rate per Dollar ( 6.30)
190
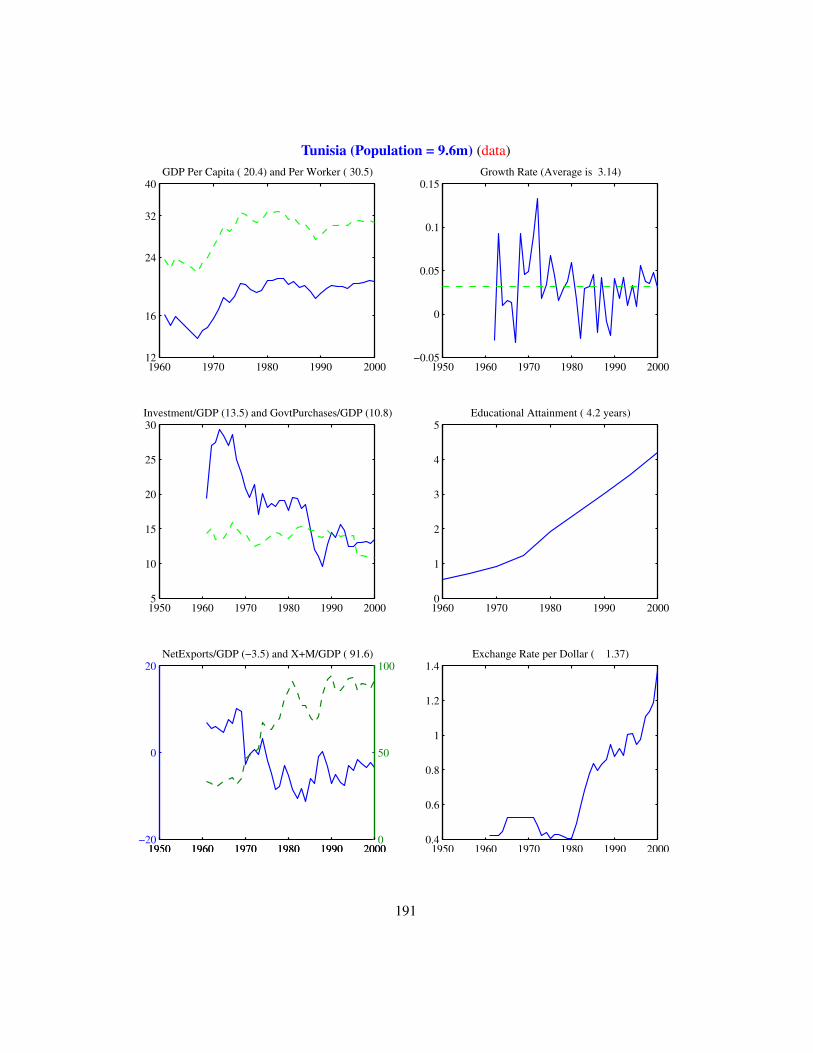
Tunisia (Population = 9.6m) (data)
1960 1970 1980 1990 200012
16
24
32
40GDP Per Capita ( 20.4) and Per Worker ( 30.5)
1950 1960 1970 1980 1990 2000−0.05
0
0.05
0.1
0.15Growth Rate (Average is 3.14)
1950 1960 1970 1980 1990 20005
10
15
20
25
30Investment/GDP (13.5) and GovtPurchases/GDP (10.8)
1960 1970 1980 1990 20000
1
2
3
4
5Educational Attainment ( 4.2 years)
1950 1960 1970 1980 1990 2000−20
0
20NetExports/GDP (−3.5) and X+M/GDP ( 91.6)
1950 1960 1970 1980 1990 20000
50
100
1950 1960 1970 1980 1990 20000.4
0.6
0.8
1
1.2
1.4Exchange Rate per Dollar ( 1.37)
191
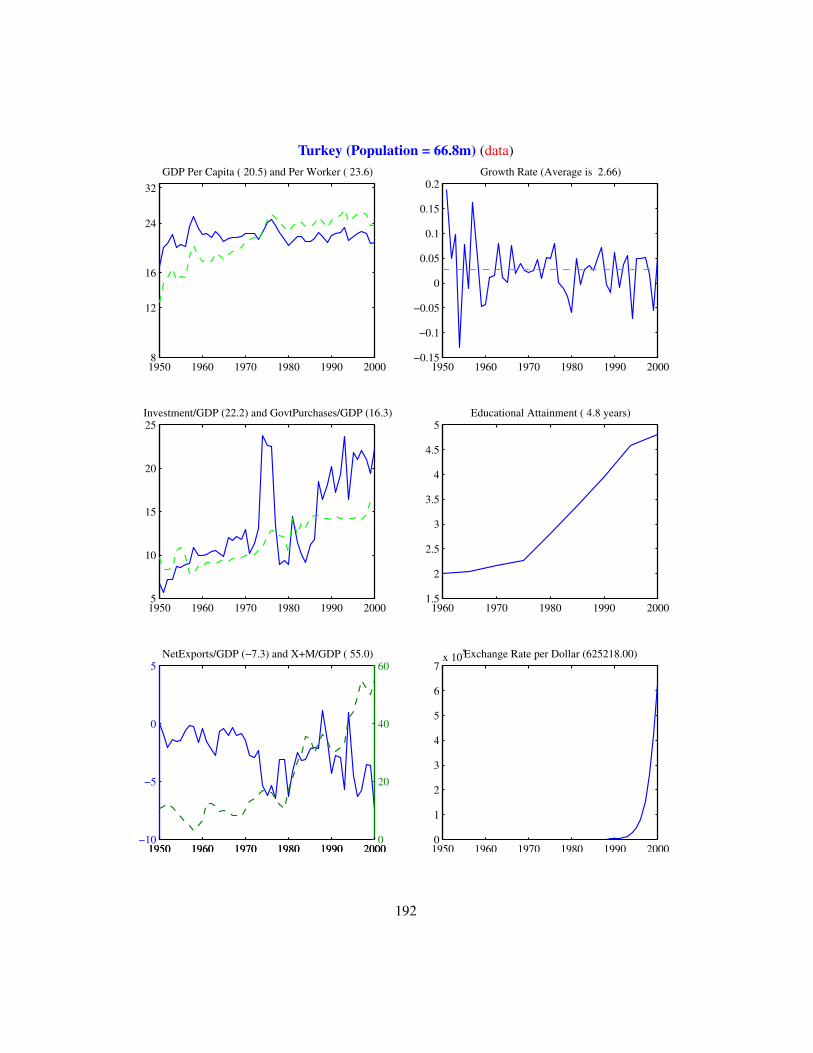
Turkey (Population = 66.8m) (data)
1950 1960 1970 1980 1990 2000 8
12
16
24
32GDP Per Capita ( 20.5) and Per Worker ( 23.6)
1950 1960 1970 1980 1990 2000−0.15
−0.1
−0.05
0
0.05
0.1
0.15
0.2Growth Rate (Average is 2.66)
1950 1960 1970 1980 1990 20005
10
15
20
25Investment/GDP (22.2) and GovtPurchases/GDP (16.3)
1960 1970 1980 1990 20001.5
2
2.5
3
3.5
4
4.5
5Educational Attainment ( 4.8 years)
1950 1960 1970 1980 1990 2000−10
−5
0
5NetExports/GDP (−7.3) and X+M/GDP ( 55.0)
1950 1960 1970 1980 1990 20000
20
40
60
1950 1960 1970 1980 1990 20000
1
2
3
4
5
6
7x 10⁵Exchange Rate per Dollar (625218.00)
192
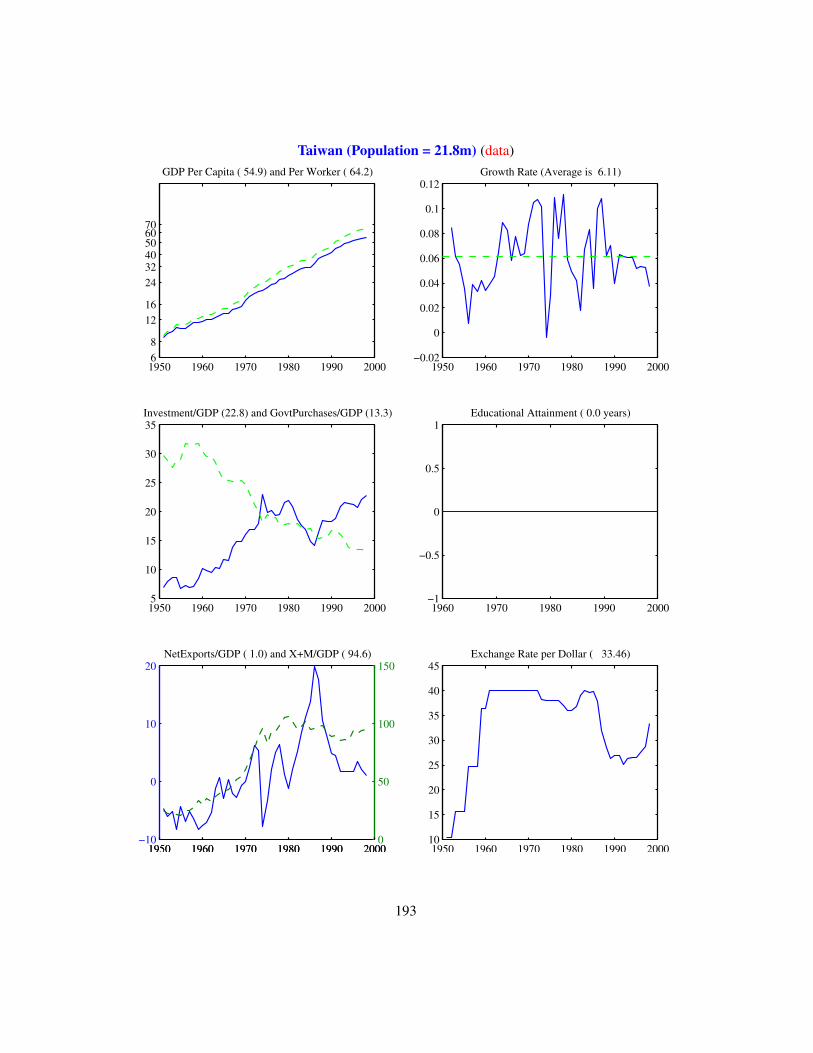
Taiwan (Population = 21.8m) (data)
1950 1960 1970 1980 1990 2000 6 8
1216
243240506070
GDP Per Capita ( 54.9) and Per Worker ( 64.2)
1950 1960 1970 1980 1990 2000−0.02
0
0.02
0.04
0.06
0.08
0.1
0.12Growth Rate (Average is 6.11)
1950 1960 1970 1980 1990 20005
10
15
20
25
30
35Investment/GDP (22.8) and GovtPurchases/GDP (13.3)
1960 1970 1980 1990 2000−1
−0.5
0
0.5
1Educational Attainment ( 0.0 years)
1950 1960 1970 1980 1990 2000−10
0
10
20NetExports/GDP ( 1.0) and X+M/GDP ( 94.6)
1950 1960 1970 1980 1990 20000
50
100
150
1950 1960 1970 1980 1990 200010
15
20
25
30
35
40
45Exchange Rate per Dollar ( 33.46)
193
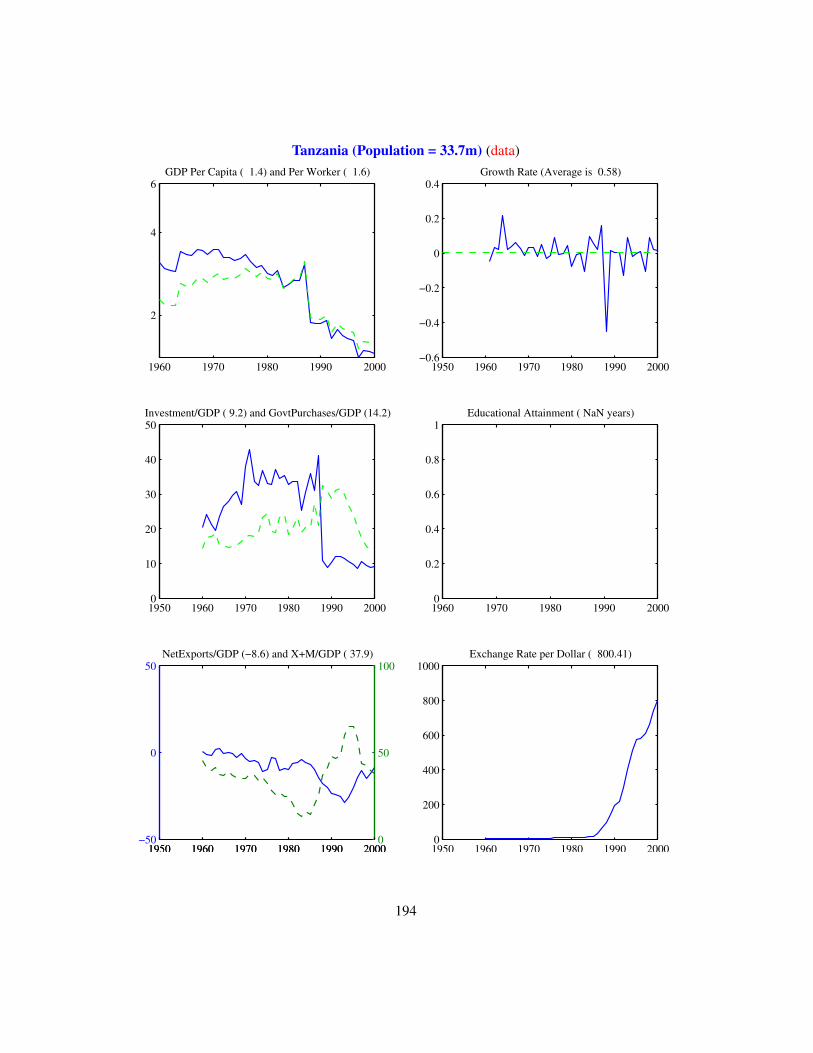
Tanzania (Population = 33.7m) (data)
1960 1970 1980 1990 2000
2
4
6GDP Per Capita ( 1.4) and Per Worker ( 1.6)
1950 1960 1970 1980 1990 2000−0.6
−0.4
−0.2
0
0.2
0.4Growth Rate (Average is 0.58)
1950 1960 1970 1980 1990 20000
10
20
30
40
50Investment/GDP ( 9.2) and GovtPurchases/GDP (14.2)
1960 1970 1980 1990 20000
0.2
0.4
0.6
0.8
1Educational Attainment ( NaN years)
1950 1960 1970 1980 1990 2000−50
0
50NetExports/GDP (−8.6) and X+M/GDP ( 37.9)
1950 1960 1970 1980 1990 20000
50
100
1950 1960 1970 1980 1990 20000
200
400
600
800
1000Exchange Rate per Dollar ( 800.41)
194
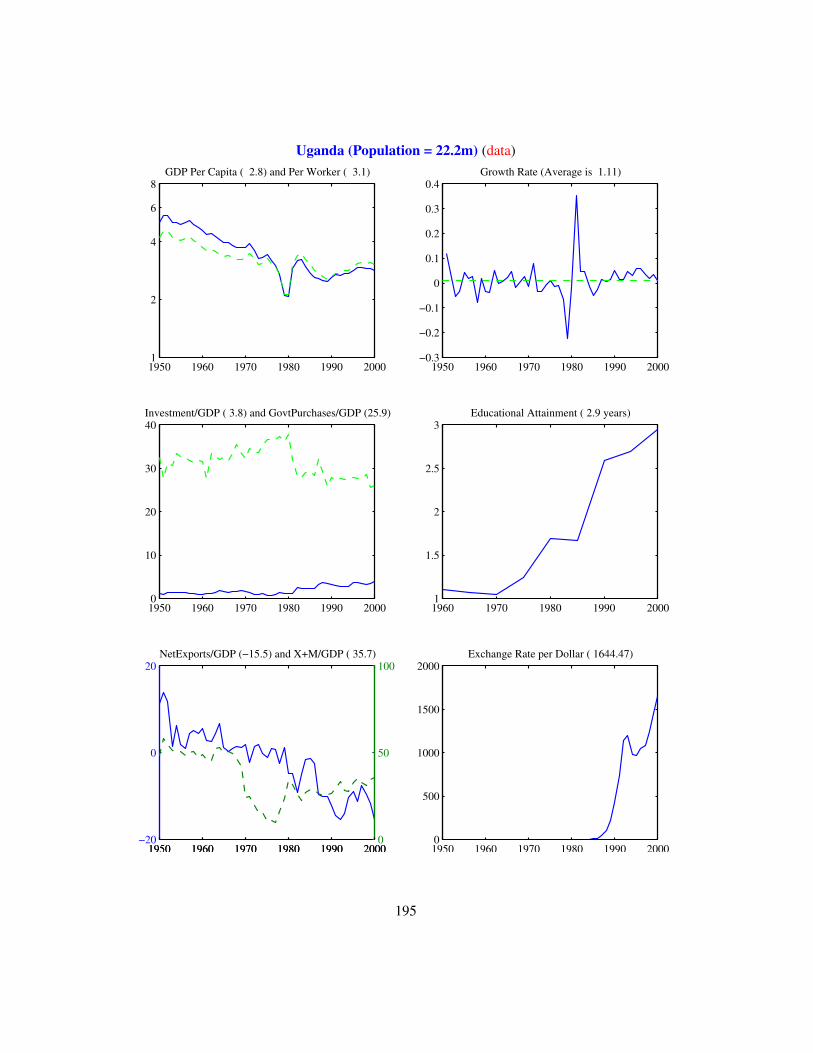
Uganda (Population = 22.2m) (data)
1950 1960 1970 1980 1990 20001
2
4
6
8GDP Per Capita ( 2.8) and Per Worker ( 3.1)
1950 1960 1970 1980 1990 2000−0.3
−0.2
−0.1
0
0.1
0.2
0.3
0.4Growth Rate (Average is 1.11)
1950 1960 1970 1980 1990 20000
10
20
30
40Investment/GDP ( 3.8) and GovtPurchases/GDP (25.9)
1960 1970 1980 1990 20001
1.5
2
2.5
3Educational Attainment ( 2.9 years)
1950 1960 1970 1980 1990 2000−20
0
20NetExports/GDP (−15.5) and X+M/GDP ( 35.7)
1950 1960 1970 1980 1990 20000
50
100
1950 1960 1970 1980 1990 20000
500
1000
1500
2000Exchange Rate per Dollar ( 1644.47)
195
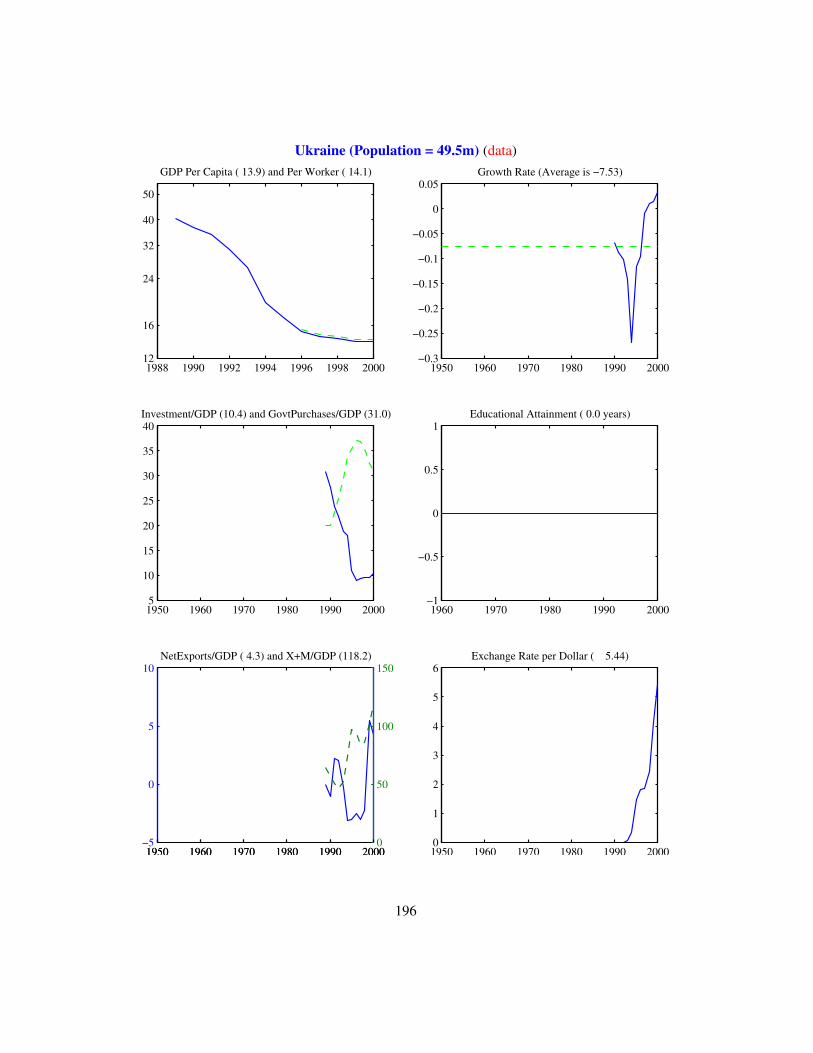
Ukraine (Population = 49.5m) (data)
1988 1990 1992 1994 1996 1998 200012
16
24
32
40
50
GDP Per Capita ( 13.9) and Per Worker ( 14.1)
1950 1960 1970 1980 1990 2000−0.3
−0.25
−0.2
−0.15
−0.1
−0.05
0
0.05Growth Rate (Average is −7.53)
1950 1960 1970 1980 1990 20005
10
15
20
25
30
35
40Investment/GDP (10.4) and GovtPurchases/GDP (31.0)
1960 1970 1980 1990 2000−1
−0.5
0
0.5
1Educational Attainment ( 0.0 years)
1950 1960 1970 1980 1990 2000−5
0
5
10NetExports/GDP ( 4.3) and X+M/GDP (118.2)
1950 1960 1970 1980 1990 20000
50
100
150
1950 1960 1970 1980 1990 20000
1
2
3
4
5
6Exchange Rate per Dollar ( 5.44)
196
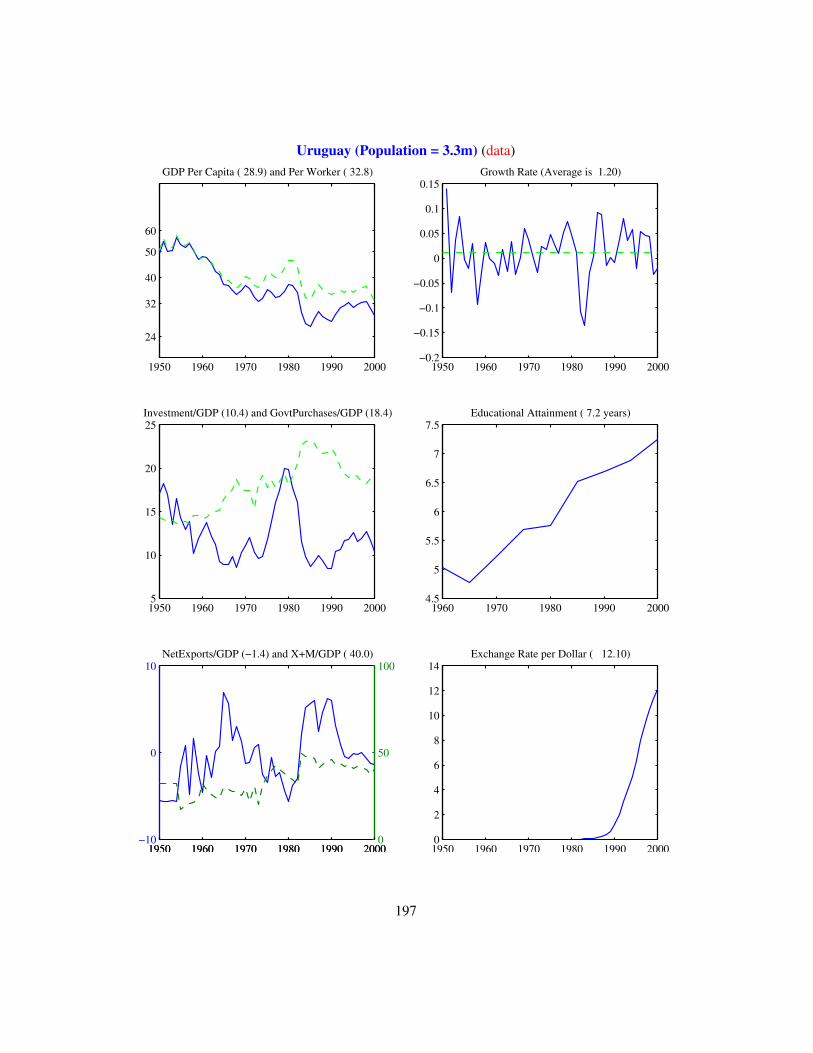
Uruguay (Population = 3.3m) (data)
1950 1960 1970 1980 1990 2000
24
32
40
50
60
GDP Per Capita ( 28.9) and Per Worker ( 32.8)
1950 1960 1970 1980 1990 2000−0.2
−0.15
−0.1
−0.05
0
0.05
0.1
0.15Growth Rate (Average is 1.20)
1950 1960 1970 1980 1990 20005
10
15
20
25Investment/GDP (10.4) and GovtPurchases/GDP (18.4)
1960 1970 1980 1990 20004.5
5
5.5
6
6.5
7
7.5Educational Attainment ( 7.2 years)
1950 1960 1970 1980 1990 2000−10
0
10NetExports/GDP (−1.4) and X+M/GDP ( 40.0)
1950 1960 1970 1980 1990 20000
50
100
1950 1960 1970 1980 1990 20000
2
4
6
8
10
12
14Exchange Rate per Dollar ( 12.10)
197
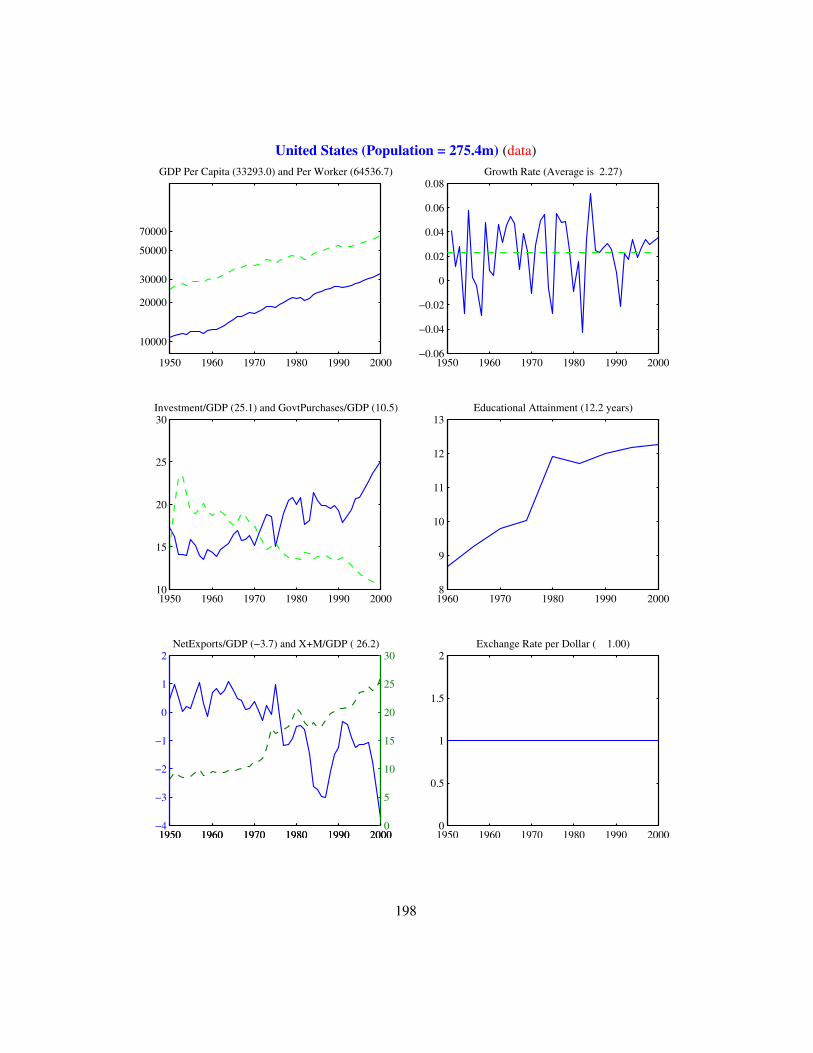
United States (Population = 275.4m) (data)
1950 1960 1970 1980 1990 2000
10000
20000
30000
50000
70000
GDP Per Capita (33293.0) and Per Worker (64536.7)
1950 1960 1970 1980 1990 2000−0.06
−0.04
−0.02
0
0.02
0.04
0.06
0.08Growth Rate (Average is 2.27)
1950 1960 1970 1980 1990 200010
15
20
25
30Investment/GDP (25.1) and GovtPurchases/GDP (10.5)
1960 1970 1980 1990 20008
9
10
11
12
13Educational Attainment (12.2 years)
1950 1960 1970 1980 1990 2000−4
−3
−2
−1
0
1
2NetExports/GDP (−3.7) and X+M/GDP ( 26.2)
1950 1960 1970 1980 1990 20000
5
10
15
20
25
30
1950 1960 1970 1980 1990 20000
0.5
1
1.5
2Exchange Rate per Dollar ( 1.00)
198
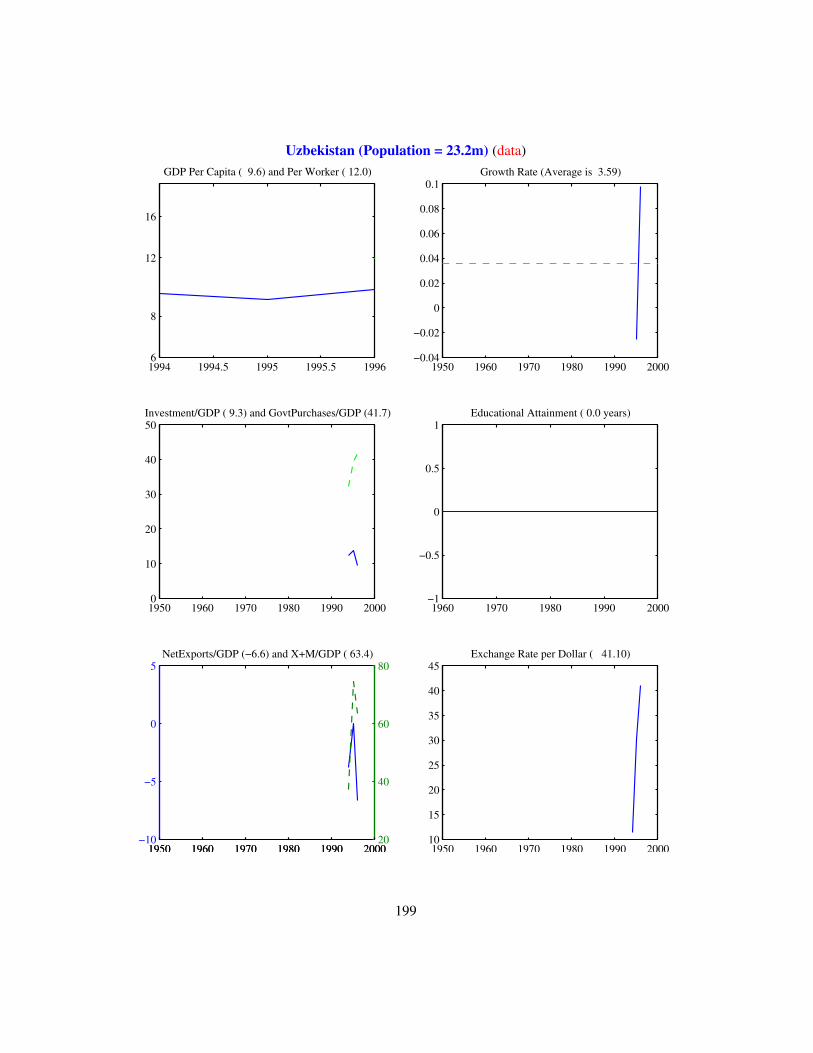
Uzbekistan (Population = 23.2m) (data)
1994 1994.5 1995 1995.5 1996 6
8
12
16
GDP Per Capita ( 9.6) and Per Worker ( 12.0)
1950 1960 1970 1980 1990 2000−0.04
−0.02
0
0.02
0.04
0.06
0.08
0.1Growth Rate (Average is 3.59)
1950 1960 1970 1980 1990 20000
10
20
30
40
50Investment/GDP ( 9.3) and GovtPurchases/GDP (41.7)
1960 1970 1980 1990 2000−1
−0.5
0
0.5
1Educational Attainment ( 0.0 years)
1950 1960 1970 1980 1990 2000−10
−5
0
5NetExports/GDP (−6.6) and X+M/GDP ( 63.4)
1950 1960 1970 1980 1990 200020
40
60
80
1950 1960 1970 1980 1990 200010
15
20
25
30
35
40
45Exchange Rate per Dollar ( 41.10)
199
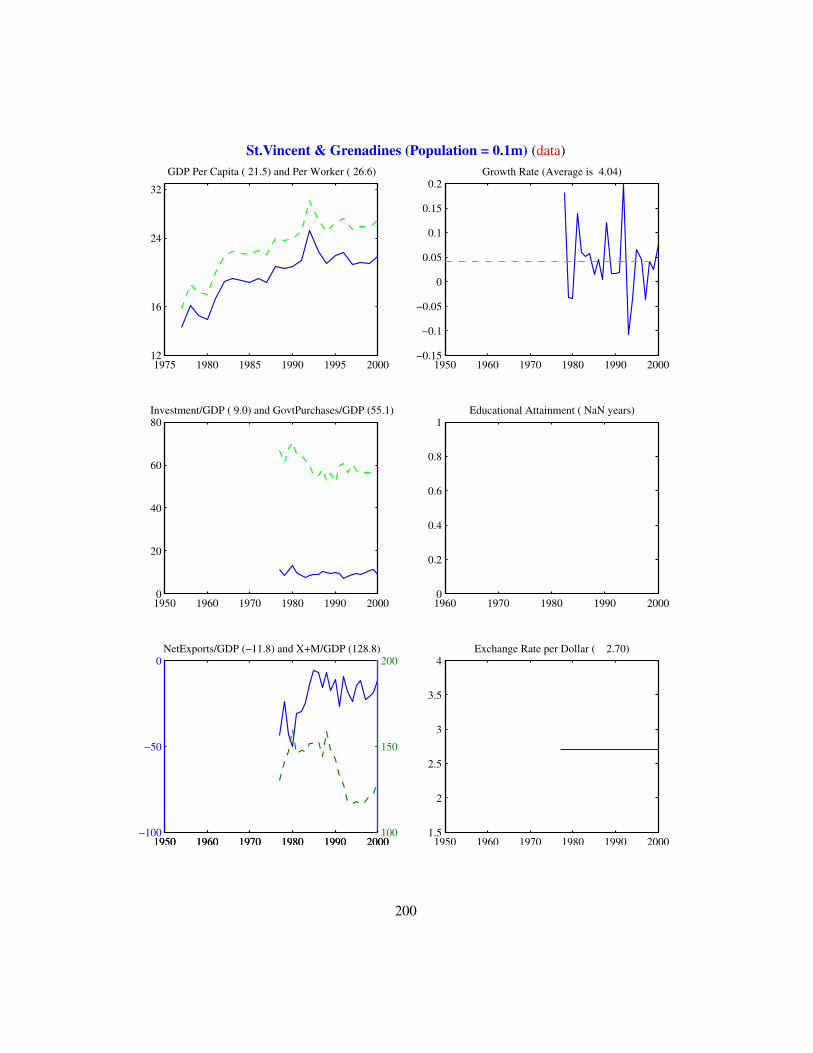
St.Vincent & Grenadines (Population = 0.1m) (data)
1975 1980 1985 1990 1995 200012
16
24
32
GDP Per Capita ( 21.5) and Per Worker ( 26.6)
1950 1960 1970 1980 1990 2000−0.15
−0.1
−0.05
0
0.05
0.1
0.15
0.2Growth Rate (Average is 4.04)
1950 1960 1970 1980 1990 20000
20
40
60
80Investment/GDP ( 9.0) and GovtPurchases/GDP (55.1)
1960 1970 1980 1990 20000
0.2
0.4
0.6
0.8
1Educational Attainment ( NaN years)
1950 1960 1970 1980 1990 2000−100
−50
0NetExports/GDP (−11.8) and X+M/GDP (128.8)
1950 1960 1970 1980 1990 2000100
150
200
1950 1960 1970 1980 1990 20001.5
2
2.5
3
3.5
4Exchange Rate per Dollar ( 2.70)
200
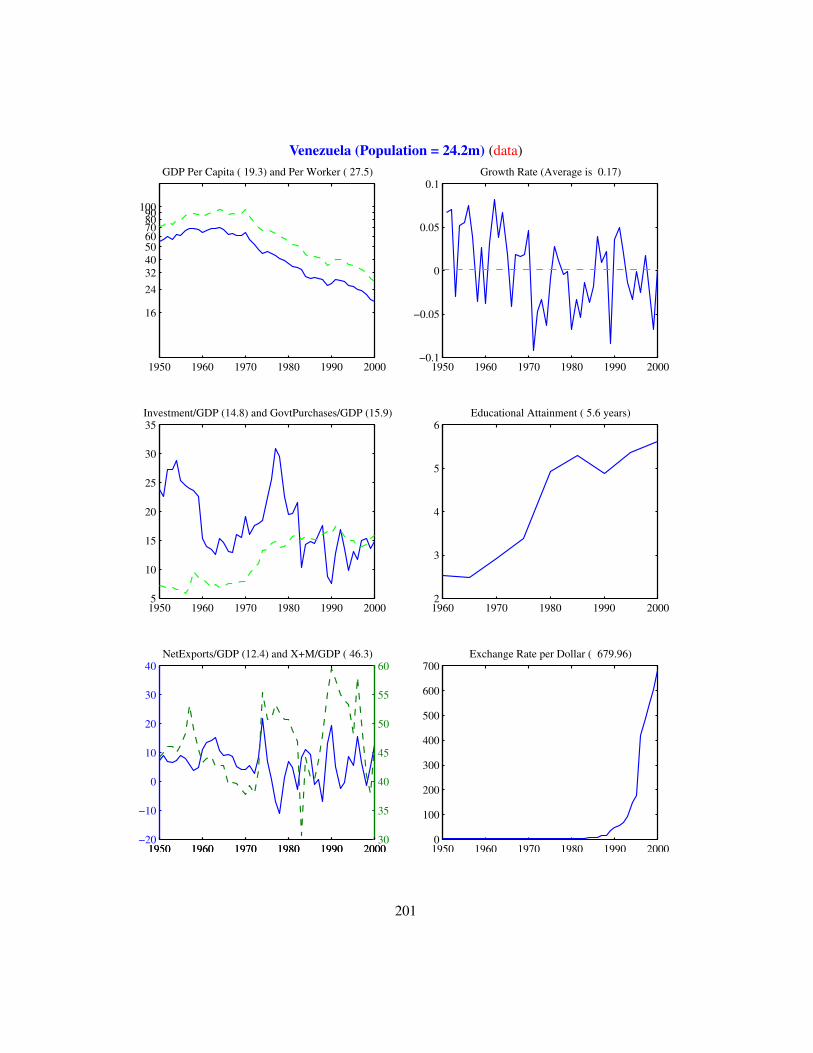
Venezuela (Population = 24.2m) (data)
1950 1960 1970 1980 1990 2000
16
24 32 40 50 60 70 80 90100
GDP Per Capita ( 19.3) and Per Worker ( 27.5)
1950 1960 1970 1980 1990 2000−0.1
−0.05
0
0.05
0.1Growth Rate (Average is 0.17)
1950 1960 1970 1980 1990 20005
10
15
20
25
30
35Investment/GDP (14.8) and GovtPurchases/GDP (15.9)
1960 1970 1980 1990 20002
3
4
5
6Educational Attainment ( 5.6 years)
1950 1960 1970 1980 1990 2000−20
−10
0
10
20
30
40NetExports/GDP (12.4) and X+M/GDP ( 46.3)
1950 1960 1970 1980 1990 200030
35
40
45
50
55
60
1950 1960 1970 1980 1990 20000
100
200
300
400
500
600
700Exchange Rate per Dollar ( 679.96)
201
Virgin Islands (U.S.) (Population = 0.0m) (data)
0 0.2 0.4 0.6 0.8 11
GDP Per Capita ( 0.0) and Per Worker ( 0.0)
1950 1960 1970 1980 1990 20000
0.2
0.4
0.6
0.8
1Growth Rate (Average is NaN)
1950 1960 1970 1980 1990 2000−1
−0.5
0
0.5
1Investment/GDP ( 0.0) and GovtPurchases/GDP ( 0.0)
1960 1970 1980 1990 2000−1
−0.5
0
0.5
1Educational Attainment ( 0.0 years)
1950 1960 1970 1980 1990 200099
99.5
100
100.5
101NetExports/GDP (100.0) and X+M/GDP ( 0.0)
1950 1960 1970 1980 1990 2000−1
−0.5
0
0.5
1
1950 1960 1970 1980 1990 2000−1
−0.5
0
0.5
1Exchange Rate per Dollar ( 0.00)
202
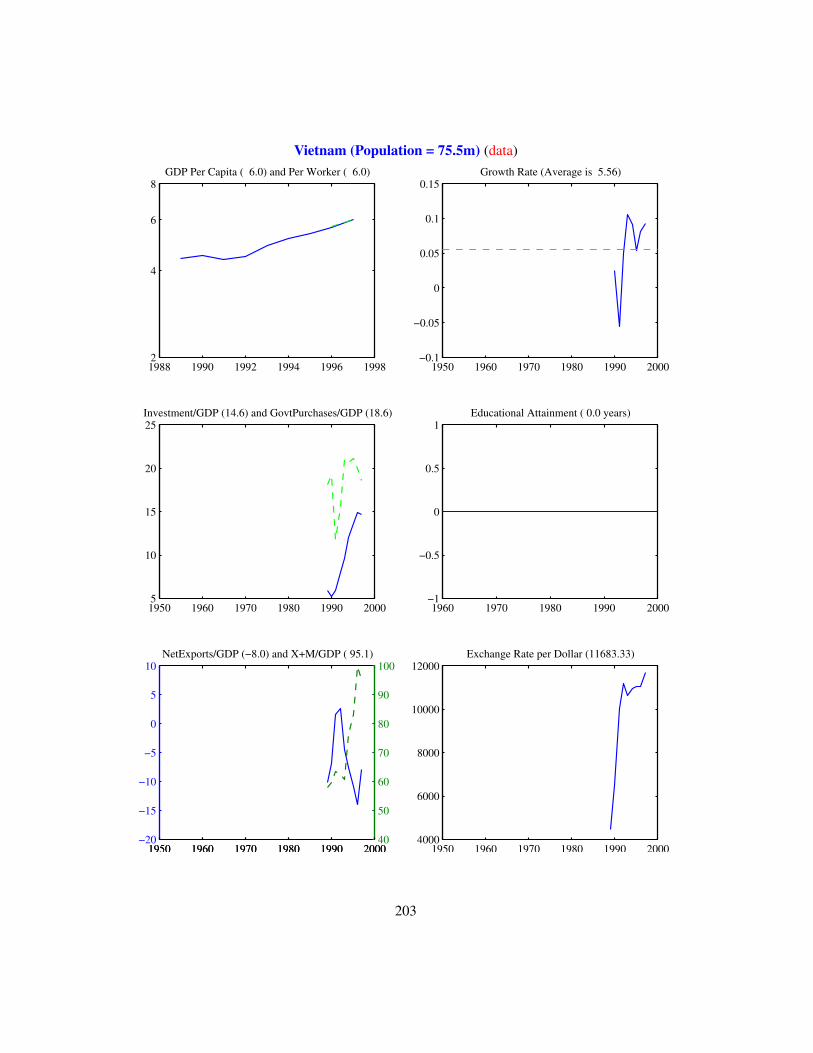
Vietnam (Population = 75.5m) (data)
1988 1990 1992 1994 1996 19982
4
6
8GDP Per Capita ( 6.0) and Per Worker ( 6.0)
1950 1960 1970 1980 1990 2000−0.1
−0.05
0
0.05
0.1
0.15Growth Rate (Average is 5.56)
1950 1960 1970 1980 1990 20005
10
15
20
25Investment/GDP (14.6) and GovtPurchases/GDP (18.6)
1960 1970 1980 1990 2000−1
−0.5
0
0.5
1Educational Attainment ( 0.0 years)
1950 1960 1970 1980 1990 2000−20
−15
−10
−5
0
5
10NetExports/GDP (−8.0) and X+M/GDP ( 95.1)
1950 1960 1970 1980 1990 200040
50
60
70
80
90
100
1950 1960 1970 1980 1990 20004000
6000
8000
10000
12000Exchange Rate per Dollar (11683.33)
203
Vanuatu (Population = 0.0m) (data)
0 0.2 0.4 0.6 0.8 11
GDP Per Capita ( 0.0) and Per Worker ( 0.0)
1950 1960 1970 1980 1990 20000
0.2
0.4
0.6
0.8
1Growth Rate (Average is NaN)
1950 1960 1970 1980 1990 2000−1
−0.5
0
0.5
1Investment/GDP ( 0.0) and GovtPurchases/GDP ( 0.0)
1960 1970 1980 1990 20000
0.2
0.4
0.6
0.8
1Educational Attainment ( NaN years)
1950 1960 1970 1980 1990 200099
99.5
100
100.5
101NetExports/GDP (100.0) and X+M/GDP ( 0.0)
1950 1960 1970 1980 1990 2000−1
−0.5
0
0.5
1
1950 1960 1970 1980 1990 2000−1
−0.5
0
0.5
1Exchange Rate per Dollar ( 0.00)
204
West Bank and Gaza (Population = 0.0m) (data)
0 0.2 0.4 0.6 0.8 11
GDP Per Capita ( 0.0) and Per Worker ( 0.0)
1950 1960 1970 1980 1990 20000
0.2
0.4
0.6
0.8
1Growth Rate (Average is NaN)
1950 1960 1970 1980 1990 2000−1
−0.5
0
0.5
1Investment/GDP ( 0.0) and GovtPurchases/GDP ( 0.0)
1960 1970 1980 1990 2000−1
−0.5
0
0.5
1Educational Attainment ( 0.0 years)
1950 1960 1970 1980 1990 200099
99.5
100
100.5
101NetExports/GDP (100.0) and X+M/GDP ( 0.0)
1950 1960 1970 1980 1990 2000−1
−0.5
0
0.5
1
1950 1960 1970 1980 1990 2000−1
−0.5
0
0.5
1Exchange Rate per Dollar ( 0.00)
205

Samoa (Population = 0.0m) (data)
0 0.2 0.4 0.6 0.8 11
GDP Per Capita ( 0.0) and Per Worker ( 0.0)
1950 1960 1970 1980 1990 20000
0.2
0.4
0.6
0.8
1Growth Rate (Average is NaN)
1950 1960 1970 1980 1990 2000−1
−0.5
0
0.5
1Investment/GDP ( 0.0) and GovtPurchases/GDP ( 0.0)
1960 1970 1980 1990 20000
0.2
0.4
0.6
0.8
1Educational Attainment ( NaN years)
1950 1960 1970 1980 1990 200099
99.5
100
100.5
101NetExports/GDP (100.0) and X+M/GDP ( 0.0)
1950 1960 1970 1980 1990 2000−1
−0.5
0
0.5
1
1950 1960 1970 1980 1990 2000−1
−0.5
0
0.5
1Exchange Rate per Dollar ( 0.00)
206
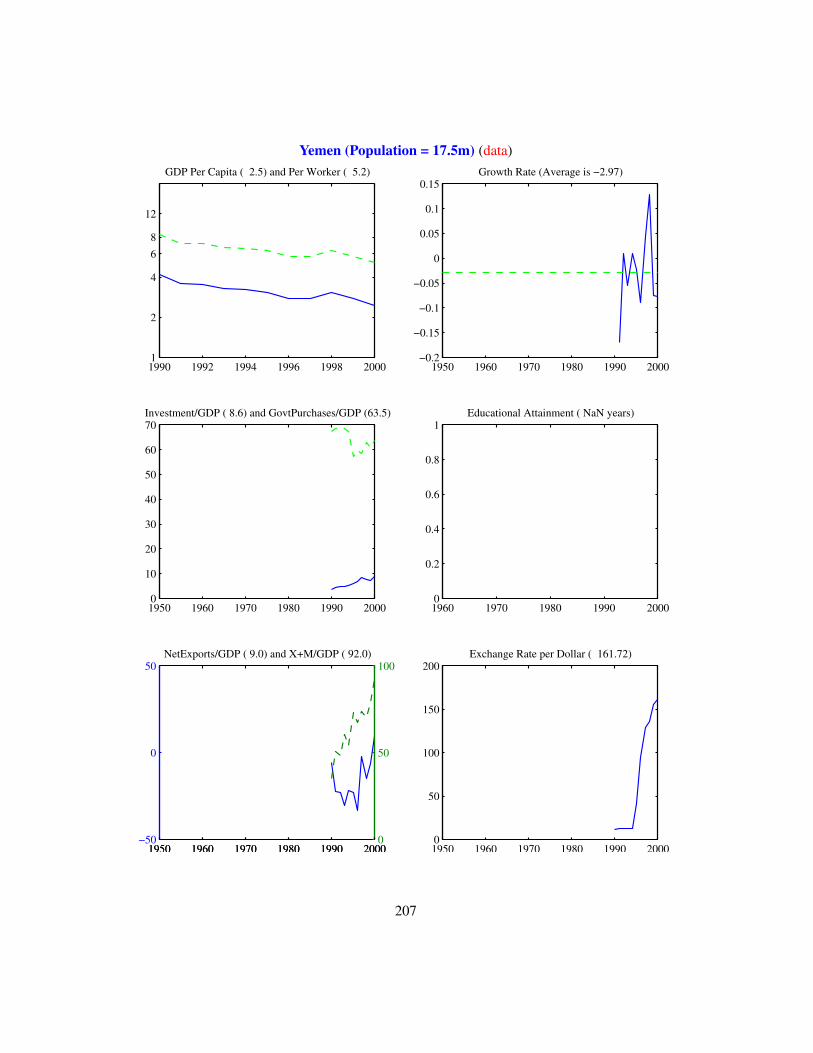
Yemen (Population = 17.5m) (data)
1990 1992 1994 1996 1998 2000 1
2
4
6 8
12
GDP Per Capita ( 2.5) and Per Worker ( 5.2)
1950 1960 1970 1980 1990 2000−0.2
−0.15
−0.1
−0.05
0
0.05
0.1
0.15Growth Rate (Average is −2.97)
1950 1960 1970 1980 1990 20000
10
20
30
40
50
60
70Investment/GDP ( 8.6) and GovtPurchases/GDP (63.5)
1960 1970 1980 1990 20000
0.2
0.4
0.6
0.8
1Educational Attainment ( NaN years)
1950 1960 1970 1980 1990 2000−50
0
50NetExports/GDP ( 9.0) and X+M/GDP ( 92.0)
1950 1960 1970 1980 1990 20000
50
100
1950 1960 1970 1980 1990 20000
50
100
150
200Exchange Rate per Dollar ( 161.72)
207
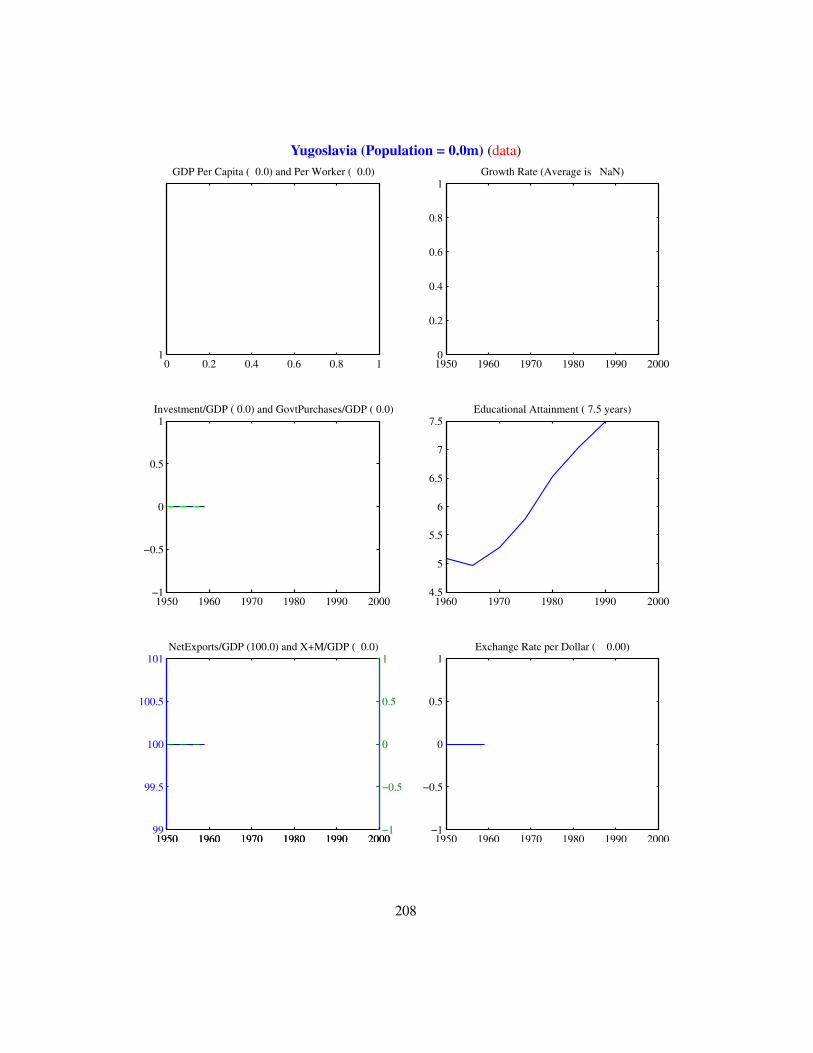
Yugoslavia (Population = 0.0m) (data)
0 0.2 0.4 0.6 0.8 11
GDP Per Capita ( 0.0) and Per Worker ( 0.0)
1950 1960 1970 1980 1990 20000
0.2
0.4
0.6
0.8
1Growth Rate (Average is NaN)
1950 1960 1970 1980 1990 2000−1
−0.5
0
0.5
1Investment/GDP ( 0.0) and GovtPurchases/GDP ( 0.0)
1960 1970 1980 1990 20004.5
5
5.5
6
6.5
7
7.5Educational Attainment ( 7.5 years)
1950 1960 1970 1980 1990 200099
99.5
100
100.5
101NetExports/GDP (100.0) and X+M/GDP ( 0.0)
1950 1960 1970 1980 1990 2000−1
−0.5
0
0.5
1
1950 1960 1970 1980 1990 2000−1
−0.5
0
0.5
1Exchange Rate per Dollar ( 0.00)
208
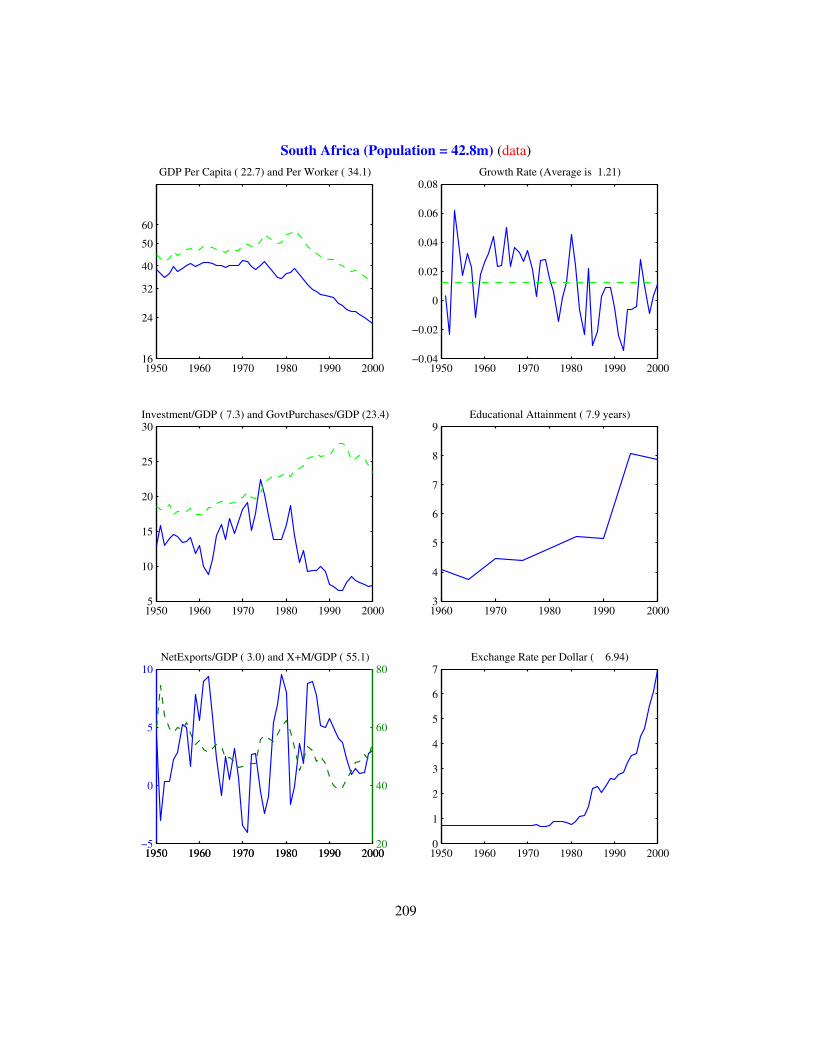
South Africa (Population = 42.8m) (data)
1950 1960 1970 1980 1990 200016
24
32
40
50
60
GDP Per Capita ( 22.7) and Per Worker ( 34.1)
1950 1960 1970 1980 1990 2000−0.04
−0.02
0
0.02
0.04
0.06
0.08Growth Rate (Average is 1.21)
1950 1960 1970 1980 1990 20005
10
15
20
25
30Investment/GDP ( 7.3) and GovtPurchases/GDP (23.4)
1960 1970 1980 1990 20003
4
5
6
7
8
9Educational Attainment ( 7.9 years)
1950 1960 1970 1980 1990 2000−5
0
5
10NetExports/GDP ( 3.0) and X+M/GDP ( 55.1)
1950 1960 1970 1980 1990 200020
40
60
80
1950 1960 1970 1980 1990 20000
1
2
3
4
5
6
7Exchange Rate per Dollar ( 6.94)
209
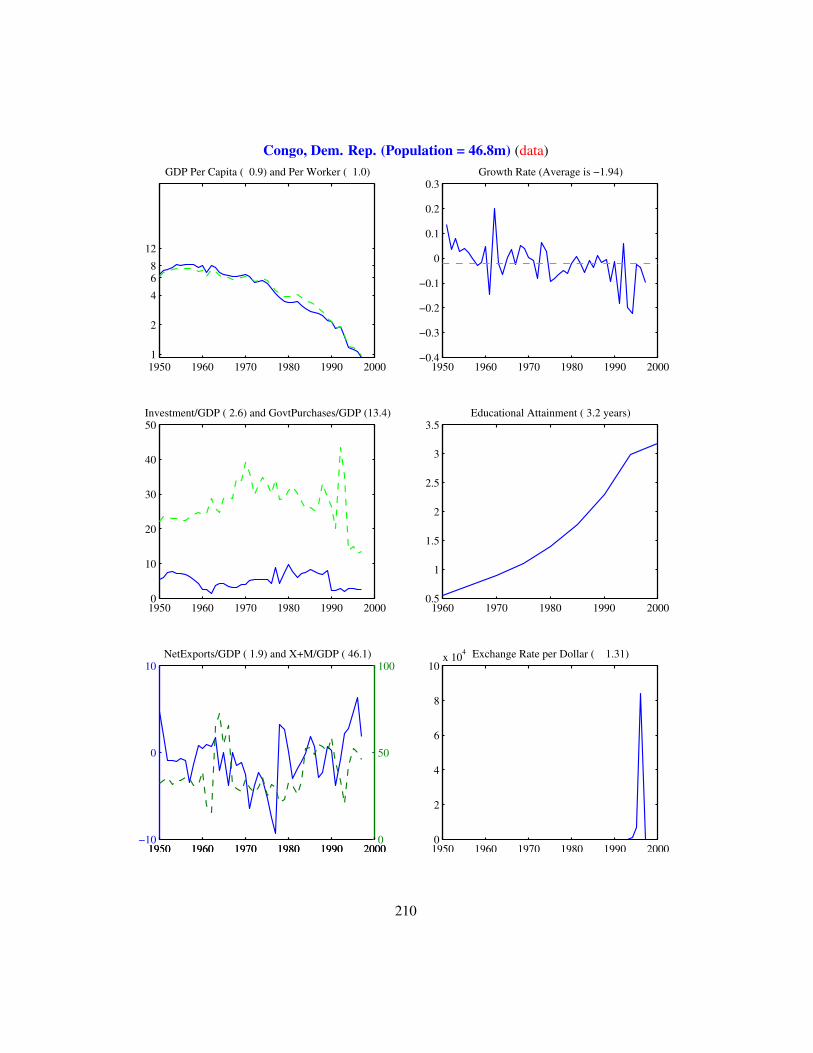
Congo, Dem. Rep. (Population = 46.8m) (data)
1950 1960 1970 1980 1990 2000 1
2
4
6 8
12
GDP Per Capita ( 0.9) and Per Worker ( 1.0)
1950 1960 1970 1980 1990 2000−0.4
−0.3
−0.2
−0.1
0
0.1
0.2
0.3Growth Rate (Average is −1.94)
1950 1960 1970 1980 1990 20000
10
20
30
40
50Investment/GDP ( 2.6) and GovtPurchases/GDP (13.4)
1960 1970 1980 1990 20000.5
1
1.5
2
2.5
3
3.5Educational Attainment ( 3.2 years)
1950 1960 1970 1980 1990 2000−10
0
10NetExports/GDP ( 1.9) and X+M/GDP ( 46.1)
1950 1960 1970 1980 1990 20000
50
100
1950 1960 1970 1980 1990 20000
2
4
6
8
10x 104 Exchange Rate per Dollar ( 1.31)
210
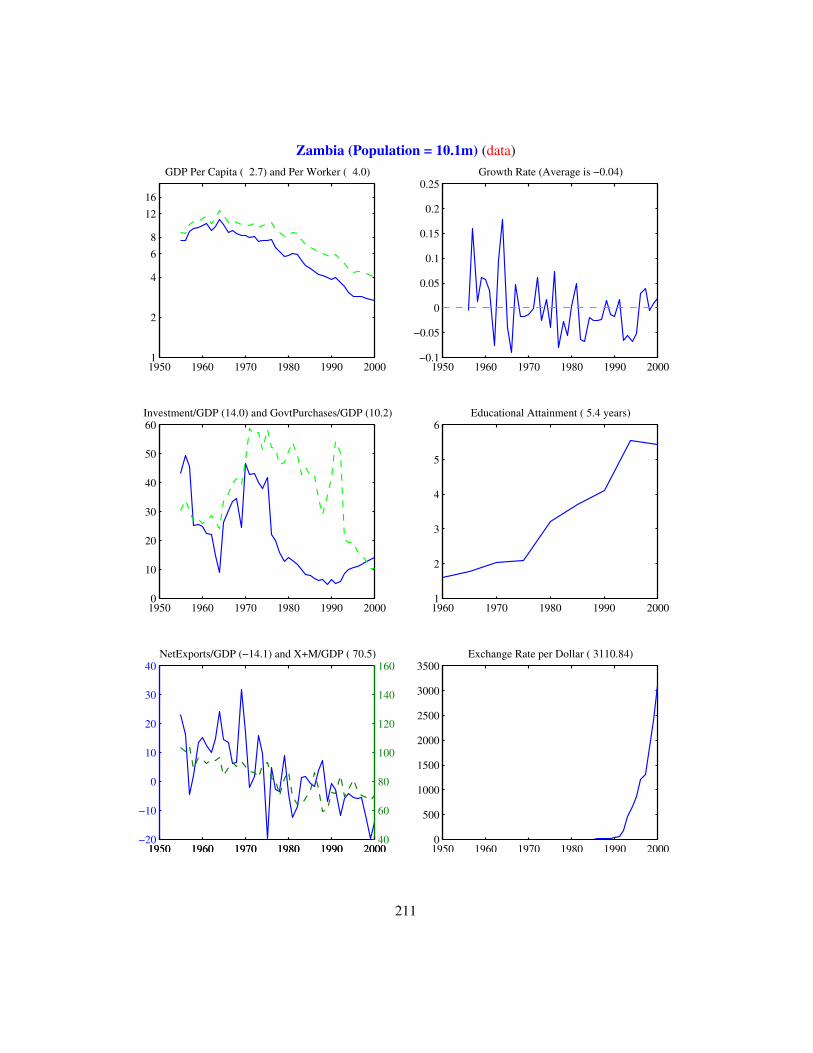
Zambia (Population = 10.1m) (data)
1950 1960 1970 1980 1990 2000 1
2
4
6 8
1216
GDP Per Capita ( 2.7) and Per Worker ( 4.0)
1950 1960 1970 1980 1990 2000−0.1
−0.05
0
0.05
0.1
0.15
0.2
0.25Growth Rate (Average is −0.04)
1950 1960 1970 1980 1990 20000
10
20
30
40
50
60Investment/GDP (14.0) and GovtPurchases/GDP (10.2)
1960 1970 1980 1990 20001
2
3
4
5
6Educational Attainment ( 5.4 years)
1950 1960 1970 1980 1990 2000−20
−10
0
10
20
30
40NetExports/GDP (−14.1) and X+M/GDP ( 70.5)
1950 1960 1970 1980 1990 200040
60
80
100
120
140
160
1950 1960 1970 1980 1990 20000
500
1000
1500
2000
2500
3000
3500Exchange Rate per Dollar ( 3110.84)
211
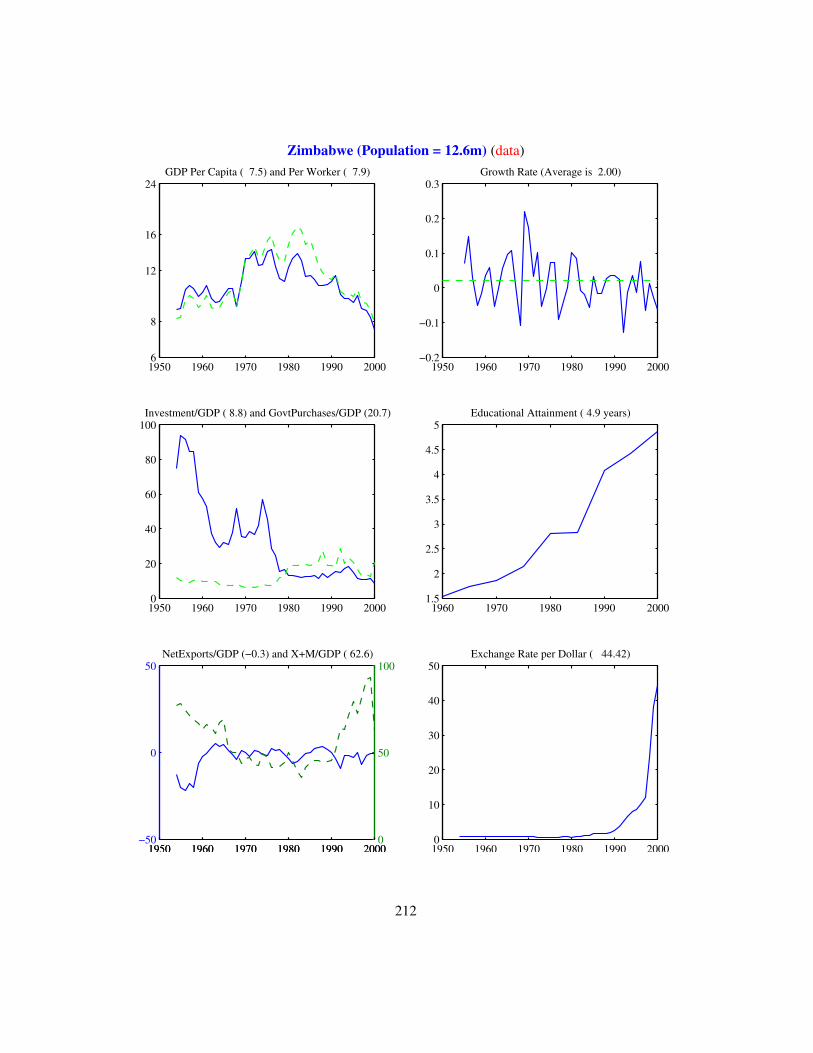
Zimbabwe (Population = 12.6m) (data)
1950 1960 1970 1980 1990 2000 6
8
12
16
24GDP Per Capita ( 7.5) and Per Worker ( 7.9)
1950 1960 1970 1980 1990 2000−0.2
−0.1
0
0.1
0.2
0.3Growth Rate (Average is 2.00)
1950 1960 1970 1980 1990 20000
20
40
60
80
100Investment/GDP ( 8.8) and GovtPurchases/GDP (20.7)
1960 1970 1980 1990 20001.5
2
2.5
3
3.5
4
4.5
5Educational Attainment ( 4.9 years)
1950 1960 1970 1980 1990 2000−50
0
50NetExports/GDP (−0.3) and X+M/GDP ( 62.6)
1950 1960 1970 1980 1990 20000
50
100
1950 1960 1970 1980 1990 20000
10
20
30
40
50Exchange Rate per Dollar ( 44.42)
212