Embed Size (px)
Citation preview

1
MH BOUCHET/Skema (c) 2013
Country risk, Financial crisis,
and Debt Analysis I
October –December 2013
Michel Henry Bouchet
www.developingfinance.org
1
Bibliography
Daniel Wagner, Country risk, Managing Country risk, NY 2012
Bouchet, Clark, Groslambert: (Wiley, NY)
Bouchet, Guilhon: Intelligence Economique et Gestion des
Risques (Paris: Pearson)
Reinhart C., Rogoff K.: This time it’s different (Princeton,
2009)
Paris Club 2013
IIF 2013
IMF, annual report 2013
BIS reports 2013
C-Bonds website
MH BOUCHET/Skema (c) 2013 2
MH BOUCHET/Skema (c) 2013
External Debt Analysis
Objectives:
1. Examining the robustness of debt-driven growth
and the sources of vulnerability
2. Assessing debt servicing sustainability , i.e.,
liquidity & solvency prospects
3. Early warning indicators of upcoming debt crisis?
4. Analyzing debt restructuring workouts
3 MH BOUCHET/Skema (c) 2013
Domestic and External Financial Equilibrium
What is disposable income?
Y = gross income - imports & taxation
Y = C + I + G + X – M – T + (KM – K flight)
Savings = Y – C
(S – I ) + (T – G) = (X – M) + (KM – K F)Trade balanceNet savings Fiscal balance Net capital inflows
4

2
Boosting savings to finance investment
without external deficit
if S < I X < M
a trade imbalance is always rooted in low
savings and excessive domestic spending
(absorption).
It requires macroeconomic correction
(interest rate hike, devaluation, ↑ taxation,
credit reduction, ↑ reserve requirements…)
MH BOUCHET/Skema (c) 2013 5
Roots of external financial crisis
Consumption > Savings =
excessive absorption
Rising money supply
Large and cheap bank credit
Budget deficit
High rates of spending on
domestic and foreign goods
Shrinking net income
Inflationary pressures
+ Exchange rate overvaluation
Balance of payments crisis
* Exchange rate adjustment + control of the money
supply: decrease in creation of reserve money +
decline on money multiplier of the deposit money
banks + interest rate rise + increase in reserve
requirements
* Fiscal adjustment + cuts in public spending
* Structural measures to stimulate competitiveness
IMF’s financing +
macroeconomic
stabilization
ADJUSTMENT
MH BOUCHET/Skema (c) 20136
Debt Restructuring + return to market access
Number of sovereign debtor countries in default/year
MH BOUCHET/Skema (c) 2013
2010
7 MH BOUCHET/Skema (c) 2013 8
/13

3
MH BOUCHET/Skema (c) 2013 9 MH BOUCHET/Skema (c) 2013
External Debt Analysis
FLOWS: Balance of payments analysis and capital flight
Liquidity
Sustainability of external debt strategy (refinancing,
market access, rescheduling, restructuring..)
STOCKS: Structure of debt by creditors, maturity (ST/LT),
currency and interest rates (fixed/floating)
Solvency ratios
London Club debt : secondary market discounts
Spread/margin over US T Bills and CDS
10
MH BOUCHET/Skema (c) 2013
Why/When does a financial crisis erupt?
Gross and Net Flows
Gross Capital Inflows =
Long-term + Short-term capital flows
Net Flows=
Gross Inflows - Principal Repayments
Net Transfers=
Net Flows - Interest Payments
Total debt service payments=
Principal payments + Interest payments
11 MH BOUCHET/Skema (c) 2013
IIF’s analysis of Capital Flows 2011-2014
OECD countries
12
4
MH BOUCHET/Skema (c) 2013
Export of goods f.o.b.
- Imports of goods f.o.b.
= Trade balance
+ Exports of non-financial services
- Imports of non-financial services
+ Investment income (credit)
- Investment expenditures (debit)
+ (-) Private unrequited transfers
+ (-) Official unrequited transfers
= Current account balance
The current account of the balance of payments
From less liquid items
toward more liquid items!
13 MH BOUCHET/Skema (c) 2013
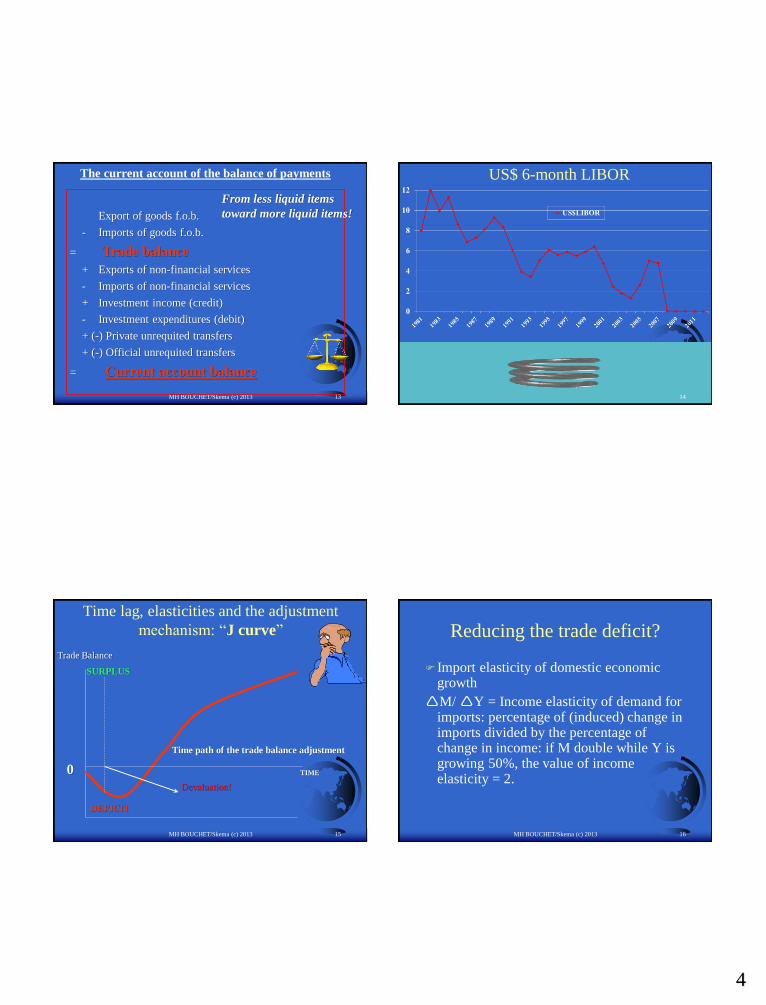
US$ 6-month LIBOR
14
MH BOUCHET/Skema (c) 2013
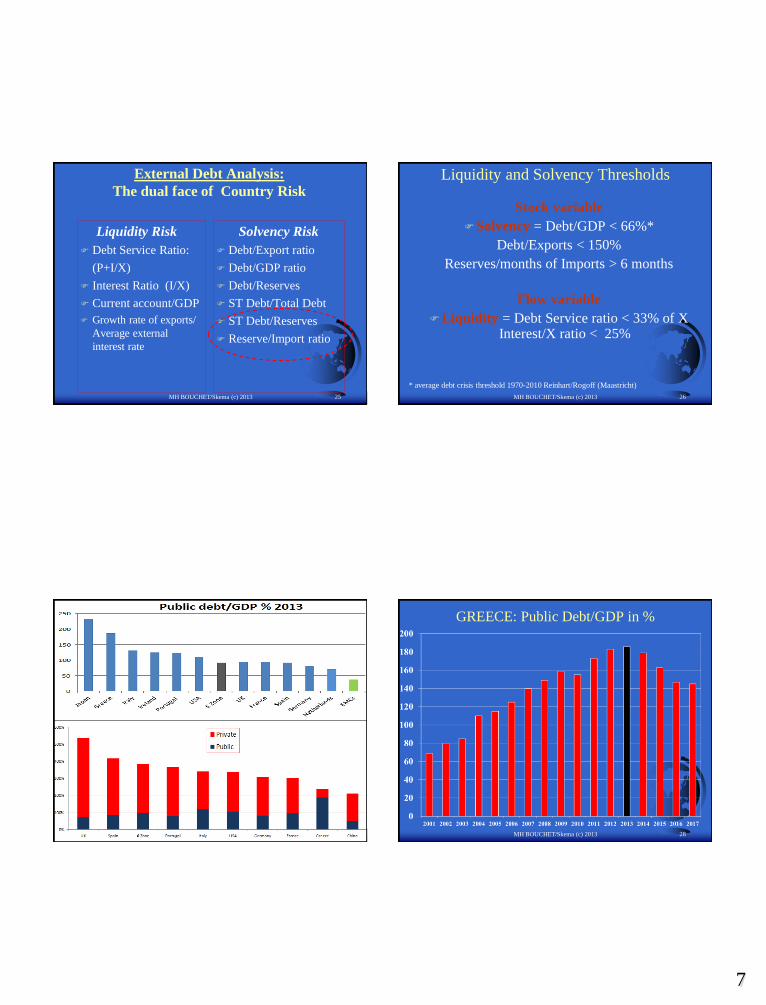
Time lag, elasticities and the adjustment
mechanism: “J curve”
Trade Balance
DEFICIT
SURPLUS
Time path of the trade balance adjustment
Devaluation!
0 TIME
15
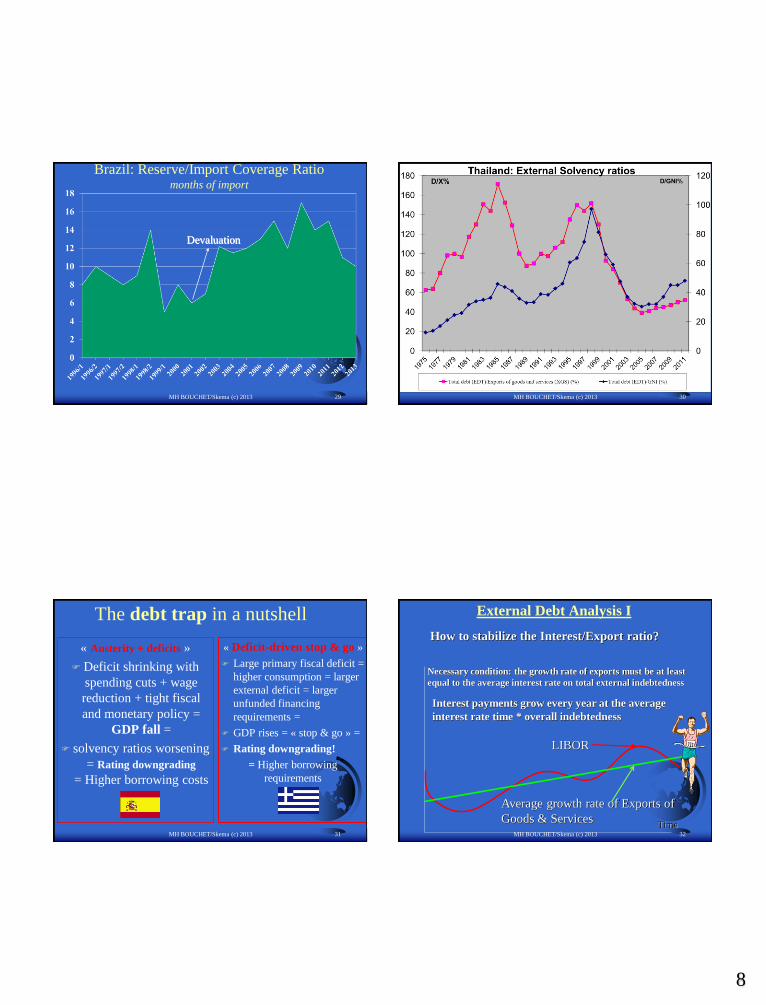
Reducing the trade deficit?
Import elasticity of domestic economic growth
M/ Y = Income elasticity of demand for imports: percentage of (induced) change in imports divided by the percentage of change in income: if M double while Y is growing 50%, the value of income elasticity = 2.
MH BOUCHET/Skema (c) 2013 16

5
MH BOUCHET/Skema (c) 2013
Trade elasticities: What about the price effects of
exchange rate changes on the BOP?
Import demand elasticity to prices =
MD/ P $ < 0 ?
Terms of trade (deterioration post devaluation): it takes more units of Exports to buy x units of imports
Export elasticity to foreign demand change =
X/ FD $ > 0 ?
This elasticity depends on foreign demand and on trade competitors
Supply elasticity to foreign demand =
S/ FD > 0?
This elasticity depends on the availability of finance, equipment, (imported) inputs, labor...
17 MH BOUCHET/Skema (c) 2013
Devaluation: the day after
key role of elasticities = ratio of two variations
Supply elasticities
∆ +Domestic production
Demand elasticities
∆ - Domestic consumption
∆ +Foreign demand ∆+ Import prices
∆ Foreign demand
∆ - export prices
18
MH BOUCHET/Skema (c) 2013
The Capital Account
Capital account
+ (-) Direct investment (non debt creating flows)
+ (-) Portfolio investment (NDCF)
+ (-) Other long-term capital (private + official)
+ (-) Other short-term capital (private + official)
+ (-) Net errors and omissions
+ (-) Counterpart items
+ (-) Change in reserves
= Capital account balance
+ Exceptional Financing (or arrears)
From less liquid items to more liquid items!
19 MH BOUCHET/Skema (c) 2013
GREECE: BOP Errors and Omissions ($ million)
20

6
MH BOUCHET/Skema (c) 2013
GREECE: Current Account/GDP in %
21 MH BOUCHET/Skema (c) 2013
Brazil: Current Account/GDP in %
22
MH BOUCHET/Skema (c) 2013 23 MH BOUCHET/Skema (c) 2013
+ Export of goods f.o.b.
- Imports of goods f.o.b.
= Trade balance
+/- Exports of non-financial services
+ /-Interest payments
+ (-) Private/Official unrequited transfers
= Current account balance
+/- FDI
+/- Portfolio capital Flows
+ LT Capital Inflows
- Debt Servicing Payments
+/- ST Capital Flows
Reserve Variation
Risk Management and BOP Analysis
24
7
MH BOUCHET/Skema (c) 2013
External Debt Analysis:
The dual face of Country Risk
Liquidity Risk
Debt Service Ratio:
(P+I/X)
Interest Ratio (I/X)
Current account/GDP
Growth rate of exports/
Average external
interest rate
Solvency Risk
Debt/Export ratio
Debt/GDP ratio
Debt/Reserves
ST Debt/Total Debt
ST Debt/Reserves
Reserve/Import ratio
25 MH BOUCHET/Skema (c) 2013
Liquidity and Solvency Thresholds
Stock variable
Solvency = Debt/GDP < 66%*
Debt/Exports < 150%
Reserves/months of Imports > 6 months
Flow variable
Liquidity = Debt Service ratio < 33% of X Interest/X ratio < 25%
* average debt crisis threshold 1970-2010 Reinhart/Rogoff (Maastricht)
26
MH BOUCHET/Skema (c) 2013 27 MH BOUCHET/Skema (c) 2013
GREECE: Public Debt/GDP in %
28
8
MH BOUCHET/Skema (c) 2013
Brazil: Reserve/Import Coverage Ratiomonths of import
Devaluation
29 MH BOUCHET/Skema (c) 2013 30
The debt trap in a nutshell
« Austerity + deficits »
Deficit shrinking with
spending cuts + wage
reduction + tight fiscal
and monetary policy =
GDP fall =
solvency ratios worsening
= Rating downgrading
= Higher borrowing costs
« Deficit-driven stop & go »
Large primary fiscal deficit =
higher consumption = larger
external deficit = larger
unfunded financing
requirements =
GDP rises = « stop & go » =
Rating downgrading!
= Higher borrowing
requirements
MH BOUCHET/Skema (c) 2013 31 MH BOUCHET/Skema (c) 2013
External Debt Analysis I
LIBOR
Average growth rate of Exports of
Goods & Services
How to stabilize the Interest/Export ratio?
Necessary condition: the growth rate of exports must be at least
equal to the average interest rate on total external indebtedness
Time
Interest payments grow every year at the average
interest rate time * overall indebtedness
32

9
External debt Analysis II
DEBT t= DEBT t-1 * (1+r) – Primary Budget Balance
GDP t = GDP t-1 * (1 + g)
DEBT t = DEBT t-1 * (1+r) – Primary Budget Balance
GDP GDP t-1 * (1+g) GDP
MH BOUCHET/Skema (c) 2013
DEBT
GDP t= DEBT
GDP t-1 1 + r
1 + g
- Primary Budget Balance
GDP
Reducing DEBT= Reducing r, increasing g, or boosting primary surplus
r = average rate of interest and g = average GDP growth rate
*
33 MH BOUCHET/Skema (c) 2013
External Debt Analysis III
Deficit
Average Debt/GDP
How to stabilize the Debt/GDP ratio?
Necessary condition: Deficit must be < (Debt/GDP * GDP growth rate)
If Debt/GDP= 85%
If GDP growth = 2%
Then deficit must be < 1,7%
Time34
MH BOUCHET/Skema (c) 2013
External Debt Analysis IV
How to stabilize the Debt/GDP ratio?
Necessary condition: Deficit must be < (Debt/GDP * GDP growth rate)
g = growth rate of GDP and d = deficit/GDP ratio
DEBT t = DEBT t-1 + DEF t-1 DEF = d * Yt Yt= Y t-1 (1+g)
DEBT t = DEBT t-1 + d * Y t-1
Y t Y t
DEBT t = DEBT t-1 * Y t-1 + d
Y t Y t-1 Yt 1+g
= ( 1 ) * DEBT t-1 + d = d/1+g = d
1+g Y t-1 1+g 1 – (1/1+g) g
So, if DEBT/Y < 120%, DEF should be < 3% for a 2,5% GDP growth rate
35
NORTH SEA GLOBAL EQUITY MANAGEMENT
MH BOUCHET/Skema (c) 2013 36

10
MH BOUCHET/Skema (c) 2013
Vietnam’s external debt outstanding
Total external debt: US$56 billion
Debt/GDP= 55%
Debt/XGS= 50%
Debt service ratio/XGS < 5%
IMF/2010 37 MH BOUCHET/Skema (c) 2013
Vietnam’s total external debt: US$56 billion (e)
o/w <30% ST
38
Vietnam’s international bank debt
MH BOUCHET/Skema (c) 2013Source: BIS 2013
39 MH BOUCHET/Skema (c) 2013
VIETNAM’s international bank debt
International bank claims on Vietnam= US$ 20,6 billion as of end-12 (o/w 24% from UK banks, 17% from French banks, 11% from US banks)
o/w US$4,8 on the non-bank private sector.
Short-term debt: US$8,5 billion
Undisbursed credit commitments: US$0,92 billion
Total overseas deposits in international banks: US$ 4,9 billion
o/w Deposits of private nonbank agents: US$1213 million (US$360 million end-2005)
40

11
Vietnam-Net Liquidity Ratios
MH BOUCHET/Skema (c) 2013 41