Embed Size (px)
Citation preview

0 [Type here] Irrigation in Africa in figures - AQUASTAT Survey - 2016
Country profile – Latvia
Version 2016


Recommended citation: FAO. 2016. AQUASTAT Country Profile – Latvia.
Food and Agriculture Organization of the United Nations (FAO). Rome, Italy
The designations employed and the presentation of material in this information product do not imply the expression of any opinion whatsoever on the part of the Food and Agriculture Organization of the United Nations (FAO) concerning the legal or development status of any country, territory, city or area or of its authorities, or concerning the delimitation of its frontiers or boundaries. The mention of specific companies or products of manufacturers, whether or not these have been patented, does not imply that these have been endorsed or recommended by FAO in preference to others of a similar nature that are not mentioned. The views expressed in this information product are those of the author(s) and do not necessarily reflect the views or policies of FAO. FAO encourages the use, reproduction and dissemination of material in this information product. Except where otherwise indicated, material may be copied, downloaded and printed for private study, research and teaching purposes, or for use in non-commercial products or services, provided that appropriate acknowledgement of FAO as the source and copyright holder is given and that FAO’s endorsement of users’ views, products or services is not implied in any way. All requests for translation and adaptation rights, and for resale and other commercial use rights should be made via www.fao.org/contact-us/licencerequest or addressed to [email protected]. FAO information products are available on the FAO website (www.fao.org/ publications) and can be purchased through [email protected]. © FAO 2016

1
Latvia
GEOGRAPHY, CLIMATE AND POPULATION
Geography
Latvia is one of the three Baltic states. It is bordered in the northeast by Estonia, in the east by the
Russian Federation, in the southeast by Belarus, in the south by Lithuania and in the west and northwest
by the Baltic Sea and the Gulf of Riga. Its total area is 64 490 km2. The country became independent
from the Soviet Union in May 1990. Administratively, Latvia is divided into 110 municipalities and 9
cities. The capital city is Riga.
Latvia consists of a continental part in the east and the Kurzeme peninsula (Kurland) in the west. The
continental part consists of morainic uplands that are crossed by several rivers flowing to the lowlands,
of which the main ones are the Daugava, Gauja and Salaca rivers. The highest point of the country is in
the Vidzeme uplands with an altitude of 312 m above sea level. The continental part is separated from
the peninsula in the west by the Lielupe river, which flows through the Zemgale plain. In the peninsula
are the Kurzeme uplands, which are lower than the continental uplands and crossed by several rivers, of
which the Venta river is the most important. The highest point in these uplands is at 184 m above sea
level. About 57 percent of the country lies below 100 m above sea level and only 2.5 percent lies above
200 m.
The agricultural area, which is the sum of arable land, permanent crops and permanent meadows and
pasture, is estimated at 1.9 million ha, which is 29 percent of the total area of the country. In 2013, the
total physical cultivated area was estimated at 1.2 million ha, of which 99.5 percent (1 208 000 ha)
consisted of temporary crops and 0.5 percent (6 000 ha) of permanent crops (Table 1).
The soils in Latvia are generally not very fertile. Around 230 000 ha are threatened by wind erosion and
around 380 000 ha by water erosion. According to various estimates, marshes cover 5-10 percent of the
total area of the country. Some swamps of peat ground reach a depth of 5 m. The fertile marshy black
soils can be found only in the Zemgale plain.
Climate
The average annual air temperature in Latvia is 6°C, varying from -5ºC in January and February to 17°C
in July. Average minimum and maximum temperature are -8ºC and 22°C respectively. The average
annual precipitation in Latvia is 667 mm, ranging from 33 mm in February and March to 78 mm in July.
Annual average relative humidity is 81 percent (LEGMC, 2016).

2 Irrigation in Eastern Europe in figures - AQUASTAT Survey - 2016
FIGURE 1
Map of Latvia

Latvia 3
TABLE 1
Basic statistics and population
Physical areas:
Area of the country 2013 6 449 000 ha
Agricultural land (permanent meadows and pasture + cultivated land) 2013 1 868 000 ha
As % of the total area of the country 2013 29 %
Permanent meadows and pasture 2013 654 000 ha
Cultivated area (arable land + area under permanent crops) 2013 1 214 000 ha
- As % of the total area of the country 2013 19 %
- Arable land (temp. crops + temp. fallow + temp. meadows) 2013 1 208 000 ha
- Area under permanent crops 2013 6 000 ha
Population:
Total population 2015 1 970 000 inhabitants
- Of which rural 2015 31 %
Population density 2015 31 inhabitants/km2
Economy and development:
Gross Domestic Product (GDP) (current US$) 2014 31 921 million US$/year
Value added in agriculture (% of GDP) 2014 3 %
GDP per capita 2014 15 640 US$/year
Human Development Index (highest = 1) 2014 0.819 -
Gender Inequality Index (equality = 0, inequality = 1) 2014 0.167 -
Access to improved drinking water sources:
Total population 2015 99 %
Urban population 2015 100 %
Rural population 2015 98 %
Four climatological regions can be distinguished in Latvia:
The coastal region, covering 25 percent of the country, includes the Zemgale plain and the whole
coastal region from Lithuania to Estonia. The average annual precipitation is 600 mm. The
average temperature varies from -3°C in January to 16.5°C in July. Humidity is low.
The Latgale region, covering 28 percent of the country, includes the southeast of the country.
The average annual precipitation is 700 mm. The average temperature varies from -7°C in
January to 17°C in July. Humidity is high.
The Vidzeme region, covering 30 percent of the country, includes the northeastern inland part
of the country. The average annual precipitation is 700-850 mm. The average temperature varies
from -7°C in January to 16.5°C in July. Humidity is high.
The Kurzeme region, covering 17 percent of the country, includes the inland part of the
Kurzeme peninsula. The average annual precipitation is 700-850 mm. The average temperature
varies from -4°C in January to 16.5°C in July. There is medium humidity.
Overall, during the 20th century the average air temperature in Latvia has risen by 1 degree due to climate
change. From the beginning of the second half of the 20th century, fluctuations in annual rainfall have
risen (LEGMC, 2016).
Population
In 2015, the total population was about 2 million, of which around 31 percent was rural (Table 1).
Average population density in the country is 31 inhabitants/km2. The average annual population growth
rate in the 2005-2015 period has been estimated at minus 1 percent.
In 2014, the Human Development Index (HDI) ranks Latvia 46 among 188 countries, while the Gender
Inequality Index (GII) ranks it 36 among 155 countries, for which information was available. Life
expectancy is 74 years and the under-five mortality is 8 per 1000 births, both progressing from 68 years
and 24 per 1000 in the 1990s. With no significant distinction between boys and girls, around 96 percent
of the children in 2013 are enrolled in primary education, but only 87 percent for secondary education

4 Irrigation in Eastern Europe in figures - AQUASTAT Survey - 2016
(WB, 2015). Adult literacy is 99.9 percent in 2012 (UNDP, 2015). In 2015, 99 percent of the total
population had access to improved water sources (100 and 98 percent in urban and rural areas
respectively) and 88 percent of the total population had access to improved sanitation (91 and 82 percent
in urban and rural areas respectively) (JMP, 2015).
ECONOMY, AGRICULTURE AND FOOD SECURITY
In 2014, the gross domestic product (GDP) was US$ 31 921 million and agriculture accounted for 3
percent of GDP, while in 1994 it accounted for 9 percent.
Until 1989, 60 percent of the area was cultivated by kolkhoz (collective farms) and 40 percent by sovkhoz
(state farms). In 1989, as a result of the proclamation of the “Act on Land Reform in Rural Areas”,
private farms started developing.
At present, Latvia is a small, open economy with exports contributing nearly a third of GDP. Due to its
geographical location, transit services are highly developed, along with timber and wood-processing,
agriculture and food products, and manufacturing of machinery and electronics industries (CIA, 2015).
The crops with a largest harvested area are cereals, followed by rape, potatoes and vegetables (CBS,
2016).
WATER RESOURCES
Surface water and groundwater resources
There are more than 12 400 rivers in the country (GWP, 2011). The major rivers are Daugava, Lielupe,
Gauja, Venta, and Salaca.
According to the Law on Water Management Latvia is divided into four river basin districts (RBD) (EC,
2015; EEA, 2015):
Daugava, including two basins:
Daugava river basin: Its total area is 87 900 km2, of which just over one quarter is located
in Latvia. The Daugava river rises in the Russian Federation, flows through Belarus (where
it is called the Western Dvina), enters Latvia in the southeast and flows northwest to the
Gulf of Riga. Several tributaries enter the Daugava river in Latvia, including three large
ones: Ogre, Aiviekste and Dubna. The Rezekne and Pededze rivers are two important
tributaries of the Aiviekste river.
Velikaya river basin: This basin consists of a number of smaller rivers flowing into the
Velikaya in the Russian Federation. The Velikaya river is a major tributary of Lake Peipus
and belongs to the basin of the Narva river which is predominantly in Estonia. Its area within
Latvia is 3 200 km2. The main tributaries flowing from Latvia to the Velikaya river are the
Sinyaya (Zilupe in Latvian) river which originates in Belarus, the Ultroya river and the the
Kukhva (Kūkova in Latvian) river. The total discharge of the Velikaya amounts to
4 200 million m3/year, of which 16 percent is generated within Latvia.
Gauja, including two basins:
Gauja river basin: Its total area is 8 900 km2, of which almost 95 percent is situated in
Latvia. The Gauja river rises in the Vidzeme upland and flows east, then turns northwest,
becomes the border between Latvia and Estonia for a short distance, and then flows
southwest to the Gulf of Riga.
Salaca river basin: It covers the north of the country, near the border with Estonia. Its total
area is 3 600 km2, of which more than 95 percent is located in Latvia. The Salaca river rises
in Lake Burtnieks in the north and flows west to the Gulf of Riga.
Latvia 5
Lielupe, including one basin:
Lielupe river basin: Its total area is 17 600 km2, of which about half is situated in Latvia.
The Lielupe river rises in Lithuania, enters Latvia in the south and flows north to the Gulf
of Riga through the most fertile regions of the country. It has many tributaries, the most
important being the Memele, Lecava and Svete. The Musa river is a tributary of the Memele
river.
Venta, including three basins:
Venta river basin; Its total area is 11 800 km2, of which almost two thirds is situated in
Latvia. The Venta river rises in Lithuania, enters Latvia in the southwest and flows north
through the Kurzeme lowland to the Baltic Sea. The Venta has many tributaries, but only
one of them, the Abava river, exceeds 100 km in length.
Coastal west basin: It includes the small river basins at the west coast with a total area of
5 100 km2. It includes rivers such as the Barta, Durba, Riva and Uzava, which flow to the
Baltic Sea.
Coastal north basin: It includes the small river basins within the coastal lowland on the
opposite shores of the Gulf of Riga. Their combined area is 3 800 km2. This area includes
rivers such as the Irbe, Stonde, Roja, Svetupe and Vitupe.
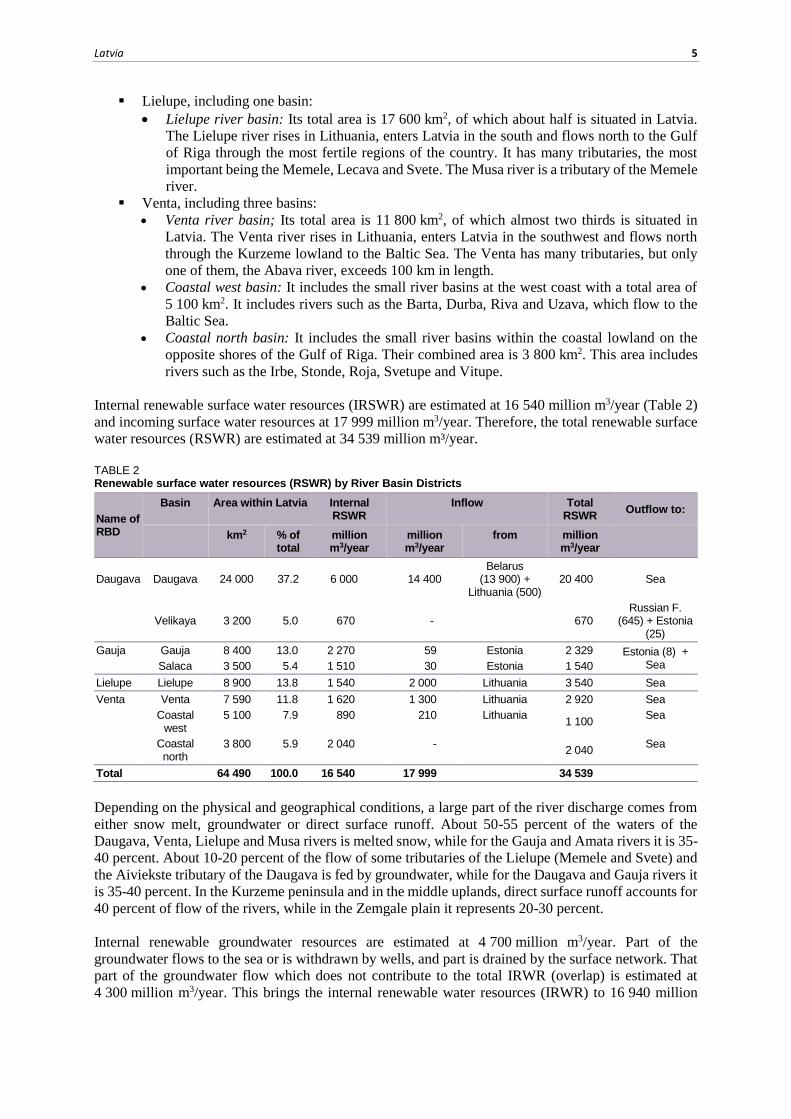
Internal renewable surface water resources (IRSWR) are estimated at 16 540 million m3/year (Table 2)
and incoming surface water resources at 17 999 million m3/year. Therefore, the total renewable surface
water resources (RSWR) are estimated at 34 539 million m³/year.
TABLE 2 Renewable surface water resources (RSWR) by River Basin Districts
Name of RBD
Basin Area within Latvia Internal RSWR
Inflow Total RSWR
Outflow to:
km2 % of total
million m3/year
million m3/year
from million m3/year
Daugava Daugava 24 000 37.2 6 000 14 400 Belarus
(13 900) + Lithuania (500)
20 400 Sea
Velikaya 3 200 5.0 670 - 670
Russian F. (645) + Estonia
(25)
Gauja Gauja 8 400 13.0 2 270 59 Estonia 2 329 Estonia (8) + Sea Salaca 3 500 5.4 1 510 30 Estonia 1 540
Lielupe Lielupe 8 900 13.8 1 540 2 000 Lithuania 3 540 Sea
Venta Venta 7 590 11.8 1 620 1 300 Lithuania 2 920 Sea
Coastal west
5 100 7.9 890 210 Lithuania 1 100
Sea
Coastal north
3 800 5.9 2 040 - 2 040
Sea
Total 64 490 100.0 16 540 17 999 34 539
Depending on the physical and geographical conditions, a large part of the river discharge comes from
either snow melt, groundwater or direct surface runoff. About 50-55 percent of the waters of the
Daugava, Venta, Lielupe and Musa rivers is melted snow, while for the Gauja and Amata rivers it is 35-
40 percent. About 10-20 percent of the flow of some tributaries of the Lielupe (Memele and Svete) and
the Aiviekste tributary of the Daugava is fed by groundwater, while for the Daugava and Gauja rivers it
is 35-40 percent. In the Kurzeme peninsula and in the middle uplands, direct surface runoff accounts for
40 percent of flow of the rivers, while in the Zemgale plain it represents 20-30 percent.
Internal renewable groundwater resources are estimated at 4 700 million m3/year. Part of the
groundwater flows to the sea or is withdrawn by wells, and part is drained by the surface network. That
part of the groundwater flow which does not contribute to the total IRWR (overlap) is estimated at
4 300 million m3/year. This brings the internal renewable water resources (IRWR) to 16 940 million

6 Irrigation in Eastern Europe in figures - AQUASTAT Survey - 2016
m3/year (16 540+4 700-4 300) and the total renewable water resources (TRWR) to 34 939 million
m3/year (34 539+4 700-4 300) (Table 3). TABLE 3 Renewable water resources
Renewable freshwater resources:
Precipitation (long-term average) - 667 mm/year
- 43 015 million m3/year
Internal renewable water resources (long-term average) - 16 940 million m3/year
Total renewable water resources - 34 939 million m3/year
Dependency ratio - 52 %
Total renewable water resources per inhabitant 2014 17 736 m3/year
Total dam capacity 2010 1 007 million m3
Artificial groundwater recharge takes place in several well fields in Baltezers that are used for Riga city
water supply. A hydrogeological modelling and field investigation has shown that artificial recharging
of groundwater resources in Baltezers does not put at risk groundwater quality to exceed permitted
parameters’ values for drinking water. (LEGMA; 2005; Spalviņš et al, 2008).
In 2009, produced municipal wastewater was estimated at 282 million m3, treated municipal wastewater
at 128 million m3 and direct use of treated municipal wastewater at 12 million m3.
Lakes and dams
There are about 2 250 lakes with a total area of about 850 km2, most of them being small lakes with
more than 10 000 lakes having a surface area of less than 1 ha (LEGMA; 2005). About 36 percent of
the lakes in Latvia are located in the Latgale upland in the southeast of the country. Lubans lake in the
Daugava river basin is the largest lake with a surface area of almost 100 km2.
Dams have been constructed for two main reasons: to control floods and to build hydro-electric power
stations. Before the Second World War, about 300 such stations had been built. After the Second World
War, the construction of another 547 small stations was planned, but only 267 were built. At present, no
small power stations are functioning, though the reservoirs still exist.
Three large hydropower dams have been constructed on the Daugava river, with a total full reservoir
capacity of 1 005 million m3: (1) the Kegums reservoir, with an area of 25 km2 and a full capacity of
157 million m3, was constructed in 1947; (2) the Plavinas reservoir, with an area of 35 km2 and a full
capacity of 509 million m3, was constructed in 1965; (3) the Riga reservoir, with an area of 42 km2 and
a full capacity of 339 million m3, was constructed in 1976.
INTERNATIONAL WATER ISSUES
All of the River Basin Districts (RBD) are transboundary river basins. The Gauja RBD is shared with
Estonia and the Lielupe RBD and the Venta RBD are shared with Lithuania. The Daugava RBD is
shared with Belarus, Lithuania and Russian Federation and it also includes a very small part of the Lake
Peipus-Narva river basin which is predominantly in Estonia (EC, 2012, EC, 2015; EEA, 2015).
The Daugava, Lielupe and Venta rivers are included in the list of European Main Transboundary Surface
Waters. The water quality problems of these rivers can only be solved by means of international
agreements, in compliance with the mechanisms provided in the Helsinki Convention on “Use and
protection of transboundary watercourses and international lakes” adopted in 1992 and ratified by Latvia
in 1996 (MoERD, 2016).
Coordination of some River Basin Management Plans (RBMP) elements with Lithuania has occurred,
but a joint RBMP has not been elaborated. An intergovernmental commission on transboundary
cooperation between these two countries was set up following the “Agreement on Transfrontier

Latvia 7
Cooperation between the Government of Lithuania and the Government of Latvia” signed in 1999.
Cooperation with Lithuania seeking to create a joint River Basin District Management Plan will continue
on the basis of this agreement and pursuant to the Technical Protocol of Cooperation in the Management
of International River Basin Districts, signed between the Ministry of Environment of Lithuania and the
Ministry of Environment of Latvia in 2003.
A draft agreement between Latvia, Belarus and the Russian Federation on the Western Dvina/Daugava
river basin, establishing a joint commission, was finalized in 2003. Latvia approved the draft but it was
not signed as Russia and Belarus postponed the final decision several times due to various reasons. After
joining the European Union (EU) in 2004, water quality became a topic of shared responsibility between
the Member States and the EU. Therefore, any international agreement on water management between
an EU Member State and a non-Member State requires the EU as a Contracting Party. Cooperation
agreements were on the list of topics to be discussed during high-level meetings of the EU and the
Russian Federation. However, this has not led to renewal of the negotiations concerning river basin
management agreement. Latvia has no framework agreement with Belarus and Russian Federation on
cooperation in river basin management (ECE, 2009; EC, 2012).
In 2003 and 2004, several seminars were held for Baltic experts to discuss identification of river basin
districts, proposed typology and characteristics of surface water. Even if they have not led to a
harmonized typology, experts had a regular information exchange with neighbouring colleagues. In
2003, permanent working groups were established in accordance with the agreements concluded
between the Ministries of the Environment of Latvia and Lithuania and of Latvia and Estonia (LEGMA,
2005).
Latvia and Estonia cooperate on establishing, updating and implementing water management plans for
the cross-border Gauja/Koiva river basin. This joint project also supports the preparation of a joint water
management plan, combining the water management plans of the two countries. The first river basin
management plans were produced separately (MoE of Estonia, 2015).
The Nemunas RBD is shared with two EU Member States, Poland and Lithuania, and two non-EU
countries, Belarus and the Russian Federation (Kaliningrad oblast). The governments of Lithuania, the
Russian Federation, Belarus, and the European Commission have initiated the preparation of an
agreement on cooperation in the use and protection of water bodies within the Nemunas River Basin
District (RBD). A draft agreement has been drawn up but has not been signed yet. No measures have
been foreseen for Poland and Latvia, because the part of the Nemunas RBD in Poland constitutes only
287 km2 (the upstream reaches of the rivers with no significant pressures), and the part of the RBD in
Latvia constitutes only 100 km2 (the upstream reaches of the rivers with no significant pressures), and
the results of water quality monitoring showed that the ecological status of the rivers along the Polish
and Latvian border were good.
WATER USE
In 1995, total water withdrawal was 418 million m3, while in 2002 it had gone down to 256 million m3,
mainly due to a reduction in industrial water withdrawal, probably related to a reduction in industrial
activities.
In 2013, total water withdrawal was estimated at 248 million m3 of which 159 million m3 (64 percent)
for municipalities, 52 million m3 (21 percent) for industry and 36 million m3 (15 percent) for agriculture
of which 33 million m3 corresponds to aquaculture (Eurostat, 2016) (Table 4 and Figure 2).

8 Irrigation in Eastern Europe in figures - AQUASTAT Survey - 2016
TABLE 4 Water use
Water withdrawal:
Total water withdrawal 2013 248 million m3/year
- Agriculture (Irrigation + Livestock + Aquaculture) 2013 36 million m3/year
- Municipalities 2013 159 million m3/year
- Industry 2013 52 million m3/year
Per inhabitant 2013 126 m3/year
Surface water and groundwater withdrawal (primary and secondary) 2013 236 million m3/year
As % of total renewable water resources 2013 0.7 %
Non-conventional sources of water:
Produced municipal wastewater 2009 282 million m3/year
Treated municipal wastewater 2009 128 million m3/year
Direct use of treated municipal wastewater 2009 12 million m3/year
Direct use of agricultural drainage water - - million m3/year
Desalinated water produced - - million m3/year
FIGURE 2
Water withdrawal by sector
Total: 248 million m3 in 2013
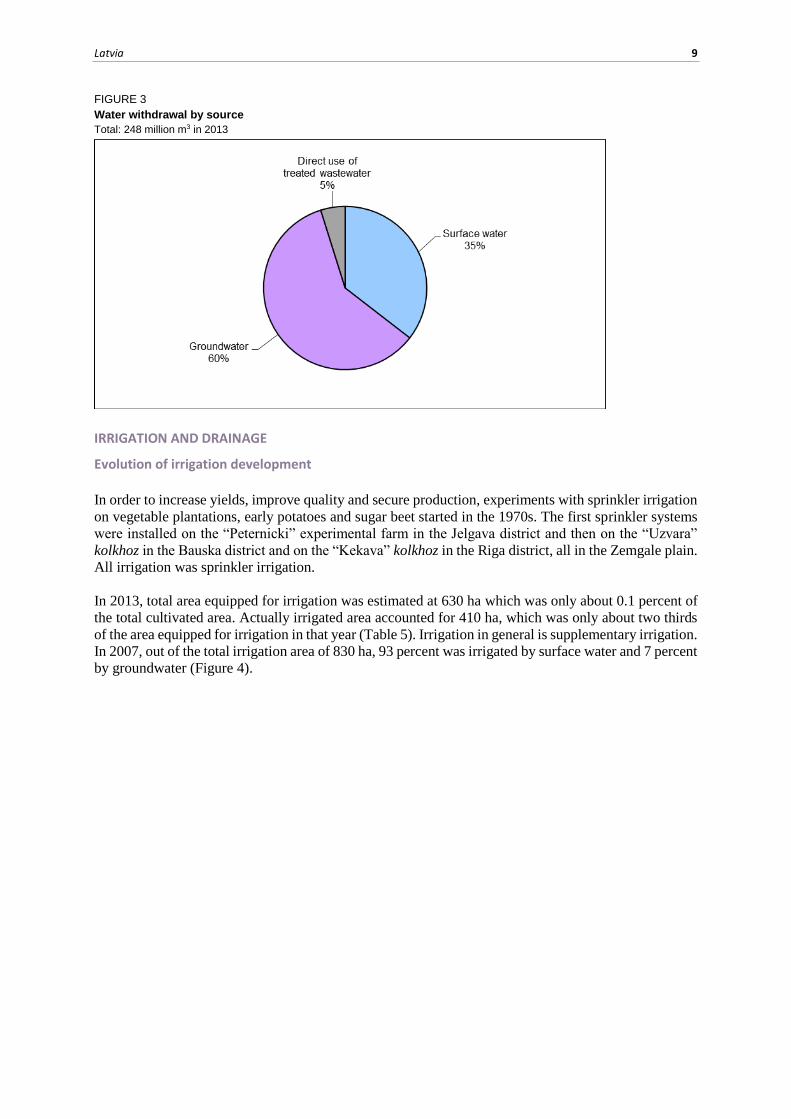
In 2013, it was estimated that around 60 percent of total water withdrawal is withdrawn from
groundwater, 35 percent from surface water and 5 percent comes from direct use of treated municipal
wastewater (Eurostat, 2016) (Figure 3).
Groundwater is widely used for individual water supply in farms and small settlements throughout
Latvia. For this purpose, mainly shallow wells and less often deep boreholes, are used (ECMC, 2000).
Latvia 9
FIGURE 3
Water withdrawal by source
Total: 248 million m3 in 2013
IRRIGATION AND DRAINAGE
Evolution of irrigation development
In order to increase yields, improve quality and secure production, experiments with sprinkler irrigation
on vegetable plantations, early potatoes and sugar beet started in the 1970s. The first sprinkler systems
were installed on the “Peternicki” experimental farm in the Jelgava district and then on the “Uzvara”
kolkhoz in the Bauska district and on the “Kekava” kolkhoz in the Riga district, all in the Zemgale plain.
All irrigation was sprinkler irrigation.
In 2013, total area equipped for irrigation was estimated at 630 ha which was only about 0.1 percent of
the total cultivated area. Actually irrigated area accounted for 410 ha, which was only about two thirds
of the area equipped for irrigation in that year (Table 5). Irrigation in general is supplementary irrigation.
In 2007, out of the total irrigation area of 830 ha, 93 percent was irrigated by surface water and 7 percent
by groundwater (Figure 4).

10 Irrigation in Eastern Europe in figures - AQUASTAT Survey - 2016
TABLE 5 Irrigation and drainage
Irrigation potential - - ha
Irrigation:
1. Full control irrigation: equipped area 2013 630 ha
- Surface irrigation - - ha
- Sprinkler irrigation - - ha
- Localized irrigation - - ha
Area equipped for full control irrigation actually irrigated 2013 410 ha
- As % of area equipped for full control irrigation 2013 65 %
2. Equipped lowlands (wetland, ivb, flood plains, mangroves) - 0 ha
3. Spate irrigation - 0 ha
Total area equipped for irrigation (1+2+3) 2013 630 ha
As % of cultivated area 2013 0.1 %
% of area irrigated from surface water 2007 93 %
% of area irrigated from groundwater 2007 7 %
% of area irrigated from mixed surface water and groundwater - - %
% of area irrigated from non-conventional sources of water - - %
Area equipped for irrigation actually irrigated 2013 410 ha
- As % of total area equipped for irrigation 2013 65 %
Average increase per year 2000-2013 1 %
Power irrigated area as % of total area equipped for irrigation - - %
4. Non-equipped cultivated wetlands and inland valley bottoms - - ha
5. Non-equipped flood recession cropping area - - ha
Total agricultural water managed area (1+2+3+4+5) 2013 630 ha
As % of cultivated area 2013 0.1 %
Size of full control irrigation schemes: Criteria:
Small schemes < - ha - - ha
Medium schemes > - ha and < - ha - - ha
large schemes > - ha - - ha
Total number of households in irrigation - -
Irrigated crops in full control irrigation schemes:
Total irrigated grain production - metric tons
As % of total grain production - %
Harvested crops:
Total harvested irrigated cropped area 2007 620 ha
Temporary crops: total 2007 620 ha
- Vegetables 2007 310 ha
- Potatoes 2007 310 ha
Permanent crops: total - - ha
Irrigated cropping intensity (on full control area actually irrigated) 2007 100 %
Drainage - Environment:
Total cultivated area drained 1995 1 580 000 ha
Non-irrigated cultivated area drained - - ha
Area equipped for irrigation drained - - ha
- As % of total area equipped for irrigation - - %
Area salinized by irrigation - - ha
Area waterlogged by irrigation - - ha

Latvia 11
FIGURE 4
Source of irrigation water on area equipped for irrigation Total: 830 ha in 2007
Role of irrigation in agricultural production, the economy and society
In 2007, the total harvested irrigated crop area was 620 ha, of which 50 percent were potatoes and 50
percent vegetables (Table 5 and Figure 5).
FIGURE 5
Irrigated crops on area equipped for full control irrigation Total harvested area 620 ha in 2007 (cropping intensity on actually irrigated area: 100%)
Status and evolution of drainage systems
For agriculture, drainage is more important than irrigation. Over 90 percent of the agricultural land in
Latvia can be intensively cultivated only if drained.

12 Irrigation in Eastern Europe in figures - AQUASTAT Survey - 2016
The more important works connected with land drainage started in the eighteenth century in the east of
the country. At the beginning of the nineteenth century, large-scale hydraulic works were carried out on
the Bera, Auce, Riva and Lielupe rivers; dikes were built along the Roja, Abava, Riva and Pededze
rivers; and the Starpinupe canal connecting Lake Kanieris with the Gulf of Riga was constructed. In the
middle of the nineteenth century, a canal connecting Lake Lubans with the Aiviekste river was
constructed. Subsurface drainage started in 1850. Until 1924, all hydraulic works were carried out
without the use of any machinery. In 1924, machines and excavators were purchased, which facilitated
the excavation of cross-cuts, made it possible to straighten riverbeds and to shape new ones. The first
land improvement act was passed in 1937.
By 1995, almost 1.6 million ha, including agricultural land, meadows, pastures and land used for
construction, had been drained. Most of this area, around 96 percent, was provided with subsurface
drains, using ceramic or polymer pipes. The state only financed improvements and maintenance of the
system. For 1996 and 1997, $US 3.3 million were earmarked for these purposes.
In 1994, fodder crops covered a large part of the drained area, followed by cereals, vegetables, potatoes
and industrial plants. In that year, the drained lands produced 80 percent of all vegetable production. It
is assumed that, generally, crop yields on drained land are 20-25 percent higher than those on undrained
land.
WATER MANAGEMENT, POLICIES AND LEGISLATION RELATED TO WATER USE IN AGRICULTURE
Institutions
The following institutions are involved in water resources management:
The Ministry of Environmental Protection and Regional Development (MoERD) is responsible
for the policy planning on water resources and sanitation, implementation and supervision of
drinking water and sanitation improvement projects. It is also responsible for regional
development and information and communication technologies. It ensures that natural resources
are used effectively and in sustainable manner (MoERD, 2016). Amongst others, the MoERD
supervises the following institutions:
State Environmental Service (SES), which has to ensure the implementation of the
legislation framework related to environmental protection and natural resources.
Environment State Bureau (ESB), which carries out environmental impact assessment of
proposed activities and planning documents.
Nature Conservation Agency (NCA), which is responsible for the management of all
protected areas in Latvia.
The Latvian Environment, Geology and Meteorology Centre (LEGMC), which ensures
water quality and quantity monitoring, as well as data quality control and availability of
these data for public, river basin management, preparation of various reports for national
and international institutions, as well as calculation of flood territories.
The Ministry of Health participates in the development of policy planning documents and legal
acts. It supervises the Health Inspectorate that is responsible for the control of public drinking
water supply from the water supply points to the consumer.
The Ministry of Agriculture has, amongst others, the responsibility of water resources
protection.
The Latvia University of Agriculture carries out large-scale scientific research on irrigation and
land reclamation.
The University of Latvia in Riga conducts research on hydrology, climate, geography of water
resources and in environmental sciences.

Latvia 13
Water management
Water management in Latvia is composed of two levels: central and local management. The central
government is responsible for water resources protection and development, the formulation and
implementation of national water policy and national macro-management of water resources. The local
government is in charge of the supervision and management of water use and sewage treatment
(ASEMWater, 2016).
The final version of the River basin district management plans (RBMP) was approved by the Order of
the Minister of Environment in 2010. The principal objectives of the RBMPs are to prevent deterioration
in the condition of the water and to improve the surface water and groundwater quality (EC, 2012).
Finances
The Latvian government and local institutions apply charges and the polluter pays principle (PPP) to
water users. There is a close relationship between charge for water and manner of fetching water as well
as the purpose of water use (ASEMWater, 2016).
Foreign investments in Latvia have been very important to develop the water sector. Recently, the
Nordic Environment Finance Corporation (NEFCO) has invested € 5 million to upgrade wastewater
treatment plants in Latvia (NEFCO, 2008).
Policies and legislation
The Law on Water Management (2002) is the main regulation in water management and protection and
aims to establish a surface water and groundwater protection and management system that promotes
sustainable and rational use of water resources, improves protection of water environment, ensures water
protection and facilitates achievement of goals set in international agreements. The Law defines that
water protection measures, their efficiency and usefulness must be controlled within river basins instead
of administrative borders (MoERD, 2016).
The Law on Regulators of Public Utilities (2000) states that water supply and sewerage should be
regulated by local regulators.
ENVIRONMENT AND HEALTH
According to the information included in the river basin management plans, 51 percent of the surface
water bodies are currently considered to be of high or good ecological quality. The main cause of
inadequate surface water quality is eutrophication due to pollution from point and diffuse sources,
morphological changes in rivers and an influx of biogens from neighbouring countries via transboundary
watercourses.
Since the beginning of the 1990s the annual average concentration of nitrogen in rivers has decreased
in Daugava, Gauja and Venta. In Lielupe, the concentration of nitrogen is higher due to intensive
agriculture in this region. However, the recent trend indicates a small increase in nitrogen concentrations
in all rivers. More than 70 percent of the total nitrogen and more than 40 percent of the total phosphorus
inland load is caused by various human activities. The main source of nitrogen is agriculture while the
main source of phosphorus is municipal and industrial wastewater (EEA, 2015).
Water pollution in wells may be due to their placement at insufficient distances from the organic or
bacteriological pollution sources (cattle-sheds, toilets, etc.). The reasons for water quality being non-
compliant with required standards were mostly due to high iron content and organoleptic qualities
(ECMC, 2000).

14 Irrigation in Eastern Europe in figures - AQUASTAT Survey - 2016
Water protection is one of the main priorities in the environmental protection policy of the country.
Currently good results have already been achieved. Wastewater treatment has been improved
significantly (MoERD, 2016).
Sea water intrusion has been observed in the Famenian aquifer system in Liepaja in the southwest of the
country. It was caused by very intensive abstraction of groundwater. Indirect intrusion of sea water
through Daugava river bed is observed in the Arukula-Amata aquifer system in the centre of Riga region.
In both sites groundwater bodies have been identified as being at risk (LEGMA, 2005).
PROSPECTS FOR AGRICULTURAL WATER MANAGEMENT
Freshwater resources far exceed present and future requirements for water consumption (EEA, 2015).
The government focuses its policy and activities for the future mainly on water protection.
MAIN SOURCES OF INFORMATION
ASEMWater. 2016. Website of ASEMWater. The Republic of Latvia. ASEM Water Resources Research and
Development Center.
CIA. 2015. The World Fact Book: Latvia. Central Intelligence Agency.
CSB. 2016. CBS website. Central Bureau of Statistics of Latvia.
EEA. 2015. Freshwater – State and impacts (Latvia). European Environment Agency.
EC. 2012. Commission staff working document. Member State: Latvia. Accompanying the document Report from
the Commission to the European Parliament and the Council; on the implementation of the Water Framework
Directive (2000/60/EC); River Basin Management Plans. European Commission.
EC. 2015. European Commission websiste. Environment. Latvia. European Commission.
ECE. 2009. Capacity for water cooperation in Eastern Europe, Caucasus and Central Asia. Economic
Commission for Europe.
ECMC. 2000. Latvian State of the Environment Report (1998). Environmental Consulting and Monitoring Centre
of the Ministry of Environmental Protection and Regional Development.
Eurostat. 2016. Eurostat Database
Feldmane J, Sleže S, Auziņa A and Kadikis N. 2011. Water and Health Protocol implementation in Latvia.
Seminar for Nordic and Baltic countries “Drinking water and sanitation in a Nordic and Baltic perspective –
common challenges and collaboration“ Oslo 07.11-08.11.2011.
Friedrich V. 2002. Feasibility study for stabilising the Plavinas dam, Latvia.
GWP. 2011. Website of GWP. Latvia. Global Water Partnership.
JMP. 2015. Progress on drinking water and sanitation – 2015 Update and MDG Assessment. WHO/UNICEF
Joint Monitoring Programme for Water Supply and Sanitation.
Jurgelane I. 2013. Water management services regulation in Latvia: principles and development trends.
LEGMA. 2005. Characteristics of the Latvian river basin districts. A review of the impact of human activity on
the status of surface waters and on groundwater. Economic analysis of water use (Article 5 report). Lativan
Environment, geology and meteorology agency.
LEGMC. 2016. Climate of Latvia. Latvian Environment, Geology and Meteorology Centre.

Latvia 15
Mezals, A. 2012. Water management sector regulation in Latvia. Public Utilities Commission of Latvia. Deputy
Director of Municipal Service and Railway Transport Department, Head of Municipal Service Division
MoE of Estonia. 2015. Website. River basin management plans. Ministry of the Environment of Estonia
MoERD. 2016. Website of MoERD. Ministry of Environmental Protection and Regional Development
NEFCO. 2008. NEFCO finances waste water treatment plants in Latvia. The Nordic Environment Finance
Corporation
Spalviņš, A., Gavena, I., Aleksans, O., Juhna, V. 2008 Artificial Recharging of Ground Water Resources
Experience in Well Field “Baltezers” (Latvia). In: Proceedings of Congress “Water: Ecology and Technology”
(ECWATECH-2008), Russia, Moscow, 4-5 June, 2008. Moscow: Crocus Expo Exhibition Center, 2008, pp.1-7.
UNDP. 2015. Human Development Reports: Data. United Nations Development Programme. New York.
World Bank. 2015. World Development Indicators. World DataBank. World Bank. Washington.