Embed Size (px)
Citation preview
COUNTRY ECONOMIC REVIEW NEPAL
December 2001
CURRENCY EQUIVALENTS (as of 31 December 2001)
Currency Unit – Nepalese Rupee/s (NRe/NRs) NRe1.00 = $0.01312 $1.00 = NRs76.30
ABBREVIATIONS ADB - Asian Development Bank AIC - Agriculture Inputs Corporation APP - Agriculture Perspective Plan GDP - gross domestic product IMF - International Monetary Fund MW - megawatt NBL - Nepal Bank Limited NRB - Nepal Rastra Bank RBB - Rastriya Banijya Bank STW - shallow tubewell UNDP - United Nations Development Programme VAT - value-added tax
NOTES (i) The Nepalese rupee is pegged to the Indian rupee (Re) at NRs1.60 to Re1.00, and is
fully convertible on all current account transactions. (ii) The exchange rate used to determine the dollar equivalent of Nepalese rupee values in
the text is the rate prevailing at the time of the events being discussed. (iii) The fiscal year (FY) of the Government ends on 15 July. FY before a calendar year
denotes the year in which the fiscal year ends, e.g., FY2001 ends on 15 July 2001. (iv) In this report, “$” refers to US dollars.
ii
CONTENTS Page MAP EXECUTIVE SUMMARY i I. RECENT ECONOMIC DEVELOPMENTS 1
A. Growth, Employment, Saving, and Investment 1 B. Fiscal Developments 7 C. Monetary Developments and Prices 11 D. External Trade, Balance of Payments, and Foreign Debt 13
II. SHORT- AND MEDIUM-TERM ECONOMIC PROSPECTS AND POLICY ISSUES 16 APPENDIX 23 This report was prepared by Sungsup Ra, Economist, SAOC, South Asia Department, with contributions from Nepal Resident Mission.
EXECUTIVE SUMMARY Despite a series of ambitious development plans and assistance from international aid agencies, Nepal’s economic growth has barely kept pace with its expanding population. In fiscal year (FY) 2001, gross national product per capita was only $249, making Nepal one of the poorest countries in the Asian region. Nepal ranked 129th out of 162 countries in the United Nations Development Programme’s (UNDP’s) Human Development Report 2001. Several structural factors hinder the country’s attempts at development, including: (i) the difficult terrain of a mountainous, landlocked country; (ii) heavy dependence on subsistence agriculture; (iii) low levels of physical infrastructure and human capital; (iv) low domestic resource mobilization and continued dependence on foreign assistance; (v) inadequate institutional capacity for development management; and (vi) poor governance. While the country has been moving toward a market-oriented economy since the early 1990s, frequent changes in government have hampered the realization of policy reforms and delayed the implementation of development projects. The government elected in May 1999 raised expectations that progress would be made in achieving the reforms necessary for the sustainable development of the country, but frequent political infighting and protests by the opposition party have meant that results to date have been limited. The deaths of members of the royal family on 1 June 2001 aggravated the political tension. The escalating insurgency has helped worsen the government’s poor delivery of basic services, and curtailed private sector activities. Overall economic performance in FY2001 remained favorable. Though growth in total output, as measured by gross domestic product (GDP), slowed from 6.1 percent of FY2000 to 5.0 percent in FY2001, it was still higher than the average growth rate of 4.7 percent during 1990s. The slowdown is mainly attributed to weaker performance in agricultural sector compared with the exceptionally strong growth in FY2000, sharp deceleration in manufacturing and continued weakness in tourism. The rate of gross fixed capital investment remained at 19 percent of GDP in FY2001 due to continued weakness in the private sector investment. However, the savings rate increased to 21 percent, mainly reflecting the robust economic growth during the past two years and an increase in net factor income from abroad. Domestic revenue collection in FY2001 recorded a strong 16 percent increase due to the Government’s enhanced revenue measures. However, it was more than offset by a 26 percent rise in expenditure, mainly for increased spending on security, a salary increase for civil servants, and the implementation of a voluntary early retirement scheme. As a result, the budget deficit widened to 4.2 percent of GDP from 3.3 percent in FY 2000. Dependence on foreign assistance increased further in FY2001, and the economy remains highly dependent on foreign assistance. Foreign grants and loans financed 58 percent of development expenditures in FY2001, a sharp increase from the 47 percent level over the past five years, a situation that is not likely to be reversed in the near future. The FY2002 budget is calling for domestic revenues to reach over 13 percent of GDP compared to 11.5 percent in FY 2001 and for a 27 percent increase in development expenditures from the level in FY2001. The budget speech emphasized the need to raise the efficiency of the civil service, but increases in civil service salaries preceded any such restructuring placing added strain on scarce domestic resources. The budget speech also emphasized the need for financial sector reform and private sector development in Nepal. Broad money (M2) was contained to slower growth of 15 percent in FY2001, within the authorities’ target range, compared with 22 percent in FY2000. A steep slowdown in the growth of net foreign assets compared with that of the previous year was a key contributing factor to slower growth of broad money. Because of the exchange rate peg with the Indian rupee and the
ii
active trade across the relatively open border between the two countries, inflation in Nepal generally follows India’s inflation rate. Inflation was low at 2.4 percent in FY2001—the lowest rate in more than 20 years—compared with 3.4 percent in the previous year. The increased agricultural production due to favorable weather throughout South Asia kept the prices of food items in check and helped counteract rising prices of non-food and service group including fuel, electricity, water, and education. Nepal’s current account deficit remained at 4.4 percent of GDP in FY2001, below the average deficit of 8.5 percent that prevailed during the 1990s. Growth in the dollar value of merchandise exports fell sharply to 3.7 percent in FY2001 compared with a substantial expansion of 42 percent in FY2000. Most of the decline was due to the sharp drop in exports of ready made garments, woolen carpets and jewelry. The dollar value of imports declined by nearly 1 percent, following a recovery of 20 percent growth in FY2000 reflecting sharp deceleration in manufacturing. Official grants and loans were more than sufficient to cover the current account deficit such that foreign exchange reserves continued to expand. At the end of FY2001, Nepal had about $1 billion in foreign exchange reserves, enough to cover about seven months of imports, and external debt was reduced to less than 47 percent of GDP. External debt had been about 50 percent of GDP for previous ten years. The debt service ratio has also fallen and, due to the concessional nature of Nepal's external debt, was at a manageable level of 3.9 percent of exports during FY2001. With continued prudent macroeconomic management, Nepal should continue to experience a stable macroeconomy over the medium term. The country has potential for growth rates to exceed 5 percent per year. However, actual performance would be still quite vulnerable to changes in the weather and external factors and internal factors such the accession of People’s Republic of China to the World Trade Organization and domestic and external political stability, given its narrow industrial base and limited number of trading partners. Nepal may be affected by any slowdown in the world economy due to the events of 11 September 2001 in the United States. These events have exacerbated the impact of a deepening global economic downturn, and have worsened external balances of other countries in the region. In particular, Nepal’s tourism and trade sectors, which were already adversely affected by domestic political instability, are likely to be hit further by these events. However, the impacts will depend on the extent of the downturn in the Indian economy, with which the Nepalese economy has strong trade and tourism links.
Single-digit inflation can be sustained, if supported by monetary policy geared toward supporting the exchange rate peg with the Indian rupee. Although exports should continue to expand, albeit at a slower rate, the current account deficit should also widen as public investment picks up while the savings rate remains stagnant. The expanding public investment program will lead to higher fiscal deficits and external debt as a share of GDP, but debt service should continue to be manageable, as additional borrowing will be mainly from concessional aid resources. To achieve the level of growth necessary to reduce poverty, Nepal needs to quickly restore effective law and order and to continue and accelerate the reforms that were begun in the early 1990s and agreed on during the National Development Forum in 2000 to provide an environment conducive to private sector development. Financial sector reform must be a cornerstone of the reform agenda to increase the country’s savings rate and funnel funds efficiently into productive investments. With the majority of the country’s poor depending on agriculture for their livelihood, the Government’s continued commitment to improving the performance of the agriculture sector within the broad framework of the Agriculture Perspective
iii
Plan is also important. Improved governance in the public sector will be a critical factor in maximizing development effectiveness. Public resource management reform is needed to ensure macroeconomic stability and effectively use the country’s limited public resources. It will require major improvements in budget planning, domestic and external resource management, and expenditure management. This should begin with redefining the role of the Government versus that of the private sector in the economy. Prioritization of development expenditures based on realistic estimates of resources should be expedited to raise the efficiency of public sector investments. Civil service reform, which aims to improve efficiency, predictability, transparency, and accountability, is critical to delivering public services more effectively and keeping recurrent expenditures in check. To reduce dependence on foreign assistance for the country’s development expenditures, continued efforts are needed to mobilize domestic resources and reduce the fiscal deficit.
1
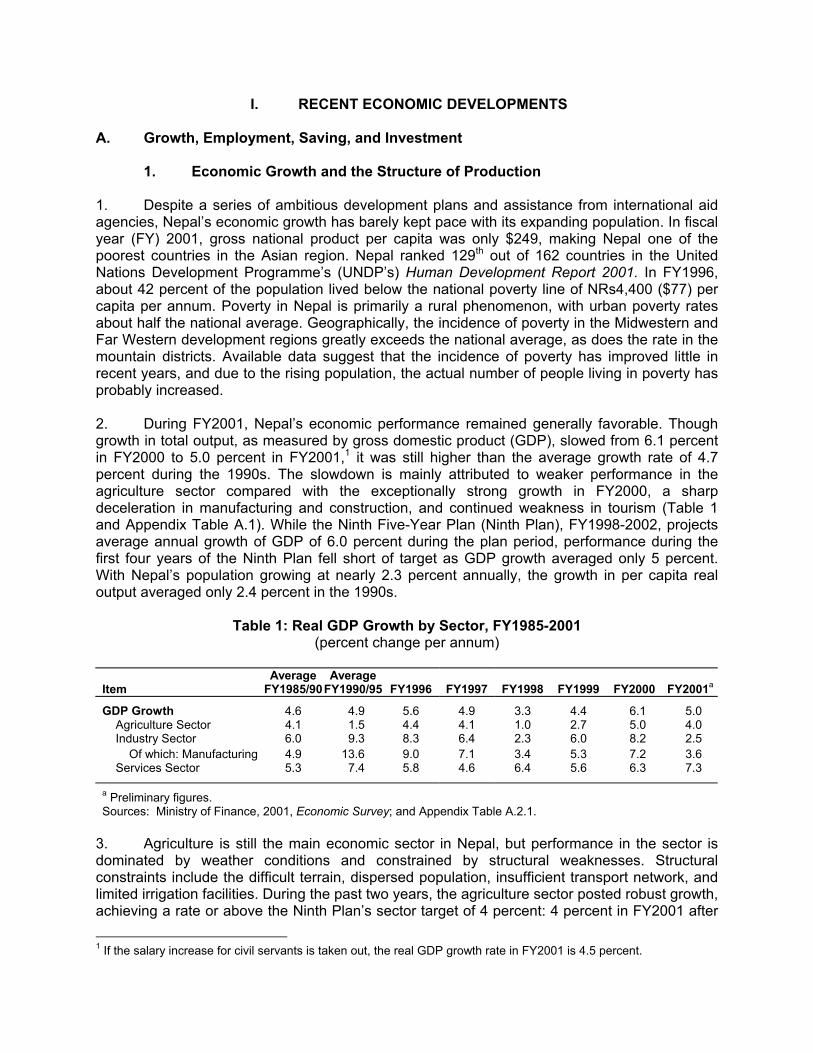
I. RECENT ECONOMIC DEVELOPMENTS A. Growth, Employment, Saving, and Investment 1. Economic Growth and the Structure of Production 1. Despite a series of ambitious development plans and assistance from international aid agencies, Nepal’s economic growth has barely kept pace with its expanding population. In fiscal year (FY) 2001, gross national product per capita was only $249, making Nepal one of the poorest countries in the Asian region. Nepal ranked 129th out of 162 countries in the United Nations Development Programme’s (UNDP’s) Human Development Report 2001. In FY1996, about 42 percent of the population lived below the national poverty line of NRs4,400 ($77) per capita per annum. Poverty in Nepal is primarily a rural phenomenon, with urban poverty rates about half the national average. Geographically, the incidence of poverty in the Midwestern and Far Western development regions greatly exceeds the national average, as does the rate in the mountain districts. Available data suggest that the incidence of poverty has improved little in recent years, and due to the rising population, the actual number of people living in poverty has probably increased. 2. During FY2001, Nepal’s economic performance remained generally favorable. Though growth in total output, as measured by gross domestic product (GDP), slowed from 6.1 percent in FY2000 to 5.0 percent in FY2001,1 it was still higher than the average growth rate of 4.7 percent during the 1990s. The slowdown is mainly attributed to weaker performance in the agriculture sector compared with the exceptionally strong growth in FY2000, a sharp deceleration in manufacturing and construction, and continued weakness in tourism (Table 1 and Appendix Table A.1). While the Ninth Five-Year Plan (Ninth Plan), FY1998-2002, projects average annual growth of GDP of 6.0 percent during the plan period, performance during the first four years of the Ninth Plan fell short of target as GDP growth averaged only 5 percent. With Nepal’s population growing at nearly 2.3 percent annually, the growth in per capita real output averaged only 2.4 percent in the 1990s.
Table 1: Real GDP Growth by Sector, FY1985-2001 (percent change per annum)
Item Average
FY1985/90 Average
FY1990/95 FY1996 FY1997 FY1998 FY1999 FY2000
FY2001a
GDP Growth 4.6 4.9 5.6 4.9 3.3 4.4 6.1 5.0 Agriculture Sector 4.1 1.5 4.4 4.1 1.0 2.7 5.0 4.0 Industry Sector 6.0 9.3 8.3 6.4 2.3 6.0 8.2 2.5 Of which: Manufacturing 4.9 13.6 9.0 7.1 3.4 5.3 7.2 3.6 Services Sector 5.3 7.4 5.8 4.6 6.4 5.6 6.3 7.3
a Preliminary figures. Sources: Ministry of Finance, 2001, Economic Survey; and Appendix Table A.2.1.
3. Agriculture is still the main economic sector in Nepal, but performance in the sector is dominated by weather conditions and constrained by structural weaknesses. Structural constraints include the difficult terrain, dispersed population, insufficient transport network, and limited irrigation facilities. During the past two years, the agriculture sector posted robust growth, achieving a rate or above the Ninth Plan’s sector target of 4 percent: 4 percent in FY2001 after 1 If the salary increase for civil servants is taken out, the real GDP growth rate in FY2001 is 4.5 percent.
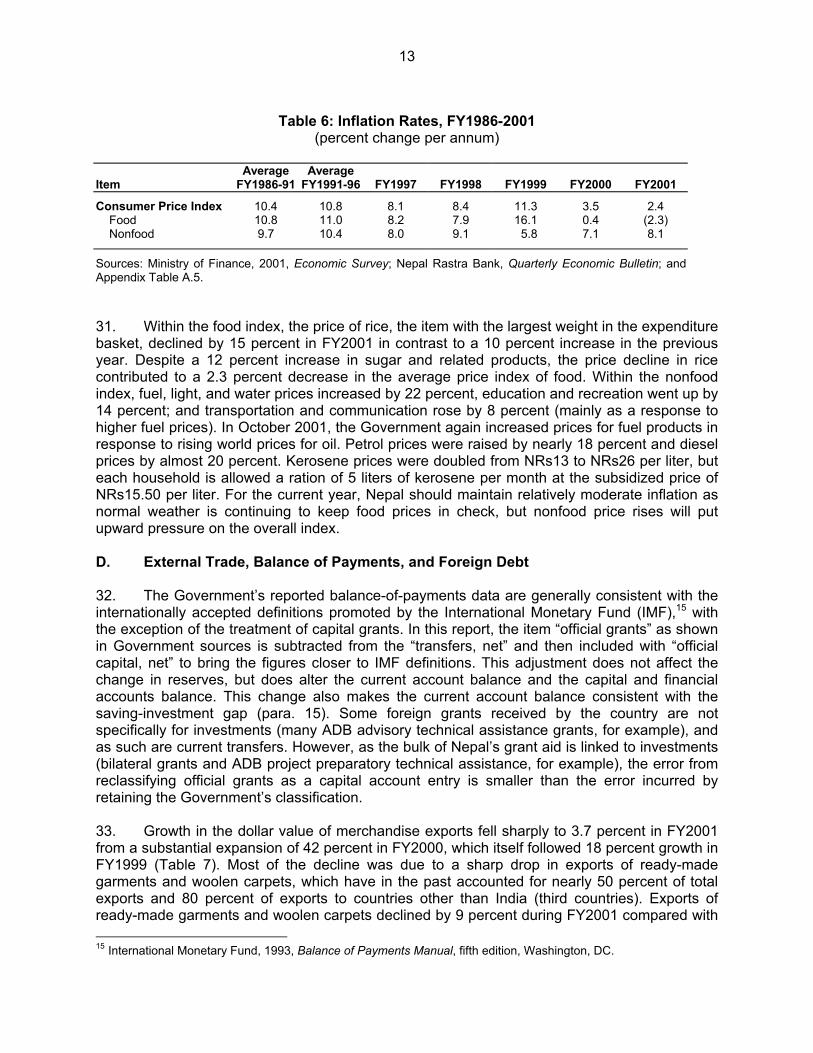
2
5 percent in FY2000 (Table 1 and Appendix Table A.2.1). This is mainly due to favorable monsoon weather. Rice production was more than 4.2 million metric tons in FY2001, a 4.6 percent increase in output from the previous year. Wheat and millet production decreased by 2.2 percent and 4.0 percent, respectively, mainly due to unusually dry winter weather, compared with 9.0 percent and 1.4 percent increases, respectively, in FY2000. Cash crop production continued to register more than 7 percent growth in the past two years. 4. The Government’s 20-year plan for the sector, the Agriculture Perspective Plan (APP), aims to eliminate the structural constraints in the sector and reduce the burden from the country’s physical constraints. The APP has identified priorities involving four essential inputs—fertilizers, irrigation, road and power, and extension services—and four priority outputs—livestock, high-valued crops, agribusiness, and forestry. Under the APP, the monopoly of the state-owned Agricultural Inputs Corporation (AIC) on the import and distribution of fertilizer was eliminated. All fertilizer prices were completely deregulated in FY1999 and fertilizer subsidies were removed in FY2000. The restructuring steps that aim to split the AIC into two private corporations, fertilizer and seed companies, are expected to be finalized in FY2002 subject to availability of government funds for severance payments to some 700 staff. Similarly, to promote the development of shallow tubewells (STWs), the capital cost subsidies for STWs were removed in FY2000.2 The role of the state-owned Nepal Food Corporation in the distribution of foodgrains is also being rationalized to promote more private sector activity. The goal of the APP is to raise the annual agricultural growth rate to 5 percent, while reducing the variation in growth performance due to the sector’s current dependence on the weather. 5. Although growth in the industry sector has been generally higher than in agriculture, its growth rate is also subject to wide year-to-year fluctuations. The industrial base is very narrow, and its development is constrained by inadequate infrastructure, a small domestic market, high transport costs, and a low domestic savings rate. Growth of the industry sector remained sluggish at only 2.5 percent in FY2001 compared to an expansion of 8.2 percent in FY2000. It was the first time that growth in the industry sector was lower than agriculture since FY1990. The decline in the growth rate was mainly due to a sharp contraction in manufacturing and construction, which grew by only 3.6 percent and 0.8 percent, respectively (Appendix Table A.2.1). The Ninth Plan projects an average annual growth rate of 7.7 percent for industry during the plan period; however, actual performance averaged only 5.6 percent during the first four years. 6. Within the industry sector, manufacturing has been the strongest performer since the 1991 Trade and Transit treaties with India, which have provided Nepal’s manufacturers access to the vast Indian market and the port at Calcutta. As the Trade Treaty was renewed in December 1996 and the Transit Treaty in January 1999, the prospects for the manufacturing sector are promising.3 However, reliance on the production of a limited range of goods leaves the manufacturing subsector vulnerable to external shocks.4 In FY2001, manufacturing grew at
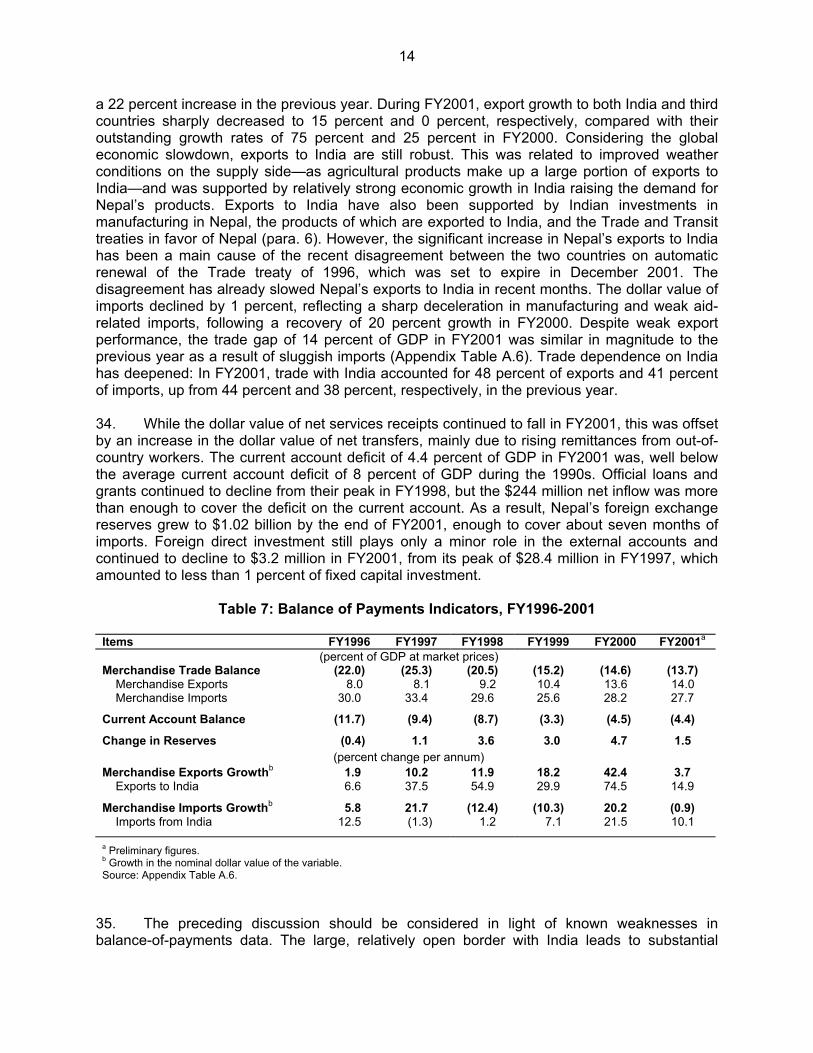
2 The final removal of STW subsidies coincided with a reduced demand for installation of STWs, raising the
Government’s concern over the removal of subsidies. Consequently, the Government and Asian Development Bank (ADB) have initiated a joint study to assess demand for STWs.
3 The Indian and Nepalese governments are in the process of renegotiating these treaties based on India’s concerns. The preferential treatment for Nepalese exports to India provisioned in the 1996 Treaty is not likely to continue as in the past as India is now seeking a minimum local labor/material content in Nepal’s exports to India.
4 According to the industrial and commercial census of FY1997, the main manufacturing industries are textiles, apparel, and footwear; and food, beverages, and tobacco. Together, these industries account for nearly half of all manufacturing establishments and almost 70 percent of manufacturing value added. Even within these broad aggregates, manufacturing activity tends to be concentrated in relatively few industries. Carpets and rugs, and
3
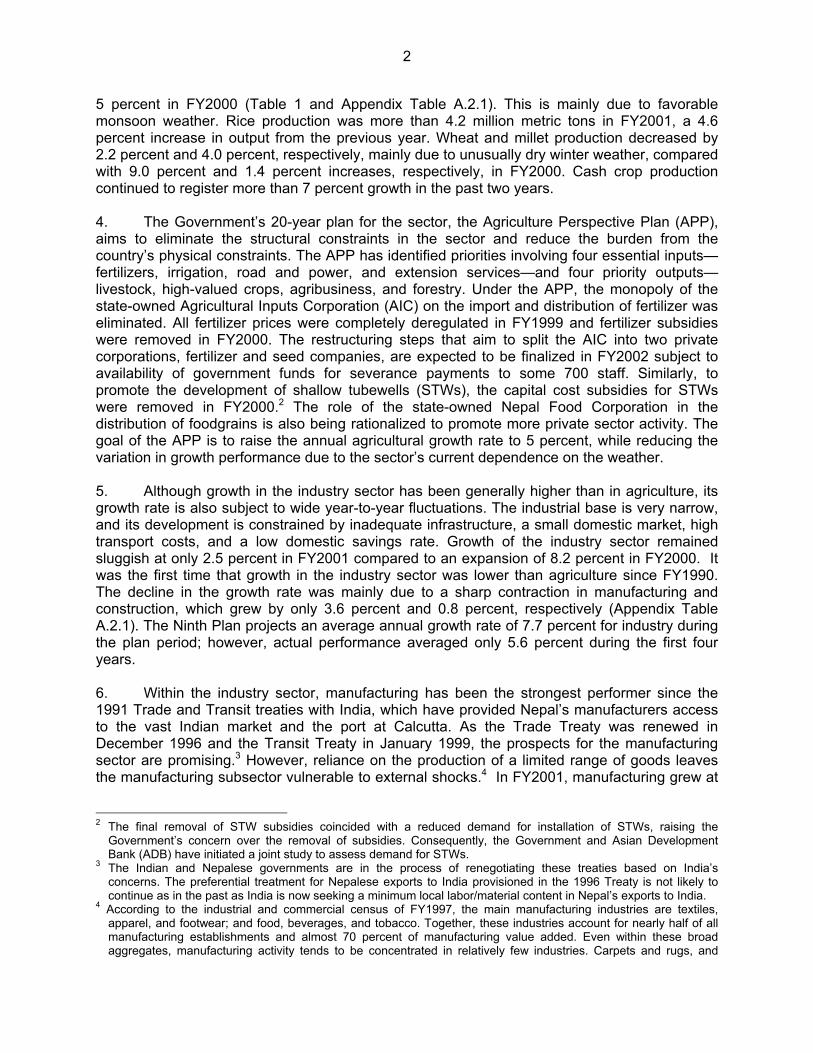
only 3.6 percent compared with an impressive growth rate of 7.2 percent in the previous year. This deceleration is attributable to a sharp contraction in the woolen carpet and ready-made garment industries, which were adversely affected by their inability to maintain the quality of their products, the disruptions caused by the insurgency, and lower external demand from the United States (US) and Europe. 7. Despite a series of market-oriented policy reform since the early 1990s, one survey study indicates that bureaucratic burdens remain the greatest obstacle to doing business in Nepal (Figure 1).5 Firms suffer from bureaucratic burdens mainly associated with excessive red tape, delays, and corruption as well as unpredictability, inconsistency, lack of clarity, and poor implementation of government policy. Weak domestic and external demand, poor access to finance, inadequate infrastructure services, poor layoff procedures of permanent labor, and unavailability of skilled workers are among the major obstacles. The survey also shows that manufacturing sector productivity is low by international standards. Firms having access to learning mechanisms, which assist in acquiring and using new technologies, exhibit higher productivity on average. However, private as well as collective learning mechanisms such as training, trade, and foreign direct investment, are very limited in Nepal. Rigid labor regulations including difficult layoff procedures seem encouraging firms to hire casual workers rather than permanent workers. The survey shows that the manufacturing sector chooses to operate with 48 percent casual workers. In addition to the findings of the survey, rigid labor regulations and politicization of labor unions encourage industries to employ capital-intensive technologies. These point to need for a proper balance between labor rights and flexibility in the terms of labor employment.
16.3
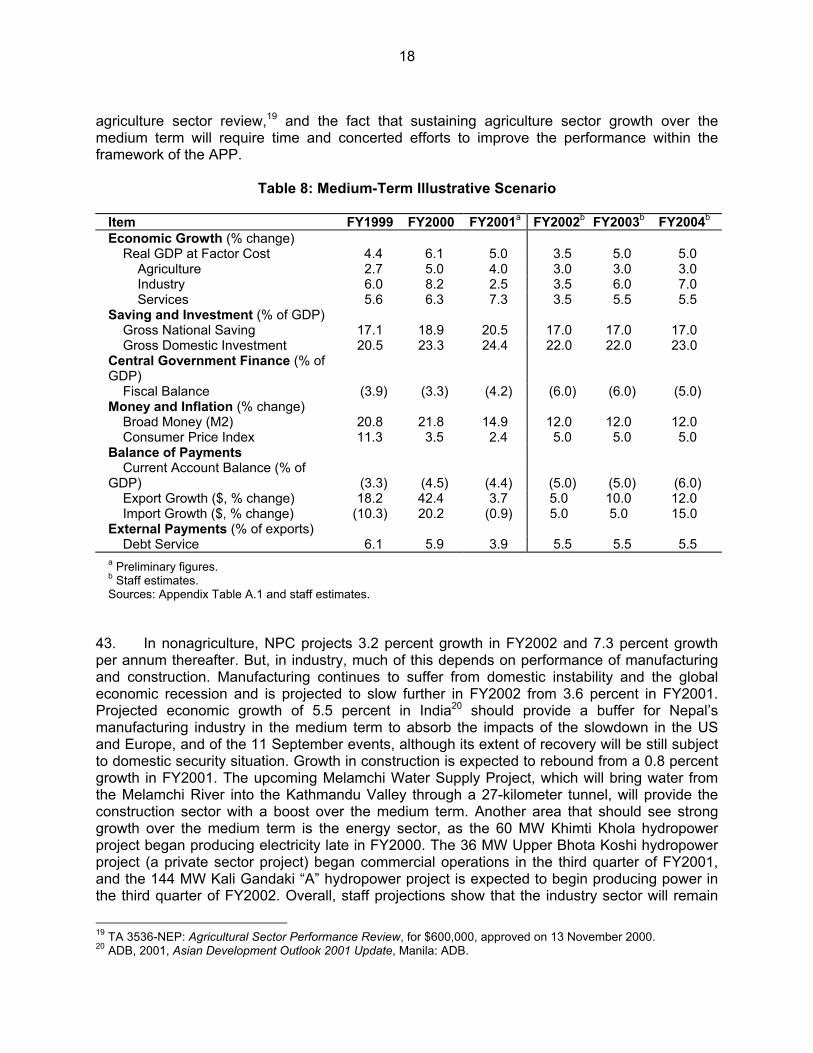
8.59.09.0
10.912.4
15.0
18.9
0%
5%
10%
15%
20%
BureaucraticBurden
GovernmentPolicy
Weak Demand Infrastructure Access toFinance
Labor BusinessSupport
Others
Bigg
est B
usin
ess
Obs
tacl
e
Figure 1: Business Environment in Nepal, FY2000
Source: World Bank and Federation of Nepalese Chambers of Commerce and Industry, 2000, The Business Environment and Manufacturing Performance in Nepal. 8. Nepal’s estimated potential for hydropower generation is 83,000 megawatts (MW), of which about 42,000 MW is technically and economically viable, but only about 384 MW, or 0.9 percent, has been developed to date. The national electrification ratio remains low at only 15
wearing apparel—two major exports to countries other than India—account for the bulk of the firms, employees, and value added within textiles, apparel, and footwear.
5 World Bank and Federation of Nepalese Chambers of Commerce and Industry, 2000, The Business Environment and Manufacturing Performance in Nepal.
4
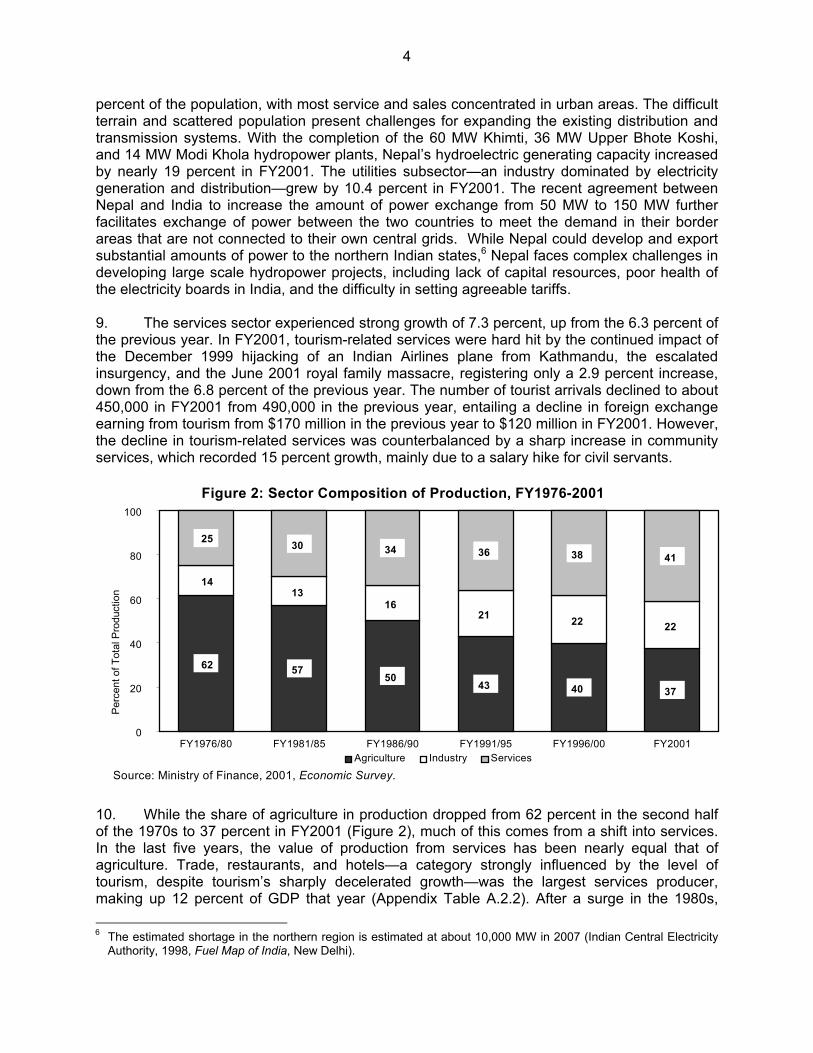
percent of the population, with most service and sales concentrated in urban areas. The difficult terrain and scattered population present challenges for expanding the existing distribution and transmission systems. With the completion of the 60 MW Khimti, 36 MW Upper Bhote Koshi, and 14 MW Modi Khola hydropower plants, Nepal’s hydroelectric generating capacity increased by nearly 19 percent in FY2001. The utilities subsector—an industry dominated by electricity generation and distribution—grew by 10.4 percent in FY2001. The recent agreement between Nepal and India to increase the amount of power exchange from 50 MW to 150 MW further facilitates exchange of power between the two countries to meet the demand in their border areas that are not connected to their own central grids. While Nepal could develop and export substantial amounts of power to the northern Indian states,6 Nepal faces complex challenges in developing large scale hydropower projects, including lack of capital resources, poor health of the electricity boards in India, and the difficulty in setting agreeable tariffs. 9. The services sector experienced strong growth of 7.3 percent, up from the 6.3 percent of the previous year. In FY2001, tourism-related services were hard hit by the continued impact of the December 1999 hijacking of an Indian Airlines plane from Kathmandu, the escalated insurgency, and the June 2001 royal family massacre, registering only a 2.9 percent increase, down from the 6.8 percent of the previous year. The number of tourist arrivals declined to about 450,000 in FY2001 from 490,000 in the previous year, entailing a decline in foreign exchange earning from tourism from $170 million in the previous year to $120 million in FY2001. However, the decline in tourism-related services was counterbalanced by a sharp increase in community services, which recorded 15 percent growth, mainly due to a salary hike for civil servants.
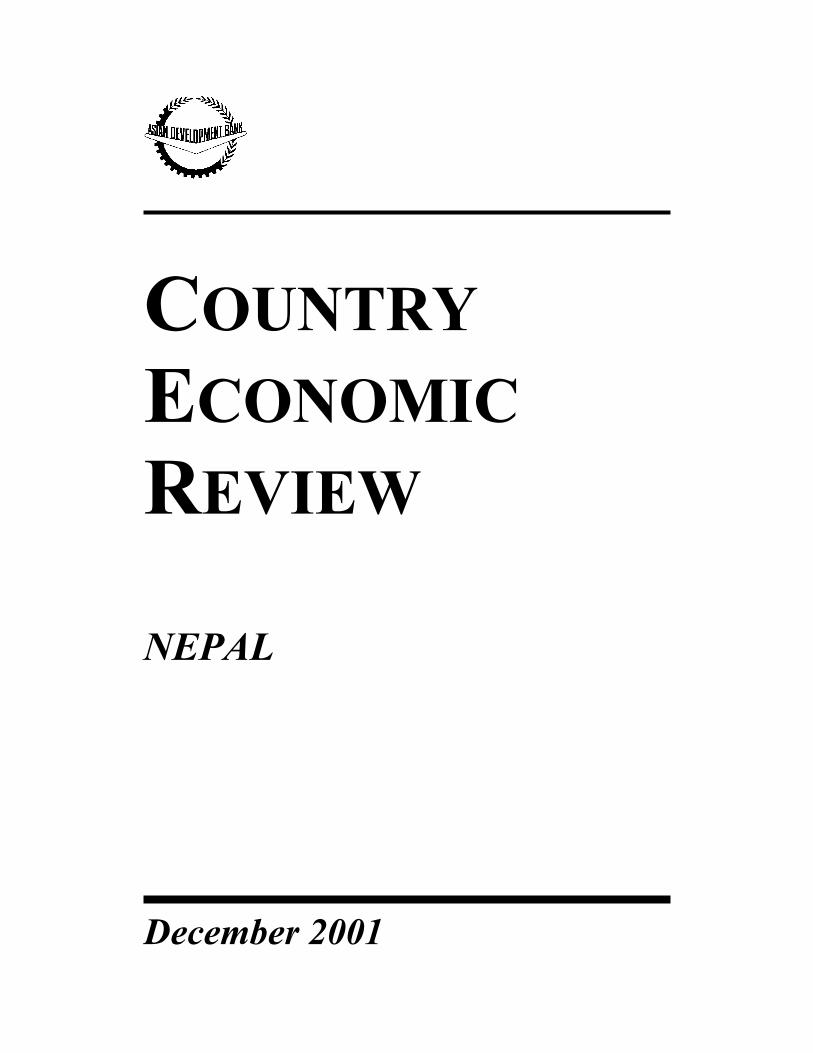
10. While the share of agriculture in production dropped from 62 percent in the second half of the 1970s to 37 percent in FY2001 (Figure 2), much of this comes from a shift into services. In the last five years, the value of production from services has been nearly equal that of agriculture. Trade, restaurants, and hotels—a category strongly influenced by the level of tourism, despite tourism’s sharply decelerated growth—was the largest services producer, making up 12 percent of GDP that year (Appendix Table A.2.2). After a surge in the 1980s, 6 The estimated shortage in the northern region is estimated at about 10,000 MW in 2007 (Indian Central Electricity
Authority, 1998, Fuel Map of India, New Delhi).
Figure 2: Sector Composition of Production, FY1976-2001
62 57 50
43 40 37
14 13
16 21 22 22
25 30 34 36 38 41
0
20
40
60
80
100
FY1976/80 FY1981/85 FY1986/90 FY1991/95 FY1996/00 FY2001
Perc
ent o
f Tot
al P
rodu
ctio
n
Agriculture Industry Services
Source: Ministry of Finance, 2001, Economic Survey.
5
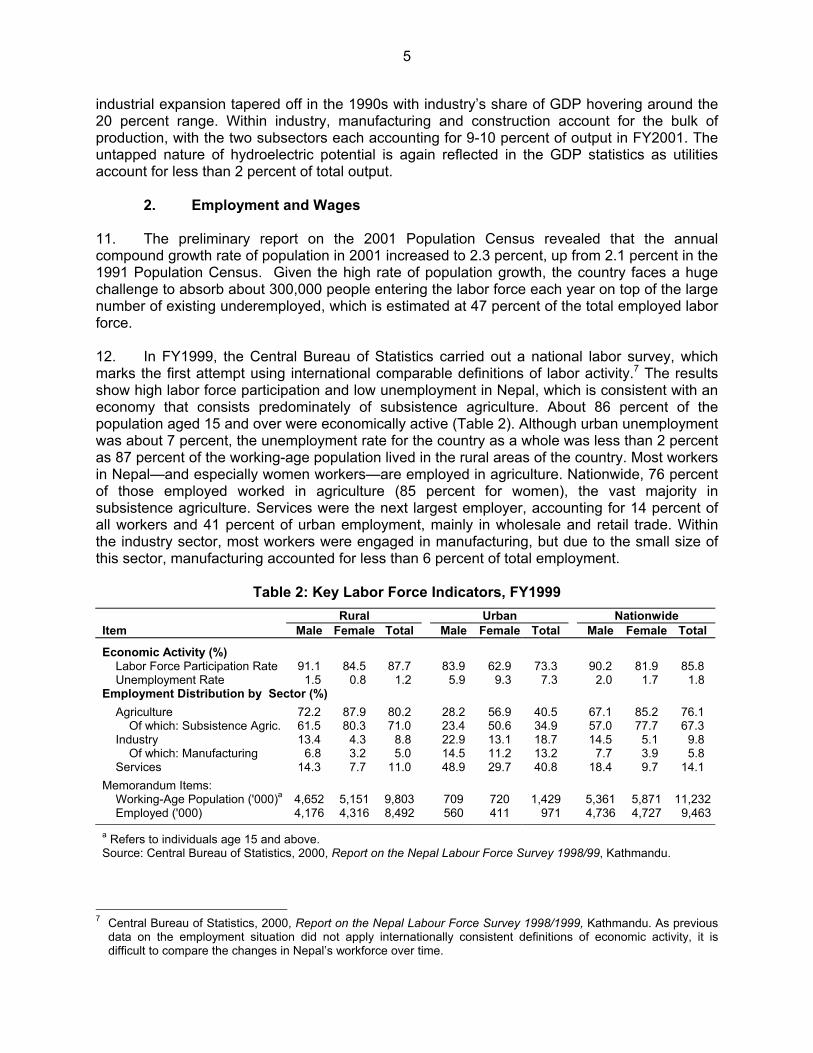
industrial expansion tapered off in the 1990s with industry’s share of GDP hovering around the 20 percent range. Within industry, manufacturing and construction account for the bulk of production, with the two subsectors each accounting for 9-10 percent of output in FY2001. The untapped nature of hydroelectric potential is again reflected in the GDP statistics as utilities account for less than 2 percent of total output. 2. Employment and Wages 11. The preliminary report on the 2001 Population Census revealed that the annual compound growth rate of population in 2001 increased to 2.3 percent, up from 2.1 percent in the 1991 Population Census. Given the high rate of population growth, the country faces a huge challenge to absorb about 300,000 people entering the labor force each year on top of the large number of existing underemployed, which is estimated at 47 percent of the total employed labor force. 12. In FY1999, the Central Bureau of Statistics carried out a national labor survey, which marks the first attempt using international comparable definitions of labor activity.7 The results show high labor force participation and low unemployment in Nepal, which is consistent with an economy that consists predominately of subsistence agriculture. About 86 percent of the population aged 15 and over were economically active (Table 2). Although urban unemployment was about 7 percent, the unemployment rate for the country as a whole was less than 2 percent as 87 percent of the working-age population lived in the rural areas of the country. Most workers in Nepal—and especially women workers—are employed in agriculture. Nationwide, 76 percent of those employed worked in agriculture (85 percent for women), the vast majority in subsistence agriculture. Services were the next largest employer, accounting for 14 percent of all workers and 41 percent of urban employment, mainly in wholesale and retail trade. Within the industry sector, most workers were engaged in manufacturing, but due to the small size of this sector, manufacturing accounted for less than 6 percent of total employment.
Table 2: Key Labor Force Indicators, FY1999
Rural Urban Nationwide Item Male Female Total Male Female Total Male Female Total
Economic Activity (%) Labor Force Participation Rate 91.1 84.5 87.7 83.9 62.9 73.3 90.2 81.9 85.8 Unemployment Rate 1.5 0.8 1.2 5.9 9.3 7.3 2.0 1.7 1.8 Employment Distribution by Sector (%)
Agriculture 72.2 87.9 80.2 28.2 56.9 40.5 67.1 85.2 76.1 Of which: Subsistence Agric. 61.5 80.3 71.0 23.4 50.6 34.9 57.0 77.7 67.3 Industry 13.4 4.3 8.8 22.9 13.1 18.7 14.5 5.1 9.8 Of which: Manufacturing 6.8 3.2 5.0 14.5 11.2 13.2 7.7 3.9 5.8 Services 14.3 7.7 11.0 48.9 29.7 40.8 18.4 9.7 14.1
Memorandum Items: Working-Age Population ('000)a 4,652 5,151 9,803 709 720 1,429 5,361 5,871 11,232 Employed ('000) 4,176 4,316 8,492 560 411 971 4,736 4,727 9,463
a Refers to individuals age 15 and above. Source: Central Bureau of Statistics, 2000, Report on the Nepal Labour Force Survey 1998/99, Kathmandu.
7 Central Bureau of Statistics, 2000, Report on the Nepal Labour Force Survey 1998/1999, Kathmandu. As previous
data on the employment situation did not apply internationally consistent definitions of economic activity, it is difficult to compare the changes in Nepal’s workforce over time.
6
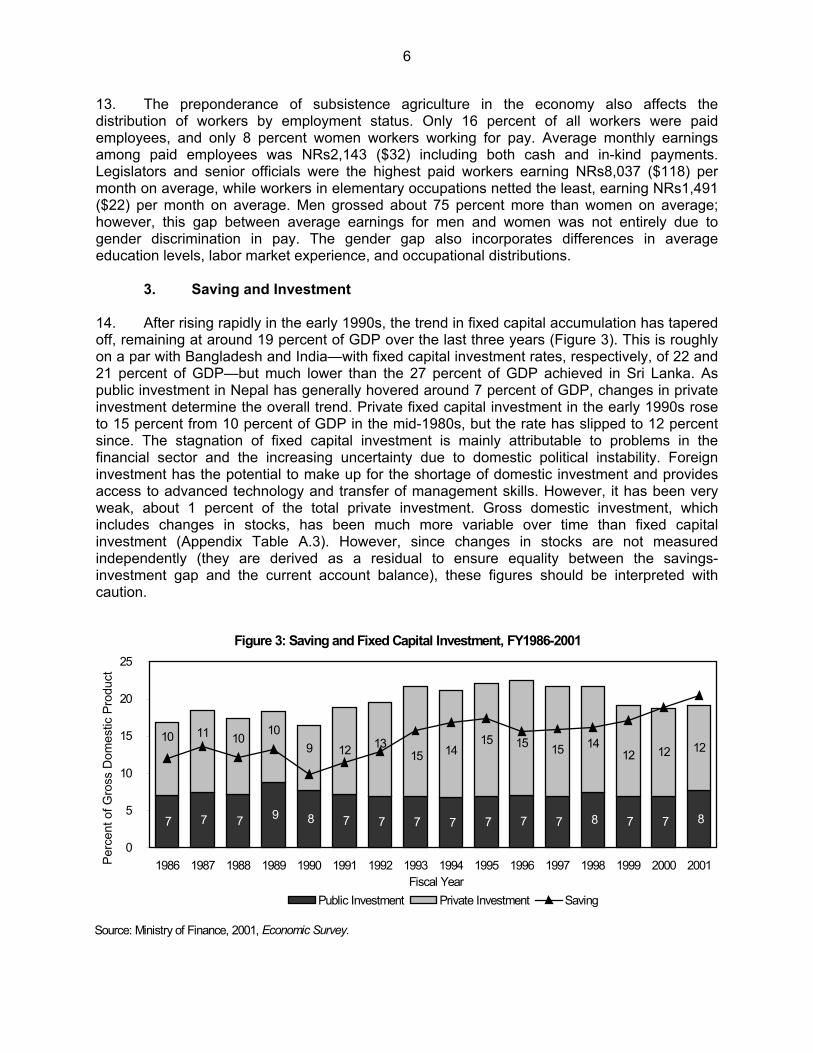
13. The preponderance of subsistence agriculture in the economy also affects the distribution of workers by employment status. Only 16 percent of all workers were paid employees, and only 8 percent women workers working for pay. Average monthly earnings among paid employees was NRs2,143 ($32) including both cash and in-kind payments. Legislators and senior officials were the highest paid workers earning NRs8,037 ($118) per month on average, while workers in elementary occupations netted the least, earning NRs1,491 ($22) per month on average. Men grossed about 75 percent more than women on average; however, this gap between average earnings for men and women was not entirely due to gender discrimination in pay. The gender gap also incorporates differences in average education levels, labor market experience, and occupational distributions. 3. Saving and Investment 14. After rising rapidly in the early 1990s, the trend in fixed capital accumulation has tapered off, remaining at around 19 percent of GDP over the last three years (Figure 3). This is roughly on a par with Bangladesh and India—with fixed capital investment rates, respectively, of 22 and 21 percent of GDP—but much lower than the 27 percent of GDP achieved in Sri Lanka. As public investment in Nepal has generally hovered around 7 percent of GDP, changes in private investment determine the overall trend. Private fixed capital investment in the early 1990s rose to 15 percent from 10 percent of GDP in the mid-1980s, but the rate has slipped to 12 percent since. The stagnation of fixed capital investment is mainly attributable to problems in the financial sector and the increasing uncertainty due to domestic political instability. Foreign investment has the potential to make up for the shortage of domestic investment and provides access to advanced technology and transfer of management skills. However, it has been very weak, about 1 percent of the total private investment. Gross domestic investment, which includes changes in stocks, has been much more variable over time than fixed capital investment (Appendix Table A.3). However, since changes in stocks are not measured independently (they are derived as a residual to ensure equality between the savings-investment gap and the current account balance), these figures should be interpreted with caution.
Figure 3: Saving and Fixed Capital Investment, FY1986-2001
8 9 7 7 7 8 7 7 7 7 7 7 7 7 7 8
10 11 10 109 15 14 15 14
1212 13 15 1512 12
0%
5%
10%
15%
20%
25%
1986 1987 1988 1989 1990 1991 1992 1993 1994 1995 1996 1997 1998 1999 2000 2001Fiscal Year
Perc
ent o
f Gro
ss D
omes
tic P
rodu
ct
Public Investment Private Investment Saving
Source: Ministry of Finance, 2001, Economic Survey.
7
15. The savings rate rose sharply over the last six years. This reflected mainly an increase in the private saving rate resulting from recent robust economic growth and an increase in net transfers from abroad. While the savings rate of 20.5 percent of GDP in FY2001 is an improvement over past performance, it is still low compared with Bangladesh (22 percent), India (22 percent), and Sri Lanka (24 percent). The savings rate exceeded the investment rate measured by gross fixed capital formation in FY2001 for the first time in 30 years. As a result, the savings-investment gap fell to a record low of 4 percent in FY2001. Sluggish private investment is worrisome as it undermines the ability of the economy to sustain future growth and to generate employment opportunities, which are critical for poverty reduction. In addition, investment efficiency is still low compared with other countries in the region.8 The necessary reforms to address these issues include measures to strengthen the financial sector and improve predictability, transparency, and accountability in all institutions, in both the public and private sectors. B. Fiscal Developments 1. Recent Fiscal Performance9 16. While domestic revenue generation has improved since the early 1990s, receipts are still much too low. In FY2001, domestic revenue collection recorded strong 16 percent growth due to the Government’s enhanced revenue measures, reaching 11.5 percent of GDP, up from the previous year’s less than 11 percent of GDP (Table 3). However, domestic revenue of NRs47 billion was still lower than the budgeted NRs50 billion. In comparison, domestic revenue generation in other South Asian countries is much higher than in Nepal: 15.3 percent of GDP in India, 16.1 percent in Pakistan, and 18.5 percent in Sri Lanka. Only Bangladesh has a lower revenue generation rate than Nepal (9.4 percent of GDP). However, the figures for domestic revenue generation are understated as some earmarked taxes and fees—such as the airport tax—are off-budget items. Tax collection in FY2001 was 9.5 percent of GDP, a 16 percent improvement from the previous year (Appendix Table A.4). Indirect taxes make up about 75 percent of tax revenues, mainly from customs duties (33 percent of the total) and value-added tax (VAT) (30 percent). 17. With the Government’s strong measures, significant progress on tax administration has recently been made. The introduction of VAT in November 1997 was meant to be the centerpiece of overall tax reform. Though the rate for VAT was reduced to 10 percent from the 15 percent originally envisaged, the minimum size of businesses subject to VAT decreased from NRs4.5 million in revenue to NRs2.0 million, while registrations doubled from 9,082 in FY1999 to about 18,000 in FY2000. Issuing invoices at the retail level and refunding VAT are still problems. Customs duties are collected according to official valuation rather than purchase price, while income tax is levied on a negotiated amount rather than on account, both of which lead to underinvoicing. Measures to strengthen VAT system are being implemented, which 8 The incremental capital-output ratio (ICOR) defined as a ratio of the real rate of capital accumulation to the real rate of output growth, was high at 4.3 in Nepal in FY2000, compared with 3.0 in India and 3.5 in Bangladesh. 9 Since the Government’s reported fiscal data do not follow internationally consistent definitions and formats, as
detailed by the International Monetary Fund (IMF), this report makes some minor adjustments to bring the budget figures closer to IMF definitions. The biggest adjustment is in the treatment of principal repayments on outstanding loans. The Government treats these payments as an expense, while IMF guidelines bring these below the line as part of net financing, so that the budget deficit reflects the net change in the outstanding national debt. The implication for the analysis is that the deficit figures in this report will be considerably lower than the Government’s official figures. IMF publishes the Nepal fiscal data according to these standards, but the data are not available on a timely basis. For the IMF guidelines, see Manual on Government Finance Statistics,1986, Washington, DC.
8
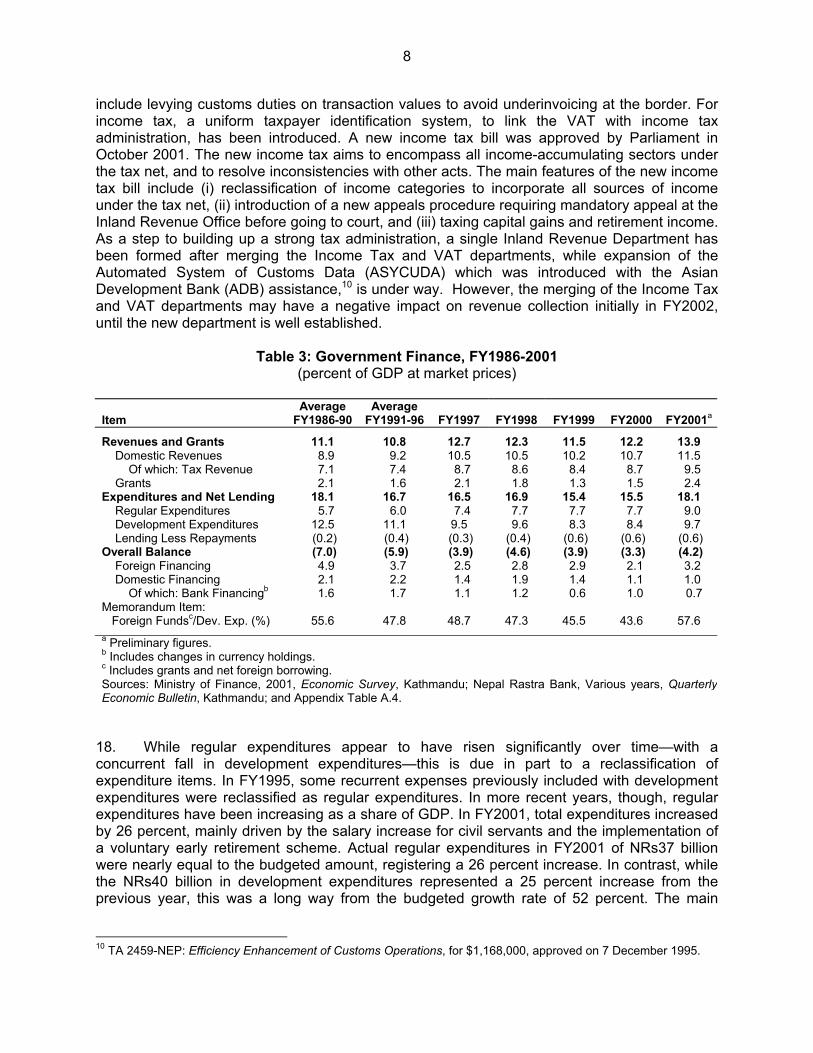
include levying customs duties on transaction values to avoid underinvoicing at the border. For income tax, a uniform taxpayer identification system, to link the VAT with income tax administration, has been introduced. A new income tax bill was approved by Parliament in October 2001. The new income tax aims to encompass all income-accumulating sectors under the tax net, and to resolve inconsistencies with other acts. The main features of the new income tax bill include (i) reclassification of income categories to incorporate all sources of income under the tax net, (ii) introduction of a new appeals procedure requiring mandatory appeal at the Inland Revenue Office before going to court, and (iii) taxing capital gains and retirement income. As a step to building up a strong tax administration, a single Inland Revenue Department has been formed after merging the Income Tax and VAT departments, while expansion of the Automated System of Customs Data (ASYCUDA) which was introduced with the Asian Development Bank (ADB) assistance,10 is under way. However, the merging of the Income Tax and VAT departments may have a negative impact on revenue collection initially in FY2002, until the new department is well established.
Table 3: Government Finance, FY1986-2001
(percent of GDP at market prices)
Item Average
FY1986-90Average
FY1991-96 FY1997 FY1998 FY1999 FY2000 FY2001a
Revenues and Grants 11.1 10.8 12.7 12.3 11.5 12.2 13.9 Domestic Revenues 8.9 9.2 10.5 10.5 10.2 10.7 11.5 Of which: Tax Revenue 7.1 7.4 8.7 8.6 8.4 8.7 9.5 Grants 2.1 1.6 2.1 1.8 1.3 1.5 2.4 Expenditures and Net Lending 18.1 16.7 16.5 16.9 15.4 15.5 18.1 Regular Expenditures 5.7 6.0 7.4 7.7 7.7 7.7 9.0 Development Expenditures 12.5 11.1 9.5 9.6 8.3 8.4 9.7 Lending Less Repayments (0.2) (0.4) (0.3) (0.4) (0.6) (0.6) (0.6) Overall Balance (7.0) (5.9) (3.9) (4.6) (3.9) (3.3) (4.2) Foreign Financing 4.9 3.7 2.5 2.8 2.9 2.1 3.2 Domestic Financing 2.1 2.2 1.4 1.9 1.4 1.1 1.0 Of which: Bank Financingb 1.6 1.7 1.1 1.2 0.6 1.0 0.7 Memorandum Item: Foreign Fundsc/Dev. Exp. (%) 55.6 47.8 48.7 47.3 45.5 43.6 57.6 a Preliminary figures. b Includes changes in currency holdings. c Includes grants and net foreign borrowing. Sources: Ministry of Finance, 2001, Economic Survey, Kathmandu; Nepal Rastra Bank, Various years, Quarterly Economic Bulletin, Kathmandu; and Appendix Table A.4.
18. While regular expenditures appear to have risen significantly over time—with a concurrent fall in development expenditures—this is due in part to a reclassification of expenditure items. In FY1995, some recurrent expenses previously included with development expenditures were reclassified as regular expenditures. In more recent years, though, regular expenditures have been increasing as a share of GDP. In FY2001, total expenditures increased by 26 percent, mainly driven by the salary increase for civil servants and the implementation of a voluntary early retirement scheme. Actual regular expenditures in FY2001 of NRs37 billion were nearly equal to the budgeted amount, registering a 26 percent increase. In contrast, while the NRs40 billion in development expenditures represented a 25 percent increase from the previous year, this was a long way from the budgeted growth rate of 52 percent. The main
10 TA 2459-NEP: Efficiency Enhancement of Customs Operations, for $1,168,000, approved on 7 December 1995.
9
regular expenditure item in FY2001, based on the budgeted figures,11 was salaries and allowances, which made up 26 percent of total regular expenditures. Grants and subsidies, the next largest item, made up 21 percent of the total, while interest payments accounted for 14 percent. On a sector basis, the social sectors—education and health subsectors in particular—accounted for the largest share (25 percent) due to the large wage component of this sector’s expenditures. The main sectors absorbing development expenditures in FY2001 were power (22 percent), transportation (14 percent), local development (11 percent), and irrigation (10 percent). 19. After a decline in the late 1980s, social sector spending increased in the 1990s, including education, health, and drinking water. In FY1990, social sector spending was less than 15 percent of total Government expenditures. By FY2001, the share had risen to nearly 26 percent, and this trend is expected to continue under the FY2002 budget. In the social sector, education is the largest subsector with expenditures of 2.8 percent of GDP, mainly on recurrent expenditures. While higher spending in these areas can improve social and human development in the country, the spending needs to be translated into sustainable results. Greater efforts to improve the quality, efficiency, and sustainability of the provision of social services are the immediate needs of the sector. 20. The FY2001 budget deficit widened to 4.2 percent of GDP from 3.3 percent in the previous year, but still remained manageable. The deficit of NRs17.3 billion was considerably less than the budgeted NRs26.7 billion, as the budgeted level of development spending could not be achieved due to the escalated insurgency and the poor revenue performance, particularly in the fourth quarter of FY 2001. As in previous years, the deficit was financed mainly by foreign borrowing from various bilateral and multilateral development agencies. In FY2001, foreign lending covered 77 percent of the deficit, with domestic banks covering 16 percent and domestic nonbank sources covering the remaining 7 percent of the deficit. The dependence on foreign aid further increased in FY2001, with foreign grants and loans financing 58 percent of development expenditures, a sharp increase from the 47 percent of level in the previous five years, and a situation that is unlikely to be reversed in the near future.
2. FY2002 Budget 21. While the FY2002 budget is not as ambitious as the FY2001 budget, it is still expansionary, with a total outlay of NRs90.1 billion, representing an increase of 22 percent over an estimate of NRs74 billion for FY2001. The Government is budgeting domestic revenues in excess of 13 percent of GDP due to a 22 percent increase in tax revenues. The main source of the additional tax revenue is improved tax collection through broadened VAT and income tax coverage and an introduction of a 10 percent capital gain tax. In addition, customs receipts are envisaged to rise through the incorporation of more foreign trade activities into the tax net. 22. The budget calls for a 27 percent increase in development expenditures to be financed in greater part by grant assistance, roughly on a par with the previous year’s level of 25 percent. A 14 percent increase in regular expenditure is still moderate compared to a 26 percent surge in the previous year, caused mainly by the civil service salary hike that was completed in FY2001. The budget faces a new burden to counteract the insurgence. Planned security expenditures for FY2002 remain at around 11 percent of total expenditures, up from less than 5 percent in the 1990s. Though the FY2002 Budget envisages the fiscal deficit remaining at the previous year’s 4.2 percent of GDP, it is likely to deteriorate to 6 percent as a result of anticipated shortfalls in 11 Actual expenditures are not reported by economic classification.
10
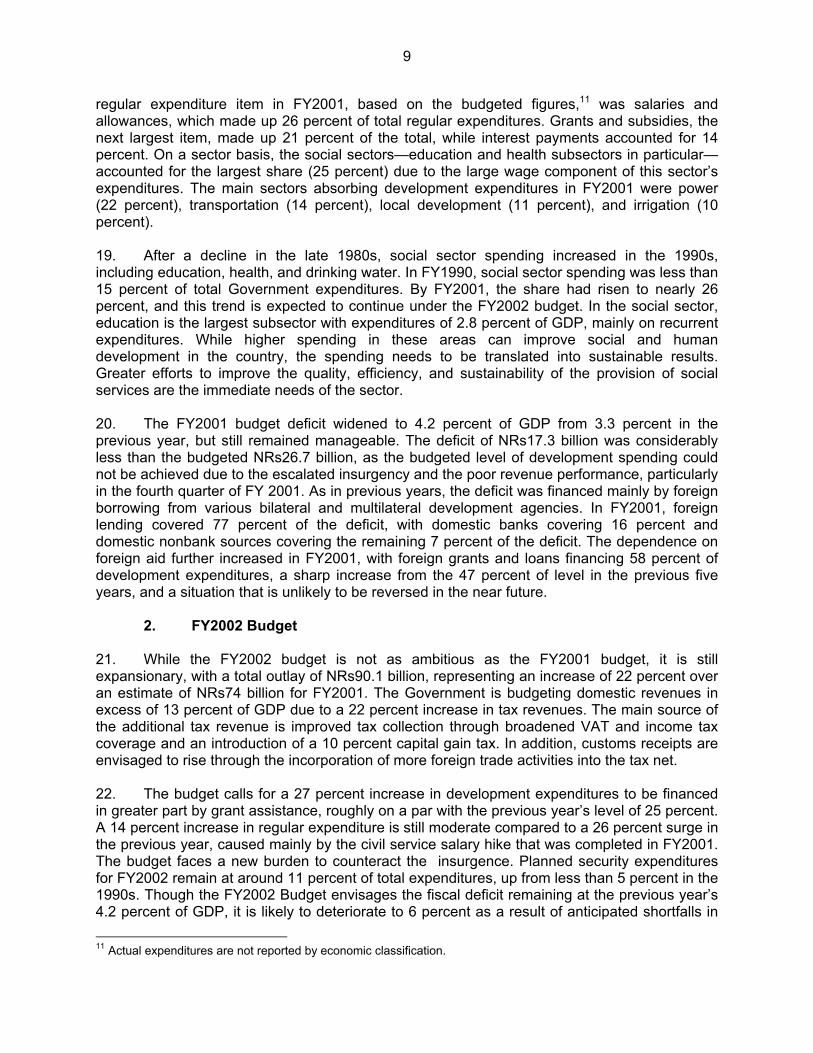
both domestic revenue collection and foreign grants and loans. The budget forecasts that most of the deficit (71 percent) will be financed by foreign borrowing. 23. Based on past experience, the Government may have difficulty in achieving its ambitious goals for development expenditures and foreign funding. In recent years, except in FY2001, foreign grants have fallen far short of projections (Table 4 and Appendix Table A.4), while foreign loans have been more than 25 percent less than the budgeted amount. Given the poor prospects for any significant improvement in domestic and external revenue mobilization, the prioritization and close monitoring of development expenditures and rationalization of regular expenditures will be more important.
Table 4: Comparison of Fiscal Performance with the Budget, FY1996-2001
(actual as percent of budget)
Item FY1996 FY1997 FY1998 FY1999 FY2000 FY2001a
Revenues and Grants 88.1 90.4 88.8 85.4 91.3 91.2 Domestic Revenues 88.3 89.8 88.7 91.4 96.5 93.4 Of which: Tax Revenue 85.5 91.3 87.7 93.1 95.7 91.3 Grants 86.8 93.5 89.6 55.8 66.0 81.7
Expenditures and Net Lending 90.4 88.2 89.6 82.7
85.4 89.9
Regular Expenditures 95.8 96.8 96.2 97.3 99.6 99.9 Development Expenditures 86.7 81.5 85.0 75.6 75.9 82.7 Lending Less Repayments 86.9 61.9 94.9 196.2 93.4 98.8
Overall Balance 98.0 81.6 91.6 75.7 68.8 85.8 Foreign Financing 75.5 59.2 63.3 60.2 57.5 91.4 Domestic Financing 270.0 240.6 273.4 143.8 109.0 71.5
a Preliminary figures. Sources: Ministry of Finance, 1996-2001, Budget Speech of the Fiscal Year, Kathmandu; and Appendix Table A.4.
24. A World Bank report12 details the weaknesses in the fiscal system including the following: (i) the annual budget is not well prioritized and not well linked to the five-year plan; (ii) the development budget is overprogrammed, due to political pressures to accommodate new projects, such that scarce resources are scattered among too many projects; and (iii) the mechanisms for screening projects and managing expenditures are weak. The World Bank report points to the need for the Government to focus its resources on fewer priority areas, stepping aside when the private sector is capable of providing the services. Good governance is key to ensuring that the priority areas are chosen according to the country’s needs when public sector involvement is required, and that resources are allocated in a transparent manner. 25. In his speech presenting the FY2002 budget, the Finance Minister reiterated, “The foremost goal of our entire development endeavor and of this budget is to achieve the prime objective of poverty reduction as envisaged by the Ninth Plan.” The budget speech also emphasized the need for raising the efficiency of the civil service and called for a hiring freeze until ministries are restructured. However, implementation of civil service salary increases before the restructuring has placed more pressure on scarce domestic resources in the short
12 World Bank, 2000, Nepal: Public Expenditure Review, Washington, DC.
11
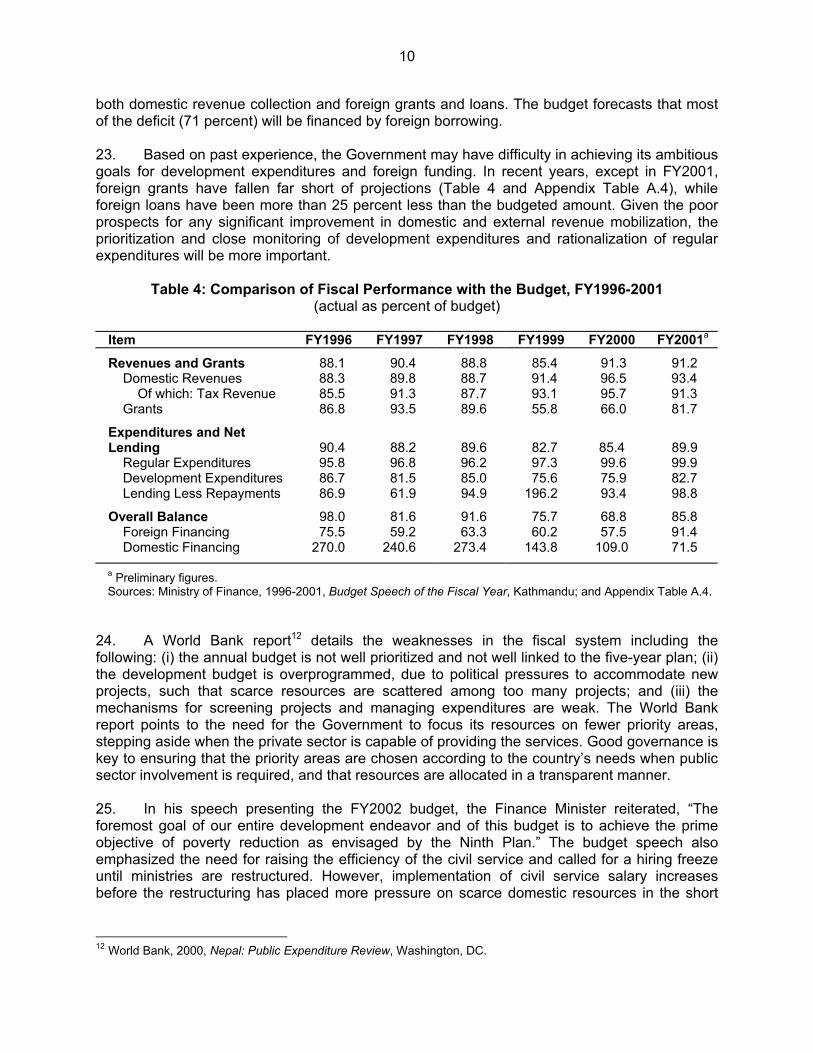
run. Financial sector reform and private sector development also featured prominently in the budget statement. C. Monetary Developments and Prices 26. The economy experienced significant monetary deepening and broadening over the course of the 1990s: broad money (M2) as a percentage of GDP has rapidly increased, reaching 52 percent in FY2001 from 32 percent in FY1990; and the share of time deposits to narrow money (M1) has also rapidly increased to 212 percent in FY2001 from 122 percent in FY1990. The main contributing factor to the growth in the money supply has been a growth in net foreign assets. On the other hand, domestic credit to the private sector has risen quickly at 24 percent per annum, significantly higher than the growth in money supply and credit to the government.13 The continued monetization of the economy, as indicated by the declining velocity of M2, accounts for the fact that such rates of money growth have not been inflationary so far. The comfortable foreign exchange reserve position—sufficient to cover more than seven months of imports—means that the current peg with the Indian rupee is sustainable if money growth is brought under control. However, the real appreciation of the currency, as Nepal’s inflation has generally been lower than India’s in the past five years, will negatively affect the country’s export potential, and this may undermine the exchange rate peg.
Table 5: Monetary Developments, FY1996-2001
Item FY1996 FY1997 FY1998 FY1999 FY2000 FY2001a
(percent of GDP at market prices)
Change in Net Foreign Assets 0.2 0.9 5.1 2.8 4.1 1.9 Change in Net Domestic Credit 6.6 4.4 5.0 5.6 6.1 7.1 to the Public Sectorb 1.4 0.6 2.1 1.5 1.2 2.6 to the Private Sector 5.2 3.8 2.8 4.1 4.9 4.5 Change in Broad Money (M2) 4.7 3.9 7.6 7.7 8.8 6.8 Change in Narrow Money (M1) 1.4 0.7 2.2 1.7 2.6 2.3
(percent change per annum)
Broad Money Growth (M2) 14.4 11.9 21.9 20.8 21.8 14.9 Narrow Money Growth (M1) 10.6 5.4 17.4 13.1 19.4 15.2 Memorandum Item:
Velocity of M2 2.7 2.7 2.4 2.3 2.1 2.0 a Preliminary figures. b Includes claims on government enterprises. Source: Appendix Table A.5.
27. However, reflecting slow economic growth, M2 was contained at slower growth of 14.9 percent in FY2001 after seeing rapid growth of 21-22 percent in the previous three years (Table 5). This is mainly due to a steeper decline in the growth of net foreign assets than in previous years. In terms of the monetary accounts from the asset side of the balance sheet, domestic credit to the public sector has expanded, reflecting a surge in net government borrowing in
13 During the 1990s, domestic credit to the Government grew relatively slowly at less than 11 percent per annum. The growth rates of M1 and M2 were 16 percent and 19 percent per annum, respectively.
12
FY2001. Additional credit, equivalent to 2.6 percent of GDP, was extended to the public sector in FY2001, compared with 1.2 percent in FY2000. Net foreign asset growth sharply declined to 7 percent in FY2001 from 22 percent in the previous year, to stand at 1.9 percent of GDP. The downward revision in interest rates on deposits and the resulting competition with non-bank financial institutions led to the slower growth of time deposits at banks to 15 percent in FY2001, down from 23 percent in FY2000. 28. The auction of Treasury bills and securities by the central bank, Nepal Rastra Bank (NRB), is an integral part of the monetary program, and open-market operations are the principal instrument for controlling domestic liquidity. NRB established a secondary market window for Government securities in FY1994 to improve open-market operations. In addition, steps were taken to reduce the Government’s automatic recourse to NRB’s overdraft facilities, which had complicated the conduct of monetary policy in the past. The authorization to issue Treasury bills was advanced to the beginning of the fiscal year, and a limit of NRs1 billion on the Government’s annual overdraft was established beginning in FY1998. However, this limit on the overdraft was not adhered to during FY2001 due to the adverse impact of the insurgency on revenue collection. The net overdraft sharply increased to NRs5.6 billion in FY2001 from NRs0.5 billion in the previous year. The Government must maintain a prudent fiscal stance to avoid fueling inflation, as the thin domestic market for Government securities means that the banking system will continue to provide much of the domestic financing of the budget deficit. 29. Commercial banking, the largest segment of the financial sector, is dominated by the state-owned Rastriya Banijya Bank (RBB) and the formerly state-owned Nepal Bank Limited (NBL). While these two banks account for about half of all commercial bank deposits, a recent audit of RBB and NBL, funded by the World Bank, showed the two institutions to be technically insolvent.14 Under the Government’s management, these two banks developed extensive, but costly, branch networks and staff resources. The inefficiencies of these two institutions and mounting nonrecoverable loans drive the interest rate spread between deposit and lending rates in the economy due to the shear size of their operations. Reforms are needed to (i) enhance the commercial orientation of these banks, and the operational autonomy and accountability of bank management; (ii) reduce overhead costs including staff retrenchment and consolidation of bank branches; and (iii) improve the quality of the portfolio and loan recovery rates of the banks. To address these problems, the Government prepared a Financial Sector Reform Strategy in FY2001, which includes strengthening the supervisory capabilities of NRB, restructuring and privatization of RBB and NBL, and establishment of the Credit Rating Agency and Asset Reconstruction Company. Management contracts to facilitate restructuring and ownership reform of RBB and NBL are expected in the second half of FY2002. In rural finance, the Agriculture Development Bank of Nepal suffers from similar problems as RBB and NBL, but the extent of the problem is unknown as a proper audit has not yet been done. 30. Because of the exchange rate peg to the Indian rupee and the active trade across the relatively open border between the two countries, inflation in Nepal generally follows India’s inflation rate. Inflation was a low 2.4 percent in FY2001—the lowest rate in more than 20 years—compared with an average of 10 percent during the 1990s (Table 6). Increased agricultural production due to favorable weather throughout South Asia kept the prices of food items in check. The decrease in food prices helped to counteract increases in administered prices, namely fuel, electricity, and water.
14 The audit estimated that RBB and NBL had a negative net worth of around $250 million-$420 million as of July
1998. These two banks accounts for 42 percent of commercial banking deposits, 48 percent of loans and advances, and 76 percent of the total branches in the commercial banking sector.
13
Table 6: Inflation Rates, FY1986-2001
(percent change per annum)
Item Average
FY1986-91 Average
FY1991-96 FY1997 FY1998 FY1999 FY2000
FY2001
Consumer Price Index 10.4 10.8 8.1 8.4 11.3 3.5 2.4 Food 10.8 11.0 8.2 7.9 16.1 0.4 (2.3) Nonfood 9.7 10.4 8.0 9.1 5.8 7.1 8.1
Sources: Ministry of Finance, 2001, Economic Survey; Nepal Rastra Bank, Quarterly Economic Bulletin; and Appendix Table A.5. 31. Within the food index, the price of rice, the item with the largest weight in the expenditure basket, declined by 15 percent in FY2001 in contrast to a 10 percent increase in the previous year. Despite a 12 percent increase in sugar and related products, the price decline in rice contributed to a 2.3 percent decrease in the average price index of food. Within the nonfood index, fuel, light, and water prices increased by 22 percent, education and recreation went up by 14 percent; and transportation and communication rose by 8 percent (mainly as a response to higher fuel prices). In October 2001, the Government again increased prices for fuel products in response to rising world prices for oil. Petrol prices were raised by nearly 18 percent and diesel prices by almost 20 percent. Kerosene prices were doubled from NRs13 to NRs26 per liter, but each household is allowed a ration of 5 liters of kerosene per month at the subsidized price of NRs15.50 per liter. For the current year, Nepal should maintain relatively moderate inflation as normal weather is continuing to keep food prices in check, but nonfood price rises will put upward pressure on the overall index. D. External Trade, Balance of Payments, and Foreign Debt 32. The Government’s reported balance-of-payments data are generally consistent with the internationally accepted definitions promoted by the International Monetary Fund (IMF),15 with the exception of the treatment of capital grants. In this report, the item “official grants” as shown in Government sources is subtracted from the “transfers, net” and then included with “official capital, net” to bring the figures closer to IMF definitions. This adjustment does not affect the change in reserves, but does alter the current account balance and the capital and financial accounts balance. This change also makes the current account balance consistent with the saving-investment gap (para. 15). Some foreign grants received by the country are not specifically for investments (many ADB advisory technical assistance grants, for example), and as such are current transfers. However, as the bulk of Nepal’s grant aid is linked to investments (bilateral grants and ADB project preparatory technical assistance, for example), the error from reclassifying official grants as a capital account entry is smaller than the error incurred by retaining the Government’s classification. 33. Growth in the dollar value of merchandise exports fell sharply to 3.7 percent in FY2001 from a substantial expansion of 42 percent in FY2000, which itself followed 18 percent growth in FY1999 (Table 7). Most of the decline was due to a sharp drop in exports of ready-made garments and woolen carpets, which have in the past accounted for nearly 50 percent of total exports and 80 percent of exports to countries other than India (third countries). Exports of ready-made garments and woolen carpets declined by 9 percent during FY2001 compared with 15 International Monetary Fund, 1993, Balance of Payments Manual, fifth edition, Washington, DC.
14
a 22 percent increase in the previous year. During FY2001, export growth to both India and third countries sharply decreased to 15 percent and 0 percent, respectively, compared with their outstanding growth rates of 75 percent and 25 percent in FY2000. Considering the global economic slowdown, exports to India are still robust. This was related to improved weather conditions on the supply side—as agricultural products make up a large portion of exports to India—and was supported by relatively strong economic growth in India raising the demand for Nepal’s products. Exports to India have also been supported by Indian investments in manufacturing in Nepal, the products of which are exported to India, and the Trade and Transit treaties in favor of Nepal (para. 6). However, the significant increase in Nepal’s exports to India has been a main cause of the recent disagreement between the two countries on automatic renewal of the Trade treaty of 1996, which was set to expire in December 2001. The disagreement has already slowed Nepal’s exports to India in recent months. The dollar value of imports declined by 1 percent, reflecting a sharp deceleration in manufacturing and weak aid-related imports, following a recovery of 20 percent growth in FY2000. Despite weak export performance, the trade gap of 14 percent of GDP in FY2001 was similar in magnitude to the previous year as a result of sluggish imports (Appendix Table A.6). Trade dependence on India has deepened: In FY2001, trade with India accounted for 48 percent of exports and 41 percent of imports, up from 44 percent and 38 percent, respectively, in the previous year. 34. While the dollar value of net services receipts continued to fall in FY2001, this was offset by an increase in the dollar value of net transfers, mainly due to rising remittances from out-of-country workers. The current account deficit of 4.4 percent of GDP in FY2001 was, well below the average current account deficit of 8 percent of GDP during the 1990s. Official loans and grants continued to decline from their peak in FY1998, but the $244 million net inflow was more than enough to cover the deficit on the current account. As a result, Nepal’s foreign exchange reserves grew to $1.02 billion by the end of FY2001, enough to cover about seven months of imports. Foreign direct investment still plays only a minor role in the external accounts and continued to decline to $3.2 million in FY2001, from its peak of $28.4 million in FY1997, which amounted to less than 1 percent of fixed capital investment.
Table 7: Balance of Payments Indicators, FY1996-2001 Items FY1996 FY1997 FY1998 FY1999 FY2000 FY2001a
(percent of GDP at market prices) Merchandise Trade Balance (22.0) (25.3) (20.5) (15.2) (14.6) (13.7) Merchandise Exports 8.0 8.1 9.2 10.4 13.6 14.0 Merchandise Imports 30.0 33.4 29.6 25.6 28.2 27.7
Current Account Balance (11.7) (9.4) (8.7) (3.3) (4.5) (4.4)
Change in Reserves (0.4) 1.1 3.6 3.0 4.7 1.5 (percent change per annum)
Merchandise Exports Growthb 1.9 10.2 11.9 18.2 42.4 3.7 Exports to India 6.6 37.5 54.9 29.9 74.5 14.9
Merchandise Imports Growthb 5.8 21.7 (12.4) (10.3) 20.2 (0.9) Imports from India 12.5 (1.3) 1.2 7.1 21.5 10.1
a Preliminary figures. b Growth in the nominal dollar value of the variable. Source: Appendix Table A.6.
35. The preceding discussion should be considered in light of known weaknesses in balance-of-payments data. The large, relatively open border with India leads to substantial
15
amounts of unrecorded trade. This is exacerbated by policy differentials between the two countries. For example, subsidies on Indian fertilizer have led to flows of unrecorded fertilizer imports, while customs procedures and valuations, in particular under-invoicing, have continued to understate import volumes.16 Barter trade across the border with the Tibet Autonomous Region of the People’s Republic of China is also not properly recorded, but is of a much smaller magnitude than the Indian trade. The figures for remittances from outside of the country are probably underestimated, but the size of the bias and its fluctuations from year to year are unclear.17 Data on foreign grants and loans are incomplete, particularly for commodity aid. The outgrowth of the unrecorded items in the balance-of-payments statistics compromises the large and volatile entries under “net errors and omissions”. 36. Nepal made considerable progress in the early 1990s in rationalizing its trade and exchange rate systems, achieving full foreign exchange convertibility for current account transactions in February 1993. During this period, the Government (i) rationalized the tariff structure; (ii) liberalized import controls, including abolishing the auction of import licenses; (iii) liberalized export regulations, including abolishing export price floors; (iv) improved export incentives by simplifying the duty drawback scheme for imported inputs for export production; (v) improved cargo handling and customs procedures; and (vi) removed restriction on foreign direct investment of NRs20 million or less.18 The number of tariff bands was reduced in FY1996. In FY2001, five tariff rates (5 percent, 10 percent, 15 percent, 25 percent, and 40 percent) and two special rates (80 percent and 130 percent, mainly for vehicles) were in force with most goods subject to the 15 or 25 percent rates. Nepal continues to pursue the objectives of low and nondiscriminatory import tariffs and is working to qualify for World Trade Organization membership. The effective tariff rate in FY2001 is estimated at about 13 percent, compared to 27 percent in India, 18 percent in Bangladesh, and 7 percent in Sri Lanka. 37. Given Nepal’s disadvantageous geographical location and relatively high cost of production base, its manufacturing sector needs to find niche export markets, especially in India and other countries. Also, instituting a coherent outward looking strategy and policy which is carefully designed to help the economy fully realize its potential comparative, is crucial to break the development impasse. This is especially important in agrobusiness and tourism. However, the design of such a strategy is constrained by Nepal’s relationship with India. With access to sea transport contingent on transit arrangements with India and the preferential trade agreement between the two countries, Nepal’s trade policies cannot deviate radically from those of its southern neighbor. As India has recently embarked on a major economy-wide liberalization effort, the negative spillovers deriving from the distorted structure of trade incentives in India have declined substantially. 38. Exports to countries other than India still cover a narrow range of goods (mainly carpets and garments) and a limited number of countries (mainly Germany and the US). Even the garment industry has ties to India, as it was developed by Indian manufacturers seeking additional garment exports to the US under the quota system governing that market. Because of the continual efforts by the international community to eliminate the quota system, the survival
16 High duties on the gold imports into India have led to the use of Nepal as an entrepôt for this trade. However, in the
recent years, unofficial gold trade with India has substantially declined as India has reduced import duties. 17 A recent report gives a conservative estimate of NRs35 billion for remittances in FY1997, compared with the official
figure of less than NRs3 billion (David Seddon, 1999, Foreign Labour Migration and the Remittance Economy of Nepal, Unpublished report of the Department for International Development, United Kingdom).
18 Some of these reforms have not been effectively implemented. For examples, floor prices still exist for some export items, the duty drawback system is still cumbersome, and the customs valuation procedure still suffers problems including under-invoicing.
16
of Nepal’s garment industry is at risk. Continued efforts are needed to diversify export products and their destinations. 39. Nepal’s external debt is all from international aid agencies, mainly ADB and the World Bank. As such, the outstanding debt is characterized by low interest rates and long grace periods for repayments. At the end of FY2001, external debt was less than 47 percent of GDP, compared with a peak of 55 percent of GDP in FY1995 (Appendix Table A.7). The debt service ratio has also fallen and was at a manageable level of 3.9 percent of exports during the year (compared with 10 percent of exports in FY1990). Although foreign loans come with favorable interest rate and repayment terms, they disburse convertible currencies and require convertible currency interest and principal payments. Investments that do generate financial returns, on the other hand, tend to generate local currency or nonconvertible Indian rupees. This mismatch between the currency of Nepal’s debt and the currency of project benefits requires continued and close monitoring. Foreign debt management remains weak and there is no systematic analysis of the future debt requirement and debt carrying capacity (Box 1). Given the economy’s high external debt dependence, it is important to establish a sound debt policy and debt management information system to monitor and test the sustainability of the external public debt in a broad macroeconomic framework. The necessary elements would include (i) creating debt obligation scenarios under different foreign exchange rates, (ii) simulating the repayment obligation in the future, (iii) computing the yield curve of different debts, (iv) quick monitoring the level of indebtedness quickly, and (v) forecasting the effects of currency and interest swaps.
II. SHORT- AND MEDIUM-TERM ECONOMIC PROSPECTS AND POLICY ISSUES 40. Nepal’s macroeconomy should continue to be stable in the medium term, but the country is unlikely to achieve the growth rates and price stability that it enjoyed in FY2000 and FY2001. Table 8 presents a short- and medium-term illustrative scenario for the economy. The underlying assumptions are: (i) the recently escalated domestic political unrest will to some extent stabilize from FY2003 and onwards, (ii) the recent global economic recession and the impact of the 11 September events on the global economy will be modest and short-lived, and (iii) Indian economy will grow at about 5.5 percent in FY2002 and 6 percent per year thereafter. The scenario for FY2002 is revised downward, but still optimistic than the Government’s projection, reflecting the negative atmosphere prevailing in the economy. The scenario presents somewhat more conservative forecast than the Government’s targets in FY2003-2004, but still suggests a positive forecast for Nepal, if supported by appropriate policies. 41. The National Planning Commission (NPC) has recently finalized the Approach Paper of the Tenth Five-Year Plan, FY2003-2007 (the Tenth Plan). While growth in real GDP for FY2002, the base year for the Tenth Plan, is projected to remain at only 2.5 percent, much lower than the Ninth Plan target of 6.0 percent, NPC projects growth in real GDP of 6.2 percent per annum during the Tenth Plan period. While the Tenth Plan target of the Approach Paper for FY2003-2004 is lower than the Ninth Plan target of 7.0 percent per annum, it is still, despite widespread uncertainty in the economy, predicated on strong growth in all sectors. 42. NPC targets 4.1 percent growth in agriculture during the plan period and projects 1.5 percent growth for FY2002. While the Government’s projection of 1.5 percent in FY2002 seems overly pessimistic, achieving 4.1 percent for FY2003-2004 will be a major challenge. Despite the recent uneven monsoon (mainly during June-August 2001) in the Eastern region, which will adversely impact agricultural growth in FY2002, staff estimates are for 3 percent agricultural growth in FY2002 and onwards (Table 8). This incorporates the findings of the recent
17
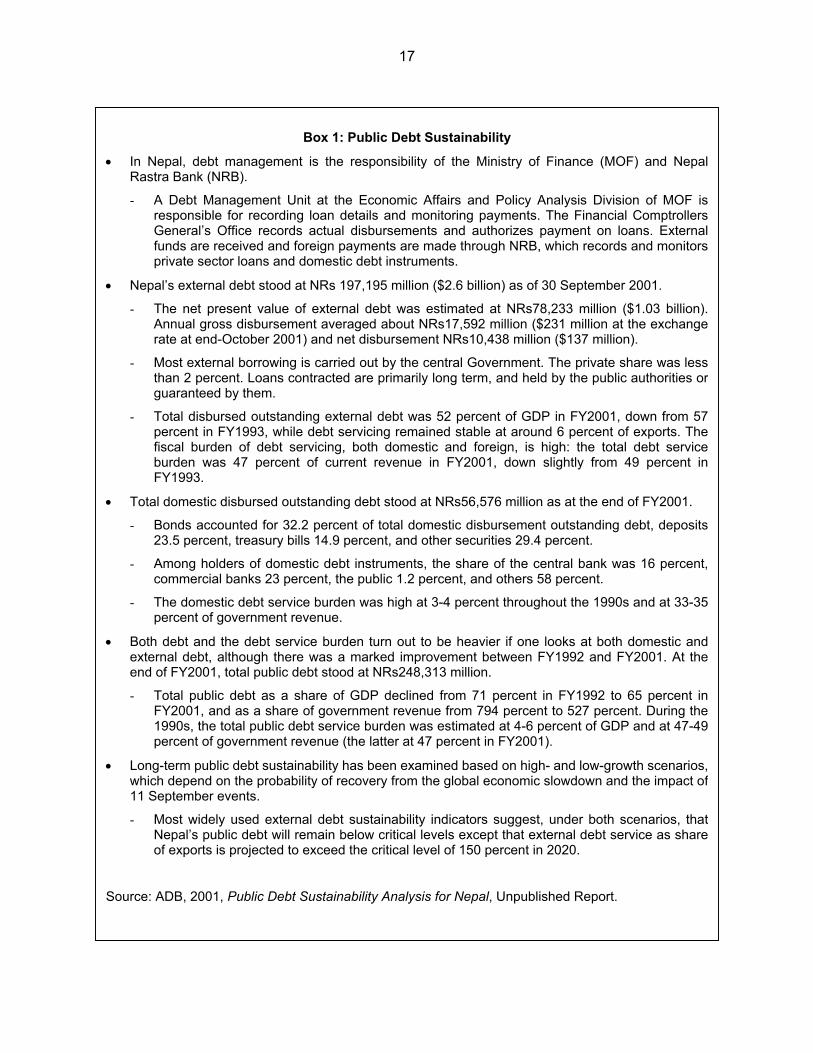
Box 1: Public Debt Sustainability
• In Nepal, debt management is the responsibility of the Ministry of Finance (MOF) and NepalRastra Bank (NRB).
- A Debt Management Unit at the Economic Affairs and Policy Analysis Division of MOF isresponsible for recording loan details and monitoring payments. The Financial ComptrollersGeneral’s Office records actual disbursements and authorizes payment on loans. Externalfunds are received and foreign payments are made through NRB, which records and monitorsprivate sector loans and domestic debt instruments.
• Nepal’s external debt stood at NRs 197,195 million ($2.6 billion) as of 30 September 2001.
- The net present value of external debt was estimated at NRs78,233 million ($1.03 billion).Annual gross disbursement averaged about NRs17,592 million ($231 million at the exchangerate at end-October 2001) and net disbursement NRs10,438 million ($137 million).
- Most external borrowing is carried out by the central Government. The private share was lessthan 2 percent. Loans contracted are primarily long term, and held by the public authorities orguaranteed by them.
- Total disbursed outstanding external debt was 52 percent of GDP in FY2001, down from 57percent in FY1993, while debt servicing remained stable at around 6 percent of exports. Thefiscal burden of debt servicing, both domestic and foreign, is high: the total debt serviceburden was 47 percent of current revenue in FY2001, down slightly from 49 percent inFY1993.
• Total domestic disbursed outstanding debt stood at NRs56,576 million as at the end of FY2001.
- Bonds accounted for 32.2 percent of total domestic disbursement outstanding debt, deposits23.5 percent, treasury bills 14.9 percent, and other securities 29.4 percent.
- Among holders of domestic debt instruments, the share of the central bank was 16 percent,commercial banks 23 percent, the public 1.2 percent, and others 58 percent.
- The domestic debt service burden was high at 3-4 percent throughout the 1990s and at 33-35percent of government revenue.
• Both debt and the debt service burden turn out to be heavier if one looks at both domestic andexternal debt, although there was a marked improvement between FY1992 and FY2001. At theend of FY2001, total public debt stood at NRs248,313 million.
- Total public debt as a share of GDP declined from 71 percent in FY1992 to 65 percent inFY2001, and as a share of government revenue from 794 percent to 527 percent. During the1990s, the total public debt service burden was estimated at 4-6 percent of GDP and at 47-49percent of government revenue (the latter at 47 percent in FY2001).
• Long-term public debt sustainability has been examined based on high- and low-growth scenarios,which depend on the probability of recovery from the global economic slowdown and the impact of11 September events.
- Most widely used external debt sustainability indicators suggest, under both scenarios, thatNepal’s public debt will remain below critical levels except that external debt service as shareof exports is projected to exceed the critical level of 150 percent in 2020.
Source: ADB, 2001, Public Debt Sustainability Analysis for Nepal, Unpublished Report.
18
agriculture sector review,19 and the fact that sustaining agriculture sector growth over the medium term will require time and concerted efforts to improve the performance within the framework of the APP.
Table 8: Medium-Term Illustrative Scenario
Item FY1999 FY2000 FY2001a FY2002b FY2003b FY2004b
Economic Growth (% change) Real GDP at Factor Cost 4.4 6.1 5.0 3.5 5.0 5.0 Agriculture 2.7 5.0 4.0 3.0 3.0 3.0 Industry 6.0 8.2 2.5 3.5 6.0 7.0 Services 5.6 6.3 7.3 3.5 5.5 5.5 Saving and Investment (% of GDP) Gross National Saving 17.1 18.9 20.5 17.0 17.0 17.0 Gross Domestic Investment 20.5 23.3 24.4 22.0 22.0 23.0 Central Government Finance (% of GDP) Fiscal Balance (3.9) (3.3) (4.2) (6.0) (6.0) (5.0) Money and Inflation (% change) Broad Money (M2) 20.8 21.8 14.9 12.0 12.0 12.0 Consumer Price Index 11.3 3.5 2.4 5.0 5.0 5.0 Balance of Payments Current Account Balance (% of GDP) (3.3) (4.5) (4.4) (5.0) (5.0) (6.0) Export Growth ($, % change) 18.2 42.4 3.7 5.0 10.0 12.0 Import Growth ($, % change) (10.3) 20.2 (0.9) 5.0 5.0 15.0 External Payments (% of exports) Debt Service 6.1 5.9 3.9 5.5 5.5 5.5 a Preliminary figures. b Staff estimates. Sources: Appendix Table A.1 and staff estimates.
43. In nonagriculture, NPC projects 3.2 percent growth in FY2002 and 7.3 percent growth per annum thereafter. But, in industry, much of this depends on performance of manufacturing and construction. Manufacturing continues to suffer from domestic instability and the global economic recession and is projected to slow further in FY2002 from 3.6 percent in FY2001. Projected economic growth of 5.5 percent in India20 should provide a buffer for Nepal’s manufacturing industry in the medium term to absorb the impacts of the slowdown in the US and Europe, and of the 11 September events, although its extent of recovery will be still subject to domestic security situation. Growth in construction is expected to rebound from a 0.8 percent growth in FY2001. The upcoming Melamchi Water Supply Project, which will bring water from the Melamchi River into the Kathmandu Valley through a 27-kilometer tunnel, will provide the construction sector with a boost over the medium term. Another area that should see strong growth over the medium term is the energy sector, as the 60 MW Khimti Khola hydropower project began producing electricity late in FY2000. The 36 MW Upper Bhota Koshi hydropower project (a private sector project) began commercial operations in the third quarter of FY2001, and the 144 MW Kali Gandaki “A” hydropower project is expected to begin producing power in the third quarter of FY2002. Overall, staff projections show that the industry sector will remain
19 TA 3536-NEP: Agricultural Sector Performance Review, for $600,000, approved on 13 November 2000. 20 ADB, 2001, Asian Development Outlook 2001 Update, Manila: ADB.
19
weak in FY2002 with 3.5 percent growth, but it will be recovered somewhat in FY2003 and FY2004. 44. In services, staff project a real growth rate of roughly 5 percent (though somewhat lower in FY2002), which is lower than the average performance of 6.0 percent over the past five years. Recent events, including those of 11 September and the declaration of a state emergency on 26 November 2001 are having a major negative impact on tourist arrivals. Recovery in the tourism sector will depend on the extent of an improvement in domestic and external security problems. And plans for reductions in the civil service should limit growth in community and personal services in the short term.21 As growth in transport is linked, in part, to export performance, performance of this sector will also be limited. 45. To achieve higher growth rates, Nepal needs to continue and accelerate the reforms begun in the early 1990s to provide an environment conducive to private sector development, not least of which is financial sector reform. As this is likely to occur only slowly, staff projections show savings as a share of GDP roughly constant over the medium term. Investment is projected to be stagnant in the medium term as uncertainty in the domestic and global markets, a critical determinant of private investment, is not likely to be dissipated quickly in the near future, while the public investment will have to be curtailed to finance increasing expenditures for security operations. 46. The budget deficit is likely to widen from 4.2 percent to 6.0 percent. The Government’s budget for FY2002 calls for a 27 percent increase in development expenditures. The target will be very difficult to achieve. While Middle Marshayangdi hydroelelectric Project and the Melamchi Water Supply Project will entail a high level of investment and resource transfers, development spending is, however, likely to be curtailed by increasing expenditure for security operations in the medium term. The Government has recently indicated that about 25 percent of the FY2002 development budget will be reallocated to meet additional security expenditures. In contrast, the Government should meet its spending target for regular expenditures as the main item, salaries, was increased in FY2001 while the staffing cuts will take time to implement. The domestic revenue target is unlikely to be achieved. If the current insurgency problems do not improve quickly, it appears that revenues will be insufficient to meet even the counterpart funds of the development projects. Overall, Nepal should see an increase in the budget deficit in the medium term in the range of 5.5-6.0 percent of GDP, with foreign assistance continuing to provide the main source of financing; however, rising security expenditures are an area that will require further monitoring. 47. Falling prices for some key food items kept Nepal’s inflation in check in FY2001. However, several factors suggest that inflation is likely to pick up in FY2002. While food prices should be stable, as South Asia again experiences normal weather for its agriculture, price declines are unlikely. Nonfood prices, on the other hand, are expected to rise. The depreciating Nepalese rupee with respect to the dollar will cause imported manufactures to become more expensive, and the prices of fuel and kerosene have already been raised. The Government can maintain these levels only as long as India does not alter its prices; pressure on India’s budget suggests that this is unsustainable. The recent increases in electricity tariffs and excise and a surcharge in petroleum product will also push prices up. The projected inflation rate in India is 5 percent, and Nepal can expect a similar rate in FY2002 if supported by appropriate money
21 As the Government plans to use the savings from rightsizing the civil service to increasing salaries in the medium
term, the extent of negative impacts of the reductions in the civil service on the growth rate may be balanced in the medium term.
20
supply growth. In the absence of any external shocks, Nepal will experience relatively moderate inflation over the next few years. 48. Monetary policy will be geared to supporting the exchange rate peg with the Indian rupee. As such, interest and inflation rates need to be kept in line with those in India. Continuing monetization of the economy will provide some leeway in monetary policy, but the 20 percent annual money supply growth rates in recent years cannot be sustained without fueling inflation. Given projections for real GDP growth and inflation, targets for broad money growth need to be in the range of 12-14 percent in the medium term. To support NRB’s efforts to control inflation and maintain the exchange rate peg, the market for government securities needs to be developed to break the link between budget deficits and monetary expansion. Moreover, the limit of NRs1 billion on the Government’s overdraft with NRB must be strictly enforced. 49. Relatively strong economic growth in India will continue to support Nepal’s exports, but not to the extent as seen in the past five years. However, exports in FY2002 will face a sharp decline, particularly in carpets, garments, and pashmina, due to the global recession. In the medium term, exports will largely depend on (i) a recovery of the global economy, (ii) economic of growth in India, and (iii) maintaining competitiveness in export of garments after the removal of the quotas provided under the Multifibre Agreement. Staff assume that a recovery of the global economy begins in the first half of FY2003 and the Indian economy will grow relatively strong in the medium term (para. 40). The Indo-Nepal Trade treaty is likely to be renewed soon.22 In exports to other countries than India, the quotas on garments imported by the US will be phased out over time and eliminated by 1 January 2005 as part of the World Trade Organization’s Agreement on Textiles and Clothing. This will have the industry in Nepal compete directly with Indian- and Chinese-made garments in this important market and the industry in Nepal must therefore respond to the gradual removal of this protection. However, depreciation of the Nepalese rupee against the dollar should help support exports to countries other than India. Largely reflecting these factors, staff estimate 5 percent export growth in FY2002 and 10-12 percent export growth in FY2003-2004. Growth in imports in Nepal is mainly driven by aid-financed development investment. Imports will be dampened in FY2002 as development investment is likely curtailed by the domestic security problems. However imports will pick up gradually in next few years as increased aid-financed projects, including the Melamchi Water Supply Project, will take place during the period. Overall, the current account is likely to worsen in coming years, though its actual performance will depend on the extent of trade deficit, decline in foreign earnings from tourism, possible diversion of foreign remittances, and adverse impact of the insurgence on foreign-aid disbursements and inflows. The deteriorating fiscal position will lead to higher external debt as a share of GDP, but debt service should continue to be manageable given the concessional nature of the Government’s borrowings. 50. Nepal is still a predominately agrarian economy, and the majority of the country’s poor reside in rural areas. As such, the Government’s continued commitment to improving agriculture sector performance within the framework of the APP is critical, including its ability to coordinate and monitor its implementation. The recent agriculture sector performance review has found that the impact of agriculture policy reforms has been positive in terms of promoting a more market-oriented system, investment, trade, productivity in crop production and livestock, and income of agroenterprises, although the impact is still modest as productivity and
22 At the eleventh Summit of the South Asian Association of Regional Cooperation which took place in Kathmandu
from 4-6 January 2002, the Indian Prime Minister indicated that the Indian government will support the renewal of the Trade Treaty.
21
commercializatin of agriculture still remain very low.23 It is important that these reforms are not reversed and are sustained so as to achieve a higher level of sustainable growth of the agriculture sector in the long run. In the finance sector, the recent audit of RBB and NBL has only clarified the magnitude of their problems, and the Government now needs to move forward with restructuring these ailing commercial banks within the broader context of overall financial sector reform. Moreover, independent audits of the state-owned development banks (Agriculture Development Bank of Nepal and Nepal Industrial Development Corporation) are necessary preliminary steps in bringing these institutions into the financial sector reform agenda. Financial sector reform is necessary to raise the domestic savings rate to support the level of investment needed to sustain higher growth rates in the future. 51. To reduce the country’s dependence on foreign assistance for development expenditures, the Government needs to continue its efforts to mobilize domestic resources. While full implementation of VAT is one area that may have an immediate payoff, more broad-based tax reforms are necessary to integrate VAT fully with income and customs tax administration to produce a more buoyant tax system. To maintain fiscal stability, reforms must also extend to the expenditure side of the budget. However, experience suggests that planned reductions in fiscal expenditures—particularly regular expenditures—are difficult to attain without running the risk of cuts in operation and maintenance expenditure or local counterpart funding for development projects. Under these circumstances, the Government will need to address the structural weaknesses that are at the root of the fiscal imbalances. This includes the need to reduce public service overstaffing, increase the efficiency of the civil service, and contain the burden of loss-incurring public enterprises (through management reform or privatization). Prioritization of development expenditures and preparation of a three-year rolling expenditure plan should also be expedited to increase the efficiency of public sector investments. 52. Continuing institutional and human resource weaknesses constrain the emergence of a strong and efficient development administration in Nepal. In the past public service performance suffered from an excessive number of ministries, inadequate remuneration of civil servants and resulting corruption, poor record keeping, excessive staff transfers, and interpretation of rules and regulations to serve the vested interests of senior officials and politicians. The current Government has indicated its strong commitment to introducing meaningful civil service and governance reforms and to build effective institutions. It has already reduced the number of ministries, and indicates that it will also introduce governance reforms in the area of anticorruption and reducing political interference in the civil service. Success of this effort will depend on the degree of consensus that the political leadership can build, as well as the leadership’s own resolve. In the private sector, improvements are needed to enforce contracts and property rights. Allowing international accounting and auditing firms to practice in Nepal will help improve corporate governance and promote an environment more conducive to private sector participation. 53. Nepal is at a critical juncture, facing formidable twin challenges of the worsening security and the deteriorating fiscal deficits, to accelerate the implementation of policy reforms. The upsurge of the insurgency is increasingly affecting the economy and development work. Rising security expenditures are crowding out public investment. And the insurgency makes it more
23 For example, removing fertilizer subsidies was one of important reform measures. It has had positive impact on
fertilizer availability and use through promoting private sector participation in fertilizer trade and distribution as per the findings of the agriculture sector performance review. TA 3536-NEP: Agriculture Sector Performance Review, for $600,000, approved on 13 November 2000.
22
difficult for externally-assisted development programs and projects to reach the rural areas due to security reasons, where people suffer from high levels of deep-rooted poverty and such interventions are, therefore, most needed. The worsening security situation has also had adverse impacts on domestic manufacturing industries and other businesses including tourism. Nepal’s fiscal position has been hit hard by the recent upsurge of insurgency. Due to economic slowdown and political disturbances, revenue collection is falling rapidly while expenditure pressures from rising security expenditures are increasing. These twin challenges are intimately intertwined and are the manifested results of deep-rooted poverty. Worse, they occurred when the economy is reeling from the external shocks including the 11 September events. To address these challenges, Nepal’s only feasible option is to accelerate the implementation of policy reforms that begun in the early 1990s and were agreed on the National Development Forum in 2000.
23
APPENDIX Table Number Title Page
Table A.1 Key Economic Indicators 24 Table A.2.1 Gross Domestic Product at Factor Cost by Sector of Origin (constant FY1985 prices) 25 Table A.2.2 Gross Domestic Product at Factor Cost by Sector of Origin (current prices) 26 Table A.3 Expenditure on Gross Domestic Product (current prices) 27 Table A.4 Summary of Central Government Finances 28 Table A.5 Monetary Survey 29 Table A.6 Balance of Payments Summary 30 Table A.7 National Debt and Debt Service 31