Embed Size (px)
Citation preview

Counting Hawks
Sylvia R. MoriPSW2005

A small, jay-size hawk (avg. 10-14" long), with dark gray back, a rusty-barred breast,
a slender square-tipped tail.
A medium crow-size hawk (avg.14-20" long) with a dark gray back, a rusty-barred breast, dark cap,and a long, rounded tail.
(Accipiter striatus) (Accipiter cooperii)

(Accipiter striatus) (Accipiter cooperii)
Immature Sharp-shinned Hawk Immature Cooper's

Immature Northern goshawk (Accipiter gentilis )
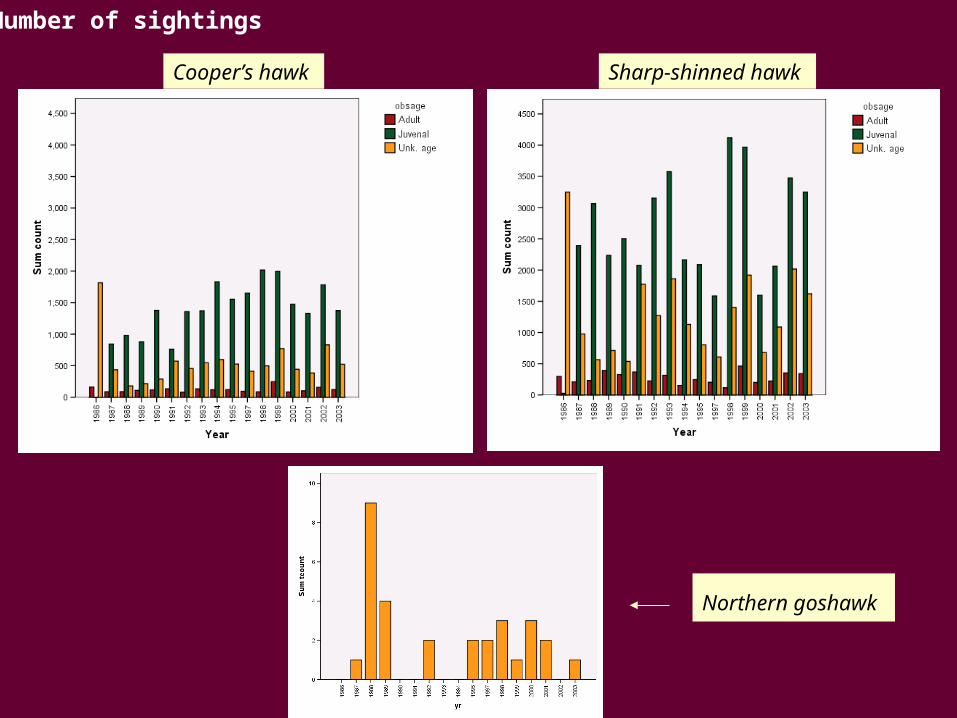
Northern goshawk
Cooper’s hawk
Relative AbundanceSharp-shinned hawk
Number of sightings

The Golden Gate Raptor Observatory (GGRO) is three staff members and more than 250 community volunteers, all dedicated to studying the autumn hawk migration
The GGRO is a program of the Golden Gate NationalParks Conservancy in cooperation with the National
Park Service
http://www.ggro.org/

Every autumn, thousands of migrating birds of prey appear over the Golden Gate near
San Francisco, California

How is the Hawk population doing? Are they increasing, decreasing or the same?
Statistical technique: Trend analysis
What are the proportions of misidentification
for Copper’s hawks and Sharp-shinned hawks
by age class and sex?
Statistical technique:Estimation of misclassification probabilities
Questions

Measured variables for trend analysis:
Number of birds counted by a group of trained observers (2-20),Year of the observation (Y), Age class (adult, juvenal or unknown) (A) ,Time of the year in Julian days (J), Time of the observation in hours on day of the observation (T),Duration of the observation in minutes (D),Number of observers’ class (1 if <7; 2 if ≥ 7) (O),Visibility class (1if <10 miles; 2 if ≥ 10 miles) (V).
Number of birds counted is the response of interest
Counting Hawks 18 years of count data (1986-2003)

Statistical model
The parameters in the functions are estimated via Maximum Likelihood Estimation (MLE)
les)ory variabg(Explanatf(year))count(E e
Example:
ˆˆˆˆˆˆˆ2cb2ˆˆE(count)
2 VOηAφDψTγTδJJYβYαe
^=estimate
Trend analysis

Observed as COHA
At noon for 1 hour and peak julian day (A:298, j:276, U:280)
with < 7 observers and visibility > 10
Year
20052000199519901985
Mea
n co
unt
20
15
10
5
0
95% CL
95% CL
Unid. age
95% CL
95% CL
Juvenal
95% CL
95% CL
Adult
Example

Julian Day of maximum abundance calculation
VηOφAψDγTδTJJβYαYeo
y22cb2
E(count)
2cblog *J*Ja)o
(yo
z
Fix all the explanatory variables except for the Julian day J, therefore the above equality is equivalent to
Using the derivative of zo with respect to J, the maximum is given by:
298)9.13(*2
10000*83.
c2
b-Max(J) Estimated
The Julian day 298 corresponds to October 25

The delta method expands a (non-linear) function of a random variable about its mean with a one-step Taylor approximation, and then takes the variance.
f(x) ≈ f(mu) + (x-mu)f'(mu) so that
Var(f(x)) = Var(x)*[f'mu)]2
where f() is differentiable and f'() = df/dx.
Expanded to vector-valued functions of random vectors,
Var(f(X)) = f'(mu) Var(X) [f'(mu)]T
and that in fact is the basis for deriving the asymptotic variance of maximum likelihood estimators. X is a 1 x p column vector; Var(X) is its p x p variance–covariance matrix; f() is a vector function returning a 1 x n column vector; and f'() is its n x p matrix of first (partial) derivatives. T is the transpose operator. Var(f(X)) is the resulting n x n variance–covariance matrix of f(X).
Julian Day of Maximum abundance and variance
The delta method

)c(c
)c,b(f*
)b(b
)c,b(f*)c,b(Covariance*2
2
)c(c
)c,b(f*)c(Variance
2
)b(b
)c,b(f*)b(Variance
c2
b-Variance
2c
1*
2
b-
c
)c,b(f
2c
1-
b
)c,b(f
2c
b-)c,b(ff(X)
Vector: X=(a,b)
Using the Delta Method, the estimated variance of the Julian dayof maximum abundance is approximated by:

A statistical computing procedure estimates the parameters of the statistical model via MLE . This procedure can also estimate the variance of the estimated Julian day of maximum abundance and its 95% confidence interval:
])Max(J tedvar[Estima2Max(J) Estimated

Adult
Juvenal
Unknown age
Sept. 30
Julian Day of maximum abundanceand confidence intervals
Species 1Species 2