Embed Size (px)
Citation preview

Counting Fish and Dolphins in Sonar Images
Using Deep Learning
Stefan Schneider
School of Computer Science
University of Guelph
Alex Zhuang
Department of Computer Science
University of Toronto
July 28, 2020
Abstract
Deep learning provides the opportunity to improve upon conflicting
reports considering the relationship between the Amazon river’s fish and
dolphin abundance and reduced canopy cover as a result of deforesta-
tion. This topic has received increased attention as a result of increased
deforestation efforts and large-scale fires of the Amazon Rainforest. Cur-
rent methods of fish and dolphin abundance estimates are performed by
on-site sampling using visual and capture/release strategies. We propose
a novel approach to calculating fish abundance using deep learning for
fish and dolphin estimates from sonar images taken from the back of a
trolling boat. We consider a data set of 143 images ranging from 0-34 fish,
and 0-3 dolphins provided by the Fund Amazonia research group. This
data set offers unique challenges as the number of images is too small
for traditional deep learning methods. To overcome the data limitation,
we test the capabilities of data augmentation on an unconventional 15/85
1
arX
iv:2
007.
1280
8v1
[cs
.CV
] 2
4 Ju
l 202
0
training/testing split. Using 20 training images, we simulate a gradient
of data up to 25,000 images using augmented backgrounds and randomly
placed/rotation cropped fish and dolphin taken from the training set. We
then train four multitask network architectures: DenseNet201, Inception-
NetV2, Xception, and MobileNetV2 to predict fish and dolphin numbers
using two function approximation methods: regression and classification.
For regression, Densenet201 performed best for fish and Xception best for
dolphin with mean squared errors of 2.11 and 0.133 respectively. For clas-
sification, InceptionResNetV2 performed best for fish and MobileNetV2
best for dolphins with a mean error of 2.07 and 0.245 respectively. Con-
sidering the 123 testing images, our results show the success of data simu-
lation for limited sonar data sets. We find DenseNet201 is able to identify
dolphins after approximately 5000 training images, while fish required the
full 25,000. Our method can be used to lower costs and expedite the data
analysis of fish and dolphin abundance to real-time along the Amazon
river and river systems worldwide.
1 Introduction
The Amazon River is the world’s second longest river, shorter only to the Nile, at
6,400km in length. The water basin for the river is 7,050,000 square kilometers
in size, covering approximately 40% the area of South America, where annual
flooding of surrounding forest regions is common. The Amazon River contains
5,600 fish species, which is 10% of all known vertebrate species on Earth [1].
The variability of fish abundance throughout the river system varies relative to
a variety of factors such as: the river depth, the speed of the current, oxygen
content, and canopy cover [2, 3]. As a result of its sheer size, surveying the
Amazon River is an enormous task where increased efficiencies would drastically
2

improve conservation research efforts. Currently fish and dolphin abundance
surveys are labour intensive, involving fishing nets and manual visual spotting
performed on suspended platforms in the center of the river [4].
Canopy cover has been a topic of additional concern for fish populations
due to continued deforestation of the Amazon, and recently, intense wild fires.
Multiple studies have been conducted globally comparing canopy cover to fish
abundance with contradicting results, however, few studies consider the Amazon
River specifically [5, 6].
In addition to fish abundance, ecologists and conservationists have gone to
great lengths to monitor the endangered populations of the Amazon River dol-
phins: Amazon River dolphin (aka. boto) Inia geoffrensis, Bolivian River dol-
phin Inia geoffrensis boliviensis, Araguaian boto Inia araguaiaensis, and tucuxi
( Sotalia fluviatilis), are crucial for the Amazon River’s ecosystem stability [7,8].
The currently implemented method to evaluate and monitor river dolphin
populations involves manning four people on each of 1,000+ line and strip tran-
sects covering 2,704 kilometers of the river system as a method to identify habi-
tats critical for dolphins [4]. Dolphin abundance data is important as a means
of species well-being, but also a measure of increased poaching activity [9]. In
2013, Mintzer et al. outlined the effect of illegal harvest on survival of Amazon
river dolphins, reporting that the decline of apparent survival exceeds the rate of
conservation limits [10]. The labour intense process of current surveying meth-
ods are a limiting factor for data collection and, as a result, real conservation
policy action [10].
Here we successfully demonstrate a deep learning computer vision technique
that modernizes current methods of fish and dolphin abundance data collection.
Instead of manual surveys, our method analyzes images taken from the back of a
trolling boat using the StarFish Seabed Imaging System [11]. Utilizing a custom
3
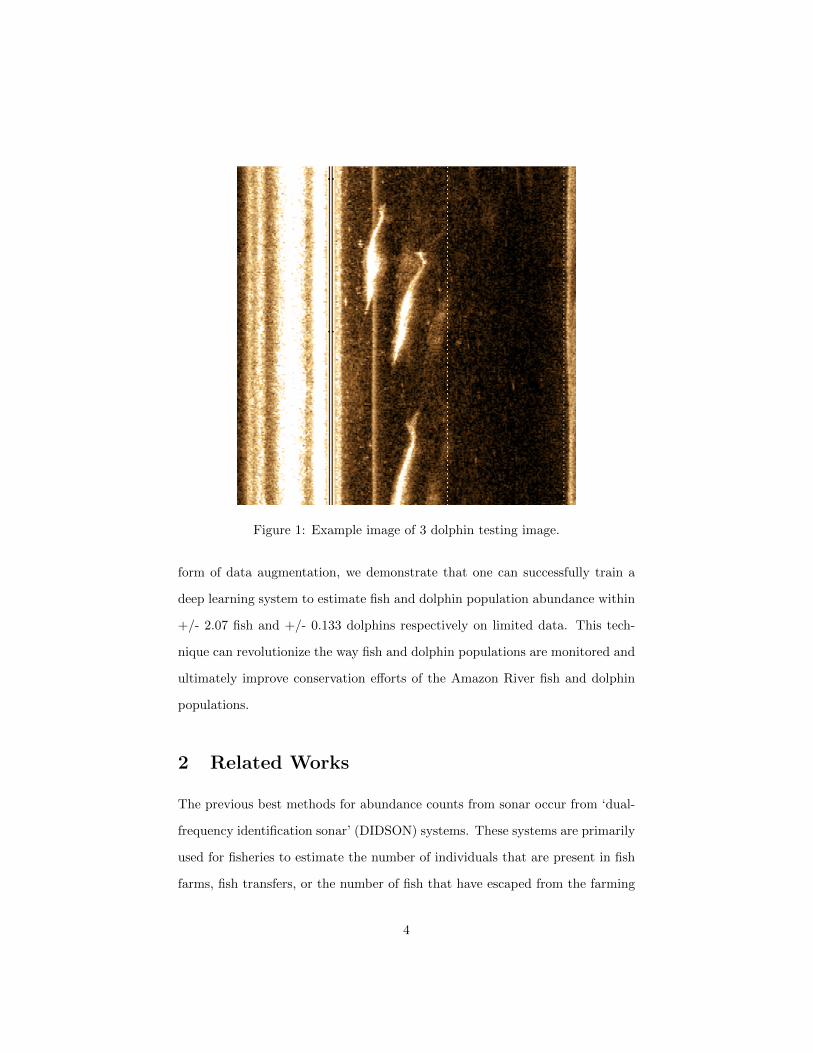
Figure 1: Example image of 3 dolphin testing image.
form of data augmentation, we demonstrate that one can successfully train a
deep learning system to estimate fish and dolphin population abundance within
+/- 2.07 fish and +/- 0.133 dolphins respectively on limited data. This tech-
nique can revolutionize the way fish and dolphin populations are monitored and
ultimately improve conservation efforts of the Amazon River fish and dolphin
populations.
2 Related Works
The previous best methods for abundance counts from sonar occur from ‘dual-
frequency identification sonar’ (DIDSON) systems. These systems are primarily
used for fisheries to estimate the number of individuals that are present in fish
farms, fish transfers, or the number of fish that have escaped from the farming
4

operation [12, 13]. The system involves mounting the DIDSON camera at a
location that has a non-changing background. The system then considers a
variety of metrics and thresholds relative to signal recovery to determine fish
numbers and error ranges from 1.20 to 13.96 depending on the number of fish
in the image [12,14]. It has also been shown that DIDSON systems can be used
to estimate approximate fish sizes [15]. The DIDSON systems are unrealistic
for our use-case, however, as they require a fixed location, which is impractical
for large scale surveys of river systems.
While not specific to sonar, computer vision methods for fish species recogni-
tion and counting from video data has been performed successfully as well [16].
Terayama et al., used Generative Adversarial Networks to transform sonar im-
ages from nighttime to daytime for improved results for when quantifying the
number of fish in fishery operations [17].
Our task and images are unique in the realm of computer vision for there has
been little to no work on counting the number of fish and dolphins using sonar
from the back of a trolling boat. The noise caused by the propeller blade, in
addition to the shallow, yet varying depths, create noisy conditions previously
not considered for deep learning models.
3 Background
Deep learning has seen a rapid growth of interest in many domains, includ-
ing ecology, due to improved computational power and the availability of large
data sets [18,19]. Deep learning methods utilize a multi-layered neural network
to solve data representation tasks. Weights within the layers are modified via
training, using a form of gradient descent to optimize the a given loss related
to desired performance of the model, such as accuracy. Neural networks use a
variety of computational techniques including updatable parameters, non-linear
5
transformations, and back-propagation to map logical relationships from in-
put to output [20]. In recent years, deep learning methods have dramatically
improved performance levels in the fields of speech recognition, object recogni-
tion/detection, drug discovery, genomics, and other areas.
Many recent advances in deep learning have come from improving the archi-
tectures of a neural network. One such architecture is the Convolutional Neural
Network (CNN), which is now the most commonly used architecture for com-
puter vision tasks [21,22]. CNNs introduce convolutional layers within a network
which learn feature maps representing the spatial similarity of patterns found
within the image, such as colour clusters, or the presence or absence of lines [18].
CNNs also introduce max pooling layers, a method that reduces computation
and increases robustness by evenly dividing these feature maps into regions and
returning only their max value [18]. Many networks have standardized due to
their landmark performance including: AlexNet (the first breakthrough CNN),
VGG19 (a well-performing 19 layered CNN), GoogLeNet/InceptionNet (which
introduced the inception module), ResNet (which introduced residual layers)
among many others [22–25]. One additional feature to networks relative to our
sonar quantification is multitask learning, where the model is trained consider-
ing multi-labeled outputs [26]. For our work, utilize multi-task to learning to
receive a prediction for both the number of fish and dolphin per image.
Deep learning researchers continually experiment with the modular archi-
tectures of neural networks, generally at the trade off of computational cost
and memory to accuracy. For our experiment, the models we chose appear on a
gradient of increasing complexity: MobileNetV2, NASNetMobile, DenseNet201,
Xception, InceptionV3, and Inception-ResNet-V2. Understanding the relative
accuracy of these models on ecological images vs. their computational complex-
ity will help map out the classification benefit vs. the computational cost of
6
choosing a particular model.
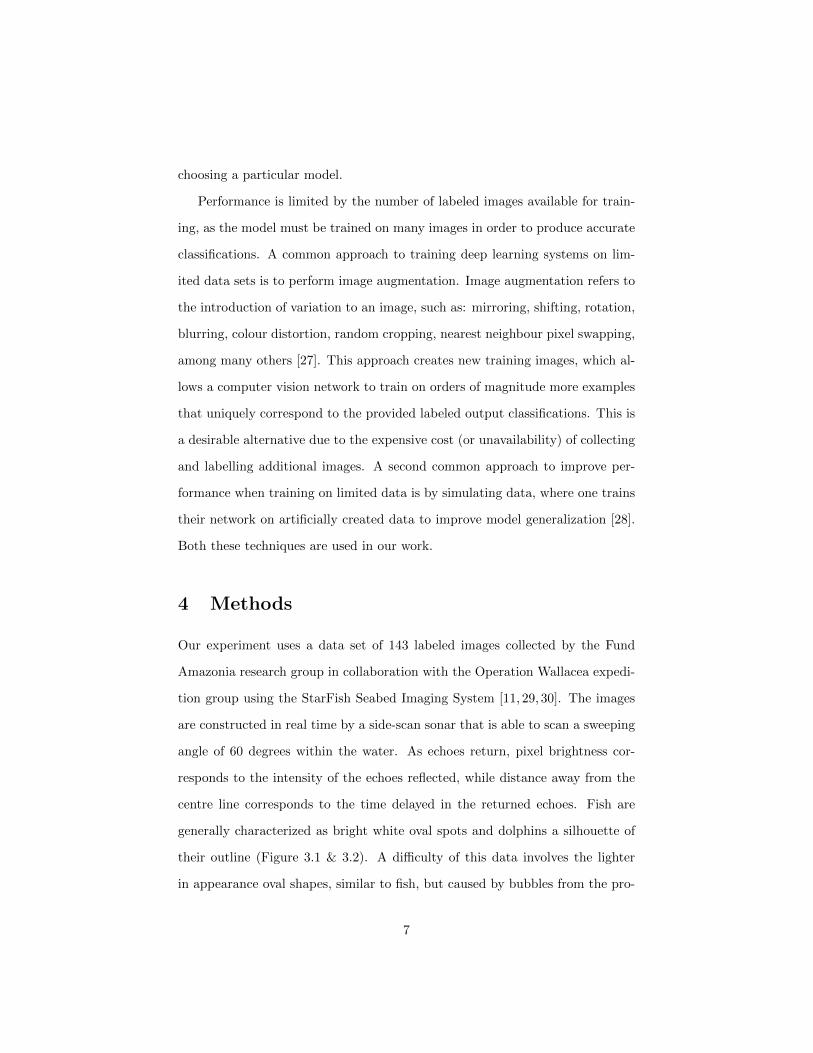
Performance is limited by the number of labeled images available for train-
ing, as the model must be trained on many images in order to produce accurate
classifications. A common approach to training deep learning systems on lim-
ited data sets is to perform image augmentation. Image augmentation refers to
the introduction of variation to an image, such as: mirroring, shifting, rotation,
blurring, colour distortion, random cropping, nearest neighbour pixel swapping,
among many others [27]. This approach creates new training images, which al-
lows a computer vision network to train on orders of magnitude more examples
that uniquely correspond to the provided labeled output classifications. This is
a desirable alternative due to the expensive cost (or unavailability) of collecting
and labelling additional images. A second common approach to improve per-
formance when training on limited data is by simulating data, where one trains
their network on artificially created data to improve model generalization [28].
Both these techniques are used in our work.
4 Methods
Our experiment uses a data set of 143 labeled images collected by the Fund
Amazonia research group in collaboration with the Operation Wallacea expedi-
tion group using the StarFish Seabed Imaging System [11, 29, 30]. The images
are constructed in real time by a side-scan sonar that is able to scan a sweeping
angle of 60 degrees within the water. As echoes return, pixel brightness cor-
responds to the intensity of the echoes reflected, while distance away from the
centre line corresponds to the time delayed in the returned echoes. Fish are
generally characterized as bright white oval spots and dolphins a silhouette of
their outline (Figure 3.1 & 3.2). A difficulty of this data involves the lighter
in appearance oval shapes, similar to fish, but caused by bubbles from the pro-
7

Figure 2: Example image of 10 fish of which DenseNet201 predicts correctly
peller or nearby debris, classified correctly only by experts. Here we utilize a
multitask learning framework to quantify the number of fish and dolphin within
the images as two outputs of the model.
In order to achieve adequate performance using deep learning methods, one
requires often thousands-millions of images. In order to satisfy this data re-
quirement we performed an unconventional 15/85 training/test split. Using
20 training images, we removed the cropped and stored the 24 fish and 9 dol-
phins present to create 20 empty backgrounds. Using blurring, mirroring, and
affining, we randomly augmented the 20 backgrounds to create 25,000 empty
canvases. We then pasted a uniform random number between 0-34 and 0-3 (the
known maximum labels) of fish and dolphin respectively at random locations,
augmented their appearance by size and rotation (Figure 3.3). The completed
8

Figure 3: Example simulated example used for training
generated image was then augmented using colour changes, blurring, grayscale,
dropout, and brightening/darkening. The 25,000 simulated images were split
into a 90/10 training/validation split for hyperparameter tuning, and the results
reported results on the remaining 123 unseen testing images. Image were resized
to 224 * 224 in size, and pixel values were normalized between 0 and 1 as were
number of fish considering a regression. For classification, there were 35 classes
for fish and 4 for dolphin, corresponding to the number found within the im-
age. Simulated/augmented data operations were performed using the ImgAug
library [27].
For this experiment, we compare four modern convolutional neural network
architectures: DenseNet201, Inception-ResNet-V2, Xception, and MobileNetV2
on the multitask output of fish and dolphin numbers in terms of two statistical
9
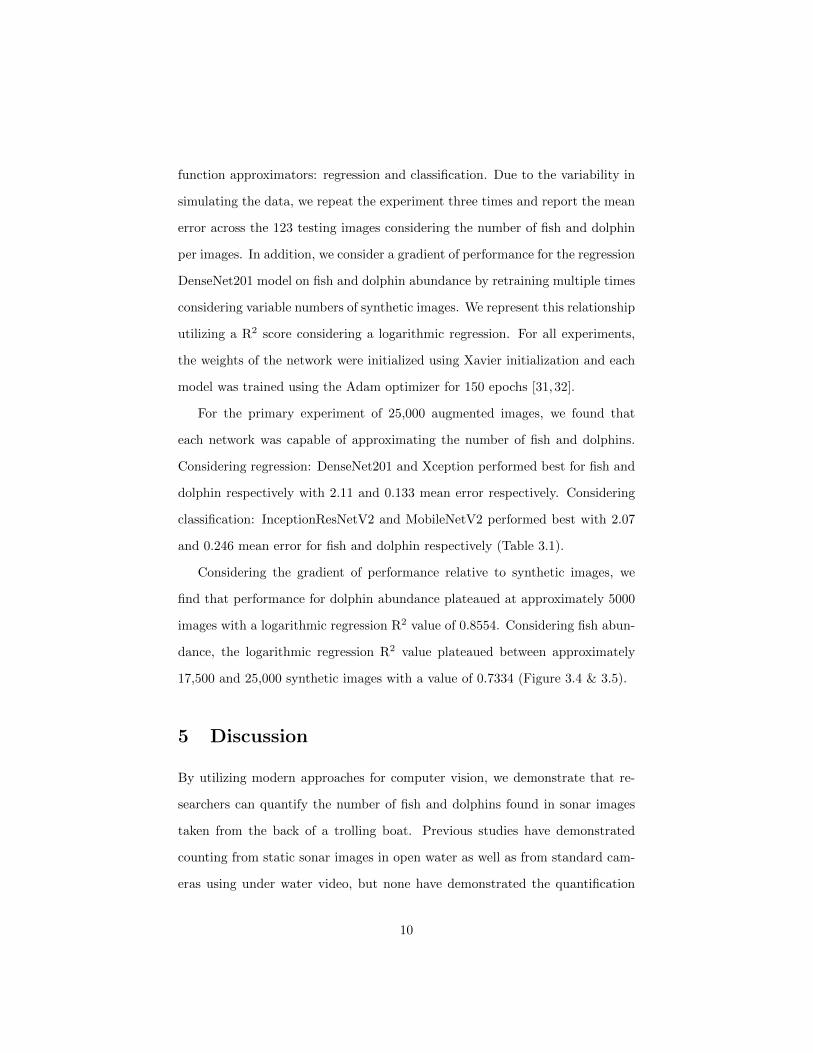
function approximators: regression and classification. Due to the variability in
simulating the data, we repeat the experiment three times and report the mean
error across the 123 testing images considering the number of fish and dolphin
per images. In addition, we consider a gradient of performance for the regression
DenseNet201 model on fish and dolphin abundance by retraining multiple times
considering variable numbers of synthetic images. We represent this relationship
utilizing a R2 score considering a logarithmic regression. For all experiments,
the weights of the network were initialized using Xavier initialization and each
model was trained using the Adam optimizer for 150 epochs [31,32].
For the primary experiment of 25,000 augmented images, we found that
each network was capable of approximating the number of fish and dolphins.
Considering regression: DenseNet201 and Xception performed best for fish and
dolphin respectively with 2.11 and 0.133 mean error respectively. Considering
classification: InceptionResNetV2 and MobileNetV2 performed best with 2.07
and 0.246 mean error for fish and dolphin respectively (Table 3.1).
Considering the gradient of performance relative to synthetic images, we
find that performance for dolphin abundance plateaued at approximately 5000
images with a logarithmic regression R2 value of 0.8554. Considering fish abun-
dance, the logarithmic regression R2 value plateaued between approximately
17,500 and 25,000 synthetic images with a value of 0.7334 (Figure 3.4 & 3.5).
5 Discussion
By utilizing modern approaches for computer vision, we demonstrate that re-
searchers can quantify the number of fish and dolphins found in sonar images
taken from the back of a trolling boat. Previous studies have demonstrated
counting from static sonar images in open water as well as from standard cam-
eras using under water video, but none have demonstrated the quantification
10

Figure 4: Gradient of mean squared error considering number of synthetic im-ages for fish abundance
of fish and dolphins from variable riverbed backgrounds within the novel river
domain. This has applications in the Amazon River, but also in river systems
worldwide.
Our results can have a large implication for the data collection methodology
of fish systems within river systems and also for conservation efforts of the
dolphins of the Amazon River. Our approach allows researchers to quickly
collect and analyze data of fish and dolphin abundance, a useful when calculating
population metrics. This is particularly important for monitoring endangered
dolphin species, which is currently performed by visual call-outs by people on
mounted transect locations. Our approach is far less expensive, dangerous, and
reliable for all involved.
Despite a minuscule training data set, we demonstrate the success of deep
learning methods when utilizing intelligent data simulation methods. Ecological
data is often limited in scope, and methods for synthetic data will be imperative
for the use of deep learning methods considering future tasks.
11

Figure 5: Gradient of mean squared error considering number of synthetic im-ages for dolphin abundance
Considering our synthetic data pipeline, we identify that each network is
capable of learning the fish/dolphin representation, with Xception performing
best on average considering the tasks, and MobileNetV2 the worst. While we
tested both regression and classification here, we recommend in practice using
regression because it can extrapolate to numbers of fish not seen during training.
Considering the gradient of performance for the number of synthetic images
using DenseNet201, we find that quantifying the number of dolphin silhouettes
was ultimately an easier pixel representation task to learn than the fish, re-
quiring less synthetic data than that of the fish silhouettes. Intuitively, this
relates to the dolphin pixel representation being more distinct than a fish. In
addition, fish abundance labels are likely imperfect due to labelling considering
interpretations of what is a fish, a bubble, or debris.
While we tested counting for fish and dolphins, this methodology can be
extended to other applications of sonar images so long as the desired object
has a distinct shape. This may include other creatures such as: manta rays,
12

alligators, etc., and in certain cases one may be able to estimate species and/or
age based on the size of outline. One may also consider this technique for
non-creatures with distinct shapes, such as plant life or improperly discarded
objects.
In the wake of increasing numbers of wildfires in the Amazon and in the
context of a changing global climate, it has become imperative for research
groups and government organizations to understand the extent of damage done
to ecosystems. As climate change escalates, biologists need to be able to react
to a changing environment equipped with quicker, more efficient analytical tools
to do their best work. Deep learning, as demonstrated here, should be one of
these tools.
Our hope is that this is just the beginning of a revolution where deep learning
improves upon the methods of ecological data collection and analysis. We believe
that deep learning can aid in increased accuracies and response times of data
collection methods, which can improve the speed at which we recognize species
population declines, and increase the speed at which policy decisions are made.
6 Conclusion
Recent advancements in the field of computer vision and deep learning have
given rise to reliable methods of feature extraction for regression and classifi-
cation tasks. The response of Amazon River aquatic populations to continued
deforestation and wildfires is generally unknown. In attempt to improve data
collection, one proposed method quantifies the number of fish and dolphin in-
dividuals from sonar imaging passed through data augmentation. We test the
ability of four deep learning architectures: DenseNet201, InceptionResNetV2,
Xception, and MobileNetV2 on their ability to quantify the number of fish and
dolphin considering images taken from the back of a trolling boat when am-
13

plified with synthetic data. We demonstrate successful results quantifying the
number of fish and dolphins from sonar images with 2.11 and 0.133 mean error
for fish and dolphins respectively considering 123 testing images and quantify
a gradient of performance to amount of synthetic data. By adopting our tech-
nique, ecologists can rapidly increase their sampling efforts of fish and dolphin
abundance in the Amazon River and worldwide.
7 Acknowledgments
We would like the thank the members of Operation Wallacea and Fund Ama-
zonia for their ambition and effort in this work. Specifically Richard Bodmer,
Maria Nino, Frederico Barroso, and Kathy Slater. We would also like to ac-
knowledge Stefan Kremer for his supervision and Graham Taylor for their ma-
chine learning insights.
14

Table 1: Comparison of Regression and Classification Abundance Predictionsfor Fish and Dolphins Considering Four Network Architectures
Animal Model Regression MeanError
ClassificationMean Error
Fish DenseNet201 2.11 2.55InceptionResNetV2 2.514 2.07
Xception 2.27 2.31MobileNetV2 2.87 2.58
Dolphin DenseNet201 0.225 0.373InceptionResNetV2 0.204 0.415
Xception 0.133 0.320MobileNetV2 0.303 0.246
15

References
[1] J. S. Albert and R. Reis, Historical biogeography of Neotropical freshwater
fishes. Univ of California Press, 2011.
[2] B. Bojsen and R. Barriga, “Effects of deforestation on fish community struc-
ture in ecuadorian amazon streams,” Freshwater Biology, vol. 47, no. 11,
pp. 2246–2260, 2002.
[3] J. Lobon-Cervia, L. L. Hess, J. M. Melack, and C. A. Araujo-Lima, “The
importance of forest cover for fish richness and abundance on the amazon
floodplain,” Hydrobiologia, vol. 750, no. 1, pp. 245–255, 2015.
[4] C. Gomez-Salazar, F. Trujillo, M. Portocarrero-Aya, and H. Whitehead,
“Population, density estimates, and conservation of river dolphins (inia
and sotalia) in the amazon and orinoco river basins,” Marine Mammal
Science, vol. 28, no. 1, pp. 124–153, 2012.
[5] J. Harding, E. Benfield, P. Bolstad, G. Helfman, and E. Jones, “Stream bio-
diversity: the ghost of land use past,” Proceedings of the national academy
of sciences, vol. 95, no. 25, pp. 14 843–14 847, 1998.
[6] E. D. Jones III, G. S. Helfman, J. O. Harper, and P. V. Bolstad, “Ef-
fects of riparian forest removal on fish assemblages in southern appalachian
streams,” Conservation biology, vol. 13, no. 6, pp. 1454–1465, 1999.
[7] J. N. Layne, “Observations on freshwater dolphins in the upper amazon,”
Journal of Mammalogy, vol. 39, no. 1, pp. 1–22, 1958.
[8] H. Hamilton, S. Caballero, A. G. Collins, and R. L. Brownell Jr, “Evolution
of river dolphins,” Proceedings of the Royal Society of London. Series B:
Biological Sciences, vol. 268, no. 1466, pp. 549–556, 2001.
16
[9] C. Loch, M. Marmontel, and P. C. Simoes-Lopes, “Conflicts with fisheries
and intentional killing of freshwater dolphins (cetacea: Odontoceti) in the
western brazilian amazon,” Biodiversity and Conservation, vol. 18, no. 14,
pp. 3979–3988, 2009.
[10] V. J. Mintzer, A. R. Martin, V. M. da Silva, A. B. Barbour, K. Lorenzen,
and T. K. Frazer, “Effect of illegal harvest on apparent survival of amazon
river dolphins (inia geoffrensis),” Biological Conservation, vol. 158, pp. 280–
286, 2013.
[11] D. Hochanadel, “Starfish sea bed,” https://www.lakescientist.com/product-
spotlight-starfish-seabed-imaging-system/, 2010.
[12] J. A. Holmes, G. M. Cronkite, H. J. Enzenhofer, and T. J. Mulligan, “Ac-
curacy and precision of fish-count data from a dual-frequency identification
sonar(didson) imaging system,” ICES Journal of Marine Science, vol. 63,
no. 3, pp. 543–555, 2006.
[13] J. Han, N. Honda, A. Asada, and K. Shibata, “Automated acoustic method
for counting and sizing farmed fish during transfer using didson,” Fisheries
Science, vol. 75, no. 6, p. 1359, 2009.
[14] K. M. Boswell, M. P. Wilson, and J. H. Cowan Jr, “A semiautomated
approach to estimating fish size, abundance, and behavior from dual-
frequency identification sonar (didson) data,” North American Journal of
Fisheries Management, vol. 28, no. 3, pp. 799–807, 2008.
[15] M.-H. Kang, “Semiautomated analysis of data from an imaging sonar for
fish counting, sizing, and tracking in a post-processing application,” Fish-
eries and aquatic sciences, vol. 14, no. 3, pp. 218–225, 2011.
17

[16] M. Sung, S.-C. Yu, and Y. Girdhar, “Vision based real-time fish detection
using convolutional neural network,” in OCEANS 2017-Aberdeen. IEEE,
2017, pp. 1–6.
[17] K. Terayama, K. Shin, K. Mizuno, and K. Tsuda, “Integration of sonar
and optical camera images using deep neural network for fish monitoring,”
Aquacultural Engineering, vol. 86, p. 102000, 2019.
[18] Y. LeCun, Y. Bengio, and G. Hinton, “Deep learning,” nature, vol. 521,
no. 7553, p. 436, 2015.
[19] S. Schneider, G. W. Taylor, and S. Kremer, “Deep learning object detection
methods for ecological camera trap data,” in 2018 15th Conference on
Computer and Robot Vision (CRV). IEEE, 2018, pp. 321–328.
[20] K. Hornik, “Approximation capabilities of multilayer feedforward net-
works,” Neural networks, vol. 4, no. 2, pp. 251–257, 1991.
[21] K. Fukushima, “Neural network model for a mechanism of pattern recogni-
tion unaffected by shift in position- neocognitron,” Electron. & Commun.
Japan, vol. 62, no. 10, pp. 11–18, 1979.
[22] A. Krizhevsky, I. Sutskever, and G. E. Hinton, “Imagenet classification with
deep convolutional neural networks,” in Advances in neural information
processing systems, 2012, pp. 1097–1105.
[23] M. Jaderberg, K. Simonyan, A. Zisserman et al., “Spatial transformer net-
works,” in Advances in Neural Information Processing Systems, 2015, pp.
2017–2025.
[24] C. Szegedy, W. Liu, Y. Jia, P. Sermanet, S. Reed, D. Anguelov, D. Erhan,
V. Vanhoucke, and A. Rabinovich, “Going deeper with convolutions,” in
18

Proceedings of the IEEE conference on computer vision and pattern recog-
nition, 2015, pp. 1–9.
[25] K. He, X. Zhang, S. Ren, and J. Sun, “Deep residual learning for image
recognition,” in Proceedings of the IEEE conference on computer vision and
pattern recognition, 2016, pp. 770–778.
[26] R. Caruana, “Multitask learning,” in Learning to learn. Springer, 1998,
pp. 95–133.
[27] ImgAug, “imgaug,” https://imgaug.readthedocs.io/en/latest/index.html,
2019.
[28] A. Shrivastava, T. Pfister, O. Tuzel, J. Susskind, W. Wang, and R. Webb,
“Learning from simulated and unsupervised images through adversarial
training,” in Proceedings of the IEEE conference on computer vision and
pattern recognition, 2017, pp. 2107–2116.
[29] Fundamazonia, “Fundamazonia,” http://www.fundamazonia.org/, 2017.
[30] Wallacea, “Opwall,” https://www.opwall.com/, 2017.
[31] K. He, X. Zhang, S. Ren, and J. Sun, “Delving deep into rectifiers: Sur-
passing human-level performance on imagenet classification,” in Proceed-
ings of the IEEE international conference on computer vision, 2015, pp.
1026–1034.
[32] D. Kingma and J. Ba, “Adam: A method for stochastic optimization,”
arXiv preprint arXiv:1412.6980, 2014.
19