Embed Size (px)
Citation preview
Counting Cover Crops 1
Counting Cover Crops
Lara Bryant, Ryan Stockwell,
and Trisha White
2013
Counting Cover Crops i
Counting Cover Crops
Bryant, L., Stockwell, R., and White, T. (2013) Counting Cover Crops. Washington, DC:
National Wildlife Federation
AcknowledgementsThe Walton Family Foundation provided the necessary support to National Wildlife Federation staff
to conduct this research. Dean Baas and Dale Mutch of Michigan State University provided valuable
feedback and insight to this research, as well as providing an example of calibration through a similar
study based on seed sales data. Bob Olson of Cooperative Development Services also provided
valuable input on the process of contacting crop advisors for the bin-run seed survey. Aviva Glaser of
National Wildlife Federation skillfully edited the copy of this paper. Finally, the authors would like to extend
tremendous gratitude to the many seed dealers and crop advisors who participated in this study (kept
anonymous to protect their sales data), and were willing to share indispensable on-the-ground information
about cover crop adoption and the seed dealer supply chain.
Designed byMaja Smith, MajaDesign, Inc.
© 2013 National Wildlife Federation
Cover image: Winter wheat. Credit: Ryan Stockwell.
AuthorsLara Bryant, National Wildlife Federation
Ryan Stockwell, National Wildlife Federation
Trisha White, National Wildlife Federation
Counting Cover Crops ii
Table of Contents
1. Executive Summary 1
2. Benefits of Cover Crops 2
3. What We Know 2
4. Focus Area: Mississippi River Basin 4
5. Methodology: Seed Dealer Survey 5
6. Findings and Limitations 6
7. Cover Crop Use is Increasing 7
8. Future Research 7
9. Conclusion and Recommendations 8
10. References 9
1
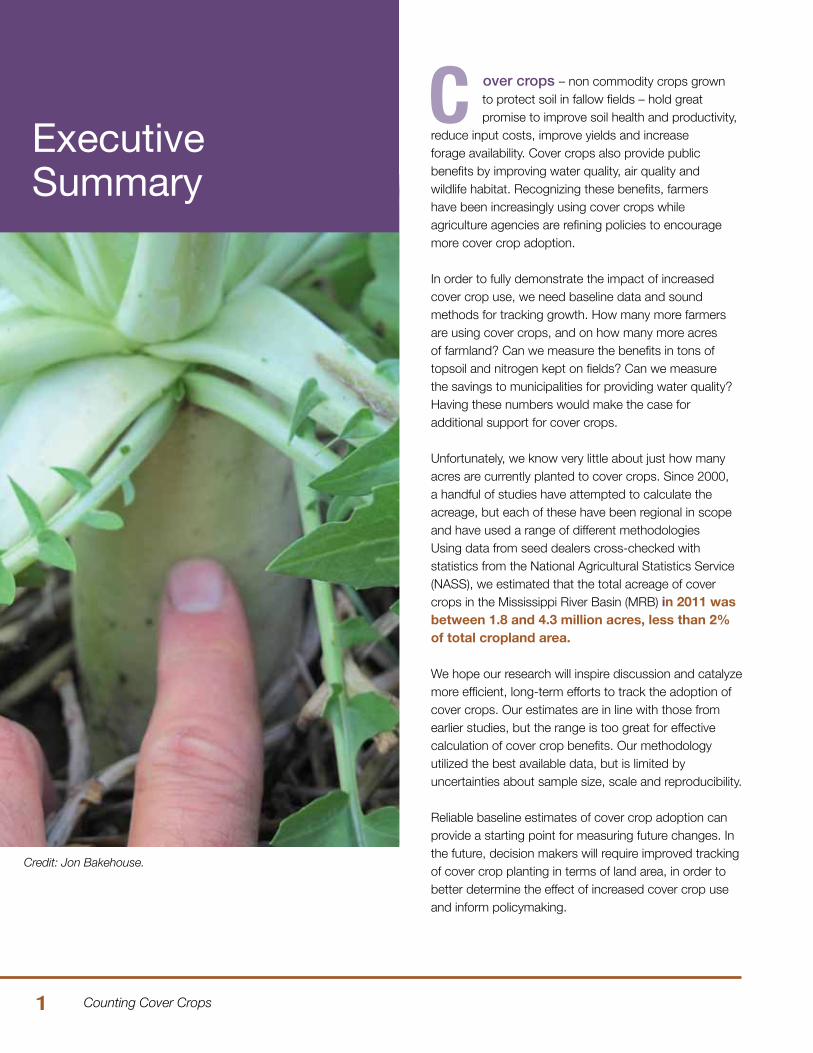
over crops – non commodity crops grown to protect soil in fallow fields – hold great promise to improve soil health and productivity, reduce input costs, improve yields and increase forage availability. Cover crops also provide public benefits by improving water quality, air quality and wildlife habitat. Recognizing these benefits, farmers have been increasingly using cover crops while agriculture agencies are refining policies to encourage more cover crop adoption.
In order to fully demonstrate the impact of increased cover crop use, we need baseline data and sound methods for tracking growth. How many more farmers are using cover crops, and on how many more acres of farmland? Can we measure the benefits in tons of topsoil and nitrogen kept on fields? Can we measure the savings to municipalities for providing water quality? Having these numbers would make the case for additional support for cover crops.
Unfortunately, we know very little about just how many acres are currently planted to cover crops. Since 2000, a handful of studies have attempted to calculate the acreage, but each of these have been regional in scope and have used a range of different methodologies Using data from seed dealers cross-checked with statistics from the National Agricultural Statistics Service (NASS), we estimated that the total acreage of cover crops in the Mississippi River Basin (MRB) in 2011 was between 1.8 and 4.3 million acres, less than 2% of total cropland area.
We hope our research will inspire discussion and catalyze more efficient, long-term efforts to track the adoption of cover crops. Our estimates are in line with those from earlier studies, but the range is too great for effective calculation of cover crop benefits. Our methodology utilized the best available data, but is limited by uncertainties about sample size, scale and reproducibility.
Reliable baseline estimates of cover crop adoption can provide a starting point for measuring future changes. In the future, decision makers will require improved tracking of cover crop planting in terms of land area, in order to better determine the effect of increased cover crop use and inform policymaking.
Executive Summary
C
Credit: Jon Bakehouse.
Counting Cover Crops
Counting Cover Crops 2
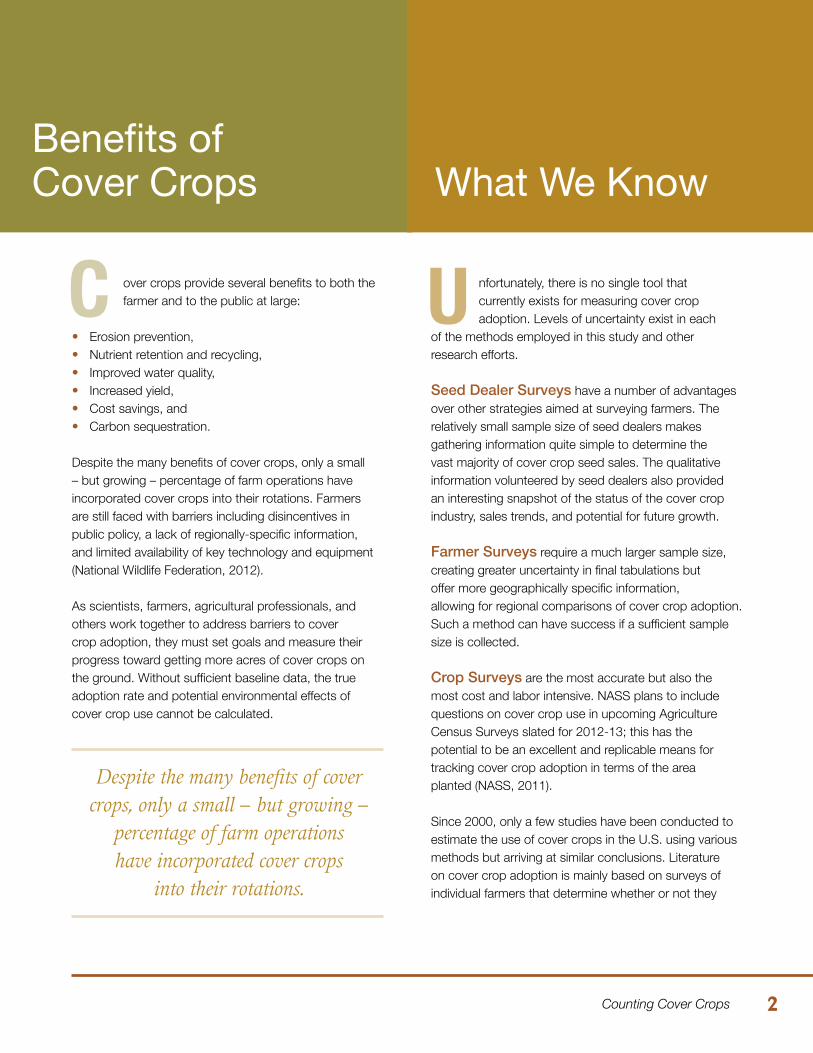
over crops provide several benefits to both the farmer and to the public at large:
• Erosion prevention,• Nutrient retention and recycling,• Improved water quality,• Increased yield,• Cost savings, and• Carbon sequestration.
Despite the many benefits of cover crops, only a small – but growing – percentage of farm operations have incorporated cover crops into their rotations. Farmers are still faced with barriers including disincentives in public policy, a lack of regionally-specific information, and limited availability of key technology and equipment (National Wildlife Federation, 2012).
As scientists, farmers, agricultural professionals, and others work together to address barriers to cover crop adoption, they must set goals and measure their progress toward getting more acres of cover crops on the ground. Without sufficient baseline data, the true adoption rate and potential environmental effects of cover crop use cannot be calculated.
nfortunately, there is no single tool that currently exists for measuring cover crop adoption. Levels of uncertainty exist in each of the methods employed in this study and other research efforts.
Seed Dealer Surveys have a number of advantages over other strategies aimed at surveying farmers. The relatively small sample size of seed dealers makes gathering information quite simple to determine the vast majority of cover crop seed sales. The qualitative information volunteered by seed dealers also provided an interesting snapshot of the status of the cover crop industry, sales trends, and potential for future growth.
Farmer Surveys require a much larger sample size, creating greater uncertainty in final tabulations but offer more geographically specific information, allowing for regional comparisons of cover crop adoption. Such a method can have success if a sufficient sample size is collected.
Crop Surveys are the most accurate but also the most cost and labor intensive. NASS plans to include questions on cover crop use in upcoming Agriculture Census Surveys slated for 2012-13; this has the potential to be an excellent and replicable means for tracking cover crop adoption in terms of the area planted (NASS, 2011).
Since 2000, only a few studies have been conducted to estimate the use of cover crops in the U.S. using various methods but arriving at similar conclusions. Literature on cover crop adoption is mainly based on surveys of individual farmers that determine whether or not they
Benefits of Cover Crops
C
What We Know
U
Despite the many benefits of cover crops, only a small – but growing –
percentage of farm operations have incorporated cover crops
into their rotations.
Counting Cover Crops 3
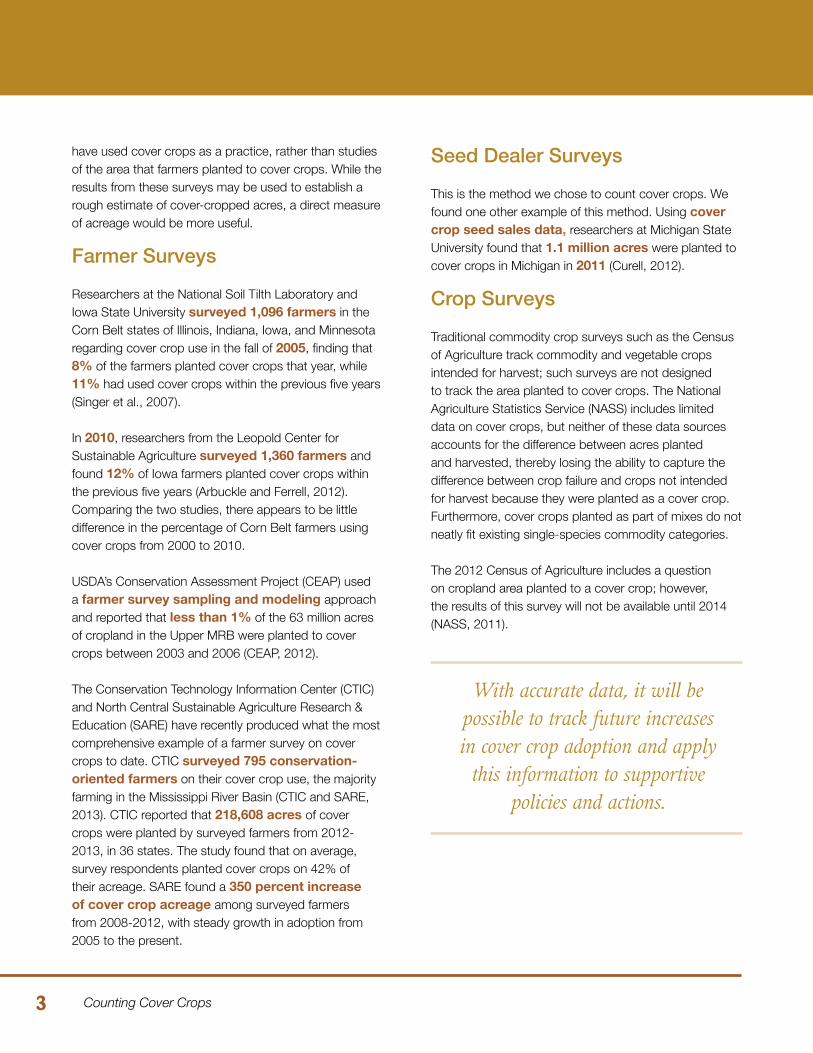
have used cover crops as a practice, rather than studies of the area that farmers planted to cover crops. While the results from these surveys may be used to establish a rough estimate of cover-cropped acres, a direct measure of acreage would be more useful.
Farmer Surveys
Researchers at the National Soil Tilth Laboratory and Iowa State University surveyed 1,096 farmers in the Corn Belt states of Illinois, Indiana, Iowa, and Minnesota regarding cover crop use in the fall of 2005, finding that 8% of the farmers planted cover crops that year, while 11% had used cover crops within the previous five years (Singer et al., 2007).
In 2010, researchers from the Leopold Center for Sustainable Agriculture surveyed 1,360 farmers and found 12% of Iowa farmers planted cover crops within the previous five years (Arbuckle and Ferrell, 2012). Comparing the two studies, there appears to be little difference in the percentage of Corn Belt farmers using cover crops from 2000 to 2010.
USDA’s Conservation Assessment Project (CEAP) used a farmer survey sampling and modeling approach and reported that less than 1% of the 63 million acres of cropland in the Upper MRB were planted to cover crops between 2003 and 2006 (CEAP, 2012).
The Conservation Technology Information Center (CTIC) and North Central Sustainable Agriculture Research & Education (SARE) have recently produced what the most comprehensive example of a farmer survey on cover crops to date. CTIC surveyed 795 conservation-oriented farmers on their cover crop use, the majority farming in the Mississippi River Basin (CTIC and SARE, 2013). CTIC reported that 218,608 acres of cover crops were planted by surveyed farmers from 2012-2013, in 36 states. The study found that on average, survey respondents planted cover crops on 42% of their acreage. SARE found a 350 percent increase of cover crop acreage among surveyed farmers from 2008-2012, with steady growth in adoption from 2005 to the present.
Seed Dealer Surveys
This is the method we chose to count cover crops. We found one other example of this method. Using cover crop seed sales data, researchers at Michigan State University found that 1.1 million acres were planted to cover crops in Michigan in 2011 (Curell, 2012).
Crop Surveys
Traditional commodity crop surveys such as the Census of Agriculture track commodity and vegetable crops intended for harvest; such surveys are not designed to track the area planted to cover crops. The National Agriculture Statistics Service (NASS) includes limited data on cover crops, but neither of these data sources accounts for the difference between acres planted and harvested, thereby losing the ability to capture the difference between crop failure and crops not intended for harvest because they were planted as a cover crop. Furthermore, cover crops planted as part of mixes do not neatly fit existing single-species commodity categories.
The 2012 Census of Agriculture includes a question on cropland area planted to a cover crop; however, the results of this survey will not be available until 2014 (NASS, 2011).
With accurate data, it will be possible to track future increases in cover crop adoption and apply
this information to supportive policies and actions.
4Counting Cover Crops
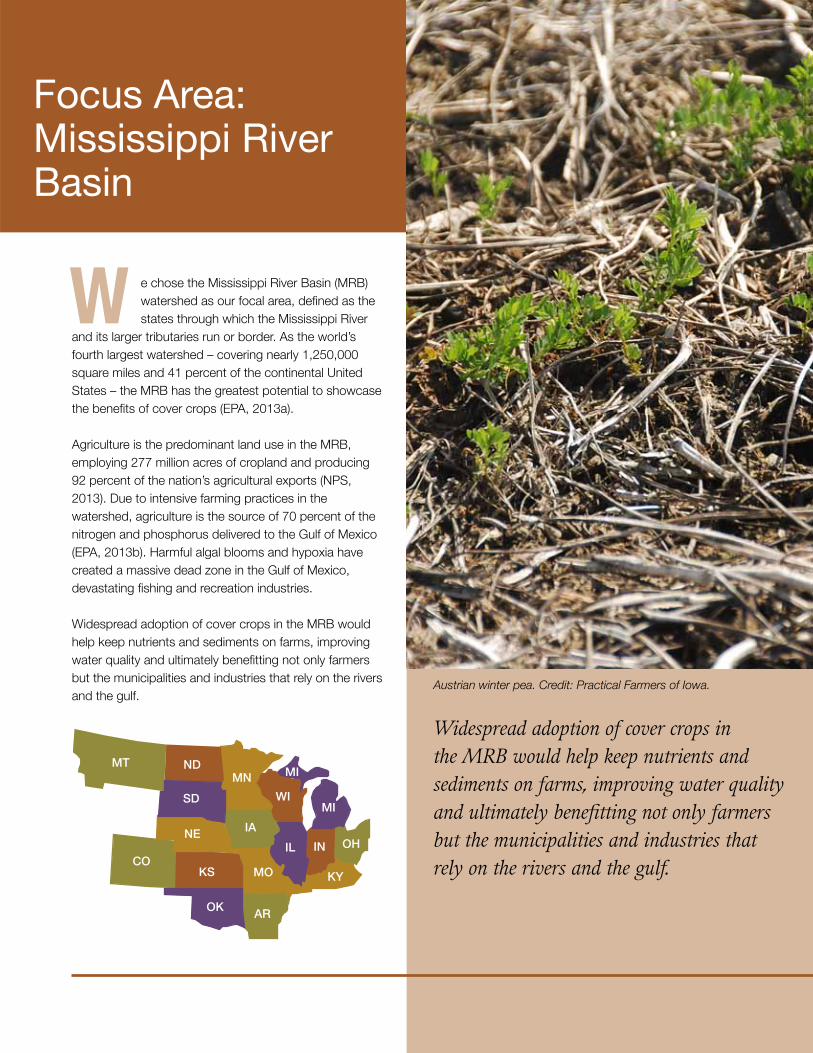
e chose the Mississippi River Basin (MRB) watershed as our focal area, defined as the states through which the Mississippi River and its larger tributaries run or border. As the world’s fourth largest watershed – covering nearly 1,250,000 square miles and 41 percent of the continental United States – the MRB has the greatest potential to showcase the benefits of cover crops (EPA, 2013a).
Agriculture is the predominant land use in the MRB, employing 277 million acres of cropland and producing 92 percent of the nation’s agricultural exports (NPS, 2013). Due to intensive farming practices in the watershed, agriculture is the source of 70 percent of the nitrogen and phosphorus delivered to the Gulf of Mexico (EPA, 2013b). Harmful algal blooms and hypoxia have created a massive dead zone in the Gulf of Mexico, devastating fishing and recreation industries.
Widespread adoption of cover crops in the MRB would help keep nutrients and sediments on farms, improving water quality and ultimately benefitting not only farmers but the municipalities and industries that rely on the rivers and the gulf.
Focus Area: Mississippi River Basin
W
Austrian winter pea. Credit: Practical Farmers of Iowa.
AR
IA
ILCO
OK
KS
NE
SD
MO
ND
IN OH
MNMT
WIMI
MI
KY
Widespread adoption of cover crops in the MRB would help keep nutrients and sediments on farms, improving water quality and ultimately benefitting not only farmers but the municipalities and industries that rely on the rivers and the gulf.
Counting Cover Crops
Credit: Jon Bakehouse.
5
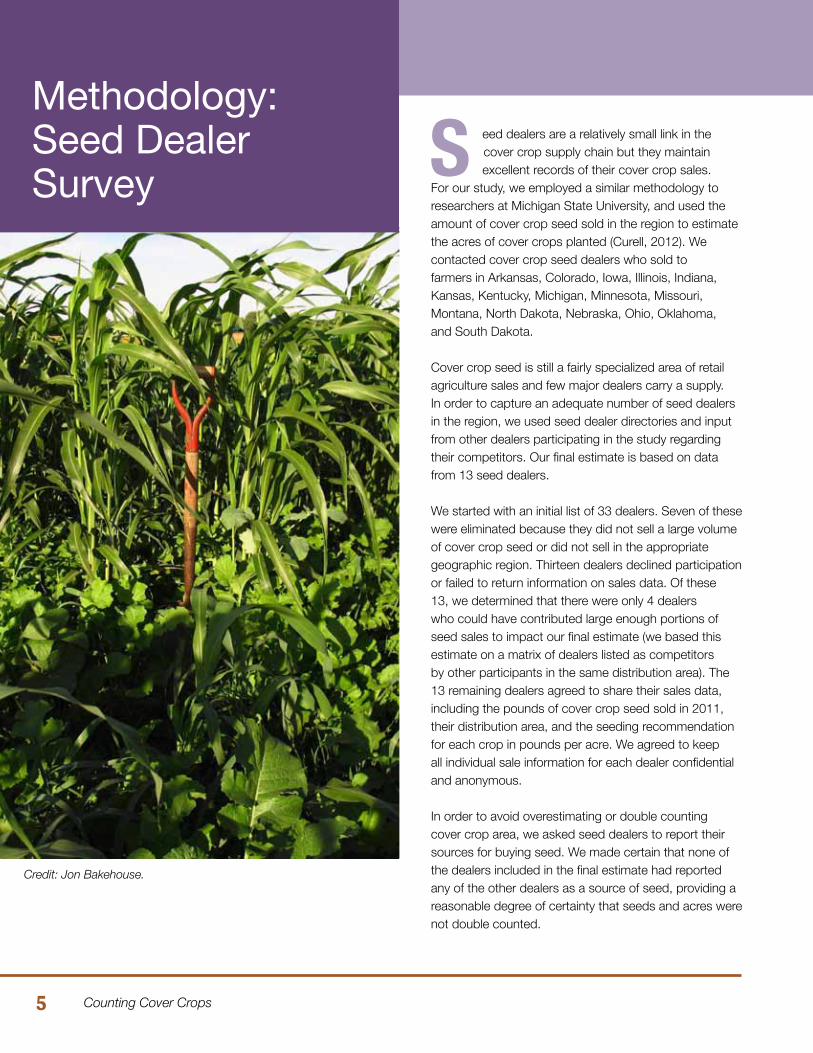
eed dealers are a relatively small link in the cover crop supply chain but they maintain excellent records of their cover crop sales. For our study, we employed a similar methodology to researchers at Michigan State University, and used the amount of cover crop seed sold in the region to estimate the acres of cover crops planted (Curell, 2012). We contacted cover crop seed dealers who sold to farmers in Arkansas, Colorado, Iowa, Illinois, Indiana, Kansas, Kentucky, Michigan, Minnesota, Missouri, Montana, North Dakota, Nebraska, Ohio, Oklahoma, and South Dakota.
Cover crop seed is still a fairly specialized area of retail agriculture sales and few major dealers carry a supply. In order to capture an adequate number of seed dealers in the region, we used seed dealer directories and input from other dealers participating in the study regarding their competitors. Our final estimate is based on data from 13 seed dealers.
We started with an initial list of 33 dealers. Seven of these were eliminated because they did not sell a large volume of cover crop seed or did not sell in the appropriate geographic region. Thirteen dealers declined participation or failed to return information on sales data. Of these 13, we determined that there were only 4 dealers who could have contributed large enough portions of seed sales to impact our final estimate (we based this estimate on a matrix of dealers listed as competitors by other participants in the same distribution area). The 13 remaining dealers agreed to share their sales data, including the pounds of cover crop seed sold in 2011, their distribution area, and the seeding recommendation for each crop in pounds per acre. We agreed to keep all individual sale information for each dealer confidential and anonymous.
In order to avoid overestimating or double counting cover crop area, we asked seed dealers to report their sources for buying seed. We made certain that none of the dealers included in the final estimate had reported any of the other dealers as a source of seed, providing a reasonable degree of certainty that seeds and acres were not double counted.
Methodology: Seed Dealer Survey S
Counting Cover Crops 6
for conservation purposes or added to a crop rotation without the intent to harvest for sale as a commodity grain, we corrected for winter wheat which is commonly grown and harvested for sale. Excluding winter wheat from our previous calculation, we estimated 1,793,310 acres of cover crops planted in the MRB in 2011.
Because we do not know the percent of total cover crop acreage represented by the 13 dealers in our study, we followed the example of Michigan State University researchers (Curell, 2012) and used NASS data for oats to estimate the percentage of acres not accounted for by our seed dealer data.
First, we tabulated the NASS estimate of acres of oats planted and harvested in 2011 for each state in the MRB (NASS, 2013). If the total area of oats harvested in the study states is subtracted from the area of oats planted, there were 492,000 acres of oats planted but not harvested in the MRB states in 2011. If we assume that the oats were not harvested because they were planted to a cover crop, then we can compare the area of oats planted from the seed dealer data to the NASS data to determine what percentage of cover crop acres our study actually represents.
We calculated 208,502 acres of oats were accounted for by seed dealer sales in our study, capturing 42 percent of cover-cropped land. If we use the percentage of oats captured as a proxy for all the cover crops in our study, and assume that we captured 42 percent of all cover-cropped acres, then the actual number of cover crop acres planted in 2011 could be as high as 4,294,182 acres.
We include this greater estimate with the qualifier that it is likely an overestimation. First, we are using oats as a proxy for all cover crop data in the study, when oats may be more likely to be planted as a cash crop than other crops in the study, such as ryegrass. Second, using this method assumes that the difference in area planted from the area harvested can only be due to cover crop use, when the difference could be also be explained by crop failure.
Nevertheless, 4.3 million acres still represents a very small percentage (less than 2%) of the 277 million acres of cropland in the MRB.
sing reports from the seed dealers on the number of pounds of seed sold and the recommended seeding rates for the individualcrops, we estimated that 1,819,808 acres of covercrops were planted in the Mississippi River Basin in 2011. However, this number does not include the four dealersmentioned in the previous section, who declined toprovide information but might have sold at a competitivelevel with other dealers in the survey. If these four dealersare representative of our survey average for the region,we can use the average number of cover crop acresper dealer (140,000), to estimate that they would addapproximately 560,000 acres to the estimate. Whenadded to the estimated of 1,819,808 acres, the total areaof cover crops would be approximately 2,379,808 acres.
In order to capture cover crops planted from bin run seed (seed that is not purchased from dealers, but has been reserved from previous years) we contacted certified crop advisors in seven states in the Mississippi River Basin: Illinois, Iowa, Minnesota, North Dakota, Ohio, Oklahoma, and Wisconsin. Six of the seven crop advisors estimated that less than 5 percent of cover crops were planted using bin run seed and only one estimated as much as 25 percent. Based on this informal survey, we concluded though some states, such as Michigan and Wisconsin may use significant amounts of bin run seed for small grain cover crops, most MRB states primarily use cover crop seed purchased from seed dealers.
As mentioned previously, one of the challenges in calculating cover crop acreage is that some common cover crops may actually be planted for harvest as cash crops, such as winter wheat. Because the intent of our study is to provide information about cover crops grown
Findings and Limitations
U
Counting Cover Crops 7
n addition to the quantitative data offered by the dealers, many volunteered qualitative comments on general trends in cover crop sales. One of the most frequently repeated messages was that cover crop sales in the area have been increasing in recent years. Nine seed dealers reported increases in cover crop sales over the past few years, and some reported as much as double or triple increases in sales.
Many were also willing to offer reasons for the increases in cover crop seed sales. Five dealers attributed the economic benefits to the farmer, emphasizing that their clients purchase cover crop seed because they expect a profitable return on their investments in improved productivity of the land. In addition, three credited soil health benefits, three stated that promotion and examples from other farmers are the reason for increased adoption, and two mentioned government incentives or policies as drivers for cover crop sales. Two dealers reported expectations of sales increases in the next year.
How are federal incentive programs such as the Environmental Quality Incentives Program and the Wildlife Habitat Incentives Program contributing to cover crop growth? NRCS data indicates that approximately 250,000-520,000 acres were contracted and cost-shared to plant cover crops in the MRB states (NRCS, 2012). Using our estimate of 1.8 million acres, this implies that over 60% of cover crops planted were not cost-shared by the federal government. This calculation reinforces the idea that farmers are using cover crops for other expected benefits or for greater stewardship of the land.
hile our study is a comprehensive estimate of cover crop acreage in the MRB, our estimated range of between 1.8 and 4.3 million acres is too great for accurate calculation of the benefits of cover crops to the Mississippi River Basin. We hope this will inspire more precise surveys of cover crop adoption across the country. Without baseline data and tracking metrics, we are unable to definitively show the vast benefits of using cover crops beyond the anecdotal level.
Going forward, researchers will develop methodologies aimed at counting either the number of farmers using cover crops or the number of acres planted with cover crops, with pros and cons for each. Similar to our calculation, the 2012 CEAP study also found that less than 2 percent of cropland in the Upper Mississippi River Basin) is planted to cover crops (Conservation Effects Assessment Project, 2012). However, surveys conducted at the individual farmer level have shown between 8 percent and 12 percent of farmers report using cover crops (CEAP, 2012; Singer et al., 2007; Arbuckle and Ferrell, 2012). How do we account for this difference?
It is possible that a relatively large number of farmers with small acreages have adopted cover crops ahead of farmers with larger acreages, explaining the difference in farmer adoption rates compared to percent of total cropland area. Literature on the relationship between farm size and cover crop adoption is inconclusive, and anecdotal evidence indicates farm size has no relationship to cover crop adoption (Prokopy et al, 2008). The fact that cover crops are a scale-neutral technology would support that conclusion. More likely, many farmers have and continue to test cover crops on small portions of their farms, indicating that in general, cover crops are still being evaluated by farmers within the MRB.
Cover Crop Use is Increasing
I
Future Research
W
Counting Cover Crops 11
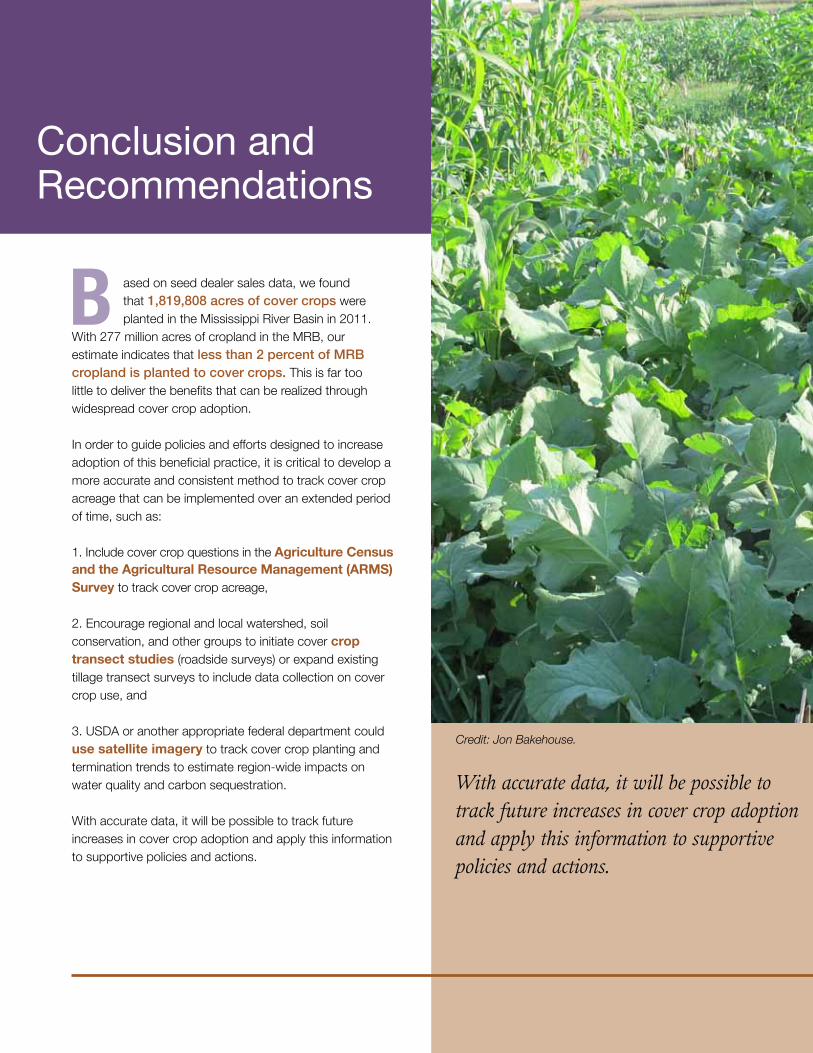
ased on seed dealer sales data, we found that 1,819,808 acres of cover crops were planted in the Mississippi River Basin in 2011.With 277 million acres of cropland in the MRB, ourestimate indicates that less than 2 percent of MRBcropland is planted to cover crops. This is far toolittle to deliver the benefits that can be realized throughwidespread cover crop adoption.
In order to guide policies and efforts designed to increase adoption of this beneficial practice, it is critical to develop a more accurate and consistent method to track cover crop acreage that can be implemented over an extended period of time, such as:
1. Include cover crop questions in the Agriculture Census and the Agricultural Resource Management (ARMS) Survey to track cover crop acreage,
2. Encourage regional and local watershed, soil conservation, and other groups to initiate cover crop transect studies (roadside surveys) or expand existing tillage transect surveys to include data collection on cover crop use, and
3. USDA or another appropriate federal department could use satellite imagery to track cover crop planting and termination trends to estimate region-wide impacts on water quality and carbon sequestration.
With accurate data, it will be possible to track future increases in cover crop adoption and apply this information to supportive policies and actions.
Conclusion and Recommendations
B
Credit: Jon Bakehouse.
With accurate data, it will be possible to track future increases in cover crop adoption and apply this information to supportive policies and actions.
Counting Cover Crops 9
EPA. 2013b. Gulf of Mexico. http://www2.epa.gov/nutrient-policy-data/gulf-mexico (accessed 17 June, 2013).
ERS. 2011. Cropland, 1945-2007, by state: the sum of cropland used for crops, cropland idled, and cropland used for pasture. USDA Economic Research Service:.http://www.ers.usda.gov/data-products/major-land-uses.aspx#25988 (16 Oct. 2012).
Follett, R. 2001. Soil management concepts and carbon sequestration in cropland soils. Soil Tillage Res. 61: 77-92.
Lal, R. 2004. Soil carbon sequestration to mitigate climate change. Geoderma 123: 1-22.
NASS. 2011. United States 2012 Census of Agriculture: Region 1 report form - sample. USDA Census of Agriculture: http://www.agcensus.usda.gov/Help/Report_Form_and_Instructions/2012_Report_Form/Region1_12a101_121311.pdf (accessed 3 Oct. 2012).
NASS. 2013. Quick Stats query: oats, acres planted and harvested by state. National Agricultural Statistics Service. http://www.nass.usda.gov/Quick_Stats/ (accessed 16 Jan. 2013)/
National Wildlife Federation. 2012. Roadmap to Increased Cover Crop Adoption.
NRCS. 2012. NRCS data retrieved through personal communication from Leroy Hall to Eliav Bitan via e-mail on 16 Mar. 2012, in response to request for information number 179.
Prokopy, L.S., K. Floress, D. Klotthor-Weinkauf, and A Baumgart-Getz. 2008. Determinants of agricultural BMP adoption: evidence from the literature. J. Soil Water Conserv. 63: 300-311.
Singer, J., Nusser, S., & Alf, C. 2007. Are cover crops being used in the US corn belt? J. Soil Water Conserv. 62: 353-358.
Arbuckle, J. G., & Ferrell, J. 2012. Attitudes toward cover crops in Iowa: benefits and barriers. Leopold Center for Sustainable Agriculture. http://www.leopold.iastate.edu/pubs-and-papers/2012-03-attitudes-toward-cover-crops-iowa-benefits-and-barriers (accessed 2 Aug. 2012).
CEAP. 2012. Assessment of the effects of conservation practices on cultivated cropland in the Upper Mississippi River Basin. Natural Resources Conservation Service. http://www.nrcs.usda.gov/Internet/FSE_DOCUMENTS/stelprdb1042093.pdf (accessed 27 Sept. 2012).
CTIC and SARE. 2013. 2013-2013 Cover Crop Survey. Accessed from: http://www.northcentralsare.org/Educational-Resources/From-the-Field/Cover-Crops-Survey-Analysis (accessed 7 Aug. 2013)
Curell, C. 2012. Cover crops’ impact on water quality. Michigan State University Extension. http://msue.anr.msu.edu/news/cover_crops_impact_on_water_quality/ (accessed 2 Aug. 2012).
Dabney, S., Delgado, J., & Reeves, D. 2001. Using winter cover cops to improve soil and water quality. Commun. Soil. Sci. Plant Anal. 32: 1221-1250.
Delgado, J., Dillon, M., Sparks, R., & Essah, S. 2007. A decade of advances in cover crops. J. Soil Water Conserv. 110A-117A.
EPA. 2013a. The Mississippi-Atchfayala River Basin (MARB). Mississippi Gulf of Mexico Watershed Nutrient Task Force. http://water.epa.gov/type/watersheds/named/msbasin/marb.cfm (accessed 26 Jan. 2013)
References
Counting Cover Crops 10
Snapp, S.E, Swinton, S.M., Labarta, R., Mutch, D., Black, J.R, Leep, R., Nyiraneza, J., O Neil, K. 2005. Evaluating cover crops for benefits, costs and performance within cropping system niches. Agron. J. 97: 322-332.
Stockwell, R., & Bitan, E. 2011. Future friendly farming: seven agricultural practices to sustain people and the environment. National Wildlife Federation. Print.
Strock, J., Porter, P., & Russelle, M. 2004. Cover cropping to reduce nitrate loss through subsurface drainage in the northern U.S. corn belt. J. Environ. Qual. 33: 1010-1016.
Tanaka, D., Anderson, R., & Rao, S. 2005. Crop sequencing to improve use of precipitation and synergize crop growth. Agron. J. 97: 385-390.
Teasdale, J. 2002. Contribution of cover crops to weed management in sustainable agricultural systems. Weed Sci. 50: 688-699.
Counting Cover Crops 11
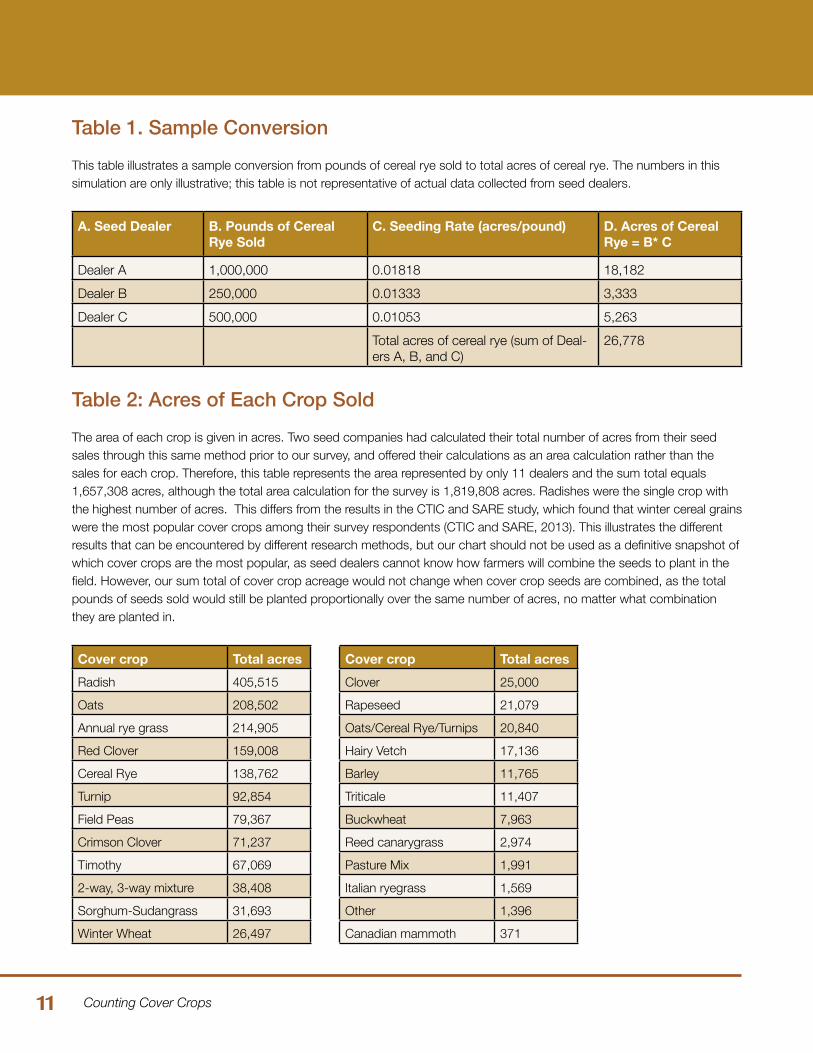
Table 1. Sample Conversion
This table illustrates a sample conversion from pounds of cereal rye sold to total acres of cereal rye. The numbers in this simulation are only illustrative; this table is not representative of actual data collected from seed dealers.
A. Seed Dealer B. Pounds of CerealRye Sold
C. Seeding Rate (acres/pound) D. Acres of Cereal Rye = B* C
Dealer A 1,000,000 0.01818 18,182
Dealer B 250,000 0.01333 3,333
Dealer C 500,000 0.01053 5,263
Total acres of cereal rye (sum of Deal-ers A, B, and C)
26,778
Table 2: Acres of Each Crop Sold
The area of each crop is given in acres. Two seed companies had calculated their total number of acres from their seed sales through this same method prior to our survey, and offered their calculations as an area calculation rather than the sales for each crop. Therefore, this table represents the area represented by only 11 dealers and the sum total equals 1,657,308 acres, although the total area calculation for the survey is 1,819,808 acres. Radishes were the single crop with the highest number of acres. This differs from the results in the CTIC and SARE study, which found that winter cereal grains were the most popular cover crops among their survey respondents (CTIC and SARE, 2013). This illustrates the different results that can be encountered by different research methods, but our chart should not be used as a definitive snapshot of which cover crops are the most popular, as seed dealers cannot know how farmers will combine the seeds to plant in the field. However, our sum total of cover crop acreage would not change when cover crop seeds are combined, as the total pounds of seeds sold would still be planted proportionally over the same number of acres, no matter what combination they are planted in.
Cover crop Total acres
Radish 405,515
Oats 208,502
Annual rye grass 214,905
Red Clover 159,008
Cereal Rye 138,762
Turnip 92,854
Field Peas 79,367
Crimson Clover 71,237
Timothy 67,069
2-way, 3-way mixture 38,408
Sorghum-Sudangrass 31,693
Winter Wheat 26,497
Cover crop Total acres
Clover 25,000
Rapeseed 21,079
Oats/Cereal Rye/Turnips 20,840
Hairy Vetch 17,136
Barley 11,765
Triticale 11,407
Buckwheat 7,963
Reed canarygrass 2,974
Pasture Mix 1,991
Italian ryegrass 1,569
Other 1,396
Canadian mammoth 371
Counting Cover Crops 15
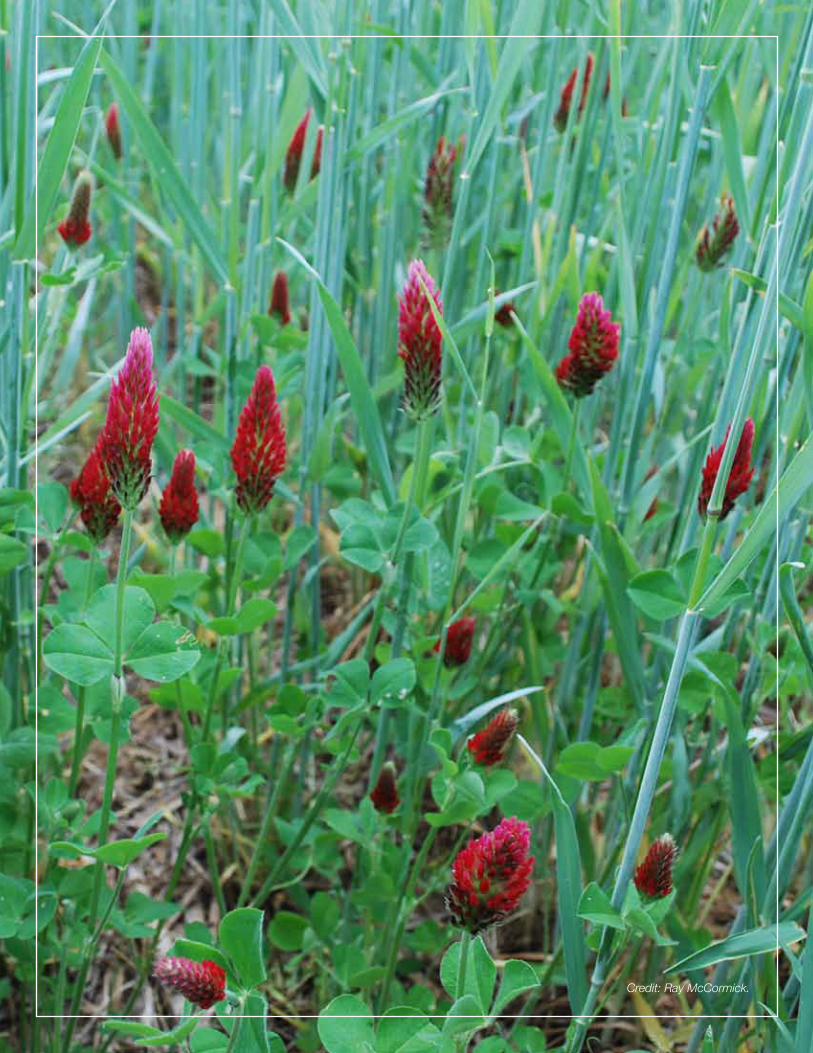
Credit: Ray McCormick.
National Wildlife FederationNational Advocacy Center
901 E St. NW, Suite 400
Washington, DC 20004
www.nwf.org
Printed on Sustainable (or Recycled) Paper, 100% PCW, PCF.