Embed Size (px)
Citation preview

COUNT ME IN PEEL! 2016 WORKFORCE
CENSUS: FINAL REPORT
May 2017
Curriculum and Instruction Support Services

Suggested citation: Peel District School Board (2017). Count Me in Peel! 2016 workforce census. Mississauga, ON: Peel District School Board.
© Peel District School Board, 2017

3
TABLE OF
CONTENTS
Introduction ….……………………………………………..1 Methodology …………………………………………….…2 Results .…………………………………………….……….3 Key Findings …...…………………………………………31 Limitations …...……………………………………………34 References ……..………………………………………...35


1
INTRODUCTION
Overview of the Workforce Census
A workforce census is a count of employees in an organization, used to gather a more detailed picture of staff in the workplace. The information collected through a workforce census can help organizations better understand and serve the interests of all employees. Recently, workforce censuses have been conducted by a number of organizations in Ontario, including the Ottawa-Carleton District School Board (TWI Inc., 2011a) and the City of Hamilton (TWI Inc., 2011b). We believe that the workforce census will help the Peel board to identify strengths and barriers to equity and inclusion, and to develop plans and
supports to address workplace equity. It will provide data to facilitate
action on one of the goals in the board’s Plan for Student Success: achieve inclusion for all through continuous progress on equity. The
current workforce census also addresses one of the recommendations found in the Research Report: Hiring and Promotion at the Peel District School Board (Turner Consulting Group, 2013) and The Journey Ahead: Our Action Plan for Equitable Hiring and Promotion in Peel (Peel District School Board, 2013) – that data should be collected and analyzed to “assess how well the designated groups are represented within its workforce and more thoroughly assess barriers to employment and advancement within the organization” (pp. 115 and 12, respectively). Ultimately, the workforce census provides an opportunity for the Peel board to renew and enhance their commitment to employee engagement, satisfaction and inclusion.
WHY have a
workforce census?

2
METHODOLOGY
The Peel District School Board embarked on a process to conduct a workforce census of its staff. A consultation process began, with involvement and approval from all employee associations and federations, as well as certain stakeholder committees (e.g., Make Peel Proud Spectrum Committee; First Nations, Métis, Inuit Education Advisory Circle). In accordance with guidelines from the Ontario Human Rights Commission, the workforce census was voluntary and confidential. The census was also anonymous, in order to address privacy concerns.
The workforce census was divided into two broad categories of questions: (1) organizational demographics: questions related to the employee’s position within the Peel board (e.g., employment status, length of employment), and (2) workforce demographics: questions related to the fixed characteristics of an individual (e.g., ethnicity, religion). The census was comprised of 22 questions, and took approximately 10 minutes to complete.
The Peel board workforce census was launched on November 14th, 2016 and remained open until November 28th, 2016. Staff had the option of accessing the workforce census either online, through FluidSurveysTM, or in paper format. An email was sent to 24,696 Peel board staff with the survey link and additional information about the survey. The paper versions of the survey were available at all Peel board work locations, and completed paper surveys were mailed through the board courier to the Research and Accountability department. Computer terminals were also set up at schools and at the Central Board Office so that staff could complete the anonymous workforce census online, in order to ensure adequate accessibility.
HOW was it
created?

3
A total of 11,084 Peel board employees completed the workforce census – 10,705 employees completed the survey online, while another 379 completed the paper version. Due to a disproportionately low response rate of 2.9% by casual employees, these data were not included in the analyses. Without the inclusion of casual employees, the overall response rate of permanent full-time and part-time employees was 66.3%. Results for the total number of permanent full-time and part-time employees (N = 10,828) are included in this report.
RESULTS
As the workforce census aims to profile the employees who responded to the survey questions, the valid percent – or those employees who answered each question, will be presented in this report. The tables will include information about those who skipped the question (missing data) or those who clicked on the “Choose not to answer” response. In the following section, the data are presented in graphical and tabular format in the order in which each question appeared in the Count Me in Peel! 2016 Workforce Census. All 22 questions from the workforce census are included, in addition to a number of supplemental analyses and comparisons. For questions where more than one response has been selected (i.e., Select all that apply.), the percentage of respondents (and not responses) will be reported. For all tables and graphs, sums may not equal 100% due to rounding.
WHO completed
it?

4
WHAT we found …

5
Question 1: Please select the federation, union, or association which reflects your primary job responsibility in the Peel District School Board.
Employee Group Number Percent
ASG – Administrative Staff Group 208 2.0%
CUPE Local 1628 (e.g., secretarial/clerical staff, library technician) 673 6.3%
CUPE Local 2544 (e.g., custodian, maintenance worker, food services staff, Learning Technology Support Services)
386 3.6%
ERFP – Educational Resource Facilitators of Peel (e.g., Designated Early Childhood Educator, Teaching Assistant, Behaviour Teaching Assistant)
1,320 12.4%
ETFO: PEOT – Peel Elementary Occasional Teachers 921 8.6%
ETFO: PETL – Peel Elementary Teachers’ Local 4,124 38.7%
OPSEU Local 283 (e.g., adult English as a Second Language/Literacy & Basic Skills instructor)
53 0.5%
OPSEU Local 292 (e.g., Learning Technology Support Services, media staff) 72 0.7%
OSSTF – Ontario Secondary School Teachers’ Federation (e.g., District 19, Professional Student Services Personnel)
2,098 19.7%
OSSTF: PSOT – Peel Secondary Occasional Teachers 280 2.6%
School Administrator – principal 254 2.4%
School Administrator – vice-principal 218 2.0%
Senior Administrator (e.g., director, superintendent, controller) 32 0.3%
Not indicated above 21 0.2%
Total Responses* 10,660 100.0%
Note.*Total Responses in this table represent 10,660 of 10,828 responses (98.4%), and do not include Missing data (n = 68 or 0.6%) and Choose not to answer responses (n = 100 or 0.9%).
47.3% of respondents were elementary teachers.
22.3% of respondents were secondary teachers.
6
34%
100%
98%
85%
77%
57%
53%
53%
46%
33%
32%
27%
27%
22%
Not indicated above
Senior Administrator
School Administrator-principal
School Administrator-vice-principal
ASG-Administrative Staff Group
ETFO: PETL-Peel Elementary Teachers' Local
CUPE Local 1628
OPSEU Local 292
OSSTF-Ontario Secondary School Teachers'Federation
OPSEU Local 283
ERFP-Educational Resource Facilitators of Peel
CUPE Local 2544
ETFO: PEOT-Peel Elementary Occasional Teachers
OSSTF: PSOT-Peel Secondary Occasional Teachers
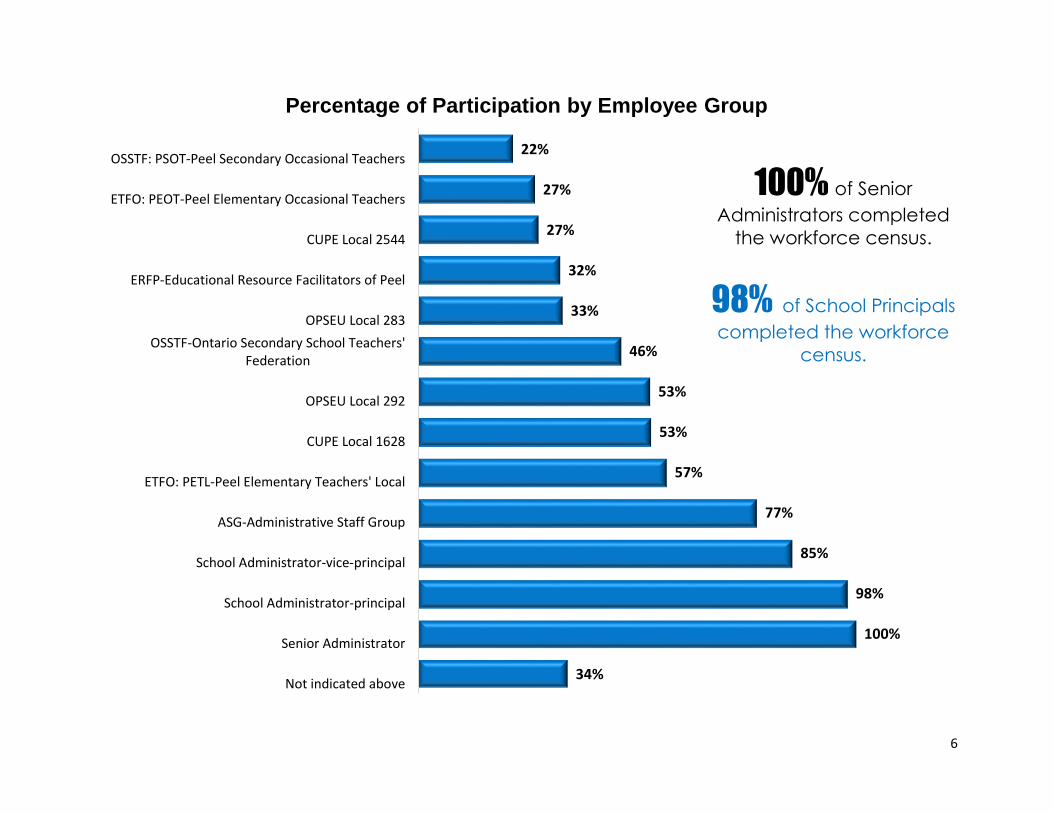
Percentage of Participation by Employee Group
100% of Senior
Administrators completed
the workforce census.
98% of School Principals
completed the workforce
census.

7
Question 2: Do you currently hold a position of responsibility?
Position of Responsibility
Number Percent
Yes 1,494 15.2%
No 8,358 84.8%
Total Responses 9,852 100.0%
Note. Total Responses in this table represent 9,852 of 10,828 responses (91.0%), and do not include Missing data (n = 646 or 6.0%) and Choose not to answer responses (n = 330 or 3.0%).
Question 3: Are you currently in an acting position?
Acting Position Number Percent
Yes 1,357 13.5%
No 8,686 86.5%
Total Responses* 10,043 100.0%
Note.*Total Responses in this table represent 10,043 of 10,828 responses (92.8%), and do not include Missing data (n = 364 or 3.4%) and Choose not to answer responses (n = 421 or 3.9%).
Approximately 15% of
respondents hold a
position of responsibility
and/or are in an acting
position.
Of all respondents who self-identify as female, 13.6% have a position of responsibility.
Of all respondents who self-identify as male, 21.0% have a position of responsibility.

8
Question 4: Where is your primary work location?
Question 5: What is your primary employment status with the Peel District School Board?
Location of Work Number Percent
H.J.A. Brown Education Centre 374 3.6%
Elementary school (including International Languages – elementary)
6,642 63.7%
Field centre 15 0.1%
Field office 184 1.8%
Maintenance shop/office 39 0.4%
Secondary school (including International Languages–secondary, PAS North & South, Adult Education sites)
2,752 26.4%
Itinerant locations (assigned to different work locations) 332 3.2%
Not indicated above 80 0.8%
Total Responses* 10,418 100.0%
Note.*Total Responses in this table represent 10,418 of 10,828 responses (96.2%), and do not include Missing data (n = 232 or 2.1%) and Choose not to answer responses (n = 178 or 1.6%).
Employment Status Number Percent
Permanent or probationary full-time employee 8,536 81.2%
Permanent or probationary part-time employee 420 4.0%
Casual, occasional, temporary, or contract employee 1,522 14.5%
Not indicated above 28 0.3%
Total Responses* 10,506 100.0%
Note.*Total Responses in this table represent 10,506 of 10,828 responses (97.0%), and do not include Missing data (n = 267 or 2.5%) and Choose not to answer responses (n = 55 or 0.5%).
90.1% of respondents work
in an elementary or
secondary school.
81.2% of respondents
work full-time.

9
50.5% have worked
between 6 – 15 years at
the board.
86.4% of respondents
work days only.
Question 6: How long have you been employed with the Peel District School Board?
Question 7: What is your primary work schedule?
Note. Total Respondents in this table represent 10,525 of 10,828 (97.2%), and do not include Missing data (n = 303 or 2.8%).
Length of Employment Number Percent
Less than 1 year 314 3.0%
1 - 5 years 2,051 19.5%
6 - 10 years 2,574 24.5%
11 - 15 years 2,739 26.0%
16 - 20 years 1,441 13.7%
21 - 25 years 473 4.5%
More than 25 years 931 8.8%
Total Responses* 10,523 100.0%
Note.*Total Responses in this table represent 10,523 of 10,828 responses (97.2%), and do not include Missing data (n = 209 or 1.9%) and Choose not to answer responses (n = 96 or 0.9%).
Work Schedule Number Percentage of Respondents
Days Only 9,091 86.4%
Days and Afternoons 917 8.7%
Days, Afternoons, Nights and/or Weekends 203 1.9%
Afternoons Only 147 1.4%
Days, Nights and/or Weekends 106 1.0%
Nights and/or Weekends 45 0.4%
Afternoons, Nights and/or Weekends 16 0.2%
Total Respondents 10,525 100.0%

10
148 different countries of birth
were reported by respondents.
85.2% of respondents were
born in Canada, India, the United
Kingdom/Great Britain, Jamaica
or Pakistan..
Question 8: Where were you born?
Canada72.5%
India6.9%
United Kingdom/Great
Britain
2.7%
Jamaica2.0%
Pakistan1.1%
All other countries14.8%
Respondents' Country of Birth
Top 5 Countries of Birth
Number Percent
Canada 7,269 72.5%
India 691 6.9%
United Kingdom/ Great Britain
275 2.7%
Jamaica 197 2.0%
Pakistan 106 1.1%
All other countries 1,487 14.8%
Total Responses* 10,025 100.0%
Note. *Total Responses in this table represent 10,025 of 10,828 responses (92.6%) and do not include Missing data (n = 803 or 7.4%).

11
Respondents' Country of Birth – All Other Countries with 10 or More Responses
All Other Countries (n>=10) Number Percent
Lebanon 13 0.13%
Malta 13 0.13%
Tanzania 13 0.13%
Ukraine 13 0.13%
Ireland 12 0.12%
Kuwait 12 0.12%
Argentina 11 0.11%
Taiwan 11 0.11%
France 10 0.10%
Uganda 10 0.10%
Zimbabwe 10 0.10%
All Other Countries (n>=10) Number Percent
United States 94 0.94%
Poland 85 0.85%
Trinidad and Tobago 67 0.67%
Portugal 66 0.66%
Guyana 63 0.63%
Italy 60 0.60%
Philippines 59 0.59%
Nigeria 55 0.55%
Sri Lanka 42 0.42%
Romania 40 0.40%
China 39 0.39%
Hong Kong 35 0.35%
Egypt 31 0.31%
Germany 28 0.28%
Mauritius 26 0.26%
Vietnam 25 0.25%
Ghana 24 0.24%
South Africa 22 0.22%
Bosnia and Herzegovina 21 0.21%
Albania 20 0.20%
Serbia 20 0.20%
Iran 19 0.19%
Korea, Republic of (South Korea) 17 0.17%
Croatia 15 0.15%
Kenya 15 0.15%
Bangladesh 13 0.13%
Brazil 13 0.13%
Chile 13 0.13%
103 other countries of birth with
less than 10 respondents not
listed here, due to confidentiality.
Top 5 countries of birth for
Peel board students: Canada,
India, Pakistan, the United
States, and the United Arab
Emirates.

12
49.1% of respondents fall into the 35 – 49 year age range.
Question 9: To which age group do you belong?
Age Group Number Percent
20 - 24 years 114 1.1%
25 - 29 years 840 8.3%
30 - 34 years 1,261 12.4%
35 - 39 years 1,703 16.7%
40 - 44 years 1,745 17.1%
45 - 49 years 1,550 15.2%
50 - 54 years 1,347 13.2%
55 - 59 years 906 8.9%
60 - 64 years 510 5.0%
65 years or older 205 2.0%
Total Responses* 10,181 100.0%
Note.*Total Responses in this table represent 10,181 of 10,828 responses (94.0%), and do not include Missing data (n = 271 or 2.5%) and Choose not to answer responses (n = 376 or 3.5%).
1.1%
8.3%
12.4%
16.7% 17.1%
15.2%
13.2%
8.9%
5.0%
2.0%
20 - 24years
25 - 29years
30 - 34years
35 - 39years
40 - 44years
45 - 49years
50 - 54years
55 - 59years
60 - 64years
65 yearsor older
Age Group of Respondents(N = 10,181)

13
12.2% of respondents plan to
retire in the next 5 years.
24.4% plan to retire in the
next 10 years.
12.2% plan to retire in the
next 5 years.
A large group of
respondents (18.6%) do not
know or are undecided.
Question 10: When do you plan to retire?
Retirement Plan Number Percent
Less than 1 year 130 1.3%
1 - 5 years 1,087 10.9%
6 - 10 years 1,216 12.2%
11 - 15 years 1,586 15.9%
16 - 20 years 1,518 15.2%
21 - 25 years 1,151 11.5%
26 - 30 years 828 8.3%
More than 30 years 615 6.2%
Do not know/undecided 1,860 18.6%
Total Responses* 9,991 100.0%
Note.*Total Responses in this table represent 9,991 of 10,828 responses (92.3%), and do not include Missing data (n = 339 or 3.1%) and Choose not to answer responses
(n = 498 or 4.6%).
1.3%
10.9%12.2%
15.9%15.2%
11.5%
8.3%
6.2%
18.6%
Less than 1 year 1 - 5 years 6 - 10 years 11 - 15 years 16 - 20 years 21 - 25 years 26 - 30 years More than 30years
Do notknow/undecided
Retirement Plan of Respondents(N = 9,991)
14
21%
25%
21%
9%
5%
10%
23%
11%
12%
7%
33%
13%
55%
16%
20%
19%
7%
4%
12%
10%
9%
12%
5%
31%
27%
28%
45%
35%
43%
59%
64%
61%
35%
67%
60%
60%
30%
52%
14%
18%
19%
17%
25%
26%
17%
33%
13%
16%
28%
6%
9%
3%
ASG – Administrative Staff Group
CUPE Local 1628 (e.g., secretarial/clerical staff, librarytechnician)
CUPE Local 2544 (e.g., custodian, maintenance worker, foodservices staff, LTSS)
ERFP – Educational Resource Facilitators of Peel (e.g., DECE, TA, BTA)
ETFO: PEOT – Peel Elementary Occasional Teachers
ETFO: PETL – Peel Elementary Teachers’ Local
OPSEU Local 283 (e.g., adult ESL/LBS instructor)
OPSEU Local 292 (e.g., LTSS, media staff)
OSSTF – Ontario Secondary School Teachers’ Federation (e.g., District 19, PSSP)
OSSTF: PSOT – Peel Secondary Occasional Teachers
School Administrator – principal
School Administrator – vice-principal
Senior Administrator (e.g., director, superintendent,controller)
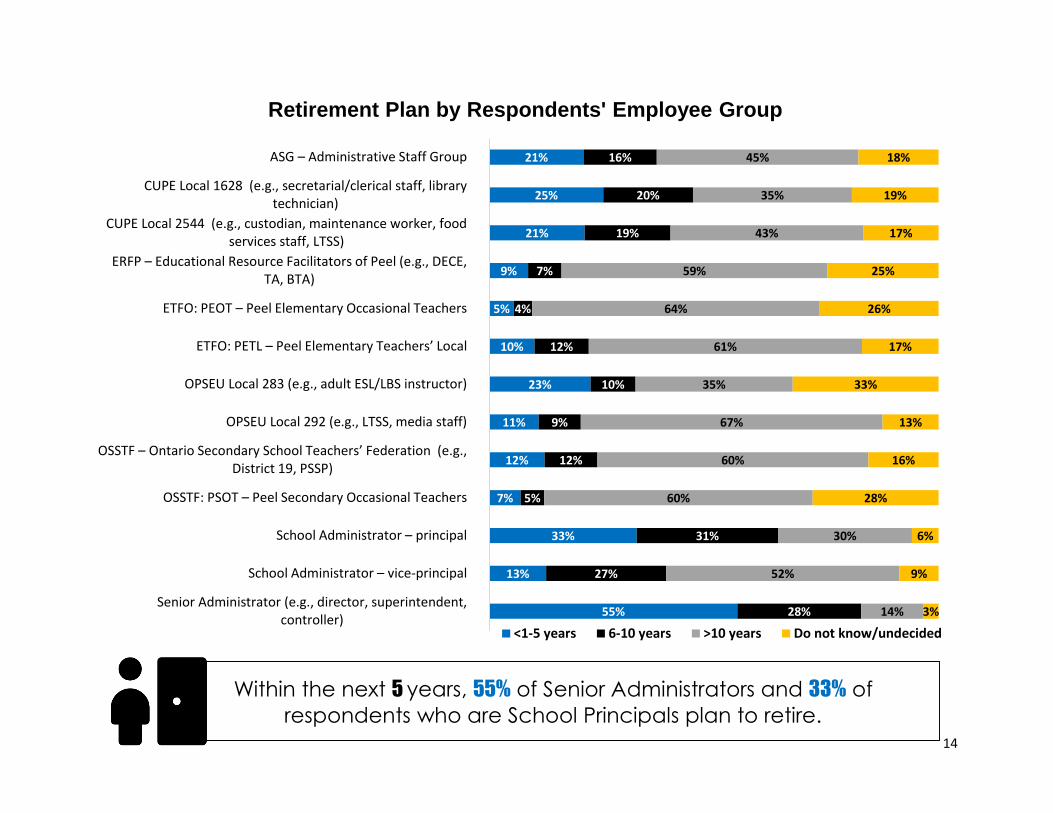
Retirement Plan by Respondents' Employee Group
<1-5 years 6-10 years >10 years Do not know/undecided
Within the next 5 years, 55% of Senior Administrators and 33% of
respondents who are School Principals plan to retire.

15
58.9% of respondents live in
the Region of Peel.
41.1% of respondents live
outside the Region of
Peel.
Question 11: Do you live in the Region of Peel?
Peel Resident Number Percent
Yes 6,105 58.9%
No 4,262 41.1%
Total Responses* 10,367 100.0%
Note.*Total Responses in this table represent 10,367 of 10,828 responses (95.7%), and do not include Missing data (n = 296 or
2.7%) and Choose not to answer responses (n = 165 or 1.5%).
Region of Peel Map

16
# of Conditions or Disabilities Reported
Number
Percentage of Respondents
1 condition or disability
391 55.4%
2 conditions or disabilities
159 22.5%
3 conditions or disabilities
82 11.6%
4 or more conditions or disabilities
25 3.5%
Conditions or disabilities not specified
49 6.9%
Total Respondents
706 100.0%
7% of respondents
consider themselves a
person with a condition or
disability.
Question 12: Do you consider yourself to be a person with a condition or disability?
Question 12b: What is the nature of your condition or disability?
Note. Total Responses in this table represent 1,072 of 1,129 responses (95.0%), and do not include Choose not to answer responses (n = 57 or 5.0%).
Condition or Disability Number Percent
Yes 706 7.0%
No 9,394 93.0%
Total Responses* 10,100 100.0%
Note.*Total Responses in this table represent 10,100 of 10,828 responses (93.3%), and do not include Missing data (n = 276 or 2.5%) and Choose not to answer responses (n = 452 or 4.2%).
Condition or Disability Reported (in descending order of frequency)
(n = 1,072 responses)
Order of Responses
Chronic medical condition 1
Mental health 2
Physical, functional, and/or mobility 3
Pain 4
Hearing 5
Learning 6
Seeing/sight/visual 7
Memory 8
Cognitive impairment 9
Addiction 10
Intellectual/developmental 11
Speech 12
Not indicated above -

17
79.9% of respondents self-
identify as female.
Question 13: Indicate your gender identity.
Gender Identity Number Percentage of Respondents
Female 8,156 79.9%
Male 2,031 19.9%
Not indicated above 15 0.1%
Total Respondents 10,202 100%
Note. Total Respondents in this table represent 10,202 of 10,828 (94.2%), and do not include Missing data (n = 329 or 3.0%) and Choose not to answer responses (n = 297 or 2.7%).
In which employee group did
respondents self-identify as female?
99% in CUPE Local 1628.
95% in Educational Resource Facilitators of
Peel.
92% in OPSEU Local 283 (e.g., adult ESL/LBS
instructor).
85% in Peel elementary teachers. This compares
with 81% female elementary teachers in Ontario*.
72% in school administrator roles (e.g.,
principal/vice-principal).
48% in senior administrator roles (e.g., director,
superintendent, controller).
29% in OPSEU Local 292 (e.g., LTSS, media staff).
*Source: Elementary Teachers’ Federation of Ontario (2017, personal
communication)

18
65%
99%
46%
95%
87%
85%
92%
29%
66%
61%
73%
70%
48%
35%
1%
54%
5%
13%
15%
8%
70%
34%
39%
26%
30%
52%
0.3%
0.2%
0.1%
1.6%
0.3%
0.4%
ASG – Administrative Staff Group
CUPE Local 1628 (e.g., secretarial/clerical staff, librarytechnician)
CUPE Local 2544 (e.g., custodian, maintenance worker, foodservices staff, LTSS)
ERFP – Educational Resource Facilitators of Peel (e.g., DECE, TA, BTA)
ETFO: PEOT – Peel Elementary Occasional Teachers
ETFO: PETL – Peel Elementary Teachers’ Local
OPSEU Local 283 (e.g., adult ESL/LBS instructor)
OPSEU Local 292 (e.g., LTSS, media staff)
OSSTF – Ontario Secondary School Teachers’ Federation (e.g., District 19, PSSP)
OSSTF: PSOT – Peel Secondary Occasional Teachers
School Administrator – principal
School Administrator – vice-principal
Senior Administrator (e.g., director, superintendent, controller)
Gender Identity by Respondents' Employee Group
Female Male Not indicated above

19
At 15.8%, this question had the
highest percentage of Choose not to
answer responses of all 22 workforce
census questions.
88.3% of respondents identify
as heterosexual, although a large
number of respondents (1,712)
chose not to answer.
4.8% of respondents identify as LGBTQ+ (i.e., lesbian, gay,
bisexual, transgender, queer, questioning, two-spirited).
Question 14: Indicate the sexual orientation(s) with which you currently identify.
Sexual Orientation(s)
Number
Percentage of Respondents
Asexual 519 5.9%
Bisexual 127 1.5%
Gay 118 1.3%
Heterosexual 7,722 88.3%
Lesbian 87 1.0%
Queer 32 0.4%
Questioning 32 0.4%
Two-spirited 21 0.2%
Not indicated above 86 1.0%
Total Respondents 8,744 100.0%
Note. Total Respondents in this table represent 8,744 of 10,828 (80.8%), and do not include Missing data (n = 372 or 3.4%) and
Choose not to answer responses (n = 1,712 or 15.8%).

20
82% of respondents possess a Bachelor’s degree (includes respondents with a Bachelor’s
degree, certificate or diploma above Bachelor level, Master’s degree, and Doctorate).
23% hold a graduate degree (e.g., Master’s degree, Doctorate).
12.5% possess a college certificate or diploma.
Question 15: What is the highest level of education you have completed?
Highest Level of Education Completed Number Percent
No school degree, certificate, or diploma 26 0.3%
Secondary school diploma or equivalency certificate 435 4.2%
Registered apprenticeship certificate 21 0.2%
Other trades certificate or diploma 56 0.5%
College certificate or diploma 1,285 12.5%
Bachelor’s degree 4,063 39.5%
Certificate or diploma above Bachelor level 2,003 19.5%
Master’s degree 2,271 22.1%
Doctorate 92 0.9%
Not indicated above 32 0.3%
Total Responses* 10,284 100.0%
Note.*Total Responses in this table represent 10,284 of 10,828 responses (95.0%), and do not include Missing data (n = 346 or 3.2%) and Choose not to answer responses (n = 198 or 1.8%).

21
25.5% of respondents self-identify as a
member of a racialized
community, although a large
number of respondents (1,194)
chose not to answer.
Question 16: Where did you complete your highest level of education?
Where highest level of education completed Number Percent
In Canada 8,030 77.8%
Outside of Canada 1,566 15.2%
Both inside, and outside of Canada 721 7.0%
Total Responses* 10,317 100.0%
Note.*Total Responses in this table represent 10,317 of 10,828 responses (95.3%), and do not include Missing data (n = 381 or 3.5%) and Choose not to answer responses (n = 130 or 1.2%).
Question 17: Do you self-identify as a member of a racialized community?
Self-identify as a member of a racialized community
Number Percent
Yes 2,349 25.5%
No 6,876 74.5%
Total Responses* 9,225 100.0%
Note.*Total Responses in this table represent 9,225 of 10,828 responses (85.2%), and do not include Missing data (n = 409 or 3.8%) and Choose not to answer responses (n = 1,194 or 11.0%).
77.8% of respondents
completed their
highest level of
education in Canada.

22
1.4% of respondents self-identify
as First Nations, Métis or
Inuit in North America.
The top 5 racial identities most commonly reported by respondents were: (1) White,
(2) South Asian – East Indian, (3) Black, (4) Chinese, and (5) North African or Arab.
Racial Identity
Number Percentage of Respondents
Black 706 7.1%
Chinese 262 2.6%
Filipino 85 0.9%
Japanese 45 0.5%
Korean 44 0.4%
South Asian-East Indian 1,570 15.9%
Southeast Asian 69 0.7%
non-white Latin American 109 1.1%
non-white West Asian 64 0.6%
North African or Arab 114 1.2%
White 6,653 67.2%
Not indicated above 102 1.0%
Mixed 53 0.5%
First Nations, Métis, Inuit 19 0.2%
Total Respondents 9,895 100.0%
Note. Total Respondents in this table represent 9,895 of 10,828 (91.4%), and do not include Missing data (n = 99 or 0.9%) and Choose not to answer responses (n = 834 or 7.7%). Based on the open-ended responses, Mixed was added as a new category.
Question 18: Do you self-identify as First Question 19: Indicate your racial identity. Nations, Métis, or Inuit in North America?
First Nations, Métis, Inuit Number Percent
Yes, First Nations 61 0.6%
Yes, Métis 70 0.7%
Yes, Inuit 12 0.1%
No 9,563 98.5%
Total Respondents 9,706 100.0%
Note. Total Respondents in this table represent 9,706 of 10,828 (89.6%), and do not include Missing data (n = 635 or 5.9%) and Choose not to answer responses (n = 487 or 4.5%).

23
66%
75%
74%
56%
58%
71%
44%
66%
68%
62%
77%
68%
73%
16%
15%
3%
18%
26%
16%
31%
11%
13%
18%
9%
14%
9%
6%
3%
6%
17%
5%
5%
8%
7%
9%
7%
9%
15%
5%
2%
2%
3%
2%
8%
4%
4%
2%
6%
2%
7%
2%
9%
6%
3%
4%
4%
8%
6%
16%
6%
9%
6%
7%
9%
3%
ASG – Administrative Staff Group
CUPE Local 1628 (e.g., secretarial/clerical staff, librarytechnician)
CUPE Local 2544 (e.g., custodian, maintenance worker, foodservices staff, LTSS)
ERFP – Educational Resource Facilitators of Peel (e.g., DECE, TA, BTA)
ETFO: PEOT – Peel Elementary Occasional Teachers
ETFO: PETL – Peel Elementary Teachers’ Local
OPSEU Local 283 (e.g., adult ESL/LBS instructor)
OPSEU Local 292 (e.g., LTSS, media staff)
OSSTF – Ontario Secondary School Teachers’ Federation (e.g., District 19, PSSP)
OSSTF: PSOT – Peel Secondary Occasional Teachers
School Administrator – principal
School Administrator – vice-principal
Senior Administrator (e.g., director, superintendent, controller)
Racial Identity by Employee Group
White South Asian-East Indian Black Chinese Filipino Non-white Latin American Non-white West Asian All Others

24
TOP 5 most commonly
reported regions from which
ethnicity and ethnocultural
practices originate:
Canada
Canada and Europe
Asia
Europe
Canada and Asia
Question 20: Indicate the region(s) from which the strongest aspects of your ethnicity and ethnocultural practices originate (regardless of how long you or your ancestors have lived in Canada).
Note. Total Respondents in this table represent 9,772 of 10,828 (90.2%), and do not include Missing data (n = 446 or 4.1%) and Choose not to answer responses (n = 610 or 5.6%).
Region(s)
Number
Percentage of Respondents
Canada Only 3,047 31.2%
Canada and Europe 1,604 16.4%
Canada and Africa 49 0.5%
Canada and Africa and Americas 26 0.3%
Canada and Africa and Asia 31 0.3%
Canada and Americas 176 1.8%
Canada and Americas and Asia 30 0.3%
Canada and Americas and Europe 190 1.9%
Canada and Arctic/Antarctica 30 0.3%
Canada and Asia 607 6.2%
Canada and Asia and Europe 192 2.0%
Canada and Indigenous 25 0.3%
Canada and Oceania/Australia 31 0.3%
Africa Only 186 1.9%
Africa and Americas 27 0.3%
Africa and Asia 33 0.3%
Africa and Europe 11 0.1%
Americas Only 474 4.9%
Americas and Asia 29 0.3%
Americas and Europe 56 0.6%
Arctic/Antarctica 45 0.5%
Asia Only 1,475 15.1%
Asia and Europe 101 1.0%
Europe 1,199 12.3%
Not Sure 85 0.9%
Not Indicated Above 13 0.1%
Total Respondents 9,772 100.0%

25
3 new categories were added, based on the open-ended responses:
(1) atheism, (2) agnostic, and (3) spiritual (non-religious).).
TOP 5 most commonly
reported religions and
spiritualities:
Christianity
I do not have a religion
or spirituality.
Hinduism
Sikhism
Islam
Question 21: Indicate any religion or spirituality with which you identify.
Note. Total Respondents in this table represent 9,176 of 10,828 (84.7%), and do not include Missing data (n = 492 or 4.5%) and Choose not to answer responses (n = 1,160 or 10.7%).
Religions and Spiritualities
Number
Percentage of Respondents
Aboriginal Spirituality 24 0.3%
Buddhism 104 1.1%
Christianity Only 5,472 59.6%
Christianity and Hinduism 33 0.4%
Christianity and Aboriginal Spirituality 31 0.3%
Christianity and Buddhism 56 0.6%
Christianity and Judaism 30 0.3%
Christianity and Other Religion 92 1.0%
Hinduism Only 455 5.0%
Hinduism and Buddhism 10 0.1%
Hinduism and Sikhism 42 0.5%
Islam 361 3.9%
Judaism 114 1.2%
Sikhism 459 5.0%
Wicca 19 0.2%
Zoroastrianism 16 0.2%
Agnostic 28 0.3%
Atheism 46 0.5%
Spiritual (non-religious) 50 0.5%
Multiple Other Religions 60 0.7%
Not indicated above 133 1.4%
I do not have a religion or spirituality. 1,541 16.8%
Total Respondents 9,176 100.0%

26
Question 22: In which language(s) can you communicate fluently?
Language Number* Percentage of Respondents
(n = 9,973)
Order of Responses
English 9,178 92.0% 1
French 1,458 14.6% 2
Hindi 827 8.3% 3
Punjabi 749 7.5% 4
Urdu 458 4.6% 5
Italian 388 3.9% 6
Spanish 279 2.8% 7
Portuguese 199 2.0% 8
German 170 1.7% 9
Polish 137 1.4% 10
Gujarati 124 1.2% 11
Arabic 123 1.2% 12
Cantonese 112 1.1% 13
Greek 96 1.0% 14
Not indicated above 140 1.4% -
All Others 1,356 13.6% -
Note. *The number of responses in this table represent 15,894 responses from 9,973 of 10,828 respondents (92.1%), and does not include Missing data (n = 523 or 4.8%) or Choose not to answer responses (n = 332 or 3.1%).
Top 5 most commonly
reported languages
spoken by respondents:
(1) English (92.0%)
(2) French (14.6%)
(3) Hindi (8.3%)
(4) Punjabi (7.5%)
(5) Urdu (4.6%).
Top 5 languages spoken by Peel board students:
(1) English
(2) Punjabi
(3) Urdu
(4) Hindi
(5) Arabic
27
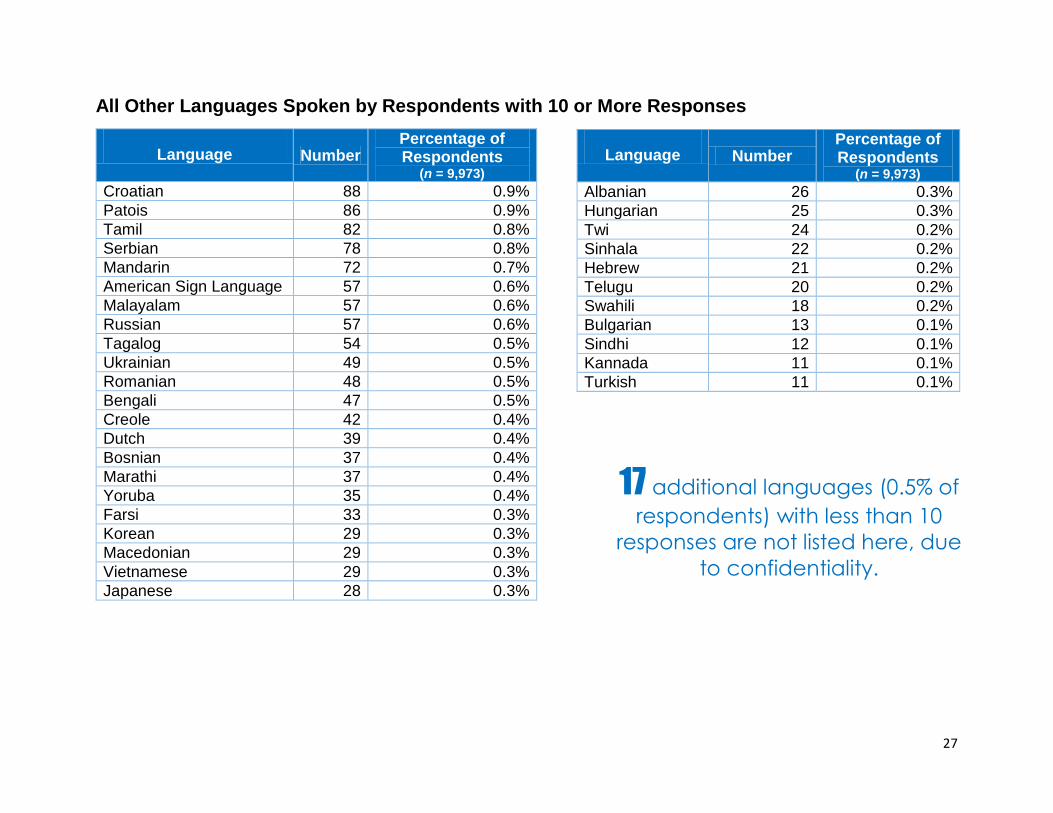
17 additional languages (0.5% of
respondents) with less than 10
responses are not listed here, due
to confidentiality.
All Other Languages Spoken by Respondents with 10 or More Responses
Language Number Percentage of Respondents
(n = 9,973)
Croatian 88 0.9%
Patois 86 0.9%
Tamil 82 0.8%
Serbian 78 0.8%
Mandarin 72 0.7%
American Sign Language 57 0.6%
Malayalam 57 0.6%
Russian 57 0.6%
Tagalog 54 0.5%
Ukrainian 49 0.5%
Romanian 48 0.5%
Bengali 47 0.5%
Creole 42 0.4%
Dutch 39 0.4%
Bosnian 37 0.4%
Marathi 37 0.4%
Yoruba 35 0.4%
Farsi 33 0.3%
Korean 29 0.3%
Macedonian 29 0.3%
Vietnamese 29 0.3%
Japanese 28 0.3%
Language Number Percentage of Respondents
(n = 9,973)
Albanian 26 0.3%
Hungarian 25 0.3%
Twi 24 0.2%
Sinhala 22 0.2%
Hebrew 21 0.2%
Telugu 20 0.2%
Swahili 18 0.2%
Bulgarian 13 0.1%
Sindhi 12 0.1%
Kannada 11 0.1%
Turkish 11 0.1%

28
English92%
French, 15%
Hindi, 8%
Urdu, 5%
Italian, 4%
Spanish, 3%
Portuguese, 2%
German, 2%
Polish, 1%
Gujarati, 1%
Arabic, 1%
Cantonese, 1%
Greek, 1%
Not indicated above, 1%
Languages Spoken by Respondents(N=9,973)
117
Different
Languages

29
Respondents Who Communicate Fluently in More than One Language
English + 1 Other Language
English + 2 Other Languages
1 Other Language
2 Other Languages
3 Other Languages
English, French (n = 895)
English, Hindi, Punjabi (n = 200)
Punjabi (n = 66)
Hindi, Urdu (n = 38)
Hindi, Punjabi, Urdu (n = 45)
English, Italian (n = 169)
English, French, Italian (n = 80)
Italian (n = 66)
English, Punjabi (n = 111)
English, French, Spanish (n = 50)
Portuguese (n = 39)
English, Spanish (n = 95)
English, French, German (n = 30)
English, Portuguese (n = 95)
English, Polish (n = 61)
English, German (n = 59)
English, Patois (n = 55)
English, Cantonese (n = 55)
English, Hindi (n = 54)
English, Greek (n = 44)
English, Urdu (n = 38)
English, Arabic (n = 38)
41.8% of respondents
communicate fluently in
more than one language.

30
Number of Languages Spoken by Respondents
English only
58%
English + French
9%
English + 1 Other
Language
13%
English + 2 Other
Languages
8%
English + 3 or more Other
Languages
5%
1 Other Language
5%
2 Other Languages
1%
3 or more Other
Languages
1%
13% speak English and one other language. 9% speak English
and French. 8% speak English and two other languages.
58% speak English only.
31
KEY FINDINGS
Based on the results from the Peel District School Board’s Count Me in Peel! 2016 workforce census, the key findings are highlighted in the following two sections: Organizational Demographics and Workforce Demographics. These data highlight the extent to which the Peel board is comprised of a very diverse workforce. This information will help to inform future system planning, so that the needs of the Peel board’s workforce can be better served in the future.
Organizational Demographics Who took part in the workforce census? What positions do they hold?
66.3% of permanent full-time and permanent part-time employees participated in the workforce census.
69.6% of respondents were elementary and secondary teachers. Another 12.4% of respondents were educational resource facilitators (e.g., Designated Early Childhood Educator, Teaching Assistant, Behaviour Teaching Assistant).
Participation rates among employee groups varied. For example, 100% of Senior Administrators and 98% of School Principals completed the workforce census, while 27% of CUPE Local 2544 (e.g., custodian, maintenance worker, food services staff) participated.
15.2% of respondents hold a position of responsibility, and 13.5% are currently in an acting position. Of respondents who self-identify as female, 13.5% have a position of responsibility, compared with 21.0% of respondents who self-identify as male.
Where do employees work? What is their primary work schedule and employment status? 90.1% of respondents work in either an elementary or a secondary school (63.7% in an elementary school, 26.4% in
a secondary school).
The primary work schedule most frequently reported by respondents was days only (86.4%), followed by days and afternoons (8.7%).
81.2% of respondents are full-time employees, 4.0% are part-time employees, and 14.5% are casual, occasional, temporary or contract employees.
How long have employees worked at the Peel board? 73.0% of respondents have worked at the Peel board within the following range: between >1 year to 15 years. There
is a fairly even distribution among respondents for each of the following 5-year intervals of service with the board: >1 year – 5 years (22.5%), 6 – 10 years (24.5%), and 11 – 15 years (26.0%). After 15 years, there is a drop in reported length of employment: 16 – 20 years (13.7%), 21 – 25 years (4.5%), >25 years (8.8%).

32
Workforce Demographics Where were employees born? What is the age distribution of Peel board employees?
There were 148 different countries of birth reported by respondents. 85.2% of respondents were born in the following top five countries: (1) Canada (72.5%), (2) India (6.9%), (3) United Kingdom/Great Britain (2.7%), (4) Jamaica (2.0%), and (5) Pakistan (1.1%).
One-third of respondents fall into the 35 – 44 years age range (33.9%). Within the 35 – 49 years age range, this percentage increases to half (49.1%) of the respondents.
When do employees plan to retire? 1,216 employees (12.2% of respondents) indicated an intention to retire within the next 5 years. This number
increases to 2,433 employees (24.4% of respondents) who indicated an intention to retire in the next 10 years. In the next 5 years, 55.2% of Senior Administrators, 32.8% of School Principals who responded, and 25.3% of CUPE Local 1628 (e.g., secretarial/clerical staff, library technician) who responded plan to retire. A large group of respondents (18.6%) do not know when they will retire or are undecided.
Where do employees live? What are the most common conditions or disabilities reported by employees? 58.9% of respondents indicated that they live in the Region of Peel.
706 respondents (7.0%) indicated that they are a person with a condition or disability. The top three reported conditions or disabilities included: (1) chronic medical condition, (2) mental health, and (3) physical, functional, and/or mobility.
What type of education do employees possess and where were they educated? 82.0% of respondents indicated that they possess a Bachelor’s degree (includes respondents with a Bachelor’s
degree, certificate or diploma above Bachelor level, Master’s degree, and Doctorate). 23.0% of respondents hold a graduate degree (e.g., Master’s degree, Doctorate), while 12.5% possess a college certificate or diploma.
77.8% of respondents indicated that they completed their highest level of education in Canada.
How do employees self-identify? 79.9% of respondents indicated female as their gender identity. The results reveal a wide range of female
representation among the various employee groups. For example, 98.9% of respondents from CUPE Local 1628 (e.g., secretarial/clerical staff, library technician) self-identify as female, compared with 28.6% of OPSEU Local 292 (e.g., LTSS, media staff). There are also higher percentages of respondents who self-identify as female among

33
Educational Resource Facilitators (e.g., Designated Early Childhood Educators, Teaching Assistants, and Behaviour Teaching Assistants) (94.5%), OPSEU Local 283 (e.g., adult ESL/LBS instructors) (91.8%), elementary teachers (85.0%), and school administrators (principals/vice-principals) (71.7%). There is a fairly even split between representation of gender identity among senior administrators (e.g., director, superintendent, controller) with 48.4% who self-identify as female and 51.6% who self-identify as male.
Of the respondents who indicated the sexual orientation(s) with which they identify, the most frequent response was heterosexual (88.3%), while another 4.8% identify as LGBTQ+ (i.e., lesbian, gay, bisexual, transgender, queer, questioning, two-spirited). Overall, there was a high percentage of respondents who chose not to answer this question (15.8%) or skipped this question (3.4%).
Three-quarters of respondents (74.5%) reported that they do not self-identify as a member of a racialized community. Overall, 14.8% of respondents either skipped this question or chose not to answer this question.
1.4% of respondents self-identify as First Nations, Métis or Inuit. Overall, 10.4% of respondents either skipped this question or chose not to answer this question.
The top five racial identities most commonly reported by respondents were: (1) White (67.2%), (2) South Asian-East Indian (15.9%), Black (7.1%), (4) Chinese (2.6%), and (5) North African or Arab (1.2%). Based on the open-ended responses, Mixed racial identity was added as a new category.
The top five most commonly reported regions from which respondents indicated origins of ethnicity and ethnocultural practices include: (1) Canada, (2) Canada and Europe, (3) Asia, (4) Europe, and (5) Canada and Asia.
Of the respondents who indicated any religion or spirituality with which they identify, Christianity was the most commonly reported (62.2%). This was followed in frequency by: (2) I do not have a religion or spirituality (16.8%), (3) Hinduism (5.6%), (4) Sikhism (5.0%), and (5) Islam (3.9%). Based on the open-ended responses, three additional categories were added: atheism, agnostic, and spiritual (non-religious). Overall, 15.2% of respondents either skipped this question or chose not to answer this question.
What languages do employees speak? There were 117 different languages in which respondents reported they were able to communicate fluently. The top
10 most frequently reported languages included: (1) English (92.0%), (2) French (14.6%), (3) Hindi (8.3%), (4) Punjabi (7.5%), (5) Urdu (4.6%), (6) Italian (3.9%), (7) Spanish (2.8%), (8) Portuguese (2.0%), (9) German (1.7%), and (10) Polish (1.4%). 41.8% of respondents communicate fluently in more than one language.

34
LIMITATIONS
As the Count Me in Peel! 2016 Workforce Census was not completed by 100% of Peel board employees, there may be gaps in the data which might not provide a complete picture of our employees. Due to the low response rate by casual employees (2.9%), these data were not included in the analyses. As a result, we were not able to capture the true picture of casual employees in our school board. Although certain patterns or trends in the data have been highlighted, a number of questions also have high rates of missing or choose not to answer responses (i.e., >10%). These include questions about: (1) sexual orientation, (2) self-identification as a member of a racialized community, (3) self-identification as First Nations, Métis, or Inuit in North America, and (4) identification with any religion or spirituality. For these questions, results may not be representative of these categories. Whenever possible, suitable comparisons were made to other data (e.g., Peel board students, Elementary Teachers’ Federation of Ontario). However, since most of the comparable 2016 Statistics Canada Census data have not been released yet, we did not want to compare our results to older 2011 Census data. Finally, we did not compare our data with workforce census data from the Ottawa-Carlton District School Board as their demographics are totally different from demographics in the Greater Toronto Area.
35
REFERENCES
Peel District School Board (2013, January 22). The Journey Ahead: Our Action Plan for Equitable Hiring and Promotion in Peel. Mississauga, ON: Peel District School Board. Retrieved from the Peel District School Board website: http://www.peelschools.org/documents/action%20plan%20-%20jan%2022.pdf Turner Consulting Group (2013, January 22). Research report: Hiring and promotion at the Peel District School Board. Retrieved from the Peel District School Board website: http://www.peelschools.org/aboutus/equity/Documents/Final%20Report%20-%20Jan%2022.pdf TWI Inc. (2011a). Together – We Count for student success 2010 OCDSB workforce census. Retrieved from the Ottawa-Carlton District School Board website: http://www.ocdsb.ca/calendar/AGENDA%20DOCS/2011%20DOCS/April%202011%20Meetings/SPPC%20April%206%202011/14%20Report%2011-068%202010%20Workforce%20Census.pdf TWI Inc. (2011b). City of Hamilton “Include Me!” workforce census report. Retrieved from the City of Hamilton website: http://www2.hamilton.ca/NR/rdonlyres/9A51D869-A26C-444E-B389- 9E3327475468/0/Oct11EDRMS_n221403_v1_7_4__HUR11012_Workforce_Census_Report_Oc.pdf
Icons used in this report provided by: www.flaticon.com