Embed Size (px)
Citation preview

COUNT DATA ANALYSIS USING POISSON REGRESSION
AND HANDLING OF OVERDISPERSION
RAIHANA BINTI ZAINORDIN
UNIVERSITI TEKNOLOGI MALAYSIA
COUNT DATA ANALYSIS USING POISSON REGRESSION AND HANDLING OF OVERDISPERSION
RAIHANA BINTI ZAINORDIN
A dissertation submitted in partial fulfillment of the requirements for the award of the degree of
Master of Science (Mathematics)
Faculty of Science Universiti Teknologi Malaysia
NOVEMBER 2009

iii
To Mak and Abah
because I could not have made it without you both.
And to sunflower
because life should be meaningful.

iv
ACKNOWLEDGEMENT
First and foremost, all praise be to Allah, the Almighty, the Benevolent for His
blessings and guidance for giving me the inspiration to embark on this project and
instilling in me the strength to see that this thesis becomes a reality.
I would like to say a big thank you to my amazing supervisor, P.M. Dr. Robiah
binti Adnan for believing in me to finish up this dissertation. Her advice, encouragement
and help mean a lot to me. So I can never thank her enough.
I would also like to thank my friend Ehsan who is never tired of helping and
teaching me things that I do not know.
As always, I am forever grateful to my parents for all their love and sacrifice. To
my sisters (Nordiana, Noraiman Amalina, Nurul Aina), thanks for giving me the reason
to laugh and cry.
A heartfelt thanks goes to all my friends who are always willing to help and
support me. And finally to my best friend, Ikhwan, thank you so much for being there.
v
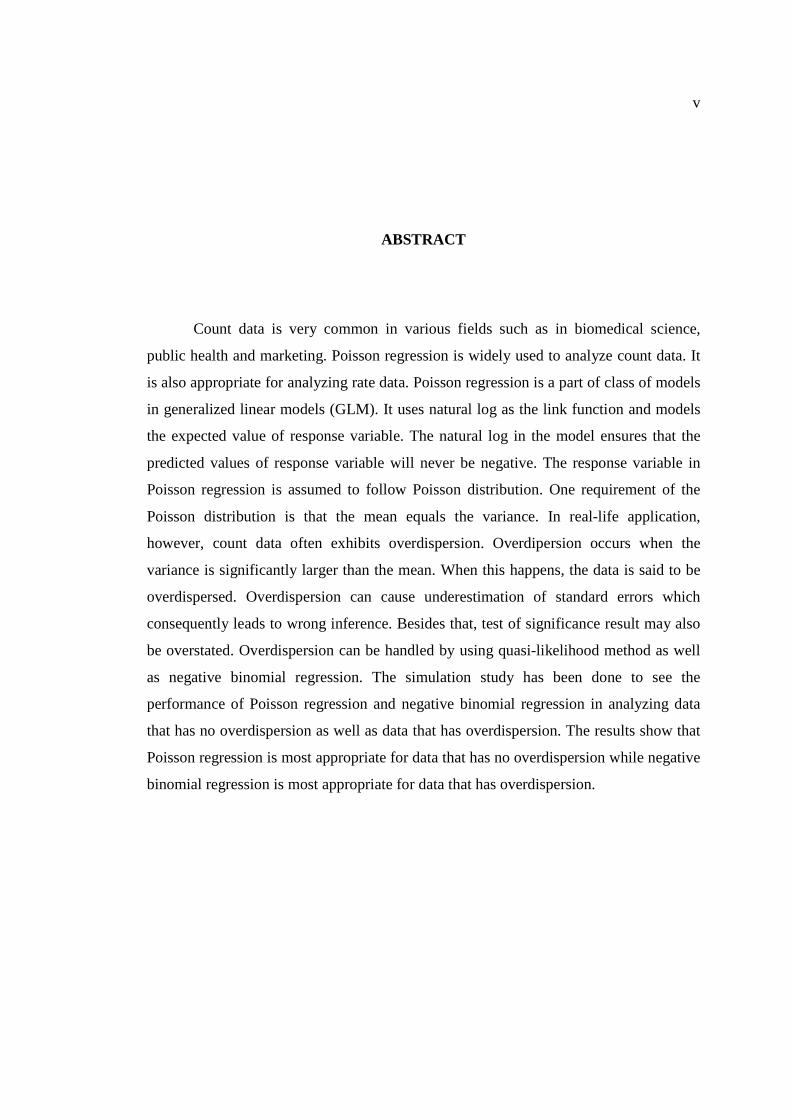
ABSTRACT
Count data is very common in various fields such as in biomedical science,
public health and marketing. Poisson regression is widely used to analyze count data. It
is also appropriate for analyzing rate data. Poisson regression is a part of class of models
in generalized linear models (GLM). It uses natural log as the link function and models
the expected value of response variable. The natural log in the model ensures that the
predicted values of response variable will never be negative. The response variable in
Poisson regression is assumed to follow Poisson distribution. One requirement of the
Poisson distribution is that the mean equals the variance. In real-life application,
however, count data often exhibits overdispersion. Overdipersion occurs when the
variance is significantly larger than the mean. When this happens, the data is said to be
overdispersed. Overdispersion can cause underestimation of standard errors which
consequently leads to wrong inference. Besides that, test of significance result may also
be overstated. Overdispersion can be handled by using quasi-likelihood method as well
as negative binomial regression. The simulation study has been done to see the
performance of Poisson regression and negative binomial regression in analyzing data
that has no overdispersion as well as data that has overdispersion. The results show that
Poisson regression is most appropriate for data that has no overdispersion while negative
binomial regression is most appropriate for data that has overdispersion.

vi
ABSTRAK
Data bilangan adalah sangat lazim dalam pelbagai bidang, contohnya bidang
sains bioperubatan, kesihatan awam dan bidang pemasaran. Regresi Poisson digunakan
secara meluas untuk menganalisis data bilangan. Regresi Poisson juga sesuai untuk
menganalisis data kadaran. Regresi Poisson merupakan sebahagian daripada model kelas
model linear teritlak. Regresi ini menggunakan logaritma asli sebagai fungsi hubungan.
Regresi ini memodelkan nilai jangkaan bagi pembolehubah maklum balas. Logaritma
asli digunakan untuk memastikan supaya nilai ramalan bagi pembolehubah maklumbalas
tidak akan berbentuk negatif. Pembolehubah maklumbalas dalam regresi Poisson
dianggap mengikut taburan Poisson. Salah satu ciri taburan Poisson ialah nilai min
pembolehubah adalah sama dengan nilai varians. Walaubagaimanapun, dalam aplikasi
sebenar, data bilangan sering mempamerkan masalah lebih serakan. Masalah lebih
serakan terjadi apabila nilai varians melebihi nilai min. Apabila ini terjadi, sesebuah data
itu dikatakan terlebih serak. Masalah lebih serakan boleh menyebabkan kurang anggaran
terhadap sisihan piawai yang kemudiannya memberi inferens yang salah. Selain
daripada itu, keputusan ujian signifikan pula akan terlebih anggar. Masalah lebih serakan
boleh diatasi dengan menggunakan kaedah kebolehjadian quasi dan juga regresi
binomial negatif. Kajian simulasi telah dibuat untuk melihat keputusan regresi Poisson
dan regresi binomial negatif dalam menganalisis data yang tidak mempunyai masalah
lebih serakan dan juga data yang mempunyai masalah lebih serakan. Keputusan
menunjukkan bahawa regresi Poisson adalah paling sesuai untuk data yang tidak
mempunyai masalah lebih serakan manakala regresi binomial negatif adalah paling
sesuai untuk data yang mempunyai masalah lebih serakan.

vii
TABLE OF CONTENTS
CHAPTER TITLE PAGE
COVER i
DECLARATION ii
DEDICATION iii
ACKNOWLEDGEMENTS iv
ABSTRACT v
ABSTRAK vi
TABLE OF CONTENTS vii
LIST OF TABLES xi
LIST OF FIGURES xii
LIST OF SYMBOLS xiv
LIST OF APPENDICES xv
1 INTRODUCTION 1
1.1 Count Data 1
1.2 Statement of the Problem 3
1.3 Objectives of the Study 4
1.4 Scope of the Study 4
1.5 Significance of the Study 4
1.6 Outline of the Study 5
1.7 Analysis Flow Chart 7
2 LITERATURE REVIEW 8
2.1 Generalized Linear Models 8
viii
2.1.1 Random component 8
2.1.2 Systematic component 9
2.1.3 Link 9
2.2 Principles of Statistical Modelling 10
2.2.1 Exploratory Data Analysis 10
2.2.2 Model Fitting 10
2.3 Poisson Distribution 12
2.4 Poisson Regression 14
2.5 Problems in Poisson Regression 16
2.5.1 Truncation and Censoring 16
2.5.2 Excess Zero 17
2.5.3 Overdispersion 19
2.6 Alternative Count Models 20
2.7 Negative Binomial Regression 21
3 POISSON REGRESSION ANALYSIS 23
3.1 The Model 23
3.2 Estimation of Parameters Using Maximum
Likelihood Estimation (MLE)
24
3.3 Standard Errors for Regression Coefficients 31
3.4 Interpretation of Coefficients 31
3.5 Elasticity 34
3.6 Model Checking Using Pearson Chi-Squares
and Deviance
35
3.6.1 Pearson Chi-Squares 36
3.6.2 Deviance 36
3.7 Model Residuals 37
3.8 Inference 38
3.8.1 Test of Significance 38
3.8.2 Confidence Intervals 39
ix
3.9 Handling Overdispersion 39
3.9.1 Quasi-Likelihood Method 39
3.9.1.1 Estimating the Overdispersion
Parameter
43
3.9.1.2 Testing for Overdispersion 44
3.9.2 Negative Binomial Regression Analysis 45
3.10 Example 46
4 ANALYSIS OF POISSON REGRESSION USING
SAS
58
4.1 Introduction 58
4.2 Nursing Home Data 58
4.3 Choosing the Right Model 65
4.4 Results and Discussion 67
4.5 Negative Binomial Regression 76
4.6 Results and Discussion 77
5 SIMULATION STUDY 85
5.1 Data Simulation 85
5.2 Analysis of Data with No Overdispersion 86
5.2.1 Results and Discussion 93
5.2.1.1 Goodness-of-fit 93
5.2.1.2 Significance, Confidence
Intervals, and Standard Errors
94
5.3 Analysis of Data with Overdispersion 94
5.3.1 Results and Discussion 101
5.3.1.1 Goodness-of-fit 101
5.3.1.2 Significance, Confidence
Intervals, and Standard Errors
102
5.4 Conclusions 103
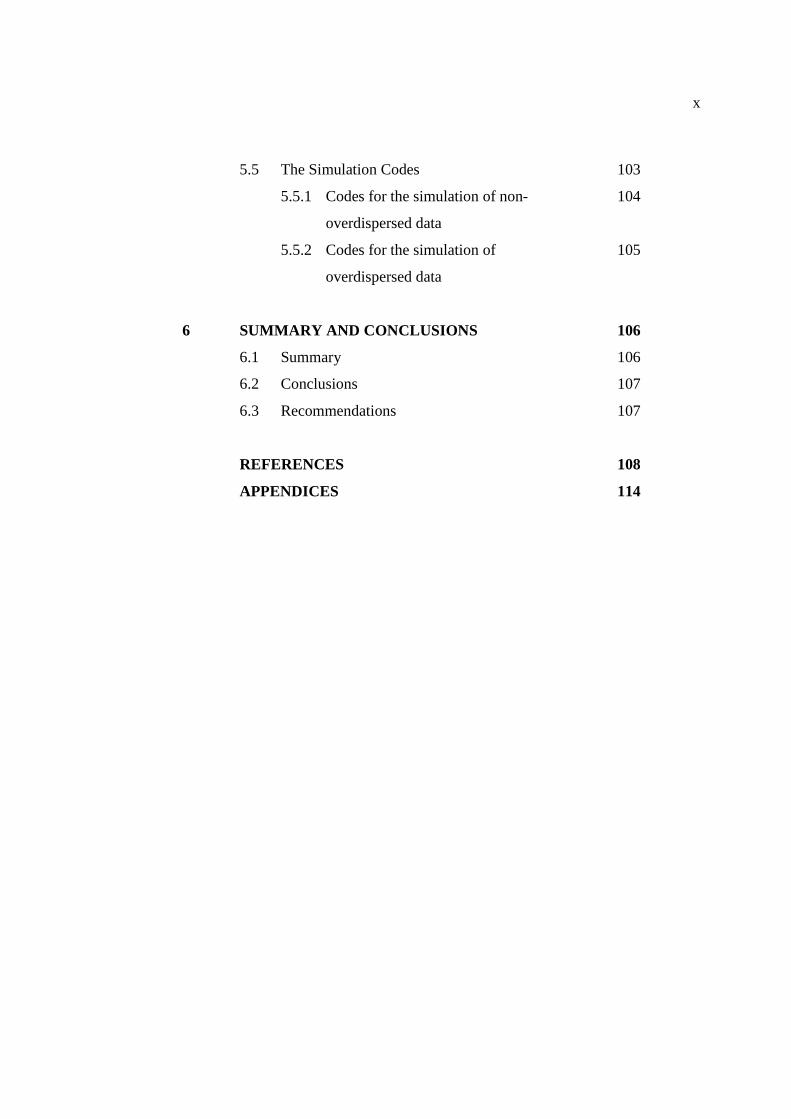
x
5.5 The Simulation Codes 103
5.5.1 Codes for the simulation of non-
overdispersed data
104
5.5.2 Codes for the simulation of
overdispersed data
105
6 SUMMARY AND CONCLUSIONS 106
6.1 Summary 106
6.2 Conclusions 107
6.3 Recommendations 107
REFERENCES 108
APPENDICES 114
xi
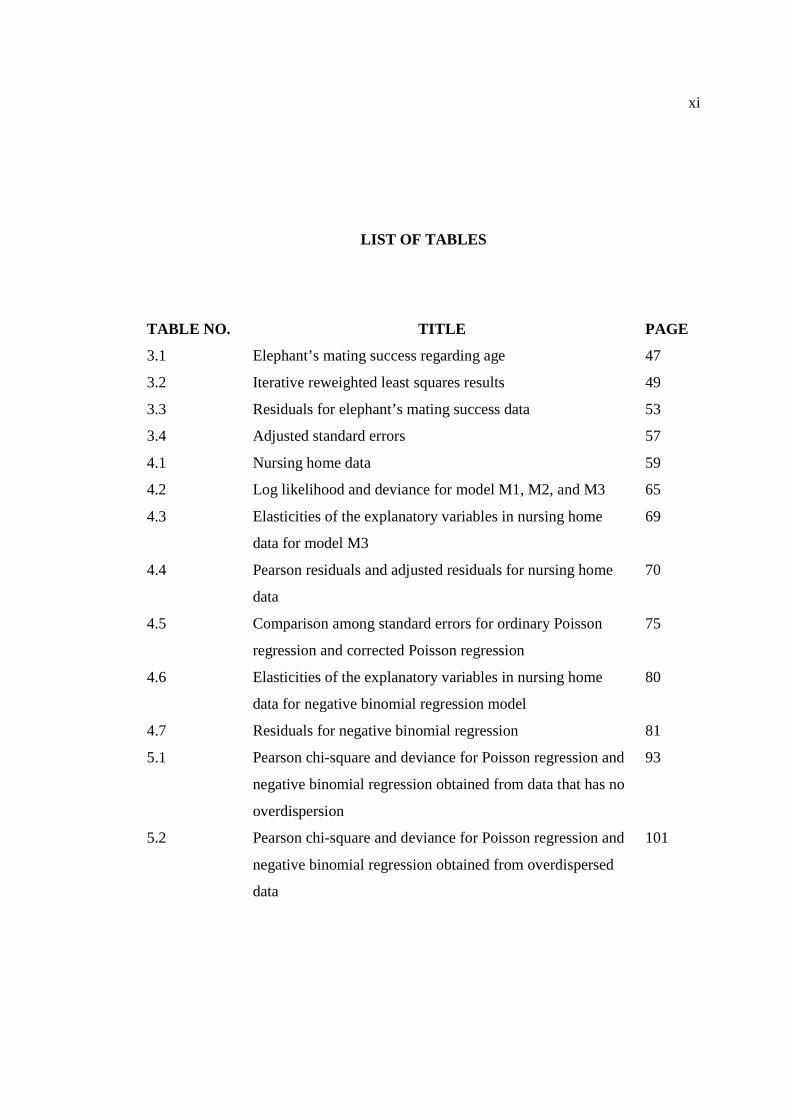
LIST OF TABLES
TABLE NO. TITLE PAGE
3.1 Elephant’s mating success regarding age 47
3.2 Iterative reweighted least squares results 49
3.3 Residuals for elephant’s mating success data 53
3.4 Adjusted standard errors 57
4.1 Nursing home data 59
4.2 Log likelihood and deviance for model M1, M2, and M3 65
4.3 Elasticities of the explanatory variables in nursing home
data for model M3
69
4.4 Pearson residuals and adjusted residuals for nursing home
data
70
4.5 Comparison among standard errors for ordinary Poisson
regression and corrected Poisson regression
75
4.6 Elasticities of the explanatory variables in nursing home
data for negative binomial regression model
80
4.7 Residuals for negative binomial regression 81
5.1 Pearson chi-square and deviance for Poisson regression and
negative binomial regression obtained from data that has no
overdispersion
93
5.2 Pearson chi-square and deviance for Poisson regression and
negative binomial regression obtained from overdispersed
data
101
xii
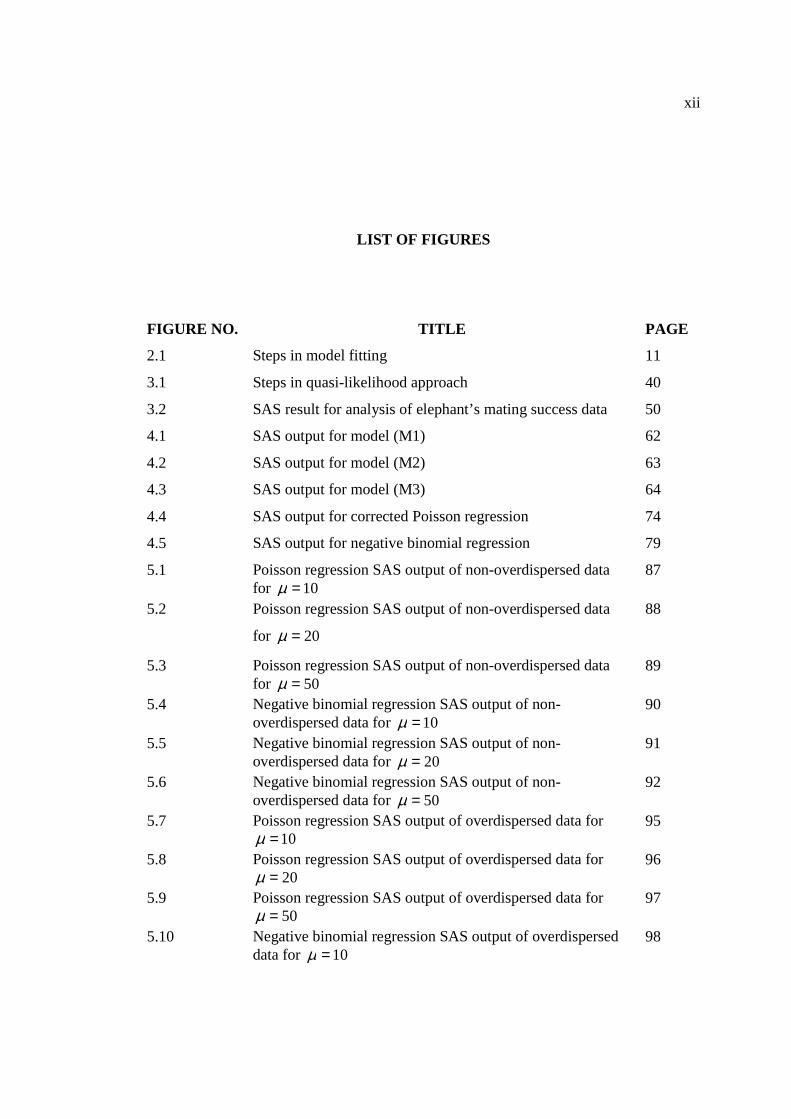
LIST OF FIGURES
FIGURE NO. TITLE PAGE
2.1 Steps in model fitting 11
3.1 Steps in quasi-likelihood approach 40
3.2 SAS result for analysis of elephant’s mating success data 50
4.1 SAS output for model (M1) 62
4.2 SAS output for model (M2) 63
4.3 SAS output for model (M3) 64
4.4 SAS output for corrected Poisson regression 74
4.5 SAS output for negative binomial regression 79
5.1 Poisson regression SAS output of non-overdispersed data for 10=µ
87
5.2 Poisson regression SAS output of non-overdispersed data
for 20=µ
88
5.3 Poisson regression SAS output of non-overdispersed data for 50=µ
89
5.4 Negative binomial regression SAS output of non-overdispersed data for 10=µ
90
5.5 Negative binomial regression SAS output of non-overdispersed data for 20=µ
91
5.6 Negative binomial regression SAS output of non-overdispersed data for 50=µ
92
5.7 Poisson regression SAS output of overdispersed data for 10=µ
95
5.8 Poisson regression SAS output of overdispersed data for 20=µ
96
5.9 Poisson regression SAS output of overdispersed data for 50=µ
97
5.10 Negative binomial regression SAS output of overdispersed data for 10=µ
98

xiii
5.11 Negative binomial regression SAS output of overdispersed data for 20=µ
99
5.12 Negative binomial regression SAS output of overdispersed data for 50=µ
100

xiv
LIST OF SYMBOLS
Y Response variable
X Predictor variable
β Regression coefficient
η Link Function
I Information matrix
U Score fuction
W Weight matrix
E Elasticity
2X Pearson chi-squares statistic
D Deviance statistic
R Pearson residual
Z Wald statistic
φ Dispersion parameter
xv
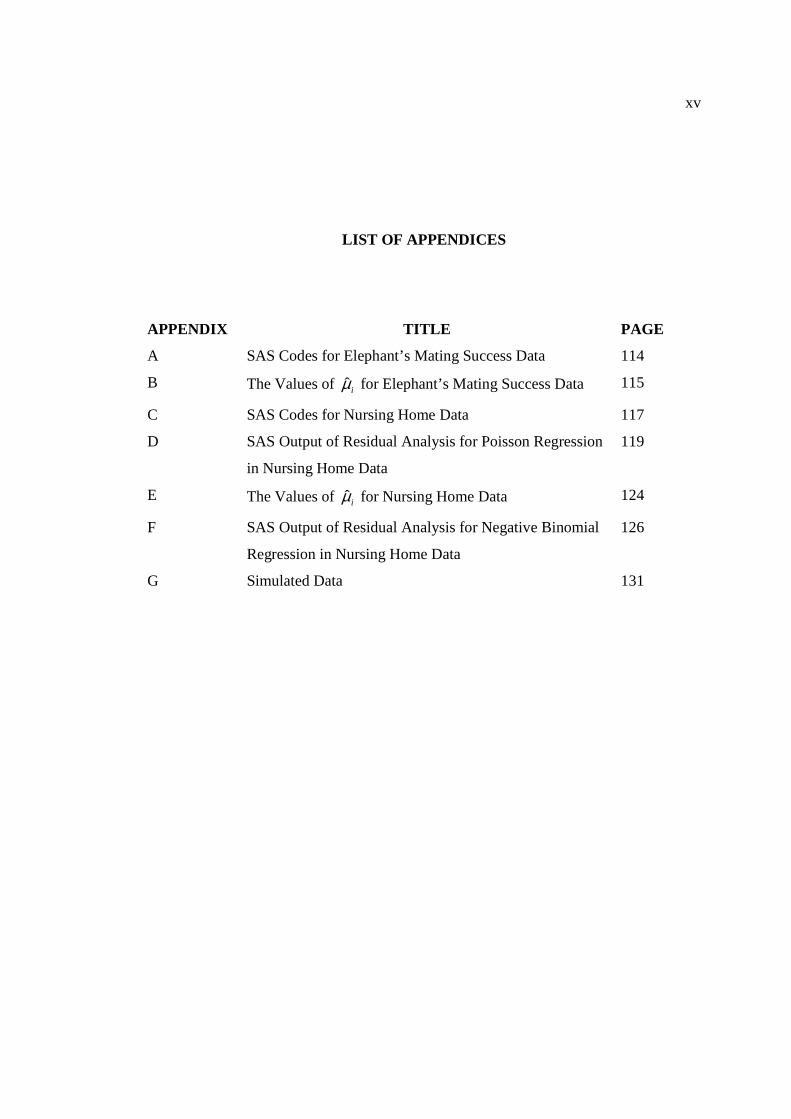
LIST OF APPENDICES
APPENDIX TITLE PAGE
A SAS Codes for Elephant’s Mating Success Data 114
B The Values of iµ̂ for Elephant’s Mating Success Data 115
C SAS Codes for Nursing Home Data 117
D SAS Output of Residual Analysis for Poisson Regression
in Nursing Home Data
119
E The Values of iµ̂ for Nursing Home Data 124
F SAS Output of Residual Analysis for Negative Binomial
Regression in Nursing Home Data
126
G Simulated Data 131
CHAPTER 1
INTRODUCTION
1.1 Count Data
An event count refers to the number of times an event occurs, for example the
number of individuals arriving at a serving station (e.g.: bank teller, gas station, cash
register, etc.) within a fixed interval, the number of failures of electronic components per
unit of time, the number of homicides per year, or the number of patents applied for and
received. In many fields such as in social, behavioral and biomedical sciences, as well as
in public health, marketing, education, biological and agricultural sciences and industrial
quality control, the response variable of interest is often measured as a nonnegative
integer or count.
Significant early developments in count models, however, took place in actuarial
science, biostatistics, and demography. In recent years these models have also been used
extensively in economics, political science, and sociology. The special features of data
in their respective fields of application have fueled developments that have enlarged the
scope of these models. An important milestone in the development of count data
regression model was the emergence of the generalized linear models, of which the
Poisson regression is a special case.
2
In another case, an event may be thought of as the realization of a point process
governed by some specified rate of occurrence of the event. The number of events may
be characterized as the total number of such realizations over some unit of time. The
dual of the event count is the inter-arrival time, defined as the length of the period
between events. Count data regression is useful in studying the occurrence rate per unit
of time.
The approach taken to the analysis of count data sometimes depends on how the
counts are assumed to arise. Count data can arise from two common ways:
i) Counts arise from a direct observation of a point process.
ii) Counts arise from discretization of continuous latent data.
In the first case, examples are the number of telephone calls arriving at central
telephone exchange, the number of monthly absences at workplace, the number of
airline accidents, the number of hospital admissions, and so forth. The data may also
consist of inter-arrival times for events.
In the second case, consider the following example. Credit rating of agencies
may be stated as AAA, AAB, AA, A, BBB, B, and so forth, where AAA indicates the
greatest credit. Suppose one codes these as my ,...,1,0= . These are pseudocounts that
can be analyzed using a count regression. But one may also regard this as an ordinal
ranking that can be modeled using a suitable latent variable model such as ordered
probit.
Typically, the characteristic of count data is that the counts occur over some
fixed area or observation period and that the things that people count are often rare.
Count data, even though numeric, can create some problems if it is analyzed using the
regular linear regression because of the limited range of most of the values and because
only nonnegative integer values can occur. Thus, count data can potentially result in a
highly skewed distribution, one that cut off at zero. Therefore, it is often unreasonable to
3
assume that the response variable and the resulting errors have a normal distribution,
making linear regression a less appropriate option for analysis. A suitable way to deal
with count data is to use Poisson distribution and log link function in the analysis. The
regression model that uses these kinds of options is called Poisson regression or Poisson
log-linear regression model.
Basically, the most popular methods to model count data are Poisson and
negative binomial regression models. But Poisson regression is the more popular of the
two and is applied to various fields.
1.2 Statement of the Problem
Count data often have variance exceeding the mean. In other words, count data
usually shows greater variability in the response counts than one would expect if the
response distribution truly were Poisson. This violates the Poisson regression
assumption which strictly states that the mean is equal to the variance (equidispersion).
The phenomenon where the variance is greater than the mean is called overdispersion. A
statistical test of overdispersion is highly desirable after running a Poisson regression.
Ignoring overdispersion in the analysis would lead to underestimation of standard errors
and consequent of significance in hypothesis testing. The overdispersion must be
accounted for by the analysis methods appropriate to the data. Poisson regression is not
adequate for analyzing overdispersed data. Therefore, to overcome overdispersion,
quasi-likelihood method will be used as well as negative binomial regression. Negative
binomial regression is more adequate for overdispersed data. This is because negative
binomial regression allows for overdispersion since its variance is naturally greater than
its mean.
4
1.3 Objectives of the Study The objectives of this study are:
i) To study the analysis of Poisson regression.
ii) To illustrate Poisson regression by analyzing count data manually and by using
SAS 9.1.
iii) To demonstrate how to handle overdispersion in Poisson regression using quasi
likelihood approach as well as negative binomial regression approach.
iv) To see the performance of Poisson regression and the performance of negative
binomial regression in analyzing data that has no overdispersion as well as data
that has overdispersion from simulation study.
1.4 Scope of the Study
This study will focus on the analysis of Poisson regression. This study will also
focus on the overdispersion problem that exists when dealing with real life count data.
Overdispersion happens when the variance is greater than the mean which violates the
equidispersion property in Poisson distribution and thus need to be taken care of. In
accordance to overdispersion problem, the performance of Poisson regression and
negative binomial regression in analyzing data that has no overdispersion as well as data
that has overdispersion will be examined from simulation study. The analyses in this
study include manual analysis and analysis by using statistical package. Statistical
package that is used in this study is SAS 9.1.
1.5 Significance of the Study
This study will help the scientists to realize the use of Poisson regression in
analyzing count data. Besides focusing on parameter estimation, this study will also help
5
to highlight about the interpretation of coefficients. This study will also help to
overcome overdispersion problem that occurs in Poisson regression which, if ignored,
may cause underestimation of standard errors and which consequently gives misleading
inference about the regression parameters. Clearly, this study is imperative and will give
much benefit.
1.6 Outline of the Study This dissertation consists of 6 chapters.
Chapter 1 gives rough idea about the study. It begins with the explanation on
count data. This includes the characteristic of count data which is very important
throughout the study. Chapter 1 also explains how the idea about the study came about.
Furthermore, it also explains about the purpose of the study, the scope and the
importance of the study.
Chapter 2 discusses the basic idea that is important in Poisson regression
analysis. This chapter also discusses about common problems in Poisson regression as
well as negative binomial regression other than previous studies done by previous
researchers.
Poisson regression analysis can be found in Chapter 3. This chapter gives clear
descriptions on formulation of Poisson regression model, manual computation of
maximum likelihood estimates, and how to interpret coefficients in Poisson regression.
It also includes other important analyses such as goodness of fit test, residual analysis
and inference. Other than that, this chapter also discusses about the methods to handle
overdispersion. To illustrate Poisson regression, an example is presented here. The
analysis of this example is done manually.
6
Chapter 4 deals with the analysis of Poisson regression using SAS 9.1. A bigger
data is used and more factors are considered. The data is a count data in the form of rate
and it involves overdispersion. SAS codes are provided for convenience.
Chapter 5 presents the simulation study. Data is simulated using R 2.9.2 software
and is analyzed by using SAS 9.1. The performance of Poisson regression and the
performance of negative binomial regression in analyzing data that has no
overdispersion as well as data that has overdispersion are presented in this chapter.
Lastly, the conclusions of the study are discussed in Chapter 6. This chapter
summarizes the whole study. Some recommendations for further research are also made
here.
7
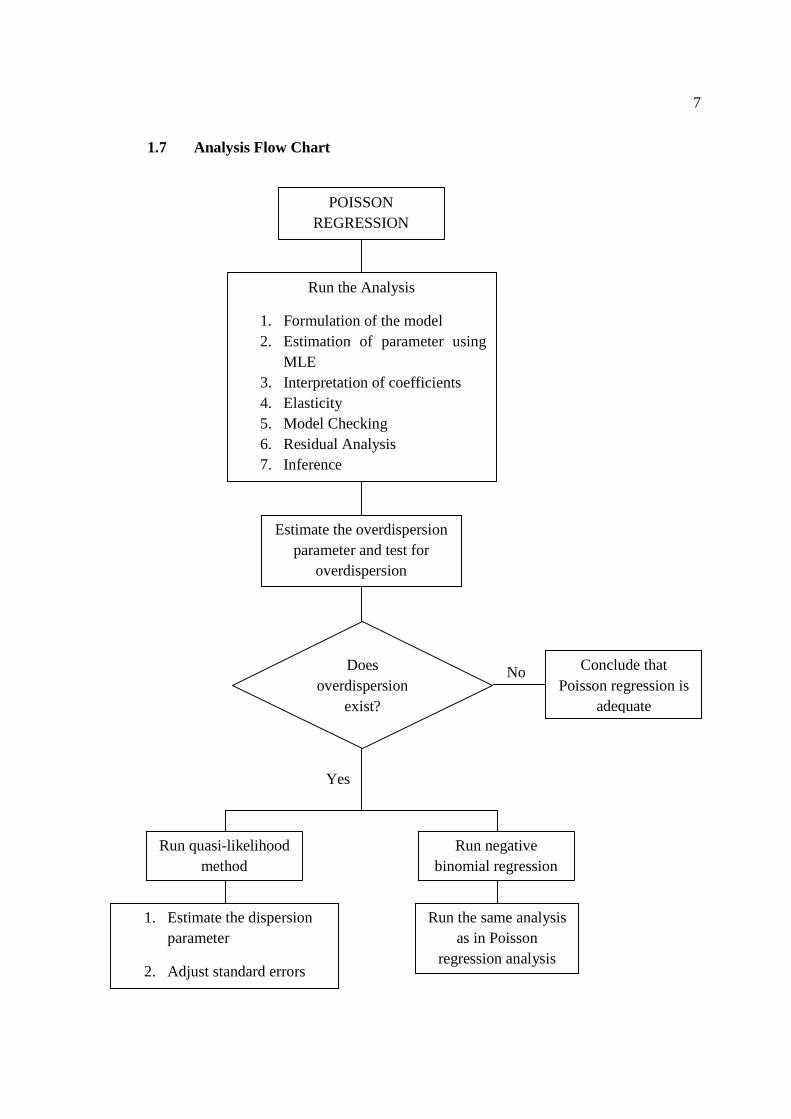
1.7 Analysis Flow Chart
No
Yes
Estimate the overdispersion parameter and test for
overdispersion
Run the Analysis
1. Formulation of the model 2. Estimation of parameter using
MLE 3. Interpretation of coefficients 4. Elasticity 5. Model Checking 6. Residual Analysis 7. Inference
POISSON REGRESSION
Does overdispersion
exist?
Run quasi-likelihood method
Run negative binomial regression
Conclude that Poisson regression is
adequate
1. Estimate the dispersion parameter
2. Adjust standard errors
Run the same analysis as in Poisson
regression analysis
108
REFERENCES
Agresti, A. 1996. An Intorduction to Categorical Data Analysis. New York: John Wiley
& Sons, Inc.
Atkins, D. C. and Gallop, R. J. 2007. Rethinking How Family Researchers Model
Infrequent Outcomes: A Tutorial on Count Regression and Zero-Inflated Models.
Journal of Family Psychology. Vol. 21, No. 4: 726 – 735.
Bailer, A. J., Reed, L. D., and Stayner, L. T. 1997. Modeling Fatal Injury Rates Using
Poisson Regression: A Case Study of Workers in Agriculture, Forestry, and
Fishing. Journal of Safety Research. 28(3): 177 – 186.
Cameron, A. C. and Trivedi, P. K. 1998. Regression Analysis of Count Data.
Cambridge, UK: Cambridge University Press.
Carrivick, P. J. W., Lee, A. H., and Yau, K. K. W. 2003. Zero-Inflated Poisson
Modeling to Evaluate Occupational Safety Interventions. Safety Science. 41: 53 –
63.
Chan, Y.H. 2005. Log-linear Models: Poisson Regression. Singapore Med. J. 46(8): 377
– 386.
109
Choi, Y., Ahn, H., and Chen, J. J. 2005. Regression Trees for Analysis of Count Data
with Extra Poisson Variation. Computational Statistics & Data Analysis. 49: 893
– 915.
Dietz, E. and Bohning, D. 2000. On Estimation of the Poisson Parameter in Zero
Modified Poisson Models. Computational Statistics & Data Analysis. 34: 441 –
459.
Dobson, A.J. 2002. An Introduction to Generalized Linear Models. 2nd Edition. New
York: Chapman & Hall.
Dossou-Gbete, S. and Mizere, D. 2006. An Overview of Probability Models Statistical
Modelling of Count Data. Monografias del Seminario Matematico Garcia de
Galdeano. 33: 237 – 244.
Famoye, F. and Wang, W. Censored Generalized Poisson Regression Model.
Computational Statistics & Data Analysis. 46: 547 – 560.
Fleiss, J.L., Levin, B. and Paik, M.C. 2003. Statistical Methods for Rates and
Proportions. 3rd Edition. New York: John Wiley & Sons, Inc.
Frome, E.L. 1986. Regression Method for Binomial and Poisson Distributed Data. The
American Institute of Physics, New York. 1 – 40.
110
Guangyong, Z. 2003. A modified Poisson Regression Approach to Prospective Studies
with Binary Data. American Journal of Epidemiology. Vol. 159, No.7: 702 –
706.
Guo, J. Q. and Li, T. 2002. Poisson Regression Models with Errors-in-Variables:
Implication and Treatment. Journal of Statistical Planning and Inference. 104:
391 – 401.
Heinzl, H. and Mittlbock, M. 2003. Pseudo R-squared Measures for Poisson Regression
Models with Over- or Underdispersion. Computational Statistics & Data
Analysis. 44: 253 – 271.
Ismail, N. and Jemain, A.A. 2005. Generalized Poisson Regression: An Alternative For
Risk Classification. Jurnal Teknologi. 43(C): 39 – 54.
Jahn-Eimermacher, A. 2008. Comparison of the Andersen – Gill Model with Poisson
and Negative Binomial Regression on Recurrent Event Data. Computational
Statistics & Data Analysis. 52: 4959 – 4997.
Jovanovic, B. D. and Hosmer, D. W. 1997. A Simulation of the Performance of Cp in
Model Selection for Logistic and Poisson Regression. Computational Statistics
& Data Analysis. 23: 373 – 379.
Kleinbaum, D.G., Kupper, L.L., Muller, K.E., and Nizam, A. 1998. Applied Regression
Analysis and Other Multivariable Methods. 3rd Edition. USA: Duxbury Press.
111
Kohler, M. and Krzyzak, A. 2007. Asymptotic Confidence Intervals for Poisson
Regression. Journal of Multivariate Analysis. 98: 1072 – 1094.
Kokonendji, C.C., Demetrio, C,G,B, and Dossou-Gbete, S. 2004. Overdispersion and
Poisson-Tweedie Exponential Dispersion Models. Monografias del Seminario
Matematico Garcia de Galdeano. 31: 365 – 374.
Kutner, M.H., Nachtsheim, C.J., and Neter, J. 2004. Applied Linear Regression Models.
Fourth Edition. New York: McGraw-Hill.
Lee, J, Nam, D., and Park, D. 2005. Analyzing the Relationship Between Grade
Crossing Elements and Accidents. Journal of Eastern Asia Society for
Transportation Study. Vol. 6: 3658 – 3668.
Lee, Y., Nelder, J.A., Pawitan, Y. 2006.Generalized Linear Models with Random
Effects, Unified Analysis via H-likelihood. USA: Chapman & Hall.
Liu, J. and Dey, D. K. 2007. Hierarchical overdispersed Poisson Model with Macrolevel
Autocorrelation. Statistical Methodology. 4: 354 – 370.
Lord, D., Washington, S. P., and Ivan, J. N. 2005. Poisson, Poisson-Gamma and Zero-
Inflated Regression Models of Motor Vehicle Crashes: Balancing Statistical Fit
and Theory. Accident Analysis and Prevention. 37: 35 – 46.
112
Luceno, A. 1995. A Family of Partially Correlated Poisson Models for Overdispersion.
Computational Statistics & Data Analysis. 20: 511 – 520.
McCullagh, P. and J.A. Nelder. 1989. Generalized Linear Models. 2nd Edition. London:
Chapman & Hall.
Norliza binti Adnan (2006). Comparing Three Methods of Handling Multicollinearity
Using Simulation Approach. Master of Science (Mathematics). Universiti
Teknologi Malaysia, Skudai.
Osgood, D.W. 2000. Poisson-Based Regression Analysis of Aggregate Crime Rates.
Journal of Quantitative Criminology. Vol. 16, No. 1: 21 – 43.
Pedan, A. Analysis of Count Data Using the SAS System. Statistic, Data Analysis, and
Data Mining. Paper 247-26: 1 – 6.
Pradhan, N. C. and Leung, P.S. 2006. A Poisson and Negative Binomial Regression
Model of Sea Turtle Interactions in Hawaii’s Longline Fishery. Fisheries
Research. 78: 309 – 322.
Spinelli, J. J., Lockhart, R. A., and Stephens, M. A. 2002. Tests for the Response
Distribution in a Poisson Regression Model. Journal of Statistical Planning and
Inference. 108: 137 – 154.
113
Strien, A.V., Pannekoek, P., Hegemeijer, W. and Verstrael, T. 2000. A Loglinear
Poisson Regression Method to Analyse Bird Monitoring Data. Proceeding of the
International Conference and 13th Meeting of the European Bird Census Council.
33 – 39.
Tang, H, Hu, M, and Shi, Q. 2003. Accident Injury Analysis for Two-Lane Rural
Highways. Journal of Eastern Asia Society for Transportation Study. Vol. 5:
2340 – 2443.
Tsou, T. S. 2006. Robust Poisson Regression. Journal of Statistical Planning and
Inference. 136: 3173 – 3186.
Vacchino, M. N. 1999. Poisson Regression in Mapping Cancer Mortality.
Environmental Research Section A. 81: 1 – 17.
Wang, K., Lee, A. H., and Yau, K. K. W. and Carrivick, P. J. W. 2003. A Bivariate
Zero-Inflated Poisson Regression Model to Analyze Occupational Injuries.
Accident Analysis and Prevention. 35: 625 – 629.
Wang, Y., Smith, E. P., and Ye, K. 2006. Sequential Designs for a Poisson Regression
Model. Journal of Statistical Planning and Inference. 136: 3187 – 3202.


![[Modul 4] Soalan Ramalan SPM - · PDF fileSoalan Ramalan SPM Soalan Ramalan SPM Set 1/2007 Set 1/2007 2hb. Ogos, 2007, ... Modal 1 November 2006 45 000 Untung bersih tahun kewangan](https://img.pdfslide.us/doc/110x75/5a78afea7f8b9a852c8e7c81/modul-4-soalan-ramalan-spm-ramalan-spm-soalan-ramalan-spm-set-12007-set-12007.jpg)


![[Contoh] ramalan topikal bab 1 maths tahun 5 2012](https://img.pdfslide.us/doc/110x75/55c8c22dbb61eb557e8b45e4/contoh-ramalan-topikal-bab-1-maths-tahun-5-2012.jpg)