Embed Size (px)
Citation preview

Council Approved – February 26, 2015

Impact to the Average Residential Homeowner ......................................................................................................... 1
Decisions Made By Council Impacting the 2015 Budget ............................................................................................. 4 Property Tax Supported Budget: Increase of $12.6 Million or 2.5% .......................................................................... 6
Source of Operating Revenues ......................................................................................................................... 6 How Operating Dollars Are Spent By Service Program .................................................................................... 7 How Operating Dollars Are Spent By Expenditure Type .................................................................................. 7 Net Property Tax Budget .................................................................................................................................. 8 2015 Net Budget Pressures .............................................................................................................................. 9 User Fees ........................................................................................................................................................ 10 Capital Budget Overview: 2015 Capital & 2016-2024 Capital Plan ................................................................ 11 Share of Public Infrastructure ........................................................................................................................ 12 Capital Budget by Classification ..................................................................................................................... 12 Lifecycle Renewal Capital Budget ($66.5 million in 2015) ............................................................................. 13 Growth Capital Budget ($51 million in 2015) ................................................................................................. 14 Service Improvement Capital Budget ($10.9 million in 2015) ....................................................................... 15 Capital Budget by Funding Source ................................................................................................................. 16 Capital Budget by Service ............................................................................................................................... 17 2015 Capital Budget with Forecasts for 2016-2024 ....................................................................................... 18
Reserves and Reserve Funds Overview ..................................................................................................................... 19 Reserve Fund Allocation ................................................................................................................................ 20 The Future - Funding Needs and Narrowing the Infrastructure Gap ............................................................. 21
Debt Overview ............................................................................................................................................................ 22
How Does the City Manage Debt? ................................................................................................................ 22 Property Tax Supported Debt Levels and Servicing Costs ............................................................................. 24
2016 to 2019 Property Tax Supported Budget Forecast ........................................................................................... 25 Appendix A – Corporate Operating Budget Overview .............................................................................................. 26 Appendix B – Service Program Overview .................................................................................................................. 30
Culture ........................................................................................................................................................... 31 Economic Prosperity ..................................................................................................................................... 40 Environmental Services ................................................................................................................................. 49 Parks, Recreation & Neighbourhood Services .............................................................................................. 57 Planning & Development .............................................................................................................................. 65 Protective Services ........................................................................................................................................ 72 Social & Health Services ................................................................................................................................ 81 Transportation Services ................................................................................................................................ 90 Corporate, Operational & Council Services ................................................................................................... 98
TABLE OF CONTENTS

TABLE OF CONTENTS - CONTINUED Appendix C – Service Program Detail ...................................................................................................................... 108
Culture ......................................................................................................................................................... 109 Economic Prosperity ................................................................................................................................... 116 Environmental Services ............................................................................................................................... 124 Parks, Recreation & Neighbourhood Services ............................................................................................ 132 Planning & Development ............................................................................................................................ 149 Protective Services ...................................................................................................................................... 153 Social & Health Services .............................................................................................................................. 163 Transportation Services .............................................................................................................................. 179 Corporate, Operational & Council Services ................................................................................................. 189
Appendix D – Capital Budget Overview ................................................................................................................... 230
2015 Capital Budget With Forecasts for 2016-2024 ................................................................................... 231 2015 Capital Budget With Forecasts – Sources of Funding ........................................................................ 232 Major Capital Works in Ten Year Plan 2015-2024 ...................................................................................... 233 Lifecycle Renewal Capital Budget ............................................................................................................... 235 Growth Capital Budget ................................................................................................................................ 245 Service Improvement Capital Budget.......................................................................................................... 261
Appendix E – Reserves/Reserve Funds Overview ................................................................................................... 271 Appendix F – Debt Overview .................................................................................................................................... 278

Page 1
On February 26, 2015, Council approved a 2.5% increase in the property tax levy from rates. A 2015 property tax
supported budget increase from rates of 2.5% reflects a $63 increase annually for the average residential rate payer.
Total Cost Of Municipal Services
NOTES:
Average rate payer owning a home with an assessed value of $214,000. Municipal Property Tax Amount is subject to 2015 tax policy. Excludes the Education tax portion which is set by the Province (2014 - $434.42).
*Figures rounded for presentation purposes.
IMPACT TO THE AVERAGE RESIDENTIAL HOMEOWNER
2014 2015
$2,493 $2,556
$63 or 2.5%
2.92.9%
Page 2
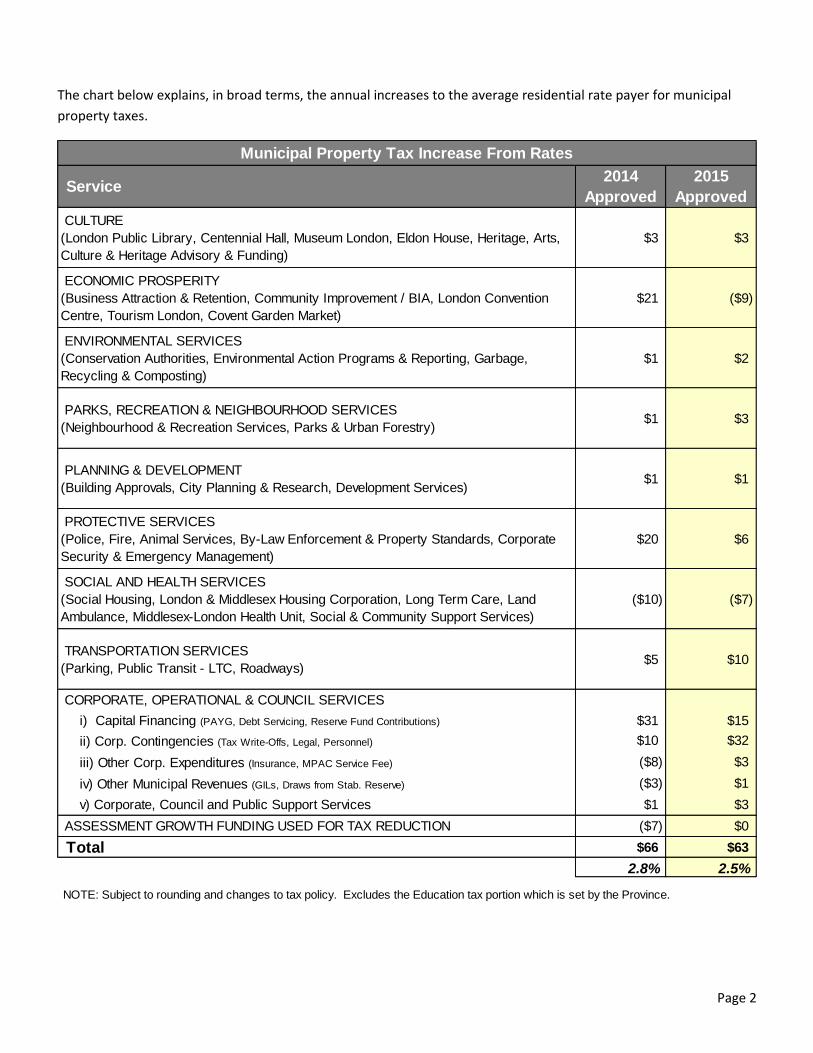
The chart below explains, in broad terms, the annual increases to the average residential rate payer for municipal
property taxes.
Service2014
Approved
2015
Approved
CULTURE
(London Public Library, Centennial Hall, Museum London, Eldon House, Heritage, Arts,
Culture & Heritage Advisory & Funding)
$3 $3
ECONOMIC PROSPERITY
(Business Attraction & Retention, Community Improvement / BIA, London Convention
Centre, Tourism London, Covent Garden Market)
$21 ($9)
ENVIRONMENTAL SERVICES
(Conservation Authorities, Environmental Action Programs & Reporting, Garbage,
Recycling & Composting)
$1 $2
PARKS, RECREATION & NEIGHBOURHOOD SERVICES
(Neighbourhood & Recreation Services, Parks & Urban Forestry) $1 $3
PLANNING & DEVELOPMENT
(Building Approvals, City Planning & Research, Development Services) $1 $1
PROTECTIVE SERVICES
(Police, Fire, Animal Services, By-Law Enforcement & Property Standards, Corporate
Security & Emergency Management)
$20 $6
SOCIAL AND HEALTH SERVICES
(Social Housing, London & Middlesex Housing Corporation, Long Term Care, Land
Ambulance, Middlesex-London Health Unit, Social & Community Support Services)
($10) ($7)
TRANSPORTATION SERVICES
(Parking, Public Transit - LTC, Roadways) $5 $10
CORPORATE, OPERATIONAL & COUNCIL SERVICES
i) Capital Financing (PAYG, Debt Servicing, Reserve Fund Contributions) $31 $15
ii) Corp. Contingencies (Tax Write-Offs, Legal, Personnel) $10 $32
iii) Other Corp. Expenditures (Insurance, MPAC Service Fee) ($8) $3
iv) Other Municipal Revenues (GILs, Draws from Stab. Reserve) ($3) $1
v) Corporate, Council and Public Support Services $1 $3
ASSESSMENT GROWTH FUNDING USED FOR TAX REDUCTION ($7) $0
Total $66 $63
2.8% 2.5%
Municipal Property Tax Increase From Rates
NOTE: Subject to rounding and changes to tax policy. Excludes the Education tax portion which is set by the Province.

Page 3
The City of London provides services that Londoners rely on every day and
contribute to the high quality of life in London. The table below shows a
breakdown of the costs of services that make up the average property tax bill
of $2,556.
NOTE: Subject to rounding and changes to tax policy.
*Excludes the Education tax portion which is set by the Province.
Did You Know…
The City of London provides
over 90 unique services.

Page 4
In order to achieve a 2.5% approved budget increase from rates, Council made the following adjustments to the
budgets for Civic Service Areas, Boards and Commissions:
In additional to the decisions above, Council made the following non-tax levy from rate adjustments to the budgets
for Civic Service Areas, Boards and Commissions:
$1.3 million capital budget to initiate plan development for a “flexible street” concept for Dundas Street from
Wellington to the river;
$5.4 million reduction to the 2015 capital budget for industrial land servicing, but added back in 2019 to
2021, reflecting Council’s earlier decision to defer contributions to the Economic Development reserve fund,
noting that overall funding for the Industrial Land Development Strategy is maintained, just stretched from
five years to eight;
$150 thousand was removed from the capital budget in 2015 plus additional planned funding for 2016 to
2018, for the medical devices initiative that is no longer required because of the grant to the London Medical
Innovation and Commercialization Network in 2014;
Tax Levy From Rates $(000's) %Homeowner
Impact1
Starting Point
(Budget as Submitted - December 8, 2014)$14,479 2.9% $72
Council Budget Deliberation Adjustments:
Reduction to Economic Development Reserve
Fund for Industrial Land Development Strategy
funding with corresponding cut to capital
($1,800) (0.4%) ($9)
Fire Services - Reduction as a result of
operational efficiencies
($277) (0.1%) ($1)
Operational funding for the Urban Forestry
Strategy
$175 0.0% $1
Conservation Authorities - Adjustments due to
timing of budget submissions (KCCA - $1.4
thousand, LTVCA - ($3.6) thousand, UTRCA -
$11.3 thousand)
$9 0.0% $0
Final Approved Budget Position - February 26, 2015 $12,586 2.5% $63
Note 1: Average rate payer owning a home with an assessed value of $214,000. Municipal Property Tax Amount
is subject to 2015 tax policy. Excludes the Education tax portion which is set by the Province (2014 - $434.42)
DECISIONS MADE BY COUNCIL IMPACTING THE 2015 BUDGET

Page 5
Capital funding for two community centres in east London was reprioritized such that the first facility
currently planned for East Lions Park on Wavell Street with a pool and gym will be funded ($16.8 million) by
2016, and $24 million for the second centre with an arena and gym in a location to be determined in the
southeast will be fully funded by 2020;
$100 thousand interest-free loan was granted to the Palace Theatre for building repairs; and
One-time funding was granted to the Employment Sector Council London-Middlesex for $26 thousand,
London Middlesex Immigrant Employment Council for $18 thousand and Northwest London Resource Centre
for $40 thousand.

Page 6
PROPERTY TAX SUPPORTED BUDGET: INCREASE OF $12.6 MILLION OR 2.5%
The table below provides a corporate overview of the City of London budget.
The source of revenue contained in the 2015 operating budget is $804.1 million (Table 1). The largest source of revenue is property taxes which accounts for 64% of the total revenues.
Table 1
The allocation of the 2015 budget for operating expenditures by service program can be found in Table 2 and by expenditure type in Table 3.
2013
Actual
2014
Revised
Budget
2015
Approved
Budget
$ Budget
Increase/
(Decrease)
% Budget
Increase/
(Decrease)
Total Expenditures 769,771 777,559 804,147 26,588 3.4%
Total Revenues:
Non-Property Tax Revenues 290,134 278,829 286,996 8,167 2.9%
Property Tax
From Rates 479,637 498,730 511,316 12,586 2.5%
From Assessment Growth 5,835 5,835 1.2%
Total Property Tax 479,637 498,730 517,151 18,421 3.7%
Total Revenues 769,771 777,559 804,147 26,588 3.4%
* Subject to rounding.
$000's
Property Tax, 64% Other, 9%
User Fees, 6%
Grants/Subsidies, 21%
Source of Operating Revenues $804.1 Million Revenues
Property taxes are
the largest
revenue source for
the City

Page 7
Table 2
Table 3
Culture, 3% Economic Prosperity, 2% Environmental
Services, 4%
Parks, Recreation & Neighbourhood
Services, 9%
Planning & Development Services, 2%
Protective Services, 20%
Social & Health Services, 26%
Transportation Services, 9%
Corporate, Operational &
Council Services, 11%
Capital Financing and Contingencies,
14%
How Operating Dollars are Spent By Service Program
$804.1 Million Expenditures
2015
Budget
($000's)
% Of Budget
Expenditures
Personnel 309,489 38.5%
Administrative 5,832 0.7%
Financial 121,006 15.0%
Purchased Services 154,302 19.2%
Materials & Supplies 32,975 4.1%
Furniture & Equipment 22,506 2.8%
Transfers 167,714 20.9%
Recovered Expenses (15,512) (1.9%)
Costs Due To A Growing City (funded by assessment growth) 5,835 0.7%
Total Expenditures 804,147 100.0%
* Subject to rounding.
How Operating Dollars are Spent
By Expenditure Type
$804.1 Million Expenditure

Page 8
Table 4
2015
Budget
($000's)
Tax Levy
Increase
($000's)
% Tax Levy
Increase
Culture 23,494 562 0.1%
Economic Prosperity 12,815 (1,760) (0.3%)
Environmental Services 17,662 433 0.1%
Parks, Recreation and Neighbourhood Services 30,348 627 0.1%
Planning & Development Services 5,801 124 0.0%
Protective Services 152,895 1,162 0.3%
Social and Health Services 65,297 (1,323) (0.3%)
Transportation Services 60,024 1,948 0.4%
Corporate, Operational and Council Services
i) Capital Financing (PAYG, Debt Servicing, Reserve Fund Contributions) 94,942 3,056 0.6%
ii) Corp. Contingencies (Tax Write-Offs, Legal, Personnel) 20,843 6,392 1.3%
iii) Other Corp. Expenditures (Insurance, MPAC Service Fee) 11,135 528 0.2%
iv) Other Municipal Revenues (Grant in Lieu, Draw s from Stab. Reserve) (37,456) 204 (0.1%)
v) Corporate, Council and Public Support Services 53,516 633 0.1%
Total Corporate, Operational and Council Services 142,980 10,813 2.2%
TOTAL 2015 TAX LEVY FROM RATES 511,316 12,586 2.5%
* Subject to rounding
Net Property Tax Budget

Page 9
The key cost drivers that have put pressure on the tax levy from rates resulting in an increase of $12.6 million
include:
2015 Net Budget Pressures
Corp. Contingencies (Tax Write-Offs, Legal, Personnel) 6.4 32
Capital Financing (Note 1) 3.0 15
Pay As You Go 2.2 11
Reserve / Reserve Fund Contributions 0.8 4
Protective Services 1.0 4
Police (Approved at 0.7%) 0.7 3
Fire (Approved at 0.5%) 0.3 1
Roadways (Approved at 3.4%) 1.2 6
London Transit Commission (Approved at 2.9%) 0.8 4
London & Middlesex Housing Corporation (Approved at 7.4%) 0.6 3
Land Ambulance (Approved at 3.6%) 0.4 2
London Public Library (Approved at 2.1%) 0.4 2
Conservation Authorities 0.2 1
Net Ontario Works (0.5) (2)
Ontario Works (Provincial Uploading) (1.7) (8)
Reduced Reliance On Stabilization Reserve 1.2 6
Remaining Service Areas (0.9) (4)
Tax Levy Increase From Rates As Approved $12.6 $63
* Subject to rounding.
$
Inc. / (Dec.)
(millions)
$
Impact To Avg.
Res. Homeowner
NOTE 1: Capital Financing funds all service programs such as Environmental Services, Recreation, Transportation and Protective Services.

Page 10
USER FEES
Note: Reflects user fees approved by Council with the exception of the London Police Service as a result of shared financial reporting
system. User fees set by Boards and Commissions follow the structure that those areas have in place with respect to their user fee
approval process.
User fees are charges imposed by the municipality to provide specific services to its citizens. This revenue source is intended to recover all or part of the costs associated with providing the service. The City of London anticipates raising $804.1 million in revenue for the 2015 Property Tax Supported Budget to support operations. User fees account for $43.6 million of the $804.1 million total operating revenue or 6 cents of every municipal revenue dollar collected. Parks, Recreation & Neighbourhood Services is the greatest contributor to user fee revenue for the City of London. In 2015, $16.1 million of the total $43.6 million budgeted user fee revenue from civic service areas is anticipated from Parks, Recreation & Neighbourhood Services. This area charges a variety of user fees in service areas such as aquatics, arenas, community recreation and leisure programming, community centres, golf courses, sports services, senior centres and Storybook Gardens. The bar chart highlights some of the significant components of budgeted user fee revenue for civic services within the City of London.
2014 2015 Increase/Decrease
Revised Approved Over 2014
Budget Budget Budget
(millions) (millions) (millions)
Culture 0.6 0.6 0.0
Environmental Services 4.2 4.1 (0.1)
Parks, Recreation & Neighbourhood 15.9 16.1 0.2
Planning and Development 6.5 6.6 0.1
Protective Services 3.4 3.3 (0.1)
Social & Health Services 5.4 5.5 0.1
Transportation 3.8 3.7 (0.1)
Corporate, Oper. & Council Services 3.6 3.7 0.1
Total User Fees For Civic Service Areas 1 $43.4 $43.6 $0.2
Service Program
16.1
5.5
5.4
4.1
3.7
1.8
1.3
1.1
1.1
1.1
0.8
1.6
0.0 5.0 10.0 15.0 20.0
Parks, Recreation & Neighbourhood Services
Long Term Care
Building Approvals
Garbage, Recycling and Composting
Roadways & Parking
By-law Enforcement
Animal Services
Corporate Services
City Planning & Research and Development Serv.
Public Support Services
Licencing and Certificates
Other

Page 11
CAPITAL BUDGET OVERVIEW: 2015 CAPITAL & 2016-2024 CAPITAL PLAN
The capital section of the budget includes a 2015 approved budget plus a forecast for the next nine years (2016-
2024). Together, these make the ten year capital plan. A long term capital plan is a useful tool to help Council
ensure objectives are met, help guide community expectations and provide a good planning tool for growth and
financial planning. Within the capital budget and plan, there are three classifications for capital projects:
lifecycle renewal, growth and service improvement.
The City’s ten year capital plan is almost $1.8 Billion. It includes projects such as:
As demonstrated in the chart on the next page, municipalities have increased their ownership and management
of public infrastructure significantly since 1961. This is a combination of the transfer of assets from the
provincial and federal governments and increased demand for municipal services. However, municipalities
receive by far the smallest share (only 9%) of total tax revenues compared to federal and provincial bodies.
Expenditures Requested
$millions
2015
Approved
Budget
2016-2024
Forecast
Total 2015
to 2024
Lifecycle Renewal 66.5 645.1 711.5
Growth 51.0 796.2 847.2
Service Improvement 10.9 186.1 197.0
Total Capital Expenditures $128.4 $1,627.3 $1,755.7
Major Capital Works in Ten Year Plan 2015- 2024 ($ millions) 2015 2016-2024
Industrial Land Acquisition, Servicing and Development $5.9 $62.9
Two Multi-purpose Recreation Centres - East (beginning design in 2015, construction
scheduled for 2018) and Southeast (2016-2018)$10.4 $30.4
Hyde Park Widening Phase II (CP Rail to Fanshawe) (construction 2015) $12.8
Commissioners Rd Widening (Wonderland to Viscount) (construction 2015) $10.5
Future Road Widening and New Initiatives $9.8 $368.0
Roads and Bridges - Lifecycle Renewal (including construction in 2015):
Colborne Street (construction from Grey to Nelson)
Fanshawe Park Rd (construction from Medway Bridge to North Centre Road)
Ridout/Upper Queens/Nixon (construction from Baseline to Southdale)
Highbury Ave over CN Rail Bridge Rehabilitation
$20.8 $214.2
Rapid Transit Investment (environmental assessment in 2015, road widening and buses
in future years)$2.7 $340.3
Transit System Investment (buses) $6.3 $74.3

Page 12
Share of Public Infrastructure
Source: Integrated Long Term Financial Planning (MFOA and AMCTO publications)
CAPITAL BUDGET BY CLASSIFICATION
Capital projects are classified based on
their purpose and funding source. 41% of
the 10 year capital plan is for Lifecycle
Renewal projects because maintaining
current assets is a high priority. 48% of
the plan is allocated to Growth projects
included in the Council approved 2014 DC
By-law. The remaining 11% of the capital
plan is earmarked for Service
Improvement projects to improve service
or address an emerging need. Spending
on Growth and Service Improvement
fluctuates from year to year due to the
nature of the projects. The sections
below discuss each classification in more
detail.
Ontario municipalities receive 9%
of total revenues, yet are
responsible for over 50% of the
infrastructure
Source: Association of Municipalities of Ontario

Page 13
Lifecycle Renewal projects maintain the infrastructure that is in place today (e.g. projects that resurface roads,
replace roofs, and replace equipment). This is a high priority component of the capital budget. The goal is to
keep systems and facilities in good repair, and planned regular maintenance is cheaper in the long run than
sporadic emergency work.
In 2014, the City published a Corporate Asset Management Plan. The Plan focused on what is needed to
achieve established levels of service (LOS), plan lifecycle asset management, identify long-term asset investment
needs and cope with the growing infrastructure gap. The infrastructure gap was identified as $50.2 million for
property tax supported assets and projected to grow to $405.5 million by 2022. Lifecycle Renewal projects
address the infrastructure gap.
The Asset Management Plan called for a 1.77% annual tax rate increase over eight years to address
the infrastructure gap. There is nothing included in the base 2015 budget towards this goal other
than the consideration for a 0.5% tax levy increase ($2.5 million) contained in the additional
investment business case #1.
Financing Strategy for Lifecycle Renewal Capital Budget
The Corporate Strategic Financial Plan, endorsed by Council, guides the funding mix for each capital
budget classification. The plan calls for Lifecycle Renewal projects to be funded by capital levy and
reserve funds, with a reduced reliance on debt. This is referred to as “pay-as-you-go” funding. Debt is
not an appropriate funding source for the renewal of current assets. The chart below shows debt
financing for Lifecycle Renewal decreasing significantly since 2006. Debt is forecasted to be 0% by 2021.
Source of Financing
$millions
2015
Approved
Budget
2016-2024
Forecast
Total 2015
to 2024
Capital Levy (Pay-as-you-go) 27.7 337.0 364.7
Debenture 10.6 32.3 42.9
Reserve Fund 15.1 131.1 146.1
Other 0.4 1.5 1.9
Total Tax Supported $53.8 $501.8 $555.6
Federal Grants 10.5 123.1 133.6
Provincial Grants 1.1 17.1 18.2
Reserve Fund 1.1 2.9 4.0
Other Sources - 0.2 0.2
Total Non-Tax Supported $12.7 $143.3 $155.9
Total Financing Available $66.5 $645.1 $711.5
Lifecycle Renewal Capital Budget ( $66.5 million in 2015)
The estimated replacement value of city owned assets
supported by the property tax capital budget is $4.2 Billion.

Page 14
The benefits of moving to pay-as-you-go financing include:
1) Reduces cost to the taxpayer in the long run for renewing and maintaining infrastructure.
2) Creates intergenerational equity – those who benefit from the asset pay for the asset
3) Creates debt capacity for increased investment in growth and new initiative projects that benefit
future taxpayers.
Growth projects are planned to extend services into newly developed areas of the City (e.g. a road widening to
handle additional traffic from new subdivisions). Growth projects are not always immediately imperative, but in
the long run the City has a responsibility to provide adequate services to newly developed areas.
Growth Capital Budget ($51 million in 2015)
Source of Financing
$millions
2015
Approved
Budget
2016-2024
Forecast
Total 2015
to 2024
Capital Levy (Pay-as-you-go) 0.9 8.0 8.9
Debenture 10.9 92.1 103.0
Reserve Fund - 0.4 0.4
Other 0.1 - 0.1
Total Tax Supported $11.9 $100.5 $112.3
Debenture (Supported by DCs) 2.7 205.3 208.0
Reserve Fund (Development Charges) 35.8 263.6 299.4
Senior Government 0.7 226.8 227.5 Total Non-Tax Supported $39.1 $695.7 $734.9
Total Financing Available $51.0 $796.2 $847.2
TARGET
0%
Since 2006 the
percent of lifecycle
capital projects
financed by debt has
decreased from 35%
to 10% and is
forecasted to be
essentially
eliminated by 2021.

Page 15
The ten year growth plan increased considerably from the 2014 budget as a result of Council approving the 2014
Development Charges (DC) By-law. Many new growth projects were added to the plan through the
accompanying DC Study. The 2015-2024 growth plan includes an additional $343 million for the rapid transit
initiative, including road widenings and buses. Two-thirds of the funding for this initiative is planned to be
provided by senior governments. The ten year plan also includes $158 million for other road widenings that
were added through the 2014 DC Study.
Financing Strategy for Growth Capital Budget
The Strategic Financial Plan requires Growth projects be primarily supported by DC’s. DC’s are collected when
building permits are issued for new construction. Certain growth projects (e.g. rapid transit) also heavily depend
on senior government support. 13% of the current ten year plan for growth is tax supported, primarily debt.
Debt is appropriate for new assets with a long life. The tax supported portion is referred to as the “non-growth”
component which is defined within the DC Study for each growth project.
The growth budget will be controlled through the linkage to the annual Growth Management
Implementation Strategy (GMIS). GMIS is a process of annually reviewing growth projects
planned in the current Development Charges (DC) Study versus development charges revenue
received when building permits are acquired. Growth projects are deferred if DC revenue
cannot financially support the growth plan. GMIS is completed each year in advance of the
budget process so the results are reflected in the next year’s budget.
Service Improvement projects provide a new or improved level of service or address an emerging need (e.g.
purchasing property for industrial land). These projects are optional, but the case may be compelling.
Financing Strategy for Service Improvements Capital Budget
The Strategic Financial Plan for Service Improvement projects sees a mix of capital levy and reserve fund, as well
as debt and non-tax support, depending on the nature of each specific project. The ten year plan for service
Service Improvement Capital Budget ($10.9 million in 2015)
Source of Financing
$millions
2015
Approved
Budget
2016-2024
Forecast
Total 2015
to 2024
Capital Levy (Pay-as-you-go) 0.5 16.5 17.0
Debenture 0.6 44.2 44.8
Reserve Fund 5.1 64.4 69.5
Other 0.6 0.6 1.2
Total Tax Supported $6.8 $125.7 $132.5
Federal Grants 0.5 30.0 30.5
Reserve Fund 0.3 0.1 0.4
Senior Government 3.3 30.3 33.6
Total Non-Tax Supported $4.1 $60.4 $64.5
Total Financing Available $10.9 $186.1 $197.0

Page 16
improvement includes $45 million to support the Industrial Land Development Strategy (ILDS). Two-thirds of the
funding for servicing land for the ILDS is scheduled to be provided by senior governments.
The capital budget is funded by tax supported contributions (capital levy, reserve funds, debt) and non-tax
supported contributions (development charges revenue and senior government funding).
The Corporate Strategic Financial Plan calls for the lifecycle renewal budget to be financed completely by capital
levy and reserve funds. Debt is not an appropriate source of financing for renewal of existing assets. Both capital
levy and reserve fund contributions are scheduled to increase moderately each year to support this Financial
Plan. Currently, debt is essentially eliminated from the lifecycle renewal budget in 2021.
Debenture financing has remained stable in the 2015-2024 capital forecast. A $26.0 million cap on the average
total debt financing over the ten year plan remains in place and contributes to this stability.
Non-tax supported funding increased considerably in the 2015-2024 capital plan. The Rapid Transit initiative and
the Industrial Land Development Strategy combined added $388 million to the plan but included two-thirds
senior government funding support and considerable support from development charges.
Source of Financing
$millions
2015
Approved
Budget
2016-2024
Forecast
Total 2015
to 2024
Capital Levy (Pay-as-you-go) 29.2 361.4 390.6
Debenture 22.1 168.7 190.8
Reserve Fund 20.2 195.7 215.9
Other 1.0 2.1 3.1
Total Tax Supported $72.4 $728.0 $800.4
Debenture 2.7 205.3 208.0
Reserve Fund 37.1 266.6 303.7
Federal Gas Tax 11.0 153.1 164.1
Provincial Grants 1.1 17.1 18.2
Senior Government 4.0 257.2 261.2
Other 0.0 0.1 0.2
Total Non-Tax Supported $56.0 $899.4 $955.4
Total Financing Available $128.4 $1,627.3 $1,755.7
* Figures rounded for presentation purposes
CAPITAL BUDGET BY FUNDING SOURCE

Page 17
Transportation Services, primarily road rehabilitation, dominates the capital budget with projects worth $1.2
billion or 66% of the ten year capital plan. Major projects include:
Roads & Bridges Lifecycle Renewal $175 million
Future Road Widenings $200 million
Rapid Transit Initiative $380 million
Parks, Recreation & Neighbourhood Services is the next largest area with $180 million over ten years. Major
projects include:
Recreation Facilities Lifecycle Renewal $37 million
Parks Lifecycle Renewal $39 million
Economic Prosperity includes projects worth $108 million in the 2015 – 2024 plan. Major projects include:
Industrial Land Servicing and Development $78 million
$millions 2015
Approved
Budget
2016-2024
Forecast
Total 2015
to 2024
Culture 4.9 21.2 26.1
Economic Prosperity 12.4 95.8 108.2
Environmental Services 0.8 69.7 70.5
Parks, Recreation & Neighbourhood Services 21.8 157.8 179.6
Planning & Development Services 0.4 1.5 1.9
Protective Services 5.5 80.2 85.7
Social & Health Services 2.6 23.9 26.5
Transportation Services 71.9 1,085.4 1,157.3
Corporate, Operational & Council Services 8.1 91.9 100.0
Total Expenditures $128.4 $1,627.3 $1,755.7
CAPITAL BUDGET BY SERVICE
Page 18
2014
Revised
Budget
2015
Approved
Budget
2016
Forecast
2017
Forecast
2018
Forecast
2019
Forecast
2020-
2024
Forecast
Total
2015 to
2024
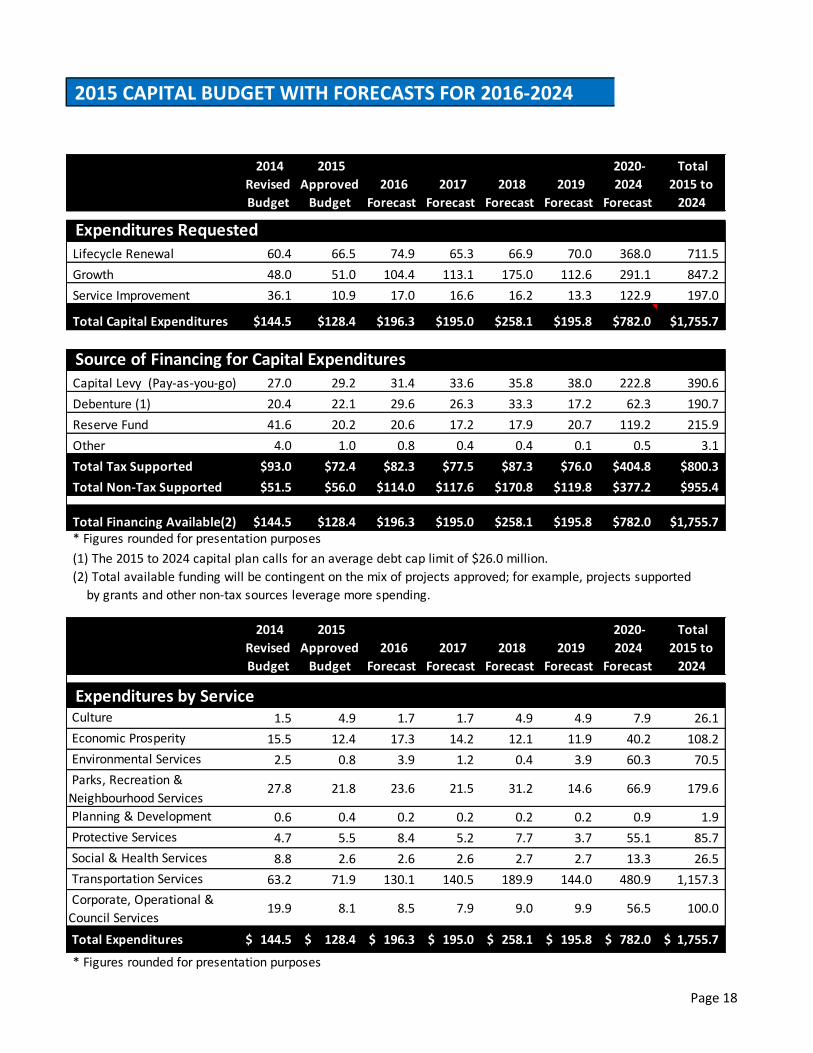
Expenditures RequestedLifecycle Renewal 60.4 66.5 74.9 65.3 66.9 70.0 368.0 711.5
Growth 48.0 51.0 104.4 113.1 175.0 112.6 291.1 847.2
Service Improvement 36.1 10.9 17.0 16.6 16.2 13.3 122.9 197.0
Total Capital Expenditures $144.5 $128.4 $196.3 $195.0 $258.1 $195.8 $782.0 $1,755.7
Source of Financing for Capital ExpendituresCapital Levy (Pay-as-you-go) 27.0 29.2 31.4 33.6 35.8 38.0 222.8 390.6
Debenture (1) 20.4 22.1 29.6 26.3 33.3 17.2 62.3 190.7
Reserve Fund 41.6 20.2 20.6 17.2 17.9 20.7 119.2 215.9
Other 4.0 1.0 0.8 0.4 0.4 0.1 0.5 3.1
Total Tax Supported $93.0 $72.4 $82.3 $77.5 $87.3 $76.0 $404.8 $800.3
Total Non-Tax Supported $51.5 $56.0 $114.0 $117.6 $170.8 $119.8 $377.2 $955.4
Total Financing Available(2) $144.5 $128.4 $196.3 $195.0 $258.1 $195.8 $782.0 $1,755.7* Figures rounded for presentation purposes
(1) The 2015 to 2024 capital plan calls for an average debt cap limit of $26.0 million.
(2) Total available funding will be contingent on the mix of projects approved; for example, projects supported
by grants and other non-tax sources leverage more spending.
2014
Revised
Budget
2015
Approved
Budget
2016
Forecast
2017
Forecast
2018
Forecast
2019
Forecast
2020-
2024
Forecast
Total
2015 to
2024
Expenditures by Service Culture 1.5 4.9 1.7 1.7 4.9 4.9 7.9 26.1
Economic Prosperity 15.5 12.4 17.3 14.2 12.1 11.9 40.2 108.2
Environmental Services 2.5 0.8 3.9 1.2 0.4 3.9 60.3 70.5
Parks, Recreation &
Neighbourhood Services 27.8 21.8 23.6 21.5 31.2 14.6 66.9 179.6
Planning & Development
Services 0.6 0.4 0.2 0.2 0.2 0.2 0.9 1.9
Protective Services 4.7 5.5 8.4 5.2 7.7 3.7 55.1 85.7
Social & Health Services 8.8 2.6 2.6 2.6 2.7 2.7 13.3 26.5
Transportation Services 63.2 71.9 130.1 140.5 189.9 144.0 480.9 1,157.3
Corporate, Operational &
Council Services 19.9 8.1 8.5 7.9 9.0 9.9 56.5 100.0
Total Expenditures 144.5$ 128.4$ 196.3$ 195.0$ 258.1$ 195.8$ 782.0$ 1,755.7$
* Figures rounded for presentation purposes
2015 CAPITAL BUDGET WITH FORECASTS FOR 2016-2024
Page 19
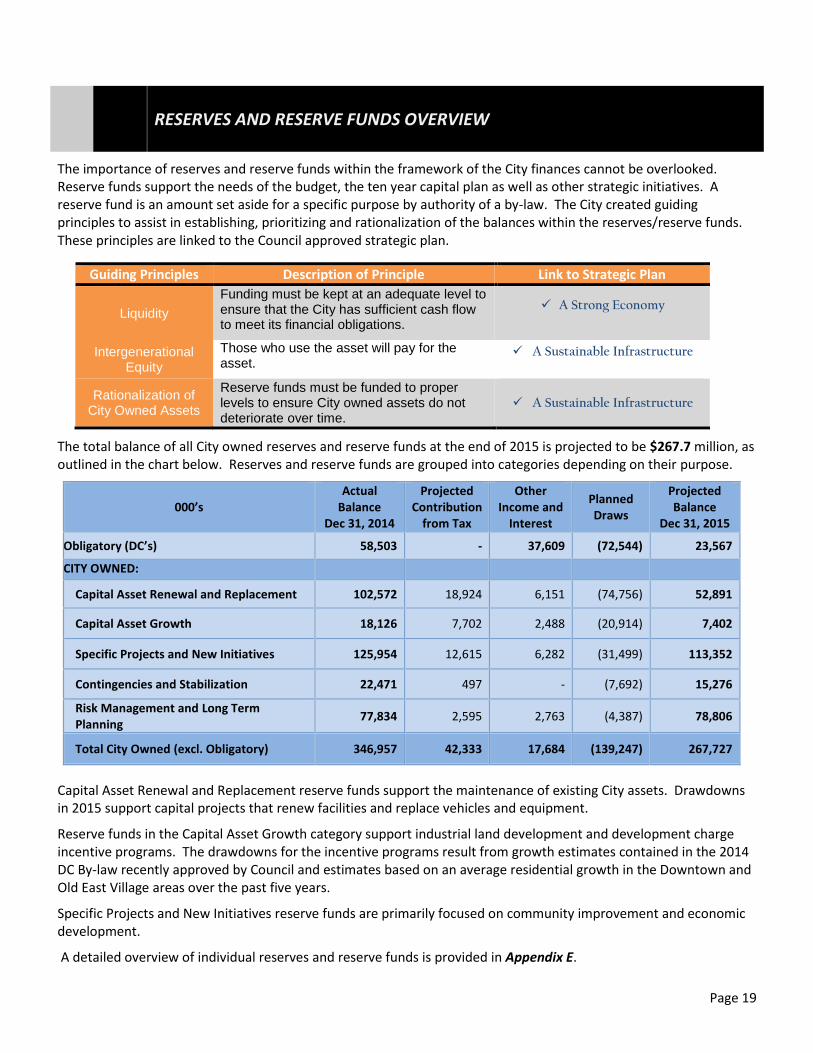
RESERVES AND RESERVE FUNDS OVERVIEW
The importance of reserves and reserve funds within the framework of the City finances cannot be overlooked. Reserve funds support the needs of the budget, the ten year capital plan as well as other strategic initiatives. A reserve fund is an amount set aside for a specific purpose by authority of a by-law. The City created guiding principles to assist in establishing, prioritizing and rationalization of the balances within the reserves/reserve funds. These principles are linked to the Council approved strategic plan.
Guiding Principles Description of Principle Link to Strategic Plan
Liquidity
Funding must be kept at an adequate level to ensure that the City has sufficient cash flow to meet its financial obligations.
A Strong Economy
Intergenerational Equity
Those who use the asset will pay for the asset.
A Sustainable Infrastructure
Rationalization of City Owned Assets
Reserve funds must be funded to proper levels to ensure City owned assets do not deteriorate over time.
A Sustainable Infrastructure
The total balance of all City owned reserves and reserve funds at the end of 2015 is projected to be $267.7 million, as outlined in the chart below. Reserves and reserve funds are grouped into categories depending on their purpose.
000’s
Actual Balance
Dec 31, 2014
Projected Contribution
from Tax
Other Income and
Interest
Planned Draws
Projected Balance
Dec 31, 2015
Obligatory (DC’s) 58,503 - 37,609 (72,544) 23,567
CITY OWNED:
Capital Asset Renewal and Replacement 102,572 18,924 6,151 (74,756) 52,891
Capital Asset Growth 18,126 7,702 2,488 (20,914) 7,402
Specific Projects and New Initiatives 125,954 12,615 6,282 (31,499) 113,352
Contingencies and Stabilization 22,471 497 - (7,692) 15,276
Risk Management and Long Term Planning
77,834 2,595 2,763 (4,387) 78,806
Total City Owned (excl. Obligatory) 346,957 42,333 17,684 (139,247) 267,727
Capital Asset Renewal and Replacement reserve funds support the maintenance of existing City assets. Drawdowns in 2015 support capital projects that renew facilities and replace vehicles and equipment.
Reserve funds in the Capital Asset Growth category support industrial land development and development charge incentive programs. The drawdowns for the incentive programs result from growth estimates contained in the 2014 DC By-law recently approved by Council and estimates based on an average residential growth in the Downtown and Old East Village areas over the past five years.
Specific Projects and New Initiatives reserve funds are primarily focused on community improvement and economic development.
A detailed overview of individual reserves and reserve funds is provided in Appendix E.
Page 20
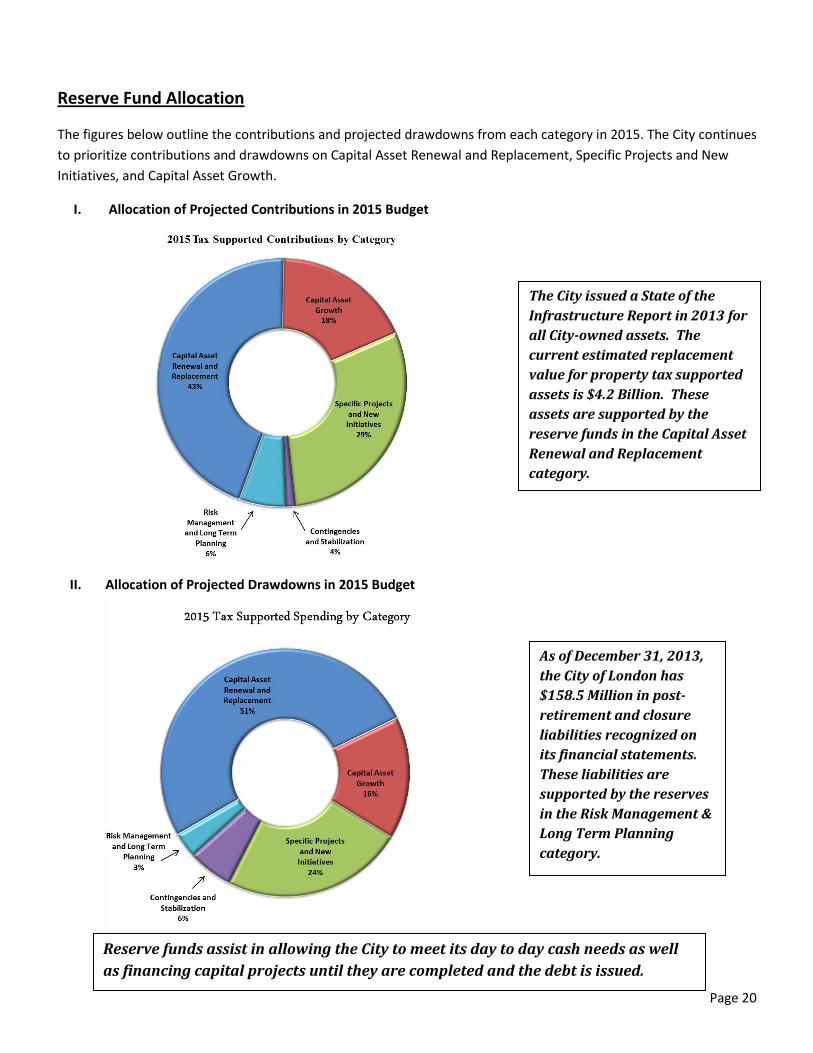
Reserve Fund Allocation
The figures below outline the contributions and projected drawdowns from each category in 2015. The City continues
to prioritize contributions and drawdowns on Capital Asset Renewal and Replacement, Specific Projects and New
Initiatives, and Capital Asset Growth.
I. Allocation of Projected Contributions in 2015 Budget
II. Allocation of Projected Drawdowns in 2015 Budget
As of December 31, 2013,
the City of London has
$158.5 Million in post-
retirement and closure
liabilities recognized on
its financial statements.
These liabilities are
supported by the reserves
in the Risk Management &
Long Term Planning
category.
The City issued a State of the
Infrastructure Report in 2013 for
all City-owned assets. The
current estimated replacement
value for property tax supported
assets is $4.2 Billion. These
assets are supported by the
reserve funds in the Capital Asset
Renewal and Replacement
category.
Reserve funds assist in allowing the City to meet its day to day cash needs as well
as financing capital projects until they are completed and the debt is issued.

Page 21
The Future - Funding Needs and Narrowing the Infrastructure Gap
In 2013, the City of London issued a State of the Infrastructure Report to identify the needs and prioritize spending
on capital assets based on a comprehensive risk based approach. The report identified a current infrastructure gap
of $50.2 million in property tax supported assets, growing to $405.5 million in ten years. Failing to address growing
infrastructure needs will result in increased risk of infrastructure failures that will negatively affect Londoners quality
of life through more frequent impacts like road closures, water alerts, unkempt parks, etc. The use of reserve funds
is one of the prudent strategies available to help mitigate growth of the infrastructure gap.
Reserve funds in the Capital Asset Renewal and Replacement category support the City’s existing infrastructure. As
seen in the previous figures, 42% of the City’s reserve fund contributions are being directed to this category in 2015.
The chart below outlines the
projected balances in this
category from 2014 to 2018.
Although the projected
balances are increasing over
the next five years, the total
balance of approximately $81
million is a small percentage
of the estimated replacement
value of $4.2 Billion on
property tax supported
assets. The reserve fund
balance by 2018 will
represent only 1.9 % of that
estimated replacement value.
The Transportation Services
program area has the biggest
infrastructure gap going forward, $271.6 million in ten years. This program area does not have dedicated reserve
funds. Administration is attempting to address the gap with increases in capital levy to demonstrate a willingness to
partner with senior levels of government for infrastructure funding.
The infrastructure gap for the Corporate, Operational and
Council Services program area is the second largest at $66.1
million in ten years. For this reason, large contributions to the
Capital Asset Renewal and Replacement Reserve funds are
necessary. Assets in this program area include administrative
buildings owned by the city, fleet vehicles used for city
operations and information technology.
City of London - City Hall Building
Contingency
and
Stabilization
Reserves
Page 22
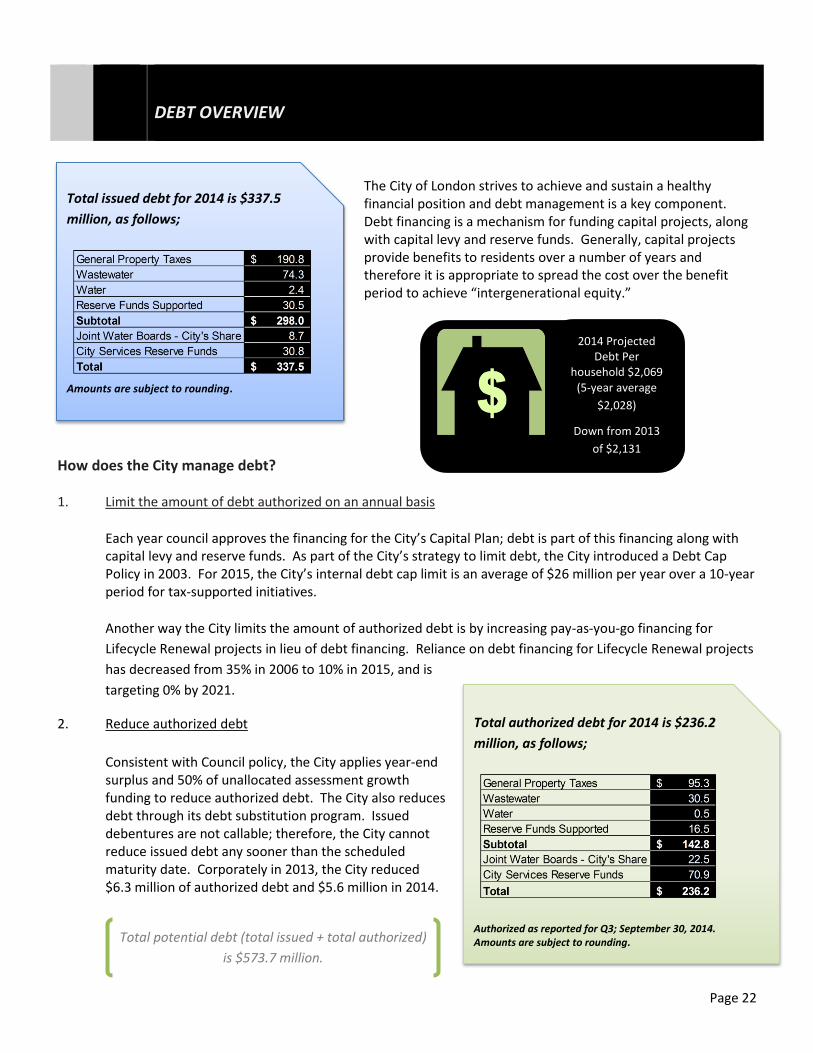
2014 Projected Debt Per
household $2,069 (5-year average
$2,028)
Down from 2013
of $2,131
The City of London strives to achieve and sustain a healthy financial position and debt management is a key component. Debt financing is a mechanism for funding capital projects, along with capital levy and reserve funds. Generally, capital projects provide benefits to residents over a number of years and therefore it is appropriate to spread the cost over the benefit period to achieve “intergenerational equity.”
How does the City manage debt? 1. Limit the amount of debt authorized on an annual basis
Each year council approves the financing for the City’s Capital Plan; debt is part of this financing along with capital levy and reserve funds. As part of the City’s strategy to limit debt, the City introduced a Debt Cap Policy in 2003. For 2015, the City’s internal debt cap limit is an average of $26 million per year over a 10-year period for tax-supported initiatives.
Another way the City limits the amount of authorized debt is by increasing pay-as-you-go financing for
Lifecycle Renewal projects in lieu of debt financing. Reliance on debt financing for Lifecycle Renewal projects
has decreased from 35% in 2006 to 10% in 2015, and is
targeting 0% by 2021.
2. Reduce authorized debt
Consistent with Council policy, the City applies year-end surplus and 50% of unallocated assessment growth funding to reduce authorized debt. The City also reduces debt through its debt substitution program. Issued debentures are not callable; therefore, the City cannot reduce issued debt any sooner than the scheduled maturity date. Corporately in 2013, the City reduced $6.3 million of authorized debt and $5.6 million in 2014.
DEBT OVERVIEW
Total issued debt for 2014 is $337.5
million, as follows;
Amounts are subject to rounding.
Total authorized debt for 2014 is $236.2
million, as follows;
Authorized as reported for Q3; September 30, 2014. Amounts are subject to rounding.
Total potential debt (total issued + total authorized)
is $573.7 million.

Page 23
3. Manage the City’s debt servicing charges
Each year the City receives its “Annual Repayment Limit” or ARL, (under Ontario Regulation 403/02) from the Ministry of Municipal Affairs and Housing. The limit is based on data contained in the City’s Financial Information Return and it represents the maximum amount the municipality has available to commit to payments relating to debt and financial obligations. In general, debt payments are limited to 25% of a previous year’s “own-source” revenue.
Each year Moody’s Investors Service reviews the credit worthiness of the City of London and then assigns the City a credit rating for the year. Moody's Investors Service is a leading provider of credit ratings, research, and risk analysis. The firm's ratings and analysis track debt covering more than 130 countries, 11,000 corporate issuers, 21,000 public finance issuers, and 76,000 structured finance obligations. For 2014, the City of London received the highest possible rating, Aaa, for the 38th consecutive year.
As a Aaa rated municipality, the City of London debentures are considered to be of the highest quality with minimal credit risk making them appealing to institutional buyers and investors. This contributes to the City of London’s favourable cost of borrowing on long-term financing, which may be between 3 to 5 basis points in comparison to being rated Aa depending on market conditions. This translates to approximately $0.5 million of interest costs avoided on a 10-year borrowing program of $30 million.
Excerpt from Moody’s Investors Service Credit Analysis Report, November 6, 2014:
“When compared with other Canadian municipalities, London exhibits a lower debt burden, while the city’s liquidity, as measured by the level of net cash and investments relative to debt and revenue, is considered healthy and in line with national peers of a similar rating.”
“The City of London’s Aaa debt rating is supported by sizeable level of reserves and a prudent, conservative approach to fiscal planning.”
A municipality may issue debt for long-term borrowing to provide financing for capital works. The City issues debt on projects that are substantially complete. The City reviews project status reports on a quarterly basis to determine which projects that have debt financing are substantially complete. This analysis along with cash flow requirements, budget constraints and market conditions determine the amount of debt issued each year.
Total debt servicing costs for 2015 are
$62.1 million, as follows;
Amounts are subject to rounding.
Aaa for 38
years
Did you know…
London has been rated Aaa
for 38 consecutive years
The City’s 2015 annual debt repayment limit is $125 million, an amount that would
support approximately $986 million of debt.
In 2014, the City of London
issued $30,000,000 of
debentures in the capital
markets at an all-in-rate of
2.957% for a 10-year term.

Page 24
Summary of Debt Process: From Authorization to Payments
Looking ahead The City has continued on the path of employing tighter controls for authorizing new debt and that is being reflected in a slight decline in total potential debt levels (i.e. issued and authorized) from 2014. The City expects that this trend will continue through 2019. Debt servicing costs (property tax supported) show a slight incline, which reflects an increase in the amount of debt issued and the rising interest rate environment that is expected in the next few years. Projected debt repayments are calculated over a 10-year term using interest rates starting from 4.3% in 2015, and rising to 5.7% by 2018. Interest rates are derived using forecasts published by the “Big Five Canadian Banks.” The graph below shows the Property Tax Supported debt levels and servicing costs from 2014 through to 2019.
0
10
20
30
40
50
60
70
80
0
50
100
150
200
250
300
350
400
2014 2015 2016 2017 2018 2019
Pri
nci
pal
& In
tere
st P
aym
en
ts (
$ m
illio
ns)
De
bt
Leve
l ($
mill
ion
s)
Property Tax Supported Debt Levels and Servicing Costs
Issued Authorized Principal & Interest Payments
WHERE WE ARE HEADEDWHERE WE ARE
Issued $30 million in 2014
CAPITAL BUDGET
DEBT IS
AUTHORIZED
FOR PROJECTS
SPENDING ON
PROJECTS
ISSUE
DEBENTURES
ON
COMPLETED
PROJECTS
OPERATING
BUDGET
PRINCIPAL
AND
INTEREST
PAYMENTS
Total authorized is $236.2 million Budget for 2015 is $62.1 million

Page 25
2016 TO 2019 PROPERTY TAX SUPPORTED BUDGET FORECAST
The 2016 to 2019 Property Tax Supported budget forecast, as outlined in the chart below, anticipates an average property tax rate increase of 3.2%. These forecasts are based on the forecast information provided by Civic Service Areas, Boards and Commissions to maintain existing service levels without any significant adjustments to services or introduction of new services.
Note: The forecast for 2019 is a placeholder based on a reasonable cost estimate.
The forecast for most programs and services are to maintain existing service levels. Items classified as
additional investments are unfunded and will form part of the multi-year budget discussion next year;
Continued upload of Ontario Works to the Province that commenced in 2010 will be completed by 2018.
The municipal share will drop to 5.8% in 2016, 2.8% in 2017 and 0% in 2018;
Gradual reduced reliance from City reserves as a funding source contained in the budget. The objective is
to ensure that City reserves are not being depleted to fund ongoing operational costs contained in the
budget;
An annual increase of $2.2 million in capital levy (pay as you go) financing. This funding source will be
used to fund capital projects as outlined in the capital plan in lieu the debt financing, which is a more
costly form of capital financing;
An increase in the average annual debt servicing costs of $1.3 million, net of retired debt, for financing of
previously approved capital projects; and
The forecast is only reflective of the property tax increase from rates and excludes the impacts of
assessment growth costs due to an expanding City.
As with any financial planning process, new information may become available that may impact the financial
forecast and plan. While every effort is taken to ensure that all aspects are adequately covered, unforeseen items
will still come forward resulting from changing government legislation/regulation and economic events.
4.2%
2.9%2.7%
3.0%
0.0%
0.5%
1.0%
1.5%
2.0%
2.5%
3.0%
3.5%
4.0%
4.5%
2016 2017 2018 2019
Fore
cast
ed T
ax L
evy
Incr
ease
Forecasted Tax Levy Increase From Rates
Average tax levy
increase from rates
is forecasted to be
3.2% from 2016 -
2019

Page 26

Page 27
2014 Net
Revised
Budget
2015
Expense
2015 Non Tax
Revenue
2015 Net
Approved
Budget
Increase /
(Decrease)
Over 2014 $
Increase /
(Decrease)
Over 2014 %
CULTURE
Cultural Services:
Centennial Hall 100 747 (642) 105 5 4.6% 0
Arts, Culture, & Heritage Advisory & Funding 2,180 2,253 0 2,253 73 3.4% 0
Museum London 1,550 1,614 0 1,614 64 4.1% 0
Eldon House 232 263 0 263 31 13.3% 0
Heritage 157 145 0 145 (12) (7.8%) 0
London Public Library 18,713 19,114 0 19,114 401 2.1% 0
TOTAL CULTURE 22,932 24,136 (642) 23,494 562 2.4% 0
ECONOMIC PROSPERITY
Business Attraction & Retention 11,954 10,159 0 10,159 (1,795) (15.0%) 1,912
Community Improvement / BIA 188 195 0 195 7 3.5% 0
London Convention Centre 569 569 0 569 0 0.0% 0
Tourism London 1,864 1,892 0 1,892 28 1.5% 0
Covent Garden Market 0 0 0 0 0 0.0% 0
TOTAL ECONOMIC PROSPERITY 14,575 12,815 0 12,815 (1,760) (12.1%) 1,912
ENVIRONMENTAL SERVICES
Kettle Creek Conservation Authority 393 412 0 412 19 4.9% 0
Lower Thames Valley Conservation Authority 93 100 0 100 7 7.9% 0
Upper Thames River Conservation Authority 2,726 2,886 0 2,886 160 5.9% 0
Environmental Action Programs & Reporting 734 851 (116) 735 1 0.1% 0
Garbage, Recycling & Composting 13,283 25,549 (12,020) 13,529 246 1.9% 351
TOTAL ENVIRONMENTAL SERVICES 17,229 29,798 (12,136) 17,662 433 2.5% 351
SERVICE
NET BUDGET ($000’s)2015
Approved
Assessment
Growth
2015 OPERATING BUDGET OVERVIEW

Page 28
2014 Net
Revised
Budget
2015
Expense
2015 Non Tax
Revenue
2015 Net
Approved
Budget
Increase /
(Decrease)
Over 2014 $
Increase /
(Decrease)
Over 2014 %
PARKS, RECREATION & NEIGHBOURHOOD SERVICES
Neighbourhood & Recreation Services 18,538 62,904 (44,098) 18,806 268 1.4% 89
Parks & Urban Forestry 11,183 11,593 (51) 11,542 359 3.2% 207
TOTAL PARKS, RECREATION & NEIGHBOURHOOD SERVICES 29,721 74,497 (44,149) 30,348 627 2.1% 296
PLANNING & DEVELOPMENT
Building Approvals (1,178) 4,310 (5,461) (1,151) 27 2.3% 0
City Planning & Research (Land Use Planning) 3,175 3,501 (300) 3,201 26 0.8% 0
Development Services 3,680 4,670 (919) 3,751 71 1.9% 0
TOTAL PLANNING & DEVELOPMENT 5,677 12,481 (6,680) 5,801 124 2.2% -
PROTECTIVE SERVICES
Animal Services 1,435 2,882 (1,343) 1,539 104 7.2% 0
By-Law Enforcement & Property Standards 1,108 3,051 (1,869) 1,182 74 6.7% 0
Corporate Security & Emergency Management 1,323 1,381 (40) 1,341 18 1.4% 110
Fire Services 55,390 55,844 (177) 55,667 277 0.5% 0
London Police Services 92,477 101,214 (8,048) 93,166 689 0.7% 0
TOTAL PROTECTIVE SERVICES 151,733 164,372 (11,477) 152,895 1,162 0.8% 110
SOCIAL & HEALTH SERVICES
Housing:
Social Housing 12,914 23,333 (10,789) 12,544 (370) (2.9%) 0
London & Middlesex Housing Corporation 7,955 8,541 0 8,541 586 7.4% 0
Long Term Care 4,677 21,345 (16,945) 4,400 (277) (5.9%) 0
Primary Health Care:
Land Ambulance 11,713 12,132 0 12,132 419 3.6% 0
Middlesex-London Health Unit 6,095 6,095 0 6,095 0 0.0% 0
Social & Community Support Services 23,266 141,168 (119,583) 21,585 (1,681) (7.2%) 0
TOTAL SOCIAL & HEALTH SERVICES 66,620 212,614 (147,317) 65,297 (1,323) (2.0%) 0
SERVICE
NET BUDGET ($000’s)2015
Approved
Assessment
Growth
Page 29
2014 Net
Revised
Budget
2015
Expense
2015 Non Tax
Revenue
2015 Net
Approved
Budget
Increase /
(Decrease)
Over 2014 $
Increase /
(Decrease)
Over 2014 %
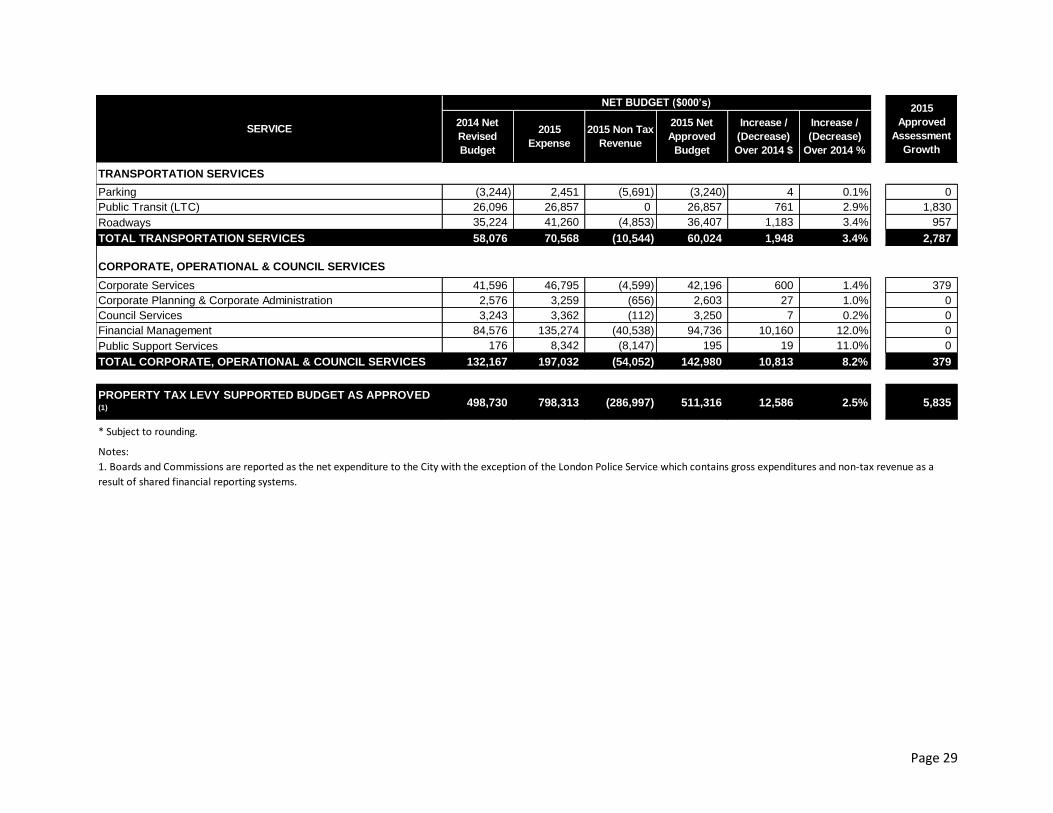
TRANSPORTATION SERVICES
Parking (3,244) 2,451 (5,691) (3,240) 4 0.1% 0
Public Transit (LTC) 26,096 26,857 0 26,857 761 2.9% 1,830
Roadways 35,224 41,260 (4,853) 36,407 1,183 3.4% 957
TOTAL TRANSPORTATION SERVICES 58,076 70,568 (10,544) 60,024 1,948 3.4% 2,787
CORPORATE, OPERATIONAL & COUNCIL SERVICES
Corporate Services 41,596 46,795 (4,599) 42,196 600 1.4% 379
Corporate Planning & Corporate Administration 2,576 3,259 (656) 2,603 27 1.0% 0
Council Services 3,243 3,362 (112) 3,250 7 0.2% 0
Financial Management 84,576 135,274 (40,538) 94,736 10,160 12.0% 0
Public Support Services 176 8,342 (8,147) 195 19 11.0% 0
TOTAL CORPORATE, OPERATIONAL & COUNCIL SERVICES 132,167 197,032 (54,052) 142,980 10,813 8.2% 379
PROPERTY TAX LEVY SUPPORTED BUDGET AS APPROVED (1)
498,730 798,313 (286,997) 511,316 12,586 2.5% 5,835
* Subject to rounding.
SERVICE
NET BUDGET ($000’s)2015
Approved
Assessment
Growth
Notes:
1. Boards and Commissions are reported as the net expenditure to the City with the exception of the London Police Service which contains gross expenditures and non-tax revenue as a
result of shared financial reporting systems.

Page 30

Page 31
Centennial Hall, Arts, Culture and Heritage Advisory and Funding, Museum London, Eldon House
Heritage Services
London Public Library

Page 32
Centennial Hall, 0.4%
Arts, Culture & Heritage Advisory &
Funding, 9.6%
Museum London, 6.9%
Eldon House, 1.1%
Heritage, 0.6%
London Public Library, 81.4%
Page 32
Culture, 4.6% Economic
Prosperity, 2.5%
Environmental Services, 3.5%
Parks, Rec. & Neighbourhood Services, 5.9%
Planning & Development Services, 1.1%
Protective Services, 29.9%
Social & Health Services, 12.8%
Transportation Services, 11.7%
Corporate, Operational &
Council Services, 28.0%
Operating Overview Culture
The City of London’s 2015 Approved Tax Supported Budget for Culture is $23.5 million representing 4.6% of the net property tax supported
budget. Outlined below is a breakdown of the 6 services that make up the City of London’s Culture Program.

Page 33
2015 Approved Budget ($000’s)
2016 – 2018 Multi-Year Budget ($000’s)
NOTE: The 2015 approved budget and the 2016 to 2018 forecast is only reflective of the property tax levy increases from rates and excludes the
impacts of assessment growth costs due to an expanding City.
SERVICE
2014 Net
Revised
Budget
2015
Expense
2015 Non
Tax Revenue
2015 Net
Approved
Budget
Increase /
(Decrease)
Over 2014 $
Increase /
(Decrease)
Over 2014 %
2015
Approved
Assessment
Growth
Centennial Hall 100 747 (642) 105 5 4.6% 0
Arts, Culture & Heritage Advisory & Funding 2,180 2,253 0 2,253 73 3.4% 0
Museum London 1,550 1,614 0 1,614 64 4.1% 0
Eldon House 232 263 0 263 31 13.3% 0
Heritage 157 145 0 145 (12) (7.8%) 0
London Public Library 18,713 19,114 0 19,114 401 2.1% 0
Tax Levy From Rates 22,932 24,136 (642) 23,494 562 2.4% 0
*Subject to rounding.
SERVICE
2016 Net
Budget
Forecast
2017 Net
Budget
Forecast
2018 Net
Budget
Forecast
2016 to 2018
Projected
Increase
2016 to 2018
% Increase
Centennial Hall 126 149 173 68 64.8%
Arts, Culture & Heritage Advisory & Funding 2,264 2,275 2,236 (17) (0.8%)
Museum London 1,718 1,826 1,898 284 17.6%
Eldon House 311 345 356 93 35.4%
Heritage 148 152 154 9 6.2%
London Public Library 19,729 20,201 20,671 1,557 8.1%
Total 24,296 24,948 25,488 1,994 8.5%
Change ($) 802 652 540
Change (%) 3.4% 2.7% 2.2%
*Subject to rounding.
Annual Average Increase: 2.8%

Page 34
Staffing Summary
2014 2015 2016 2017 2018
Centennial Hall 0 0 0 0 0
Arts, Culture & Heritage Advisory & Funding 2 2 2 2 2
Museum London 19 18 19 19 19
Eldon House 2 2 2 2 2
Heritage 2 2 2 2 2
London Public Library 180 180 182 182 182
Total 205 204 207 207 207
2014 2015 2016 2017 2018
Centennial Hall 0.0 0.0 0.0 0.0 0.0
Arts, Culture & Heritage Advisory & Funding 2.0 2.0 2.0 2.0 2.0
Museum London 20.9 20.2 21.2 21.2 21.2
Eldon House 3.6 3.6 4.6 5.1 5.1
Heritage 2.0 2.0 2.0 2.0 2.0
London Public Library 235.0 235.0 237.5 237.5 237.5
Total 263.5 262.8 267.3 267.8 267.8
STAFFING - Full-Time Employees #
STAFFING - Full-Time Equivalents #

Page 35
Key Performance Indicators
Description 2013 2014 2015 2016 2017 2018 Centennial Hall
Number of Events 125 120 120 120 120 120
Attendance 97,900+ 100,000+ 100,000+ 100,000+ 100,000+ 100,000+
Arts, Culture & Heritage Advisory & Funding
Gross Culture Cost – Arts Grants per Capita $3.74 $3.70 $3.66 $3.63 $3.59 $3.55
Gross Culture Cost – Heritage Grants per Capita
$1.59 $1.57 $1.56 $1.54 $1.53 $1.51
Museum London
General Attendance 98,857 101,000 103,000 106,000 110,000 112,000
Program Participation 20,298 22,000 25,000 27,000 29,000 32,000
Eldon House
Attendance 7,000 7,200 7,350 7,500 7,650 8,000
Heritage
Number of Additional Properties Designated Under Part IV of the Ontario Heritage Act
3 4 4 4 4 4
Number of Heritage Conservation District Plans Completed
2 2 1 3 1 1
London Public Library
Number Of Visits: In-person & Website (000’s)
7,614 7,650 7,727 7,881 8,117 8,361
Overall Customer Satisfaction (1) 97.9% 98.2% 98.3%
Operating Cost Per Use $1.32 $1.32 $1.33 $1.33 $1.34 $1.34 Note: 1) Customer Survey to be done every two years.

Page 36
Centennial Hall Operating Highlights 2015 Budget Highlights
Centennial Hall approved budget increase of $5 thousand or 4.6%. Rising utility costs and increases in purchased services for contractual
obligations are partially offset by anticipated increases in user fee revenue based on current trends. To help mitigate budgetary
pressures Centennial Hall will continue to build relationships with dance groups and concert promoters, while trying to grow wedding
events.
Arts, Culture and Heritage Advisory & Funding Operating Highlights 2015 Budget Highlights
Arts, Culture and Heritage Advisory & Funding approved budget increase of $73 thousand or 3.4% primarily due to increased funding to
support the London Celebrates Canada campaign as well as increased costs for public art maintenance, restoration needs and condition
studies.
The Culture Office will continue to promote public art in London while ensuring existing public art is properly maintained.
Museum London Operating Highlights 2015 Budget Highlights
Museum London approved budget increase of $64 thousand or 4.1% relates to the continued challenges associated with rising utility
rates well above the rate of inflation and cost increases in marketing and collection management expenses related to art acquisition
along with stagnant sponsorship and fundraising revenues. To mitigate the budget increase, Museum London eliminated funding for the
vacant Head of Development position.
Eldon House Operating Highlights 2015 Budget Highlights
The Eldon House approved budget increase of $31 thousand or 13.3% is primarily attributable to personnel cost increases due to
contractual obligations, funding for additional equipment rentals for payment processing, and increased advertising expenses partially
offset by increases in revenues. Eldon House will continue to focus on building awareness of the heritage property to promote revenue
generation.

Page 37
Heritage Operating Highlights
2015 Budget Highlights
Heritage approved budget a decrease of $12 thousand or 7.8% due to lower personnel costs required in 2015 because the 2014 budget
included an estimated cost for future hiring (Council approved one position to support the City’s heritage programs and policies in 2014).
London Public Library Operating Highlights
2015 Budget Highlights
As a high use, low cost service provider, the Library will continue to maintain existing service levels with an increase of $401 thousand or
2.1%. The increase is primarily attributable to personnel contractual obligations and increased budgetary pressures on utilities.
A continued effort on energy conservation and implementing actions that are aligned with the Library’s 2014-2017 Strategic Plan will
continue in 2015.
The Library’s additional investment business case for the Central Library Revitalization of $2 million was approved by Council. As a result
of this approval the Library will undertake several activities aimed at realizing the revitalization goals in 2015.

Page 38
Capital Overview
The City of London’s capital plan for Culture Services is $4.9 Million in 2015 and $26.0 Million from 2015 to 2024, which represents 1.5% of the
overall ten year capital plan. Outlined below is a breakdown of the major capital works schedule over the next ten years of the Culture program.
Revised Approved Forecast Forecast Forecast Forecast Forecast
2014 2015 2016 2017 2018 2019 2020-2024
Classification
Lifecycle 1,548 4,867 1,737 1,747 1,567 1,577 7,855
Growth - - - - 3,330 3,330 -
Service Improvements - - - - - - -
Total 1,548 4,867 1,737 1,747 4,897 4,907 7,855
Source of Financing
Capital Levy 1,057 2,177 1,067 1,077 1,067 1,077 5,355
Reserve Funds 408 670 670 670 500 500 2,500
Debt - 2,020 - - 929 2,113 -
Other 83 - - - 2,401 1,217
Total 1,548 4,867 1,737 1,747 4,897 4,907 7,855
Lifecycle Renewal
Growth
Service Improvement

Page 39
Major Capital Works in Ten Year Plan 2015- 2024 ($000's) 2015 2016-2024
Cultural Services - Lifecycle
GG1841-15 Museum London Repairs 1,450 3,100
TS6186-15 Centennial Hall Repairs 180 1,620
Total Cultural Services - Lifecycle 1,630 4,720
Total Cultural Services 1,630 4,720
Heritage - Lifecycle
PD2154 Heritage Conservation 75 675
PD2324-15 Municipally Owned Heritage Buildings 472 4,248
Total Heritage - Lifecycle 547 4,923
Total Heritage 547 4,923
Libraries - Lifecycle
RC3341 Integrated Library System 200 2,150
RC3533 Branch Facilities Maintenance 50 450
RC3536 Central Library Revitilization 2,020
RC3540 Facility Renewal Plan 420 2,240
Total Cultural Services - Lifecycle 2,690 4,840
Libraries - Growth
RC3464 Northwest Branch Library 3,330
RC3466 Southeast Branch Library 3,330
Total Libraries - Growth - 6,660
Total Libraries 2,690 11,500
TOTAL CULTURAL SERVICES 4,867 21,143
Culture Major Projects
Municipally Owned
Heritage Building
Lifecycle renewal
Program ($4.7
million)
Museum London
Lifecycle Program
($4.5 Million)
Central Library
Revitalization ($2.0
Million)
Northwest Branch
Library – 2019 ($3.3
Million)
Southeast Branch
Library - 2018
($3.3 Million)

Page 40
Business Attraction & Retention, Community Improvement/BIA, London Convention Centre, Tourism London and Covent Garden Market
Page 41
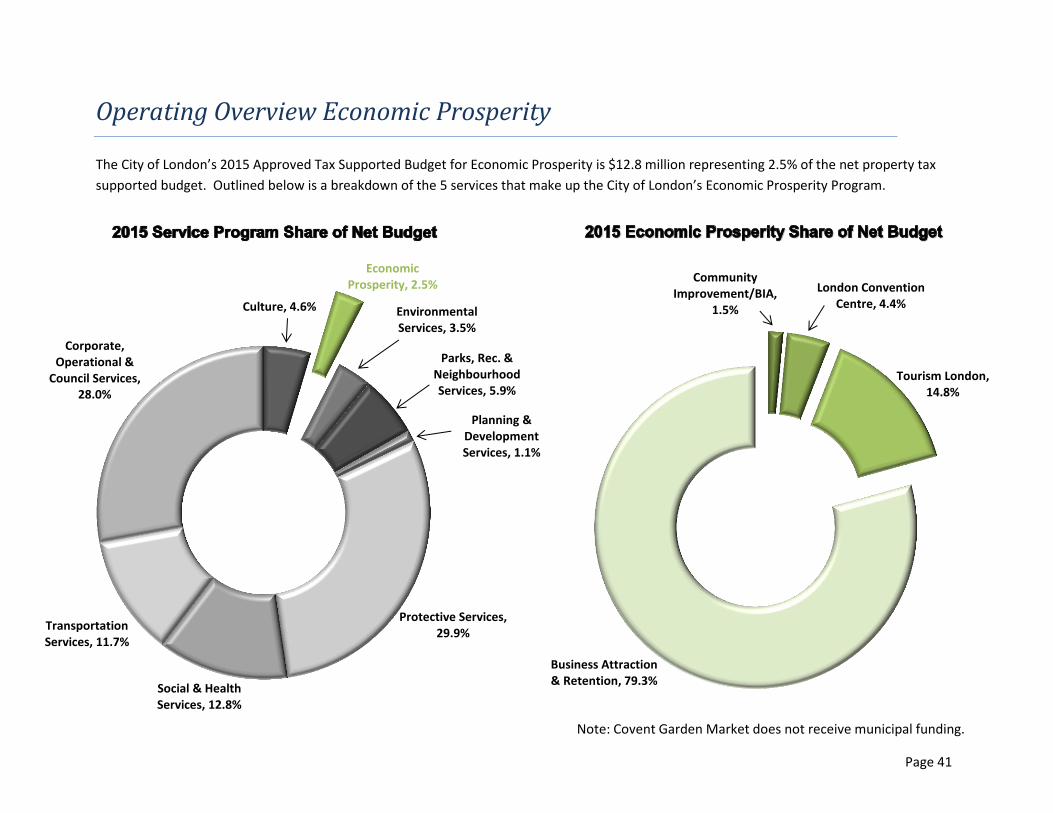
Business Attraction & Retention, 79.3%
Community Improvement/BIA,
1.5%
London Convention Centre, 4.4%
Tourism London, 14.8%
Note: Covent Garden Market does not receive municipal funding.
Page 41
Culture, 4.6%
Economic Prosperity, 2.5%
Environmental Services, 3.5%
Parks, Rec. & Neighbourhood Services, 5.9%
Planning & Development Services, 1.1%
Protective Services, 29.9%
Social & Health Services, 12.8%
Transportation Services, 11.7%
Corporate, Operational &
Council Services, 28.0%
Operating Overview Economic Prosperity
The City of London’s 2015 Approved Tax Supported Budget for Economic Prosperity is $12.8 million representing 2.5% of the net property tax
supported budget. Outlined below is a breakdown of the 5 services that make up the City of London’s Economic Prosperity Program.

Page 42
2015 Approved Budget ($000’s)
2016 – 2018 Multi-Year Budget ($000’s)
NOTE: The 2015 approved budget and the 2016 to 2018 forecast is only reflective of the property tax levy increases from rates and excludes the
impacts of assessment growth costs due to an expanding City.
SERVICE
2014 Net
Revised
Budget
2015
Expense
2015 Non
Tax Revenue
2015 Net
Approved
Budget
Increase /
(Decrease)
Over 2014 $
Increase /
(Decrease)
Over 2014 %
2015
Approved
Assessment
Growth
Business Attraction & Retention 11,954 10,159 0 10,159 (1,795) (15.0%) 1,912
Community Improvement / BIA 188 195 0 195 7 3.5% 0
London Convention Centre 569 569 0 569 0 0.0% 0
Tourism London 1,864 1,892 0 1,892 28 1.5% 0
Covent Garden Market 0 0 0 0 0 0.0% 0
Tax Levy From Rates 14,575 12,815 0 12,815 (1,760) (12.1%) 1,912
*Subject to rounding.
SERVICE
2016 Net
Budget
Forecast
2017 Net
Budget
Forecast
2018 Net
Budget
Forecast
2016 to 2018
Projected
Increase
2016 to 2018
% Increase
Business Attraction & Retention 10,210 10,262 10,315 156 1.5%
Community Improvement / BIA 200 203 205 10 5.1%
London Convention Centre 569 569 569 0 0.0%
Tourism London 1,936 1,980 2,026 134 7.1%
Covent Garden Market 0 0 0 0 0.0%
Total 12,915 13,014 13,115 300 2.3%
Change ($) 100 99 101
Change (%) 0.8% 0.8% 0.8%
*Subject to rounding.
Annual Average Increase: 0.8%

Page 43
Staffing Summary
2014 2015 2016 2017 2018
Business Attraction & Retention 43 43 43 43 43
Community Improvement / BIA 1 1 1 1 1
London Convention Centre 36 35 34 36 36
Tourism London 13 13 13 13 13
Covent Garden Market 5 5 5 5 5
Total 98 97 96 98 98
2014 2015 2016 2017 2018
Business Attraction & Retention 45.0 45.0 45.0 45.0 45.0
Community Improvement / BIA 1.0 1.0 1.0 1.0 1.0
London Convention Centre 54.0 53.0 52.0 54.0 54.0
Tourism London 14.5 14.5 14.5 14.5 14.5
Covent Garden Market 5.3 5.3 5.3 5.3 5.3
Total 119.8 118.8 117.8 119.8 119.8
STAFFING - Full-Time Employees #
STAFFING - Full-Time Equivalents #

Page 44
Key Performance Indicators
Description 2013 2014 2015 2016 2017 2018 Business Attraction and Retention
New Job Creation Through Attraction and Expansions
1,200 1,200 1,200 1,200 1,200 1,200
Attraction of New Foreign Direct Investment and Investment in Local Businesses Through Expansions
$110M $120M $120M $120M $120M $120M
London Convention Centre
Total Direct Economic Impact $15.5M $19M $18M $15M* $20M $20M
Operational Surplus $4,000 $152,513 $14,474 ($226,642)* $210,035 $233,281
Tourism London
Economic Impact $630M $630M $630M $630M $630M $630M
* Assuming first floor London Convention Centre renovation completed in 2016

Page 45
Business Attraction & Retention Operating Highlights 2015 Budget Highlights
Business Attraction & Retention approved budget a decrease of $1.8 million or 15% (reduction to the Economic Development reserve
fund related to the Industrial Land Development Strategy). As part of the approved budget, $6.9 million will be contributed to the
Economic Development Reserve Fund that will be used to fund investments that best accelerate London’s economy and foster private
sector investment in the City.
Resulting from the December 18, 2012 “A Path to Prosperity” report, Civic Administration identified five proposals best suited to meet
the goals and objectives of London’s Prosperity Plan. The proposals included: the Industrial Land Strategy, Redevelopment of 111
Horton Street, Mixed Use Development Including a Performing Arts Centre, London Medical Innovation and Commercialization Network
(LMICN) and the Employment Program Support.
The following is intended to serve as a status update associated with each proposal:
The Industrial Land Strategy: in process - ILDS annual monitoring and pricing report presented March 2015.
Redevelopment of 111 Horton Street: in process - constraint and gap identification.
Mixed Use Development Including a Performing Arts Centre: on March 10, 2015 Municipal Council decided to take no further
action on the Celebration Centre proposal and referred the matter of exploring the potential for a future performing arts to the
multi-year budget discussion in order to permit the Municipal Council to further review this matter in the context of overall
budgetary considerations.
London Medical Innovation and Commercialization Network (LMICN): the City invested $10M towards the London Medical
Innovation and Commercialization (LMICN) initiative; the grant is intended to serve as a catalyst to activate the Network, and is
required to be applied to capital and equipment costs. It being noted that, Western submitted a proposal to FedDev for
additional funding in January 2015.
The Employment Program Support: the Employment Program Support has successfully received a second year of funding for the
fiscal year 2014/2015, noting that any future and /or additional funding in this matter will be considered through the Strategic
Funding Framework.
In 2014, Council endorsed six recommendations which resulted from the “Economic Development Review” report completed by
KPMG. As a result, staff will continue the implementation of the identified recommendations in 2015, which include the development of
a community economic strategy and enhanced coordination and reporting between City funded economic organizations.

Page 46
Community Improvement/BIA Operating Highlights
2015 Budget Highlights
Community Improvement/BIA approved budget an increase of $7 thousand or 3.5% due to increases associated with personnel
contractual obligations.
In 2015, the service area will focus on being more proactive in supporting infill and intensification, consistent with the intentions of the
London Plan.
London Convention Centre Operating Highlights 2015 Budget Highlights
The City’s annual contribution to the LCC remains unchanged from 2014. The City funds allocated to the LCC are directed to the LCC
Facilities Reserve Fund to help pay for life cycle replacement projects.
The LCC additional investment business case for the reconfiguration of the LCC main level was approved by Council. As a result of this
approval LCC will undertake several activities aimed at realizing the reconfiguration goals in 2015.
Tourism London Operating Highlights 2015 Budget Highlights
With the approved increase of $28 thousand or 1.5%, Tourism London will be able to maintain existing service levels. The increase is
primarily due to cost increases related to utilities, telephone charges, bank service charges, and building and property maintenance. In
order to ensure all Tourism London properties are adequately maintained, a building condition assessment will be conducted.
Covent Garden Market Operating Highlights 2015 Budget Highlights
With no City funding, the Covent Garden Market will continue to provide a unique shopping and gathering place, with tenants offering
fresh, local products.

Page 47
Capital Overview
The City of London’s capital plan for Economic Prosperity is $12.4 Million in 2015 and $108.2 Million from 2015 to 2024, which represents 6.2 %
of the overall ten year capital plan. Outlined below is a breakdown of the major capital works schedule over the next ten years of the Economic
Prosperity Program.
Revised Approved Forecast Forecast Forecast Forecast Forecast
2014 2015 2016 2017 2018 2019 2020-2024
Classification
Lifecycle 1,155 2,662 187 1,116 1,033 221 5,101
Growth - 1,255 5,000 5,000 - - -
Service Improvements 14,306 8,488 12,106 8,106 11,106 11,675 35,190
Total 15,461 12,405 17,293 14,222 12,139 11,896 40,291
Source of Financing
Capital Levy -
Reserve Funds 11,044 5,843 5,872 5,468 6,385 7,096 30,691
Debt - 1,965 - - -
Other 4,417 4,597 11,421 8,754 5,754 4,800 9,600
Total 15,461 12,405 17,293 14,222 12,139 11,896 40,291
Lifecycle Renewal
Growth
Service Improvement

Page 48
Major Capital Works in Ten Year Plan 2015- 2024 ($000's) 2015 2016-2024
Economic Development - Lifecycle
GG1765-15 Convention Centre Repairs 697 7,657
GG1770 Reconfiguration of Main Level at London Convention Centre 1,965
Total Economic Development - Lifecycle 2,662 7,657
Economic Prosperity - Growth
TS1308 Hwy 401 Interchange Projects 1,255 10,000
Total Economic Prosperity - Growth 1,255 10,000
Economic Prosperity - Service Improvement
GG1725 London Music Industry 150
ID1145 Future Industrial Land purchase 2,400
ID1150 ILDS Internal Servicing 4,600 55,400
ID1168 Innovation Park 850
ID1265 Skyway Industrial Park - Phase II Assumption 1,500
ID2169 ILDS - External Transportation Servicing 413 3,609
GG1721-6 New Economy-Fanshawe College 1,575 7,175
GG1721-8 Fanshawe College-Kingsmills 900 8,100
Total Economic Prosperity - Service Improvement 8,488 78,184
TOTAL ECONOMIC PROSPERITY 12,405 95,841
Economic Prosperity Major
Projects
Convention Centre
Lifecycle Renewal
Program ($8.4 Million)
Economic Stimulus
Capacity Reinvestment
- 401 Interchanges
($11.3 Million)
New Economy –
Fanshawe College
($8.8 Million)
New Economy –
Fanshawe College-
Kingsmills ($9.0
Million)
Industrial Land
Acquisition, Servicing
and Development
($68.8 Million)

Page 49
Kettle Creek Conservation Authority, Lower Thames Valley Conservation Authority, Upper Thames River Conservation Authority
Environmental Action Programs & Reporting
Recycling & Composting, Garbage Collection & Disposal

Page 50
KCCA, 2.3% LTVCA, 0.6%
UTRCA, 16.3%
Environmental Action Programs &
Reporting, 4.2%
Garbage, Recycling & Compositing,
76.6%
Page 50
Culture, 4.6%
Economic Prosperity, 2.5%
Environmental Services, 3.5%
Parks, Rec. & Neighbourhood Services, 5.9%
Planning & Development Services, 1.1%
Protective Services, 29.9%
Social & Health Services, 12.8%
Transportation Services, 11.7%
Corporate, Operational &
Council Services, 28.0%
Operating Overview Environmental Services
The City of London’s 2015 Approved Tax Supported Budget for Environmental Services is $17.7 million representing 3.5% of the net property tax
supported budget. Outlined below is a breakdown of the 5 services that make up the City of London’s Environmental Services Program.

Page 51
2015 Approved Budget ($000’s)
2016 – 2018 Multi-Year Budget ($000’s)
NOTE: The 2015 approved budget and the 2016 to 2018 forecast is only reflective of the property tax levy increases from rates and excludes the
impacts of assessment growth costs due to an expanding City.
SERVICE
2014 Net
Revised
Budget
2015
Expense
2015 Non
Tax Revenue
2015 Net
Approved
Budget
Increase /
(Decrease)
Over 2014 $
Increase /
(Decrease)
Over 2014 %
2015
Approved
Assessment
Growth
Kettle Creek Conservation Authority 393 412 0 412 19 4.9% 0
Lower Thames Valley Cons. Authority 93 100 0 100 7 7.9% 0
Upper Thames River Cons. Authority 2,726 2,886 0 2,886 160 5.9% 0
Environmental Action Programs & Reporting 734 851 (116) 735 1 0.1% 0
Garbage, Recycling & Composting 13,283 25,549 (12,020) 13,529 246 1.9% 351
Tax Levy From Rates 17,229 29,798 (12,136) 17,662 433 2.5% 351
*Subject to rounding.
SERVICE
2016 Net
Budget
Forecast
2017 Net
Budget
Forecast
2018 Net
Budget
Forecast
2016 to 2018
Projected
Increase
2016 to 2018
% Increase
Kettle Creek Conservation Authority 426 441 456 44 10.7%
Lower Thames Valley Cons. Authority 110 116 122 22 22.0%
Upper Thames River Cons. Authority 3,031 3,193 3,353 467 16.2%
Environmental Action Programs & Reporting 738 742 745 10 1.4%
Garbage, Recycling & Composting 13,779 14,563 14,758 1,229 9.1%
Total 18,084 19,055 19,434 1,772 10.0%
Change ($) 422 971 379
Change (%) 2.4% 5.4% 2.0%
*Subject to rounding.
Annual Average Increase: 3.2%
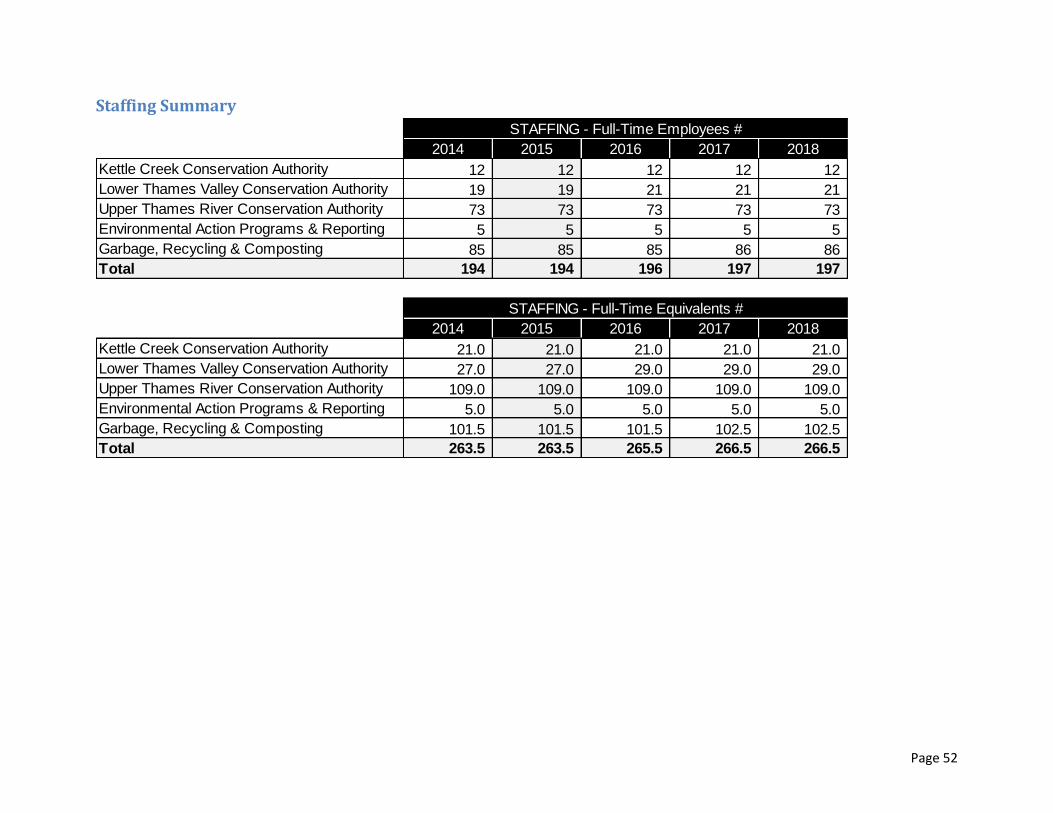
Page 52
Staffing Summary
2014 2015 2016 2017 2018
Kettle Creek Conservation Authority 12 12 12 12 12
Lower Thames Valley Conservation Authority 19 19 21 21 21
Upper Thames River Conservation Authority 73 73 73 73 73
Environmental Action Programs & Reporting 5 5 5 5 5
Garbage, Recycling & Composting 85 85 85 86 86
Total 194 194 196 197 197
2014 2015 2016 2017 2018
Kettle Creek Conservation Authority 21.0 21.0 21.0 21.0 21.0
Lower Thames Valley Conservation Authority 27.0 27.0 29.0 29.0 29.0
Upper Thames River Conservation Authority 109.0 109.0 109.0 109.0 109.0
Environmental Action Programs & Reporting 5.0 5.0 5.0 5.0 5.0
Garbage, Recycling & Composting 101.5 101.5 101.5 102.5 102.5
Total 263.5 263.5 265.5 266.5 266.5
STAFFING - Full-Time Employees #
STAFFING - Full-Time Equivalents #

Page 53
Key Performance Indicators
Description 2013 2014 2015 2016 2017 2018 Kettle Creek Conservation Authority
Number of Trees Planted 100,000 40,000 40,000 40,000 40,000 40,000
Maintain or Improve on Overall Watershed Benchmark Grade of “C”
C C C+ C+ C+ C+
Lower Thames Valley Conservation Authority
Increased Reliability in all Aspects of Flood Control Infrastructure – Eliminate Equipment Malfunctions
2 incidents
(better than
target by 2)
1 incident
0 0 0 0
Avoid Damage to Life and Property in Flood Prone Areas
$0 in property damage, no lives
lost
$0 in property damage, no lives
lost
$0 in property damage, no lives
lost
$0 in property damage, no lives
lost
$0 in property damage, no lives
lost
$0 in property damage, no lives
lost
Upper Thames River Conservation Authority
Hectares of Land Actively Managed 11,600 11,800 12,000 12,200 12,400 12,600
Number of Conservation Projects 456 463 470 475 480 490
Environmental Action Programs & Reporting
Number of Stakeholder Groups/Organizations Engaged
40 40 42 44 46 48
Number of Community Based Outreach Events 25 26 27 28 29 30
Community GHG (Greenhouse Gases) Emissions use per Capita (tonnes/person)
8.3 8.0 7.8 7.6 7.4 7.2
Garbage Recycling & Composting
Material Diverted (tonnes) 69,000 69,500 70,000 70,400 70,800 71,200
Net Operating Cost ($/household) $73 $78 $79 $79 $79 $79
Diversion Rate 44% 44% 45% 45% 45% 45%

Page 54
Conservation Authorities Operating Highlights 2015 Budget Highlights
The Conservation Authorities approved budget increase is $186 thousand or 5.8%. The increase is primarily in the UTRCA due to a
decrease in government grants and direct revenues for soil conservation and Source Water Protection projects completed in 2014 that
will not carry over to 2015. This loss of funding is partially offset by a reduction in materials and supplies and capital contracts.
Environmental Action Programs & Reporting Operating Highlights 2015 Budget Highlights
Environmental Action Programs & Reporting budget was approved with a small increase of $1 thousand or 0.1% due to inflationary
budgetary pressures being offset by operational cost containment. In 2015, staff will be implementing the actions identified in the
Community Energy Action Plan. In addition, as the short-term Active Transportation (AT) and Transportation Demand Management
(TDM) Action Plan nears its conclusions, development of the longer-term Comprehensive AT and TDM Action Plan that complements
Complete Streets and supports the active transportation aspects of The London Plan will begin.
Garbage, Recycling & Composting Operating Highlights 2015 Budget Highlights
A budget reduction to Recycling and Composting of $334 thousand or 7.5% is primarily due to increased processing fee and recycling
revenues, due to increased commodity prices and volumes partially offset by contractual obligations and personnel costs.
A budget increase to Garbage Collection and Disposal of $580 thousand or 6.6% is primarily due to reduced revenue from lower
quantities of business garbage and container charges and increases in operational expenditures.

Page 55
Capital Overview
The City of London’s capital plan for Environmental Services is $0.8 Million in 2015 and $70.6 Million from 2015 to 2024, which represents 4.0 %
of the overall ten year capital plan. Outlined below is a breakdown of the major capital works schedule over the next ten years of the
Environmental Services Program.
Revised Approved Forecast Forecast Forecast Forecast Forecast
2014 2015 2016 2017 2018 2019 2020-2024
Classification
Lifecycle 2,518 815 3,885 1,175 385 3,425 6,935
Growth - - - - - - -
Service Improvements - - - - - 500 53,500
Total 2,518 815 3,885 1,175 385 3,925 60,435
Source of Financing
Capital Levy -
Reserve Funds 1,900 200 200 - 16,523
Debt - - - - 12,000
Other 618 815 3,685 975 385 3,925 31,912
Total 2,518 815 3,885 1,175 385 3,925 60,435
Lifecycle Renewal
Growth
Service Improvement

Page 56
Major Capital Works in Ten Year Plan 2015- 2024 ($000's) 2015 2016-2024
Environmental Services - Lifecycle
SW6025 Waste Diversion 240
SW6051 Municipal Waste Study 400
SW6530 Material Recovery Facility 790
SW6014-15 W12A Ancillary 300 1,950
SW6021-15 W12A New Cell Construction 100 9,700
SW6040-15 Landfill Gas Collection 340 2,050
SW6087-15 Closed Landfill Management 75 675
Total Environmental Services - Lifecycle 815 15,805
Environmental Services - Service Improvement
SW6050 New & Emerging Solid Waste Technologies 35,000
SW6080 Long Term Disposal Capacity 19,000
Total Environmental Services - Service Improvement - 54,000
TOTAL ENVIRONMENTAL SERVICES 815 69,805
Environment Services
Major Projects
Landfill Gas
Collection ($2.4
Million)
New & Emerging
Solid Waste
Technologies ($35
Million)
W12A New Cell
Construction ($9.8
Million)
Long Term Disposal
Capacity ($19
Million)

Page 57
Aquatics, Arenas, Children’s Services, Community Centres, Community Development & Funding, Community Recreation & Leisure Programming, Golf, Special Events Coordination, Sports Services, Storybook Gardens, Recreation Administration
Parks & Horticulture, Parks & Natural Areas Planning & Design, Urban Forestry
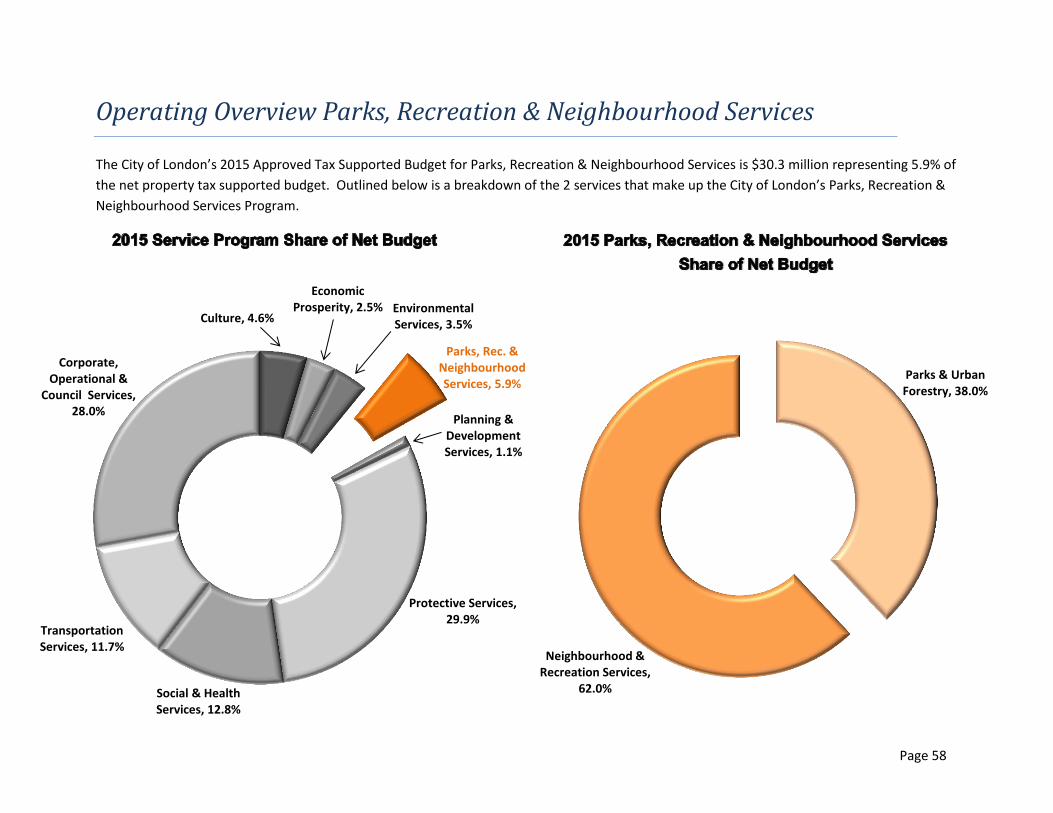
Page 58
Parks & Urban Forestry, 38.0%
Neighbourhood & Recreation Services,
62.0%
Page 58
Culture, 4.6%
Economic Prosperity, 2.5% Environmental
Services, 3.5%
Parks, Rec. & Neighbourhood Services, 5.9%
Planning & Development Services, 1.1%
Protective Services, 29.9%
Social & Health Services, 12.8%
Transportation Services, 11.7%
Corporate, Operational &
Council Services, 28.0%
Operating Overview Parks, Recreation & Neighbourhood Services
The City of London’s 2015 Approved Tax Supported Budget for Parks, Recreation & Neighbourhood Services is $30.3 million representing 5.9% of
the net property tax supported budget. Outlined below is a breakdown of the 2 services that make up the City of London’s Parks, Recreation &
Neighbourhood Services Program.

Page 59
2015 Approved Budget ($000’s)
2016 – 2018 Multi-Year Budget ($000’s)
NOTE: The 2015 approved budget and the 2016 to 2018 forecast is only reflective of the property tax levy increases from rates and excludes the
impacts of assessment growth costs due to an expanding City.
SERVICE
2014 Net
Revised
Budget
2015
Expense
2015 Non
Tax Revenue
2015 Net
Approved
Budget
Increase /
(Decrease)
Over 2014 $
Increase /
(Decrease)
Over 2014 %
2015
Approved
Assessment
Growth
Neighbourhood & Recreation Services 18,538 62,904 (44,098) 18,806 268 1.4% 89
Parks & Urban Forestry 11,183 11,593 (51) 11,542 359 3.2% 207
Tax Levy From Rates 29,721 74,497 (44,149) 30,348 627 2.1% 296
*Subject to rounding.
SERVICE
2016 Net
Budget
Forecast
2017 Net
Budget
Forecast
2018 Net
Budget
Forecast
2016 to 2018
Projected
Increase
2016 to 2018
% Increase
Neighbourhood & Recreation Services 19,183 19,399 19,672 866 4.6%
Parks & Urban Forestry 11,676 11,799 11,922 380 3.3%
Total 30,859 31,198 31,594 1,246 4.1%
Change ($) 511 339 396
Change (%) 1.7% 1.1% 1.3%
*Subject to rounding.
Annual Average Increase: 1.4%

Page 60
Staffing Summary
2014 2015 2016 2017 2018
Neighbourhood & Recreation Services 86 87 88 88 88
Parks & Urban Forestry 33 35 35 35 35
Total 119 122 123 123 123
2014 2015 2016 2017 2018
Neighbourhood & Recreation Services 387.4 392.0 393.0 393.0 418.0
Parks & Urban Forestry 105.4 107.8 107.8 107.8 107.8
Total 492.8 499.8 500.8 500.8 525.8
STAFFING - Full-Time Equivalents #
STAFFING - Full-Time Employees #

Page 61
Key Performance Indicators
Description 2013 2014 2015 2016 2017 2018 Aquatics
Respondents Satisfied With Their Aquatic Experience
95% 97% 97% 97% 97% 97%
Children’s Services
Average Monthly Fee Subsidy Caseload 2,851 2,700 2,700 2,700 2,700 2,700
Fee Subsidy Wait List (At Year End) 705 450 400 400 400 400
Community Centres
Number of Annual Visits 2,015,975 2,036,134 2,056,496 2,077,060 2,097,831 2,118,809
Community Development & Funding
Total Funding Allocated to Community $2.5M $2.67M $2.59M $2.63M $2.67M $2.71M
Community Recreation & Leisure
Number of Participants Registered in Recreation Programs
26,952 27,000 27,000 27,000 27,000 27,000
Golf
Revenue per Round $30.00 $30.50 $31.10 $31.80 $32.00 $32.00
Parks & Horticulture
Cost / Hectare – Parks & Natural Areas $4,100 $4,200 $4,300 $4,400 $4,500 $4,600
Urban Forestry
Trees Planted 2,400 2,400 3,000 3,000 3,000 3,000
Ash Trees Injected 384 200 384 200 384 200

Page 62
Neighbourhood & Recreation Services Operating Highlights
2015 Budget Highlights
Neighbourhood & Recreation Services approved budget increase of $268 thousand or 1.4%. The increase is primarily due to personnel
contractual obligations and the impacts of the 7.3% increase in the minimum wage that became effective June 2014, partially offset by
modest increases to user fees. In addition, a service adjustment of $82 thousand has been included in the budget for an Age Friendly
Coordinator position to support the Age Friendly initiatives and implementation of the Age Friendly London Action Plan. It should be
noted that additional investments for Municipal Grant Requests have been submitted. The requested funding is not recommended by
Civic Administration and is not included in the 2015 base budget request or forecast.
Municipal golf, following a down turn in the economy in 2008 has returned to a financially viable operation. In recent years, revenue has
exceeded expenses while the operation has been revised to reduce costs while increasing the quality of the experience. Participation
has increased and annual contributions to capital reserves for reinvestment in the golf courses and facilities are now being made.
Parks & Urban Forestry
2015 Budget Highlights
Parks & Urban Forestry approved budget increase of $359 thousand or 3.2% primarily due to personnel contractual obligations,
increases in purchased services related to office rental costs, higher Upper Thames River Conservation Authority contract costs (includes
additional hectares being managed) and new initiative funding for the Urban Forestry Strategy .

Page 63
Capital Overview
The City of London’s capital plan for Parks, Recreation and Neighbourhood Services is $21.8 Million in 2015 and $179.6 Million from 2015 to
2024, which represents 10.2 % of the overall ten year capital plan. Outlined below is a breakdown of the major capital works schedule over the
next ten years of the Parks, Recreation and Neighbourhood Services Program.
Revised Approved Forecast Forecast Forecast Forecast Forecast
2014 2015 2016 2017 2018 2019 2020-2024
Classification
Lifecycle 7,730 7,615 9,009 8,584 8,681 8,753 46,180
Growth 19,423 13,692 14,133 12,329 19,430 5,340 16,730
Service Improvements 629 480 500 575 3,050 525 4,000
Total 27,782 21,787 23,642 21,488 31,161 14,618 66,910
Source of Financing
Capital Levy 6,137 4,681 5,956 8,383 7,532 8,898 46,201
Reserve Funds 1,736 3,149 50 50 - 1,356
Debt 12,286 9,486 12,594 8,032 17,789 1,839 6,607
Other 7,623 4,471 5,042 5,023 5,840 3,881 12,746
Total 27,782 21,787 23,642 21,488 31,161 14,618 66,910
Lifecycle Renewal
Growth
Service Improvement

Page 64
Major Capital Works in Ten Year Plan 2015- 2024 ($000's) 2015 2016-2024
Neighbourhood & Recreation - Lifecycle
RC2445 Senior Centres Lifecycle Repairs 620 1,440
Update Security Systems and Customer Service Systems 200 660
RC2201-15 Recreation Facilities Lifecycle Repairs 3,119 31,978
RC2881-15 Golf Courses Lifecycle Program 150 1,725
Total Neighbourhood & Recreation - Lifecycle 4,089 35,803
Neighbourhood & Recreation - Growth
RC2756 East Multi Purpose Rec Centre Aquatics Anchored 10,416 6,376
RC2758 Southeast Multi Purpose Rec Centre Arena Anchored 23,989
Other Neighbourhood & Recreation Growth 400 1,900
Total Neighbourhood & Recreation - Growth 10,816 32,265
Neighbourhood & Recreation - Service Improvement
Farquharson, Glen Cairn and Silverwoods Arena Improvements 4,900
Total Neighbourhood & Recreation - Service Improvement - 4,900
Total Neighbourhood & Recreation 14,905 72,968
Parks & Urban Forestry - Lifecycle
Maintain District, Neighbourhood and Urban Parks 1,020 16,180
Downtown and Street Tree Planting Program 636 5,724
PD2063-15 Maintain Open Space Network 270 3,850
PD2135-15 Maintain Thames Valley Pathway 300 2,150
PD2173-15 Maintain Sportspark 1,350
PD2243-15 Maintain Environmentally Significant Areas 350 1,800
PD2754-15 Woodlot Management 150 900
RC2464-15 Multi-Use Park Pathway Lifecycle 300 3,350
RC2749-15 Park Facilities Major Upgrades 150 6,000
TS3093-15 Parks Major Upgrades 350 4,100
Total Parks & Urban Forestry - Lifecycle 3,526 45,404
Parks & Urban Forestry - Growth
Various New Parks 2,875 35,697
Total Parks & Urban Forestry - Growth 2,875 35,697
Parks & Urban Forestry - Service Improvement
PD1142 Enhanced Veterans Memorial Parkway 80 150
PD2044 Management of Emerald Ash 400 3,600
Total Parks & Urban Forestry - Service Improvement 480 3,750
Total Parks & Urban Forestry 6,881 84,851
TOTAL PARKS, RECREATION & NEIGHBOURHOOD SERVICES 21,786 157,819
Parks, Recreation &
Neighbourhood Services Major
Projects
New East Multi-purpose
Recreation Centre –Aquatics
($16.8 Million)
New Southeast Multi-purpose
Rec Centre-Arena ($24 million)
Recreation Facilities Lifecycle
Renewal Program ($35.1
Million)
Various Tree Planting and
Woodland Management
Programs ( $11.6 Million)
Various New Parks Program
($38.6 Million)
Arena Service Improvements
(Farquharson, Glen Cairn and
Silverwoods) ($4.9 Million)
Page 65
Building Approvals Land Use Planning
; Development Services

Page 66
Building Approvals, (19.8)%
City Planning & Research, 55.2%
Development Services, 64.6%
Page 66
Culture, 4.6%
Economic Prosperity, 2.5% Environmental
Services, 3.5%
Parks, Rec. & Neighbourhood Services, 5.9%
Planning & Development Services, 1.1%
Protective Services, 29.9%
Social & Health Services, 12.8%
Transportation Services, 11.7%
Corporate, Operational &
Council Services, 28.0%
Operating Overview Planning & Development Services
The City of London’s 2015 Approved Tax Supported Budget for Planning & Development Services is $5.8 million representing 1.1% of the net
property tax supported budget. Outlined below is a breakdown of the 3 services that make up the City of London’s Planning & Development
Program.

Page 67
2015 Approved Budget ($000’s)
2016 – 2018 Multi-Year Budget ($000’s)
NOTE: The 2015 approved budget and the 2016 to 2018 forecast is only reflective of the property tax levy increases from rates and excludes the
impacts of assessment growth costs due to an expanding City.
SERVICE
2014 Net
Revised
Budget
2015
Expense
2015 Non
Tax Revenue
2015 Net
Approved
Budget
Increase /
(Decrease)
Over 2014 $
Increase /
(Decrease)
Over 2014 %
2015
Approved
Assessment
Growth
Building Approvals (1,178) 4,310 (5,461) (1,151) 27 2.3% 0
City Planning & Research (Land Use Planning) 3,175 3,501 (300) 3,201 26 0.8% 0
Development Services 3,680 4,670 (919) 3,751 71 1.9% 0
Tax Levy From Rates 5,677 12,481 (6,680) 5,801 124 2.2% 0
*Subject to rounding.
SERVICE
2016 Net
Budget
Forecast
2017 Net
Budget
Forecast
2018 Net
Budget
Forecast
2016 to 2018
Projected
Increase
2016 to 2018
% Increase
Building Approvals (1,120) (1,101) (1,090) 61 5.3%
City Planning & Research (Land Use Planning) 3,270 3,324 3,358 157 4.9%
Development Services 3,844 3,854 3,867 116 3.1%
Total 5,994 6,077 6,135 334 5.7%
Change ($) 193 83 58
Change (%) 3.3% 1.4% 1.0%
*Subject to rounding.
Annual Average Increase: 1.9%

Page 68
Staffing Summary
Key Performance Indicators
Description 2013 2014 2015 2016 2017 2018
Building Approvals
Total Construction Value of Permits Issued
$732M $740M $740M $740M $740M $740M
Number of Building Inspections Excluding Plumbing
18,690 19,000 19,000 19,000 19,000 19,000
City Planning
Number of Planning Applications per Year 63 60 60 60 60 60
Median Application Time (Days) for Official Plan/Zoning Applications
117 118 125 125 125 125
Median Application Time (Days) for Zoning By-law Amendment Applications
102 95 110 110 110 110
2014 2015 2016 2017 2018
Building Approvals 45 45 45 45 45
City Planning & Research 32 32 32 32 32
Development Services 48 48 48 48 48
Total 125 125 125 125 125
2014 2015 2016 2017 2018
Building Approvals 46.1 46.1 46.1 46.1 46.1
City Planning & Research 33.2 33.2 33.2 33.2 33.2
Development Services 49.5 49.5 49.5 49.5 49.5
Total 128.8 128.8 128.8 128.8 128.8
STAFFING - Full-Time Employees #
STAFFING - Full-Time Equivalents #

Page 69
Building Approvals Operating Highlights
2015 Budget Highlights
The 2015 budget increase of $27 thousand or 2.3% for Building Approvals is primarily due to increases in personnel costs related to
existing employment agreements, minimal costs associated with information system maintenance, and general inflationary pressures,
partially offset by increased revenue in sign permit fees and lawyers letters based on current trends.
In 2015, Building Approvals will be ensuring all plans examination and inspection staff are trained and re-qualified with respect to the
Ontario Building Code changes effective January 1, 2014.
City Planning & Research (Land Use Planning) Operating Highlights
2015 Budget Highlights
City Planning & Research approved budget increase of $26 thousand or 0.8% primarily due to increases in personnel contractual
obligations, parking, and professional development, partially offset by additional revenues for zoning change applications.
For 2015, Land Use Planning will continue to focus on processing planning applications quickly, noting that processing times for planning
applications remain some of the fastest in Ontario.
Development Services Operating Highlights
2015 Budget Highlights
Development Services will maintain existing service levels with an increase of $71 thousand or 1.9%. The increase is primarily due to
personnel contractual obligations and reduced user fee revenues for subdivision inspection fees based on current trends.
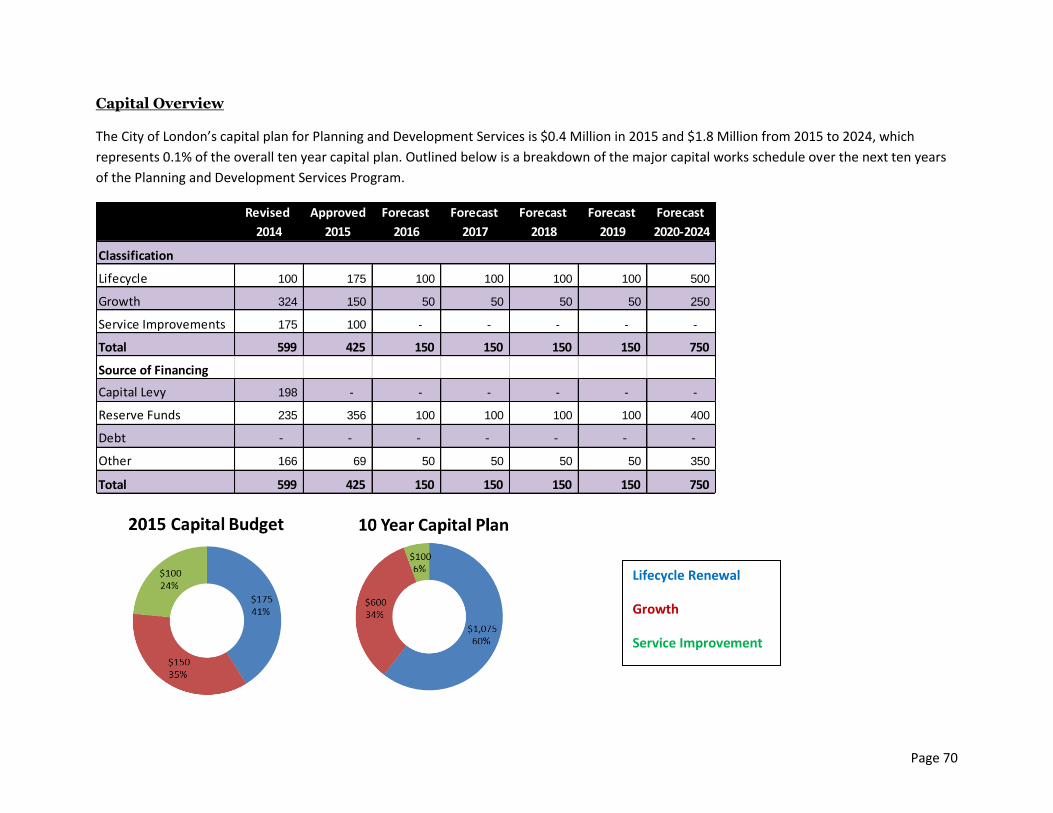
Page 70
Capital Overview
The City of London’s capital plan for Planning and Development Services is $0.4 Million in 2015 and $1.8 Million from 2015 to 2024, which
represents 0.1% of the overall ten year capital plan. Outlined below is a breakdown of the major capital works schedule over the next ten years
of the Planning and Development Services Program.
Revised Approved Forecast Forecast Forecast Forecast Forecast
2014 2015 2016 2017 2018 2019 2020-2024
Classification
Lifecycle 100 175 100 100 100 100 500
Growth 324 150 50 50 50 50 250
Service Improvements 175 100 - - - - -
Total 599 425 150 150 150 150 750
Source of Financing
Capital Levy 198 - - - - - -
Reserve Funds 235 356 100 100 100 100 400
Debt - - - - - - -
Other 166 69 50 50 50 50 350
Total 599 425 150 150 150 150 750
Lifecycle Renewal
Growth
Service Improvement

Page 71
Major Capital Works in Ten Year Plan 2015- 2024 ($000's) 2015 2016-2024
Planning & Development - Lifecycle
PD1213 Archaeological Master Plan 75
PD3023 5-Year Official Plan Review 100 900
Total Planning & Development - Lifecycle 175 900
Planning & Development - Growth
GG1034 Development Charges Consulting 50 450
PD2162 New Urban Civic Spaces 100
Total Planning & Development - Growth 150 450
Planning & Development - Service Improvement
PD1215 Downtown Waterfront 100
Total Planning & Development - Service Improvement 100 -
TOTAL PLANNING & DEVELOPMENT 425 1,350
Planning and Development
Services Major Projects
Official Plan Review
($1 Million)
Development Charge
Study Development
($0.5 Million)
Page 72
Animal Services By-Law Enforcement & Property Standards Corporate Security &
Emergency Management
Fire & Rescue Services, Fire Prevention & Education
Police Services

Page 73
Animal Services, 1.0%
Fire Services, 36.4%
Corporate Security & Emergency Mgmt, 0.9%
By-Law Enforcement &
Property Standards, 0.8%
London Police Services, 60.9%
Page 73
Culture, 4.6%
Economic Prosperity, 2.5%
Environmental Services, 3.5%
Parks, Rec. & Neighbourhood Services, 5.9%
Planning & Development Services, 1.1%
Protective Services, 29.9%
Social & Health Services, 12.8%
Transportation Services, 11.7%
Corporate, Operational &
Council Services, 28.0%
Operating Overview Protective Services
The City of London’s 2015 Approved Tax Supported Budget for Protective Services is $152.9 million representing 29.9% of the net property tax
supported budget. Outlined below is a breakdown of the 5 services that make up the City of London’s Protective Services Program.

Page 74
2015 Approved Budget ($000’s)
2016 – 2018 Multi-Year Budget ($000’s)
NOTE: The 2015 approved budget and the 2016 to 2018 forecast is only reflective of the property tax levy increases from rates and excludes the
impacts of assessment growth costs due to an expanding City.
SERVICE
2014 Net
Revised
Budget
2015
Expense
2015 Non
Tax Revenue
2015 Net
Approved
Budget
Increase /
(Decrease)
Over 2014 $
Increase /
(Decrease)
Over 2014 %
2015
Approved
Assessment
Growth
Animal Services 1,435 2,882 (1,343) 1,539 104 7.2% 0
By-Law Enforcement & Property Standards 1,108 3,051 (1,869) 1,182 74 6.7% 0
Corporate Security & Emergency Management 1,323 1,381 (40) 1,341 18 1.4% 110
Fire Services 55,390 55,844 (177) 55,667 277 0.5% 0
London Police Services 92,477 101,214 (8,048) 93,166 689 0.7% 0
Tax Levy From Rates 151,733 164,372 (11,477) 152,895 1,162 0.8% 110
*Subject to rounding.
SERVICE
2016 Net
Budget
Forecast
2017 Net
Budget
Forecast
2018 Net
Budget
Forecast
2016 to 2018
Projected
Increase
2016 to 2018
% Increase
Animal Services 1,579 1,621 1,663 124 8.1%
By-Law Enforcement & Property Standards 1,164 1,141 1,113 (69) (5.8%)
Corporate Security & Emergency Management 1,358 1,375 1,393 52 3.9%
Fire Services 55,844 55,924 56,058 391 0.7%
London Police Services 94,075 94,638 95,225 2,059 2.2%
Total 154,020 154,699 155,452 2,557 1.7%
Change ($) 1,125 679 753
Change (%) 0.7% 0.4% 0.5%
*Subject to rounding.
Annual Average Increase: 0.6%

Page 75
Staffing Summary
2014 2015 2016 2017 2018
Animal Services 1 1 1 1 1
By-Law Enforcement & Property Standards 33 33 33 33 33
Corporate Security & Emergency Management 8 8 8 8 8
Fire Services 416 416 416 416 416
London Police Services 821 808 808 808 808
Total 1,279 1,266 1,266 1,266 1,266
2014 2015 2016 2017 2018
Animal Services 1.0 1.0 1.0 1.0 1.0
By-Law Enforcement & Property Standards 35.4 35.4 35.4 35.4 35.4
Corporate Security & Emergency Management 8.0 8.0 8.0 8.0 8.0
Fire Services 420.5 420.5 420.5 420.5 420.5
London Police Services 823.0 808.5 808.5 808.5 808.5
Total 1,287.9 1,273.4 1,273.4 1,273.4 1,273.4
STAFFING - Full-Time Employees #
STAFFING - Full-Time Equivalents #

Page 76
Key Performance Indicators Description 2013 2014 2015 2016 2017 2018
Animal Services
Animal Licences Sold 39,933 41,000 41,000 42,500 43,500 44,000
Animals Spay/Neutered 1,088 1,175 1,175 1,275 1,275 1,350
Adoptions/Transfers 854 950 1,000 1,050 1,200 1,250
By-law Enforcement
Number of Taxi Licences Issued 300 320 340 342 344 348
Number of Residential Rental Unit Licences Issued 3,000 3,500 4,500 5,500 6,000 7,500
Emergency Management
Number of Staff Trained 400 450 450 500 500 500
Number of Public Education Awareness Events 15 20 25 25 30 30
Corporate Security
Number of Incident Responses 3,625 3,725 3,800 3,900 4,000 4,100
Number of Service Requests 2,150 2,250 2,350 2,450 2,550 2,650
Fire Services
90th Percentile for Engine Arriving on Scene Within Urban Growth Boundary (Code 4)
4:00 4:21 4:15 4:20 4:20 4:25
90th Percentile for 15 Fire Fighters Arriving Within Urban Growth Boundary (Code 4)
7:21 7:42 7:30 7:35 7:35 7:40
Inspections and Inspection Activities 4,722 4,707 5,457 7,152 7,302 8,997
Emergency/Non-Emergency Calls 6,486/ 1,852
6,630/ 2,366
6,683/ 2,385
6,737/ 2,404
6,791/ 2,423
6,845/ 2,442
Police Services
Police : Population Ration (1 Officer : # Citizens) 1:620 1:625 1:643 1:649 1:656 1:663
Total Operating Cost per Staff (excluding amortization) OMBI PLCE320
$124,568 London was the lowest in 2013 of 11 participating municipalities.
Calls for Service 117,057 122,910 124,139 125,380 126,634 127,900
Page 77
Animal Services Operating Highlights
2015 Budget Highlights
Animal Services approved budget increase of $104 thousand or 7.2% primarily due to the flow through of the animal control contract
that was signed in the fall of 2014.
In 2015, Animal Services will further explore the idea of a City run mobile microchip unit and develop an implementation strategy.
By-law Enforcement Operating Highlights
2015 Budget Highlights
By-law Enforcement approved budget increase of $74 thousand or 6.7% primarily due to personnel contractual obligations and
reductions to untidy lot revenue based on current trends, partially offset by savings in purchased services related to enforcement
actions and licensing expenses.
A focus on proactive targeted enforcement projects will continue to be conducted in 2015.
Corporate Security & Emergency Management Operating Highlights
2015 Budget Highlights
Corporate Security & Emergency Management approved budget increase of $18 thousand or 1.4% primarily due to increases in
purchased services related to cost escalation for guard services and maintenance of alarm services.
Fire Services Operating Highlights
2015 Budget Highlights
With an increase of $277 thousand or 0.5%, Fire Services has limited spending to only “mission critical” items in order to reduce costs.
The increase is primarily attributable to flow through costs associated with an interim arbitration award of 1.9% in 2014. No amounts
are included in the 2015 budget for the unresolved labour contract related to 2015 settlements. It should be noted that 95% of total
expenditures are related to personnel costs and agreements that cover salaries and fringe benefits expired on December 31, 2010.

Page 78
Police Services Operating Highlights
2015 Budget Highlights
Police Services approved budget increase of $689 thousand or 0.7%. The increase is primarily attributable to increased costs for fuel,
utilities, Workplace Safety and Insurance Board costs and a reduced draw from its reserves, partially offset by the extension of Provincial
funding for court security and prisoner transportation costs. In addition, the 2015 budget includes service reductions resulting from
restructuring efforts that have led to a reduction of 14.5 full time equivalent positions which has assisted in mitigating the overall 2015
budget request. Although front line service delivery will not be impacted, there are service reductions to other programs and services
offered by the Police Service such as the closure of Police Headquarters overnight and reductions in staff dedicated to crime prevention,
family consultants, and Secondary School resources. It should be noted that there have been no amounts included in the 2015 budget
for labour settlements (Working Agreements expire December 31, 2014).

Page 79
Capital Overview
The City of London’s capital plan for Protective Services is $5.5 Million in 2015 and $85.8 Million from 2015 to 2024, which represents 4.9% of
the overall ten year capital plan. Outlined below is a breakdown of the major capital works schedule over the next ten years of the Protective
Services Program.
Revised Approved Forecast Forecast Forecast Forecast Forecast
2014 2015 2016 2017 2018 2019 2020-2024
Classification
Lifecycle 3,000 5,479 6,899 3,438 4,189 3,746 25,888
Growth - - 500 1,065 2,063 - 1,805
Service Improvements 1,677 - 1,000 700 1,485 - 27,500
Total 4,677 5,479 8,399 5,203 7,737 3,746 55,193
Source of Financing
Capital Levy 2,200 650 2,725 1,450 2,385 800 15,302
Reserve Funds 2,232 4,829 5,174 2,688 3,414 2,946 19,483
Debt - 176 376 552 18,964
Other 245 324 689 1,386 1,444
Total 4,677 5,479 8,399 5,203 7,737 3,746 55,193
Lifecycle Renewal
Growth
Service Improvement

Page 80
Major Capital Works in Ten Year Plan 2015- 2024 ($000's) 2015 2016-2024
Emergency & Security - Lifecycle
GG1589 Facility Maintenance-Security 100 1,350
GG1600 Emergency Management 50 450
Total Emergency & Security - Lifecycle 150 1,800
Fire Services - Lifecycle
PP1045 Replace Portable Radios 720
PP1042-15 Non-Emergency Fire Vehicle Replacement 1,420
PP1123-15 Replace Firefighter Equipment 625 4,830
PP1152-15 Emergency Fire Vehicle Replacement 2,270 6,424
PP1176-15 Fire Stations Lifecycle Repairs 640 6,360
Total Fire Services - Lifecycle 3,535 19,754
Fire Services - Growth
PP1043 Add Aerial Company 1,805
PP1087 New Fire Station No. 15 3,128
Total Fire Services - Growth - 4,933
Fire Services - Service Improvement
PP1025 Interface & Mobile Data 1,000
PP1090 Relocate Existing Resource to New Fire Station No. 16 2,185
PP1091 Replacement & Relocation of Fire Training Tower 7,500
Total Fire Services - Service Improvement - 10,685
Total Fire Services 3,535 35,372
Police Services - Lifecycle
PP4326 Conducted Energy Weapons 339
PP4405 Portable Radio User Gear 3,503
PP4314-15 Replace Police Vehicles 955 13,478
PP4444-15 Headquarters Building Lifecycle Repairs 500 5,625
Total Police Services - Lifecycle 1,794 22,606
Police Services - Growth
PP4480 Police Facility Needs Analysis 500
Total Police Services - Growth - 500
Police Services - Service Improvement
PP4462 LPS Facility Expansion 20,000
Total Police Services - Service Improvement - 20,000
Total Police Services 1,794 43,106
TOTAL PROTECTIVE SERVICES 5,479 80,278
Protective Services Major
Projects
Replacement and
Relocation of Training
Tower ($7.5 Million)
New Fire Station #15 –
South East London
($3.1 Million)
Emergency & Non-
Emergency Fire Vehicle
Replacement Program
($10.1 Million)
Police Vehicle
Replacement Program
($14.4 Million)
Police Facility
Expansion ($20.0
Million)

Page 81
Affordable Housing Planning & Funding, Social Housing Administration, London & Middlesex Housing Corporation
Adult Day Programs, Long Term Care (Dearness Home), Homemakers
Land Ambulance, Middlesex-London Health Unit
Homeless Prevention, Immigration Services, Subsidized Transit, Ontario Works Programs

Page 82
Social Housing, 19.2%
London & Middlesex Housing Corporation, 13.1%
Long Term Care, 6.7%
Land Ambulance, 18.6%
Middlesex-London Health Unit, 9.3%
Social & Community Support
Services, 33.1%
Page 82
Culture, 4.6%
Economic Prosperity, 2.5%
Environmental Services, 3.5%
Parks, Rec. & Neighbourhood Services, 5.9%
Planning & Development Services, 1.1%
Protective Services, 29.9%
Social & Health Services, 12.8%
Transportation Services, 11.7%
Corporate, Operational &
Council Services, 28.0%
Operating Overview Social & Health Services
The City of London’s 2015 Approved Tax Supported Budget for Social & Health Services is $65.3 million representing 12.8% of the net property tax
supported budget. Outlined below is a breakdown of the 6 services that make up the City of London’s Social & Health Services Program.

Page 83
2015 Approved Budget ($000’s)
2016 – 2018 Multi-Year Budget ($000’s)
NOTE: The 2015 approved budget and the 2016 to 2018 forecast is only reflective of the property tax levy increases from rates and excludes the
impacts of assessment growth costs due to an expanding City.
SERVICE
2014 Net
Revised
Budget
2015
Expense
2015 Non
Tax Revenue
2015 Net
Approved
Budget
Increase /
(Decrease)
Over 2014 $
Increase /
(Decrease)
Over 2014 %
2015
Approved
Assessment
Growth
Social Housing 12,914 23,333 (10,789) 12,544 (370) (2.9%) 0
London & Middlesex Housing Corporation 7,955 8,541 0 8,541 586 7.4% 0
Long Term Care 4,677 21,345 (16,945) 4,400 (277) (5.9%) 0
Land Ambulance 11,713 12,132 0 12,132 419 3.6% 0
Middlesex-London Health Unit 6,095 6,095 0 6,095 0 0.0% 0
Social & Community Support Services 23,266 141,168 (119,583) 21,585 (1,681) (7.2%) 0
Tax Levy From Rates 66,620 212,614 (147,317) 65,297 (1,323) (2.0%) 0
*Subject to rounding.
SERVICE
2016 Net
Budget
Forecast
2017 Net
Budget
Forecast
2018 Net
Budget
Forecast
2016 to 2018
Projected
Increase
2016 to 2018
% Increase
Social Housing 12,474 12,396 12,247 (297) (2.4%)
London & Middlesex Housing Corporation 9,173 9,403 9,638 1,097 12.8%
Long Term Care 4,327 4,273 4,224 (176) (4.0%)
Land Ambulance 12,749 13,426 13,962 1,830 15.1%
Middlesex-London Health Unit 6,095 6,095 6,095 0 0.0%
Social & Community Support Services 19,202 16,528 13,979 (7,606) (35.2%)
Total 64,020 62,121 60,145 (5,152) (7.9%)
Change ($) (1,277) (1,899) (1,976)
Change (%) (2.0%) (3.0%) (3.2%)
*Subject to rounding.
Annual Average Increase: (2.7%)

Page 84
Staffing Summary
2014 2015 2016 2017 2018
Social Housing 18 18 18 18 18
London & Middlesex Housing Corporation 55 55 55 55 55
Long Term Care 147 145 145 145 145
Land Ambulance 160 164 170 176 180
Middlesex-London Health Unit 246 246 246 246 246
Social & Community Support Services 251 253 253 254 254
Total 877 881 887 894 898
2014 2015 2016 2017 2018
Social Housing 18.3 19.3 19.3 18.3 18.3
London & Middlesex Housing Corporation 60.8 60.8 60.8 60.8 60.8
Long Term Care 228.2 225.6 225.6 225.6 225.6
Land Ambulance 206.3 211.8 218.3 225.3 230.3
Middlesex-London Health Unit 278.5 278.5 278.5 278.5 278.5
Social & Community Support Services 251.0 253.0 253.0 254.0 254.0
Total 1,043.1 1,049.0 1,055.5 1,062.5 1,067.5
STAFFING - Full-Time Equivalents #
STAFFING - Full-Time Employees #

Page 85
Key Performance Indicators
Description 2013 2014 2015 2016 2017 2018 Social Housing
Number of Affordable Housing Units per 1,000 City of London Households
6.3 6.4 6.9 7.3 8.2 8.8
Number of Social Housing Units per 1,000 City of London Households
41.4 41 40 39 39 39
London & Middlesex Housing Corporation
Rental Arrears as a Percentage of Rental Revenue
13.8% 13% 12.8% 12.4% 12.2% 12.%
Vacancy Rate 3% 3% 3% 3% 3% 3%
Long Term Care
Day Program - % of Clients who are Satisfied with the Program
92% 95% 95% 95% 95% 95%
Dearness Home Occupancy Rate 98.7% 98.7% 98.7% 98.7% 98.7% 98.7%
Total LTC Cost (CMI Adjusted) per Weighted Bed Day
$221.92 $221.31 $226.38 $227.39 $228.63 $229.95
Middlesex-London Health Unit
Funding Per Capita $14.39 $16.14 $15.98 $15.83 $15.67 $15.51
Ontario Works
Ontario Works Caseload 10,976 11,000 11,200 11,200 11,300 11,300
Average Monthly Cost per OW Case $671 $679 $706 $713 $720 $727

Page 86
Social Housing Operating Highlights
2015 Budget Highlights
Social Housing approved budget decrease of $370 thousand or 2.9%. Social Housing has been able to achieve a budget reduction primarily due
to increased funding received from the Ontario Gazette as well as operational savings from improved business practices related to housing
provider monitoring. Also included in the 2015 budget are first year start-up and transition costs for the Housing Development Corporation
and the Housing Collaborative Initiative which includes the implementation of a new housing financial system in conjunction with other
participating municipalities.
London & Middlesex Housing Corporation Operating Highlights
2015 Budget Highlights
The approved budget increase of $586 thousand or 7.4% for LMHC is primarily the result of significant increases in property taxes, insurance
and utilities. The property tax expense is anticipated to increase by 7.2% due to MPAC assessments and insurance and utilities costs are
anticipated to increase by 6.8% and 5.1% respectively. These costs pressures represent approximately 96% of the total increase required to
maintain existing service levels.
Long Term Care Operating Highlights
2015 Budget Highlights
Long Term Care approved budget decrease of $277 thousand or 5.9% primarily due to a budget reduction in the Dearness Home. Factors
contributing to the Dearness Home reduced request include a reduction to personnel costs due to a reduction of 2.6 full-time equivalents
resulting from a workload restructuring, increases in user fees, and increases in the level of care and envelope funding.
The South West Local Health Integration Networks (LHIN) implemented a financial and service delivery model for Adult Day Programs effective
April 2014. Under this new model, the overall funding for this program has been reduced and in order to remain viable a municipal
contribution for Adult Day Programs of $15 thousand is required in 2015, it being noted that a municipal contribution was not required in
2014.

Page 87
Land Ambulance Operating Highlights
2015 Budget Highlights
With an increase of $419 thousand or 3.6%, Land Ambulance will be adding a 12 hour vehicle (4 full-time employees / 5 full-time equivalents
per 12 hour ambulance) operating 7 days per week to address increasing demand for service and to mitigate wait time pressures. The increase
in expenditures has been offset partially by a planned drawdown from reserves.
Middlesex-London Health Unit Operating Highlights
2015 Budget Highlights
Middlesex-London Health Unit approved budget a 0% increase. The City of London, the County of Middlesex, and the Middlesex-London
Health Unit are working collaboratively in efforts to identify cost efficiencies in the delivery of public health, it being noted that the
provincial/municipal funding ratio in the 2015 budget remains at 69/31 rather than the desired 75/25.
Social & Community Support Services Operating Highlights
2015 Budget Highlights
Social & Community Support Services approved budget reduction of $1.7 million or 7.2% primarily due to additional provincial subsidy resulting
from the Provincial upload of the municipal share of eligible Ontario Works Financial Assistance and Employment Assistance costs that were
originally cost shared at 80:20 provincial-municipal basis. In 2015, the municipal share will be 8.6%.
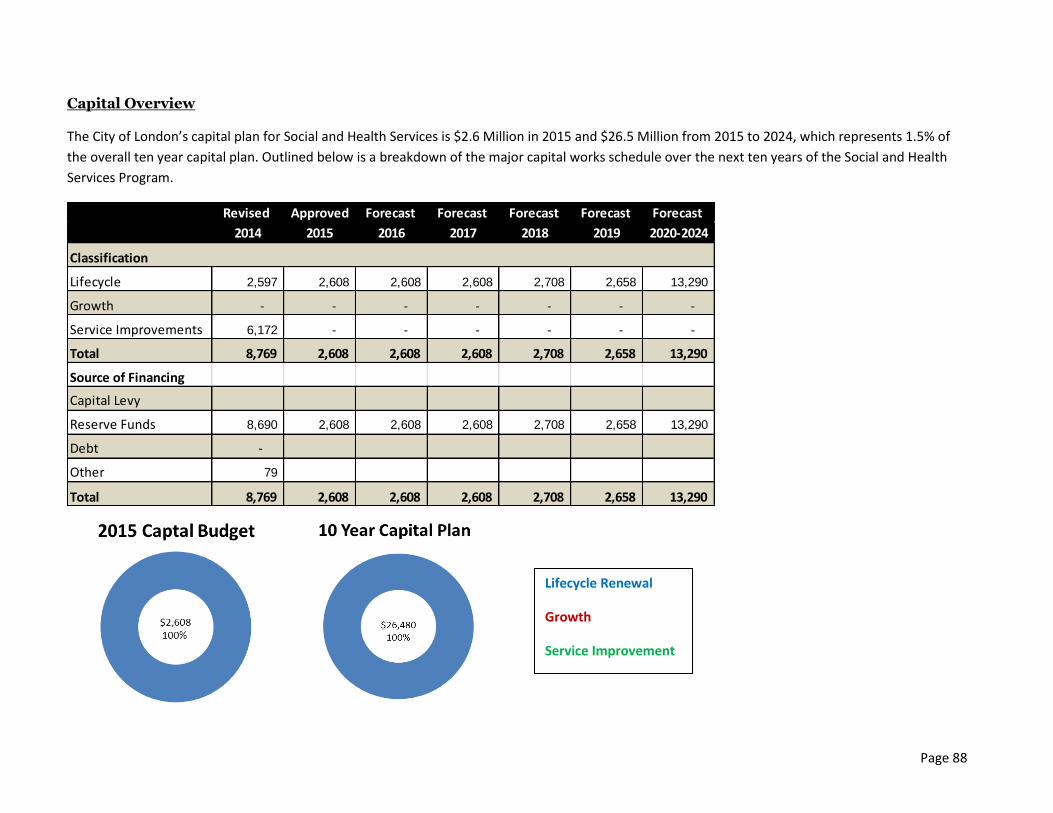
Page 88
Capital Overview
The City of London’s capital plan for Social and Health Services is $2.6 Million in 2015 and $26.5 Million from 2015 to 2024, which represents 1.5% of
the overall ten year capital plan. Outlined below is a breakdown of the major capital works schedule over the next ten years of the Social and Health
Services Program.
Revised Approved Forecast Forecast Forecast Forecast Forecast
2014 2015 2016 2017 2018 2019 2020-2024
Classification
Lifecycle 2,597 2,608 2,608 2,608 2,708 2,658 13,290
Growth - - - - - - -
Service Improvements 6,172 - - - - - -
Total 8,769 2,608 2,608 2,608 2,708 2,658 13,290
Source of Financing
Capital Levy
Reserve Funds 8,690 2,608 2,608 2,608 2,708 2,658 13,290
Debt -
Other 79
Total 8,769 2,608 2,608 2,608 2,708 2,658 13,290
Lifecycle Renewal
Growth
Service Improvement

Page 89
Major Capital Works in Ten Year Plan 2015- 2024 ($000's) 2015 2016-2024
Social & Health Services - Lifecycle
PD2618-15 Public Housing Upgrades 2,208 19,872
GG1620-15 Dearness Major Upgrades 400 4,000
Total Social & Health Services - Lifecycle 2,608 23,872
TOTAL SOCIAL & HEALTH SERVICES 2,608 23,872
Social and Health
Services Major
Projects
Dearness Home
Lifecycle Renewal
Program
($4.4 Million)
Public housing
program ($22.1
Million)

Page 90
Parking Conventional, Specialized
;
Roadway Maintenance, Roadway Planning & Design, Snow Control, Traffic Control & Lighting

Page 91
Parking, (5.4)%
Public Transit (LTC), 44.7%
Roadways, 60.7%
Page 91
Culture, 4.6%
Economic Prosperity, 2.5%
Environmental Services, 3.5%
Parks, Rec. & Neighbourhood Services, 5.9%
Planning & Development Services, 1.1%
Protective Services, 29.9%
Social & Health Services, 12.8%
Transportation Services, 11.7%
Corporate, Operational &
Council Services, 28.0%
Operating Overview Transportation Services
The City of London’s 2015 Approved Tax Supported Budget for Transportation Services is $60.0 million representing 11.7% of the net property
tax supported budget. Outlined below is a breakdown of the 3 services that make up the City of London’s Transportation Services Program.
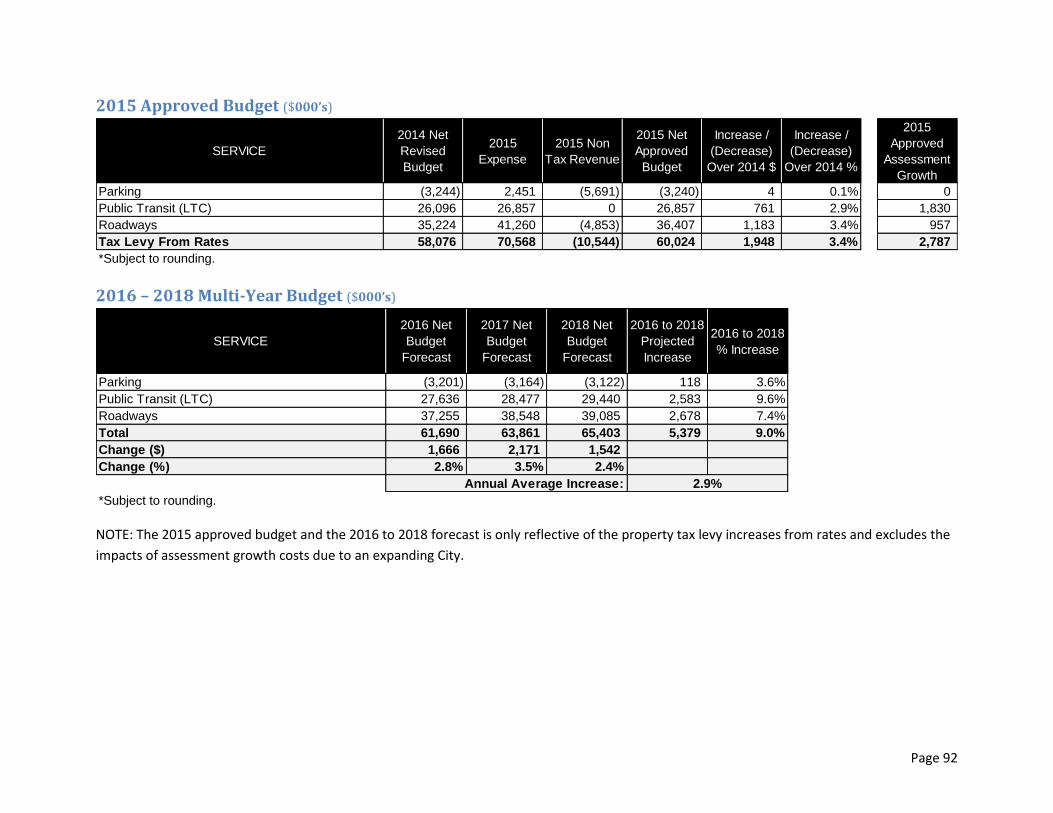
Page 92
2015 Approved Budget ($000’s)
2016 – 2018 Multi-Year Budget ($000’s)
NOTE: The 2015 approved budget and the 2016 to 2018 forecast is only reflective of the property tax levy increases from rates and excludes the
impacts of assessment growth costs due to an expanding City.
SERVICE
2014 Net
Revised
Budget
2015
Expense
2015 Non
Tax Revenue
2015 Net
Approved
Budget
Increase /
(Decrease)
Over 2014 $
Increase /
(Decrease)
Over 2014 %
2015
Approved
Assessment
Growth
Parking (3,244) 2,451 (5,691) (3,240) 4 0.1% 0
Public Transit (LTC) 26,096 26,857 0 26,857 761 2.9% 1,830
Roadways 35,224 41,260 (4,853) 36,407 1,183 3.4% 957
Tax Levy From Rates 58,076 70,568 (10,544) 60,024 1,948 3.4% 2,787
*Subject to rounding.
SERVICE
2016 Net
Budget
Forecast
2017 Net
Budget
Forecast
2018 Net
Budget
Forecast
2016 to 2018
Projected
Increase
2016 to 2018
% Increase
Parking (3,201) (3,164) (3,122) 118 3.6%
Public Transit (LTC) 27,636 28,477 29,440 2,583 9.6%
Roadways 37,255 38,548 39,085 2,678 7.4%
Total 61,690 63,861 65,403 5,379 9.0%
Change ($) 1,666 2,171 1,542
Change (%) 2.8% 3.5% 2.4%
*Subject to rounding.
Annual Average Increase: 2.9%

Page 93
Staffing Summary
Note: Public Transit (LTC) reports Full-Time Equivalents, but does not report Full-Time Employees therefore the total Full-Time Employee #
excludes LTC.
2014 2015 2016 2017 2018
Parking 11 11 11 11 11
Public Transit (LTC) NA NA NA NA NA
Roadways 197 197 197 197 197
Total 208 208 208 208 208
2014 2015 2016 2017 2018
Parking 11.5 11.5 11.5 11.5 11.5
Public Transit (LTC) 528.5 538.5 550.5 562.5 573.5
Roadways 234.4 234.4 234.4 234.4 234.4
Total 774.4 784.4 796.4 808.4 819.4
STAFFING - Full-Time Employees #
STAFFING - Full-Time Equivalents #

Page 94
Key Performance Indicators
Description 2013 2014 2015 2016 2017 2018 Parking
Number of Paid Parking Spaces per 100,000 Population 807 797 791 783 775 767
Parking Fine Revenue/Cost Ratio 1.57 1.54 1.51 1.48 1.45 1.42
London Transit Commission
Rides per Capita (Conventional) 63.1 62.7 63.0 63.7 64.3 64.7
Service Complaints per 100,000 passengers (Conventional) 54.5 54.5 53.5 52.5 51.5 50.5
Rides per Service Hour (Conventional) 42.1 41.8 41.1 40.6 40.2 39.7
Total Operating Cost / Passenger (Conventional) $2.49 $2.55 $2.61 $2.68 $2.74 $2.82
City of London Investment / Passenger (Conventional) $0.93 $0.94 $0.95 $0.97 $1.00 $1.03
Total Operating Cost / Passenger (Specialized) $18.57 $20.27 $20.51 $20.42 $20.73 $21.07
City of London Investment / Passenger (Specialized) $13.97 $14.45 $14.66 $14.24 $14.46 $14.70
Total Registrants (Specialized) 5,150 5,900 6,300 7,100 7,400 7,700
Rides per Service Hour (Specialized ) 2.45 2.43 2.45 2.45 2.45 2.45
Non-Accommodated trips per registrant (Specialized) 1.42 1.32 1.38 1.30 1.27 1.28
Roadways
Number of Roadway Lane km 3,526 3,561 3,596 3,631 3,666 3,701
Percent of Paved Road Condition – Good to Very Good 54% 54% 53% 52% 51% 50%
Road Reconstruction (lane km) 96 105 125 140 130 130
# of Event Days for Winter Roadway Maintenance 85 60 60 60 60 60

Page 95
Parking Operating Highlights
2015 Budget Highlights
Parking approved budget increase of $4 thousand or 0.1%. Increases related to personnel contractual obligations and cost pressures in
the parking enforcement contract and maintenance costs for a carpool parking lot are offset by savings from the reduced utilization of
one vehicle and increased user fee revenue based on current trends.
In 2015, Parking will continue to replace individual meters with master meters (pay ‘n display) in the Downtown Area to provide better
customer service including more options for payment and more efficient maintenance and collection of coins.
London Transit Commission Operating Highlights
2015 Budget Highlights
The London Transit Commission approved budget increase of $761 thousand or 2.9%. Increase in expenditures are primarily
attributable to personnel contractual obligations, inflationary pressures in insurance, fuel and contracts, as well as costs associated with
the flow through impacts of service hours added in 2014. Partially offsetting these expenditure pressures are increased transportation
and operating revenue along with Provincial Gas Tax funding.
The London Transit Commission continues to have a disparity between ridership growth and service hour growth which has resulted in
service quality issues. The hours of service added over the last number of years have been minimal in relation to ridership growth due
to economic challenges, including the constraints on public investment. The additional service hours have been used to address the
most significant service quality issues and ridership retention, not ridership growth.
Roadways Operating Highlights
2015 Budget Highlights
With an increase of $1,183 thousand or 3.4%, Roadways will be able to maintain existing service levels. The approved 2015 budget
increase is primarily the result of increases in personnel contractual obligations, operating supplies and equipment, and energy costs for
traffic signals and street lights.
In 2015, Roadways will progress the first Rapid Transit environmental assessment, a primary recommendation of the Transportation
Master Plan, and initiate the second Rapid Transit environmental assessment.
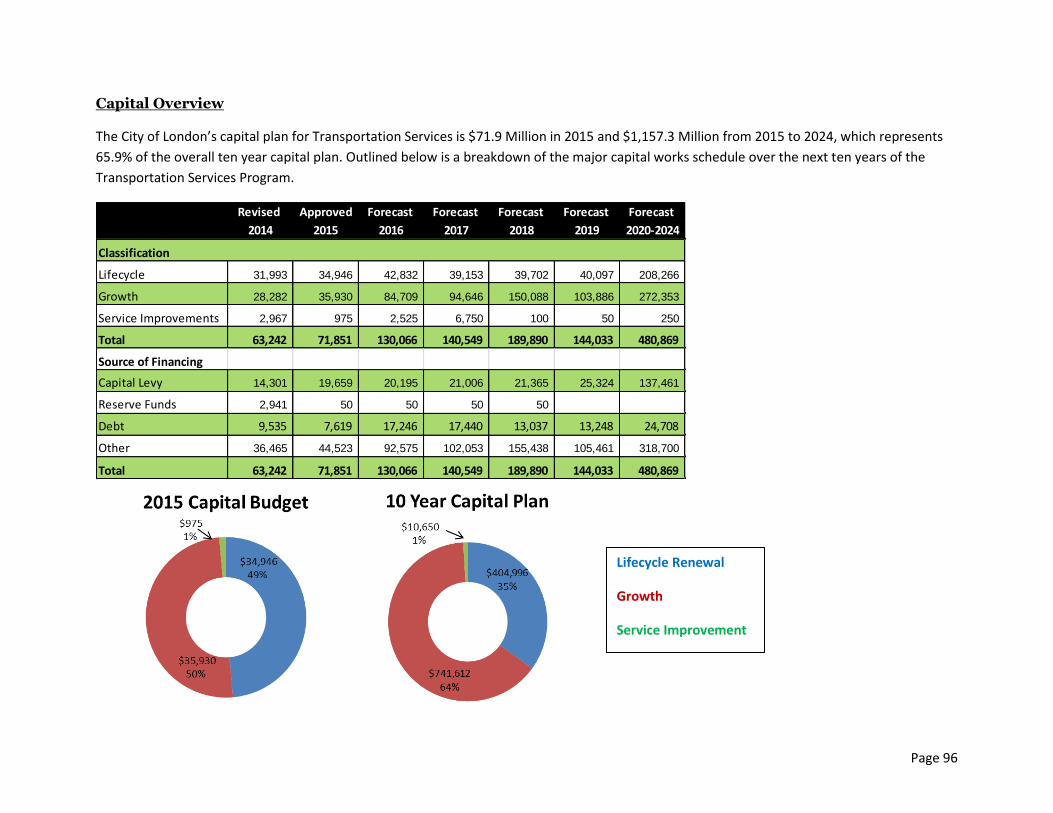
Page 96
Capital Overview
The City of London’s capital plan for Transportation Services is $71.9 Million in 2015 and $1,157.3 Million from 2015 to 2024, which represents
65.9% of the overall ten year capital plan. Outlined below is a breakdown of the major capital works schedule over the next ten years of the
Transportation Services Program.
Revised Approved Forecast Forecast Forecast Forecast Forecast
2014 2015 2016 2017 2018 2019 2020-2024
Classification
Lifecycle 31,993 34,946 42,832 39,153 39,702 40,097 208,266
Growth 28,282 35,930 84,709 94,646 150,088 103,886 272,353
Service Improvements 2,967 975 2,525 6,750 100 50 250
Total 63,242 71,851 130,066 140,549 189,890 144,033 480,869
Source of Financing
Capital Levy 14,301 19,659 20,195 21,006 21,365 25,324 137,461
Reserve Funds 2,941 50 50 50 50
Debt 9,535 7,619 17,246 17,440 13,037 13,248 24,708
Other 36,465 44,523 92,575 102,053 155,438 105,461 318,700
Total 63,242 71,851 130,066 140,549 189,890 144,033 480,869
Lifecycle Renewal
Growth
Service Improvement

Page 97
Major Capital Works in Ten Year Plan 2015- 2024 ($000's) 2015 2016-2024Total Parking -Service Improvement (Parking Meters Parking Prog.) 300 100
Roadways - Lifecycle
TS1446-15 Road Rehab-Main Life Cycle Renewal 12,180 127,832
TS1763-15 Bridge Rehab Life Cycle Renewal 2,800 32,400
TS3014-15 Road Rehab - Local and Rural 5,800 54,000
TS4067-15 Traffic Signal Maintenance Program 3,141 31,659
TS5123-15 Street Light Maintenance Program 1,650 22,425
TS3037-15 Lifecycle Sidewalk Repair & Replacement 1,200 10,800
Miscellaneous Roadways Lifecycle 1,840 16,610
Total Roadways - Lifecycle 28,611 295,726
TS1134 Richmond St & Fanshawe Park Rd Intersection Improvements 850 7,100
TS1348-1 Wonderland Rd Widening (Phases 1 to 4) 33,956
TS1430 Rapid Transit Road Widenings 2,700 301,964
TS1470 Commissioners Rd Widening (Wonderland Rd to Viscount Rd) 10,455
TS1739-15 Bike Lanes 783 7,046
TS1489 Western Road Widening (Platts Lane to Oxford St) 700 22,669
TS1475-2 Fanshawe Rd E Widening (Fanshawe/Highbury Intersection) 700 11,340
TS1477-2 Hyde Park Widening Ph II (CP Rail to Fanshawe) 12,836
TS1523-1 Bradley Ave Extension 834 22,185
TS1405 Hamilton Road 16,294
TS1479-1 Bradley Ave Widening Phase I &2) 15,263
TS1484 Sarnia Road Widening (Wonderland to Sleightholme) 500 6,520
TS1476 Clarke Rd Widening (VMP Extension to Fanshawe Park Rd) 24,711
Future Road Widenings & Growth studies 5,572 198,347
Total Roadways - Growth 35,930 667,395
TS1136 Western Rd & Philip Aziz Ave Improvements 575 8,975
TS1135 Dundas Flexible Street (2015-EA) 1,300
PD2134 Maintain Thames Valley & PD2163 Maintain Major Open Space-
funding transferred to fund TS1135 Dundas Flexible Street (1,300)
TS5012 Audible Pedestrian Signal Program 100 600
Total Roadways - Service Improvement 675 9,575
Total Roadways 65,216 972,696
Public Transit
MU1200-Fleet Radio Replacement 125
MU1044-15 Bus Purchase Replacment (Lifecycle) 6,035 70,299
MU1136-15 Existing Facility Upgrades 300 3,900
Total Public Transit - Lifecycle 6,335 74,324
MU1185-Rapid Transit Expansion Vehicles & Facility Expansion 38,287
Total Public Transit - Growth 0 38,287
Total Public Transit 6,335 112,611
TOTAL TRANSPORTATION SERVICES 71,851 1,085,407
Transportation Services
Major Projects
Rapid Transit Investment
($343.0 Million)
Hyde Park Widening Phase II
(CP Rail to Fanshawe Park
Rd)
($12.8 Million)
Commissioners Rd Widening
(Wonderland to Viscount
($10.5 Million)
Future road widening
($367.5 Million)
Western Road and Philip Aziz
($9.6 Million)
Road & Bridge Rehab
Lifecycle Renewal Program
($235.0 Million)
Transit system Investment
($80.7 Million)
Bike Lanes Investment ($7.8
Million)

Page 98
Advisory Committees, Audit, Councillor’s Office, Mayor’s Office, Municipal Elections, Secretariat Support (City Clerk)
Corporate Finance, Finance
Administration of Justice, Taxation, Corporate Communications, Customer Relations, Licensing & Certificates, Cafeteria
Asset Management Dispatch, Employee Systems, Energy Conservation, Facilities, Finance Payroll Services, Fleet Management Graphics, Surveying & Technical Services, Human Resources, Human Rights, Legal Services, Purchasing, Realty Services, Risk Management, Information Technology Services
Corporate Management, Governmental Liaison, Information & Archive Management
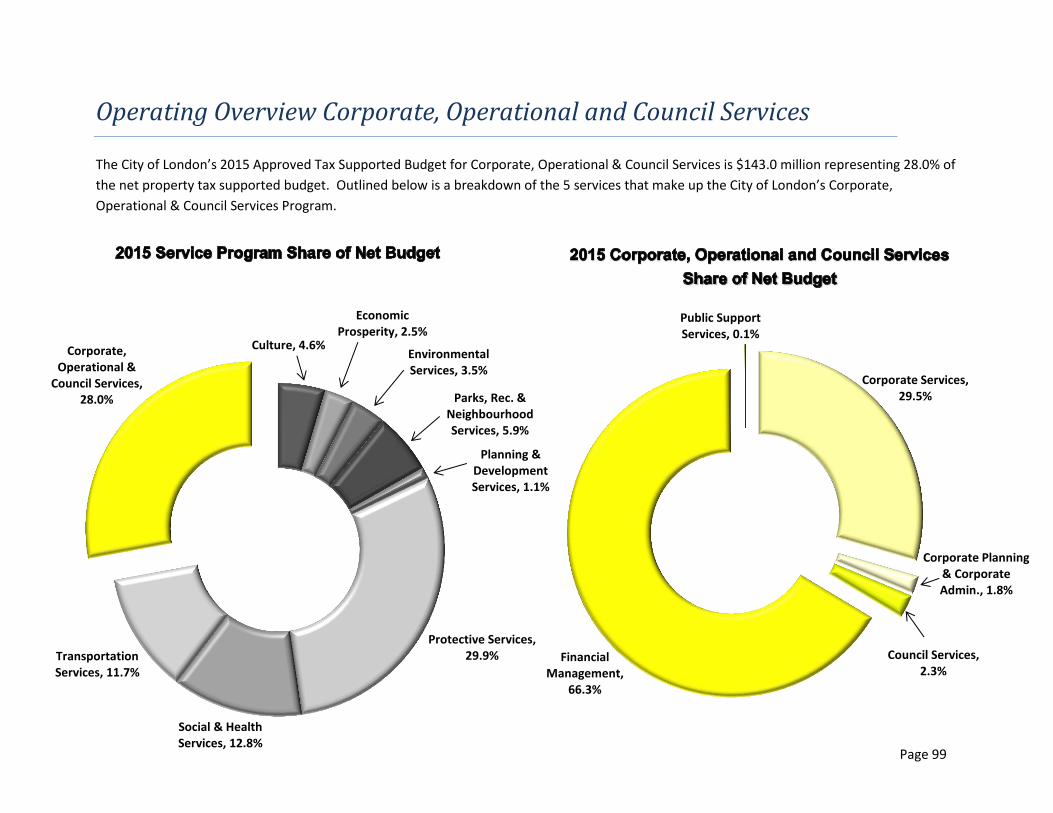
Page 99
Corporate Services, 29.5%
Corporate Planning & Corporate Admin., 1.8%
Council Services, 2.3%
Financial Management,
66.3%
Public Support Services, 0.1%
Page 99
Culture, 4.6%
Economic Prosperity, 2.5%
Environmental Services, 3.5%
Parks, Rec. & Neighbourhood Services, 5.9%
Planning & Development Services, 1.1%
Protective Services, 29.9%
Social & Health Services, 12.8%
Transportation Services, 11.7%
Corporate, Operational &
Council Services, 28.0%
Operating Overview Corporate, Operational and Council Services
The City of London’s 2015 Approved Tax Supported Budget for Corporate, Operational & Council Services is $143.0 million representing 28.0% of
the net property tax supported budget. Outlined below is a breakdown of the 5 services that make up the City of London’s Corporate,
Operational & Council Services Program.

Page 100
2015 Approved Budget ($000’s)
2016 – 2018 Multi-Year Budget ($000’s)
NOTE: The 2015 approved budget and the 2016 to 2018 forecast is only reflective of the property tax levy increases from rates and excludes the
impacts of assessment growth costs due to an expanding City.
SERVICE
2014 Net
Revised
Budget
2015
Expense
2015 Non
Tax Revenue
2015 Net
Approved
Budget
Increase /
(Decrease)
Over 2014 $
Increase /
(Decrease)
Over 2014 %
2015
Approved
Assessment
Growth
Corporate Services 41,596 46,795 (4,599) 42,196 600 1.4% 379
Corporate Planning & Corporate Admin. 2,576 3,259 (656) 2,603 27 1.0% 0
Council Services 3,243 3,362 (112) 3,250 7 0.2% 0
Financial Management 84,576 135,274 (40,538) 94,736 10,160 12.0% 0
Public Support Services 176 8,342 (8,147) 195 19 11.0% 0
Tax Levy From Rates 132,167 197,032 (54,052) 142,980 10,813 8.2% 379
*Subject to rounding.
SERVICE
2016 Net
Budget
Forecast
2017 Net
Budget
Forecast
2018 Net
Budget
Forecast
2016 to 2018
Projected
Increase
2016 to 2018
% Increase
Corporate Services 42,890 43,649 44,514 2,318 5.5%
Corporate Planning & Corporate Admin. 2,641 2,672 2,693 90 3.5%
Council Services 3,270 3,289 3,309 59 1.8%
Financial Management 111,981 123,422 135,427 40,691 43.0%
Public Support Services 297 420 541 346 177.4%
Total 161,079 173,452 186,484 43,504 30.4%
Change ($) 18,099 12,373 13,032
Change (%) 12.7% 7.7% 7.5%
*Subject to rounding.
Annual Average Increase: 9.3%

Page 101
Staffing Summary
2014 2015 2016 2017 2018
Corporate Services 322 322 322 322 322
Corporate Planning & Corporate Administration 21 22 22 22 22
Council Services 32 32 32 32 32
Financial Management 90 90 90 90 90
Public Support Services 52 52 52 52 52
Total 517 518 518 518 518
2014 2015 2016 2017 2018
Corporate Services 339.8 335.9 335.9 335.9 335.9
Corporate Planning & Corporate Administration 22.0 22.0 22.0 22.0 22.0
Council Services 37.5 35.5 34.5 34.5 37.5
Financial Management 90.4 90.4 90.4 90.4 90.4
Public Support Services 57.7 57.5 55.5 55.5 55.5
Total 547.4 541.3 538.3 538.3 541.3
STAFFING - Full-Time Employees #
STAFFING - Full-Time Equivalents #
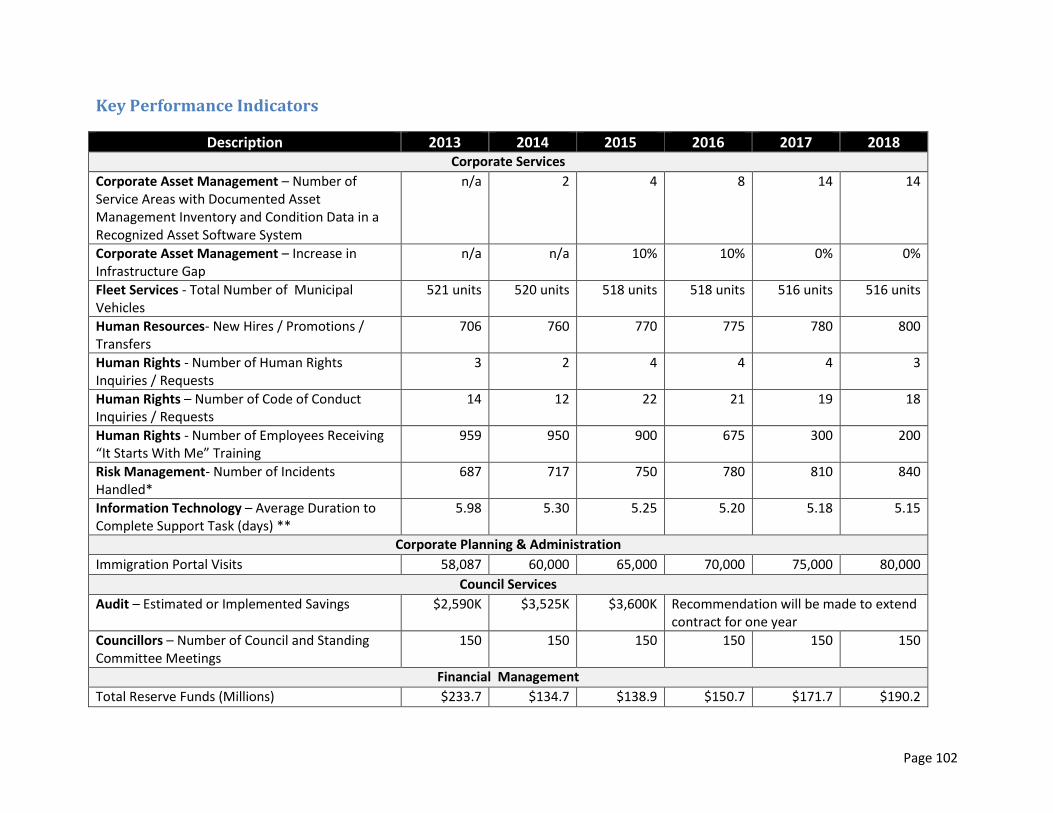
Page 102
Key Performance Indicators
Description 2013 2014 2015 2016 2017 2018 Corporate Services
Corporate Asset Management – Number of Service Areas with Documented Asset Management Inventory and Condition Data in a Recognized Asset Software System
n/a 2 4 8 14 14
Corporate Asset Management – Increase in Infrastructure Gap
n/a n/a 10% 10% 0% 0%
Fleet Services - Total Number of Municipal Vehicles
521 units 520 units 518 units 518 units 516 units 516 units
Human Resources- New Hires / Promotions / Transfers
706 760 770 775 780 800
Human Rights - Number of Human Rights Inquiries / Requests
3 2 4 4 4 3
Human Rights – Number of Code of Conduct Inquiries / Requests
14 12 22 21 19 18
Human Rights - Number of Employees Receiving “It Starts With Me” Training
959 950 900 675 300 200
Risk Management- Number of Incidents Handled*
687 717 750 780 810 840
Information Technology – Average Duration to Complete Support Task (days) **
5.98 5.30 5.25 5.20 5.18 5.15
Corporate Planning & Administration
Immigration Portal Visits 58,087 60,000 65,000 70,000 75,000 80,000
Council Services
Audit – Estimated or Implemented Savings $2,590K $3,525K $3,600K Recommendation will be made to extend contract for one year
Councillors – Number of Council and Standing Committee Meetings
150 150 150 150 150 150
Financial Management
Total Reserve Funds (Millions) $233.7 $134.7 $138.9 $150.7 $171.7 $190.2

Page 103
Percentage of Lifecycle Renewal Projects Funded from Capital Levy
33% 38% 43% 39% 48% 48%
Debt Financing as a Percentage of Total Capital (Tax Supported) Budget
24% 19% 14% 15% 13% 12%
Public Support Services
Administration of Justice – Charges Received *** 53,000 50,000 50,000 50,000 50,000 50,000
Taxation – Number of Property Tax Accounts 140,142 141,531 144,000 146,000 148,000 150,000
Taxation – Taxes Receivable as a % of Tax Levy 1.9% 1.6% 2.3% 2.3% 2.3% 2.3%
Customer Relations – Number of Clients Supported Through Service London Business
N/A 450 960 1,000 1,200 1,500
Customer Relations – Customer Satisfaction with Overall Quality of Service Delivery
64% 66% 68% 70% 72% 74%
Licencing – Amount of Proceeds Raised for Local Charities and Associations in the London Community through Licencing
$3,489,482 $3,400,000 $3,400,000 $3,400,000 $3,400,000 $3,400,000
Corporate Communications – Number of news releases/media advisories issued
135 142 165 180 190 200
Corporate Communications – Number of Informational Videos Posted on the City’s You Tube Channel
25 35 40 45 50 55
Corporate Communications – Number of Followers to City Tweeter Feed
7,796 13,079 14,000 15,000 16,000 17,000
* An increase in claims frequency and cost is expected as the City of London continues to grow, infrastructure ages and budgets tighten. This is also compounded
by the fact weather is a key contributor in the expected number of claims. Extreme weather events will likely increase. Our forecast takes these factors in
consideration and increased claims volume and cost will be expected.
** Average duration includes evenings and weekends in addition to regular working hours.
*** Current Statistics are indicating that the average levels of charges received might stabilize lower than 2013 level.

Page 104
Corporate Services Operating Highlights
2015 Budget Highlights
Corporate Services has been able to contain the 2015 budget increase to $600 thousand or 1.4%. Approximately $342 thousand or 57%
of the increase is related to utility cost pressures with the remaining increases primarily associated with general inflationary pressures.
It should be noted that Information Technology Services (ITS) has been able to submit a budget with a 0% increase as a result of
restructuring ITS such that strategy aligned with tactical actions along with a zero based budget review that occurred in 2014 that better
aligned functional units with the services provided.
Corporate Planning & Administration Operating Highlights
2015 Budget Highlights
With a budget increase of $27 thousand or 1%, Corporate Planning & Administration will continue to maintain existing service levels.
With personnel costs representing approximately 89% of the total budget, the increase is primarily due to personnel contractual
obligations.
Council Services Operating Highlights
2015 Budget Highlights
Council Services has been able to contain the 2015 budget increase to $7 thousand or 0.2%. The increase is primarily due to additional
costs related to interpreter services in Advisory Committees.
As part of ongoing customer service improvement efforts, an assessment of the resources required to support the Mayor and Members
of Council in carrying out their statutory responsibilities will be undertaken to determine what, if any, changes are required to the
existing support mode, with the associated budgets to be adjusted accordingly.
Page 105
Financial Management Operating Highlights
2015 Budget Highlights
The $10.2 million or 12.0% increase in Financial Management is primarily attributable to increases in capital financing and other reserve
contributions (pay as you go financing and reserve / reserve fund contributions) that is used to fund the corporate capital plan,
corporate contingencies along with a reduced reliance from reserves to fund ongoing expenditures contained in the budget.
Financial Management’s additional investment business case for Corporate Properties – Carrying Costs of $590 thousand was approved
by Council. The funding source for this initiative is from 2014 operating surplus, therefore there is no impact to the 2015 tax levy.
Public Support Services Operating Highlights
2015 Budget Highlights
Public Support Services approved budget increase of $19 thousand or 11%. The increase is primarily due to increased costs for
interpreter services and postage and courier costs partially offset by a budget reduction in Taxation resulting from a decrease to
personnel costs attributable to existing employment agreements and increased user fees.

Page 106
Capital Overview
The City of London’s capital plan for Corporate, Operational and Council Services is $8.1 Million in 2015 and $100 Million from 2015 to 2024, which represents 5.7% of the overall ten year capital plan. Outlined below is a breakdown of the major capital works schedule over the next ten years of the Corporate, Operational and Council Services Program.
Revised Approved Forecast Forecast Forecast Forecast Forecast
2014 2015 2016 2017 2018 2019 2020-2024
Classification
Lifecycle 9,757 7,286 7,683 7,393 8,522 9,401 53,968
Growth - - - - - - -
Service Improvements 10,169 863 863 500 500 500 2,500
Total 19,926 8,149 8,546 7,893 9,022 9,901 56,468
Source of Financing
Capital Levy 3,043 1,990 1,415 1,640 3,407 1,857 18,464
Reserve Funds 11,516 3,694 6,631 5,753 5,115 7,544 35,504
Debt 3,569 1,965
Other 1,798 500 500 500 500 500 2,500
Total 19,926 8,149 8,546 7,893 9,022 9,901 56,468
Lifecycle Renewal
Growth
Service Improvement

Page 107
Major Capital Works in Ten Year Plan 2015- 2024 ($000's) 2015 2016-2024
Corporate Services - Lifecycle
GG1050 Corporate Systems Update 5,500
GG1055 One Voice Communications 100 2,100
GGAPPL Application, Data, Information & Process 775 6,399
GGMOD Network Modernization 305 4,400
GGSTOR Primary Storage Replacement 5,700
GGITSEC Security Event and Incident Management Replacement 550
GGENDUSER End User Devices & Productivity Tools 100 900
ME1206 Fuel System Management 50 450
ME1407 Fleet and Equipment Maintenance 170
ME2014 Vehicle & Equipment Replacement 3,736 41,808
GG1320 Courts Administration Building Upgrade 300
GG1545-15 Municipal Buildings Major Upgrades 510 3,490
GG1555-15 City Hall Major Upgrades 1,000 9,000
TS6200-15 Operation Facilities Lifecycle 710 6,200
Total Corporate Services - Lifecycle 7,286 86,967
Corporate Services - Service Improvement
TS1346 Corporate Asset Management 338 338
TS1350 Corporate Asset Management Software 25 25
TS6217-14 Facility Energy Management 500 4,500
Total Corporate Services - Service Improvement 863 4,863
TOTAL CORPORATE SERVICES 8,149 91,830
Corporate, Operational and
Council Services Major
Projects
Information Technology
Services ($24.6 Million)
City Vehicle& Equipment
Lifecycle Replacement
Program ($46.2 Million)
City Facilities Lifecycle
Renewal (including City
Hall, Energy Savings
Initiatives, Operations
facilities) ($25.9 Million)

Page 108

Page 109
ExpenseNon Tax
Revenue
Net Tax
SupportedExpense
Non Tax
Revenue
Net Tax
Supported
Centennial Hall 716 (616) 100 747 (642) 105 5 4.6%
Arts, Culture & Heritage Advisory
& Funding2,180 0 2,180 2,253 0 2,253 73 3.4%
Museum London 3,141 (1,591) 1,550 3,181 (1,567) 1,614 64 4.1%
Eldon House 301 (69) 232 345 (82) 263 31 13.3%
Heritage 157 0 157 145 0 145 (12) (7.8%)
London Public Library 20,216 (1,504) 18,713 20,618 (1,504) 19,114 401 2.1%
Total Approved Culture Budget 26,711 (3,780) 22,932 27,289 (3,795) 23,494 562 2.4%
Total Impact on Tax Levy from the Cultural Services Program 0.11%
All figures are subject to rounding.
CULTURE2015 Approved Budget
2014 2015
Net Increase/
(Decrease)
Over 2014
Tax
Supported
(%)
Revised Budget Approved Budget
($000's)
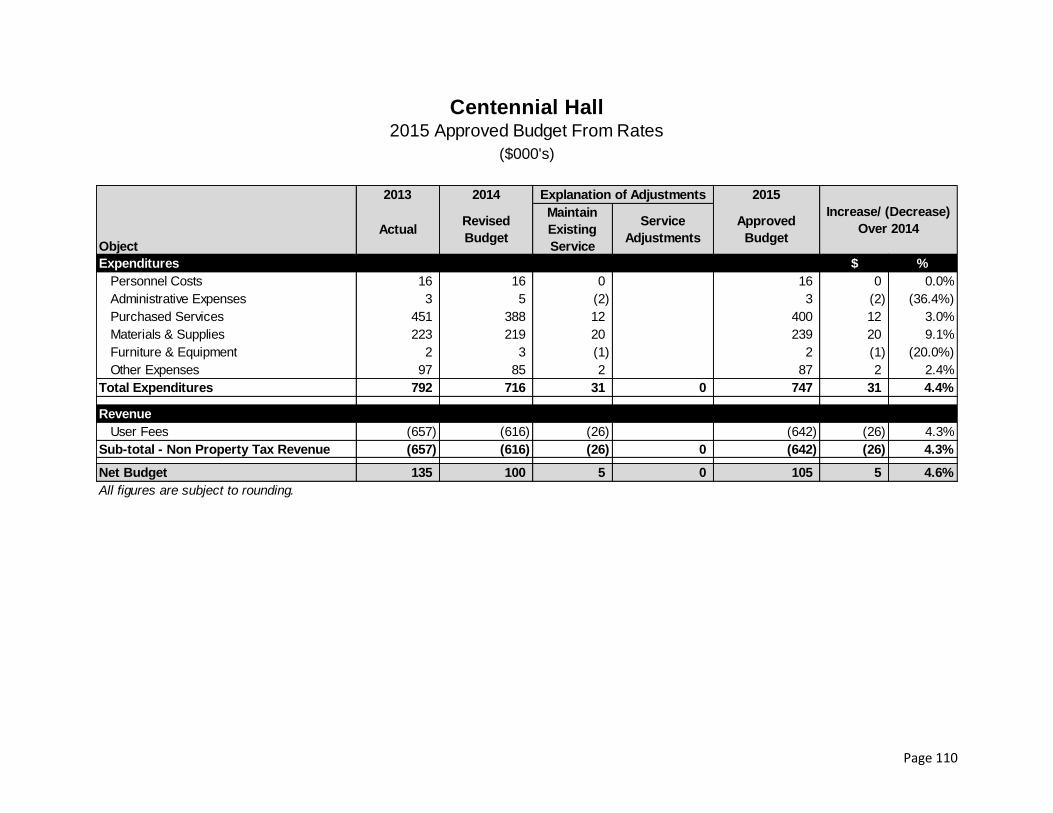
Page 110
2013 2014 2015
Object
ActualRevised
Budget
Maintain
Existing
Service
Service
Adjustments
Approved
Budget
Expenditures $ %
Personnel Costs 16 16 0 16 0 0.0%
Administrative Expenses 3 5 (2) 3 (2) (36.4%)
Purchased Services 451 388 12 400 12 3.0%
Materials & Supplies 223 219 20 239 20 9.1%
Furniture & Equipment 2 3 (1) 2 (1) (20.0%)
Other Expenses 97 85 2 87 2 2.4%
Total Expenditures 792 716 31 0 747 31 4.4%
Revenue
User Fees (657) (616) (26) (642) (26) 4.3%
Sub-total - Non Property Tax Revenue (657) (616) (26) 0 (642) (26) 4.3%
Net Budget 135 100 5 0 105 5 4.6%
All figures are subject to rounding.
Centennial Hall2015 Approved Budget From Rates
Explanation of Adjustments
Increase/ (Decrease)
Over 2014
($000's)

Page 111
2013 2014 2015
Object
ActualRevised
Budget
Maintain
Existing
Service
Service
Adjustments
Approved
Budget
Expenditures $ %
Personnel Costs 226 238 (1) 237 (1) (0.3%)
Administrative Expenses 8 10 0 10 0 0.0%
Financial Expenses 139 0 0 0 0 0.0%
Purchased Services 302 322 34 356 34 10.6%
Materials & Supplies 0 2 0 2 0 (10.0%)
Furniture & Equipment 1 1 0 1 0 42.9%
Transfers 1,371 1,607 40 1,647 40 2.5%
Total Expenditures 2,047 2,180 73 0 2,253 73 3.4%
Revenue
Sub-total - Non Property Tax
Revenue0 0 0 0 0 0 0.0%
Net Budget 2,047 2,180 73 0 2,253 73 3.4%
All figures are subject to rounding.
Arts, Culture & Heritage Advisory & Funding 2015 Approved Budget From Rates
Explanation of Adjustments
Increase/ (Decrease) Over
2014
($000's)

Page 112
2013 2014 2015
Object
ActualRevised
Budget
Maintain
Existing
Service
Service
Adjustments
Approved
Budget
Expenditures $ %
Personnel Costs 1,440 1,379 51 (55) 1,375 (4) (0.3%)
Exhibition & Program 526 419 (49) 370 (49) (11.7%)
Collection Management 238 93 13 106 13 13.7%
Facility Maintenance & Utilities 760 789 42 831 42 5.3%
Administration 202 180 (3) 177 (3) (1.5%)
Revenue Generation 255 281 41 322 41 14.6%
Total Expenditures 3,421 3,141 95 (55) 3,181 40 1.3%
Revenue
Government Grants & Subsidies (602) (414) 38 (376) 38 (9.1%)
User Fees (82) (103) 0 (103) 0 0.0%
Other (1,225) (1,074) (14) (1,088) (14) 1.3%
Sub-total - Non Property Tax
Revenue(1,909) (1,591) 24 0 (1,567) 24 (1.5%)
Net Budget 1,512 1,550 119 (55) 1,614 64 4.1%
All figures are subject to rounding.
Museum London2015 Approved Budget From Rates
Explanation of Adjustments
Increase/ (Decrease) Over
2014
($000's)
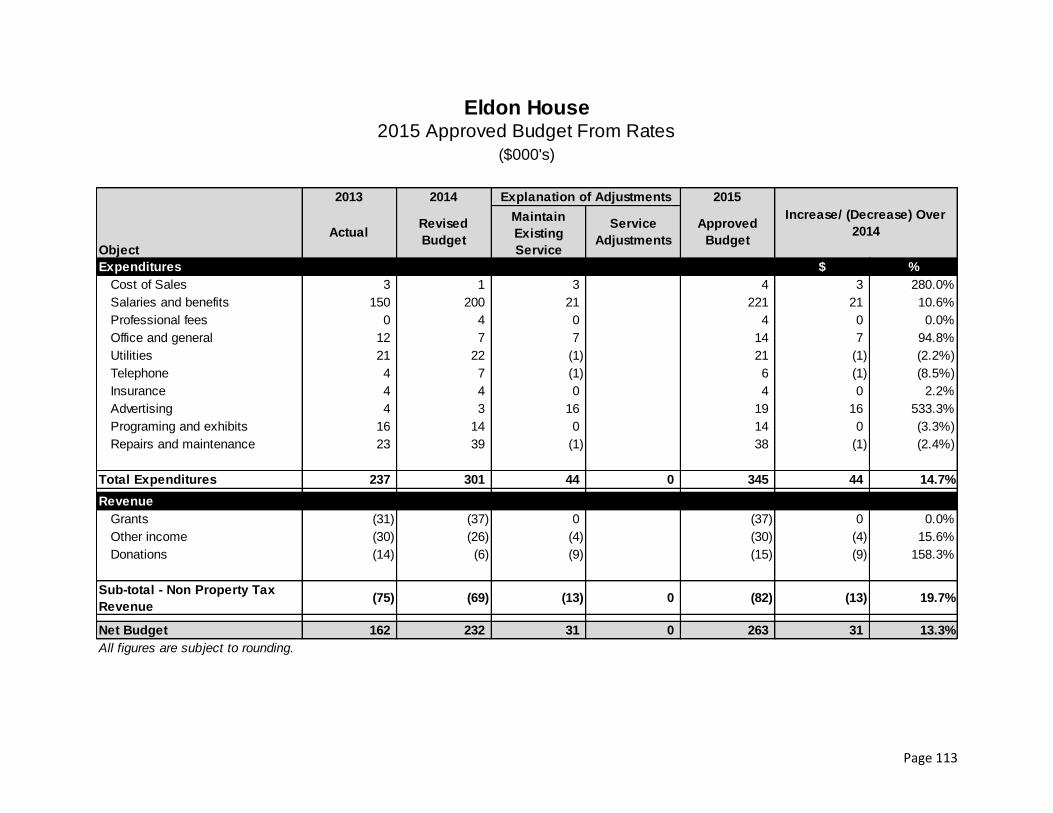
Page 113
2013 2014 2015
Object
ActualRevised
Budget
Maintain
Existing
Service
Service
Adjustments
Approved
Budget
Expenditures $ %
Cost of Sales 3 1 3 4 3 280.0%
Salaries and benefits 150 200 21 221 21 10.6%
Professional fees 0 4 0 4 0 0.0%
Office and general 12 7 7 14 7 94.8%
Utilities 21 22 (1) 21 (1) (2.2%)
Telephone 4 7 (1) 6 (1) (8.5%)
Insurance 4 4 0 4 0 2.2%
Advertising 4 3 16 19 16 533.3%
Programing and exhibits 16 14 0 14 0 (3.3%)
Repairs and maintenance 23 39 (1) 38 (1) (2.4%)
Total Expenditures 237 301 44 0 345 44 14.7%
Revenue
Grants (31) (37) 0 (37) 0 0.0%
Other income (30) (26) (4) (30) (4) 15.6%
Donations (14) (6) (9) (15) (9) 158.3%
Sub-total - Non Property Tax
Revenue(75) (69) (13) 0 (82) (13) 19.7%
Net Budget 162 232 31 0 263 31 13.3%
All figures are subject to rounding.
Eldon House2015 Approved Budget From Rates
Explanation of Adjustments
Increase/ (Decrease) Over
2014
($000's)

Page 114
2013 2014 2015
Object
ActualRevised
Budget
Maintain
Existing
Service
Service
Adjustments
Approved
Budget
Expenditures $ %
Personnel Costs 90 157 (12) 0 145 (12) (7.8%)
Total Expenditures 90 157 (12) 0 145 (12) (7.8%)
Net Budget 90 157 (12) 0 145 (12) (7.8%)
All figures are subject to rounding.
Heritage2015 Approved Budget From Rates
Explanation of Adjustments
Increase/ (Decrease) Over
2014
($000's)

Page 115
2013 2014 2015
Object
ActualRevised
Budget
Maintain
Existing
Service
Service
Adjustments
Approved
Budget
Expenditures $ %
Personnel Costs 14,137 14,425 190 14,615 190 1.3%
Administrative Expenses 100 92 (6) 86 (6) (6.7%)
Purchased Services 580 583 15 598 15 2.5%
Technology Services 428 510 (10) 500 (10) (1.9%)
Utilities 860 891 157 1,048 157 17.6%
Facilities Services 1,532 1,476 76 1,552 76 5.2%
Collections Materials & Supplies 2,045 2,025 (25) 2,000 (25) (1.2%)
Program Services 73 58 0 58 0 0.0%
General 15 6 0 6 0 0.0%
Reserve Fund Contribution 125 106 5 111 5 5.2%
Furniture and Equipment 23 44 0 44 0 0.0%
Total Expenditures 19,918 20,216 402 0 20,618 402 2.0%
Revenue
Provincial Grants (599) (599) 0 (599) 0 0.0%
Fines, Fees, etc. (467) (504) 45 (459) 45 (8.9%)
Operating Revenues (176) (148) (21) (169) (21) 14.2%
Rental Revenues (157) (200) (25) (225) (25) 12.5%
Business Revenue (53) (52) 0 (52) 0 0.0%
Reserve Fund Contribution (11) 0 0 0 0 0.0%
Sub-total - Non Property Tax
Revenue(1,463) (1,503) (1) 0 (1,504) (1) 0.1%
Net Budget 18,455 18,713 401 0 19,114 401 2.1%
All figures are subject to rounding.
London Public Library2015 Approved Budget From Rates
Explanation of Adjustments
Increase/ (Decrease) Over
2014
($000's)

Page 116
ExpenseNon Tax
Revenue
Net Tax
SupportedExpense
Non Tax
Revenue
Net Tax
Supported
Business Attraction & Retention 11,954 - 11,954 10,159 - 10,159 (1,795) (15.0%)
Community Improvement /
Business Improvement Areas188 - 188 195 - 195 7 3.5%
London Convention Centre 5,864 (5,295) 569 5,632 (5,063) 569 0 0.0%
Tourism London 2,079 (215) 1,864 2,107 (215) 1,892 28 1.5%
Covent Garden Market 2,913 (2,913) - 2,943 (2,943) - 0 0.0%
Total Approved Economic
Prosperity Budget 22,998 (8,423) 14,575 21,036 (8,221) 12,815 (1,760) (12.1%)
Total Impact on Tax Levy from the Economic Prosperity Program (0.35%)
All figures are subject to rounding.
ECONOMIC PROSPERITY2015 Approved Budget
2014 2015
Net Increase/
(Decrease)
Over 2014
Tax
Supported
(%)
Revised Budget Approved Budget
($000's)

Page 117
ExpenseNon Tax
Revenue
Net Tax
SupportedExpense
Non Tax
Revenue
Net Tax
SupportedExpense
Non Tax
Revenue
Net Tax
Supported
Tax
Supported
(%)
Business Attraction &
Retention11,542 0 11,542 9,747 0 9,747 (1,795) 0 (1,795) (15.6%)
Corporate Investment &
Partnership412 0 412 412 0 412 0 0 0 0.0%
Total to Maintain
Existing Service Level11,954 0 11,954 10,159 0 10,159 (1,795) 0 (1,795) (15.0%)
All figures are subject to rounding.
Business Attraction & RetentionSummary of Approved 2015 Budget From Rates
Service
2014 2015Increase / (Decrease) Over Previous Year
Revised Budget Approved Budget
($000's)

Page 118
2013 2014 2015
Object
ActualRevised
Budget
Maintain
Existing
Service
Service
Adjustments
Approved
Budget
Expenditures $ %
LEDC 2,235 2,234 0 2,234 0 0.0%
Small Business Centre 174 177 0 177 0 0.0%
Tech Alliance 200 200 0 200 0 0.0%
Stiller Centre 204 208 5 213 5 2.2%
Contribution to Economic
Development Reserve Fund3,973 8,723 0 (1,800) 6,923 (1,800) (20.6%)
Total Expenditures 6,786 11,542 5 (1,800) 9,747 (1,795) (15.6%)
Revenue
Sub-total - Non Property Tax
Revenue0 0 0 0 0 0 0.0%
Net Budget 6,786 11,542 5 (1,800) 9,747 (1,795) (15.6%)
All figures are subject to rounding.
Business Attraction & Retention2015 Approved Budget From Rates
Explanation of Adjustments
Increase/ (Decrease) Over
2014
($000's)

Page 119
2013 2014 2015
Object
ActualRevised
Budget
Maintain
Existing
Service
Service
Adjustments
Approved
Budget
Expenditures $ %
Personnel Costs 404 337 6 343 6 1.7%
Administrative Expenses 11 17 0 17 0 0.6%
Purchased Services 19 39 2 41 2 4.6%
Materials & Supplies 0 8 (4) 4 (4) (50.0%)
Furniture & Equipment 5 11 (4) 7 (4) (34.8%)
Total Expenditures 439 412 0 0 412 0 0.0%
Revenue
Sub-total - Non Property Tax
Revenue0 0 0 0 0 0 0.0%
Net Budget 439 412 0 0 412 0 0.0%
All figures are subject to rounding.
Corporate Investment & Partnership2015 Approved Budget From Rates
Explanation of Adjustments
Increase/ (Decrease) Over
2014
($000's)

Page 120
2013 2014 2015
Object
ActualRevised
Budget
Maintain
Existing
Service
Service
Adjustments
Approved
Budget
Expenditures $ %
Personnel Costs 80 82 6 0 89 7 8.0%
Purchased Services 159 106 0 0 106 0 0.0%
Transfers 10 0 0 0 0 0 0.0%
Total Expenditures 249 188 6 0 195 7 3.5%
Revenue
Other Municipal Revenues (10) 0 0 0 0 0 0.0%
Sub-total - Non Property Tax
Revenue(10) 0 0 0 0 0 0.0%
Net Budget 239 188 6 0 195 7 3.5%
All figures are subject to rounding.
Community Improvement / Business Improvement Areas2015 Approved Budget From Rates
Explanation of Adjustments
Increase/ (Decrease) Over
2014
($000's)

Page 121
2013 2014 2015
Object
ActualRevised
Budget
Maintain
Existing
Service
Service
Adjustments
Approved
Budget
Expenditures $ %
Personnel Costs 2,401 2,567 71 2,638 71 2.8%
Administrative Expenses 1,136 1,430 (215) 1,215 (215) (15.1%)
Building Reserve Fund 600 597 0 597 0 0.0%
Purchased Services 45 49 0 49 0 (0.5%)
Materials & Supplies 981 1,153 (87) 1,066 (87) (7.5%)
Other Expenses 62 68 (1) 67 (1) (1.4%)
Total Expenditures 5,225 5,864 (232) 0 5,632 (232) (4.0%)
Revenue
User Fees (4,625) (5,295) 232 (5,063) 232 (4.4%)
Sub-total - Non Property Tax
Revenue(4,625) (5,295) 232 0 (5,063) 232 (4.4%)
Net Budget 600 569 0 0 569 0 0.0%
All figures are subject to rounding.
London Convention Centre2015 Approved Budget From Rates
Explanation of Adjustments
Increase/ (Decrease) Over
2014
($000's)

Page 122
2013 2014 2015
Object
ActualRevised
Budget
Maintain
Existing
Service
Service
Adjustments
Approved
Budget
Expenditures $ %
Personnel Costs 1,078 1,247 0 1,247 0 0.0%
Administrative Expenses 14 17 0 17 0 0.0%
Financial Expenses 54 15 (4) 11 (4) (25.3%)
Purchased Services 528 414 32 446 32 7.8%
Materials & Supplies 6 15 0 15 0 0.0%
Furniture & Equipment 7 6 0 6 0 0.8%
Other Expenses 340 365 0 365 0 0.0%
Total Expenditures 2,027 2,079 28 0 2,107 28 1.4%
Revenue
User Fees (190) (208) 0 (208) 0 0.0%
Other Municipal Revenues (5) (7) 0 (7) 0 0.0%
Sub-total - Non Property Tax
Revenue(195) (215) 0 0 (215) 0 0.0%
Net Budget 1,832 1,864 28 0 1,892 28 1.5%
All figures are subject to rounding.
Tourism London2015 Approved Budget From Rates
Explanation of Adjustments
Increase/ (Decrease) Over
2014
($000's)

Page 123
2013 2014 2015
Object
ActualRevised
Budget
Maintain
Existing
Service
Service
Adjustments
Approved
Budget
Expenditures $ %
Personnel Costs 396 426 6 432 6 1.5%
Administrative Expenses 389 407 37 444 37 9.0%
Financial Expenses 388 493 (82) 411 (82) (16.7%)
Purchased Services 1,182 1,154 (6) 1,148 (6) (0.5%)
Materials & Supplies 329 307 22 329 22 7.2%
Furniture & Equipment 133 126 53 179 53 42.3%
Total Expenditures 2,817 2,913 30 0 2,943 30 1.0%
Revenue
User Fees (2,684) (2,786) 23 (2,763) 23 (0.8%)
Drawdown from reserves (133) (127) (53) (180) (53) 42.3%
Sub-total - Non Property Tax
Revenue(2,817) (2,913) (30) 0 (2,943) (30) 1.0%
Net Budget 0 0 0 0 0 0 0.0%
All figures are subject to rounding.
Covent Garden Market2015 Approved Budget From Rates
Explanation of Adjustments
Increase/ (Decrease) Over
2014
($000's)

Page 124
ExpenseNon Tax
Revenue
Net Tax
SupportedExpense
Non Tax
Revenue
Net Tax
Supported
Kettle Creek Conservation
Authority1,806 (1,413) 393 1,845 (1,433) 412 19 4.9%
Lower Thames Valley
Conservation Authority2,506 (2,413) 93 2,619 (2,519) 100 7 7.9%
Upper Thames River Conservation
Authority11,871 (9,145) 2,726 11,804 (8,918) 2,886 160 5.9%
Environmental Action Programs &
Reporting848 (114) 734 851 (116) 735 1 0.1%
Garbage,Recycling & Composting 24,538 (11,255) 13,283 25,549 (12,020) 13,529 246 1.9%
Total Approved Environmental
Services Budget41,569 (24,340) 17,229 42,668 (25,006) 17,662 433 2.5%
Total Impact on Tax Levy from the Environmental Services Program 0.09%
All figures are subject to rounding.
ENVIRONMENTAL SERVICES2015 Approved Budget
2014 2015
Net Increase/
(Decrease)
Over 2014
Tax
Supported
(%)
Revised Budget Approved Budget
($000's)

Page 125
2013 2014 2015
Object
ActualRevised
Budget
Maintain
Existing
Service
Service
Adjustments
Approved
Budget
Expenditures $ %
Administration 100 112 0 112 0 0.0%
Wages and Benefits 1,084 986 17 1,003 17 1.7%
Conservation Awareness 70 46 0 46 0 0.0%
Conservation Lands 431 318 7 325 7 2.2%
Environmental Protection 218 289 8 297 8 2.8%
Public Safety 63 55 7 62 7 12.7%
Total Expenditures 1,966 1,806 39 0 1,845 39 2.2%
Revenue
User Fees (877) (815) (10) (825) (10) 1.2%
Government Grant (119) (119) 0 (119) 0 0.0%
Other Municipal Levy (328) (337) (10) (347) (10) 3.0%
Other Revenue (277) (142) 0 (142) 0 0.0%
Sub-total - Non Property Tax
Revenue(1,601) (1,413) (20) 0 (1,433) (20) 1.4%
Net Budget 365 393 19 0 412 19 4.9%
All figures are subject to rounding.
Kettle Creek Conservation Authority2015 Approved Budget From Rates
Explanation of Adjustments
Increase/ (Decrease) Over
2014
($000's)

Page 126
2013 2014 2015
Object
ActualRevised
Budget
Maintain
Existing
Service
Service
Adjustments
Approved
Budget
Expenditures $ %
Flood Control 189 238 2 240 2 1.1%
Erosion Control 24 25 3 28 3 12.5%
Flood Forecasting & Warning 170 249 0 249 0 0.0%
Planning and Regulation 71 77 62 139 62 87.3%
Technical Studies 13 14 0 14 0 0.0%
Conservation Services 231 266 9 275 9 3.9%
Conservation and Recreation 474 497 23 520 23 4.9%
Community Relations 167 161 4 165 4 2.4%
Conservation Education 97 115 5 120 5 5.2%
Ska-Nah-Doht Iroquoian Village 223 245 5 250 5 2.2%
Groundwater Monitoring 12 12 2 14 2 16.7%
Employment Programs (Fed/Prov) 19 100 0 100 0 0.0%
Watershed Planning-Source Protection 45 25 0 25 0 0.0%
Technical Studies-Generic Regulations 71 72 (45) 27 (45) (63.4%)
Chatham-Kent Greening Project 362 330 10 340 10 2.8%
Aerial Photography 0 11 0 11 0 0.0%
McGregor Creek-Rivard Dam Repair 43 10 0 10 0 0.0%
Admin Building Repairs 35 11 30 41 30 85.7%
Community Trees Initiative 3 12 3 15 3 100.0%
Union Gas Centennial Project 12 16 0 16 0 0.0%
Thames Mouth Debris Removal 15 20 0 20 0 0.0%
Total Expenditures 2,276 2,506 113 0 2,619 113 4.5%
Revenue
Government Grants & Subsidies (579) (490) (25) (515) (25) 5.1%
User Fees (598) (680) (25) (705) (25) 3.7%
Foundation Grants/Revenues (29) (41) (4) (45) (4) 9.8%
Other Municipal Revenues (982) (1,202) (52) (1,254) (52) 4.3%
Sub-total - Non Property Tax
Revenue(2,188) (2,413) (106) 0 (2,519) (106)
4.4%
Net Budget 88 93 7 0 100 7 7.9%
All figures are subject to rounding.
Lower Thames Valley Conservation Authority2015 Approved Budget From Rates
Explanation of Adjustments
Increase/ (Decrease) Over
2014
($000's)

Page 127
2013 2014 2015
Object
ActualRevised
Budget
Maintain
Existing
Service
Service
Adjustments
Approved
Budget
Expenditures $ %
Personnel Costs 5,967 5,920 69 5,989 69 1.2%
Materials & Supplies 1,902 1,536 (148) 1,388 (148) (9.6%)
Capital Contracts, Capital Mtce. & Op. Resv. 2,184 804 (91) 713 (91) (11.2%)
Taxes/Insurance 416 443 (1) 442 (1) (0.3%)
Utilities 310 324 0 324 0 0.0%
Legal Fees 35 20 0 20 0 0.0%
Allocated Costs (includes occupancy,
information systems, motor pool, marketing,
administration and finance)
2,815 2,824 104 2,928 104 3.7%
Total Expenditures 13,629 11,871 (67) 0 11,804 (67) (0.6%)
Revenue
Government Grants & Subsidies (3,494) (1,868) 215 (1,653) 215 (11.5%)
User Fees & Direct Revenue (6,071) (5,780) 88 (5,692) 88 (1.5%)
Other Municipal Revenues (1,425) (1,497) (76) (1,573) (76) 5.1%
Sub-total - Non Property Tax Revenue (10,990) (9,145) 227 0 (8,918) 227 (2.5%)
Net Budget 2,639 2,726 160 0 2,886 160 5.9%
All figures are subject to rounding.
Upper Thames River Conservation Authority2015 Approved Budget From Rates
Explanation of
Increase/ (Decrease) Over
2014
($000's)

Page 128
2013 2014 2015
Object
ActualRevised
Budget
Maintain
Existing
Service
Service
Adjustments
Approved
Budget
Expenditures $ %
Personnel Costs 623 595 (2) 593 (2) (0.3%)
Administrative Expenses 0 1 0 1 0 0.0%
Financial Expenses 20 0 0 0 0 0.0%
Purchased Services 194 244 3 247 3 1.3%
Materials & Supplies 5 3 1 4 1 33.3%
Furniture & Equipment 6 5 1 6 1 15.9%
Other Expenses 2 0 0 0 0 0.0%
Recovered Expenses 0 0 0 0 0 0.0%
Total Expenditures 850 848 3 0 851 3 0.4%
Revenue
Other Municipal Revenues (138) (114) (2) (116) (2) 1.9%
Sub-total - Non Property Tax
Revenue(138) (114) (2) 0 (116) (2) 1.9%
Net Budget 712 734 1 0 735 1 0.1%
All figures are subject to rounding.
Environmental Action Programs2015 Approved Budget From Rates
Explanation of Adjustments
Increase/ (Decrease) Over
2014
($000's)

Page 129
ExpenseNon Tax
Revenue
Net Tax
SupportedExpense
Non Tax
Revenue
Net Tax
SupportedExpense
Non Tax
Revenue
Net Tax
Supported
Tax
Supported
(%)
Recycling & Composting 12,031 (7,575) 4,456 12,892 (8,770) 4,122 861 (1,195) (334) (7.5%)
Garbage Collection &
Disposal12,507 (3,680) 8,827 12,657 (3,250) 9,407 150 430 580 6.6%
Total to Maintain
Existing Service Level24,538 (11,255) 13,283 25,549 (12,020) 13,529 1,011 (765) 246 1.9%
All figures are subject to rounding.
Garbage Recycling & CompostingSummary of Approved 2015 Budget From Rates
2014 2015Increase / (Decrease) Over Previous Year
Revised Budget Approved Budget
Service
($000's)

Page 130
2013 2014 2015
Object
ActualRevised
Budget
Maintain
Existing
Service
Service
Adjustments
Approved
Budget
Expenditures $ %
Personnel Costs 385 820 36 856 36 4.4%
Administrative Expenses 2 2 0 2 0 12.5%
Financial Expenses 29 0 0 0 0 0.0%
Purchased Services 10,147 10,526 306 10,832 306 2.9%
Materials & Supplies 12 13 0 13 0 0.0%
Furniture & Equipment 29 41 (4) 37 (4) (10.1%)
Transfers 378 625 515 1,140 515 82.4%
Other Expenses 263 4 8 12 8 200.0%
Recovered Expenses (1) 0 0 0 0 0.0%
Total Expenditures 11,244 12,031 861 0 12,892 861 7.2%
Revenue
User Fees (545) (655) (325) (980) (325) 49.6%
Other Municipal Revenues (6,803) (6,920) (870) (7,790) (870) 12.6%
Sub-total - Non Property Tax
Revenue(7,348) (7,575) (1,195) 0 (8,770) (1,195) 15.8%
Net Budget 3,896 4,456 (334) 0 4,122 (334) (7.5%)
All figures are subject to rounding.
Recycling & Composting2015 Approved Budget From Rates
Explanation of Adjustments
Increase/ (Decrease) Over
2014
($000's)

Page 131
2013 2014 2015
Object
ActualRevised
Budget
Maintain
Existing
Service
Service
Adjustments
Approved
Budget
Expenditures $ %
Personnel Costs 6,666 6,375 83 6,458 83 1.3%
Administrative Expenses 77 79 (4) 75 (4) (5.0%)
Financial Expenses (268) 87 0 87 0 0.0%
Purchased Services 695 792 (66) 726 (66) (8.3%)
Materials & Supplies 325 207 40 247 40 19.2%
Furniture & Equipment 4,277 4,562 (13) 4,549 (13) (0.3%)
Other Expenses 710 515 120 635 120 23.3%
Recovered Expenses (535) (110) (10) (120) (10) 9.1%
Total Expenditures 11,947 12,507 150 0 12,657 150 1.2%
Revenue
User Fees (3,366) (3,510) 435 (3,075) 435 (12.4%)
Other Municipal Revenues (153) (170) (5) (175) (5) 2.9%
Sub-total - Non Property Tax
Revenue(3,519) (3,680) 430 0 (3,250) 430 (11.7%)
Net Budget 8,428 8,827 580 0 9,407 580 6.6%
All figures are subject to rounding.
Garbage Collection & Disposal2015 Approved Budget From Rates
Explanation of Adjustments
Increase/ (Decrease) Over
2014
($000's)

Page 132
ExpenseNon Tax
Revenue
Net Tax
SupportedExpense
Non Tax
Revenue
Net Tax
Supported
Neighbourhood & Recreation
Services60,399 (41,861) 18,538 62,904 (44,098) 18,806 268 1.4%
Parks & Urban Forestry 11,223 (40) 11,183 11,593 (51) 11,542 359 3.2%
Total Approved Parks,
Recreation & Neighbourhood
Services Budget
71,622 (41,901) 29,721 74,497 (44,149) 30,348 627 2.1%
Total Impact on Tax Levy from the Parks, Recreation & Neighbourhood Services Program 0.13%
All figures are subject to rounding.
PARKS, RECREATION & NEIGHBOURHOOD SERVICES2015 Approved Budget
2014 2015
Net Increase/
(Decrease)
Over 2014
Tax
Supported
(%)
Revised Budget Approved Budget
($000's)

Page 133
ExpenseNon Tax
Revenue
Net Tax
SupportedExpense
Non Tax
Revenue
Net Tax
SupportedExpense
Non Tax
Revenue
Net Tax
Supported
Tax
Supported
(%)
Aquatics 3,303 (2,464) 839 3,426 (2,432) 994 123 32 155 18.5%
Arenas 7,494 (6,001) 1,493 7,520 (6,086) 1,434 26 (85) (59) (4.0%)
Children's Services 31,295 (24,471) 6,824 32,918 (26,094) 6,824 1,623 (1,623) 0 0.0%
Community Centres 3,113 (1,565) 1,548 3,486 (1,770) 1,716 373 (205) 168 10.9%
Community Development &
Funding3,275 0 3,275 3,459 (184) 3,275 184 (184) 0 0.0%
Community Recreation &
Leisure Programs 2,283 (1,300) 983 2,375 (1,403) 972 92 (103) (11) (1.1%)
Golf 3,691 (3,693) (2) 3,720 (3,720) 0 29 (27) 2 (100.0%)
Special Events Coordination 212 (152) 60 218 (156) 62 6 (4) 2 2.9%
Sports Services 1,790 (734) 1,056 1,767 (764) 1,003 (23) (30) (53) (5.0%)
Storybook Gardens 1,416 (1,364) 52 1,436 (1,422) 14 20 (58) (38) (73.3%)
Recreation Administration 2,527 (117) 2,410 2,579 (67) 2,512 52 50 102 4.2%
Total to Maintain
Existing Service Level60,399 (41,861) 18,538 62,904 (44,098) 18,806 2,505 (2,237) 268 1.4%
All figures are subject to rounding.
Neighbourhood & Recreation ServicesSummary of Approved 2015 Budget From Rates
Service
2014 2015Increase / (Decrease) Over Previous Year
Revised Budget Approved Budget
($000's)

Page 134
2013 2014 2015
Object
ActualRevised
Budget
Maintain
Existing
Service
Service
Adjustments
Approved
Budget
Expenditures $ %
Personnel Costs 2,643 2,832 118 0 2,950 118 4.2%
Administrative Expenses 25 27 0 0 27 0 0.0%
Financial Expenses 4 0 0 0 0 0 0.0%
Purchased Services 60 70 1 0 71 1 1.1%
Materials & Supplies 277 272 4 0 276 4 1.5%
Furniture & Equipment 133 102 0 0 102 0 0.0%
Other Expenses 47 0 0 0 0 0 0.0%
Recovered Expenses (14) 0 0 0 0 0 0.0%
Total Expenditures 3,175 3,303 123 0 3,426 123 3.7%
Revenue
User Fees (2,317) (2,464) 32 0 (2,432) 32 (1.3%)
Other Municipal Revenues (3) 0 0 0 0 0 0.0%
Sub-total - Non Property Tax
Revenue(2,320) (2,464) 32 0 (2,432) 32 (1.3%)
Net Budget 855 839 155 0 994 155 18.5%
All figures are subject to rounding.
Aquatics2015 Approved Budget From Rates
Explanation of Adjustments
Increase/ (Decrease) Over
2014
($000's)

Page 135
2013 2014 2015
Object
ActualRevised
Budget
Maintain
Existing
Service
Service
Adjustments
Approved
Budget
Expenditures $ %
Personnel Costs 3,973 4,246 60 0 4,306 60 1.4%
Administrative Expenses 85 79 (6) 0 73 (6) (7.8%)
Financial Expenses 15 0 0 0 0 0 0.0%
Purchased Services 2,555 2,659 (27) 0 2,632 (27) (1.0%)
Materials & Supplies 236 187 10 0 197 10 5.2%
Furniture & Equipment 340 323 (11) 0 312 (11) (3.3%)
Other Expenses 105 0 0 0 0 0 0.0%
Recovered Expenses (92) 0 0 0 0 0 0.0%
Total Expenditures 7,217 7,494 26 0 7,520 26 0.3%
Revenue
Government Grants & Subsidies (25) (24) 5 0 (19) 5 (19.9%)
User Fees (5,781) (5,872) (90) 0 (5,962) (90) 1.5%
Other Municipal Revenues (138) (105) 0 0 (105) 0 0.0%
Sub-total - Non Property Tax
Revenue(5,944) (6,001) (85) 0 (6,086) (85) 1.4%
Net Budget 1,273 1,493 (59) 0 1,434 (59) (4.0%)
All figures are subject to rounding.
Arenas2015 Approved Budget From Rates
Explanation of Adjustments
Increase/ (Decrease) Over
2014
($000's)
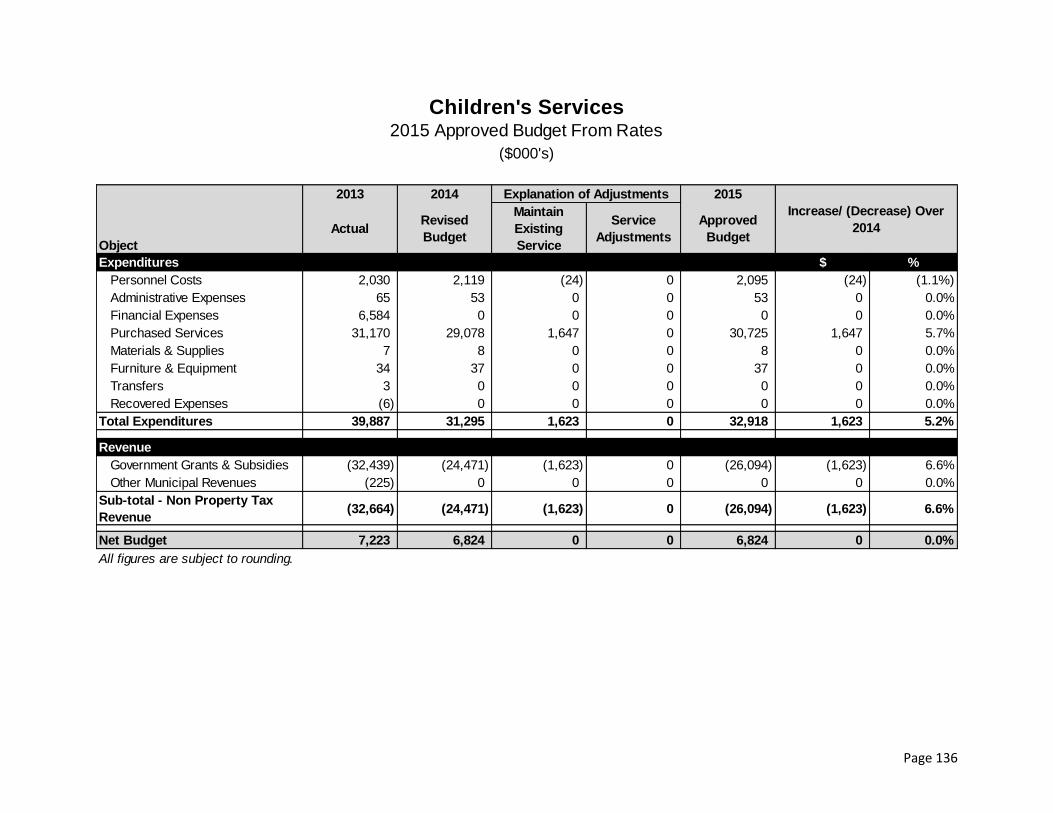
Page 136
2013 2014 2015
Object
ActualRevised
Budget
Maintain
Existing
Service
Service
Adjustments
Approved
Budget
Expenditures $ %
Personnel Costs 2,030 2,119 (24) 0 2,095 (24) (1.1%)
Administrative Expenses 65 53 0 0 53 0 0.0%
Financial Expenses 6,584 0 0 0 0 0 0.0%
Purchased Services 31,170 29,078 1,647 0 30,725 1,647 5.7%
Materials & Supplies 7 8 0 0 8 0 0.0%
Furniture & Equipment 34 37 0 0 37 0 0.0%
Transfers 3 0 0 0 0 0 0.0%
Recovered Expenses (6) 0 0 0 0 0 0.0%
Total Expenditures 39,887 31,295 1,623 0 32,918 1,623 5.2%
Revenue
Government Grants & Subsidies (32,439) (24,471) (1,623) 0 (26,094) (1,623) 6.6%
Other Municipal Revenues (225) 0 0 0 0 0 0.0%
Sub-total - Non Property Tax
Revenue(32,664) (24,471) (1,623) 0 (26,094) (1,623) 6.6%
Net Budget 7,223 6,824 0 0 6,824 0 0.0%
All figures are subject to rounding.
Children's Services2015 Approved Budget From Rates
Explanation of Adjustments
Increase/ (Decrease) Over
2014
($000's)

Page 137
2013 2014 2015
Object
ActualRevised
Budget
Maintain
Existing
Service
Service
Adjustments
Approved
Budget
Expenditures $ %
Personnel Costs 2,420 2,462 167 82 2,711 249 10.1%
Administrative Expenses 27 29 2 0 31 2 5.7%
Financial Expenses 35 0 0 0 0 0 0.0%
Purchased Services 153 226 65 0 291 65 28.8%
Materials & Supplies 404 357 56 0 413 56 15.6%
Furniture & Equipment 63 36 1 0 37 1 1.7%
Other Expenses 5 3 0 0 3 0 0.0%
Recovered Expenses 0 0 0 0 0 0 0.0%
Total Expenditures 3,107 3,113 291 82 3,486 373 12.0%
Revenue
Government Grants & Subsidies (165) (128) 0 0 (128) 0 0.0%
User Fees (1,299) (1,302) (72) 0 (1,374) (72) 5.5%
Other Municipal Revenues (146) (135) (133) 0 (268) (133) 98.3%
Sub-total - Non Property Tax
Revenue(1,610) (1,565) (205) 0 (1,770) (205) 13.1%
Net Budget 1,497 1,548 86 82 1,716 168 10.9%
All figures are subject to rounding.
Community Centres2015 Approved Budget From Rates
Explanation of Adjustments
Increase/ (Decrease) Over
2014
($000's)

Page 138
2013 2014 2015
Object
ActualRevised
Budget
Maintain
Existing
Service
Service
Adjustments
Approved
Budget
Expenditures $ %
Personnel Costs 579 523 15 0 538 15 2.9%
Administrative Expenses 12 13 0 0 13 0 0.0%
Purchased Services 292 342 (15) 0 327 (15) (4.5%)
Materials & Supplies 20 26 0 0 26 0 0.0%
Furniture & Equipment 0 0 0 0 0 0 0.0%
Transfers 2,225 2,371 0 184 2,555 184 7.8%
Other Expenses 0 0 0 0 0 0 0.0%
Total Expenditures 3,128 3,275 0 184 3,459 184 5.6%
Revenue
User Fees (2) 0 0 0 0 0 0.0%
Transfer from Reserve 0 0 0 (184) (184) (184) 0.0%
Other Municipal Revenues (11) 0 0 0 0 0 0.0%
Sub-total - Non Property Tax
Revenue(13) 0 0 (184) (184) (184) 0.0%
Net Budget 3,115 3,275 0 0 3,275 0 0.0%
All figures are subject to rounding.
Community Development & Funding2015 Approved Budget From Rates
Explanation of Adjustments
Increase/ (Decrease) Over
2014
($000's)

Page 139
2013 2014 2015
Object
ActualRevised
Budget
Maintain
Existing
Service
Service
Adjustments
Approved
Budget
Expenditures $ %
Personnel Costs 1,805 1,939 92 0 2,031 92 4.8%
Administrative Expenses 41 40 0 0 40 0 0.7%
Financial Expenses 19 0 0 0 0 0 0.0%
Purchased Services 181 197 (2) 0 195 (2) (0.9%)
Materials & Supplies 81 106 2 0 108 2 1.6%
Furniture & Equipment 0 1 0 0 1 0 0.0%
Total Expenditures 2,127 2,283 92 0 2,375 92 4.1%
Revenue
Government Grants & Subsidies (11) 0 0 0 0 0 0.0%
User Fees (1,242) (1,300) (97) 0 (1,397) (97) 7.5%
Other Municipal Revenues 0 0 (6) 0 (6) (6) 0.0%
Sub-total - Non Property Tax
Revenue(1,253) (1,300) (103) 0 (1,403) (103) 7.9%
Net Budget 874 983 (11) 0 972 (11) (1.1%)
All figures are subject to rounding.
Community Recreation & Leisure Programs 2015 Approved Budget From Rates
Explanation of Adjustments
Increase/ (Decrease) Over
2014
($000's)

Page 140
2013 2014 2015
Object
ActualRevised
Budget
Maintain
Existing
Service
Service
Adjustments
Approved
Budget
Expenditures $ %
Personnel Costs 1,784 1,835 12 0 1,847 12 0.6%
Administrative Expenses 18 17 0 0 17 0 (2.3%)
Financial Expenses 171 268 (26) 0 242 (26) (9.6%)
Purchased Services 371 356 36 0 392 36 10.0%
Materials & Supplies 815 759 7 0 766 7 1.0%
Furniture & Equipment 435 449 0 0 449 0 0.0%
Other Expenses 9 9 0 0 9 0 0.0%
Recovered Expenses (8) (2) 0 0 (2) 0 0.0%
Total Expenditures 3,595 3,691 29 0 3,720 29 0.8%
Revenue
Government Grants & Subsidies (2,751) (2,884) (7) 0 (2,891) (7) 0.2%
User Fees (844) (809) (20) 0 (829) (20) 2.5%
Sub-total - Non Property Tax
Revenue(3,595) (3,693) (27) 0 (3,720) (27) 0.7%
Net Budget 0 (2) 2 0 0 2 (100.0%)
All figures are subject to rounding.
Golf2015 Approved Budget From Rates
Explanation of Adjustments
Increase/ (Decrease) Over
2014
($000's)
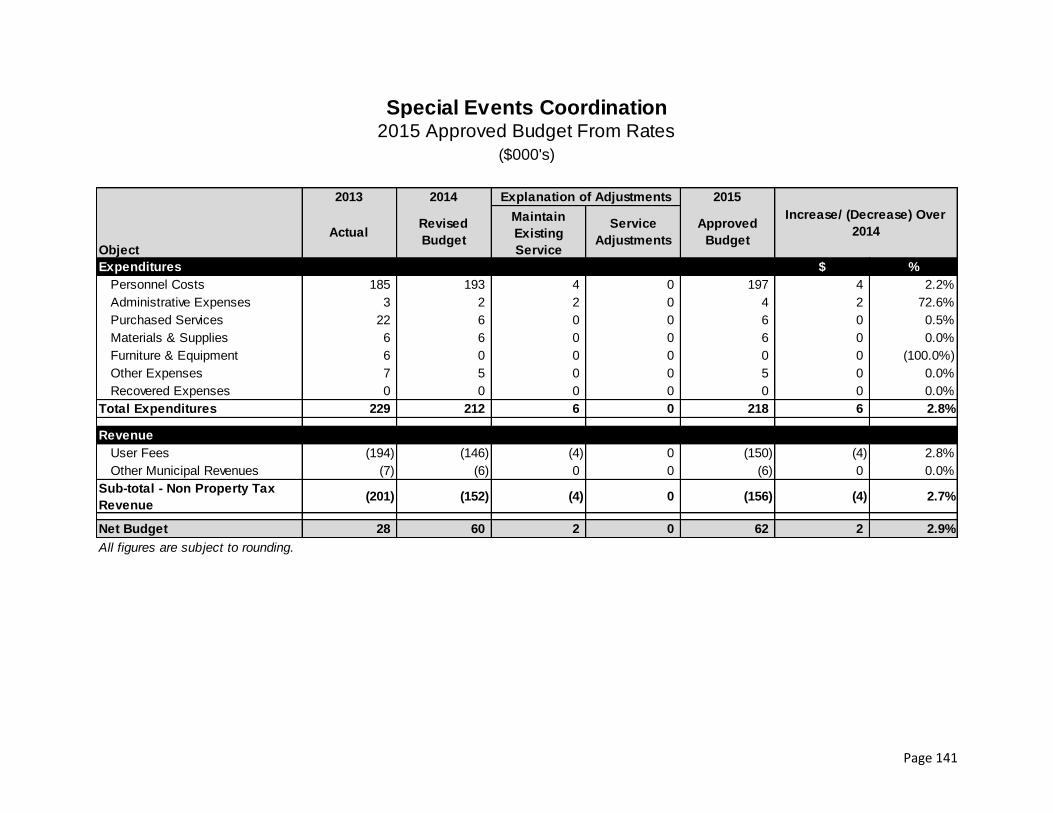
Page 141
2013 2014 2015
Object
ActualRevised
Budget
Maintain
Existing
Service
Service
Adjustments
Approved
Budget
Expenditures $ %
Personnel Costs 185 193 4 0 197 4 2.2%
Administrative Expenses 3 2 2 0 4 2 72.6%
Purchased Services 22 6 0 0 6 0 0.5%
Materials & Supplies 6 6 0 0 6 0 0.0%
Furniture & Equipment 6 0 0 0 0 0 (100.0%)
Other Expenses 7 5 0 0 5 0 0.0%
Recovered Expenses 0 0 0 0 0 0 0.0%
Total Expenditures 229 212 6 0 218 6 2.8%
Revenue
User Fees (194) (146) (4) 0 (150) (4) 2.8%
Other Municipal Revenues (7) (6) 0 0 (6) 0 0.0%
Sub-total - Non Property Tax
Revenue(201) (152) (4) 0 (156) (4) 2.7%
Net Budget 28 60 2 0 62 2 2.9%
All figures are subject to rounding.
Special Events Coordination2015 Approved Budget From Rates
Explanation of Adjustments
Increase/ (Decrease) Over
2014
($000's)

Page 142
2013 2014 2015
Object
ActualRevised
Budget
Maintain
Existing
Service
Service
Adjustments
Approved
Budget
Expenditures $ %
Personnel Costs 704 838 (47) 0 791 (47) (5.6%)
Administrative Expenses 4 2 0 0 2 0 0.0%
Purchased Services 165 194 0 0 194 0 0.0%
Materials & Supplies 364 304 17 0 321 17 5.8%
Furniture & Equipment 298 357 7 0 364 7 2.0%
Other Expenses 121 0 0 0 0 0 0.0%
Recovered Expenses (78) 0 0 0 0 0 0.0%
Transfers 86 95 0 0 95 0 0.0%
Total Expenditures 1,664 1,790 (23) 0 1,767 (23) (1.3%)
Revenue
User Fees (665) (734) (30) 0 (764) (30) 4.1%
Sub-total - Non Property Tax
Revenue(665) (734) (30) 0 (764) (30) 4.1%
Net Budget 999 1,056 (53) 0 1,003 (53) (5.0%)
All figures are subject to rounding.
Sports Services2015 Approved Budget From Rates
Explanation of Adjustments
Increase/ (Decrease) Over
2014
($000's)

Page 143
2013 2014 2015
Object
ActualRevised
Budget
Maintain
Existing
Service
Service
Adjustments
Approved
Budget
Expenditures $ %
Personnel Costs 750 779 33 0 812 33 4.2%
Administrative Expenses 6 10 (1) 0 9 (1) (8.4%)
Financial Expenses 45 17 3 0 20 3 15.0%
Purchased Services 245 307 (14) 0 293 (14) (4.6%)
Materials & Supplies 213 280 (8) 0 272 (8) (3.0%)
Furniture & Equipment 3 3 2 0 5 2 76.1%
Other Expenses 31 35 0 0 35 0 0.0%
Recovered Expenses (10) (15) 5 0 (10) 5 (33.3%)
Total Expenditures 1,283 1,416 20 0 1,436 20 1.4%
Revenue
Government Grants & Subsidies (16) 0 0 0 0 0 0.0%
User Fees (960) (1,056) (72) 0 (1,128) (72) 6.8%
Other Municipal Revenues (210) (308) 14 0 (294) 14 (4.6%)
Sub-total - Non Property Tax
Revenue(1,186) (1,364) (58) 0 (1,422) (58) 4.2%
Net Budget 97 52 (38) 0 14 (38) (73.3%)
All figures are subject to rounding.
Storybook Gardens2015 Approved Budget From Rates
Explanation of Adjustments
Increase/ (Decrease) Over
2014
($000's)
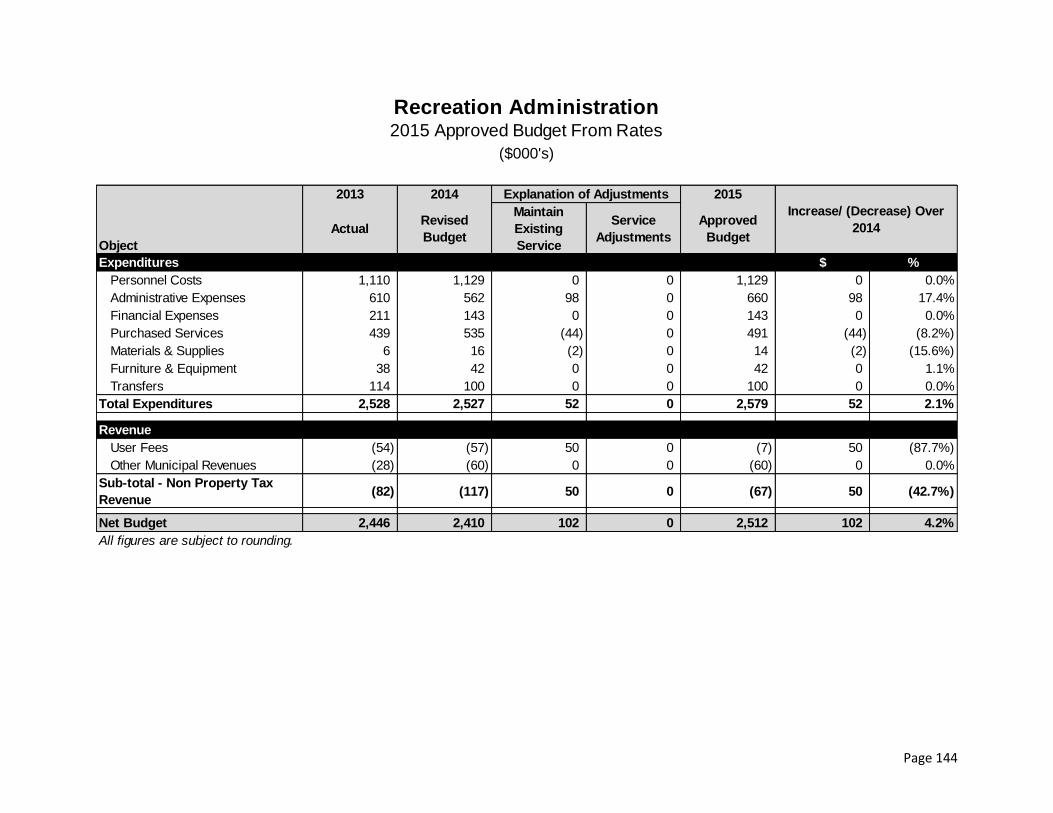
Page 144
2013 2014 2015
Object
ActualRevised
Budget
Maintain
Existing
Service
Service
Adjustments
Approved
Budget
Expenditures $ %
Personnel Costs 1,110 1,129 0 0 1,129 0 0.0%
Administrative Expenses 610 562 98 0 660 98 17.4%
Financial Expenses 211 143 0 0 143 0 0.0%
Purchased Services 439 535 (44) 0 491 (44) (8.2%)
Materials & Supplies 6 16 (2) 0 14 (2) (15.6%)
Furniture & Equipment 38 42 0 0 42 0 1.1%
Transfers 114 100 0 0 100 0 0.0%
Total Expenditures 2,528 2,527 52 0 2,579 52 2.1%
Revenue
User Fees (54) (57) 50 0 (7) 50 (87.7%)
Other Municipal Revenues (28) (60) 0 0 (60) 0 0.0%
Sub-total - Non Property Tax
Revenue(82) (117) 50 0 (67) 50 (42.7%)
Net Budget 2,446 2,410 102 0 2,512 102 4.2%
All figures are subject to rounding.
Recreation Administration2015 Approved Budget From Rates
Explanation of Adjustments
Increase/ (Decrease) Over
2014
($000's)

Page 145
ExpenseNon Tax
Revenue
Net Tax
SupportedExpense
Non Tax
Revenue
Net Tax
SupportedExpense
Non Tax
Revenue
Net Tax
Supported
Tax
Supported
(%)
Parks & Horticulture 6,977 0 6,977 7,076 0 7,076 99 0 99 1.4%
Parks & Natural Areas
Planning & Design1,324 0 1,324 1,368 0 1,368 44 0 44 3.3%
Urban Forestry 2,922 (40) 2,882 3,149 (51) 3,098 227 (11) 216 7.5%
Total to Maintain
Existing Service Level11,223 (40) 11,183 11,593 (51) 11,542 370 (11) 359 3.2%
All figures are subject to rounding.
Parks & Urban ForestrySummary of Approved 2015 Budget From Rates
Service
2014 2015Increase / (Decrease) Over Previous Year
Revised Budget Approved Budget
($000's)

Page 146
2013 2014 2015
Object
ActualRevised
Budget
Maintain
Existing
Service
Service
Adjustments
Approved
Budget
Expenditures $ %
Personnel Costs 4,202 4,441 109 0 4,550 109 2.5%
Administrative Expenses 44 38 11 0 49 11 29.0%
Financial Expenses 37 0 0 0 0 0 0.0%
Purchased Services 427 462 (40) 0 422 (40) (8.6%)
Materials & Supplies 518 629 (12) 0 617 (12) (1.9%)
Furniture & Equipment 1,386 1,466 33 0 1,499 33 2.2%
Other Expenses 348 0 0 0 0 0 0.0%
Recovered Expenses (385) (59) (2) 0 (61) (2) 3.3%
Total Expenditures 6,577 6,977 99 0 7,076 99 1.4%
Revenue
Other Municipal Revenues (36) 0 0 0 0 0 0.0%
Sub-total - Non Property Tax
Revenue(36) 0 0 0 0 0 0.0%
Net Budget 6,541 6,977 99 0 7,076 99 1.4%
All figures are subject to rounding.
Parks & Horticulture2015 Approved Budget From Rates
Explanation of Adjustments
Increase/ (Decrease) Over
2014
($000's)

Page 147
2013 2014 2015
Object
ActualRevised
Budget
Maintain
Existing
Service
Service
Adjustments
Approved
Budget
Expenditures $ %
Personnel Costs 763 805 2 0 807 2 0.3%
Administrative Expenses 8 10 1 0 11 1 5.2%
Financial Expenses 23 0 0 0 0 0 0.0%
Purchased Services 555 509 41 0 550 41 8.1%
Furniture & Equipment 1 0 0 0 0 0 0.0%
Recovered Expenses 0 0 0 0 0 0 0.0%
Total Expenditures 1,350 1,324 44 0 1,368 44 3.3%
Revenue
Sub-total - Non Property Tax
Revenue0 0 0 0 0 0 0.0%
Net Budget 1,350 1,324 44 0 1,368 44 3.3%
All figures are subject to rounding.
Parks & Natural Areas Planning & Design2015 Approved Budget From Rates
Explanation of Adjustments
Increase/ (Decrease) Over
2014
($000's)

Page 148
2013 2014 2015
Object
ActualRevised
Budget
Maintain
Existing
Service
Service
Adjustments
Approved
Budget
Expenditures $ %
Personnel Costs 1,445 1,761 50 146 1,957 196 11.1%
Administrative Expenses 22 24 0 3 27 3 12.5%
Purchased Services 584 564 0 0 564 0 0.0%
Materials & Supplies 46 26 0 0 26 0 0.0%
Furniture & Equipment 438 405 6 26 437 32 1.4%
Other Expenses 213 168 (13) 0 155 (13) (7.7%)
Recovered Expenses (26) (26) 9 0 (17) 9 (34.6%)
Total Expenditures 2,722 2,922 52 175 3,149 227 7.8%
Revenue
User Fees (44) (40) 2 0 (38) 2 (6.2%)
Other Municipal Revenues (127) 0 (13) 0 (13) (13) 0.0%
Sub-total - Non Property Tax
Revenue(171) (40) (11) 0 (51) (11) 25.9%
Net Budget 2,551 2,882 41 175 3,098 216 7.5%
All figures are subject to rounding.
Urban Forestry2015 Approved Budget From Rates
Explanation of Adjustments
Increase/ (Decrease) Over
2014
($000's)

Page 149
ExpenseNon Tax
Revenue
Net Tax
SupportedExpense
Non Tax
Revenue
Net Tax
Supported
Building Approvals 4,261 (5,439) (1,178) 4,310 (5,461) (1,151) 27 2.3%
City Planning & Research (Land
Use Planning)3,465 (290) 3,175 3,501 (300) 3,201 26 0.8%
Development Services 4,612 (932) 3,680 4,670 (919) 3,751 71 1.9%
Total Approved Planning &
Development Services Budget12,338 (6,661) 5,677 12,481 (6,680) 5,801 124 2.2%
Total Impact on Tax Levy from the Planning & Development Services Program 0.02%
All figures are subject to rounding.
PLANNING & DEVELOPMENT SERVICES2015 Approved Budget
2014 2015
Net Increase/
(Decrease)
Over 2014
Tax
Supported
(%)
Revised Budget Approved Budget
($000's)

Page 150
2013 2014 2015
Object
ActualRevised
Budget
Maintain
Existing
Service
Service
Adjustments
Approved
Budget
Expenditures $ %
Personnel Costs 3,701 4,034 31 4,065 31 0.8%
Administrative Expenses 54 45 7 52 7 15.4%
Financial Expenses 12 3 3 6 3 100.0%
Purchased Services 23 19 (1) 18 (1) (3.8%)
Materials & Supplies 34 19 (1) 18 (1) (5.2%)
Furniture & Equipment 156 141 10 151 10 7.3%
Other Expenses 0 0 0 0 0 0.0%
Recovered Expenses (3) 0 0 0 0 0.0%
Total Expenditures 3,977 4,261 49 0 4,310 49 1.2%
Revenue
User Fees (5,032) (5,427) (22) (5,449) (22) 0.4%
Other Municipal Revenues (1) (12) 0 (12) 0 1.9%
Sub-total - Non Property Tax
Revenue(5,033) (5,439) (22) 0 (5,461) (22) 0.4%
Net Budget (1,056) (1,178) 27 0 (1,151) 27 2.3%
All figures are subject to rounding.
Building Approvals2015 Approved Budget From Rates
Explanation of Adjustments
Increase/ (Decrease) Over
2014
($000's)

Page 151
2013 2014 2015
Object
ActualRevised
Budget
Maintain
Existing
Service
Service
Adjustments
Approved
Budget
Expenditures $ %
Personnel Costs 2,465 2,926 16 0 2,942 16 0.5%
Administrative Expenses 49 53 15 0 68 15 28.3%
Financial Expenses 85 0 0 0 0 0 0.0%
Purchased Services 405 416 5 0 421 5 1.2%
Materials & Supplies 43 62 0 0 62 0 0.0%
Furniture & Equipment 12 8 0 0 8 0 0.0%
Other Expenses 1 0 0 0 0 0 0.0%
Total Expenditures 3,060 3,465 36 0 3,501 36 1.0%
Revenue
User Fees (277) (290) (10) 0 (300) (10) 3.5%
Other Municipal Revenues 0 0 0 0 0 0 0.0%
Sub-total - Non Property Tax
Revenue(277) (290) (10) 0 (300) (10) 3.5%
Net Budget 2,783 3,175 26 0 3,201 26 0.8%
All figures are subject to rounding.
Land Use Planning2015 Approved Budget From Rates
($000's)
Explanation of Adjustments
Increase/ (Decrease) Over
2014

Page 152
2013 2014 2015
Object
ActualRevised
Budget
Maintain
Existing
Service
Service
Adjustments
Approved
Budget
Expenditures $ %
Personnel Costs 4,038 4,485 51 4,536 51 1.1%
Administrative Expenses 26 39 8 47 8 20.7%
Financial Expenses 190 0 0 0 0 0.0%
Purchased Services 13 25 (1) 24 (1) (6.0%)
Materials & Supplies 17 17 1 18 1 4.2%
Furniture & Equipment 23 46 (1) 45 (1) (1.7%)
Other Expenses 10 0 0 0 0 0.0%
Recovered Expenses (11) 0 0 0 0 0.0%
Total Expenditures 4,306 4,612 58 0 4,670 58 1.3%
Revenue
User Fees (754) (832) 15 (817) 15 (1.8%)
Other Municipal Revenues (1) (100) (2) (102) (2) 1.9%
Sub-total - Non Property Tax
Revenue(755) (932) 13 0 (919) 13 (1.4%)
Net Budget 3,551 3,680 71 0 3,751 71 1.9%
All figures are subject to rounding.
Development Services2015 Approved Budget From Rates
Explanation of Adjustments
Increase/ (Decrease) Over
2014
($000's)

Page 153
ExpenseNon Tax
Revenue
Net Tax
SupportedExpense
Non Tax
Revenue
Net Tax
Supported
Animal Services 2,784 (1,349) 1,435 2,882 (1,343) 1,539 104 7.2%
By-law Enforcement & Property
Standards3,009 (1,901) 1,108 3,051 (1,869) 1,182 74 6.7%
Corporate Security & Emergency
Management1,362 (39) 1,323 1,381 (40) 1,341 18 1.4%
Fire Services 55,567 (177) 55,390 55,844 (177) 55,667 277 0.5%
London Police Services 100,912 (8,435) 92,477 101,214 (8,048) 93,166 689 0.7%
Total Approved Protective
Services Budget163,634 (11,901) 151,733 164,372 (11,477) 152,895 1,162 0.8%
Total Impact on Tax Levy from the Protective Services Program 0.23%
All figures are subject to rounding.
PROTECTIVE SERVICES2015 Approved Budget
2014 2015
Net Increase/
(Decrease)
Over 2014
Tax
Supported
(%)
Revised Budget Approved Budget
($000's)

Page 154
2013 2014 2015
Object
ActualRevised
Budget
Maintain
Existing
Service
Service
Adjustments
Approved
Budget
Expenditures $ %
Personnel Costs 79 81 0 81 0 (0.6%)
Administrative Expenses 0 1 (1) 0 (1) (50.0%)
Purchased Services 2,311 2,606 117 2,723 117 4.5%
Materials & Supplies 13 1 (1) 0 (1) (50.0%)
Furniture & Equipment 88 95 (17) 78 (17) (18.5%)
Recovered Expenses (4) 0 0 0 0 0.0%
Total Expenditures 2,487 2,784 98 0 2,882 98 3.5%
Revenue
User Fees (1,213) (1,343) 0 (1,343) 0 0.0%
Other Municipal Revenues (17) (6) 6 0 6 (100.0%)
Sub-total - Non Property Tax
Revenue(1,230) (1,349) 6 0 (1,343) 6 (0.4%)
Net Budget 1,257 1,435 104 0 1,539 104 7.2%
All figures are subject to rounding.
Animal Services2015 Approved Budget From Rates
Explanation of Adjustments
Increase/ (Decrease) Over
2014
($000's)

Page 155
2013 2014 2015
Object
ActualRevised
Budget
Maintain
Existing
Service
Service
Adjustments
Approved
Budget
Expenditures $ %
Personnel Costs 2,581 2,597 84 2,681 84 3.3%
Administrative Expenses 0 23 0 23 0 1.9%
Financial Expenses 0 3 3 6 3 100.0%
Purchased Services 141 218 (29) 189 (29) (13.4%)
Materials & Supplies 6 37 (7) 30 (7) (18.0%)
Furniture & Equipment 132 131 (9) 122 (9) (7.1%)
Other Expenses 13 0 0 0 0 0.0%
Recovered Expenses (4) 0 0 0 0 0.0%
Total Expenditures 2,869 3,009 42 0 3,051 42 1.4%
Revenue
User Fees (1,418) (1,846) 33 (1,813) 33 (1.8%)
Other Municipal Revenues (72) (55) (1) (56) (1) 1.9%
Sub-total - Non Property Tax
Revenue(1,490) (1,901) 32 0 (1,869) 32 (1.7%)
Net Budget 1,379 1,108 74 0 1,182 74 6.7%
All figures are subject to rounding.
By-law Enforcement & Property Standards2015 Approved Budget From Rates
Explanation of Adjustments
Increase/ (Decrease) Over
2014
($000's)

Page 156
ExpenseNon Tax
Revenue
Net Tax
SupportedExpense
Non Tax
Revenue
Net Tax
SupportedExpense
Non Tax
Revenue
Net Tax
Supported
Tax
Supported
(%)
Emergency Management 236 (5) 231 237 (5) 232 1 0 1 0.1%
Corporate Security 1,126 (34) 1,092 1,144 (35) 1,109 18 (1) 17 1.6%
Total to Maintain
Existing Service Level1,362 (39) 1,323 1,381 (40) 1,341 19 (1) 18 1.4%
All figures are subject to rounding.
Corporate Security & Emergency ManagementSummary of Approved 2015 Budget From Rates
Service
2014 2015Increase / (Decrease) Over Previous Year
Revised Budget Approved Budget
($000's)

Page 157
2013 2014 2015
Object
ActualRevised
Budget
Maintain
Existing
Service
Service
Adjustments
Approved
Budget
Expenditures $ %
Personnel Costs 181 186 0 186 0 (0.1%)
Administrative Expenses 23 31 (1) 30 (1) (3.8%)
Purchased Services 17 13 1 14 1 11.0%
Materials & Supplies 6 5 0 5 0 4.2%
Furniture & Equipment 0 1 0 1 0 0.0%
Recovered Expenses (4) 0 0 0 0 0.0%
Total Expenditures 223 236 0 0 236 0 0.2%
Revenue
Other Municipal Revenues (23) (5) 0 0 (5) 0 1.9%
Sub-total - Non Property Tax
Revenue(23) (5) 0 0 (5) 0 1.9%
Net Budget 200 231 0 0 231 0 0.1%
All figures are subject to rounding.
Emergency Management2015 Approved Budget From Rates
Explanation of Adjustments
Increase/ (Decrease) Over
2014
($000's)
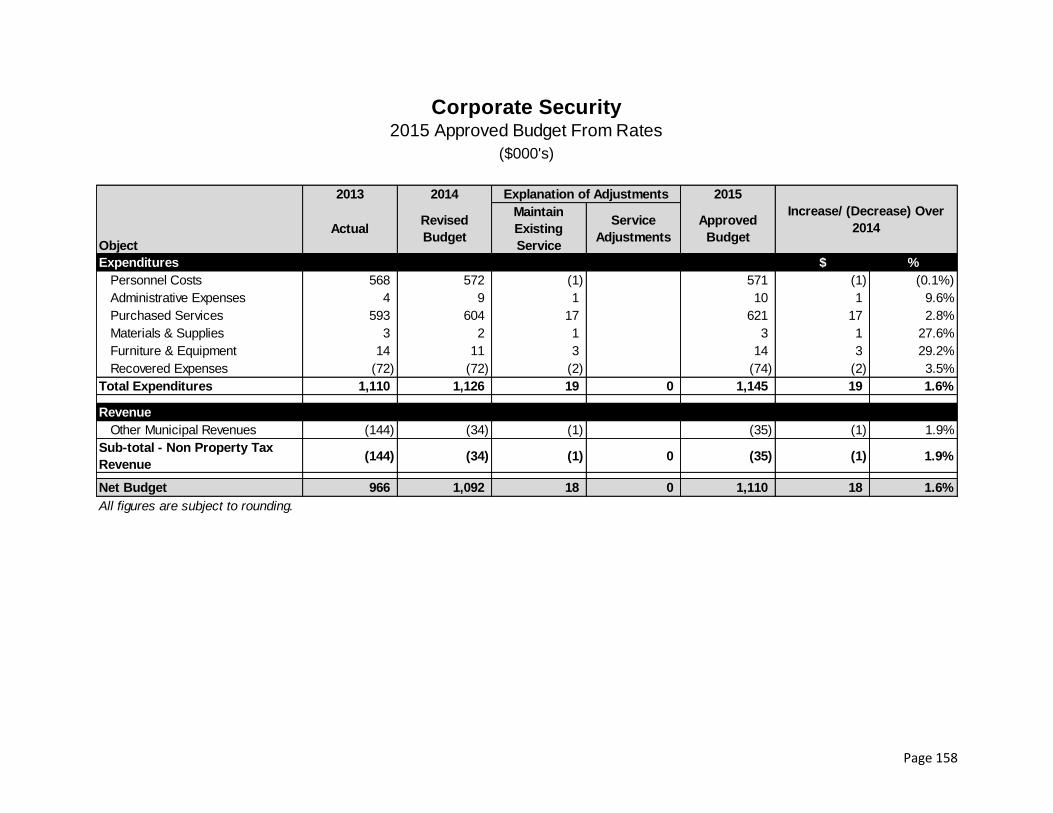
Page 158
2013 2014 2015
Object
ActualRevised
Budget
Maintain
Existing
Service
Service
Adjustments
Approved
Budget
Expenditures $ %
Personnel Costs 568 572 (1) 571 (1) (0.1%)
Administrative Expenses 4 9 1 10 1 9.6%
Purchased Services 593 604 17 621 17 2.8%
Materials & Supplies 3 2 1 3 1 27.6%
Furniture & Equipment 14 11 3 14 3 29.2%
Recovered Expenses (72) (72) (2) (74) (2) 3.5%
Total Expenditures 1,110 1,126 19 0 1,145 19 1.6%
Revenue
Other Municipal Revenues (144) (34) (1) (35) (1) 1.9%
Sub-total - Non Property Tax
Revenue(144) (34) (1) 0 (35) (1) 1.9%
Net Budget 966 1,092 18 0 1,110 18 1.6%
All figures are subject to rounding.
Corporate Security2015 Approved Budget From Rates
Explanation of Adjustments
Increase/ (Decrease) Over
2014
($000's)

Page 159
ExpenseNon Tax
Revenue
Net Tax
SupportedExpense
Non Tax
Revenue
Net Tax
SupportedExpense
Non Tax
Revenue
Net Tax
Supported
Tax
Supported
(%)
Fire & Rescue Services 52,851 (37) 52,814 52,751 (37) 52,714 (100) 0 (100) (0.2%)
Fire Prevention &
Education2,716 (140) 2,576 3,093 (140) 2,953 377 0 377 14.6%
Total to Maintain
Existing Service
Level
55,567 (177) 55,390 55,844 (177) 55,667 277 0 277 0.5%
All figures are subject to rounding.
Fire ServicesSummary of Approved 2015 Budget From Rates
($000's)
Service
2014 2015Increase / (Decrease) Over Previous Year
Revised Budget Approved Budget

Page 160
2013 2014 2015
Object
ActualRevised
Budget
Maintain
Existing
Service
Service
Adjustments
Approved
Budget
Expenditures $ %
Personnel Costs 50,291 50,448 51 (277) 50,222 (226) (0.4%)
Administrative Expenses 469 405 2 0 407 2 0.5%
Financial Expenses 36 0 0 0 0 0 0.0%
Purchased Services 486 451 39 0 490 39 8.7%
Materials & Supplies 1,058 1,245 91 0 1,336 91 7.3%
Furniture & Equipment 245 302 (6) 0 296 (6) (2.1%)
Other Expenses 0 0 0 0 0 0 0.0%
Total Expenditures 52,585 52,851 177 (277) 52,751 (100) (0.2%)
Revenue
User Fees (209) (37) 0 0 (37) 0 0.0%
Other Municipal Revenues (80) 0 0 0 0 0 0.0%
Sub-total - Non Property Tax
Revenue(289) (37) 0 0 (37) 0 0.0%
Net Budget 52,296 52,814 177 (277) 52,714 (100) (0.2%)
All figures are subject to rounding.
Fire & Rescue Services2015 Approved Budget From Rates
Explanation of Adjustments
Increase/ (Decrease) Over
2014
($000's)

Page 161
2013 2014 2015
Object
ActualRevised
Budget
Maintain
Existing
Service
Service
Adjustments
Approved
Budget
Expenditures $ %
Personnel Costs 2,261 2,604 355 0 2,959 355 13.6%
Administrative Expenses 0 1 0 0 1 0 0.0%
Materials & Supplies 116 80 2 0 82 2 3.1%
Furniture & Equipment 41 31 20 0 51 20 62.8%
Total Expenditures 2,418 2,716 377 0 3,093 377 13.9%
Revenue
User Fees (130) (140) 0 0 (140) 0 0.0%
Other Municipal Revenues (1) 0 0 0 0 0 0.0%
Sub-total - Non Property Tax
Revenue(131) (140) 0 0 (140) 0 0.0%
Net Budget 2,287 2,576 377 0 2,953 377 14.6%
All figures are subject to rounding.
Fire Prevention & Education2015 Approved Budget From Rates
Explanation of Adjustments
Increase/ (Decrease) Over
2014
($000's)

Page 162
ExpenseNon Tax
Revenue
Net Tax
SupportedExpense
Non Tax
Revenue
Net Tax
SupportedExpense
Non Tax
Revenue
Net Tax
Supported
Tax
Supported
(%)
Police Services Board 216 (51) 165 267 (51) 216 51 0 51 30.6%
Administration / Reserves 5,285 (1,102) 4,183 5,442 (524) 4,918 157 578 735 17.6%
Corporate Services 9,359 (598) 8,761 9,707 (599) 9,108 348 (1) 347 4.0%
Uniformed Division 54,205 (2,689) 51,516 54,127 (2,582) 51,545 (78) 107 29 0.1%
Criminal Investigation 18,272 (1,319) 16,953 18,111 (1,454) 16,657 (161) (135) (296) (1.7%)
Support Services 13,575 (2,676) 10,899 13,560 (2,838) 10,722 (15) (162) (177) (1.6%)
Totals 100,912 (8,435) 92,477 101,214 (8,048) 93,166 302 387 689 0.7%
93,166 689 0.7%
All figures are subject to rounding.
2015 APPROVED LONDON POLICE SERVICES
London Police Service2015 Approved Budget From Rates
Service
2014 2015Increase / (Decrease) Over Previous Year
Revised Budget Approved Budget
($000's)
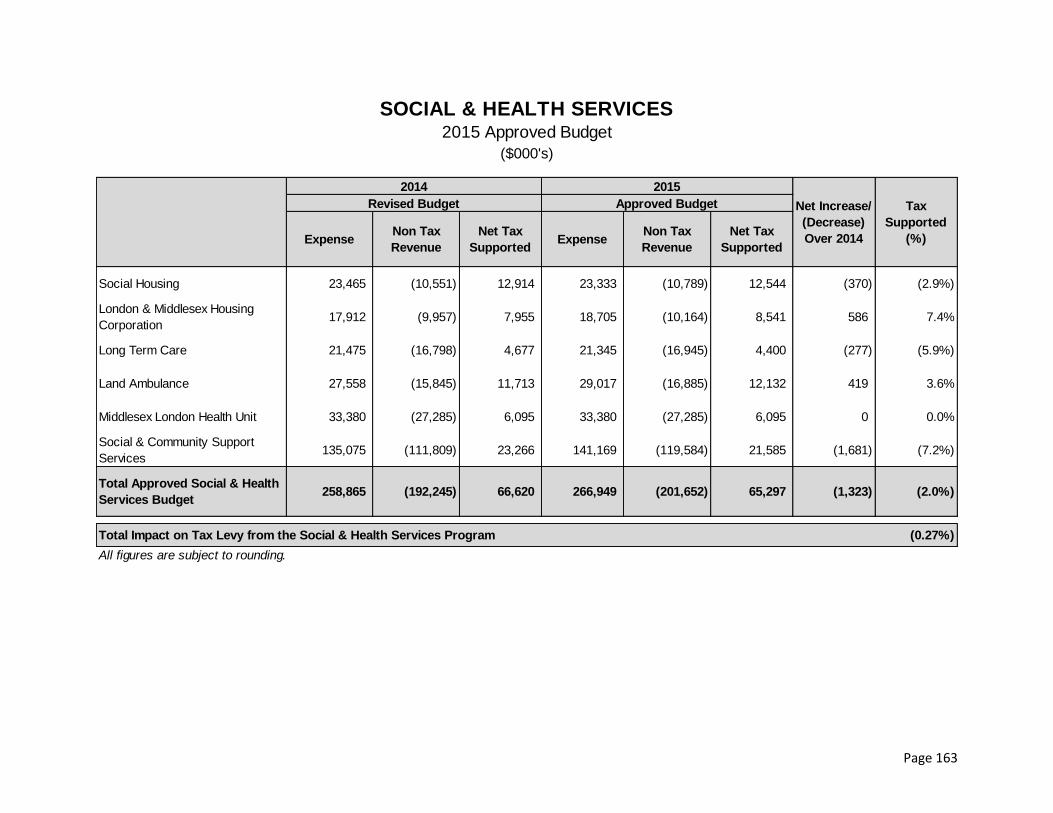
Page 163
ExpenseNon Tax
Revenue
Net Tax
SupportedExpense
Non Tax
Revenue
Net Tax
Supported
Social Housing 23,465 (10,551) 12,914 23,333 (10,789) 12,544 (370) (2.9%)
London & Middlesex Housing
Corporation17,912 (9,957) 7,955 18,705 (10,164) 8,541 586 7.4%
Long Term Care 21,475 (16,798) 4,677 21,345 (16,945) 4,400 (277) (5.9%)
Land Ambulance 27,558 (15,845) 11,713 29,017 (16,885) 12,132 419 3.6%
Middlesex London Health Unit 33,380 (27,285) 6,095 33,380 (27,285) 6,095 0 0.0%
Social & Community Support
Services135,075 (111,809) 23,266 141,169 (119,584) 21,585 (1,681) (7.2%)
Total Approved Social & Health
Services Budget258,865 (192,245) 66,620 266,949 (201,652) 65,297 (1,323) (2.0%)
Total Impact on Tax Levy from the Social & Health Services Program (0.27%)
All figures are subject to rounding.
SOCIAL & HEALTH SERVICES2015 Approved Budget
2014 2015
Net Increase/
(Decrease)
Over 2014
Tax
Supported
(%)
Revised Budget Approved Budget
($000's)

Page 164
ExpenseNon Tax
Revenue
Net Tax
SupportedExpense
Non Tax
Revenue
Net Tax
SupportedExpense
Non Tax
Revenue
Net Tax
Supported
Tax
Supported
(%)
Affordable Housing
Planning & Funding191 (114) 77 297 (120) 177 106 (6) 100 129.2%
Social Housing
Administration 23,274 (10,437) 12,837 23,036 (10,669) 12,367 (238) (232) (470) (3.7%)
Total to Maintain
Existing Service
Level
23,465 (10,551) 12,914 23,333 (10,789) 12,544 (132) (238) (370) (2.9%)
All figures are subject to rounding.
HousingSummary of Approved 2015 Budget From Rates
Service
2014 2015Increase / (Decrease) Over Previous Year
Revised Budget Approved Budget
($000's)

Page 165
2013 2014 2015
Object
ActualRevised
Budget
Maintain
Existing
Service
Service
Adjustments
Approved
Budget
Expenditures $ %
Personnel Costs 71 74 0 0 74 0 (0.4%)
Administrative Expenses 0 0 0 0 0 0 0.0%
Financial Expenses 45 0 0 0 0 0 0.0%
Purchased Services 194 117 106 0 223 106 91.1%
Transfers 3,604 0 0 0 0 0 0.0%
Total Expenditures 3,914 191 106 0 297 106 55.7%
Revenue
Government Grants & Subsidies (504) (114) (6) 0 (120) (6) 5.8%
Other Municipal Revenues (3,258) 0 0 0 0 0 0.0%
Sub-total - Non Property Tax
Revenue(3,762) (114) (6) 0 (120) (6) 5.8%
Net Budget 152 77 100 0 177 100 129.2%
All figures are subject to rounding.
Affordable Housing Planning & Funding2015 Approved Budget From Rates
Explanation of Adjustments
Increase/ (Decrease) Over
2014
($000's)

Page 166
2013 2014 2015
Object
ActualRevised
Budget
Maintain
Existing
Service
Service
Adjustments
Approved
Budget
Expenditures $ %
Personnel Costs 1,241 1,509 92 0 1,601 92 6.1%
Administrative Expenses 28 24 16 0 40 16 64.6%
Financial Expenses 30 0 0 0 0 0 0.0%
Purchased Services 21,381 21,675 (351) 0 21,324 (351) (1.6%)
Materials & Supplies 6 9 0 0 9 0 0.0%
Furniture & Equipment 56 18 5 0 23 5 28.4%
Transfers 38 39 0 0 39 0 1.5%
Total Expenditures 22,780 23,274 (238) 0 23,036 (238) (1.0%)
Revenue
Government Grants & Subsidies (6,824) (6,713) (224) 0 (6,937) (224) 3.3%
Other Municipal Revenues (4,322) (3,724) (8) 0 (3,732) (8) 0.2%
Sub-total - Non Property Tax
Revenue(11,146) (10,437) (232) 0 (10,669) (232) 2.2%
Net Budget 11,634 12,837 (470) 0 12,367 (470) (3.7%)
All figures are subject to rounding.
Social Housing Administration 2015 Approved Budget From Rates
Explanation of Adjustments
Increase/ (Decrease) Over
2014
($000's)

Page 167
2013 2014 2015
Object
ActualRevised
Budget
Maintain
Existing
Service
Service
Adjustments
Approved
Budget
Expenditures $ %
Personnel Costs 4,143 4,405 26 0 4,431 26 0.6%
Maintenance, Materials and Services 4,198 3,775 157 0 3,932 157 4.2%
Utilities 3,790 3,682 187 0 3,869 187 5.1%
Property Taxes, Insurance and Mortgage 4,903 5,303 375 0 5,678 375 7.1%
Administration 957 732 48 0 780 48 6.6%
Fire, Wind and Ice Expenses 70 15 0 0 15 0 0.0%
Total Expenditures 18,061 17,912 793 0 18,705 793 4.4%
Revenue
Net Rental Revenues (9,702) (9,654) (237) 0 (9,891) (237) 2.4%
Other Municipal Revenues (303) (303) 30 0 (273) 30 (9.9%)
One-Time Funding (481) 0 0 0 0 0 0.0%
Sub-total - Non Property Tax Revenue (10,486) (9,957) (207) 0 (10,164) (207) 2.1%
Net Budget 7,575 7,955 586 0 8,541 586 7.4%
All figures are subject to rounding.
London & Middlesex Housing Corporation2015 Approved Budget From Rates
($000's)
Explanation of Adjustments
Increase/ (Decrease)
Over 2014
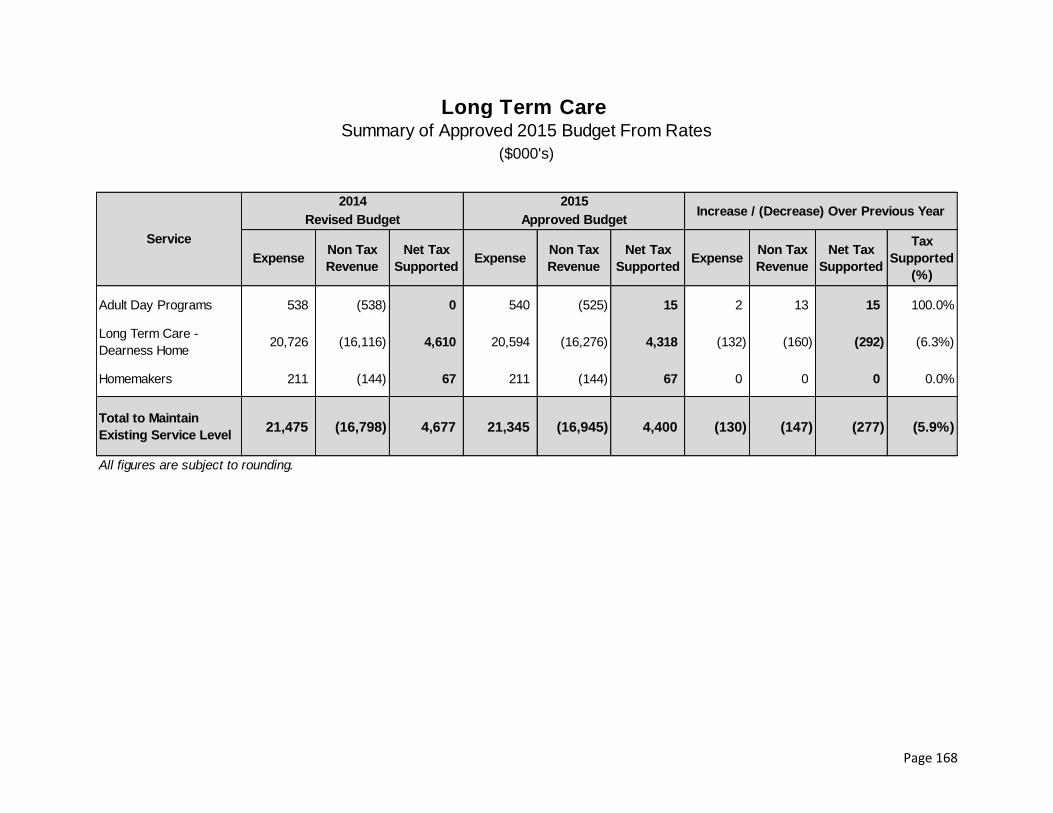
Page 168
ExpenseNon Tax
Revenue
Net Tax
SupportedExpense
Non Tax
Revenue
Net Tax
SupportedExpense
Non Tax
Revenue
Net Tax
Supported
Tax
Supported
(%)
Adult Day Programs 538 (538) 0 540 (525) 15 2 13 15 100.0%
Long Term Care -
Dearness Home20,726 (16,116) 4,610 20,594 (16,276) 4,318 (132) (160) (292) (6.3%)
Homemakers 211 (144) 67 211 (144) 67 0 0 0 0.0%
Total to Maintain
Existing Service Level21,475 (16,798) 4,677 21,345 (16,945) 4,400 (130) (147) (277) (5.9%)
All figures are subject to rounding.
Long Term Care Summary of Approved 2015 Budget From Rates
Service
2014 2015Increase / (Decrease) Over Previous Year
Revised Budget Approved Budget
($000's)

Page 169
2013 2014 2015
Object
ActualRevised
Budget
Maintain
Existing
Service
Service
Adjustments
Approved
Budget
Expenditures $ %
Personnel Costs 338 257 0 0 257 0 (0.1%)
Administrative Expenses 76 75 0 0 75 0 0.0%
Purchased Services 12 7 (3) 0 4 (3) (38.5%)
Materials & Supplies 80 34 5 0 39 5 14.9%
Transfers 138 143 0 0 143 0 0.0%
Other Expenses 21 22 0 0 22 0 0.0%
Total Expenditures 665 538 2 0 540 2 0.4%
Revenue
Government Grants & Subsidies (473) (366) (71) 0 (437) (71) 19.4%
User Fees (192) (172) 84 0 (88) 84 (48.9%)
Sub-total - Non Property Tax
Revenue(665) (538) 13 0 (525) 13 (2.5%)
Net Budget 0 0 15 0 15 15 100.0%
All figures are subject to rounding.
Adult Day Programs2015 Approved Budget From Rates
Explanation of Adjustments
Increase/ (Decrease) Over
2014
($000's)

Page 170
2013 2014 2015
Object
ActualRevised
Budget
Maintain
Existing
Service
Service
Adjustments
Approved
Budget
Expenditures $ %
Personnel Costs 16,837 17,198 (167) 0 17,031 (167) (1.0%)
Administrative Expenses 79 112 0 0 112 0 0.3%
Financial Expenses 46 0 0 0 0 0 0.0%
Purchased Services 1,204 1,218 5 0 1,223 5 0.4%
Materials & Supplies 2,113 2,186 26 0 2,212 26 1.2%
Furniture & Equipment 94 105 4 0 109 4 4.0%
Transfers (138) (143) 0 0 (143) 0 0.0%
Other Expenses 77 50 0 0 50 0 0.0%
Recovered Expenses (1) 0 0 0 0 0 0.0%
Total Expenditures 20,311 20,726 (132) 0 20,594 (132) (0.6%)
Revenue
Government Grants & Subsidies (10,777) (10,727) (92) 0 (10,819) (92) 0.9%
User Fees (5,332) (5,271) (141) 0 (5,412) (141) 2.7%
Other Municipal Revenues (163) (118) 73 0 (45) 73 (61.9%)
Sub-total - Non Property Tax
Revenue(16,272) (16,116) (160) 0 (16,276) (160) 1.0%
Net Budget 4,039 4,610 (292) 0 4,318 (292) (6.3%)
All figures are subject to rounding.
Long Term Care-Dearness Home2015 Approved Budget From Rates
Explanation of Adjustments
Increase/ (Decrease) Over
2014
($000's)

Page 171
2013 2014 2015
Object
ActualRevised
Budget
Maintain
Existing
Service
Service
Adjustments
Approved
Budget
Expenditures $ %
Personnel Costs 30 31 0 0 31 0 0.0%
Purchased Services 150 180 0 0 180 0 0.0%
Total Expenditures 180 211 0 0 211 0 0.0%
Revenue
Government Grants & Subsidies (120) (144) 0 0 (144) 0 0.0%
Sub-total - Non Property Tax
Revenue(120) (144) 0 0 (144) 0 0.0%
Net Budget 60 67 0 0 67 0 0.0%
All figures are subject to rounding.
Homemakers2015 Approved Budget From Rates
Explanation of Adjustments
Increase/ (Decrease) Over
2014
($000's)
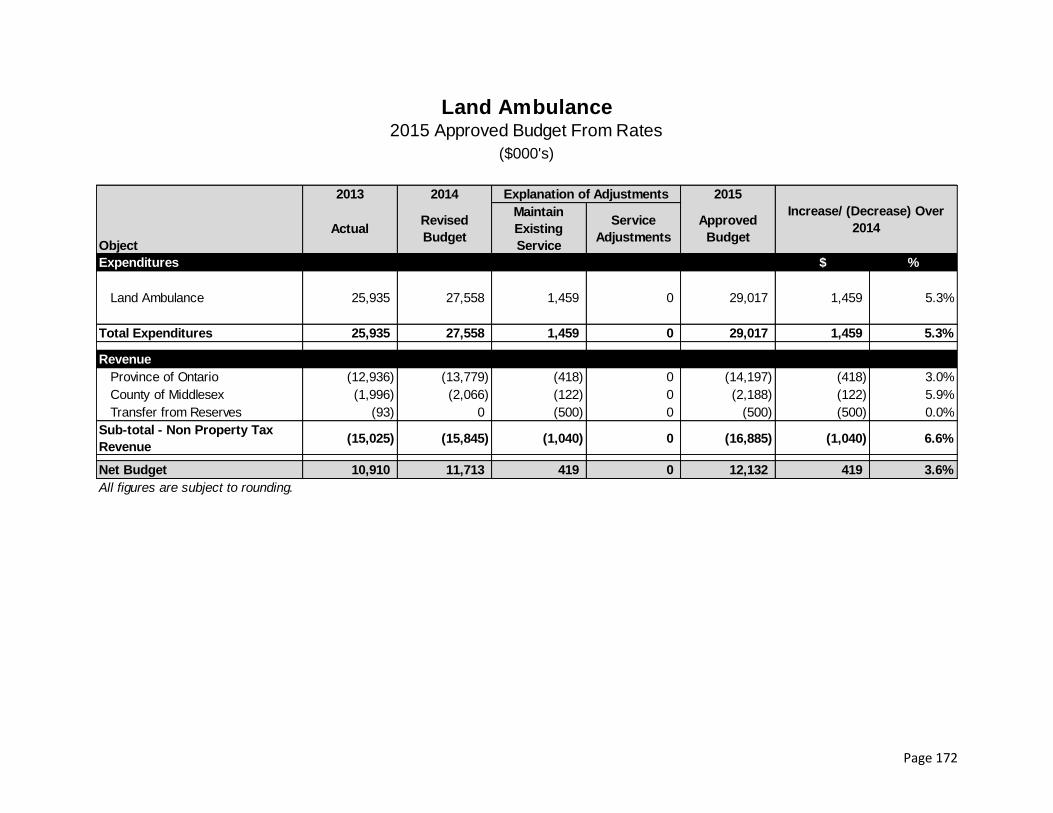
Page 172
2013 2014 2015
Object
ActualRevised
Budget
Maintain
Existing
Service
Service
Adjustments
Approved
Budget
Expenditures $ %
Land Ambulance 25,935 27,558 1,459 0 29,017 1,459 5.3%
Total Expenditures 25,935 27,558 1,459 0 29,017 1,459 5.3%
Revenue
Province of Ontario (12,936) (13,779) (418) 0 (14,197) (418) 3.0%
County of Middlesex (1,996) (2,066) (122) 0 (2,188) (122) 5.9%
Transfer from Reserves (93) 0 (500) 0 (500) (500) 0.0%
Sub-total - Non Property Tax
Revenue(15,025) (15,845) (1,040) 0 (16,885) (1,040) 6.6%
Net Budget 10,910 11,713 419 0 12,132 419 3.6%
All figures are subject to rounding.
Land Ambulance2015 Approved Budget From Rates
Explanation of Adjustments
Increase/ (Decrease) Over
2014
($000's)

Page 173
2013 2014 2015
Object
ActualRevised
Budget
Maintain
Existing
Service
Service
Adjustments
Approved
Budget
Expenditures $ %
Personnel Costs 24,747 24,542 0 0 24,542 0 0.0%
Administrative Expenses 410 589 0 0 589 0 0.0%
Financial Expenses 0 450 0 0 450 0 0.0%
Purchased Services 5,214 5,849 0 0 5,849 0 0.0%
Materials & Supplies 1,311 1,206 0 0 1,206 0 0.0%
Furniture & Equipment 416 481 0 0 481 0 0.0%
Other Expenses 1,538 263 0 0 263 0 0.0%
Total Expenditures 33,636 33,380 0 0 33,380 0 0.0%
Revenue
Government Grants & Subsidies (26,893) (26,323) 0 0 (26,323) 0 0.0%
User Fees (524) (674) 0 0 (674) 0 0.0%
Other Revenues (841) (288) 0 0 (288) 0 0.0%
Sub-total - Non Property Tax
Revenue(28,258) (27,285) 0 0 (27,285) 0 0.0%
Net Budget 5,378 6,095 0 0 6,095 0 0.0%
All figures are subject to rounding.
Middlesex-London Health Unit2015 Approved Budget From Rates
Explanation of Adjustments
Increase/ (Decrease) Over
2014
($000's)

Page 174
ExpenseNon Tax
Revenue
Net Tax
SupportedExpense
Non Tax
Revenue
Net Tax
SupportedExpense
Non Tax
Revenue
Net Tax
Supported
Tax
Supported
(%)
Homeless Prevention 10,271 (8,920) 1,351 10,026 (8,675) 1,351 (245) 245 0 0.0%
Immigration Services 221 (221) 0 214 (214) 0 (7) 7 0 0.0%
Subsidized Transit 541 0 541 567 0 567 26 0 26 4.9%
Ontario Works 124,042 (102,668) 21,374 130,361 (110,694) 19,667 6,319 (8,026) (1,707) (8.0%)
Total to Maintain
Existing Service Level135,075 (111,809) 23,266 141,168 (119,583) 21,585 6,093 (7,774) (1,681) (7.2%)
All figures are subject to rounding.
Social & Community Support ServicesSummary of Approved 2015 Budget From Rates
Service
2014 2015Increase / (Decrease) Over Previous Year
Revised Budget Approved Budget
($000's)

Page 175
2013 2014 2015
Object
ActualRevised
Budget
Maintain
Existing
Service
Service
Adjustments
Approved
Budget
Expenditures $ %
Personnel Costs 269 449 (6) 0 443 (6) (1.3%)
Administrative Expenses 113 26 (10) 0 16 (10) (38.9%)
Financial Expenses 1 0 0 0 0 0 0.0%
Purchased Services 9,810 9,031 (228) 0 8,803 (228) (2.5%)
Materials & Supplies 37 3 0 0 3 0 0.0%
Furniture & Equipment 58 11 0 0 11 0 0.0%
Transfers 773 751 0 0 751 0 0.0%
Total Expenditures 11,061 10,271 (244) 0 10,027 (244) (2.4%)
Revenue
Government Grants & Subsidies (9,651) (8,920) 244 0 (8,676) 244 (2.7%)
Sub-total - Non Property Tax
Revenue(9,651) (8,920) 244 0 (8,676) 244 (2.7%)
Net Budget 1,410 1,351 0 0 1,351 0 0.0%
All figures are subject to rounding.
Homeless Prevention2015 Approved Budget From Rates
Explanation of Adjustments
Increase/ (Decrease) Over
2014
($000's)

Page 176
2013 2014 2015
Object
ActualRevised
Budget
Maintain
Existing
Service
Service
Adjustments
Approved
Budget
Expenditures $ %
Personnel Costs 15 0 0 0 0 0 0.0%
Administrative Expenses 6 9 (7) 0 2 (7) (78.2%)
Financial Expenses 186 187 0 0 187 0 0.0%
Purchased Services 17 25 0 0 25 0 0.0%
Furniture & Equipment 0 0 0 0 0 0 0.0%
Total Expenditures 224 221 (7) 0 214 (7) (3.2%)
Revenue
Government Grants & Subsidies (224) (221) 7 0 (214) 7 (3.2%)
Other Municipal Revenues 0 0 0 0 0 0 0.0%
Sub-total - Non Property Tax
Revenue(224) (221) 7 0 (214) 7 (3.2%)
Net Budget 0 0 0 0 0 0 0.0%
All figures are subject to rounding.
Immigration Services2015 Approved Budget From Rates
Explanation of Adjustments
Increase/ (Decrease) Over
2014
($000's)

Page 177
2013 2014 2015
Object
ActualRevised
Budget
Maintain
Existing
Service
Service
Adjustments
Approved
Budget
Expenditures $ %
Purchased Services 524 541 26 0 567 26 4.9%
Total Expenditures 524 541 26 0 567 26 4.9%
Revenue
Sub-total - Non Property Tax
Revenue0 0 0 0 0 0 0.0%
Net Budget 524 541 26 0 567 26 4.9%
All figures are subject to rounding.
Subsidized Transit2015 Approved Budget From Rates
Explanation of Adjustments
Increase/ (Decrease) Over
2014
($000's)

Page 178
2013 2014 2015
Object
ActualRevised
Budget
Maintain
Existing
Service
Service
Adjustments
Approved
Budget
Expenditures $ %
Personnel Costs 16,643 17,761 489 0 18,250 489 2.8%
Administrative Expenses 153 246 0 0 246 0 0.0%
Financial Expenses 847 0 0 0 0 0 0.0%
Purchased Services 9,229 9,956 425 0 10,381 425 4.3%
Materials & Supplies 66 228 1 0 229 1 0.3%
Furniture & Equipment 300 248 5 0 253 5 1.9%
Transfers 95,351 95,620 5,399 0 101,019 5,399 5.6%
Other Expenses 57 (17) 0 0 (17) 0 2.4%
Total Expenditures 122,646 124,042 6,319 0 130,361 6,319 5.1%
Revenue
Government Grants & Subsidies (99,660) (102,668) (8,026) 0 (110,694) (8,026) 7.8%
User Fees 2 0 0 0 0 0 0.0%
Sub-total - Non Property Tax
Revenue(99,658) (102,668) (8,026) 0 (110,694) (8,026) 7.8%
Net Budget 22,988 21,374 (1,707) 0 19,667 (1,707) (8.0%)
All figures are subject to rounding.
Ontario Works2015 Approved Budget From Rates
Explanation of Adjustments
Increase/ (Decrease) Over
2014
($000's)

Page 179
ExpenseNon Tax
Revenue
Net Tax
SupportedExpense
Non Tax
Revenue
Net Tax
Supported
Parking 2,428 (5,672) (3,244) 2,451 (5,691) (3,240) 4 0.1%
Public Transit
(London Transit Commission)65,939 (39,843) 26,096 67,941 (41,084) 26,857 761 2.9%
Roadways 40,246 (5,022) 35,224 41,260 (4,853) 36,407 1,183 3.4%
Total Approved Transportation
Services Budget108,613 (50,537) 58,076 111,652 (51,628) 60,024 1,948 3.4%
Total Impact on Tax Levy from the Transportation Services Program 0.39%
All figures are subject to rounding.
TRANSPORTATION SERVICES2015 Approved Budget
2014 2015
Net Increase/
(Decrease)
Over 2014
Tax
Supported
(%)
Revised Budget Approved Budget
($000's)

Page 180
2013 2014 2015
Object
ActualRevised
Budget
Maintain
Existing
Service
Service
Adjustments
Approved
Budget
Expenditures $ %
Personnel Costs 857 760 19 779 19 2.5%
Administrative Expenses 5 10 (1) 9 (1) (13.1%)
Financial Expenses 173 117 0 117 0 0.0%
Purchased Services 1,185 1,197 32 1,229 32 2.7%
Materials & Supplies 78 113 (12) 101 (12) (10.9%)
Furniture & Equipment 45 43 (15) 28 (15) (34.8%)
Transfers 0 190 0 190 0 0.0%
Recovered Expenses (1) (2) 0 (2) 0 0.0%
Total Expenditures 2,342 2,428 23 0 2,451 23 0.9%
Revenue
User Fees (2,809) (2,970) (19) (2,989) (19) 0.6%
Other Municipal Revenues (2,895) (2,702) 0 (2,702) 0 0.0%
Sub-total - Non Property Tax
Revenue(5,704) (5,672) (19) 0 (5,691) (19) 0.3%
Net Budget (3,362) (3,244) 4 0 (3,240) 4 0.1%
All figures are subject to rounding.
Parking2015 Approved Budget From Rates
Explanation of Adjustments
Increase/ (Decrease) Over
2014
($000's)

Page 181
ExpenseNon Tax
Revenue
Net Tax
SupportedExpense
Non Tax
Revenue
Net Tax
SupportedExpense
Non Tax
Revenue
Net Tax
Supported
Tax
Supported
(%)
London Transit Commission -
Conventional Transit Service60,519 (38,285) 22,234 62,245 (39,492) 22,753 1,726 (1,207) 519 2.3%
London Transit Commission -
Specialized Transit Service5,420 (1,558) 3,862 5,696 (1,592) 4,104 276 (34) 242 6.3%
Total to Maintain
Existing Service Level65,939 (39,843) 26,096 67,941 (41,084) 26,857 2,002 (1,241) 761 2.9%
All figures are subject to rounding.
Public Transit ServicesSummary of Approved 2015 Budget From Rates
Service
2014 2015Increase / (Decrease) Over Previous Year
Revised Budget Approved Budget
($000's)

Page 182
2013 2014 2015
Object
ActualRevised
Budget
Maintain
Existing
Service
Service
Adjustments
Approved
Budget
Expenditures $ %
Personnel Costs 39,514 40,074 1,404 41,478 1,404 3.5%
Fuel 7,581 7,883 468 8,351 468 5.9%
Direct Bus Maint & Servicing 3,941 4,074 133 4,207 133 3.3%
Facility Costs 2,380 2,536 8 2,544 8 0.3%
Insurance 1,793 1,681 15 1,696 15 0.9%
Contracted Costs 0 0 0 0 0 0.0%
Contribution to Reserves 1,419 1,780 (350) 1,430 (350) (19.7%)
Other Costs 2,333 2,491 48 2,539 48 1.9%
Total Expenditures 58,961 60,519 1,726 0 62,245 1,726 2.9%
Revenue
Transportation and Operating (32,955) (33,788) (463) (34,251) (463) 1.4%
Reserve Funding (836) (770) - - (770) - 0.0%
Provincial Gas Tax (3,306) (3,727) (744) (4,471) (744) 20.0%
Sub-total - Non Property Tax
Revenue(37,097) (38,285) (1,207) - (39,492) (1,207) 3.2%
Net Budget 21,864 22,234 519 0 22,753 519 2.3%
All figures are subject to rounding.
London Transit Commission - Conventional Transit Service2015 Approved Budget From Rates
Explanation of Adjustments
Increase/ (Decrease) Over
2014
($000's)
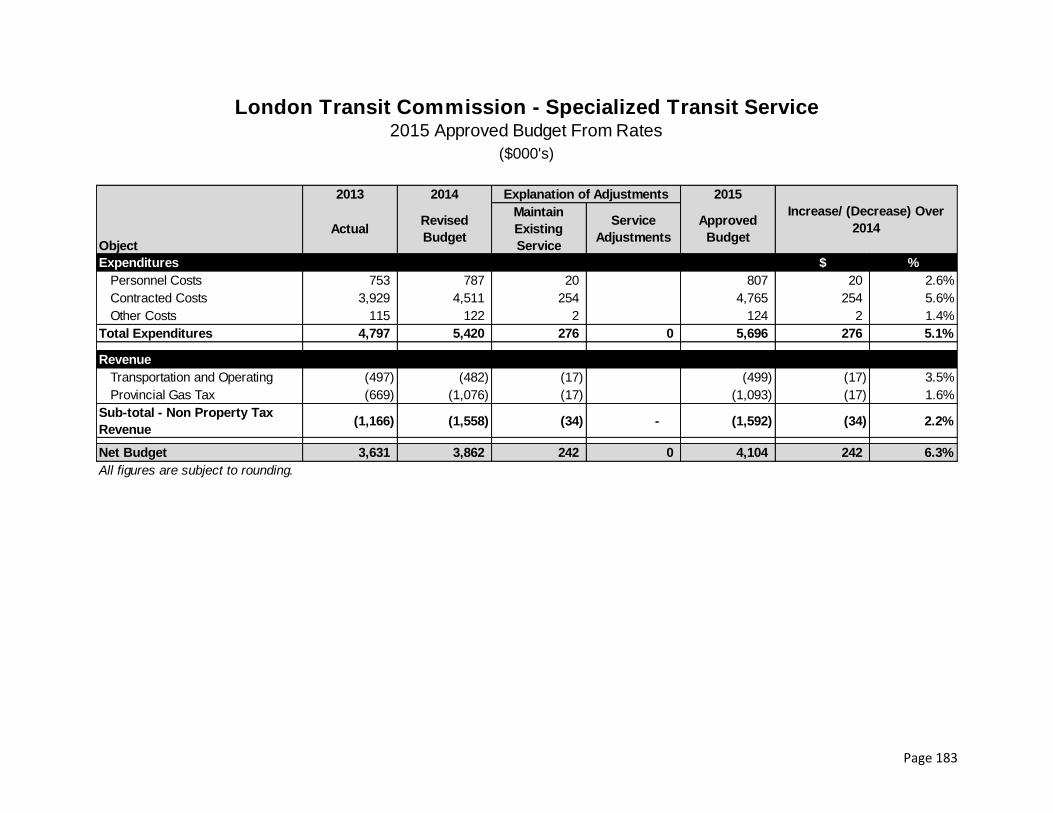
Page 183
2013 2014 2015
Object
ActualRevised
Budget
Maintain
Existing
Service
Service
Adjustments
Approved
Budget
Expenditures $ %
Personnel Costs 753 787 20 807 20 2.6%
Contracted Costs 3,929 4,511 254 4,765 254 5.6%
Other Costs 115 122 2 124 2 1.4%
Total Expenditures 4,797 5,420 276 0 5,696 276 5.1%
Revenue
Transportation and Operating (497) (482) (17) (499) (17) 3.5%
Provincial Gas Tax (669) (1,076) (17) (1,093) (17) 1.6%
Sub-total - Non Property Tax
Revenue(1,166) (1,558) (34) - (1,592) (34) 2.2%
Net Budget 3,631 3,862 242 0 4,104 242 6.3%
All figures are subject to rounding.
London Transit Commission - Specialized Transit Service2015 Approved Budget From Rates
Explanation of Adjustments
Increase/ (Decrease) Over
2014
($000's)

Page 184
ExpenseNon Tax
Revenue
Net Tax
SupportedExpense
Non Tax
Revenue
Net Tax
SupportedExpense
Non Tax
Revenue
Net Tax
Supported
Tax
Supported
(%)
Roadway
Maintenance11,980 (2,974) 9,006 12,150 (2,893) 9,257 170 81 251 2.8%
Roadway Planning &
Design 3,191 (1,474) 1,717 3,223 (1,454) 1,769 32 20 52 3.1%
Snow Control 12,746 (353) 12,393 12,968 (353) 12,615 222 0 222 1.8%
Traffic Control &
Street Lighting12,329 (221) 12,108 12,919 (153) 12,766 590 68 658 5.4%
Total to Maintain
Existing Service
Level
40,246 (5,022) 35,224 41,260 (4,853) 36,407 1,014 169 1,183 3.4%
All figures are subject to rounding.
RoadwaysSummary of Approved 2015 Budget From Rates
Service
2014 2015Increase / (Decrease) Over Previous Year
Revised Budget Approved Budget
($000's)

Page 185
2013 2014 2015
Object
ActualRevised
Budget
Maintain
Existing
Service
Service
Adjustments
Approved
Budget
Expenditures $ %
Personnel Costs 6,261 6,846 90 6,936 90 1.3%
Administrative Expenses 143 157 (19) 138 (19) (12.4%)
Financial Expenses 252 0 0 0 0 0.0%
Purchased Services 463 896 (270) 626 (270) (30.1%)
Materials & Supplies 1,640 1,517 302 1,819 302 19.9%
Furniture & Equipment 2,804 2,637 105 2,742 105 4.0%
Other Expenses 1,547 0 970 970 970 0.0%
Recovered Expenses (1,395) (73) (1,008) (1,081) (1,008) 1380.8%
Total Expenditures 11,715 11,980 170 0 12,150 170 1.4%
Revenue
Government Grants & Subsidies (56) (90) 40 (50) 40 (44.4%)
User Fees (157) (242) 81 (161) 81 (33.5%)
Other Municipal Revenues (2,435) (2,642) (40) (2,682) (40) 1.5%
Sub-total - Non Property Tax
Revenue(2,648) (2,974) 81 0 (2,893) 81 (2.7%)
Net Budget 9,067 9,006 251 0 9,257 251 2.8%
All figures are subject to rounding.
Roadway Maintenance2015 Approved Budget From Rates
Explanation of Adjustments
Increase/ (Decrease) Over
2014
($000's)

Page 186
2013 2014 2015
Object
ActualRevised
Budget
Maintain
Existing
Service
Service
Adjustments
Approved
Budget
Expenditures $ %
Personnel Costs 2,896 3,099 25 3,124 25 0.8%
Administrative Expenses 31 24 6 30 6 24.9%
Financial Expenses 123 0 0 0 0 0.0%
Purchased Services 29 35 3 38 3 8.8%
Materials & Supplies 7 10 0 10 0 0.0%
Furniture & Equipment 27 23 (2) 21 (2) (6.9%)
Other Expenses 0 0 0 0 0 0.0%
Recovered Expenses (596) 0 0 0 0 0.0%
Total Expenditures 2,517 3,191 32 0 3,223 32 1.0%
Revenue
User Fees (143) (209) 25 (184) 25 (12.0%)
Other Municipal Revenues (792) (1,265) (5) (1,270) (5) 0.4%
Sub-total - Non Property Tax
Revenue(935) (1,474) 20 0 (1,454) 20 (1.4%)
Net Budget 1,582 1,717 52 0 1,769 52 3.1%
All figures are subject to rounding.
Roadway Planning & Design 2015 Approved Budget From Rates
Explanation of Adjustments
Increase/ (Decrease) Over
2014
($000's)

Page 187
2013 2014 2015
Object
ActualRevised
Budget
Maintain
Existing
Service
Service
Adjustments
Approved
Budget
Expenditures $ %
Personnel Costs 4,870 4,365 261 4,626 261 6.0%
Administrative Expenses 1 7 0 7 0 0.0%
Financial Expenses 109 0 0 0 0 0.0%
Purchased Services 134 90 0 90 0 0.0%
Materials & Supplies 3,374 2,538 0 2,538 0 0.0%
Furniture & Equipment 6,419 5,851 74 5,925 74 1.3%
Other Expenses 300 22 360 382 360 1636.4%
Recovered Expenses (883) (127) (473) (600) (473) 372.4%
Total Expenditures 14,324 12,746 222 0 12,968 222 1.7%
Revenue
User Fees (412) (353) 0 (353) 0 0.0%
Other Municipal Revenues (3) 0 0 0 0 0.0%
Sub-total - Non Property Tax
Revenue(415) (353) 0 0 (353) 0 0.0%
Net Budget 13,909 12,393 222 0 12,615 222 1.8%
All figures are subject to rounding.
Snow Control2015 Approved Budget From Rates
Explanation of Adjustments
Increase/ (Decrease) Over
2014
($000's)
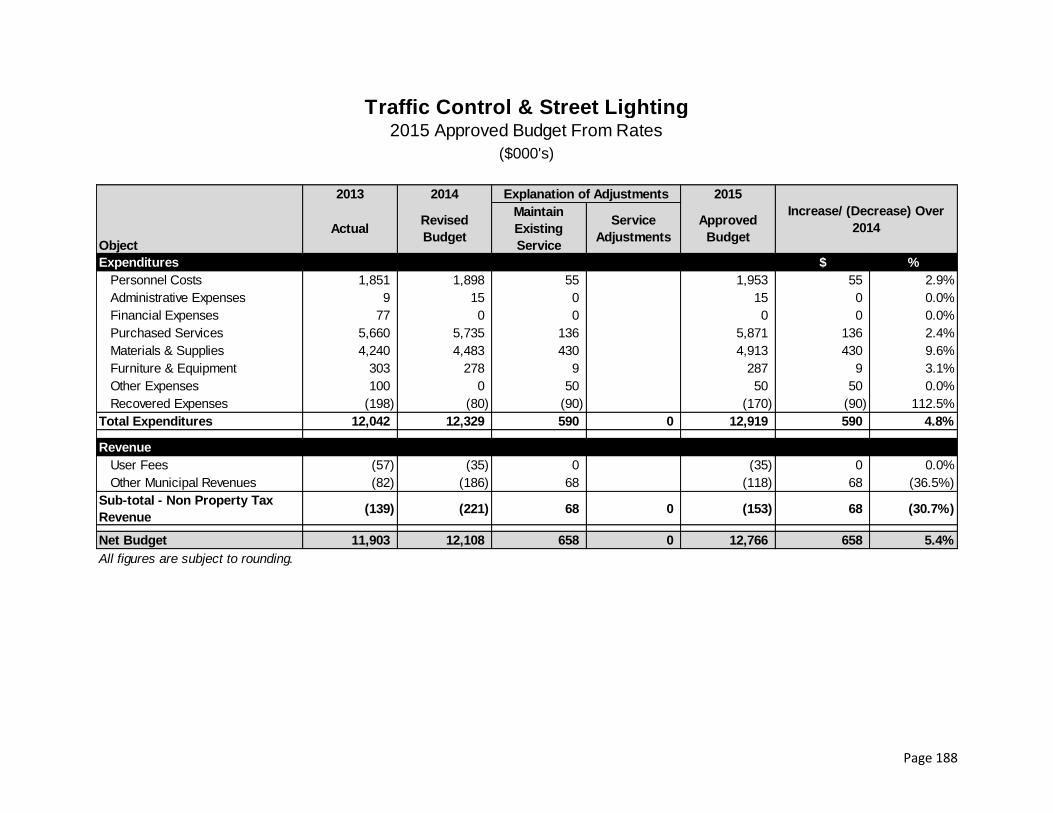
Page 188
2013 2014 2015
Object
ActualRevised
Budget
Maintain
Existing
Service
Service
Adjustments
Approved
Budget
Expenditures $ %
Personnel Costs 1,851 1,898 55 1,953 55 2.9%
Administrative Expenses 9 15 0 15 0 0.0%
Financial Expenses 77 0 0 0 0 0.0%
Purchased Services 5,660 5,735 136 5,871 136 2.4%
Materials & Supplies 4,240 4,483 430 4,913 430 9.6%
Furniture & Equipment 303 278 9 287 9 3.1%
Other Expenses 100 0 50 50 50 0.0%
Recovered Expenses (198) (80) (90) (170) (90) 112.5%
Total Expenditures 12,042 12,329 590 0 12,919 590 4.8%
Revenue
User Fees (57) (35) 0 (35) 0 0.0%
Other Municipal Revenues (82) (186) 68 (118) 68 (36.5%)
Sub-total - Non Property Tax
Revenue(139) (221) 68 0 (153) 68 (30.7%)
Net Budget 11,903 12,108 658 0 12,766 658 5.4%
All figures are subject to rounding.
Traffic Control & Street Lighting2015 Approved Budget From Rates
Explanation of Adjustments
Increase/ (Decrease) Over
2014
($000's)
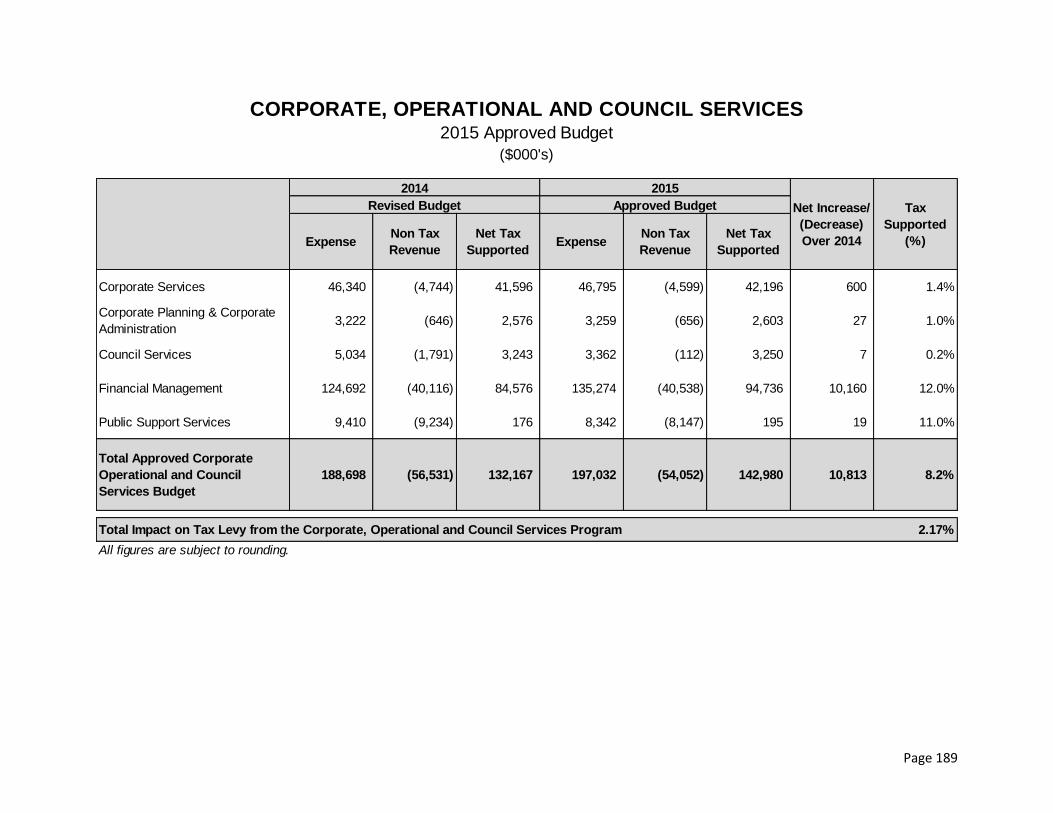
Page 189
ExpenseNon Tax
Revenue
Net Tax
SupportedExpense
Non Tax
Revenue
Net Tax
Supported
Corporate Services 46,340 (4,744) 41,596 46,795 (4,599) 42,196 600 1.4%
Corporate Planning & Corporate
Administration3,222 (646) 2,576 3,259 (656) 2,603 27 1.0%
Council Services 5,034 (1,791) 3,243 3,362 (112) 3,250 7 0.2%
Financial Management 124,692 (40,116) 84,576 135,274 (40,538) 94,736 10,160 12.0%
Public Support Services 9,410 (9,234) 176 8,342 (8,147) 195 19 11.0%
Total Approved Corporate
Operational and Council
Services Budget
188,698 (56,531) 132,167 197,032 (54,052) 142,980 10,813 8.2%
Total Impact on Tax Levy from the Corporate, Operational and Council Services Program 2.17%
All figures are subject to rounding.
CORPORATE, OPERATIONAL AND COUNCIL SERVICES2015 Approved Budget
2014 2015
Net Increase/
(Decrease)
Over 2014
Tax
Supported
(%)
Revised Budget Approved Budget
($000's)

Page 190
ExpenseNon Tax
Revenue
Net Tax
SupportedExpense
Non Tax
Revenue
Net Tax
SupportedExpense
Non Tax
Revenue
Net Tax
Supported
Tax
Supported
(%)
Asset Management 440 0 440 440 0 440 0 0 0 0.0%
Dispatch 949 (238) 711 976 (243) 733 27 (5) 22 3.1%
Employee Systems 518 0 518 538 0 538 20 0 20 3.8%
Energy Conservation 137 (44) 93 141 (45) 96 4 (1) 3 3.6%
Facilities 13,269 (491) 12,778 13,772 (498) 13,274 503 (7) 496 3.9%
Fleet Management 34 (34) 0 27 (27) 0 (7) 7 0 0.0%
Graphics, Surveying &
Technical Services1,292 (636) 656 1,311 (645) 666 19 (9) 10 1.5%
Human Resources 5,528 (658) 4,870 5,595 (671) 4,924 67 (13) 54 1.1%
Human Rights 281 0 281 286 0 286 5 0 5 1.8%
Legal Services 2,756 (68) 2,688 2,774 (69) 2,705 18 (1) 17 0.6%
Finance Payroll Services 1,197 (198) 999 1,172 (202) 970 (25) (4) (29) (2.8%)
Purchasing 1,360 (444) 916 1,364 (447) 917 4 (3) 1 0.1%
Realty Services 1,353 (1,012) 341 1,410 (1,050) 360 57 (38) 19 5.4%
Risk Management 433 (157) 276 423 (165) 258 (10) (8) (18) (6.5%)
Information Technology 16,793 (764) 16,029 16,566 (537) 16,029 (227) 227 0 0.0%
Total to Maintain
Existing Service Level46,340 (4,744) 41,596 46,795 (4,599) 42,196 455 145 600 1.4%
All figures are subject to rounding.
Corporate ServicesSummary of Approved 2015 Budget From Rates
Service
2014 2015Increase / (Decrease) Over Previous Year
Revised Budget Approved Budget
($000's)

Page 191
2013 2014 2015
Object
ActualRevised
Budget
Maintain
Existing
Service
Service
Adjustments
Approved
Budget
Expenditures $ %
Personnel Costs 335 391 (1) 390 (1) (0.3%)
Administrative Expenses 6 17 5 22 5 28.8%
Purchased Services 6 30 (6) 24 (6) (18.9%)
Materials and Supplies 0 2 0 2 0 (4.4%)
Furniture & Equipment 0 0 2 2 2 0.0%
Total Expenditures 347 440 0 0 440 0 0.0%
Revenue
Sub-total - Non Property Tax
Revenue0 0 0 0 0 0 0.0%
Net Budget 347 440 0 0 440 0 0.0%
All figures are subject to rounding.
Asset Management2015 Approved Budget From Rates
Explanation of Adjustments
Increase/ (Decrease) Over
2014
($000's)

Page 192
2013 2014 2015
Object
ActualRevised
Budget
Maintain
Existing
Service
Service
Adjustments
Approved
Budget
Expenditures $ %
Personnel Costs 750 823 4 827 4 0.5%
Administrative Expenses 4 6 0 6 0 (4.3%)
Financial Expenses 20 0 0 0 0 0.0%
Purchased Services 109 151 5 156 5 2.6%
Materials & Supplies 1 3 0 3 0 14.3%
Furniture & Equipment 79 84 0 84 0 0.4%
Other Expenses 134 0 0 0 0 0.0%
Recovered Expenses (109) (118) 18 (100) 18 (15.5%)
Total Expenditures 988 949 27 0 976 27 2.8%
Revenue
Other Municipal Revenues (162) (238) (5) (243) (5) 1.9%
Sub-total - Non Property Tax
Revenue(162) (238) (5) 0 (243) (5) 1.9%
Net Budget 826 711 22 0 733 22 3.1%
All figures are subject to rounding.
Dispatch2015 Approved Budget From Rates
Explanation of Adjustments
Increase/ (Decrease) Over
2014
($000's)
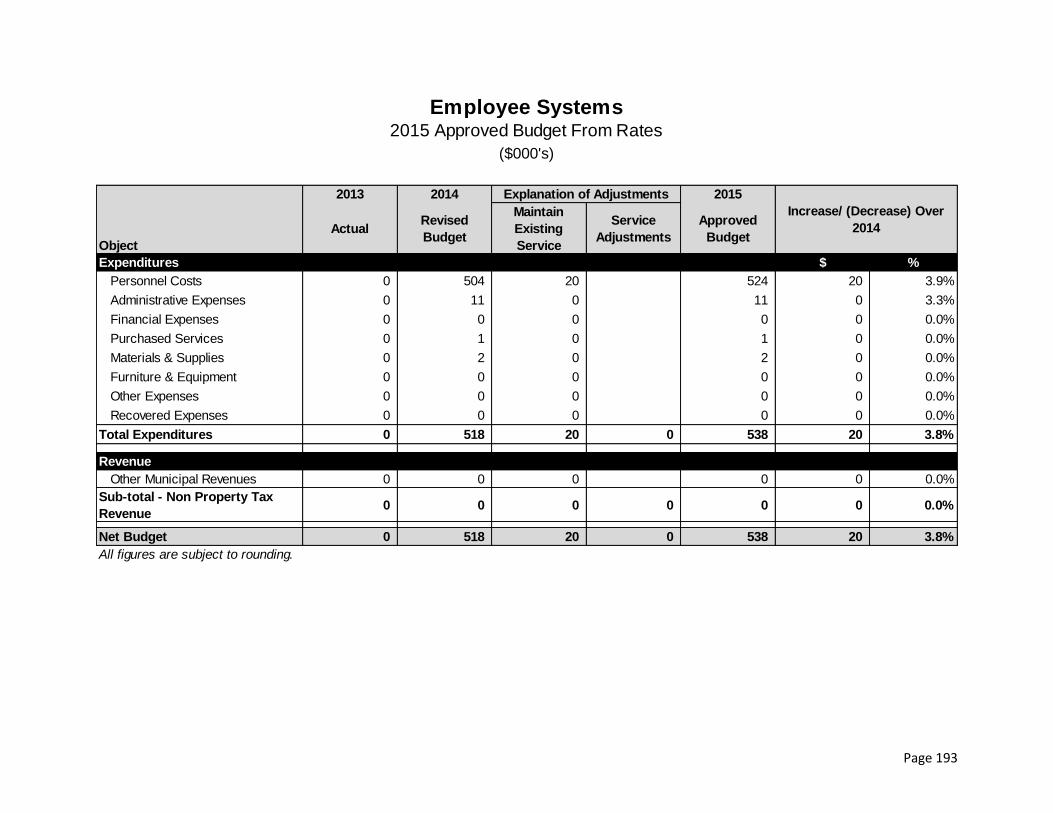
Page 193
2013 2014 2015
Object
ActualRevised
Budget
Maintain
Existing
Service
Service
Adjustments
Approved
Budget
Expenditures $ %
Personnel Costs 0 504 20 524 20 3.9%
Administrative Expenses 0 11 0 11 0 3.3%
Financial Expenses 0 0 0 0 0 0.0%
Purchased Services 0 1 0 1 0 0.0%
Materials & Supplies 0 2 0 2 0 0.0%
Furniture & Equipment 0 0 0 0 0 0.0%
Other Expenses 0 0 0 0 0 0.0%
Recovered Expenses 0 0 0 0 0 0.0%
Total Expenditures 0 518 20 0 538 20 3.8%
Revenue
Other Municipal Revenues 0 0 0 0 0 0.0%
Sub-total - Non Property Tax
Revenue0 0 0 0 0 0 0.0%
Net Budget 0 518 20 0 538 20 3.8%
All figures are subject to rounding.
Employee Systems2015 Approved Budget From Rates
Explanation of Adjustments
Increase/ (Decrease) Over
2014
($000's)
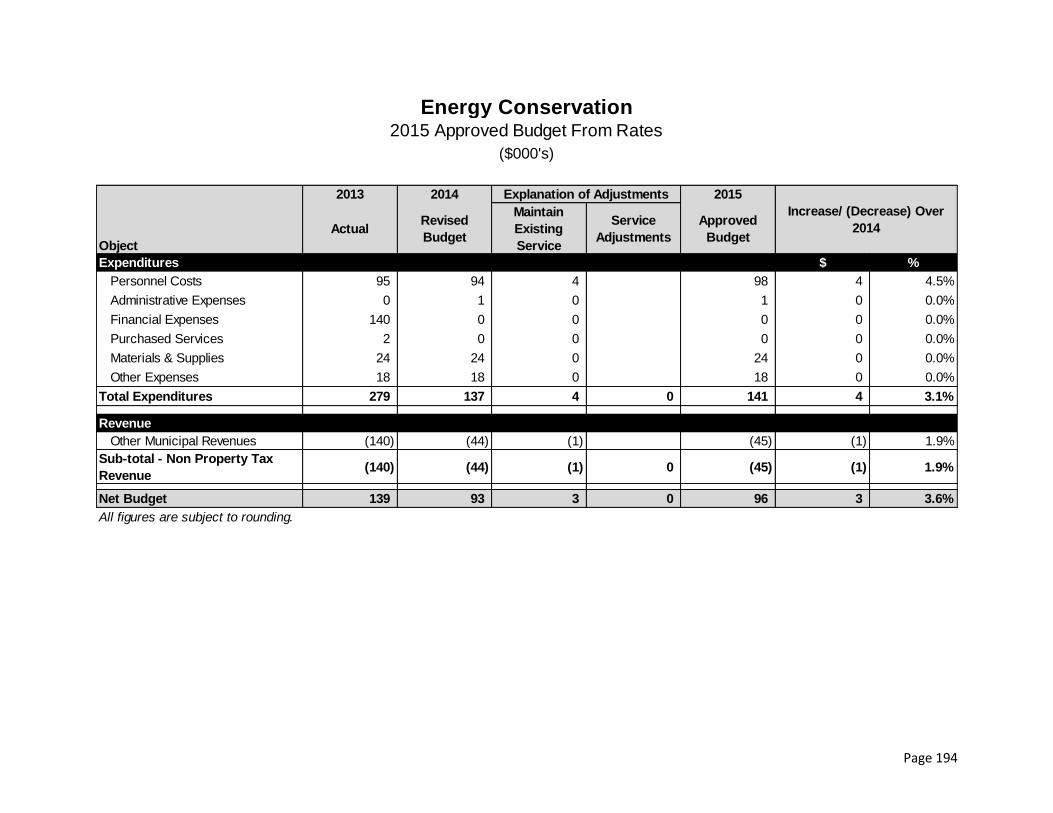
Page 194
2013 2014 2015
Object
ActualRevised
Budget
Maintain
Existing
Service
Service
Adjustments
Approved
Budget
Expenditures $ %
Personnel Costs 95 94 4 98 4 4.5%
Administrative Expenses 0 1 0 1 0 0.0%
Financial Expenses 140 0 0 0 0 0.0%
Purchased Services 2 0 0 0 0 0.0%
Materials & Supplies 24 24 0 24 0 0.0%
Other Expenses 18 18 0 18 0 0.0%
Total Expenditures 279 137 4 0 141 4 3.1%
Revenue
Other Municipal Revenues (140) (44) (1) (45) (1) 1.9%
Sub-total - Non Property Tax
Revenue(140) (44) (1) 0 (45) (1) 1.9%
Net Budget 139 93 3 0 96 3 3.6%
All figures are subject to rounding.
Energy Conservation2015 Approved Budget From Rates
Explanation of Adjustments
Increase/ (Decrease) Over
2014
($000's)

Page 195
2013 2014 2015
Object
ActualRevised
Budget
Maintain
Existing
Service
Service
Adjustments
Approved
Budget
Expenditures $ %
Personnel Costs 4,754 5,032 16 5,048 16 0.3%
Administrative Expenses 53 62 2 64 2 4.0%
Financial Expenses 134 0 0 0 0 0.0%
Purchased Services 3,314 2,644 315 2,959 315 11.9%
Materials & Supplies 4,737 5,541 78 5,619 78 1.4%
Furniture & Equipment 309 308 (1) 307 (1) (0.5%)
Other Expenses 41 10 10 20 10 94.2%
Recovered Expenses (244) (328) 83 (245) 83 (25.3%)
Total Expenditures 13,098 13,269 503 0 13,772 503 3.8%
Revenue
User Fees (26) (28) 0 (28) 0 0.0%
Other Municipal Revenues (332) (463) (7) (470) (7) 1.6%
Sub-total - Non Property Tax
Revenue(358) (491) (7) 0 (498) (7) 1.5%
Net Budget 12,740 12,778 496 0 13,274 496 3.9%
All figures are subject to rounding.
Facilities2015 Approved Budget From Rates
Explanation of Adjustments
Increase/ (Decrease) Over
2014
($000's)

Page 196
2013 2014 2015
Object
ActualRevised
Budget
Maintain
Existing
Service
Service
Adjustments
Approved
Budget
Expenditures $ %
Personnel Costs 4,252 4,516 62 4,578 62 1.4%
Administrative Expenses 54 63 (2) 61 (2) (2.5%)
Financial Expenses 3,575 3,650 0 3,650 0 0.0%
Purchased Services 758 938 (120) 818 (120) (12.7%)
Materials & Supplies 4,226 4,748 264 5,012 264 5.6%
Furniture & Equipment 386 221 (9) 212 (9) (4.2%)
Other Expenses 35 35 (10) 25 (10) (28.6%)
Recovered Expenses (13,429) (14,137) (192) (14,329) (192) 1.4%
Total Expenditures (143) 34 (7) 0 27 (7) 19.1%
Revenue
Government Grants & Subsidies (7) (14) 7 (7) 7 (46.4%)
Other Municipal Revenues (283) (20) 0 (20) 0 0.0%
Sub-total - Non Property Tax
Revenue(290) (34) 7 0 (27) 7 (19.1%)
Net Budget (433) 0 0 0 0 0 0.0%
All figures are subject to rounding.
Fleet Management2015 Approved Budget From Rates
Explanation of Adjustments
Increase/ (Decrease) Over
2014
($000's)

Page 197
2013 2014 2015
Object
ActualRevised
Budget
Maintain
Existing
Service
Service
Adjustments
Approved
Budget
Expenditures $ %
Personnel Costs 1,142 1,138 24 1,162 24 2.1%
Administrative Expenses 1 1 0 1 0 (9.8%)
Purchased Services 39 119 1 120 1 0.4%
Materials & Supplies 8 8 0 8 0 4.2%
Furniture & Equipment 17 26 (6) 20 (6) (23.1%)
Recovered Expenses (415) 0 0 0 0 0.0%
Total Expenditures 792 1,292 19 0 1,311 19 1.5%
Revenue
User Fees (1) (3) 1 (2) 1 (40.0%)
Other Municipal Revenues 0 (633) (10) (643) (10) 1.6%
Sub-total - Non Property Tax
Revenue(1) (636) (9) 0 (645) (9) 1.4%
Net Budget 791 656 10 0 666 10 1.5%
All figures are subject to rounding.
Graphics, Surveying & Technical Services2015 Approved Budget From Rates
Explanation of Adjustments
Increase/ (Decrease) Over
2014
($000's)

Page 198
2013 2014 2015
Object
ActualRevised
Budget
Maintain
Existing
Service
Service
Adjustments
Approved
Budget
Expenditures $ %
Personnel Costs 4,022 4,049 (25) 4,024 (25) (0.6%)
Administrative Expenses 416 678 2 680 2 0.3%
Financial Expenses 191 0 0 0 0 0.0%
Purchased Services 443 722 57 779 57 7.8%
Materials & Supplies 34 51 0 51 0 0.2%
Furniture & Equipment 13 28 33 61 33 118.6%
Other Expenses 0 0 0 0 0 0.0%
Recovered Expenses 0 0 0 0 0 0.0%
Total Expenditures 5,119 5,528 67 0 5,595 67 1.2%
Revenue
User Fees (2) (3) 0 (3) 0 0.0%
Other Municipal Revenues (757) (655) (13) (668) (13) 1.9%
Sub-total - Non Property Tax
Revenue(759) (658) (13) 0 (671) (13) 1.9%
Net Budget 4,360 4,870 54 0 4,924 54 1.1%
All figures are subject to rounding.
Human Resources2015 Approved Budget From Rates
Explanation of Adjustments
Increase/ (Decrease) Over
2014
($000's)

Page 199
2013 2014 2015
Object
ActualRevised
Budget
Maintain
Existing
Service
Service
Adjustments
Approved
Budget
Expenditures $ %
Personnel Costs 87 176 5 181 5 2.8%
Administrative Expenses 1 30 0 30 0 0.1%
Financial Expenses 0 0 0 0 0 0.0%
Purchased Services 37 74 0 74 0 0.0%
Materials & Supplies 0 1 0 1 0 0.0%
Furniture & Equipment 0 0 0 0 0 0.0%
Other Expenses 0 0 0 0 0 0.0%
Recovered Expenses 0 0 0 0 0 0.0%
Total Expenditures 125 281 5 0 286 5 1.8%
Revenue
User Fees 0 0 0 0 0 0.0%
Other Municipal Revenues 0 0 0 0 0 0.0%
Sub-total - Non Property Tax
Revenue0 0 0 0 0 0 0.0%
Net Budget 125 281 5 0 286 5 1.8%
All figures are subject to rounding.
Human Rights2015 Approved Budget From Rates
Explanation of Adjustments
Increase/ (Decrease) Over
2014
($000's)
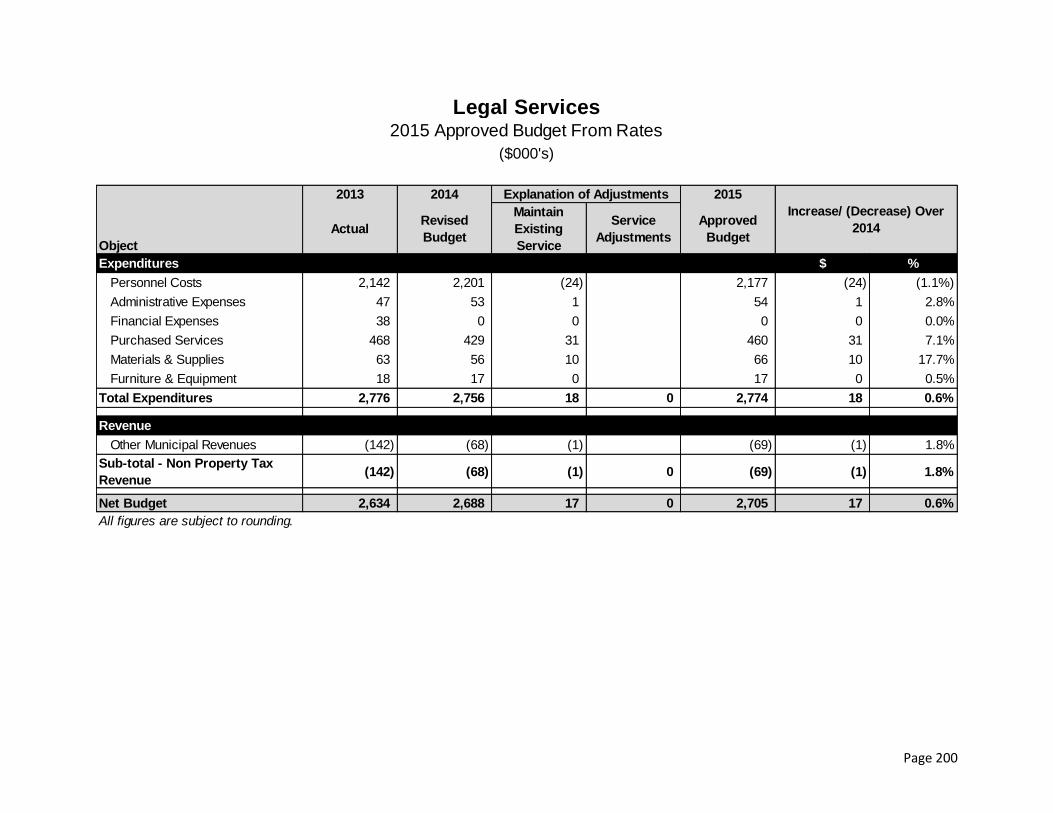
Page 200
2013 2014 2015
Object
ActualRevised
Budget
Maintain
Existing
Service
Service
Adjustments
Approved
Budget
Expenditures $ %
Personnel Costs 2,142 2,201 (24) 2,177 (24) (1.1%)
Administrative Expenses 47 53 1 54 1 2.8%
Financial Expenses 38 0 0 0 0 0.0%
Purchased Services 468 429 31 460 31 7.1%
Materials & Supplies 63 56 10 66 10 17.7%
Furniture & Equipment 18 17 0 17 0 0.5%
Total Expenditures 2,776 2,756 18 0 2,774 18 0.6%
Revenue
Other Municipal Revenues (142) (68) (1) (69) (1) 1.8%
Sub-total - Non Property Tax
Revenue(142) (68) (1) 0 (69) (1) 1.8%
Net Budget 2,634 2,688 17 0 2,705 17 0.6%
All figures are subject to rounding.
Legal Services2015 Approved Budget From Rates
Explanation of Adjustments
Increase/ (Decrease) Over
2014
($000's)

Page 201
2013 2014 2015
Object
ActualRevised
Budget
Maintain
Existing
Service
Service
Adjustments
Approved
Budget
Expenditures $ %
Personnel Costs 1,105 1,165 (28) 1,137 (28) (2.4%)
Administrative Expenses 13 10 0 10 0 (0.9%)
Financial Expenses 16 0 0 0 0 0.0%
Purchased Services 2 1 0 1 0 24.1%
Materials & Supplies 16 21 0 21 0 1.0%
Furniture & Equipment 17 0 3 3 3 0.0%
Total Expenditures 1,169 1,197 (25) 0 1,172 (25) (2.0%)
Revenue
Other Municipal Revenues (221) (198) (4) (202) (4) 1.9%
Sub-total - Non Property Tax
Revenue(221) (198) (4) 0 (202) (4) 1.9%
Net Budget 948 999 (29) 0 970 (29) (2.8%)
All figures are subject to rounding.
Finance Payroll Services2015 Approved Budget From Rates
Explanation of Adjustments
Increase/ (Decrease) Over
2014
($000's)

Page 202
2013 2014 2015
Object
ActualRevised
Budget
Maintain
Existing
Service
Service
Adjustments
Approved
Budget
Expenditures $ %
Personnel Costs 1,284 1,319 1 1,320 1 0.1%
Administrative Expenses 12 21 1 22 1 2.2%
Financial Expenses 0 0 0 0 0 0.0%
Purchased Services 0 0 0 0 0 (77.0%)
Materials & Supplies 6 8 0 8 0 0.0%
Furniture & Equipment 10 12 2 14 2 19.6%
Total Expenditures 1,312 1,360 4 0 1,364 4 0.3%
Revenue
User Fees (5) (15) 5 (10) 5 (33.3%)
Other Municipal Revenues (207) (429) (8) (437) (8) 1.9%
Sub-total - Non Property Tax
Revenue(212) (444) (3) 0 (447) (3) 0.7%
Net Budget 1,100 916 1 0 917 1 0.1%
All figures are subject to rounding.
Purchasing2015 Approved Budget From Rates
Explanation of Adjustments
Increase/ (Decrease) Over
2014
($000's)

Page 203
2013 2014 2015
Object
ActualRevised
Budget
Maintain
Existing
Service
Service
Adjustments
Approved
Budget
Expenditures $ %
Personnel Costs 730 891 10 901 10 1.1%
Administrative Expenses 17 25 0 25 0 1.2%
Financial Expenses 190 235 30 265 30 12.8%
Purchased Services 152 183 18 201 18 9.7%
Materials & Supplies 7 18 (1) 17 (1) (5.0%)
Furniture & Equipment 0 1 0 1 0 0.0%
Total Expenditures 1,096 1,353 57 0 1,410 57 4.2%
Revenue
User Fees (943) (1,012) (38) (1,050) (38) 3.8%
Sub-total - Non Property Tax
Revenue(943) (1,012) (38) 0 (1,050) (38) 3.8%
Net Budget 153 341 19 0 360 19 5.4%
All figures are subject to rounding.
Realty Services2015 Approved Budget From Rates
Explanation of Adjustments
Increase/ (Decrease) Over
2014
($000's)

Page 204
2013 2014 2015
Object
ActualRevised
Budget
Maintain
Existing
Service
Service
Adjustments
Approved
Budget
Expenditures $ %
Personnel Costs 365 372 (24) 348 (24) (6.6%)
Administrative Expenses 9 27 0 27 0 0.0%
Financial Expenses 0 0 0 0 0 0.0%
Purchased Services 19 30 0 30 0 0.0%
Materials & Supplies 1 3 0 3 0 0.0%
Furniture & Equipment 0 1 14 15 14 2311.6%
Total Expenditures 394 433 (10) 0 423 (10) (2.3%)
Revenue
User Fees (10) (5) (7) (12) (7) 144.4%
Other Municipal Revenues (97) (152) (1) (153) (1) 0.8%
Sub-total - Non Property Tax
Revenue(107) (157) (8) 0 (165) (8) 5.0%
Net Budget 287 276 (18) 0 258 (18) (6.5%)
All figures are subject to rounding.
Risk Management2015 Approved Budget From Rates
Explanation of Adjustments
Increase/ (Decrease) Over
2014
($000's)

Page 205
2013 2014 2015
Object
ActualRevised
Budget
Maintain
Existing
Service
Service
Adjustments
Approved
Budget
Expenditures $ %
Personnel Costs 7,730 8,322 (626) 7,696 (626) (7.5%)
Administrative Expenses 163 295 (30) 265 (30) (10.3%)
Financial Expenses 1,134 0 0 0 0 0.0%
Purchased Services 5,035 5,320 398 5,718 398 7.5%
Materials & Supplies 212 213 17 230 17 8.0%
Furniture & Equipment 2,927 3,152 (20) 3,132 (20) (0.6%)
Recovered Expenses (496) (509) 34 (475) 34 (6.6%)
Total Expenditures 16,705 16,793 (227) 0 16,566 (227) (1.4%)
Revenue
User Fees (5) (6) 0 (6) 0 0.0%
Other Municipal Revenues (524) (758) 227 (531) 227 (30.0%)
Sub-total - Non Property Tax
Revenue(529) (764) 227 0 (537) 227 (29.7%)
Net Budget 16,176 16,029 0 0 16,029 0 0.0%
All figures are subject to rounding.
Information Technology2015 Approved Budget From Rates
Explanation of Adjustments
Increase/ (Decrease) Over
2014
($000's)

Page 206
ExpenseNon Tax
Revenue
Net Tax
SupportedExpense
Non Tax
Revenue
Net Tax
SupportedExpense
Non Tax
Revenue
Net Tax
Supported
Tax
Supported
(%)
Corporate Management 2,076 (578) 1,498 2,110 (589) 1,521 34 (11) 23 1.6%
Governmental Liaison 529 (40) 489 531 (40) 491 2 0 2 0.4%
Information & Archive
Management617 (28) 589 618 (27) 591 1 1 2 0.3%
Total to Maintain
Existing Service Level3,222 (646) 2,576 3,259 (656) 2,603 37 (10) 27 1.0%
All figures are subject to rounding.
Corporate Planning & AdministrationSummary of Approved 2015 Budget From Rates
Service
2014 2015Increase / (Decrease) Over Previous Year
Revised Budget Approved Budget
($000's)

Page 207
2013 2014 2015
Object
ActualRevised
Budget
Maintain
Existing
Service
Service
Adjustments
Approved
Budget
Expenditures $ %
Personnel Costs 1,321 1,309 29 1,338 29 2.2%
Administrative Expenses 157 219 3 222 3 1.2%
Financial Expenses 14 0 0 0 0 0.0%
Purchased Services 213 531 2 533 2 0.4%
Materials & Supplies 7 12 0 12 0 3.1%
Furniture & Equipment 0 5 0 5 0 0.0%
Total Expenditures 1,712 2,076 34 0 2,110 34 1.7%
Revenue
Government Grants & Subsidies 0 0 0 0 0 0.0%
Other Municipal Revenues (1,153) (578) (11) (589) (11) 1.9%
Sub-total - Non Property Tax
Revenue(1,153) (578) (11) 0 (589) (11) 1.9%
Net Budget 559 1,498 23 0 1,521 23 1.6%
All figures are subject to rounding.
Corporate Management2015 Approved Budget From Rates
Explanation of Adjustments
Increase/ (Decrease) Over
2014
($000's)

Page 208
2013 2014 2015
Object
ActualRevised
Budget
Maintain
Existing
Service
Service
Adjustments
Approved
Budget
Expenditures $ %
Personnel Costs 420 438 2 440 2 0.5%
Administrative Expenses 37 49 (1) 48 (1) (2.7%)
Purchased Services 49 41 1 42 1 2.4%
Materials & Supplies 1 1 0 1 0 0.0%
Total Expenditures 507 529 2 0 531 2 0.4%
Revenue
Government Grants & Subsidies (49) (40) 0 (40) 0 0.0%
Other Municipal Revenues (1) 0 0 0 0 0.0%
Sub-total - Non Property Tax
Revenue(50) (40) 0 0 (40) 0 0.0%
Net Budget 457 489 2 0 491 2 0.4%
All figures are subject to rounding.
Governmental Liaison2015 Approved Budget From Rates
Explanation of Adjustments
Increase/ (Decrease) Over
2014
($000's)

Page 209
2013 2014 2015
Object
ActualRevised
Budget
Maintain
Existing
Service
Service
Adjustments
Approved
Budget
Expenditures $ %
Personnel Costs 493 546 (6) 540 (6) (1.0%)
Administrative Expenses 0 1 0 1 0 (60.0%)
Financial Expenses 0 0 0 0 0 0.0%
Purchased Services 75 70 7 77 7 9.4%
Materials & Supplies 0 0 0 0 0 0.0%
Total Expenditures 568 617 1 0 618 1 0.1%
Revenue
User Fees (10) (13) 1 (12) 1 (9.1%)
Other Municipal Revenues 0 (15) 0 (15) 0 1.9%
Sub-total - Non Property Tax
Revenue(10) (28) 1 0 (27) 1 (3.3%)
Net Budget 558 589 2 0 591 2 0.3%
All figures are subject to rounding.
Information & Archive Management2015 Approved Budget From Rates
Explanation of Adjustments
Increase/ (Decrease) Over
2014
($000's)

Page 210
ExpenseNon Tax
Revenue
Net Tax
SupportedExpense
Non Tax
Revenue
Net Tax
SupportedExpense
Non Tax
Revenue
Net Tax
Supported
Tax
Supported
(%)
Advisory Committees 99 0 99 107 0 107 8 0 8 8.1%
Audit 300 (7) 293 300 (7) 293 0 0 0 0.0%
Councillors' Office 1,304 0 1,304 1,300 0 1,300 (4) 0 (4) (0.3%)
Mayor's Office 527 0 527 524 0 524 (3) 0 (3) (0.5%)
Municipal Elections 1,734 (1,734) 0 55 (55) 0 (1,679) 1,679 0 0.0%
Secretariat Support (City
Clerk)1,069 (49) 1,020 1,076 (50) 1,026 7 (1) 6 0.6%
Total to Maintain
Existing Service Level5,033 (1,790) 3,243 3,362 (112) 3,250 (1,671) 1,678 7 0.2%
All figures are subject to rounding.
Council ServicesSummary of Approved 2015 Budget From Rates
Service
2014 2015Increase / (Decrease) Over Previous Year
Revised Budget Approved Budget
($000's)

Page 211
2013 2014 2015
Object
ActualRevised
Budget
Maintain
Existing
Service
Service
Adjustments
Approved
Budget
Expenditures $ %
Administrative Expenses 9 8 1 9 1 12.5%
Financial Expenses 5 0 0 0 0 0.0%
Purchased Services 83 105 7 112 7 6.8%
Recovered Expenses (15) (14) 0 (14) 0 1.2%
Total Expenditures 82 99 8 0 107 8 8.1%
Revenue
Other Municipal Revenues (5) 0 0 0 0 0.0%
Sub-total - Non Property Tax
Revenue(5) 0 0 0 0 0 0.0%
Net Budget 77 99 8 0 107 8 8.1%
Additional Information / Commentary With Respect To The 2015 Draft Budget
All figures are subject to rounding.
Maintaining Existing Service Levels (Flow through from prior years, inflation, contractual obligations, efficiencies)
Advisory Committees2015 Approved Budget From Rates
Explanation of Adjustments
Increase/ (Decrease) Over
2014
($000's)
Increase in administrative expenses due to increased usage of parking for Advisory Committee meetings.
Increase in purchased services due to increased usage of interpreters at meetings.

Page 212
2013 2014 2015
Object
ActualRevised
Budget
Maintain
Existing
Service
Service
Adjustments
Approved
Budget
Expenditures $ %
Purchased Services 351 300 0 300 0 0.0%
Total Expenditures 351 300 0 0 300 0 0.0%
Revenue
Other Municipal Revenues 0 (7) 0 (7) 0 0.0%
Sub-total - Non Property Tax
Revenue0 (7) 0 0 (7) 0 0.0%
Net Budget 351 293 0 0 293 0 0.0%
All figures are subject to rounding.
Audit2015 Approved Budget From Rates
Explanation of Adjustments
Increase/ (Decrease) Over
2014
($000's)

Page 213
2013 2014 2015
Object
ActualRevised
Budget
Maintain
Existing
Service
Service
Adjustments
Approved
Budget
Expenditures $ %
Personnel Costs 874 902 (6) 896 (6) (0.7%)
Administrative Expenses 92 99 2 101 2 1.5%
Financial Expenses 17 0 0 0 0 0.0%
Purchased Services 66 76 0 76 0 0.0%
Materials & Supplies 149 218 0 218 0 0.0%
Furniture & Equipment 1 9 0 9 0 0.0%
Total Expenditures 1,199 1,304 (4) 0 1,300 (4) (0.4%)
Revenue
Other Municipal Revenues 0 0 0 0 0 (100.0%)
Sub-total - Non Property Tax
Revenue0 0 0 0 0 0 0.0%
Net Budget 1,199 1,304 (4) 0 1,300 (4) (0.3%)
All figures are subject to rounding.
Councillors' Office2015 Approved Budget From Rates
Explanation of Adjustments
Increase/ (Decrease) Over
2014
($000's)

Page 214
2013 2014 2015
Object
ActualRevised
Budget
Maintain
Existing
Service
Service
Adjustments
Approved
Budget
Expenditures $ %
Personnel Costs 344 393 (1) 392 (1) (0.2%)
Administrative Expenses 18 26 0 26 0 0.8%
Purchased Services 39 86 (2) 84 (2) (2.2%)
Materials & Supplies 11 16 0 16 0 0.0%
Furniture & Equipment 1 6 0 6 0 0.0%
Total Expenditures 413 527 (3) 0 524 (3) (0.5%)
Revenue
Other Municipal Revenues 0 0 0 0 0 0.0%
Sub-total - Non Property Tax
Revenue0 0 0 0 0 0 0.0%
Net Budget 413 527 (3) 0 524 (3) (0.5%)
All figures are subject to rounding.
Mayor's Office2015 Approved Budget From Rates
Explanation of Adjustments
Increase/ (Decrease) Over
2014
($000's)

Page 215
2013 2014 2015
Object
ActualRevised
Budget
Maintain
Existing
Service
Service
Adjustments
Approved
Budget
Expenditures $ %
Personnel Costs 3 188 (151) 37 (151) (80.3%)
Administrative Expenses 0 15 (12) 3 (12) (79.3%)
Purchased Services 4 520 (515) 5 (515) (99.0%)
Materials & Supplies 0 503 (503) 0 (503) (100.0%)
Furniture & Equipment 5 509 (499) 10 (499) (98.0%)
Other Expenses 0 0 0 0 0 0.0%
Total Expenditures 12 1,735 (1,680) 0 55 (1,680) (96.8%)
Revenue
User Fees 0 (4) 4 0 4 (100.0%)
Other Municipal Revenues (8) (1,731) 1,676 (55) 1,676 (96.8%)
Sub-total - Non Property Tax
Revenue(8) (1,735) 1,680 0 (55) 1,680 (96.8%)
Net Budget 4 0 0 0 0 0 0.0%
All figures are subject to rounding.
Municipal Elections2015 Approved Budget From Rates
Explanation of Adjustments
Increase/ (Decrease) Over
2014
($000's)

Page 216
2013 2014 2015
Object
ActualRevised
Budget
Maintain
Existing
Service
Service
Adjustments
Approved
Budget
Expenditures $ %
Personnel Costs 888 928 (2) 926 (2) (0.2%)
Administrative Expenses 46 53 1 54 1 2.8%
Purchased Services 22 55 (13) 42 (13) (24.4%)
Materials & Supplies 43 55 0 55 0 (0.4%)
Furniture & Equipment 10 2 8 10 8 327.5%
Transfers 6 4 0 4 0 0.0%
Recovered Expenses (14) (28) 13 (15) 13 (47.4%)
Total Expenditures 1,001 1,069 7 0 1,076 7 0.7%
Revenue
Other Municipal Revenues (23) (49) (1) (50) (1) 1.9%
Sub-total - Non Property Tax
Revenue(23) (49) (1) 0 (50) (1) 1.9%
Net Budget 978 1,020 6 0 1,026 6 0.6%
All figures are subject to rounding.
Secretariat Support (City Clerk)2015 Approved Budget From Rates
Explanation of Adjustments
Increase/ (Decrease) Over
2014
($000's)

Page 217
ExpenseNon Tax
Revenue
Net Tax
SupportedExpense
Non Tax
Revenue
Net Tax
SupportedExpense
Non Tax
Revenue
Net Tax
Supported
Tax
Supported
(%)
Corporate Financing 116,944 (37,661) 79,283 127,509 (38,046) 89,463 10,565 (385) 10,180 12.8%
Finance 7,748 (2,455) 5,293 7,765 (2,492) 5,273 17 (37) (20) (0.4%)
Total to Maintain
Existing Service Level124,692 (40,116) 84,576 135,274 (40,538) 94,736 10,582 (422) 10,160 12.0%
All figures are subject to rounding.
Financial ManagementSummary of Approved 2015 Budget From Rates
Service
2014 2015Increase / (Decrease) Over Previous Year
Revised Budget Approved Budget
($000's)

Page 218
Corporate Financing2015 Approved Budget From Rates
($000's)
2013 2014 2015
Object
ActualRevised
Budget
Maintain
Existing
Service
Service
Adjustments
Approved
Budget
Expenditures $ %
Capital Financing:
a) Capital Levy 21,478 29,284 2,200 31,484 2,200 7.5%
b) Debt Servicing 39,865 37,511 13 37,524 13 0.0%
Contributions Reserves/ Reserve Funds
Capital Asset Renewal and
Replacement
Facilities: City 5,775 5,775 123 5,898 123 2.1%
Dearness Home 350 439 0 439 0 0.0%
Library 400 390 10 400 10 2.6%
Parking 175 0 0 0 0 0.0%
Sanitary Landfill Site 2,902 1,957 131 2,088 131 6.7%
Social Housing Major Repairs &
Upgrades
500 500 0 500 0 0.0%
Public Housing Major Upgrades
(LMHC)
2,208 2,208 0 2,208 0 0.0%
Vehicle Replacement: Fire 1,517 1,517 0 1,517 0 0.0%
Police 1,764 1,300 0 1,300 0 0.0%
Waste Diversion 121 0 0 0 0 0.0%
Capital Asset Growth
Industrial Oversizing 600 3,000 (2,600) 400 (2,600) (86.7%)
Industrial Land 1,600 1,892 0 1,892 0 0.0%
Development Charges Incentives
i) Industrial 0 815 815 815 0.0%
ii) Institutional 0 1,065 1,065 1,065 0.0%
iii) Residential 500 900 720 1,620 720 80.0%
iv) Commercial 0 0 0 0 0.0%
Explanation of Adjustments
Increase/ (Decrease) Over
2014
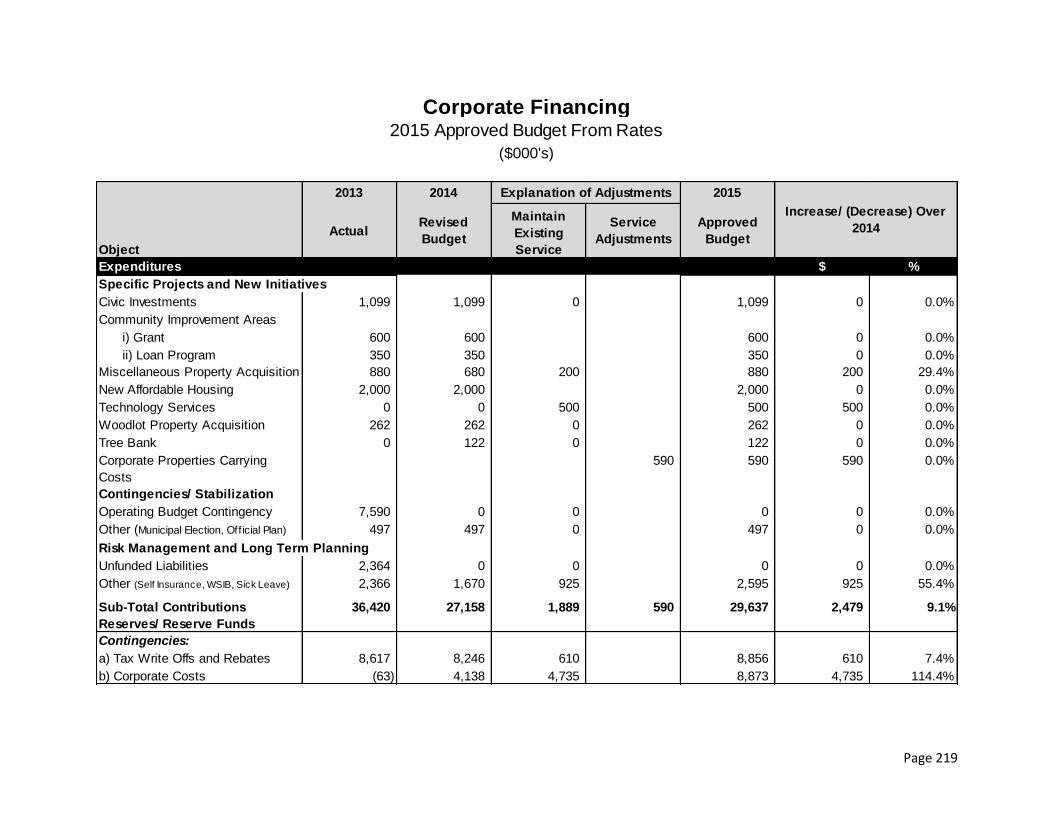
Page 219
Corporate Financing2015 Approved Budget From Rates
($000's)
2013 2014 2015
Object
ActualRevised
Budget
Maintain
Existing
Service
Service
Adjustments
Approved
Budget
Expenditures $ %
Civic Investments 1,099 1,099 0 1,099 0 0.0%
Community Improvement Areas
i) Grant 600 600 600 0 0.0%
ii) Loan Program 350 350 350 0 0.0%
Miscellaneous Property Acquisition 880 680 200 880 200 29.4%
New Affordable Housing 2,000 2,000 2,000 0 0.0%
Technology Services 0 0 500 500 500 0.0%
Woodlot Property Acquisition 262 262 0 262 0 0.0%
Tree Bank 0 122 0 122 0 0.0%
Corporate Properties Carrying
Costs
590 590 590 0.0%
Contingencies/ Stabilization
Operating Budget Contingency 7,590 0 0 0 0 0.0%
Other (Municipal Election, Official Plan) 497 497 0 497 0 0.0%
Unfunded Liabilities 2,364 0 0 0 0 0.0%
Other (Self Insurance, WSIB, Sick Leave) 2,366 1,670 925 2,595 925 55.4%
Sub-Total Contributions
Reserves/ Reserve Funds
36,420 27,158 1,889 590 29,637 2,479 9.1%
Contingencies:
a) Tax Write Offs and Rebates 8,617 8,246 610 8,856 610 7.4%
b) Corporate Costs (63) 4,138 4,735 8,873 4,735 114.4%
Specific Projects and New Initiatives
Risk Management and Long Term Planning
Explanation of Adjustments
Increase/ (Decrease) Over
2014

Page 220
Corporate Financing2015 Approved Budget From Rates
($000's)
2013 2014 2015
Object
ActualRevised
Budget
Maintain
Existing
Service
Service
Adjustments
Approved
Budget
Expenditures $ %
Other Corporate Expenditures:
a) Personnel/Administrative (retiree
benefits, parking, subscriptions)
2,355 1,936 71 2,007 71 3.7%
b) Interest Charges/Bank Fees 48 94 2 96 2 2.1%
c) Professional Fees (i.e..
Accounting, Consulting, Communications,
Legal)
1,123 901 31 932 31 3.4%
d) Insurance Costs 2,520 1,733 427 2,160 427 24.6%
e) Municipal Property Assessment
Corporation (MPAC)
4,608 4,703 (3) 4,700 (3) (0.1%)
f) County of Middlesex - suburban
roads payments
1,085 1,240 0 1,240 0 0.0%
Total Expenditures 118,056 116,944 9,975 590 127,509 10,565 9.0%
Revenue
Other Taxation:
a) Grants In Lieu of Taxes &
Railway Rights of Way
(9,163) (9,152) (17) 0 (9,169) (17) 0.2%
b) Supplementary Taxes (6,381) (5,100) 0 0 (5,100) 0 0.0%
c) Local Improvements (65) (143) 0 (143) 0 0.0%
Sub-Total Other Taxation (15,609) (14,395) (17) 0 (14,412) (17) 0.1%
Government Grants & Subsidy:
a) Dearness - Provincial Capital
Recovery
(918) (918) 0 (918) 0 0.0%
b) OMPF (3,726) 0 0 0 0 0.0%
Sub-Total Government Grants (4,644) (918) 0 0 (918) 0 0.0%
Explanation of Adjustments
Increase/ (Decrease) Over
2014

Page 221
Corporate Financing2015 Approved Budget From Rates
($000's)
2013 2014 2015
Object
ActualRevised
Budget
Maintain
Existing
Service
Service
Adjustments
Approved
Budget
Revenue $ %
Other Municipal Revenues:
a) Penalty & Interest (4,926) (3,400) 0 0 (3,400) 0 0.0%
b) Short & Long Term Investments (2,171) (3,285) (995) (4,280) (995) 30.3%
c) Draw from Operating Reserves 0 0 0.0%
i) Strategic Draw from
Operating Budget Contingency
Reserve
(1,026) (4,790) 1,240 (590) (4,140) 650 (13.6%)
ii) Transfer from Capital
Reserves
(10) 0 0 0 0 0.0%
d) Western Fair
i) Slot Machine (4,658) (4,500) 0 (4,500) 0 0.0%
ii) Rent (550) (566) (14) (580) (14) 2.5%
e) Recovery (London Hydro)
i) London Hydro-interest (4,200) 0 0 0 0 0.0%
ii) London Hydro-dividend (3,000) (5,000) (5,000) 0 0.0%
iii) London Hydro-
administrative recovery
(75) (75) 0 (75) 0 0.0%
f) Recovery from Water &
Wastewater Rate Budget
(817) (492) (9) (501) (9) 1.9%
g) Other (279) (240) 0 (240) 0 0.0%
Sub-total Other Municipal Revenue (21,712) (22,348) 222 (590) (22,716) (368) 1.6%
Sub-total - Non Property Tax
Revenue
(41,965) (37,661) 205 (590) (38,046) (385) 1.0%
Net Budget 76,091 79,283 10,180 0 89,463 10,180 12.8%
All figures are subject to rounding.
Explanation of Adjustments
Increase/ (Decrease) Over
2014
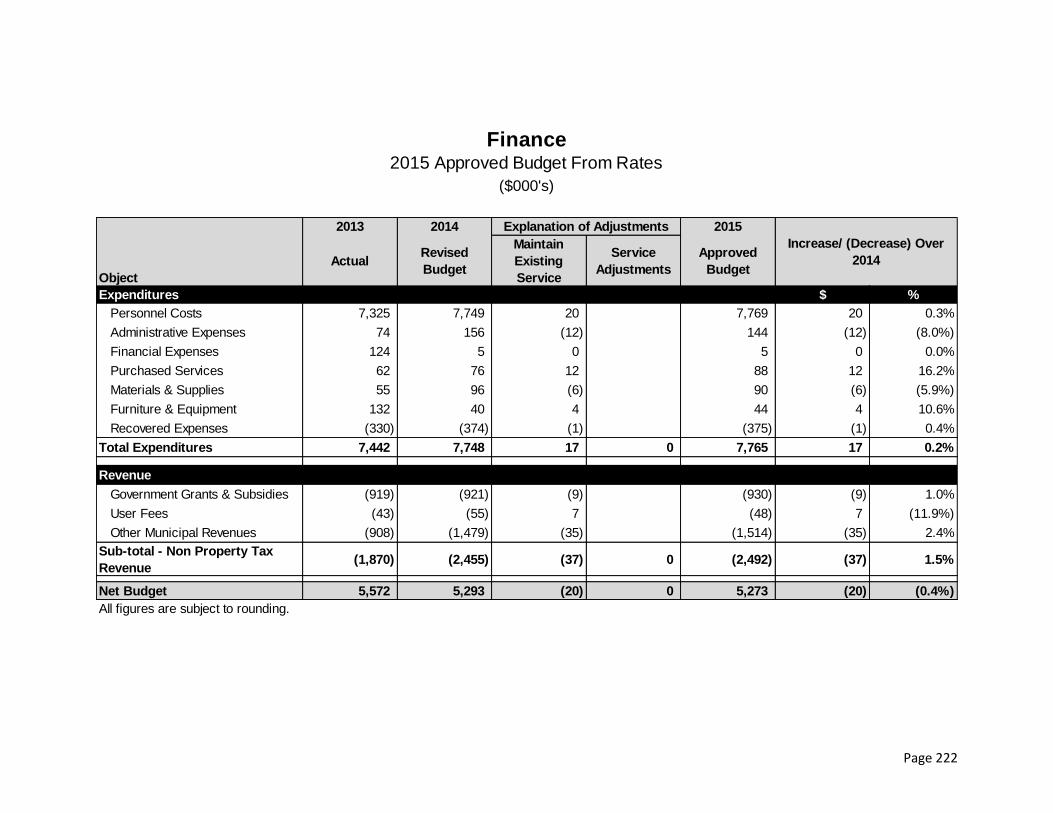
Page 222
2013 2014 2015
Object
ActualRevised
Budget
Maintain
Existing
Service
Service
Adjustments
Approved
Budget
Expenditures $ %
Personnel Costs 7,325 7,749 20 7,769 20 0.3%
Administrative Expenses 74 156 (12) 144 (12) (8.0%)
Financial Expenses 124 5 0 5 0 0.0%
Purchased Services 62 76 12 88 12 16.2%
Materials & Supplies 55 96 (6) 90 (6) (5.9%)
Furniture & Equipment 132 40 4 44 4 10.6%
Recovered Expenses (330) (374) (1) (375) (1) 0.4%
Total Expenditures 7,442 7,748 17 0 7,765 17 0.2%
Revenue
Government Grants & Subsidies (919) (921) (9) (930) (9) 1.0%
User Fees (43) (55) 7 (48) 7 (11.9%)
Other Municipal Revenues (908) (1,479) (35) (1,514) (35) 2.4%
Sub-total - Non Property Tax
Revenue(1,870) (2,455) (37) 0 (2,492) (37) 1.5%
Net Budget 5,572 5,293 (20) 0 5,273 (20) (0.4%)
All figures are subject to rounding.
Finance2015 Approved Budget From Rates
Explanation of Adjustments
Increase/ (Decrease) Over
2014
($000's)

Page 223
ExpenseNon Tax
Revenue
Net Tax
SupportedExpense
Non Tax
Revenue
Net Tax
SupportedExpense
Non Tax
Revenue
Net Tax
Supported
Tax
Supported
(%)
Administration of Justice 3,503 (5,502) (1,999) 3,511 (5,502) (1,991) 8 0 8 0.4%
Taxation 1,859 (1,178) 681 1,841 (1,196) 645 (18) (18) (36) (5.2%)
Corporate Communications 836 (85) 751 836 (73) 763 0 12 12 1.7%
Customer Relations 2,359 (1,392) 967 1,285 (285) 1,000 (1,074) 1,107 33 3.4%
Licensing & Certificates 446 (770) (324) 462 (784) (322) 16 (14) 2 0.7%
Cafeteria 407 (307) 100 407 (307) 100 0 0 0 (0.4%)
Total to Maintain
Existing Service Level9,410 (9,234) 176 8,342 (8,147) 195 (1,068) 1,087 19 11.0%
All figures are subject to rounding.
Public Support ServicesSummary of Approved 2015 Budget From Rates
Service
2014 2015Increase / (Decrease) Over Previous Year
Revised Budget Approved Budget
($000's)

Page 224
2013 2014 2015
Object
ActualRevised
Budget
Maintain
Existing
Service
Service
Adjustments
Approved
Budget
Expenditures $ %
Personnel Costs 1,088 1,116 (5) 1,111 (5) (0.5%)
Administrative Expenses 5 7 (1) 6 (1) (17.0%)
Financial Expenses 265 309 (33) 276 (33) (10.6%)
Purchased Services 1,553 1,598 44 1,642 44 2.7%
Materials & Supplies 62 84 4 88 4 5.1%
Furniture & Equipment 32 34 (1) 33 (1) (2.1%)
Transfers 295 305 0 305 0 0.0%
Other Expenses 49 50 0 50 0 0.0%
Total Expenditures 3,349 3,503 8 0 3,511 8 0.2%
Revenue
Other Municipal Revenues (5,583) (5,502) 0 (5,502) 0 0.0%
Sub-total - Non Property Tax
Revenue(5,583) (5,502) 0 0 (5,502) 0 0.0%
Net Budget (2,234) (1,999) 8 0 (1,991) 8 0.4%
All figures are subject to rounding.
Administration of Justice2015 Approved Budget From Rates
Explanation of Adjustments
Increase/ (Decrease) Over
2014
($000's)

Page 225
2013 2014 2015
Object
ActualRevised
Budget
Maintain
Existing
Service
Service
Adjustments
Approved
Budget
Expenditures $ %
Personnel Costs 1,495 1,669 (18) 1,651 (18) (1.1%)
Administrative Expenses 17 28 0 28 0 (1.1%)
Financial Expenses 134 57 0 57 0 0.0%
Purchased Services 22 23 (1) 22 (1) (0.6%)
Materials & Supplies 59 82 (2) 80 (2) (2.4%)
Furniture & Equipment 0 0 3 3 3 0.0%
Total Expenditures 1,727 1,859 (18) 0 1,841 (18) (0.9%)
Revenue
User Fees (1,337) (1,128) (18) (1,146) (18) 1.6%
Other Municipal Revenues (247) (50) 0 (50) 0 0.0%
Sub-total - Non Property Tax
Revenue(1,584) (1,178) (18) 0 (1,196) (18) 1.6%
Net Budget 143 681 (36) 0 645 (36) (5.2%)
All figures are subject to rounding.
Taxation2015 Approved Budget From Rates
Explanation of Adjustments
Increase/ (Decrease) Over
2014
($000's)
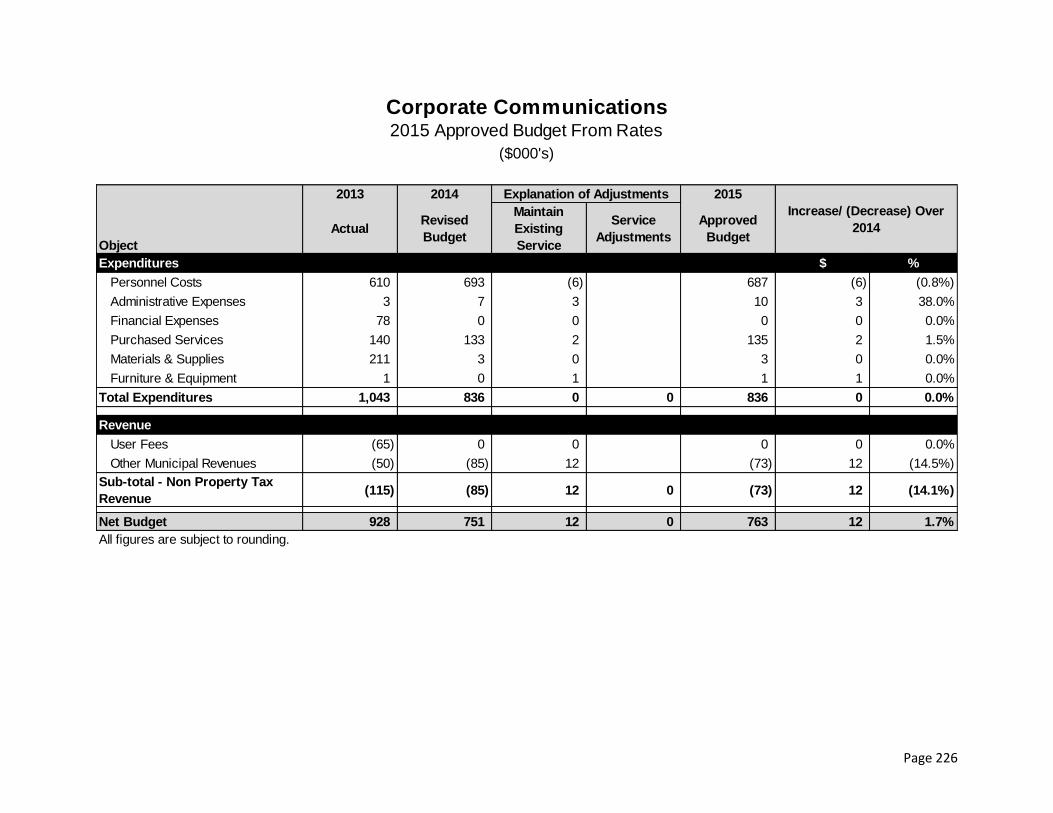
Page 226
2013 2014 2015
Object
ActualRevised
Budget
Maintain
Existing
Service
Service
Adjustments
Approved
Budget
Expenditures $ %
Personnel Costs 610 693 (6) 687 (6) (0.8%)
Administrative Expenses 3 7 3 10 3 38.0%
Financial Expenses 78 0 0 0 0 0.0%
Purchased Services 140 133 2 135 2 1.5%
Materials & Supplies 211 3 0 3 0 0.0%
Furniture & Equipment 1 0 1 1 1 0.0%
Total Expenditures 1,043 836 0 0 836 0 0.0%
Revenue
User Fees (65) 0 0 0 0 0.0%
Other Municipal Revenues (50) (85) 12 (73) 12 (14.5%)
Sub-total - Non Property Tax
Revenue(115) (85) 12 0 (73) 12 (14.1%)
Net Budget 928 751 12 0 763 12 1.7%
All figures are subject to rounding.
Corporate Communications2015 Approved Budget From Rates
Explanation of Adjustments
Increase/ (Decrease) Over
2014
($000's)

Page 227
2013 2014 2015
Object
ActualRevised
Budget
Maintain
Existing
Service
Service
Adjustments
Approved
Budget
Expenditures $ %
Personnel Costs 254 472 (79) 393 (79) (16.6%)
Administrative Expenses 4 2 8 10 8 300.4%
Purchased Services 98 45 13 58 13 29.7%
Materials & Supplies 846 809 36 845 36 4.4%
Furniture & Equipment 0 1,059 (1,052) 7 (1,052) (99.4%)
Recovered Expenses (28) (28) 0 (28) 0 0.0%
Total Expenditures 1,174 2,359 (1,074) 0 1,285 (1,074) (45.5%)
Revenue
Other Municipal Revenues (152) (1,392) 1,107 (285) 1,107 (79.5%)
Sub-total - Non Property Tax
Revenue(152) (1,392) 1,107 0 (285) 1,107 (79.5%)
Net Budget 1,022 967 33 0 1,000 33 3.4%
All figures are subject to rounding.
Customer Relations2015 Approved Budget From Rates
Explanation of Adjustments
Increase/ (Decrease) Over
2014
($000's)

Page 228
2013 2014 2015
Object
ActualRevised
Budget
Maintain
Existing
Service
Service
Adjustments
Approved
Budget
Expenditures $ %
Personnel Costs 323 348 4 352 4 1.1%
Administrative Expenses 0 0 0 0 0 0.0%
Financial Expenses 28 3 1 4 1 50.0%
Purchased Services 9 5 3 8 3 60.0%
Materials & Supplies 92 67 8 75 8 11.6%
Furniture & Equipment 0 23 0 23 0 0.0%
Total Expenditures 452 446 16 0 462 16 3.6%
Revenue
User Fees (801) (770) (14) (784) (14) 1.8%
Sub-total - Non Property Tax
Revenue(801) (770) (14) 0 (784) (14) 1.8%
Net Budget (349) (324) 2 0 (322) 2 0.7%
All figures are subject to rounding.
Licensing & Certificates2015 Approved Budget From Rates
Explanation of Adjustments
Increase/ (Decrease) Over
2014
($000's)

Page 229
2013 2014 2015
Object
ActualRevised
Budget
Maintain
Existing
Service
Service
Adjustments
Approved
Budget
Expenditures $ %
Personnel Costs 274 257 0 257 0 (0.1%)
Administrative Expenses 0 2 0 2 0 0.0%
Financial Expenses 1 1 0 1 0 0.0%
Purchased Services 13 5 0 5 0 0.0%
Materials & Supplies 111 142 0 142 0 0.0%
Total Expenditures 399 407 0 0 407 0 (0.1%)
Revenue
Other Municipal Revenues (259) (307) 0 (307) 0 0.0%
Sub-total - Non Property Tax
Revenue(259) (307) 0 0 (307) 0 0.0%
Net Budget 140 100 0 0 100 0 (0.4%)
All figures are subject to rounding.
Cafeteria2015 Approved Budget From Rates
Explanation of Adjustments
Increase/ (Decrease) Over
2014
($000's)

Page 230

Page 231
2014
Revised
Budget
2015
Approved
Budget
2016
Forecast
2017
Forecast
2018
Forecast
2019
Forecast
2020-2024
Forecast
Lifecycle Renewal 60,398 66,451 74,940 65,312 66,886 69,978 367,981
Growth 48,029 51,027 104,390 113,090 174,960 112,606 291,141
Service Improvement 36,095 10,905 16,994 16,632 16,241 13,250 122,940
Total Expenditures $144,522 $128,383 $196,324 $195,034 $258,087 $195,834 $782,062
($ 000's)
2014
Revised
Budget
2015
Approved
Budget
2016
Forecast
2017
Forecast
2018
Forecast
2019
Forecast
2020-2024
Forecast
Tangible Capital Asset 130,839 123,842 191,926 190,614 254,022 191,884 772,617
Non-Tangible Capital Asset 13,683 4,541 4,398 4,420 4,065 3,950 9,445
Total FUNDED Expenditures $144,522 $128,383 $196,324 $195,034 $258,087 $195,834 $782,062
2015 CAPITAL BUDGET
WITH FORECASTS FOR 2016-2024
($000'S)
Notes: The chart below has been added because Non-TCA projects could be classified as lifecycle, growth or service
improvement. Non-TCA are expenditures that will not result in the creation of a tangible asset (having physical substance). It
should be noted that the Non-TCA summary only includes projects that are 100% Non-TCA.

Page 232
Source of Funding
2014
Revised
Budget
2015
Approved
Budget
2016
Forecast
2017
Forecast
2018
Forecast
2019
Forecast
2020-2024
Forecast
Tax Supported
Capital Levy 26,957 29,157 31,357 33,557 35,757 37,957 222,785
Debenture (1) 20,425 22,060 29,568 26,307 33,290 17,200 62,280
Reserve Fund 41,599 20,199 20,592 17,186 17,921 20,744 119,346
Other (2) 4,047 998 763 400 350 100 500
Total Tax Supported $93,028 $72,414 $82,280 $77,450 $87,318 $76,001 $404,911
Non-Tax Supported
Debenture 9,408 2,719 19,038 27,365 39,269 22,920 96,686
Reserve Fund 25,095 37,108 37,687 34,691 38,954 39,136 116,160
Federal Gas Tax 12,054 10,998 15,235 12,765 13,184 16,724 95,180
Provincial Grants 3,021 1,121 1,661 1,599 1,619 1,619 10,592
Senior Government 0 4,008 40,408 41,149 77,728 39,419 58,458
Other 1,916 15 15 15 15 15 75
Total Non-Tax Supported $51,494 $55,969 $114,044 $117,584 $170,769 $119,833 $377,151
Total $144,522 $128,383 $196,324 $195,034 $258,087 $195,834 $782,062
Figures rounded for presentation purposes
1) The 2015 to 2024 capital plan calls for an average debt cap limit of $26.0 million.
2) 2014 other rate supported funding includes unallocated capital levy.
2015 CAPITAL BUDGET WITH FORECASTS
SOURCES OF FUNDING
($ 000's)

Page 233
Major Capital Works in Ten Year Plan 2015- 2024 ($ millions) 2015 2016-2024
Culture Services
Municipally Owned Heritage Building Lifecycle Renewal Program 0.5$ 4.3$
Centennial Hall Lifecycle Renewal Program 0.2$ 1.6$
Museum London Lifecycle Renewal Program 1.5$ 3.1$
Northwest Branch Library - 2019 3.3$
Southeast Branch Library - 2018 3.3$
Economic Prosperity
Convention Centre Lifecycle Renewal Program (incl. reconfiguration of Main Level) 2.7$ 7.6$
Economic Stimulus Capacity Reinvestment (401 Interchanges) 1.3$ 10.0$
New Economy - Fanshawe College (incl. Kingsmills) 2.5$ 15.3$
New Economy - Medical Devices Initiative 0.2$ 1.5$
Industrial Land Acquisition, Servicing and Development 5.9$ 62.9$
Environmental Services
Landfill Gas Collection 0.4$ 2.0$
New & Emerging Solid Waste Technologies 35.0$
W12A New Cell Construction 9.8$
Long Term Disposal Capacity 19.0$
Parks, Recreation & Neighbourhood Services
Two Multi-purpose Recreation Centres - (East-Construction 2016 & Southeast-Construction 2018) 10.4$ 30.4$
Various Tree Planting and Woodland Management Programs (incl. Emerald Ash) 1.5$ 10.2$
Thames Valley Parkway 1.2$ 8.5$
Recreation Facilities - Lifecycle Renewal Program 3.7$ 33.4$
Parks Projects Lifecycle Renewal Program 2.4$ 36.6$

Page 234
Major Capital Works in Ten Year Plan 2015- 2024 ($ millions) 2015 2016-2024
Protective Services
Replacement and Relocation of Training Tower 7.5$
New Fire Station No. 15 - South East London - 2018 3.1$
Fire Vehicle Replacement Program 2.3$ 6.4$
Police Vehicle Replacement Program 1.0$ 13.5$
Fire Stations Lifecycle Renewal Program 0.6$ 6.4$
Police Headquarters Lifecycle Renewal Program 0.5$ 5.6$
Social & Health Services
Dearness Home Lifecycle Renewal Program 0.4$ 4.0$
Public Housing 2.2$ 19.9$
Transportation Services
Hyde Park Widening Phase II (CP Rail to Fanshawe) 12.8$
Commissioners Rd Widening (Wonderland to Viscount) (Construction 2015) 10.5$
Future Road Widening & New Initiatives 9.8$ 368.0$
Roads and Bridges - Lifecycle Renewal, i.e.:
Colborne Street (construction from Grey to Nelson)
Fanshawe Park Rd (construction from Medway Bridge to North Centre Road)
Ridout/Upper Queens/Nixon (construction from Baseline to Southdale)
Highbury Ave over CN Rail Bridge Rehabilitation
Construction on various Road Rehabilitation projects
20.8$ 214.2$
Bike Lanes 0.8$ 7.0$
Rapid Transit Investment (Incl. Road Widening and buses) 2.7$ 340.3$
Transit System Investment 6.3$ 74.3$
Corporate, Operational and Council Services
Information Technology Services 1.2$ 23.5$
City Vehicle & Equipment Lifecycle Replacement Program 3.7$ 41.8$
City Facilities Lifecycle Renewal (including City Hall, Energy Savings Initiatives, Operation Facilities) 2.7$ 23.2$

Page 235

Page 236
($000's)
2014 2015 2016 2017 2018 2019 2020 2021 2022 2023 2024Total
2015-2024
Grand
Total
Culture 1,548 4,867 1,737 1,747 1,567 1,577 1,567 1,577 1,567 1,577 1,567 19,350 20,898
Economic Prosperity 1,155 2,661 187 1,115 1,032 221 891 813 660 1,617 1,120 10,317 11,472
Environmental Services 2,518 815 3,885 1,175 385 3,425 1,135 3,475 1,255 325 745 16,620 19,138
Parks, Recreation &
Neighbourhood Services 7,730 7,615 9,009 8,584 8,681 8,753 8,778 8,953 9,448 9,743 9,258 88,822 96,552
Planning & Development Services 100 175 100 100 100 100 100 100 100 100 100 1,075 1,175
Protective Services 3,000 5,479 6,899 3,437 4,188 3,746 4,024 4,059 4,373 6,828 6,602 49,635 52,635
Social & Health Services 2,597 2,608 2,608 2,608 2,708 2,658 2,658 2,658 2,658 2,658 2,658 26,480 29,077
Transportation Services 31,993 34,946 42,832 39,153 39,702 40,097 40,926 41,255 41,854 41,941 42,290 404,996 436,989
Corporate, Operational & Council
Services 9,757 7,285 7,683 7,393 8,522 9,401 11,017 7,293 13,425 9,807 12,426 94,252 104,009
Total LCR Budget 60,398 66,451 74,940 65,313 66,886 69,978 71,096 70,183 75,340 74,596 76,766 711,547 771,945
SUMMARY OF LIFECYCLE RENEWAL CAPITAL PROJECTS
EXPENDITURE BY SERVICE PROGRAM

Page 237
CULTURE
CULTURAL SERVICES
Total Total
Project 2014 2015 2016 2017 2018 2019 2020 2021 2022 2023 2024 2015-2024 Project Cost
GG1841-15 Museum London Major Upgrade 340 1,450 340 350 340 350 340 350 340 350 340 4,550 4,890
180 180 180 180 180 180 180 180 180 180 180 1,800 1,980
520 1,630 520 530 520 530 520 530 520 530 520 6,350 6,870
HERITAGE
* PD2154 Heritage Conservation 75 75 75 75 75 75 75 75 75 75 75 750 825
462 472 472 472 472 472 472 472 472 472 472 4,720 5,182
537 547 547 547 547 547 547 547 547 547 547 5,470 6,007
LIBRARIES
RC3341 Integrated Library System 240 200 200 200 250 250 250 250 250 250 250 2,350 2,590
RC3345 Library Vehicle Purchases 101 0 101
RC3533 Library Branch Facilities Upgrade 50 50 50 50 50 50 50 50 50 50 50 500 550
RC3536 Central Library Revitalization 2,020 2,020 2,020
RC3540 Library Facility Renewal Plan 100 420 420 420 200 200 200 200 200 200 200 2,660 2,760
491 2,690 670 670 500 500 500 500 500 500 500 7,530 8,021
1,548 4,867 1,737 1,747 1,567 1,577 1,567 1,577 1,567 1,577 1,567 19,350 20,898
Note: * represents projects that are classified as non-tangible capital assets. These expenditures will not result in the creation of a tangible asset (having physical substance).
LIFECYCLE RENEWAL CAPITAL EXPENDITURES
($000's)
TOTAL LIBRARIES
TOTAL CULTURE
TS6186-15 Centennial Hall Bldg Code Requirements
TOTAL CULTURAL SERVICES
PD2324-15 Municipally Owned Heritage Structure
TOTAL HERITAGE

Page 238
ECONOMIC PROSPERITY
ECONOMIC DEVELOPMENT
Total Total
Project 2014 2015 2016 2017 2018 2019 2020 2021 2022 2023 2024 2015-2024 Project Cost
1,155 696 187 1,115 1,032 221 891 813 660 1,617 1,120 8,352 9,507
1,965 1,965 1,965
1,155 2,661 187 1,115 1,032 221 891 813 660 1,617 1,120 10,317 11,472
1,155 2,661 187 1,115 1,032 221 891 813 660 1,617 1,120 10,317 11,472
ENVIRONMENTAL SERVICES
SW6025 Waste Diversion 50 60 60 60 60 240 290
* SW6051 Municipal Waste Study 200 200 400 400
SW6530 Material Recovery Facility 60 230 50 450 790 790
SW6014-15 W12A Ancillary Infrastructure 161 300 150 300 150 150 300 150 300 150 300 2,250 2,411
SW6021-15 W12A New Cell Construction 100 3,300 100 3,100 100 3,100 9,800 9,800
SW6040-15 Landfill Gas Collection 332 340 100 540 100 370 100 370 100 370 2,390 2,722
SW6087-15 Closed Landfill Management 75 75 75 75 75 75 75 75 75 75 75 750 825
SW6030 Landfill Site Property Acquisition 1,900 0 1,900
2,518 815 3,885 1,175 385 3,425 1,135 3,475 1,255 325 745 16,620 19,138
2,518 815 3,885 1,175 385 3,425 1,135 3,475 1,255 325 745 16,620 19,138
Note: * represents projects that are classified as non-tangible capital assets. These expenditures will not result in the creation of a tangible asset (having physical substance).
TOTAL GARBAGE RECYCLING &
COMPOSTING
TOTAL ENVIRONMENTAL
SERVICES
TOTAL ECONOMIC
DEVELOPMENT
TOTAL ECONOMIC PROSPERITY
GG1770 Reconfiguration of Main Level of
London Convention Centre
GARBAGE RECYCLING & COMPOSTING
LIFECYCLE RENEWAL CAPITAL EXPENDITURES
($000's)
GG1765-15 London Convention Centre
Upgrades

Page 239
PARKS, RECREATION & NEIGHBOURHOOD SERVICES
Total Total
Project 2014 2015 2016 2017 2018 2019 2020 2021 2022 2023 2024 2015-2024 Project Cost
100 50 50 75 75 350 350
RC2445 Senior Centres Lifecycle Renewal 110 620 310 120 110 120 210 220 110 120 120 2,060 2,170
100 100 100 100 110 510 510
RC2201-15 Recreation Facilities 4,141 3,119 5,058 3,363 3,205 3,202 3,222 3,202 4,222 3,202 3,302 35,097 39,238
RC2881-15 2015 Golf Course Lifecycle 150 150 150 175 200 200 200 200 200 200 200 1,875 2,025
4,401 4,089 5,568 3,758 3,565 3,622 3,707 3,722 4,532 3,707 3,622 39,892 44,293
100 100 100 100 100 500 500
PD1023-15 District Park Infrastructure 250 350 250 500 500 500 500 500 500 500 500 4,600 4,850
GG1312-04/PD1129-15 Downtown Street Tree Planting 225 225 225 225 225 225 225 225 225 225 225 2,250 2,475
PD1173-15 Springbank Park Upgrades 150 150 200 400 400 400 400 400 400 400 400 3,550 3,700
PD1235-15 Street Tree Planting Program 411 411 411 411 411 411 411 411 411 411 411 4,110 4,521
400 220 180 500 500 500 500 500 500 500 500 4,400 4,800
220 270 350 350 450 450 450 450 550 550 250 4,120 4,340
400 300 50 350 250 250 250 250 250 250 250 2,450 2,850
150 150 150 150 150 150 150 150 150 150 1,350 1,500
PD2135-15 Maintain Thames Valley Parkway
LIFECYCLE RENEWAL CAPITAL EXPENDITURES
($000's)
NEIGHBOURHOOD & RECREATION SERVICES
PARKS & URBAN FORESTRY
TOTAL NEIGHBOURHOOD & RECREATION
SERVICES
RC2620 Update Security Systems - Rec Facilities
RC2070 Customer Service Systems
PD2173-16 Maintain Sportspark Infrastructure
PD1282-15 Maintain Neighbourhood Park Infrastructure
PD1070 Victoria Park Redevelopment
PD2063-15 Maintain Major Open Space Network
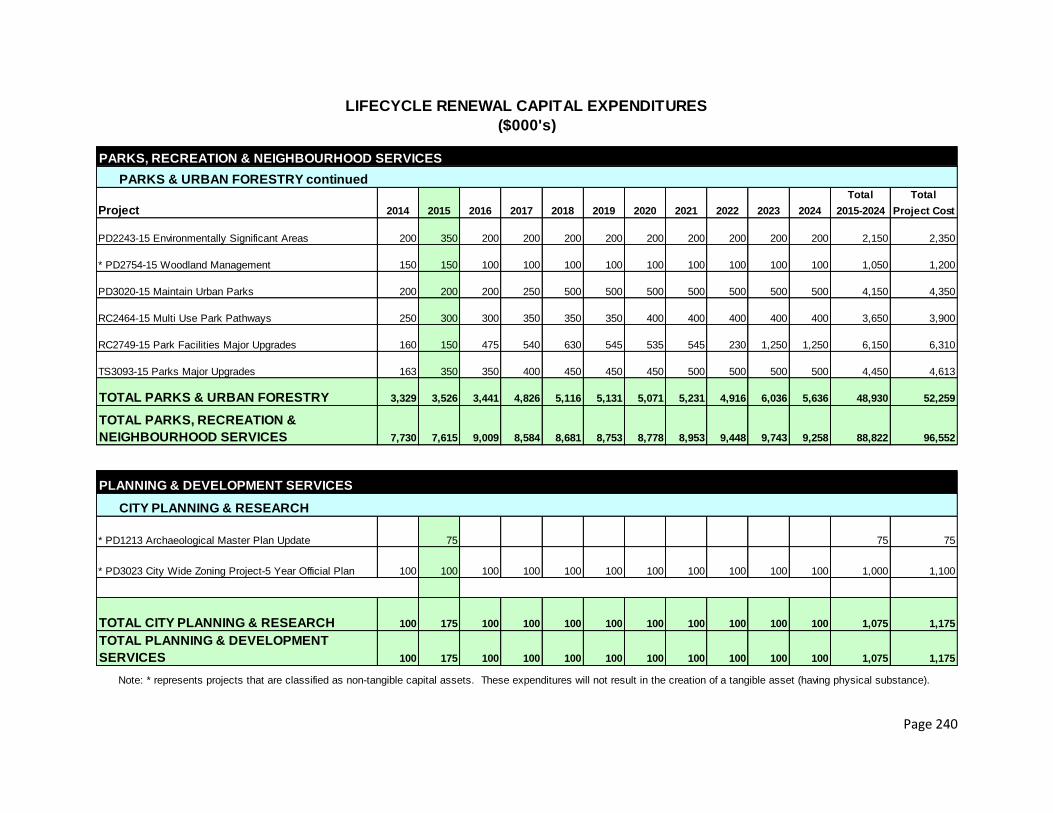
Page 240
PARKS, RECREATION & NEIGHBOURHOOD SERVICES
Total Total
Project 2014 2015 2016 2017 2018 2019 2020 2021 2022 2023 2024 2015-2024 Project Cost
PD2243-15 Environmentally Significant Areas 200 350 200 200 200 200 200 200 200 200 200 2,150 2,350
* PD2754-15 Woodland Management 150 150 100 100 100 100 100 100 100 100 100 1,050 1,200
PD3020-15 Maintain Urban Parks 200 200 200 250 500 500 500 500 500 500 500 4,150 4,350
RC2464-15 Multi Use Park Pathways 250 300 300 350 350 350 400 400 400 400 400 3,650 3,900
RC2749-15 Park Facilities Major Upgrades 160 150 475 540 630 545 535 545 230 1,250 1,250 6,150 6,310
TS3093-15 Parks Major Upgrades 163 350 350 400 450 450 450 500 500 500 500 4,450 4,613
3,329 3,526 3,441 4,826 5,116 5,131 5,071 5,231 4,916 6,036 5,636 48,930 52,259
7,730 7,615 9,009 8,584 8,681 8,753 8,778 8,953 9,448 9,743 9,258 88,822 96,552
PLANNING & DEVELOPMENT SERVICES
CITY PLANNING & RESEARCH
75 75 75
100 100 100 100 100 100 100 100 100 100 100 1,000 1,100
100 175 100 100 100 100 100 100 100 100 100 1,075 1,175
100 175 100 100 100 100 100 100 100 100 100 1,075 1,175
Note: * represents projects that are classified as non-tangible capital assets. These expenditures will not result in the creation of a tangible asset (having physical substance).
LIFECYCLE RENEWAL CAPITAL EXPENDITURES
($000's)
TOTAL PARKS & URBAN FORESTRY
TOTAL CITY PLANNING & RESEARCH
TOTAL PARKS, RECREATION &
NEIGHBOURHOOD SERVICES
TOTAL PLANNING & DEVELOPMENT
SERVICES
* PD3023 City Wide Zoning Project-5 Year Official Plan
* PD1213 Archaeological Master Plan Update
PARKS & URBAN FORESTRY continued

Page 241
PROTECTIVE SERVICES
EMERGENCY & SECURITY MANAGEMENT
Total Total
Project 2014 2015 2016 2017 2018 2019 2020 2021 2022 2023 2024 2015-2024 Project Cost
GG1589 Facility Mtce Security Measures 95 100 150 150 150 150 150 150 150 150 150 1,450 1,545
GG1600 Emergency Management 50 50 50 50 50 50 50 50 50 50 50 500 550
145 150 200 200 200 200 200 200 200 200 200 1,950 2,095
FIRE SERVICES
PP1045 Replace Portable Radios 720 720 720
135 50 160 105 345 175 255 135 195 1,420 1,555
PP1123-15 Replace Firefighter Equipment 703 625 1,890 345 50 200 250 675 345 350 725 5,455 6,158
2,270 1,035 1,095 860 100 734 2,600 8,694 8,694
PP1176-15 Fire Stations - Major Upgrades 390 640 500 690 700 740 750 740 750 740 750 7,000 7,390
1,228 3,535 3,475 1,195 1,950 1,285 1,860 1,690 2,070 1,959 4,270 23,289 24,517
POLICE SERVICES
PP4326 Conducted Energy Weapons 339 339 339
PP4405 Portable Radio User Gear 1,112 2,391 3,503 3,503
PP4314-15 Replacement Vehicles - Police 540 955 1,587 1,492 1,463 1,661 1,339 1,519 1,428 1,578 1,407 14,429 14,969
PP4444-15 Headquarters Building Repairs 475 500 525 550 575 600 625 650 675 700 725 6,125 6,600
PP4325 911 Communications Upgrades 612 612
1,627 1,794 3,224 2,042 2,038 2,261 1,964 2,169 2,103 4,669 2,132 24,396 26,023
3,000 5,479 6,899 3,437 4,188 3,746 4,024 4,059 4,373 6,828 6,602 49,635 52,635
LIFECYCLE RENEWAL CAPITAL EXPENDITURES
($000's)
TOTAL PROTECTIVE SERVICES
TOTAL FIRE SERVICES
PP1042-15 Non-Emergency Fire Vehicle Replacement
TOTAL EMERGENCY & SECURITY
MANAGEMENT
TOTAL POLICE SERVICES
PP1152-15 Emergency Fire Vehicle Replacement

Page 242
SOCIAL & HEALTH SERVICES
HOUSING
Total Total
Project 2014 2015 2016 2017 2018 2019 2020 2021 2022 2023 2024 2015-2024 Project Cost
PD2618-15 Public Housing Major Upgrades 2,208 2,208 2,208 2,208 2,208 2,208 2,208 2,208 2,208 2,208 2,208 22,080 24,288
2,208 2,208 2,208 2,208 2,208 2,208 2,208 2,208 2,208 2,208 2,208 22,080 24,288
LONG TERM CARE
GG1620-15 Dearness Major Upgrade 389 400 400 400 500 450 450 450 450 450 450 4,400 4,789
389 400 400 400 500 450 450 450 450 450 450 4,400 4,789
2,597 2,608 2,608 2,608 2,708 2,658 2,658 2,658 2,658 2,658 2,658 26,480 29,077
TRANSPORTATION SERVICES
PARKING
TS4208 Parking Lots Rehabilitation 100 0 100
100 0 0 0 0 0 0 0 0 0 0 0 100
PUBLIC TRANSIT
MU1200 Fleet Radio Replacement 125 125 125
MU1044-15 Bus Purchase Replacement 6,010 6,035 7,280 6,993 7,182 7,182 7,661 8,140 8,429 8,716 8,716 76,334 82,344
700 300 300 300 300 500 500 500 500 500 500 4,200 4,900
6,710 6,335 7,580 7,418 7,482 7,682 8,161 8,640 8,929 9,216 9,216 80,659 87,369
LIFECYCLE RENEWAL CAPITAL EXPENDITURES
($000's)
MU1136-15 LTC Existing Facility Mtce and Upgrades
TOTAL PUBLIC TRANSIT
TOTAL HOUSING
TOTAL LONG TERM CARE
TOTAL SOCIAL & HEALTH SERVICES
TOTAL PARKING

Page 243
TRANSPORTATION SERVICES
ROADWAYS
Total Total
Project 2014 2015 2016 2017 2018 2019 2020 2021 2022 2023 2024 2015-2024 Project Cost
50 50 50 50 50 50 50 50 50 50 50 500 550
100 150 150 100 100 100 100 100 100 100 100 1,100 1,200
TS1165-15 Warranted Sidewalks 230 230 230 230 230 230 230 230 230 230 230 2,300 2,530
(33) 535 535 535 535 535 535 535 535 535 535 5,350 5,317
TS1446-15 Road Rehabilitation (Main) 9,906 12,180 17,000 13,854 13,854 13,854 13,854 13,854 13,854 13,854 13,854 140,012 149,918
TS1763-15 Bridges Major Upgrades 1,800 2,800 3,600 3,600 3,600 3,600 3,600 3,600 3,600 3,600 3,600 35,200 37,000
4,000 5,800 6,000 6,000 6,000 6,000 6,000 6,000 6,000 6,000 6,000 59,800 63,800
TS3037-15 Replace & Repair Sidewalks 1,200 1,200 1,200 1,200 1,200 1,200 1,200 1,200 1,200 1,200 1,200 12,000 13,200
700 700 700 700 700 700 700 700 700 700 700 7,000 7,700
TS4058-15 Traffic Calming Program 150 125 125 125 125 125 125 125 125 125 125 1,250 1,400
TS4067-15 Traffic Signals Maintenance 2,108 3,141 3,562 3,266 3,546 3,531 3,531 3,531 3,541 3,501 3,650 34,800 36,908
TS5123-15 Street Light Maintenance 1,000 1,650 2,050 2,025 2,230 2,440 2,540 2,640 2,740 2,780 2,980 24,075 25,075
TS6181-15 Salt and Sand Dome LCR 50 50 50 50 50 300 50 250 50 50 950 950
TS1214 - Gore Road Bridge 3,972 3,972
25,183 28,611 35,252 31,735 32,220 32,415 32,765 32,615 32,925 32,725 33,074 324,337 349,520
31,993 34,946 42,832 39,153 39,702 40,097 40,926 41,255 41,854 41,941 42,290 404,996 436,989
Note: * represents projects that are classified as non-tangible capital assets. These expenditures will not result in the creation of a tangible asset (having physical substance).
LIFECYCLE RENEWAL CAPITAL EXPENDITURES
($000's)
* TS4040 Miscellaneous Traffic Studies
TS3228 Downtown Streetscape
TOTAL ROADWAYS
TOTAL TRANSPORTATION
SERVICES
TS3310-15 Road Surface Treatment
TS1254-15 Local Roadworks
TS3014-15 Road Rehab Local & Rural

Page 244
CORPORATE, OPERATIONAL & COUNCIL SERVICES
CORPORATE SERVICES
Total Total
Project 2014 2015 2016 2017 2018 2019 2020 2021 2022 2023 2024 2015-2024 Project Cost
GGMOD Network Modernization 305 50 50 130 50 50 50 2,670 1,300 50 4,705 4,705
GG1050 Corporate Systems Update 650 350 450 450 1,450 450 450 450 1,450 5,500 6,150
GG1055 One Voice Communications 100 100 100 100 100 100 100 100 500 500 500 2,200 2,300
60 60 60 60 60 60 300 360
470 775 425 490 1,737 417 317 542 1,737 417 317 7,174 7,644
GGSTOR Primary Storage Replacement 1,600 2,500 1,600 5,700 5,700
ME1206 Fuel System Management 50 50 50 50 50 50 50 50 50 50 50 500 550
75 20 75 170 170
250 150 150 550 550
GG1545-15 Municipal Buildings 510 530 510 530 310 330 310 330 310 330 4,000 4,000
GG1555-15 City Hall Major Upgrades 1,661 1,000 1,000 1,000 1,000 1,000 1,000 1,000 1,000 1,000 1,000 10,000 11,661
GGENDUSER End User 100 100 100 100 100 100 100 100 100 100 1,000 1,000
5,409 3,735 4,628 4,193 3,400 4,584 4,280 3,951 5,618 4,895 6,259 45,543 50,952
630 710 490 550 740 740 760 740 760 710 710 6,910 7,540
GGINFRA Infrastructure - ITS 727 727
9,757 7,285 7,683 7,393 8,522 9,401 11,017 7,293 13,425 9,807 12,426 94,252 104,009
9,757 7,285 7,683 7,393 8,522 9,401 11,017 7,293 13,425 9,807 12,426 94,252 104,009
Note: * represents projects that are classified as non-tangible capital assets. These expenditures will not result in the creation of a tangible asset (having physical substance).
TOTAL CORPORATE, OPERATIONAL & COUNCIL
SERVICES
GG1320 Courts Administration Building Upgrades
TOTAL CORPORATE SERVICES
TS6200-15 Operation Facilities
GGITSEC Security Event and Incident Management Replacement
LIFECYCLE RENEWAL CAPITAL EXPENDITURES
($000's)
GGAPPL Application, Data, Information & Process - ITS
* ME1407 Fleet and Equipment Maintenance
ME2015 Vehicle & Equipment Replacement

Page 245

Page 246
($000's)
Prior 2014 2015 2016 2017 2018 2019 2020 2021 2022 2023 2024 Total 10 Yr Avg
Cultural Services 1,500 3,330 3,330 8,160 666
Economic Prosperity 13,745 1,255 5,000 5,000 25,000 1,126
Parks, Recreation &
Neighbourhood
Services 42,840 19,423 13,691 14,133 12,329 19,430 5,340 2,990 4,635 2,860 3,235 3,010 143,916 8,165
Planning &
Development Services 2,288 324 150 50 50 50 50 50 50 50 50 50 3,212 60
Protective Services 500 1,065 2,063 1,805 5,433 543
Transportation Services 21,771 28,282 35,930 84,707 94,646 150,087 103,886 46,299 51,893 38,841 67,008 68,315 791,665 74,161
Total Growth
Budget 82,144 48,029 51,026 104,390 113,090 174,960 112,606 51,144 56,578 41,751 70,293 71,375 977,386 84,721
SUMMARY OF GROWTH PROJECTS
EXPENDITURE BY SERVICE PROGRAM

Page 247
Cultural Services Growth Summary
Library Services
Prior 2014 2015 2016 2017 2018 2019 2020 2021 2022 2023 2024 Total
RC3464 Northwest Branch Library 750 3,330 4,080
RC3466 Southeast Branch Library 750 3,330 4,080
Total Library Services 1,500 3,330 3,330 8,160
Total Cultural Services 1,500 3,330 3,330 8,160
Economic Prosperity
Economic Development
TS1308 Hwy 401 Interchange Projects 13,745 1,255 5,000 5,000 25,000
Total Economic Development 13,745 1,255 5,000 5,000 25,000
Total Economic Prosperity 13,745 1,255 5,000 5,000 25,000
2015 CAPITAL BUDGET WITH FORECASTS
($000'S)

Page 248
Parks, Recreation & Neighbourhood Services Growth Summary
NEIGHBOURHOOD & RECREATION SERVICES
Prior 2014 2015 2016 2017 2018 2019 2020 2021 2022 2023 2024 Total
300 50 50 150 150 50 750
10,416 6,376 16,792
2,000 2,310 6,904 14,775 25,989
400 350 350 350 350 450 2,250
Riverbend Park 350
Constitution Park 350
Foxfield Park 350
TDB 350 450
22,008 18,381 40,389
18,532 (928) 17,604
42,840 17,853 10,816 8,686 7,304 14,775 150 500 350 500 103,774
PARKS & URBAN FORESTRY
300 487 900 750 500 500 600 500 4,537
Southwest 900
Clarke/Foxfield 37
OVH 450
Beaverbrook 750
Meadowgate 500
Future Parks to be developed 500 600 500
** Represents projects that are classified as non-tangible capital assets. These expenditures will not result in the creation of a tangible asset (having physical substance).
RC2762 Multi-purpose Rec Centre North
(Budget trsd to PP2047 Purchase of 1060 &
1066 Byron Baseline)
RC2755 Multi-purpose Rec Centre
Southwest
RC2772 New Spray Pad Initiative
2015 CAPITAL BUDGET WITH FORECASTS
($000'S)
**RC2011 Update Master Plan P&R
RC2756 East Multi-purpose Rec Centre
Aquatics Anchored
TOTAL NEIGHBOURHOOD &
RECREATION SERVICES
RC2758 South East Multi-purpose Rec
Centre Arena Anchored
PD1033-15 New District Parks

Page 249
Parks, Recreation & Neighbourhood Services Growth Summary
PARKS & URBAN FORESTRY continued
Prior 2014 2015 2016 2017 2018 2019 2020 2021 2022 2023 2024 Total
70 260 220 300 300 250 300 320 320 320 320 2,980
Edge Valley 50
Z group/Uplands 100
Drewlo - Ross Lands 30
Marsman - Stoney Creek 70
Auburn - Kent 150
Jackson East 300
Applewood/Sergautis 70
Drewlo - Ross Lands North 100
Stanton West 50
Hunt Lands/Auburn 150
Meadowlily West 150
LPH - Dundas 150
Old Victoria/Sifton 110
Future Parks to be developed 150 320 320 320 320
350 700 1,730 800 575 700 350 750 350 350 350 7,005
West Byron/Warbler 225
Dingman Creek Trail 50 350
Foxhollow 330
Uplands Trail System 100 1,300 550
Hyde Park 170
Stoney Creek Trail (Phase II) 330
Riverbend 700
South River 200
Community Links 100 100 100 100 100 100 100 100 100 100
Future O.S. Projects 250 250 100 250 250 250
2015 CAPITAL BUDGET WITH FORECASTS
($000'S)
PD1382-15 New Neighbourhood Parks
PD2043-15 New Major Open Space Network

Page 250
Parks, Recreation & Neighbourhood Services Growth Summary
PARKS & URBAN FORESTRY continued
Prior 2014 2015 2016 2017 2018 2019 2020 2021 2022 2023 2024 Total
800 1,175 750 1,100 1,380 850 400 700 400 400 400 8,355
North Branch (Highbury to Clarke) 100 850
Main Branch (Through Byron) 300 750 750
Main Branch (To River Bend) 150 600
South Branch (Old Victoria) 150
South Branch (OVH) 475
South Branch (Hydro Lands) 350
South Branch (Drewlo/Deveron) 300
Main Branch (Norquay/Riverbend) 780
Future Pathway Expansion TBD 400 400 400 400 400
150 600 800 1,000 1,475 500 1,300 500 500 500 7,325
Southwest Sportsfields 200 1,000
Kilally Multi-purpose Fields 500 1,300 1,300
Riverbend Ball Diamond 150
Meadowlily Area 175
All Weather Fields 100 600
Other Sportsfield Development 500 500 500 500
150 600 300 600 300 500 500 500 3,450
Riverbend Park Field House 150
Kilally Sports Fields 600
Constitution Park 300
Southwest London 600
Foxfield Park 300
Future Field House (North) 500
Future Field House (South) 500
Future Field House (West) 500
PD2124-15 New Thames Valley Parkway
PD2230-15 New Field Houses
PD2181-15 New Sportspark
($000'S)
2015 CAPITAL BUDGET WITH FORECASTS

Page 251
Parks, Recreation & Neighbourhood Services Growth Summary
PARKS & URBAN FORESTRY continued
Prior 2014 2015 2016 2017 2018 2019 2020 2021 2022 2023 2024 Total
50 30 110 150 100 125 125 125 815
Stoney Creek ESA 25
Meadowlily East 20
CPRI 60
Felner Subdivision - Medway 30
Applewood 50
Warbler Woods 80
Kains ESA West 125
New ESA's Identified in Area Plans 125 125 125
60 100 100 100 400 100 100 100 100 100 1,260
Kenmore Subdivision 100
Applewood 100
Jackson Road 100
Summerside 400
Riverbend South 50
Future Woodlands TBD 60 50 100 100 100 100
350 850 575 600 340 340 340 340 340 340 4,415
Victoria Ridge 200
Southside - Talbot 2 150
OVH 850
Applewood Square 575
Hydro Lands 600
Future Urban Parks 340 340 340 340 340 340
1,570 2,875 5,447 5,025 4,655 5,190 2,490 4,635 2,510 2,735 3,010 40,142
42,840 19,423 13,691 14,133 12,329 19,430 5,340 2,990 4,635 2,860 3,235 3,010 143,916
TOTAL PARKS & URBAN
FORESTRY
TOTAL PARKS, RECREATION &
NEIGHBOURHOOD SERVICES
PD3019-15 New Urban Parks
PD2253-15 New Environmentally Significant
Areas
PD2765-15 New Woodland Parks
2015 CAPITAL BUDGET WITH FORECASTS
($000'S)
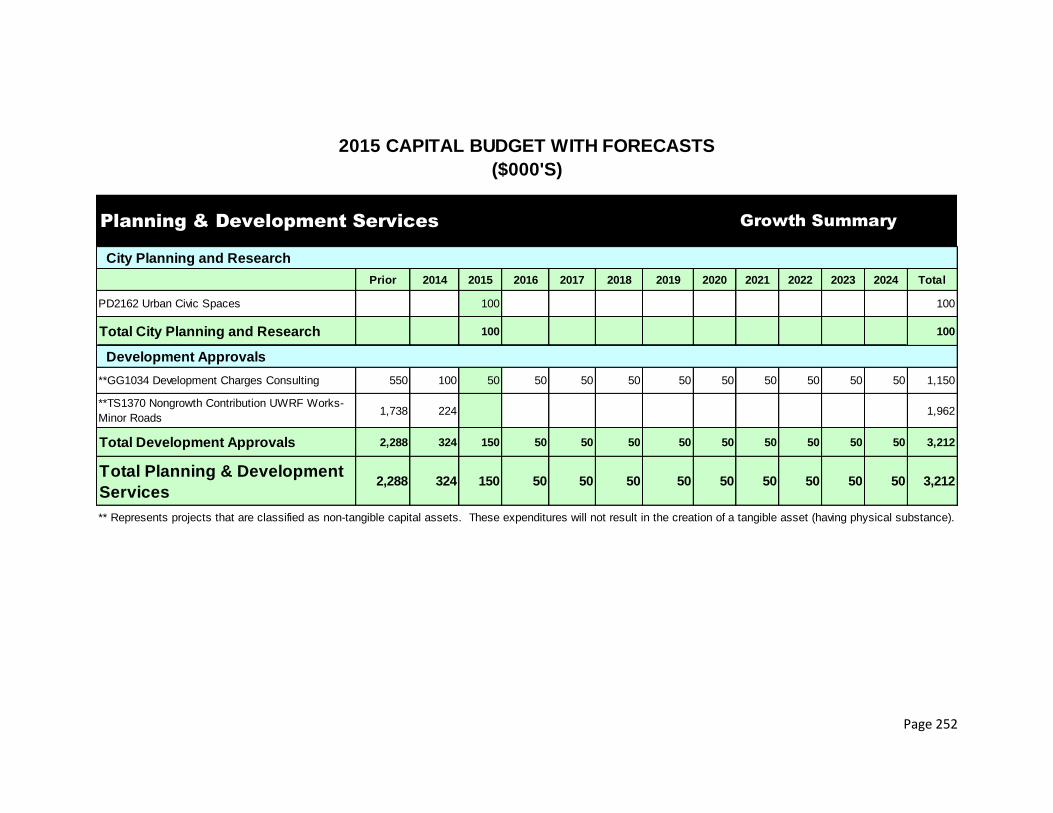
Page 252
Planning & Development Services Growth Summary
City Planning and Research
Prior 2014 2015 2016 2017 2018 2019 2020 2021 2022 2023 2024 Total
PD2162 Urban Civic Spaces 100 100
Total City Planning and Research 100 100
Development Approvals
**GG1034 Development Charges Consulting 550 100 50 50 50 50 50 50 50 50 50 50 1,150
**TS1370 Nongrowth Contribution UWRF Works-
Minor Roads1,738 224 1,962
Total Development Approvals 2,288 324 150 50 50 50 50 50 50 50 50 50 3,212
Total Planning & Development
Services2,288 324 150 50 50 50 50 50 50 50 50 50 3,212
** Represents projects that are classified as non-tangible capital assets. These expenditures will not result in the creation of a tangible asset (having physical substance).
2015 CAPITAL BUDGET WITH FORECASTS
($000'S)

Page 253
Protective Services Growth Summary
Fire Services
Prior 2014 2015 2016 2017 2018 2019 2020 2021 2022 2023 2024 Total
PP1043 Add Aerial Company 1,805 1,805
PP1087 New Fire Station No 15 - South East
London500 1,065 1,563 3,128
Total Fire Services 500 1,065 1,563 1,805 4,933
Police Services
PP4480 Police Facility Needs Analysis 500 500
Total Police Services 500 500
Total Protective Services 500 1,065 2,063 1,805 5,433
2015 CAPITAL BUDGET WITH FORECASTS
($000'S)

Page 254
Transportation Services Growth Summary
Public Transit
Prior 2014 2015 2016 2017 2018 2019 2020 2021 2022 2023 2024 Total
MU1185 Rapid Transit: Expansion Buses 12,242 13,545 25,787
MU1430 Rapid Transit: Facility Expansion 12,500 12,500
Total Public Transit 12,242 13,545 12,500 38,287
Roadways
**TS1031 Long Term Corridor Protection EA
Studies300 200 200 100 800
**TS1032 Complete Streets Guideline 100 100
**TS1037 Transportation Network Model Update 150 150
**TS1038 Transportation Development Charge
Studies250 250 500
**TS1039 Transportation Master Plan Update 100 100
**TS1040 Transportation Master Plan Update
2022750 750
**TS1041 Transportation Impact Studies 100 100 100 100 100 100 100 100 100 100 1,000
**TS1042 Transportation Monitoring Program 30 110 120 40 10 30 10 350
TS1134 Richmond St & Fanshawe Park Rd
Intersection Improvements (2015-Consulting)850 600 100 6,400 7,950
TS1306 Adelaide Street Grade Separation CPR
Tracks (2015-EA)400 400
TS1309 Hamilton Rd & Highbury Ave
Intersection Improvements (2015-Detailed
Design)
350 190 250 1,525 2,315
** Represents projects that are classified as non-tangible capital assets. These expenditures will not result in the creation of a tangible asset (having physical substance).
2015 CAPITAL BUDGET WITH FORECASTS
($000'S)

Page 255
Transportation Services Growth Summary
Roadways Continued
Prior 2014 2015 2016 2017 2018 2019 2020 2021 2022 2023 2024 Total
TS1327 Huron Street Widening Highbury Ave to
Clarke Road325 800 759 1,884
TS1329 Colonel Talbot Rd - 300M South of
Southdale to Kilbourne332 442 774
TS1345 Byron Baseline Rd Upgrades - Westdel
Bourne to Wickerson68 146 90 82 386
TS1352 Commissioners Rd E Widening -
Highbury Ave to Jackson Road258 258
TS1357 Bostwick Road Upgrades - Pack to
Southdale200 160 2,528 2,888
TS1358 Pack Rd Upgrades - Colonel Talbot Rd
to Bostwick Rd225 391 460 6,624 7,700
** TS1371 Road Class Oversizing City Share 100 100 100 100 100 100 100 100 100 100 100 1,100
TS1405 Hamilton Road Upgrades-Gore to Old
Victoria976 1,185 14,132 16,293
TS1406 Sunningdale Rd Upgrade - South
Wenige to Highbury (2015-Consulting)231 206 3,083 3,520
TS1408 Wickerson - Ironwood to Southdale
Upgrades (2015-Consulting)206 138 2,235 2,579
TS1409 Kilally Upgrades at Webster Phase 1
(2015-Consulting & Utility Relocation)336 2,359 2,695
TS1410 Huron Street Upgrades VMP Easterly
to Railway100 46 1,587 1,733
** Represents projects that are classified as non-tangible capital assets. These expenditures will not result in the creation of a tangible asset (having physical substance).
2015 CAPITAL BUDGET WITH FORECASTS
($000'S)

Page 256
Transportation Services Growth Summary
Roadways Continued
Prior 2014 2015 2016 2017 2018 2019 2020 2021 2022 2023 2024 Total
TS1412 Pond Mills Underpass 1,500 1,500
TS1470 Commissioners Rd Widening from
Wonderland Road to Viscount Road (2015-
Construction)
2,847 500 10,455 13,802
TS1476 Clarke Rd Widening VMP Extension to
Fanshawe Park Rd593 989 426 22,703 24,711
TS1478 Huron Street Widening-Adelaide to
Vesta309 5,068 476 5,853
TS1484 Sarnia Road Widening - Wonderland
Road to Sleightholme (2015-Utility Relocation)642 700 500 6,520 8,362
TS1487 Wonderland Rd Two Lane Upgrade Hwy
401 to Hwy 402 (2015-Consulting)582 756 9,057 10,395
TS1489 Western Road Widening - Platts Lane
to Oxford (2015-Detailed design)450 700 2,860 1,512 18,297 23,819
TS1490 Wilton Grove Upgrades-Commerce
Road to City Limits506 663 11,382 12,551
TS1626 Southdale Road Upgrades-Wickerson
to Westdel Bourne (2015-Consulting)119 82 1,339 1,540
TS1627 Western Road & Sarnia Road
Intersection Improvements (2015-EA)250 2,240 2,490
TS1633 Advanced Land Acquisition-VMP 840 800 600 1,960 4,200
TS1651 Minor Roadworks on Arterials 192 845 845 845 845 845 845 845 845 845 845 8,642
TS4165 Traffic Signals & Street Light Growth
Urban Intersections1,454 380 404 404 404 404 404 404 404 404 404 404 5,874
2015 CAPITAL BUDGET WITH FORECASTS
($000'S)

Page 257
Transportation Services Growth Summary
Roadways Continued
Prior 2014 2015 2016 2017 2018 2019 2020 2021 2022 2023 2024 Total
TS1035-1 Wonderland Road Widening-Phase 1
Exeter Road to Hwy 401751 536 520 11,594 13,401
TS1035-2 Wonderland Road Widening-Phase 2
Hwy 402 to Hwy 401759 759
TS1302-1 Commissioners Rd - Wonderland
Road to Springbank Drive Phase 1 (2015-EA)300 300
TS1348-1 Wonderland Road Widening-Phase 1
Riverside Dr to Springbank Dr1,009 475 210 19,018 20,712
TS1348-2 Wonderland Road Widening-Phase 2
Springbank Dr to Commissioners304 129 3,910 4,343
TS1348-3 Wonderland Road Widening-Phase 3
Riverside to Oxford810 612 1,328 140 16,725 19,615
TS1348-4 Wonderland Road Widening-Phase 4
Oxford to Sarnia312 730 439 124 1,605
TS1349-2 Sarnia Road Improvements Hyde
Park to Wonderland Rd (2015-Detailed design &
land acquisition)
2,850 557 368 4,135 7,910
TS1349-3 Sarnia Road Widening - Hyde Park to
Oakcrossing Gate158 158
TS1350-1 Boler-Sanatorium Rd Widening Phase
1 Oxford to Riverside330 330
TS1353-2 Adelaide St Widening Phase 2 -
Grenfell Dr to Sunningdale Rd232 333 364 4,726 5,655
TS1355-1 Wharncliffe Rd Widening - Becher St
to Springbank Drive400 1,759 102 14,166 16,427
TS1355-2 Wharncliffe Rd Improvements 350 189 181 5,844 6,564
2015 CAPITAL BUDGET WITH FORECASTS
($000'S)
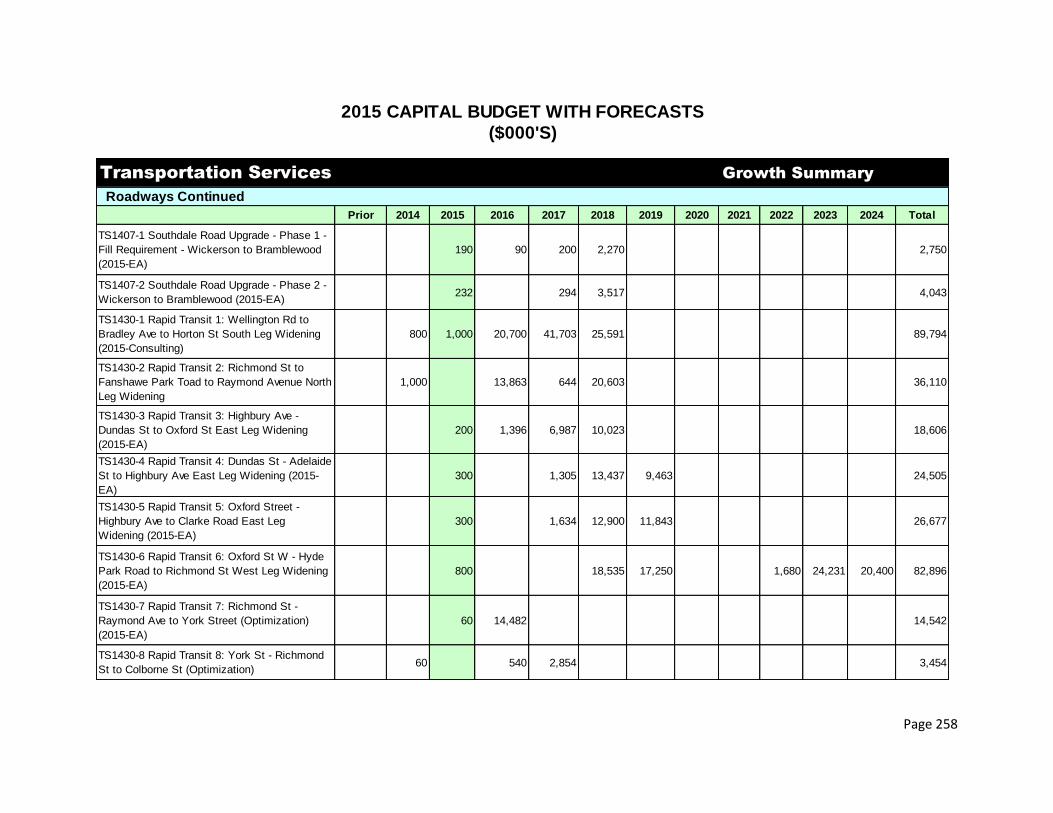
Page 258
Transportation Services Growth Summary
Roadways Continued
Prior 2014 2015 2016 2017 2018 2019 2020 2021 2022 2023 2024 Total
TS1407-1 Southdale Road Upgrade - Phase 1 -
Fill Requirement - Wickerson to Bramblewood
(2015-EA)
190 90 200 2,270 2,750
TS1407-2 Southdale Road Upgrade - Phase 2 -
Wickerson to Bramblewood (2015-EA)232 294 3,517 4,043
TS1430-1 Rapid Transit 1: Wellington Rd to
Bradley Ave to Horton St South Leg Widening
(2015-Consulting)
800 1,000 20,700 41,703 25,591 89,794
TS1430-2 Rapid Transit 2: Richmond St to
Fanshawe Park Toad to Raymond Avenue North
Leg Widening
1,000 13,863 644 20,603 36,110
TS1430-3 Rapid Transit 3: Highbury Ave -
Dundas St to Oxford St East Leg Widening
(2015-EA)
200 1,396 6,987 10,023 18,606
TS1430-4 Rapid Transit 4: Dundas St - Adelaide
St to Highbury Ave East Leg Widening (2015-
EA)
300 1,305 13,437 9,463 24,505
TS1430-5 Rapid Transit 5: Oxford Street -
Highbury Ave to Clarke Road East Leg
Widening (2015-EA)
300 1,634 12,900 11,843 26,677
TS1430-6 Rapid Transit 6: Oxford St W - Hyde
Park Road to Richmond St West Leg Widening
(2015-EA)
800 18,535 17,250 1,680 24,231 20,400 82,896
TS1430-7 Rapid Transit 7: Richmond St -
Raymond Ave to York Street (Optimization)
(2015-EA)
60 14,482 14,542
TS1430-8 Rapid Transit 8: York St - Richmond
St to Colborne St (Optimization)60 540 2,854 3,454
($000'S)
2015 CAPITAL BUDGET WITH FORECASTS
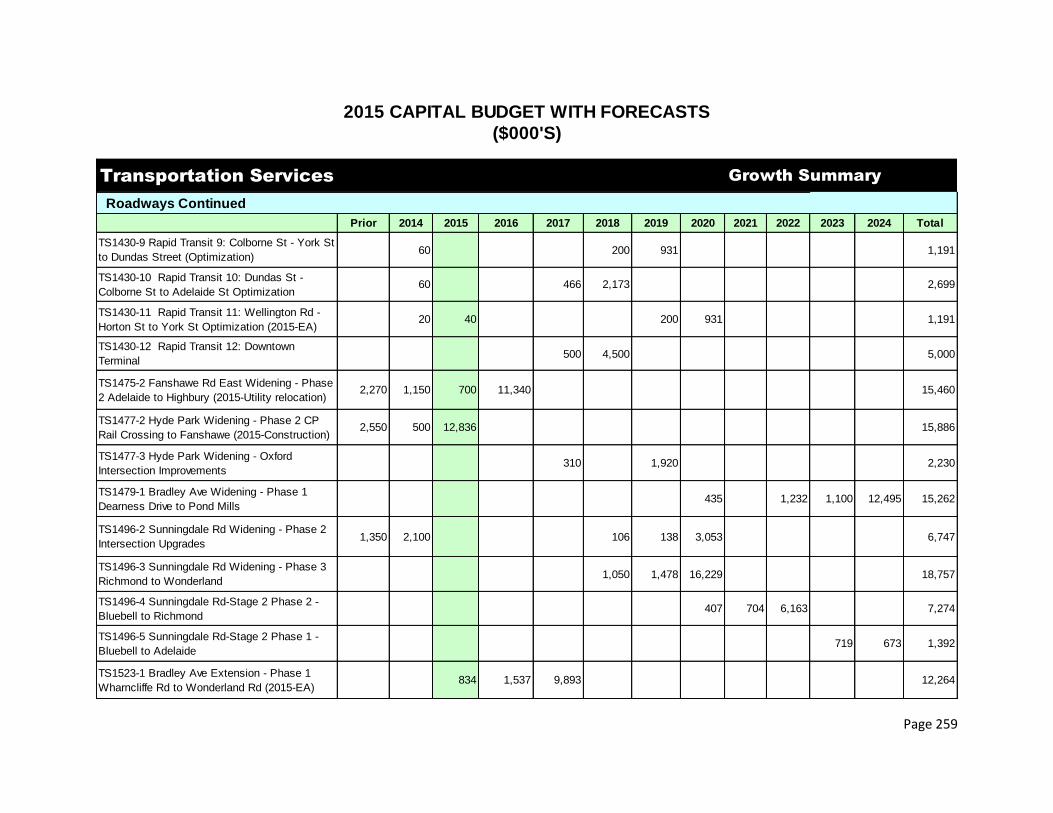
Page 259
Transportation Services Growth Summary
Roadways Continued
Prior 2014 2015 2016 2017 2018 2019 2020 2021 2022 2023 2024 Total
TS1430-9 Rapid Transit 9: Colborne St - York St
to Dundas Street (Optimization)60 200 931 1,191
TS1430-10 Rapid Transit 10: Dundas St -
Colborne St to Adelaide St Optimization60 466 2,173 2,699
TS1430-11 Rapid Transit 11: Wellington Rd -
Horton St to York St Optimization (2015-EA)20 40 200 931 1,191
TS1430-12 Rapid Transit 12: Downtown
Terminal500 4,500 5,000
TS1475-2 Fanshawe Rd East Widening - Phase
2 Adelaide to Highbury (2015-Utility relocation)2,270 1,150 700 11,340 15,460
TS1477-2 Hyde Park Widening - Phase 2 CP
Rail Crossing to Fanshawe (2015-Construction)2,550 500 12,836 15,886
TS1477-3 Hyde Park Widening - Oxford
Intersection Improvements310 1,920 2,230
TS1479-1 Bradley Ave Widening - Phase 1
Dearness Drive to Pond Mills 435 1,232 1,100 12,495 15,262
TS1496-2 Sunningdale Rd Widening - Phase 2
Intersection Upgrades 1,350 2,100 106 138 3,053 6,747
TS1496-3 Sunningdale Rd Widening - Phase 3
Richmond to Wonderland1,050 1,478 16,229 18,757
TS1496-4 Sunningdale Rd-Stage 2 Phase 2 -
Bluebell to Richmond407 704 6,163 7,274
TS1496-5 Sunningdale Rd-Stage 2 Phase 1 -
Bluebell to Adelaide719 673 1,392
TS1523-1 Bradley Ave Extension - Phase 1
Wharncliffe Rd to Wonderland Rd (2015-EA)834 1,537 9,893 12,264
2015 CAPITAL BUDGET WITH FORECASTS
($000'S)

Page 260
Transportation Services Growth Summary
Roadways Continued
Prior 2014 2015 2016 2017 2018 2019 2020 2021 2022 2023 2024 Total
TS1523-2 Bradley Ave Extension - Phase 2
Jalna to Wharncliffe797 500 876 1,344 7,239 10,756
TS1621-1 Veterans Memorial Parkway - Phase
1 Extension 2 through lanes between Huron St
and Clarke Rd
500 449 3,368 1,600 6,206 12,123
TS1629-1 Southdale Road West Widening
Farnham to Pine Valley237 221 2,692 3,150
TS1629-2 Southdale Road West Widening from
Colonel Talbot to Farnham415 1,116 1,531
TS2171-2 Old Victoria from Hamilton to Bradley 336 364 4,305 5,005
TS1264-15 2015 Rural Intersection 100 100 100 100 100 100 100 100 100 100 1,000
TS1739-15 2015 Cycling Facilities Program
(Bike Lanes)783 783 783 783 783 783 783 783 783 783 7,830
** TS1033 London Cycling Master Plan 210 210
TS1477-1 Hyde Park Widening - Phase 1
Oxford to CP Rail Crossing 3,750 17,800 21,550
TS1481-1 Wellington Rd Widening - Phase 1
Commissioners to Southdale2,400 400 2,800
TS1481-3 Wellington Rd Widening - Phase 3
Bradley to Exeter550 550
** TS7082-14 Works Undertaken by Developers
on behalf of the City100 100
Total Roadways 21,771 28,282 35,930 84,707 94,646 150,087 91,644 46,299 38,348 38,841 67,008 55,815 753,378
Total Transportation Services 21,771 28,282 35,930 84,707 94,646 150,087 103,886 46,299 51,893 38,841 67,008 68,315 791,665
** Represents projects that are classified as non-tangible capital assets. These expenditures will not result in the creation of a tangible asset (having physical substance).
2015 CAPITAL BUDGET WITH FORECASTS
($000'S)

Page 261

Page 262
($000's)
Prior 2014 2015 2016 2017 2018 2019 2020 2021 2022 2023 2024 Total 10 Yr Avg
Economic Prosperity 66,918 14,306 8,487 12,106 8,106 11,106 11,675 8,278 9,078 6,278 6,178 5,378 167,894 8,667
Environmental Services 500 34,500 1,000 15,000 3,000 54,000 5,400
Parks, Recreation and
Neighbourhood Services 1,211 629 480 500 575 3,050 525 2,400 400 400 400 400 10,970 913
Planning & Development
Services 175 100 275 10
Protective Services 723 1,677 1,000 700 1,485 1,250 250 2,000 12,000 12,000 33,085 3,069
Social & Health Services 2,241 6,172 8,413
Transportation Services 900 2,967 975 2,525 6,750 100 50 50 50 50 50 50 14,517 1,065
Corporate, Operational &
Council Services 850 10,169 863 863 500 500 500 500 500 500 500 500 16,745 573
Total Service
Improvement Budget 72,843 36,095 10,905 16,994 16,631 16,241 13,250 46,978 10,278 10,228 34,128 21,328 305,899 19,696
SUMMARY OF SERVICE IMPROVEMENT PROJECTS
EXPENDITURE BY SERVICE PROGRAM

Page 263
Economic Prosperity Service Improvement
Economic Development
Prior 2014 2015 2016 2017 2018 2019 2020 2021 2022 2023 2024 Total
ID1145 Future Industrial Land 30,481 800 800 800 32,881
ID1150 ILDS - Internal Servicing 4,600 8,600 4,600 7,600 7,200 7,200 7,200 4,400 4,300 4,300 60,000
ID1168 Innovation Park 24,600 850 25,450
ID1265 Skyway Industrial Park - Phase II 435 1,500 1,935
ID2169 ILDS - External Transportation Servicing 412 1,031 1,031 1,031 103 103 103 103 103 4,020
** GG1725 London Music Industry 150 150 300
** GG1721-6 New Economy - Fanshawe College 10,500 1,500 1,575 1,575 1,575 1,575 2,075 75 75 75 75 75 20,750
** GG1721-8 Medical Devices Initiative 800 800
** GG1721-9 Fanshawe College - Kingsmills 900 900 900 900 900 900 900 900 900 900 9,000
** GG1538 Employment Network Support Grant
Agreement102 106 208
** GG1722 London Medical Innovation 10,000 10,000
GG1730PHA Demolition of South Street Campus 2,400 2,400
** GG17RFP RFP Consultant Assignment 150 150
Total Economic Development 66,918 14,306 8,487 12,106 8,106 11,106 11,675 8,278 9,078 6,278 6,178 5,378 167,894
Total Economic Prosperity 66,918 14,306 8,487 12,106 8,106 11,106 11,675 8,278 9,078 6,278 6,178 5,378 167,894
** Represents projects that are classified as non-tangible capital assets. These expenditures will not result in the creation of a tangible asset (having physical substance).
2015 CAPITAL BUDGET WITH FORECASTS
($000'S)
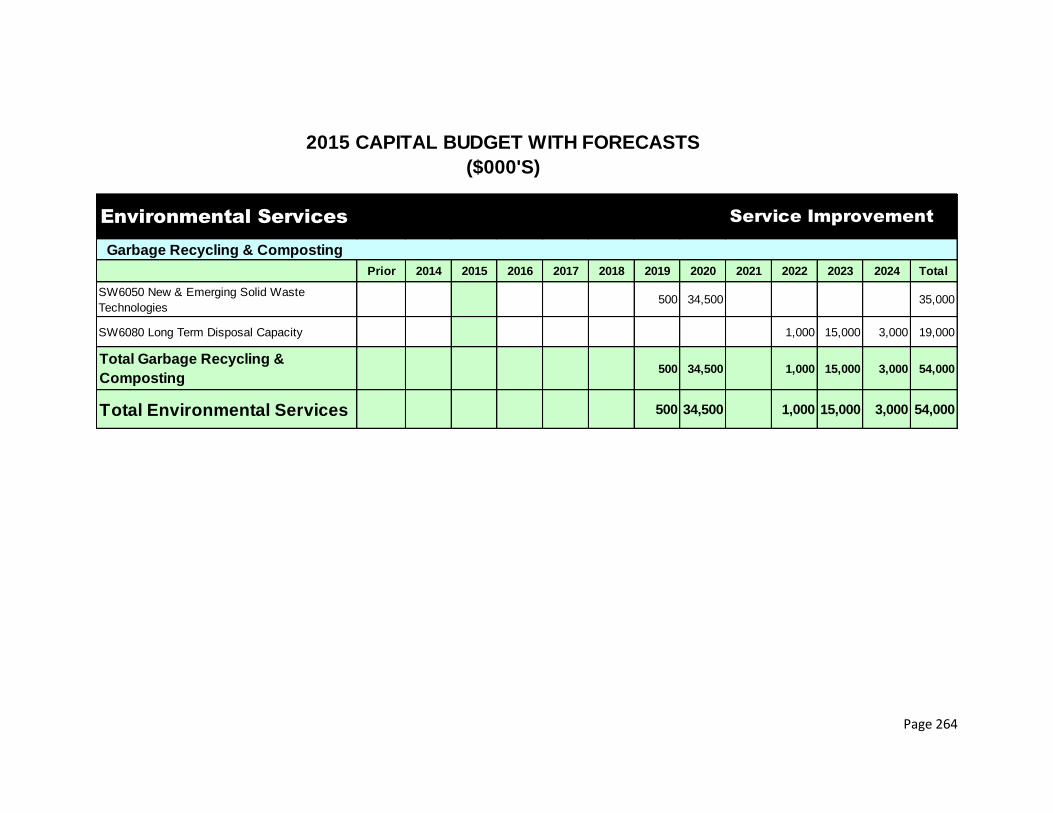
Page 264
Environmental Services Service Improvement
Garbage Recycling & Composting
Prior 2014 2015 2016 2017 2018 2019 2020 2021 2022 2023 2024 Total
SW6050 New & Emerging Solid Waste
Technologies500 34,500 35,000
SW6080 Long Term Disposal Capacity 1,000 15,000 3,000 19,000
Total Garbage Recycling &
Composting500 34,500 1,000 15,000 3,000 54,000
Total Environmental Services 500 34,500 1,000 15,000 3,000 54,000
2015 CAPITAL BUDGET WITH FORECASTS
($000'S)

Page 265
Parks, Recreation & Neighbourhood Services Service Improvement
Neighbourhood & Recreation Services
Prior 2014 2015 2016 2017 2018 2019 2020 2021 2022 2023 2024 Total
RC2602 Farquharson Arena Decommissioning and
Renovating to Community Space125 2,000 2,125
RC2608 Glen Cairn Arena Decommission &
Renovate to Community Space650 650
RC2612 Silverwoods Arena Decommission &
Renovate to Community Space125 2,000 2,125
Total Neighbourhood & Recreation
Services125 2,650 125 2,000 4,900
Parks & Urban Forestry
** PD1142 Enhanced Veterans Memorial Parkway 411 100 80 100 50 741
PP2044 Management of Emerald Ash Borer 800 400 400 400 400 400 400 400 400 400 400 400 5,200
RC2427 Turf Maintenance Equipment 129 129
Total Parks & Urban Forestry 1,211 629 480 500 450 400 400 400 400 400 400 400 6,070
Total Parks, Recreation &
Neighbourhood Services1,211 629 480 500 575 3,050 525 2,400 400 400 400 400 10,970
** Represents projects that are classified as non-tangible capital assets. These expenditures will not result in the creation of a tangible asset (having physical substance).
2015 CAPITAL BUDGET WITH FORECASTS
($000'S)

Page 266
Planning & Development Services Service Improvement
City Planning and Research
Prior 2014 2015 2016 2017 2018 2019 2020 2021 2022 2023 2024 Total
** PD1215 Downtown Waterfront 50 100 150
** PD1018 Smart City Strategy 125 125
Total City Planning and Research 175 100 275
Total Planning & Development
Services175 100 275
** Represents projects that are classified as non-tangible capital assets. These expenditures will not result in the creation of a tangible asset (having physical substance).
2015 CAPITAL BUDGET WITH FORECASTS
($000'S)

Page 267
Protective Services Service Improvement
Animal Services
Prior 2014 2015 2016 2017 2018 2019 2020 2021 2022 2023 2024 Total
GG1530 Cat Adoption Centre 23 377 400
GG1535 Veterinarian Services & Facility 300 300
Total Animal Services 23 677 700
Fire Services
Prior 2014 2015 2016 2017 2018 2019 2020 2021 2022 2023 2024 Total
PP1025 Interface & Mobile Data 1,000 1,000 2,000
PP1090 Relocate Existing Resources to New
Fire Station No 16700 1,485 2,185
PP1091 Replacement and Relocation of Fire
Training Tower located at 746 Wellington Rd.700 1,250 250 2,000 2,000 2,000 8,200
Total Fire Services 700 1,000 1,000 700 1,485 1,250 250 2,000 2,000 2,000 12,385
Police Services
Prior 2014 2015 2016 2017 2018 2019 2020 2021 2022 2023 2024 Total
PP4462 LPS Facility Expansion 10,000 10,000 20,000
Total Fire Services 10,000 10,000 20,000
Total Protective Services 723 1,677 1,000 700 1,485 1,250 250 2,000 12,000 12,000 33,085
2015 CAPITAL BUDGET WITH FORECASTS
($000'S)

Page 268
Social & Health Services Service Improvement
Social and Community Support Services
Prior 2014 2015 2016 2017 2018 2019 2020 2021 2022 2023 2024 Total
RC2072 Facility Maintenance & Planning (budget
tsfd to RC275-OW Decentralization South London)1,471 (45) 1,426
RC2750 OW Decentralization - Northeast London
Leasehold Improvements363 72 435
RC2751 OW Decentralization - South London
Community Centre407 6,145 6,552
Total Social and Community Support
Services2,241 6,172 6,552
Total Social & Health Services 2,241 6,172 6,552
2015 CAPITAL BUDGET WITH FORECASTS
($000'S)

Page 269
Transportation Services Service Improvement
Parking
Prior 2014 2015 2016 2017 2018 2019 2020 2021 2022 2023 2024 Total
TS4207 Downtown On-Street Pay & Display 600 125 300 100 1,125
Total Parking 600 125 300 100 1,125
Public Transit
MU1180-15 Bus Expansion - Existing Service
Area1,439 1,439
Total Public Transit 1,439 1,439
Roadways
TS1136 Western Rd & Philip Aziz Ave
Improvements-Huron College to Sarnia Rd250 575 2,325 6,650 9,800
TS5012 Audible Pedestrian Signals 300 100 100 100 100 100 50 50 50 50 50 50 1,100
TS1036 VMP Noise Wall 533 533
TS1135 Dundas Flexible Street 1,300 1,300
PD2134 Maintain Thames Valley Pathway
(Budget tsfd to TS1135 Dundas Flexible Street)(1,000) (1,000)
PD2063 Maintain Major Open Space (Budget
tsfd to TS1135 Dundas Flexible Street)(300) (300)
TS1137 Clarke Road Realignment 250 250
TS2705 Roadway Maintenance Additional
Vehicle70 70
TS1739-14 Bike Lane Program 200 200
Total Roadways 300 1,403 675 2,425 6,750 100 50 50 50 50 50 50 11,953
Total Transportation Services 900 2,967 975 2,525 6,750 100 50 50 50 50 50 50 14,517
2015 CAPITAL BUDGET WITH FORECASTS
($000'S)

Page 270
Corporate, Operational & Council Services Service Improvement
Corporate Services
Prior 2014 2015 2016 2017 2018 2019 2020 2021 2022 2023 2024 Total
** TS1346 Corporate Asset Management 850 338 338 338 1,864
TS1350 Corporate Asset Management Software 310 25 25 360
TS6217-15 Facility Energy Management 250 500 500 500 500 500 500 500 500 500 500 5,250
GG1558 Purchase and Renovate Normal School 2,922 2,922
PP2045 Sherwood Forest School Purchase 1,309 1,309
PP2046 Lorne Ave School Purchase 600 600
P2047 Purchase of 1060 & 1066 Byron Baseline 3,095 3,095
Total Corporate Services 850 8,824 863 863 500 500 500 500 500 500 500 500 15,400
Public Support Services
GGSERVLN1401 City Hall Lobby Renovation 195 195
GGSERVLN1402 Customer Relations Mgmt 1,150 1,150
Total Public Support Services 1,345 1,345
Total Corporate, Operational
& Council Services850 10,169 863 863 500 500 500 500 500 500 500 500 16,745
** Represents projects that are classified as non-tangible capital assets. These expenditures will not result in the creation of a tangible asset (having physical substance).
2015 CAPITAL BUDGET WITH FORECASTS
($000'S)

Page 271

Page 272
NOTES:
1) Obligatory Reserve Funds
Established to comply with legislation. Contributions and drawdowns are dictated by legislation.
ACTUAL PROJECTED OTHER PLANNED PROJECTED
000's BALANCE CONTRIBUTION INCOME DRAWS BALANCE
31-Dec-14 FROM TAX AND INTEREST (OUTFLOWS) 31-Dec-15
City Services 57,215 - 37,184 (71,423) 22,975
Parkland 1,288 - 425 (1,121) 592
TOTAL OBLIGATORY 58,503 - 37,609 (72,544) 23,567
Capital Asset Renewal and
Replacement 102,572 18,924 6,151 (74,756) 52,891
Capital Asset Growth 18,126 7,702 2,488 (20,914) 7,402
Specific Projects and New Initiatives 125,954 12,615 6,282 (31,499) 113,352
Contingencies and Stabilization 22,471 497 - (7,692) 15,276
Risk Management and Long Term
Planning 77,834 2,595 2,763 (4,387) 78,806
TOTAL CITY OWNED
(EXCLUDING OBLIGATORY)346,957 42,333 17,684 (139,247) 267,727
<-------------------------------2015---------------------------------->
Reserves and Reserve Funds Balance Overview 2014 - 2015
OBLIGATORY (1)
CITY OWNED

Page 273
Capital Asset Renewal and Replacement reserve funds support property tax supported infrastructure worth $4.2 billion with a current
infrastructure gap of $50.2 million, and projected to increase to $405.5 million by 2022.
ACTUAL PROJECTED OTHER PLANNED PROJECTED
000'sBALANCE CONTRIBUTION INCOME DRAWS BALANCE
31-Dec-14 FROM TAX AND INTEREST (OUTFLOWS) 31-Dec-15
Facilities - City 21,465 5,898 515 (9,960) 17,918
- Convention Centre 3,316 597 109 (2,748) 1,274
- Courts Administration 314 33 7 (110) 244
- Dearness Home 1,953 439 34 (1,808) 618
- Library 2,056 400 34 (2,186) 304
- Golf Courses 272 200 7 (232) 247
- Parking 833 - 12 (723) 122
- Material Recovery 711 - 19 - 730
Sanitary Landfill Site 9,909 2,088 356 (4,147) 8,206
Energy Management 2,251 - 57 (199) 2,109
Federal Gas Tax 28,559 0 3,661 (30,478) 1,742
Social Housing i) Major Repairs 6,881 500 189 - 7,570
ii) LMHC Major Upgrades 1,902 2,208 43 (2,758) 1,395
Public Art Acquisition and Maintenance 868 95 24 0 987
Vehicle Replacement - City 14,109 3,649 843 (12,721) 5,880
- Fire 4,414 1,517 69 (5,164) 836
- Police 2,760 1,300 172 (1,522) 2,710
TOTAL CAPITAL ASSET RENEWAL AND
REPLACEMENT102,572 18,924 6,151 (74,756) 52,891
CAPITAL ASSET RENEWAL AND REPLACEMENT OVERVIEW 2014 - 2015
<-------------------------------2015---------------------------------->

Page 274
Note: The “Projected Contribution from Tax” for the Industrial DC Incentive, Institutional DC Incentive, and Residential DC Incentive
reserve funds includes an allocation of $1.91 million of 2015 assessment growth funding. This was necessary to support the
projected draws from these reserve funds.
ACTUAL PROJECTED OTHER PLANNED PROJECTED
000's BALANCE CONTRIBUTION INCOME DRAWS BALANCE
31-Dec-14 FROM TAX AND INTEREST (OUTFLOWS) 31-Dec-15
Industrial Oversizing 6,046 450 99 (6,324) 271
Industrial Land 4,080 1,892 1,345 (4,161) 3,156
Industrial DC Incentive 3,013 1,065 47 (3,547) 578
Institutional DC Incentive 1,306 2,725 22 (3,652) 401
Commercial DC Incentive 1,339 0 936 (824) 1,451
Residential DC Incentive 1,442 1,570 27 (2,407) 632
Non-Growth Works Arising
from Development Agreements900 0 12 0 912
TOTAL CAPITAL ASSET
GROWTH18,126 7,702 2,488 (20,914) 7,402
CAPITAL ASSET GROWTH OVERVIEW 2014 - 2015
<-------------------------------2015---------------------------------->

Page 275
ACTUAL PROJECTED OTHER PLANNED PROJECTED
000's BALANCE CONTRIBUTION INCOME DRAWS BALANCE
31-Dec-14 FROM TAX AND INTEREST (OUTFLOWS) 31-Dec-15
Animal Welfare Benefit 241 - - - 241
AODA 1,318 - - - 1,318
Child Care & Early Childhood Development 6,522 - 173 (947) 5,748
Civic Investments 5,087 1,099 1,276 (4,288) 3,174
Community Improvement Program - Grant 3,387 600 84 (1,043) 3,028
Community Improvement Program - Loan 483 350 298 (564) 567
Social Services 3,142 - 83 - 3,225
Creative City 122 - 3 - 125
Economic Development 10,757 6,924 701 (13,200) 5,182
Effectiveness, Efficiency and Economy 10,919 - 1,500 (3,140) 9,279
Home Ownership 292 - 8 - 300
Housing Support Services 453 - 12 - 465
Misc. Property Acquisition 1,580 880 37 (1,283) 1,214
New Affordable Housing 7,073 2,000 126 (6,637) 2,562
Technology Services 1,847 500 51 (349) 2,049
Woodlot Acquisition 2,650 262 73 (48) 2,937
PUC Environmental 70,081 0 1,857 - 71,938
TOTAL SPECIFIC PROJECTS AND NEW
INITIATIVES125,954 12,615 6,282 (31,499) 113,352
SPECIFIC PROJECTS AND NEW INITIATIVES OVERVIEW 2014 - 2015
<-------------------------------2015---------------------------------->

Page 276
ACTUAL <--------------------------------PROJECTED BALANCE ----------------------------------->
000's BALANCE
31-Dec-14 2015 2016 2017 2018 2019-2024
City Services 57,215 22,975 20,929 21,989 18,690 10,921
Parklands 1,288 592 1,013 1,344 1,785 4,358
TOTAL OBLIGATORY 58,503 23,567 21,942 23,333 20,475 15,279
Facilities - City 21,465 17,918 23,022 28,595 34,792 74,758
- Convention Centre 3,316 1,274 1,773 1,344 989 (3)
- Courts Administration 314 244 223 262 242 305
- Dearness Home 1,953 618 674 731 689 734
- Library 2,056 304 143 79 185 885
- Golf Courses 272 247 306 336 337 329
- Parking 833 122 24 25 26 32
- Material Recovery 711 730 749 708 727 322
Sanitary Landfill Site 9,909 8,206 10,653 13,316 16,450 22,833
Energy Management 2,251 2,109 2,165 2,222 2,281 2,668
Federal Gas Tax 28,559 1,742 1,788 1,835 1,884 2,204
Social Housing i) Major Repairs 6,881 7,570 8,277 9,003 9,748 14,652
ii) LMHC Upgrades 1,902 1,395 1,432 1,470 1,509 1,765
Public Art Acquisition & Maintenance 868 987 1,109 1,234 1,363 2,212
Vehicle Replacement - City 14,109 5,880 5,719 5,928 6,750 4,229
- Fire 4,414 836 394 1,430 1,738 2,320
- Police 2,760 2,710 1,466 1,411 1,384 1,030
TOTAL CAPITAL ASSET RENEWAL AND
REPLACEMENT 102,572 52,891 59,916 69,928 81,094 131,274
PROJECTED RESERVES AND RESERVE FUND BALANCES 2014 - 2024
CAPITAL ASSET RENEWAL AND REPLACEMENT
OBLIGATORY
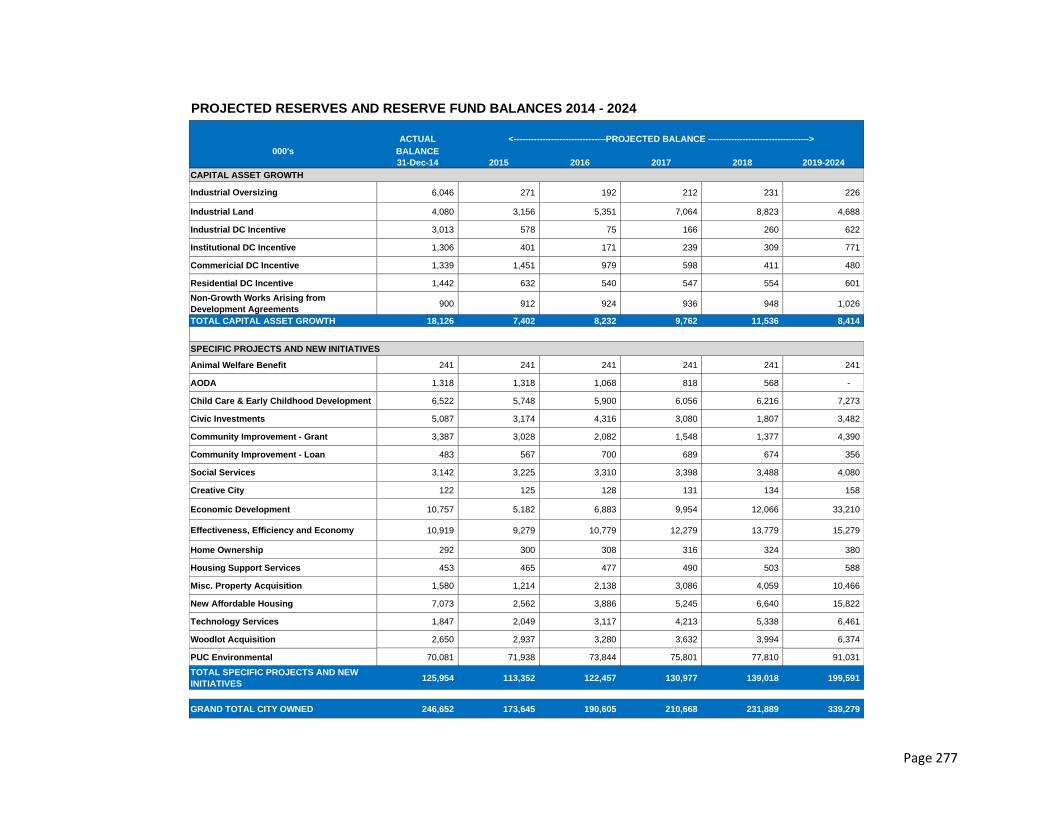
Page 277
ACTUAL <--------------------------------PROJECTED BALANCE ----------------------------------->
000's BALANCE
31-Dec-14 2015 2016 2017 2018 2019-2024
Industrial Oversizing 6,046 271 192 212 231 226
Industrial Land 4,080 3,156 5,351 7,064 8,823 4,688
Industrial DC Incentive 3,013 578 75 166 260 622
Institutional DC Incentive 1,306 401 171 239 309 771
Commericial DC Incentive 1,339 1,451 979 598 411 480
Residential DC Incentive 1,442 632 540 547 554 601
Non-Growth Works Arising from
Development Agreements900 912 924 936 948 1,026
TOTAL CAPITAL ASSET GROWTH 18,126 7,402 8,232 9,762 11,536 8,414
Animal Welfare Benefit 241 241 241 241 241 241
AODA 1,318 1,318 1,068 818 568 -
Child Care & Early Childhood Development 6,522 5,748 5,900 6,056 6,216 7,273
Civic Investments 5,087 3,174 4,316 3,080 1,807 3,482
Community Improvement - Grant 3,387 3,028 2,082 1,548 1,377 4,390
Community Improvement - Loan 483 567 700 689 674 356
Social Services 3,142 3,225 3,310 3,398 3,488 4,080
Creative City 122 125 128 131 134 158
Economic Development 10,757 5,182 6,883 9,954 12,066 33,210
Effectiveness, Efficiency and Economy 10,919 9,279 10,779 12,279 13,779 15,279
Home Ownership 292 300 308 316 324 380
Housing Support Services 453 465 477 490 503 588
Misc. Property Acquisition 1,580 1,214 2,138 3,086 4,059 10,466
New Affordable Housing 7,073 2,562 3,886 5,245 6,640 15,822
Technology Services 1,847 2,049 3,117 4,213 5,338 6,461
Woodlot Acquisition 2,650 2,937 3,280 3,632 3,994 6,374
PUC Environmental 70,081 71,938 73,844 75,801 77,810 91,031
TOTAL SPECIFIC PROJECTS AND NEW
INITIATIVES125,954 113,352 122,457 130,977 139,018 199,591
GRAND TOTAL CITY OWNED 246,652 173,645 190,605 210,668 231,889 339,279
CAPITAL ASSET GROWTH
SPECIFIC PROJECTS AND NEW INITIATIVES
PROJECTED RESERVES AND RESERVE FUND BALANCES 2014 - 2024

Page 278

Page 279
Corporate Debt Overview (Property Tax Supported, Wastewater, Water and Other Funds)
Debt Levels
Debt Levels by Rate Payer
Dec 31,
2013 (A)
Issued
2014
To Be
Retired
2014
Dec 31,
2014 (B)
Authorized
2014 (C)
Total
Potential
2014
Authorized
2015 (D) Total
General Property Taxes 202.5 16.3 28.0 190.8 95.3 286.1 22.1 308.2
Wastewater 79.1 3.5 8.3 74.3 30.5 104.8 - 104.8
Water 2.7 - 0.3 2.4 0.5 2.9 - 2.9
Rate Supported Reserve Funds 30.0 4.4 3.9 30.5 16.5 47.0 - 47.0
Subtotal 314.3 24.2 40.5 298.0 142.8 440.8 22.1 462.9
Joint Water Boards - City's Share 9.8 - 1.1 8.7 22.5 31.2 - 31.2
City Services Reserve Funds 28.3 5.8 3.3 30.8 70.9 101.7 21.9 123.6
Total 352.4 30.0 44.9 337.5 236.2 573.7 44.0 617.7
Debt Issued by Rate Payer 2014 2015 2016 2017 2018 2019 2020 2021 2022 2023 2024
General Property Taxes 190.8 189.5 185.1 187.0 185.0 180.0 182.5 192.6 166.5 143.1 133.6
Wastewater 74.3 90.7 80.6 70.3 60.4 50.4 40.2 30.3 23.5 17.5 11.6
Water 2.4 2.6 2.2 1.9 1.5 1.2 0.8 0.4 0.3 0.1 6.5
Rate Supported Reserve Funds 30.5 36.6 38.9 33.4 27.7 21.8 15.7 12.0 8.2 5.2 2.8
Subtotal 298.0 319.4 306.8 292.6 274.6 253.4 239.2 235.3 198.5 165.9 154.5
Joint Water Boards - City's Share 8.7 24.6 32.6 29.6 26.4 23.6 20.7 17.7 14.5 12.1 9.7
City Services Reserve Funds 30.8 38.6 48.6 51.6 90.0 118.3 137.6 178.9 229.4 222.3 226.0
Total Debt Level 337.5 382.6 388.0 373.8 391.0 395.3 397.5 431.9 442.4 400.3 390.2
Note A: Outstanding debt level is net
of unamortized debenture discount
and agrees to audited financial
statements.
Note B: Outstanding debt level at Dec
31, 2014 is subject to completion of
2014 financial statement audit.
Note C: Authorized as reported for
Q3; September 30, 2014
Note D: Authorized by Council in 2015
Amounts are subject to rounding.
In 2015, Council approved the addition of $44.0 million ($22.1 million for general property taxes and $21.9 million for City Services Reserve Funds)
of debt financing, increasing the total authorized debt to $280.2 million and the total potential debt to date to $617.7 million, as shown in the table
below.
The tables below project debt based on a modest pace of spending against the approved 10-year capital plan. The 10-year capital plan includes an
internal debt financing cap of $26 million over the 10-years for the general property tax supported budget, including tax supported reserve funds.
The Wastewater debt level forecast is developed using parameters included in the 20-year wastewater plan.
The Debt Level Overview tables below summarize the City's current debt levels and 10-year forecast to 2024. At the end of 2014, issued debt will
be approximately $337.5 million. The remaining debt, which has been authorized but not issued, is approximately $236.2 million, for a combined
potential debt level of $573.7 million.
Debt Level Overview for 2014 (in $ millions)
2015 Debt Level Budget with Forecast to 2024 (in $ millions)

Page 280
Corporate Debt Overview (Property Tax Supported, Wastewater, Water and Other Funds) - continued
Debt Servicing Costs
Debt Servicing Costs by
Rate Payer 2014 2015 2016 2017 2018 2019 2020 2021 2022 2023 2024
General Property Taxes 37.5 37.5 38.8 40.1 41.4 42.7 44.1 45.4 45.4 42.3 35.6
Wastewater 13.7 13.1 13.0 12.8 12.1 12.0 11.7 11.2 7.8 6.7 6.4
Water 0.4 0.4 0.4 0.4 0.4 0.4 0.4 0.4 0.2 0.2 0.1
Rate Supported Reserve Funds 4.8 4.9 6.1 7.0 7.0 7.0 7.0 4.3 4.3 3.3 2.6
Subtotal 56.4 55.9 58.3 60.3 60.9 62.1 63.2 61.3 57.7 52.5 44.7
Joint Water Boards - City's Share 1.4 1.4 3.6 4.5 4.5 4.0 4.0 4.0 4.0 3.2 3.0
City Services Reserve Funds 4.3 4.8 6.2 8.0 8.4 14.4 19.5 23.8 30.2 39.0 40.7
Total Debt Servicing Costs 62.1 62.1 68.1 72.8 73.8 80.5 86.7 89.1 91.9 94.7 88.4
Note to overview tables: All figures exclude any commitments that may be recognized by 2014 year-end and excludes all current and future commitments
against Urban Works. Debt servicing forecasts are subject to change for market conditions which affect interest rates, issue timing, and issue term that are
used in calculating debt servicing costs. Amounts are subject to rounding.
The overview table below shows debt servicing costs related to the proposed 10-year capital plan. Projected debt repayments are calculated over a
10-year term using interest rates ranging from 4.30% to 5.40% from 2015 to 2017 and peaking at 5.70% in 2018 through to 2024. Interest rates are
derived using forecasts published by the "Big Five Canadian Banks".
Debt servicing costs for 2015, total $62.1 million corporately and are forecasted to rise over the next 10-years reflecting an increase in the amount of
debt issued and the rising interest rate environment.
2015 Debt Servicing Costs with Forecast to 2024 (in $ millions)
2015 Council Approved Budget February 26, 2015