Embed Size (px)
Citation preview
aihw.gov.au
Stronger evidence, better decisions, improved health and welfare
Couch surfers are among the most hidden groups of people experiencing homelessness. This report explores the circumstances, experiences and housing outcomes of couch surfers who sought assistance from specialist homelessness services between 1 July 2011 and 30 June 2015.
Based on service use patterns across a 4–year period, this comprehensive analysis highlights the diversity and the complexities of the couch surfer population.
Couch surfersA profile of Specialist Homelessness Services clients

Couch surfersA profile of Specialist Homelessness Services clients
The Australian Institute of Health and Welfare is a major national agency whose purpose is to create authoritative and accessible information and statistics
that inform decisions and improve the health and welfare of all Australians.
© Australian Institute of Health and Welfare 2018
This product, excluding the AIHW logo, Commonwealth Coat of Arms and any material owned by a third party or protected by a trademark, has been released under a Creative Commons BY 3.0 (CC BY 3.0) licence. Excluded material owned by third parties may include, for example, design and layout, images obtained under licence from third parties and signatures. We have made all reasonable efforts to identify and label material owned by third parties.You may distribute, remix and build upon this work. However, you must attribute the AIHW as the copyright holder of the work in compliance with our attribution policy available at <www.aihw.gov.au/copyright/>. The full terms and conditions of this licence are available at <http://creativecommons.org/licenses/by/3.0/au/>.This publication is part of the Australian Institute of Health and Welfare’s bulletin series. A complete list of the Institute’s publications is available from the Institute’s website <www.aihw.gov.au>.
ISBN 978-1-76054-468-3 (PDF) ISBN 978-1-76054-469-0 (Print)
Suggested citationAustralian Institute of Health and Welfare 2018. Couch surfers: a profile of Specialist Homelessness Services clients. Cat. no. HOU 298. Canberra: AIHW.
Australian Institute of Health and WelfareBoard ChairMrs Louise Markus
Chief Executive OfficerMr Barry Sandison
Any enquiries about or comments on this publication should be directed to:Australian Institute of Health and WelfareGPO Box 570Canberra ACT 2601Tel: (02) 6244 1000Email: [email protected]
Published by the Australian Institute of Health and Welfare.
Please note that there is the potential for minor revisions of data in this report.Please check the online version at <www.aihw.gov.au> for any amendments.
iiiCouch surfers: a profile of Specialist Homelessness Services clients
Contents
Acknowledgments . . . . . . . . . . . . . . . . . . . . . . . . . . . . . . . . . . . . . . . . . . . . . . . . . . . . . . . . . . . . . . . . . . . . . . v
Abbreviations . . . . . . . . . . . . . . . . . . . . . . . . . . . . . . . . . . . . . . . . . . . . . . . . . . . . . . . . . . . . . . . . . . . . . . . . . vi
Summary . . . . . . . . . . . . . . . . . . . . . . . . . . . . . . . . . . . . . . . . . . . . . . . . . . . . . . . . . . . . . . . . . . . . . . . . . . . . . vii
1 Introduction . . . . . . . . . . . . . . . . . . . . . . . . . . . . . . . . . . . . . . . . . . . . . . . . . . . . . . . . . . . . . . . . . . . . . . . . .1
Defining homelessness . . . . . . . . . . . . . . . . . . . . . . . . . . . . . . . . . . . . . . . . . . . . . . . . . . . . . . . . . . . . . . . . 1
What is ‘couch surfing’? . . . . . . . . . . . . . . . . . . . . . . . . . . . . . . . . . . . . . . . . . . . . . . . . . . . . . . . . . . . . . . . . 2
Profile of couch surfers seeking SHS . . . . . . . . . . . . . . . . . . . . . . . . . . . . . . . . . . . . . . . . . . . . . . . . . . . . . 3
Different types of couch surfers . . . . . . . . . . . . . . . . . . . . . . . . . . . . . . . . . . . . . . . . . . . . . . . . . . . . . . . . . 6
How do people become homeless? . . . . . . . . . . . . . . . . . . . . . . . . . . . . . . . . . . . . . . . . . . . . . . . . . . . . . . 7
How do people exit homelessness? . . . . . . . . . . . . . . . . . . . . . . . . . . . . . . . . . . . . . . . . . . . . . . . . . . . . . . 9
2 Who seeks help for homelessness? . . . . . . . . . . . . . . . . . . . . . . . . . . . . . . . . . . . . . . . . . . . . . . . . . . . .10
Who is couch surfing? . . . . . . . . . . . . . . . . . . . . . . . . . . . . . . . . . . . . . . . . . . . . . . . . . . . . . . . . . . . . . . . . 10
Key comparative findings . . . . . . . . . . . . . . . . . . . . . . . . . . . . . . . . . . . . . . . . . . . . . . . . . . . . . . . . . . . . . 13
3 Persistent service users . . . . . . . . . . . . . . . . . . . . . . . . . . . . . . . . . . . . . . . . . . . . . . . . . . . . . . . . . . . . . .17
Who are persistent service users? . . . . . . . . . . . . . . . . . . . . . . . . . . . . . . . . . . . . . . . . . . . . . . . . . . . . . . 17
Why did persistent service users seek assistance? . . . . . . . . . . . . . . . . . . . . . . . . . . . . . . . . . . . . . . . . 19
What services did persistent service users need? . . . . . . . . . . . . . . . . . . . . . . . . . . . . . . . . . . . . . . . . . 24
What services were provided to persistent service users? . . . . . . . . . . . . . . . . . . . . . . . . . . . . . . . . . . 26
What are the gaps in service provision? . . . . . . . . . . . . . . . . . . . . . . . . . . . . . . . . . . . . . . . . . . . . . . . . . 28
How do persistent service users engage with services? . . . . . . . . . . . . . . . . . . . . . . . . . . . . . . . . . . . . 30
What are the housing outcomes for persistent service users? . . . . . . . . . . . . . . . . . . . . . . . . . . . . . . 34
What does this tell us? . . . . . . . . . . . . . . . . . . . . . . . . . . . . . . . . . . . . . . . . . . . . . . . . . . . . . . . . . . . . . . . . 36
4 Service cyclers . . . . . . . . . . . . . . . . . . . . . . . . . . . . . . . . . . . . . . . . . . . . . . . . . . . . . . . . . . . . . . . . . . . . . .38
Who are service cyclers? . . . . . . . . . . . . . . . . . . . . . . . . . . . . . . . . . . . . . . . . . . . . . . . . . . . . . . . . . . . . . . 38
Why did service cyclers seek assistance? . . . . . . . . . . . . . . . . . . . . . . . . . . . . . . . . . . . . . . . . . . . . . . . . 40
What services did service cyclers need? . . . . . . . . . . . . . . . . . . . . . . . . . . . . . . . . . . . . . . . . . . . . . . . . . 45
What services were provided to service cyclers? . . . . . . . . . . . . . . . . . . . . . . . . . . . . . . . . . . . . . . . . . . 46
What are the gaps in service provision? . . . . . . . . . . . . . . . . . . . . . . . . . . . . . . . . . . . . . . . . . . . . . . . . . 49
How do service cyclers engage with services? . . . . . . . . . . . . . . . . . . . . . . . . . . . . . . . . . . . . . . . . . . . . 50
What are the housing outcomes for service cyclers? . . . . . . . . . . . . . . . . . . . . . . . . . . . . . . . . . . . . . . 53
What does this tell us? . . . . . . . . . . . . . . . . . . . . . . . . . . . . . . . . . . . . . . . . . . . . . . . . . . . . . . . . . . . . . . . . 56
iv Couch surfers: a profile of Specialist Homelessness Services clients
5 Transitory service users . . . . . . . . . . . . . . . . . . . . . . . . . . . . . . . . . . . . . . . . . . . . . . . . . . . . . . . . . . . . . .58
Who are transitory service users? . . . . . . . . . . . . . . . . . . . . . . . . . . . . . . . . . . . . . . . . . . . . . . . . . . . . . . 58
Why did transitory service users seek assistance? . . . . . . . . . . . . . . . . . . . . . . . . . . . . . . . . . . . . . . . . 60
What services did transitory service users need? . . . . . . . . . . . . . . . . . . . . . . . . . . . . . . . . . . . . . . . . . 65
What services were provided to transitory service users? . . . . . . . . . . . . . . . . . . . . . . . . . . . . . . . . . . 66
What are the gaps in service provision? . . . . . . . . . . . . . . . . . . . . . . . . . . . . . . . . . . . . . . . . . . . . . . . . . 68
How do transitory service users engage with services? . . . . . . . . . . . . . . . . . . . . . . . . . . . . . . . . . . . . 69
What are the housing outcomes for transitory service users? . . . . . . . . . . . . . . . . . . . . . . . . . . . . . . 71
What does this tell us? . . . . . . . . . . . . . . . . . . . . . . . . . . . . . . . . . . . . . . . . . . . . . . . . . . . . . . . . . . . . . . . . 73
Appendix A: Background information . . . . . . . . . . . . . . . . . . . . . . . . . . . . . . . . . . . . . . . . . . . . . . . . . . . .75
Preliminary results . . . . . . . . . . . . . . . . . . . . . . . . . . . . . . . . . . . . . . . . . . . . . . . . . . . . . . . . . . . . . . . . . . . 75
Background to the Housing Journeys project . . . . . . . . . . . . . . . . . . . . . . . . . . . . . . . . . . . . . . . . . . . . . 75
Defining homelessness . . . . . . . . . . . . . . . . . . . . . . . . . . . . . . . . . . . . . . . . . . . . . . . . . . . . . . . . . . . . . 75
Exiting homelessness . . . . . . . . . . . . . . . . . . . . . . . . . . . . . . . . . . . . . . . . . . . . . . . . . . . . . . . . . . . . . . 77
Couch surfing youth in Australia . . . . . . . . . . . . . . . . . . . . . . . . . . . . . . . . . . . . . . . . . . . . . . . . . . . . . 78
Data . . . . . . . . . . . . . . . . . . . . . . . . . . . . . . . . . . . . . . . . . . . . . . . . . . . . . . . . . . . . . . . . . . . . . . . . . . . . . . . . 79
Scope of the Housing Journeys project . . . . . . . . . . . . . . . . . . . . . . . . . . . . . . . . . . . . . . . . . . . . . . . . . . 79
Aims of the Housing Journeys project . . . . . . . . . . . . . . . . . . . . . . . . . . . . . . . . . . . . . . . . . . . . . . . . . . . 80
Appendix B: Technical information . . . . . . . . . . . . . . . . . . . . . . . . . . . . . . . . . . . . . . . . . . . . . . . . . . . . . .81
Scope and coverage . . . . . . . . . . . . . . . . . . . . . . . . . . . . . . . . . . . . . . . . . . . . . . . . . . . . . . . . . . . . . . . . . . 81
Data quality and Indigenous Australians . . . . . . . . . . . . . . . . . . . . . . . . . . . . . . . . . . . . . . . . . . . . . . 82
Incomplete data . . . . . . . . . . . . . . . . . . . . . . . . . . . . . . . . . . . . . . . . . . . . . . . . . . . . . . . . . . . . . . . . . . . 82
Key data quality issues, 2011–12 . . . . . . . . . . . . . . . . . . . . . . . . . . . . . . . . . . . . . . . . . . . . . . . . . . . . . 83
References . . . . . . . . . . . . . . . . . . . . . . . . . . . . . . . . . . . . . . . . . . . . . . . . . . . . . . . . . . . . . . . . . . . . . . . . . . . .84
List of tables . . . . . . . . . . . . . . . . . . . . . . . . . . . . . . . . . . . . . . . . . . . . . . . . . . . . . . . . . . . . . . . . . . . . . . . . . .86
List of figures . . . . . . . . . . . . . . . . . . . . . . . . . . . . . . . . . . . . . . . . . . . . . . . . . . . . . . . . . . . . . . . . . . . . . . . . .87
Related publications . . . . . . . . . . . . . . . . . . . . . . . . . . . . . . . . . . . . . . . . . . . . . . . . . . . . . . . . . . . . . . . . . . .89
vCouch surfers: a profile of Specialist Homelessness Services clients
Acknowledgments
This report was prepared by the staff of the Housing and Homelessness Reporting and Development Unit of the Australian Institute of Health and Welfare (AIHW).
We are grateful to the Department of Social Services and the state and territory departments responsible for the delivery of specialist homelessness services for funding the Specialist Homelessness Services Collection and for working with us to conduct the collection.
We are especially appreciative of all homelessness agencies and their clients for their participation in the data collection, making research of this nature possible.
vi Couch surfers: a profile of Specialist Homelessness Services clients
Abbreviations
ABS Australian Bureau of Statistics
AIHW Australian Institute of Health and Welfare
SHS Specialist Homelessness Services
SHSC Specialist Homelessness Services Collection
viiCouch surfers: a profile of Specialist Homelessness Services clients
Summary
In 2011–12, 16,300 couch surfing adults (those aged 18 and over or aged 15–17 presenting to services alone) sought assistance from Specialist Homelessness Services (SHS). This report presents an analysis of these clients, providing a profile of their service use over a 4-year period using the Specialist Homelessness Services Collection (SHSC). Couch surfers are among the most hidden groups of people experiencing homelessness. They tend to be a transient group and therefore can be difficult to identify (Moore 2017). The concept of couch surfing acknowledges that homelessness is not ‘rooflessness’; that there are people who may not be sleeping rough but who cannot be considered to be stably housed (Moore 2017). Couch surfing can be a precursor to chronic homelessness, thereby making couch surfers an important group for targeted policies, programs and services.
Couch surfers are much younger than others seeking homelessness services
Around half (8,000 clients or 49%) of couch surfers were aged 15–24 upon their first presentation to services in 2011–12, compared with around one-quarter (27%) of all other adult SHS clients.
More couch surfers were female (9,800 or 60%), which was similar to other adults who sought SHS in 2011–12.
For other demographic characteristics, such as Indigenous status (26% were Indigenous), employment status (9% were employed) and the location in which they were receiving services (55% in Major cities), couch surfers were broadly similar to other adult SHS clients.
Analysis of the service use patterns of couch surfers presenting to SHS in 2011–12 to 2014–15 revealed 3 cohorts of couch surfers
• Transitory service users (7,300 clients or 45% of all couch surfers) accessed services in 2011–12 only.
• Service cyclers (7,100 clients or 44% of all couch surfers) accessed services in 2 or 3 years of the 4-year period.
• Persistent service users (1,900 clients or 12% of all couch surfers) accessed services every financial year from 2011–12 to 2014–15.
Service use increases with increasingly complex needs
Couch surfers showed increasing service use according to their needs or ‘vulnerability conditions’. In this analysis, vulnerability is based on whether someone had ever reported: a mental health issue or mental health diagnosis; having experienced problematic drug and/or alcohol use, and/or having experienced domestic or family violence.
Compared with other adult SHS clients, couch surfers were:
• less likely to ever report experiencing domestic or family violence
• equally likely to ever report problematic drug and/or alcohol use
• more likely to ever report a mental health issue or a mental health diagnosis.
Across the 3 couch surfer cohorts, persistent service users were more likely than service cyclers or transitory service users to ever report vulnerability conditions.
viii Couch surfers: a profile of Specialist Homelessness Services clients
Couch surfers most frequently seek assistance with accommodation, interpersonal relationships and financial issues
Accommodation was most frequently sought by all 3 cohorts of couch surfers.
Couch surfers also sought assistance with interpersonal relationships—particularly relationship/family breakdown and domestic or family violence. Females were more likely than males to seek assistance with relationship/family breakdown, or domestic or family violence.
The key financial issue across all 3 couch surfer cohorts was financial difficulties—persistent service users were around twice as likely to cite this issue as transitory service users.
Short-term or emergency accommodation most commonly provided to couch surfers
Of those couch surfers needing accommodation services, clients were more likely to receive short-term or emergency accommodation (ranging from 54% of transitory service users to 81% of persistent service users) over medium-term or transitional housing (23% to 59% across the 3 cohorts). Only a small percentage received long-term housing (7% of transitory service users, 13% of service cyclers and 21% of persistent service users).
Despite more than 3 in 4 couch surfers identifying a need for accommodation services, half (8,300 or 51%) did not receive any nights of accommodation during the study period (2011–15). This ranged from a low of 18% of persistent service users, to 41% of service cyclers and 68% of transitory service users. An additional 12% received 1–10 nights of accommodation only.
Many couch surfers experience positive outcomes following SHS support
Couch surfers approaching SHS for assistance are by definition homeless. Following support, 33% were housed: ranging from 18% of transitory service users to 48% of persistent service users, with housing outcomes for 21% of clients unknown.
• While more than 6 in 10 persistent service users had repeat periods of homelessness during the study period (transitioning from homeless to housed, then to homeless again), almost half (48%) were housed at 30 June 2015. For up to 1 in 7 persistent service users accessing support across 4 years, their housing outcome was unknown.
• Around one-quarter of service cyclers also experienced repeat episodes of homelessness and almost half (45%) were housed at the end of the study period. For more than 1 in 5 service cyclers, their housing outcome remained unknown.
• While only 2% of transitory service users experienced repeat homelessness during their engagement with SHS, almost 1 in 5 (18%) were housed at the end of their support. The housing outcomes for around 1 in 5 transitory service users remained unknown.
Linking data sets could provide more comprehensive information
This analysis reports only on clients accessing services from SHS agencies, not all couch surfers. It also only reports on findings to 30 June 2015. Linking these data to other sources—for example, information on rent assistance, income support or social housing—would provide more comprehensive information on a client’s circumstances, journey and outcomes. In addition, further work on identifying and improving the estimation of homelessness, including youth homelessness, is required to facilitate transparent and reliable measures that will inform effective policy and service responses.
1Couch surfers: a profile of Specialist Homelessness Services clients
Intr
oduc
tion
1
1 Introduction
Many Australians experience events in their life that may place them at risk of homelessness. On Census night in 2016, more than 116,400 men, women and children in Australia were experiencing homelessness (ABS 2018). Of these, an estimated 17,700 (15%) were ‘couch surfing’—that is, they were staying temporarily with other households. This is a 2% increase in the number of people couch surfing from the 2011 Census estimates, where 102,400 people were experiencing homelessness, and 17,400 of these people were couch surfing. However, it represents a decrease in the rate of couch surfers from 8.1 per 10,000 population on Census night in 2011 to 7.6 in 2016. This ‘visitor’ homeless group reflects the average male to female ratio of all homeless people in 2016 (59% to 41% respectively) (ABS 2018).
Most people approaching Specialist Homelessness Services (SHS) for assistance are at risk of homelessness and remain housed following support. The Specialist Homelessness Services Collection (SHSC) defines couch surfers as homeless (AIHW 2017). The couch surfer cohort is small yet distinct from other SHS clients, and is often referred to as ‘masked’—it is 1 of the most hidden populations of people experiencing homelessness (ABS 2012; Gaetz et al. 2012).
Defining homelessness There is no single universally agreed definition of homelessness. For example, the Australian Bureau of Statistics (ABS) defines it as a lack of 1 or more of the elements that represent home—which may include a sense of security, stability, privacy, safety and the ability to control living space (ABS 2012). The literature refers to 3 types of homelessness based on a cultural definition which identifies shared community standards regarding the minimum level of housing that people have a right to expect:
• primary homelessness, when people lack conventional accommodation, such as living on the streets, sleeping in parks or cars, or squatting in buildings and improvised dwellings for shelter (Chamberlain & MacKenzie 2008; UNSD 2017)
• secondary homelessness, when people are forced to move from 1 temporary shelter to another; for example, couch surfing (Chamberlain & MacKenzie 2008; UNSD 2017)
• tertiary homelessness, when people live in accommodation that falls below minimum standards; for example, single rooms in private boarding houses without their own bathroom, kitchen or security of tenure (Chamberlain & MacKenzie 2008).
The SHSC considers a person to be homeless if they are living in any of the following circumstances:
• non-conventional accommodation or ‘sleeping rough’—defined as living on the streets, sleeping in parks, squatting, staying in cars or railway carriages, living in improvised dwellings or living in the long grass. This definition aligns closely with the cultural definition of primary homelessness
• short-term or emergency accommodation due to a lack of other options, including refuges, crisis shelters, couch surfing or living temporarily with friends and relatives, insecure accommodation on a short-term basis, emergency accommodation arranged by a specialist homelessness agency (for example, in hotels, motels and so forth). This aligns closely with the cultural definition of secondary homelessness (AIHW 2017).
2 Couch surfers: a profile of Specialist Homelessness Services clients
Intr
oduc
tion
1
What is ‘couch surfing’?Most of what is known about couch surfing is grounded in the literature on homelessness which highlights that homelessness does not equate with ‘rooflessness’. This is the case for the many people who may not be sleeping rough but who cannot be considered to be stably housed (Moore 2017).
In Australia, it is widely accepted that homelessness should be broadly defined to include temporary stays with a friend or relative—commonly referred to as couch surfing. This practice is defined as a type of secondary homelessness encompassing people in temporary accommodation with no other secure housing elsewhere, such as staying with other households (couch surfing), refuges and hostels (Chamberlain & MacKenzie 2008).
MacKenzie and Chamberlain (2003) identified a common set of circumstances preceding chronic homelessness. In what was termed the ‘homelessness career’, couch surfing was identified as 1 such precursor, occurring in the very early ‘in and out of home’ stage, when young people are still at school. It involves frequent movements between temporary living arrangements, including in the homes of friends, friends’ parents, extended family and strangers. For this reason, the literature often aligns couch surfing with young people (McCoy & Hug 2018; McLoughlin 2013; Moore 2017). Despite this, there is a recognised increase in the prevalence of couch surfing among older people, with a recent report released by Homelessness Australia citing an almost doubling of couch surfing among older women, with a similar rise in the number of older women sleeping in cars over the 4 years to 2017 (Butler 2017; McDonald 2017).
The literature notes couch surfers are a transient cohort of vulnerable people who can be difficult to identify (Moore 2017). There is currently no reliable way of estimating homelessness among people staying with other households in Australia (ABS 2018). Specifically, limitations of the ABS homelessness estimates include:
• for some couch surfing youth, a usual residence may still be reported in the Census. Their homelessness is masked as their characteristics look no different to other youth who are not homeless but simply visiting another residence on Census night
• a usual address may be reported for ‘couch surfers’ either because the young person does not want to disclose they are unable to go home or the person filling out the Census form assumes the young person will return to their home
• the definition under ABS data collection principles is unclear as to whether the couch surfing event involves days, months or years before the situation can be considered couch surfing (ABS 2012).
3Couch surfers: a profile of Specialist Homelessness Services clients
Intr
oduc
tion
1
Identification of the cohort is further complicated by culturally specific practices. For example, in many cultures, particularly the Pacific Islander, Māori, Aboriginal and Torres Strait Islander communities, young children and adolescents constantly move between the homes of family and community members, and it is common for parents to send children to live with extended members of the family. For these communities, ‘home’ is understood in a different way, particularly when staying with their extended family (Moore 2017). These movements should not fall under the definition of couch surfing as a form of homelessness.
Data presented in this report are limited to clients presenting to SHS for assistance and do not cover all couch surfers or all those who are experiencing homelessness. Data used in this analysis are unweighted and client counts are likely to be underestimated. Data from this study are not comparable to the published results of weighted data in other reports using SHSC data. For further information, please refer to Appendix A.
Profile of couch surfers seeking SHSOf the more than 16,300 couch surfers who sought the help of SHS in 2011–12:
• 6 in 10 (60%) were female
• around half (49%) were aged 15–24
• 9 in 10 (91%) were unemployed or not in the labour force
• 15% were enrolled in some form of education upon first presentation to SHS
• more than one-third (37%) reported ever experiencing a mental health issue, while 1 in 3 (30%) reported a mental health diagnosis
• more than one-third (34%) had ever experienced domestic or family violence. Females were more than 3 times as likely to have ever experienced domestic or family violence as males (48% compared with 14%).
Compared with all other adult SHS clients, couch surfers were more likely to be young, Indigenous, enrolled in education, living with other family or in a group situation, and have experienced repeat episodes of homelessness. The main reasons for seeking assistance were accommodation, interpersonal relationships (particularly relationship/family breakdown) and/or financial issues.
The profiles of couch surfers and other SHS clients are presented in Table 1.
4 Couch surfers: a profile of Specialist Homelessness Services clients
Intr
oduc
tion
1
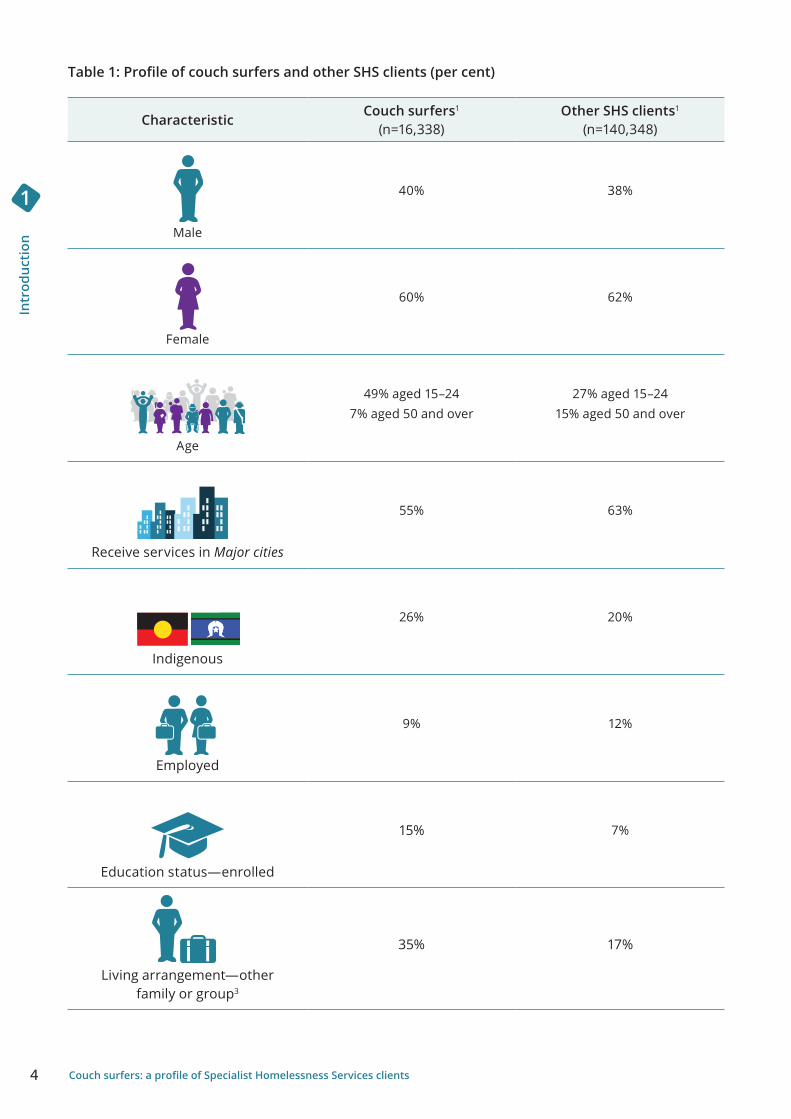
Table 1: Profile of couch surfers and other SHS clients (per cent)
CharacteristicCouch surfers1
(n=16,338)Other SHS clients1
(n=140,348)
Male
40% 38%
Female
60% 62%
Age
49% aged 15–247% aged 50 and over
27% aged 15–2415% aged 50 and over
Receive services in Major cities
55% 63%
Indigenous
26% 20%
Employed
9% 12%
Education status—enrolled
15% 7%
Living arrangement—other family or group3
35% 17%
5Couch surfers: a profile of Specialist Homelessness Services clients
Intr
oduc
tion
1
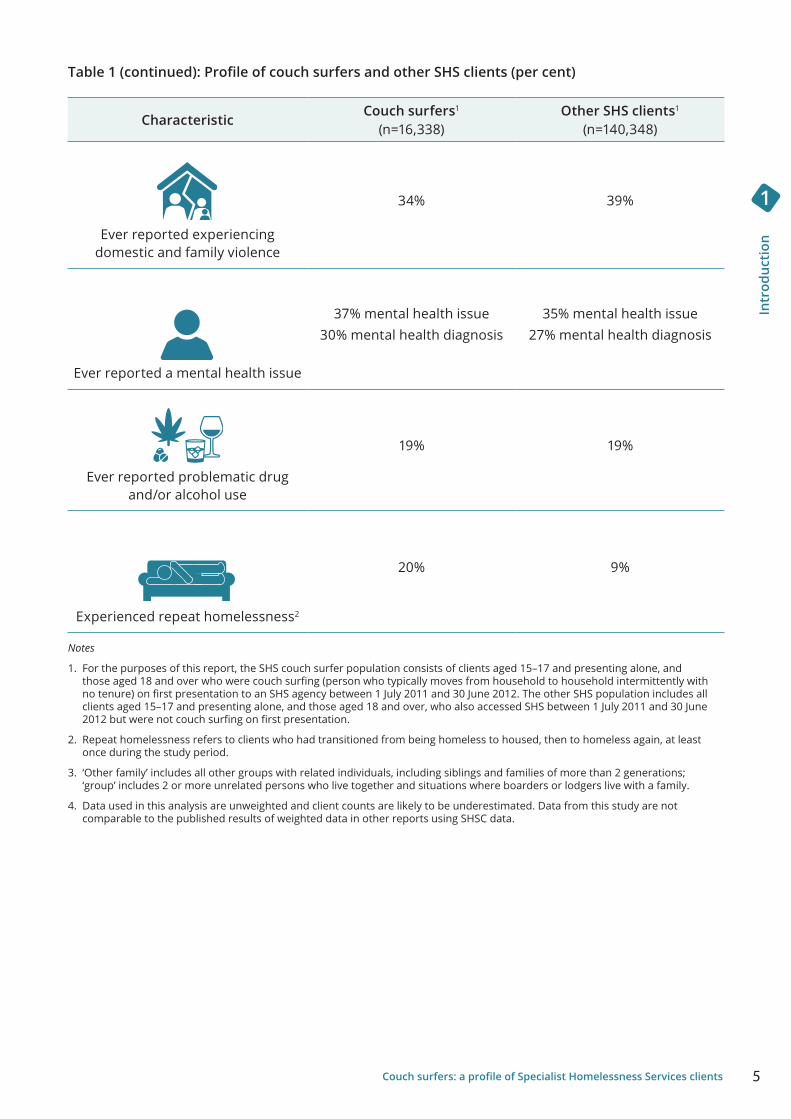
CharacteristicCouch surfers1
(n=16,338)Other SHS clients1
(n=140,348)
Ever reported experiencing domestic and family violence
34% 39%
Ever reported a mental health issue
37% mental health issue30% mental health diagnosis
35% mental health issue27% mental health diagnosis
Ever reported problematic drug and/or alcohol use
19% 19%
Experienced repeat homelessness2
20% 9%
Notes
1. For the purposes of this report, the SHS couch surfer population consists of clients aged 15–17 and presenting alone, and those aged 18 and over who were couch surfing (person who typically moves from household to household intermittently with no tenure) on first presentation to an SHS agency between 1 July 2011 and 30 June 2012. The other SHS population includes all clients aged 15–17 and presenting alone, and those aged 18 and over, who also accessed SHS between 1 July 2011 and 30 June 2012 but were not couch surfing on first presentation.
2. Repeat homelessness refers to clients who had transitioned from being homeless to housed, then to homeless again, at least once during the study period.
3. ‘Other family’ includes all other groups with related individuals, including siblings and families of more than 2 generations; ‘group’ includes 2 or more unrelated persons who live together and situations where boarders or lodgers live with a family.
4. Data used in this analysis are unweighted and client counts are likely to be underestimated. Data from this study are not comparable to the published results of weighted data in other reports using SHSC data.
Table 1 (continued): Profile of couch surfers and other SHS clients (per cent)
6 Couch surfers: a profile of Specialist Homelessness Services clients
Intr
oduc
tion
1
This report presents, for the first time, a comprehensive analysis of Australia’s couch surfers, using longitudinal data from the Australian Institute of Health and Welfare’s (AIHW’s) SHSC. It examines the circumstances, experiences and housing outcomes for adults who were couch surfing as well as teenagers aged 15–17 presenting alone to SHS seeking services. (These younger clients have been included as they presented to services unaccompanied while couch surfing, without an established support system in place. As such, they are treated as adults.) It analyses the service use patterns of couch surfers and describes the:
• characteristics of couch surfers
• reasons they seek assistance
• services provided and unmet demand
• service engagement patterns (days of support, span of support periods, nights of accommodation, number of support periods)
• housing outcomes of couch surfers.
This report is the second of 3 in the AIHW’s Housing Journeys of Homeless Clients Project. The first report focusing on rough sleepers was released in August 2018, while the final report will focus on people living in short-term or emergency accommodation and will be released in 2019. For more information on the SHSC and the project, see Appendix A.
Supplementary tables accompanying this release are available at <www.aihw.gov.au> and are referenced throughout this report as Supplementary table SX.
Different types of couch surfers This report focuses on clients who identified as a couch surfer (a person who typically moves from household to household intermittently with no tenure) when first presenting to SHS for assistance between 1 July 2011 and 30 June 2012. Three cohorts of couch surfers were selected based on their service use over the subsequent 3 years (to 30 June 2015).
• Persistent service users—clients who had at least 1 support period in each financial year between 1 July 2011 and 30 June 2015.
• Service cyclers—clients who had a least 1 support period between 1 July 2011 and 30 June 2012 and at least 1 other support period between 1 July 2012 and 30 June 2015.
• Transitory service users—clients who had at least 1 support period between 1 July 2011 and 30 June 2012, but did not receive any support between 1 July 2012 and 30 June 2015.
Specialist Homelessness Services Collection
Specialist Homelessness Services (SHS) assist people who are homeless, or at risk of homelessness, by assessing their needs, providing direct assistance, such as emergency accommodation, and referring clients to other services as required. The Specialist Homelessness Services Collection (SHSC) is conducted by the AIHW to monitor the assistance provided and to contribute to the evidence base that shapes policy and service development. Data are provided to the AIHW by around 1,500 homelessness agencies.
The SHSC only includes data on homeless clients or clients at risk of homelessness who presented to services. It therefore does not represent all people who are homeless or who are at risk of homelessness.
A support period is the length of time a client receives services from an SHS agency. It starts on the day a client first receives a direct service and ends when services stop. Clients may receive multiple support periods across time.
7Couch surfers: a profile of Specialist Homelessness Services clients
Intr
oduc
tion
1
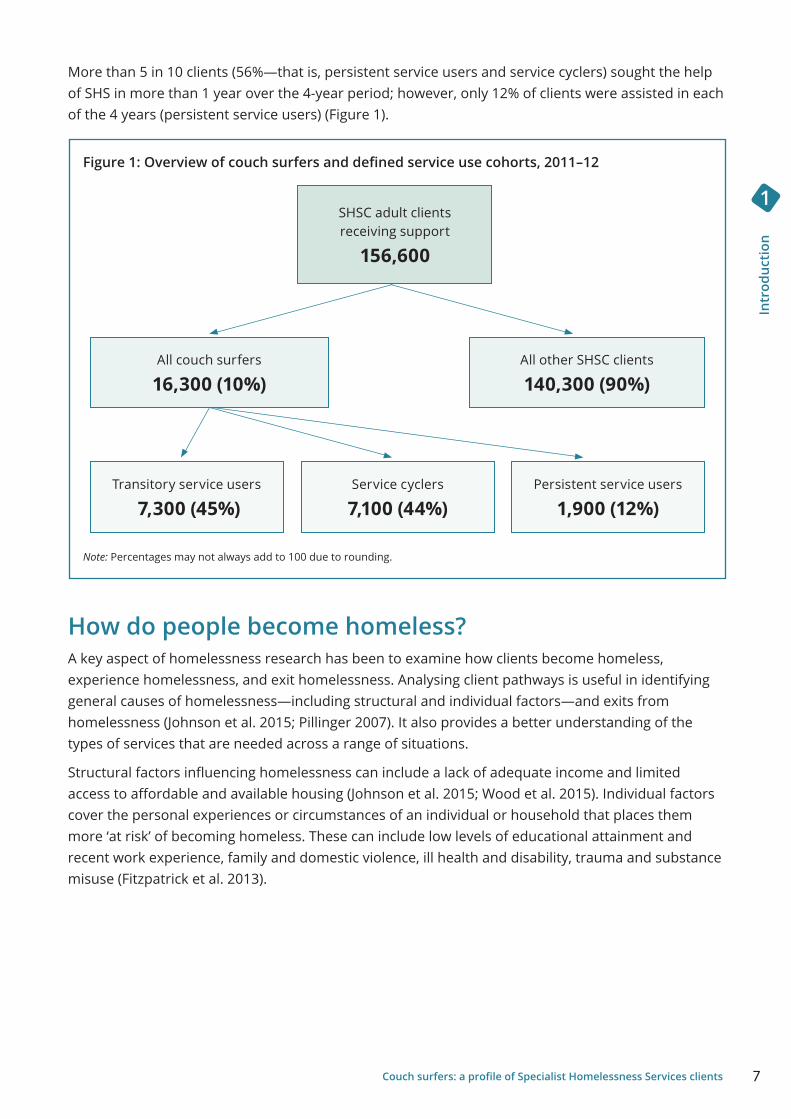
More than 5 in 10 clients (56%—that is, persistent service users and service cyclers) sought the help of SHS in more than 1 year over the 4-year period; however, only 12% of clients were assisted in each of the 4 years (persistent service users) (Figure 1).
Figure 1: Overview of couch surfers and defined service use cohorts, 2011–12
Note: Percentages may not always add to 100 due to rounding.
How do people become homeless?A key aspect of homelessness research has been to examine how clients become homeless, experience homelessness, and exit homelessness. Analysing client pathways is useful in identifying general causes of homelessness—including structural and individual factors—and exits from homelessness (Johnson et al. 2015; Pillinger 2007). It also provides a better understanding of the types of services that are needed across a range of situations.
Structural factors influencing homelessness can include a lack of adequate income and limited access to affordable and available housing (Johnson et al. 2015; Wood et al. 2015). Individual factors cover the personal experiences or circumstances of an individual or household that places them more ‘at risk’ of becoming homeless. These can include low levels of educational attainment and recent work experience, family and domestic violence, ill health and disability, trauma and substance misuse (Fitzpatrick et al. 2013).
SHSC adult clients receiving support
156,600
All couch surfers
16,300 (10%)
Transitory service users
7,300 (45%)Service cyclers
7,100 (44%)Persistent service users
1,900 (12%)
All other SHSC clients
140,300 (90%)
8 Couch surfers: a profile of Specialist Homelessness Services clients
Intr
oduc
tion
1
The Melbourne Institute (using the Journeys Home longitudinal data set) found the following individual risk factors associated with homelessness (Bevitt et al. 2015):
• sex (males were more likely to experience homelessness than females)
• age (respondents over 45 were twice as likely to experience homelessness as those aged 15–24)
• Indigenous status (Aboriginal or Torres Strait Islanders were more likely to experience homelessness)
• marital status (singles were more likely to experience homelessness than couples)
• living arrangement (respondents without resident children were more likely to experience homelessness than those with children living with them)
• experience of incarceration (respondents who had ever been incarcerated, including juvenile detention, were more prone to homelessness)
• current circumstances (family breakdown, health problems, employment status, alcohol and drug use, recent incarceration, physical and sexual violence) impact on experiences of homelessness.
Chamberlain and Johnson (2011) examined over 4,000 case histories of people experiencing homelessness during 2005–06 and identified 5 typical pathways into adult homelessness:
• housing crisis
• family breakdown
• substance abuse
• mental health
• transitioning from being homeless in youth (‘youth to adult’).
The length of time that people remained homeless was also examined, classified as short (3 months or less), medium (4–11 months) and long term (12 months or more). People who entered homelessness through housing crisis or family breakdown had a typical period of homelessness that lasted 3 months or less, while those who had substance abuse or mental health issues typically experienced periods of homelessness that lasted 12 months or more.
The triggers associated with people experiencing homelessness have been found to increase with an individual’s age and previous durations of ‘rooflessness’ and/or episodic homelessness (Pillinger 2007; Ravenhill 2003). Individual factors, such as ill health, trauma and disability, can be both a cause and a consequence of homelessness, including prolonged rough sleeping (Johnson et al. 2015).
9Couch surfers: a profile of Specialist Homelessness Services clients
Intr
oduc
tion
1
How do people exit homelessness?Homelessness is a complex issue affecting many Australians. It requires a long-term and systematic effort across agencies, sectors and the community. Governments have committed to the National Housing and Homelessness Agreement, which came into effect as of 1 July 2018.
The Journeys Home survey (Bevitt et al. 2015) found several factors to be associated with high rates of exit from homelessness. Males are both more likely than females to enter homelessness and less likely to exit. In addition, the young (while only slightly more likely to enter homelessness) are much more likely to exit than older respondents, lending weight to the argument that the young are more likely to cycle in and out of homelessness. Respondents with resident children are also more likely to exit homelessness than singles or couples without children living with them. It also appears that family connections are important to both preventing the entry into homelessness as well as assisting individuals out of homelessness (for further information regarding the Melbourne Institute’s research using the Journeys Home longitudinal data set, please see Appendix A).
In addition, Ravenhill (2003) reports that certain events or personal factors can prompt people experiencing homelessness into wanting to exit homelessness. These can include that people felt they had reached rock bottom, could no longer cope with the rough sleeping lifestyle, had a sudden shock or trauma, or realised that someone cared. Additional catalysts could be ‘doing it for their children’ and ‘not wanting to be stigmatised for being homeless’. Exiting homelessness is also dependent on the availability of homelessness services (Ravenhill 2003). Access to these services was the most significant issue found in the resettlement process, including access to: advice, crisis accommodation, resettlement help, women’s refuges, rehabilitation programs, supported accommodation and follow-up support.
10
Who
see
ks h
elp
for
hom
eles
snes
s?
2
Couch surfers: a profile of Specialist Homelessness Services clients
2 Who seeks help for homelessness?
Clients who approach SHS for assistance do so for a variety of reasons, yet they all share 1 thing—they lack suitable housing, or are at risk of not being able to maintain their current housing situation. They may be currently homeless, or facing the prospect of losing their housing (at risk of homelessness). It should be noted that most clients seeking assistance from SHS agencies were housed but ‘at risk’ of becoming homeless. Couch surfers in the SHSC are considered to be homeless.
Who is couch surfing?Between 1 July 2011 and 30 June 2012, nearly 156,600 adults presented to SHS for assistance and of these, more than 16,300 clients (10% of all SHS clients aged either 15–17 and presenting alone, or aged 18 and over) were couch surfing.
Of these 16,300 clients:
• 6 in 10 were female (60%)
• almost half (49%) were aged 15–24, with female couch surfers generally younger than male:
– 15–24: 52% of all female couch surfers 45% of all male couch surfers
– 25–34: 24% of all female couch surfers 23% of all male couch surfers
– 35 and over: 24% of all female couch surfers 32% of all male couch surfers
• more than one-quarter (26%) were Indigenous:
– 23% of males compared with 28% of females
• fewer than 1 in 10 (9%) were employed, 43% were unemployed and 47% were not in the labour force upon their first presentation to a SHS for assistance
• more than 5 in 10 (55%) couch surfers were receiving services in Major cities:
– males were equally likely to be receiving services in Major cities (56% compared with 55% females)
– females were more likely to be receiving services in Remote or Very remote areas (5% compared with 2% males)
• one-third (33%) reported they were living alone, 27% were living with at least 1 child:
– males were more likely to report living alone (42% compared with 27% females)
– females were more likely to report living with at least 1 child (35% compared with 15% males).
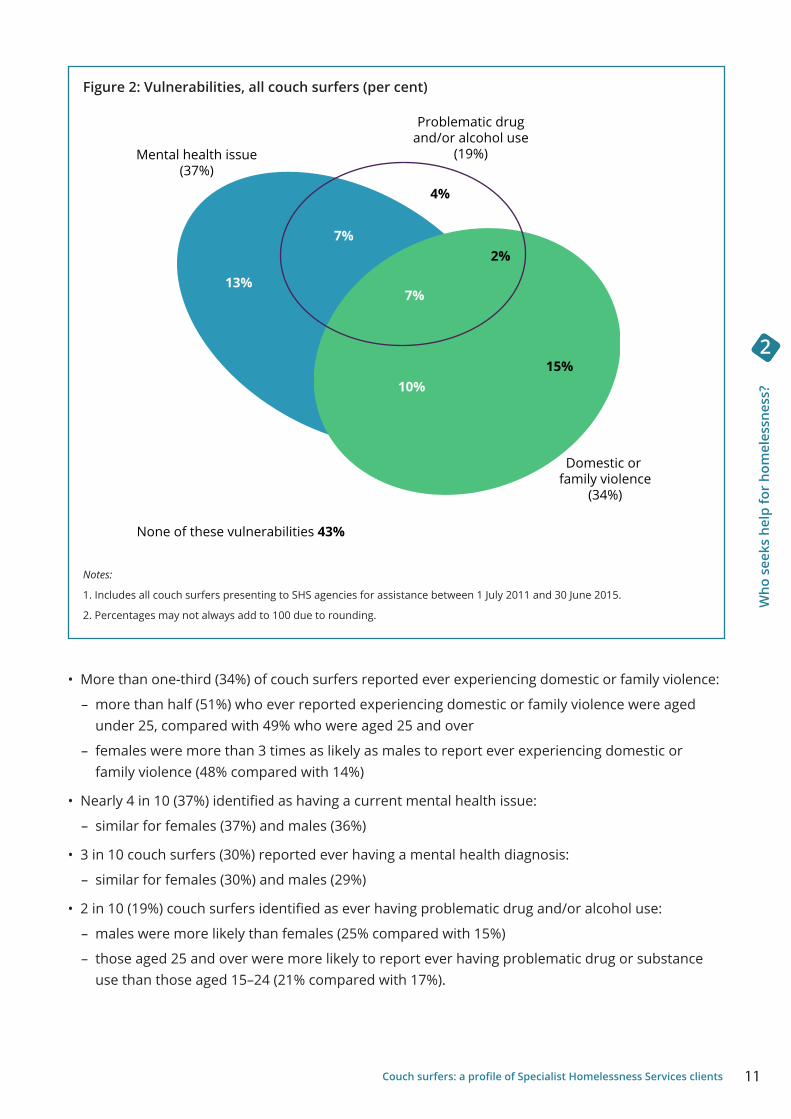
One in 4 (26%) couch surfers experienced 2 or more vulnerabilities (defined as ever experiencing domestic or family violence, ever reporting a mental health issue, or ever experiencing problematic drug and/or alcohol use) (Figure 2).
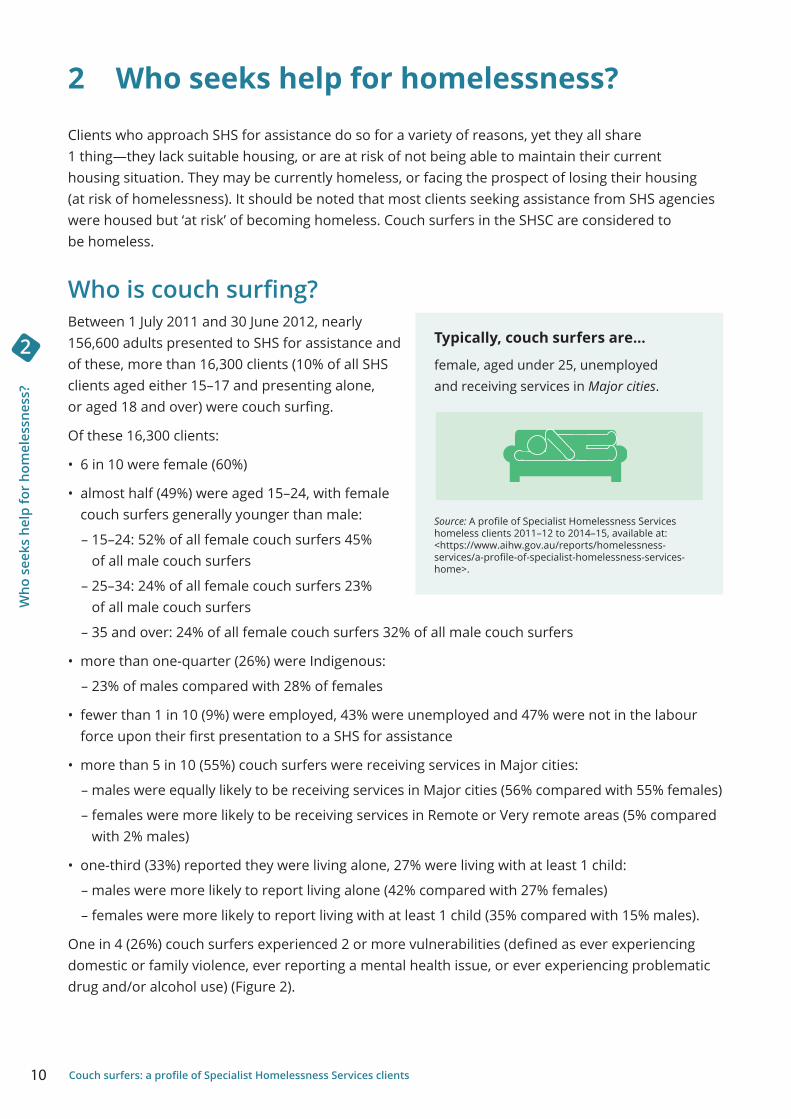
Typically, couch surfers are…
female, aged under 25, unemployed and receiving services in Major cities .
Source: A profile of Specialist Homelessness Services homeless clients 2011–12 to 2014–15, available at: <https://www.aihw.gov.au/reports/homelessness-services/a-profile-of-specialist-homelessness-services-home>.
11
Who
see
ks h
elp
for
hom
eles
snes
s?
2
Couch surfers: a profile of Specialist Homelessness Services clients
Figure 2: Vulnerabilities, all couch surfers (per cent)
Notes:
1. Includes all couch surfers presenting to SHS agencies for assistance between 1 July 2011 and 30 June 2015.
2. Percentages may not always add to 100 due to rounding.
• More than one-third (34%) of couch surfers reported ever experiencing domestic or family violence:
– more than half (51%) who ever reported experiencing domestic or family violence were aged under 25, compared with 49% who were aged 25 and over
– females were more than 3 times as likely as males to report ever experiencing domestic or family violence (48% compared with 14%)
• Nearly 4 in 10 (37%) identified as having a current mental health issue:
– similar for females (37%) and males (36%)
• 3 in 10 couch surfers (30%) reported ever having a mental health diagnosis:
– similar for females (30%) and males (29%)
• 2 in 10 (19%) couch surfers identified as ever having problematic drug and/or alcohol use:
– males were more likely than females (25% compared with 15%)
– those aged 25 and over were more likely to report ever having problematic drug or substance use than those aged 15–24 (21% compared with 17%).
None of these vulnerabilities 43%
Mental health issue(37%)
Domestic or family violence
(34%)
Problematic drugand/or alcohol use
(19%)
2%
7%
10%
7%
4%
15%
13%
12
Who
see
ks h
elp
for
hom
eles
snes
s?
2
Couch surfers: a profile of Specialist Homelessness Services clients
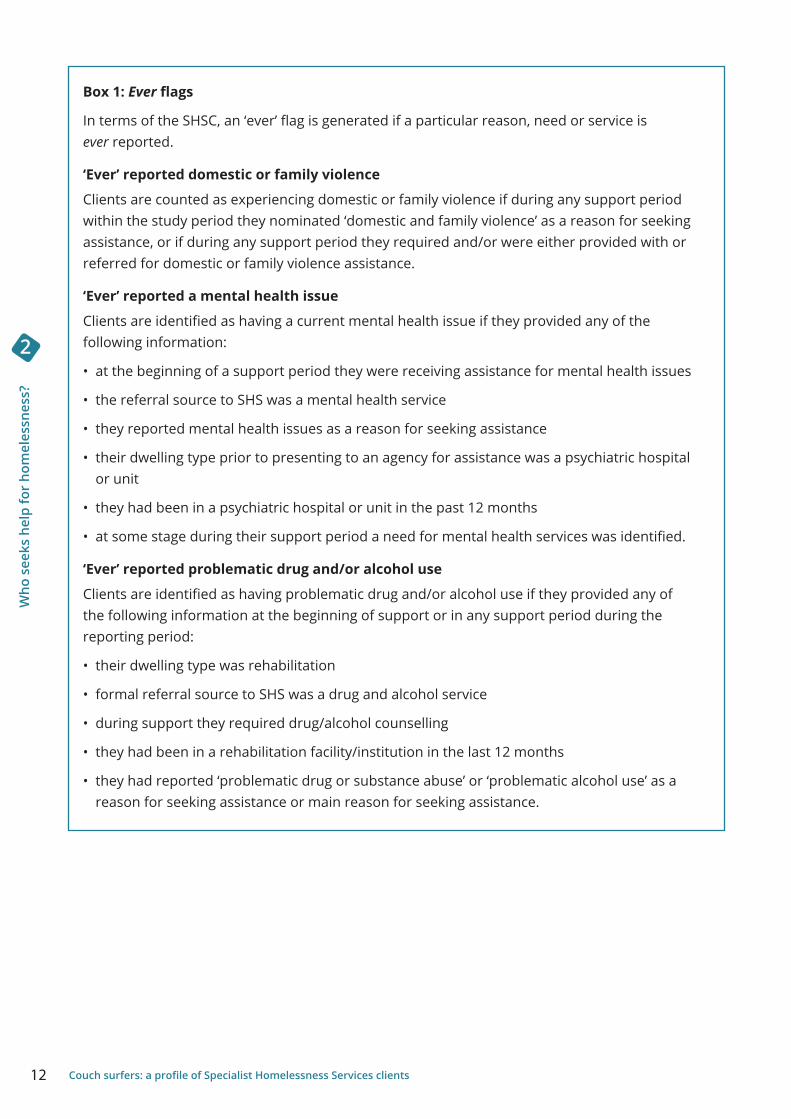
Box 1: Ever flags
In terms of the SHSC, an ‘ever’ flag is generated if a particular reason, need or service is ever reported.
‘Ever’ reported domestic or family violence
Clients are counted as experiencing domestic or family violence if during any support period within the study period they nominated ‘domestic and family violence’ as a reason for seeking assistance, or if during any support period they required and/or were either provided with or referred for domestic or family violence assistance.
‘Ever’ reported a mental health issue
Clients are identified as having a current mental health issue if they provided any of the following information:
• at the beginning of a support period they were receiving assistance for mental health issues
• the referral source to SHS was a mental health service
• they reported mental health issues as a reason for seeking assistance
• their dwelling type prior to presenting to an agency for assistance was a psychiatric hospital or unit
• they had been in a psychiatric hospital or unit in the past 12 months
• at some stage during their support period a need for mental health services was identified.
‘Ever’ reported problematic drug and/or alcohol use
Clients are identified as having problematic drug and/or alcohol use if they provided any of the following information at the beginning of support or in any support period during the reporting period:
• their dwelling type was rehabilitation
• formal referral source to SHS was a drug and alcohol service
• during support they required drug/alcohol counselling
• they had been in a rehabilitation facility/institution in the last 12 months
• they had reported ‘problematic drug or substance abuse’ or ‘problematic alcohol use’ as a reason for seeking assistance or main reason for seeking assistance.
13
Who
see
ks h
elp
for
hom
eles
snes
s?
2
Couch surfers: a profile of Specialist Homelessness Services clients
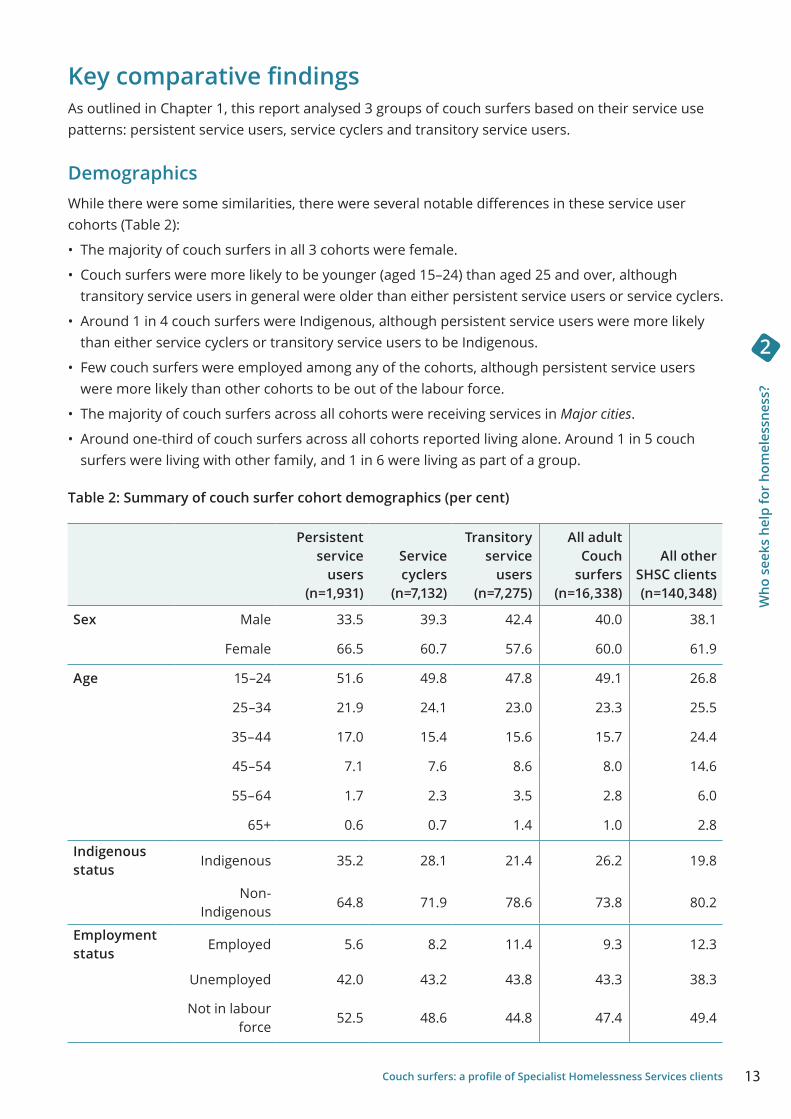
Key comparative findingsAs outlined in Chapter 1, this report analysed 3 groups of couch surfers based on their service use patterns: persistent service users, service cyclers and transitory service users.
DemographicsWhile there were some similarities, there were several notable differences in these service user cohorts (Table 2):
• The majority of couch surfers in all 3 cohorts were female.
• Couch surfers were more likely to be younger (aged 15–24) than aged 25 and over, although transitory service users in general were older than either persistent service users or service cyclers.
• Around 1 in 4 couch surfers were Indigenous, although persistent service users were more likely than either service cyclers or transitory service users to be Indigenous.
• Few couch surfers were employed among any of the cohorts, although persistent service users were more likely than other cohorts to be out of the labour force.
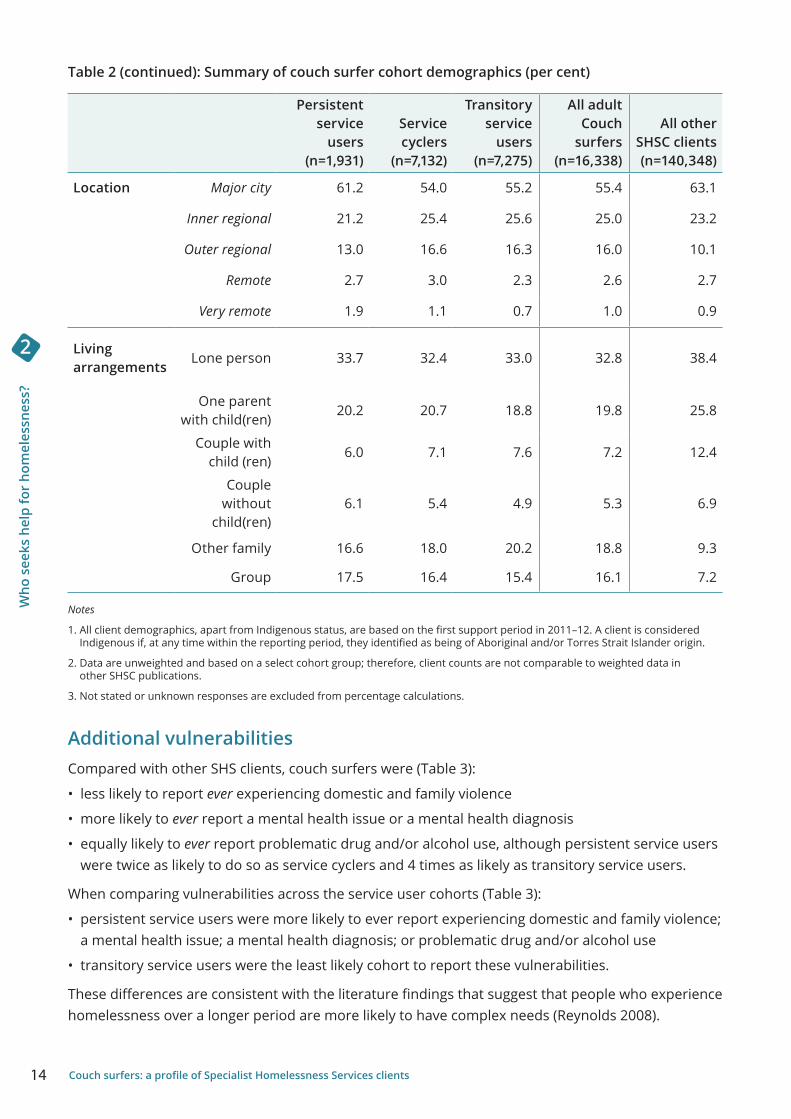
• The majority of couch surfers across all cohorts were receiving services in Major cities .
• Around one-third of couch surfers across all cohorts reported living alone. Around 1 in 5 couch surfers were living with other family, and 1 in 6 were living as part of a group.
Table 2: Summary of couch surfer cohort demographics (per cent)
Persistent service
users (n=1,931)
Service cyclers
(n=7,132)
Transitory service
users (n=7,275)
All adult Couch
surfers (n=16,338)
All other SHSC clients (n=140,348)
Sex Male 33 .5 39 .3 42 .4 40 .0 38 .1
Female 66 .5 60 .7 57 .6 60 .0 61 .9
Age 15–24 51 .6 49 .8 47 .8 49 .1 26 .8
25–34 21 .9 24 .1 23 .0 23 .3 25 .5
35–44 17 .0 15 .4 15 .6 15 .7 24 .4
45–54 7 .1 7 .6 8 .6 8 .0 14 .6
55–64 1 .7 2 .3 3 .5 2 .8 6 .0
65+ 0 .6 0 .7 1 .4 1 .0 2 .8
Indigenous status
Indigenous 35 .2 28 .1 21 .4 26 .2 19 .8
Non-Indigenous
64 .8 71 .9 78 .6 73 .8 80 .2
Employment status
Employed 5 .6 8 .2 11 .4 9 .3 12 .3
Unemployed 42 .0 43 .2 43 .8 43 .3 38 .3
Not in labour force
52 .5 48 .6 44 .8 47 .4 49 .4
14
Who
see
ks h
elp
for
hom
eles
snes
s?
2
Couch surfers: a profile of Specialist Homelessness Services clients
Persistent service
users (n=1,931)
Service cyclers
(n=7,132)
Transitory service
users (n=7,275)
All adult Couch
surfers (n=16,338)
All other SHSC clients (n=140,348)
Location Major city 61 .2 54 .0 55 .2 55 .4 63 .1
Inner regional 21 .2 25 .4 25 .6 25 .0 23 .2
Outer regional 13 .0 16 .6 16 .3 16 .0 10 .1
Remote 2 .7 3 .0 2 .3 2 .6 2 .7
Very remote 1 .9 1 .1 0 .7 1 .0 0 .9
Living arrangements
Lone person 33 .7 32 .4 33 .0 32 .8 38 .4
One parent with child(ren)
20 .2 20 .7 18 .8 19 .8 25 .8
Couple with child (ren)
6 .0 7 .1 7 .6 7 .2 12 .4
Couple without
child(ren)6 .1 5 .4 4 .9 5 .3 6 .9
Other family 16 .6 18 .0 20 .2 18 .8 9 .3
Group 17 .5 16 .4 15 .4 16 .1 7 .2
Notes
1. All client demographics, apart from Indigenous status, are based on the first support period in 2011–12. A client is considered Indigenous if, at any time within the reporting period, they identified as being of Aboriginal and/or Torres Strait Islander origin.
2. Data are unweighted and based on a select cohort group; therefore, client counts are not comparable to weighted data in other SHSC publications.
3. Not stated or unknown responses are excluded from percentage calculations.
Additional vulnerabilitiesCompared with other SHS clients, couch surfers were (Table 3):
• less likely to report ever experiencing domestic and family violence
• more likely to ever report a mental health issue or a mental health diagnosis
• equally likely to ever report problematic drug and/or alcohol use, although persistent service users were twice as likely to do so as service cyclers and 4 times as likely as transitory service users.
When comparing vulnerabilities across the service user cohorts (Table 3):
• persistent service users were more likely to ever report experiencing domestic and family violence; a mental health issue; a mental health diagnosis; or problematic drug and/or alcohol use
• transitory service users were the least likely cohort to report these vulnerabilities.
These differences are consistent with the literature findings that suggest that people who experience homelessness over a longer period are more likely to have complex needs (Reynolds 2008).
Table 2 (continued): Summary of couch surfer cohort demographics (per cent)
15
Who
see
ks h
elp
for
hom
eles
snes
s?
2
Couch surfers: a profile of Specialist Homelessness Services clients
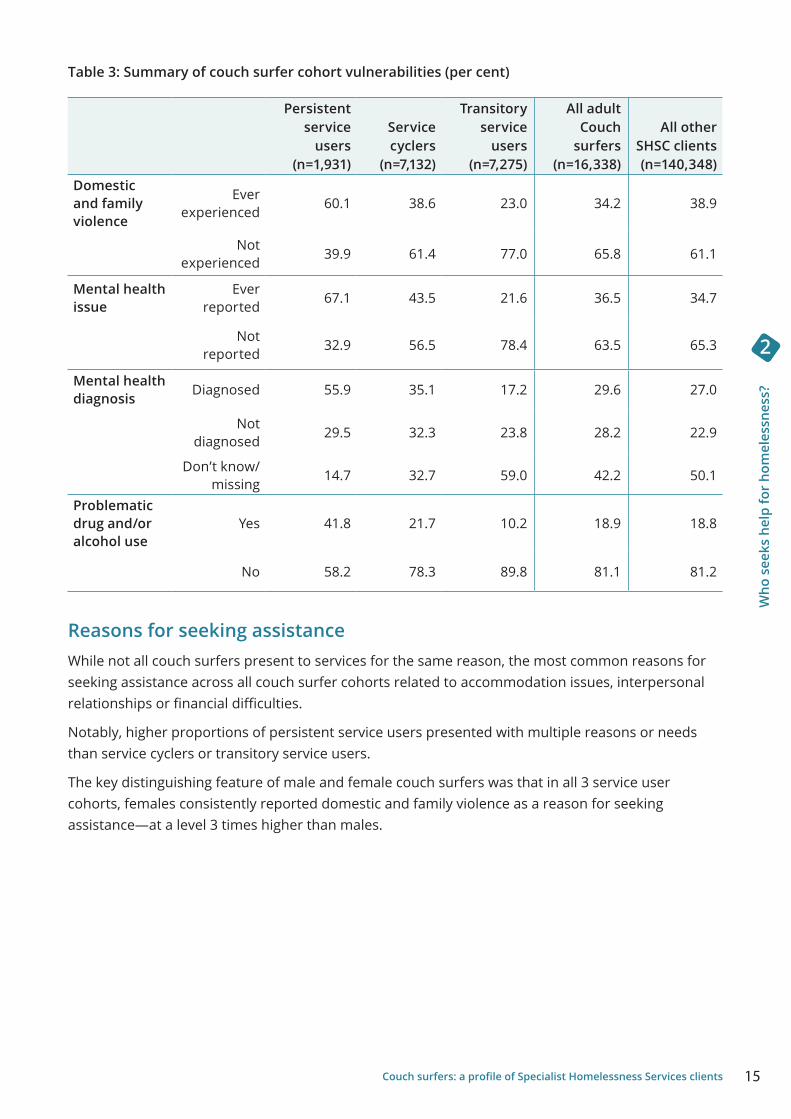
Table 3: Summary of couch surfer cohort vulnerabilities (per cent)
Persistent service
users (n=1,931)
Service cyclers
(n=7,132)
Transitory service
users (n=7,275)
All adult Couch
surfers (n=16,338)
All other SHSC clients (n=140,348)
Domestic and family violence
Ever experienced
60 .1 38 .6 23 .0 34 .2 38 .9
Not experienced
39 .9 61 .4 77 .0 65 .8 61 .1
Mental health issue
Ever reported
67 .1 43 .5 21 .6 36 .5 34 .7
Not reported
32 .9 56 .5 78 .4 63 .5 65 .3
Mental health diagnosis Diagnosed 55 .9 35 .1 17 .2 29 .6 27 .0
Not diagnosed
29 .5 32 .3 23 .8 28 .2 22 .9
Don’t know/ missing
14 .7 32 .7 59 .0 42 .2 50 .1
Problematic drug and/or alcohol use
Yes 41 .8 21 .7 10 .2 18 .9 18 .8
No 58 .2 78 .3 89 .8 81 .1 81 .2
Reasons for seeking assistanceWhile not all couch surfers present to services for the same reason, the most common reasons for seeking assistance across all couch surfer cohorts related to accommodation issues, interpersonal relationships or financial difficulties.
Notably, higher proportions of persistent service users presented with multiple reasons or needs than service cyclers or transitory service users.
The key distinguishing feature of male and female couch surfers was that in all 3 service user cohorts, females consistently reported domestic and family violence as a reason for seeking assistance—at a level 3 times higher than males.
16
Who
see
ks h
elp
for
hom
eles
snes
s?
2
Couch surfers: a profile of Specialist Homelessness Services clients
Service useService engagement across the study period was the underlying basis for the 3 cohort descriptions. Distinct differences across groups were evident:
• the majority of persistent service users (64%) received over 365 days of support across the 4-year period, with almost one-third of clients engaging with agencies 10 or more times
• more than one-third (35%) of service cyclers received up to 90 days of support over the 4-year period, with less frequent contact with agencies apparent (1–3 support periods only)
• almost half of all transitory service users received up to 7 days of support (48%).
The temporary nature of homelessness for the largest group of couch surfers—transitory service users who only appear in first year of the study, receive up to 7 days of support and have a low reporting of complex needs—suggests that some of these clients face relatively temporary issues with which SHS are able to assist or that they themselves are able to resolve. It is important to note for transitory service users the low percentage of clients housed at the end of support (18%), as well as the percentage of clients for whom housing outcomes are unknown (21%). Linkage to other data sets would greatly improve information on the outcomes for this homeless cohort.
The demand for accommodation services was high for all 3 service user cohorts. The common characteristic of these SHS clients was that they were couch surfing when they first presented in 2011–12. The rate of not getting any nights of accommodation increased with lowering service engagement: more than two-thirds (68%) of transitory service users did not receive any nights of accommodation compared with around 41% of service cyclers and 18% of persistent service users, despite needing accommodation services.
While accommodation services were supplied to a large proportion of couch surfers in some form, it is important to note that the largest gap in service delivery remains long-term housing solutions.
Housing outcomesHousing outcomes look at a client’s situation at the end of their last closed support period within the study period; that is, up to 30 June 2015 for persistent service users and service cyclers, and up to 30 June 2012 for transitory service users. Also of interest is repeat homelessness (where a client transitions from homeless to housed, then to homeless again). Overall, around 1 in 5 couch surfers (or almost 3,300 clients) experienced repeat episodes of homelessness. Persistent service users were the most likely to experience repeat homelessness; the frequency was higher for both Indigenous and younger clients (those aged 15–24).
Following engagement with agencies, one-third (33% or more than 5,400 clients) of couch surfers were housed. This was highest for persistent service users (48% or around 900 clients) and lowest for transitory service users (18% or 1,300 clients). Service cyclers (22% or almost 1,600 clients) and transitory service users (21% or around 1,500 clients) had the largest percentage of clients whose housing outcomes were unknown at the end of the reporting period compared with 14% of persistent service users (almost 300 clients).
One in 3 persistent service users (29%, or more than 550 clients) were in ongoing support at the end of the 4-year study period, consistent with their high frequency of engagement and high level of support (days of support). In contrast, just 6% of service cyclers remained in ongoing support at the end of the study (around 400 clients).
17Couch surfers: a profile of Specialist Homelessness Services clients
Pers
iste
nt s
ervi
ce u
sers
3
3 Persistent service users
Key findings
Persistent service users are those clients who had at least 1 support period in each financial year between 1 July 2011 and 30 June 2015. This cohort comprised more than 1,900 clients and was the smallest of the 3 cohorts.
Consistent with the broader group of couch surfers:
• the majority of persistent service users were female. Most persistent service users were aged 15–24. The majority received services in Major cities and one-third reported they were living alone
• the most common reasons for seeking assistance were related to accommodation issues, interpersonal relationships or financial difficulties. Younger clients (aged 15–24) were more likely to report these reasons than those clients aged 25 and over
• persistent service users were most likely to receive short-term or emergency accommodation rather than medium- or long-term accommodation. Females were more likely to receive medium- or long-term accommodation than males
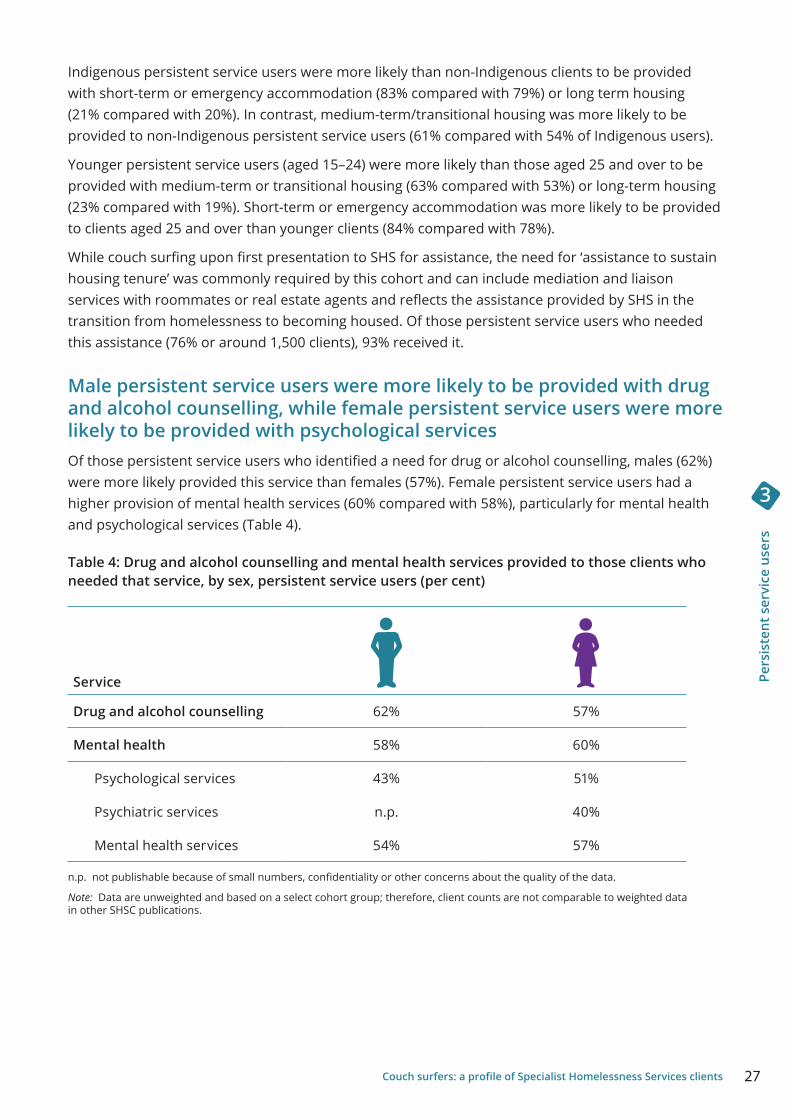
• male persistent service users (compared with females) were more likely to receive drug and alcohol services, while females (compared with males) were more likely to receive mental health services.
Persistent service users, when compared with service cyclers and transitory service users, were more likely to:
• ever experience a mental health issue
• experience 2 or 3 of the 3 vulnerability conditions (domestic and family violence, mental health issue, and/or problematic drug and/or alcohol use)
• receive some form of accommodation, and have greater numbers of support periods per person, over the study period
• experience repeat episodes of homelessness.
In 2011–12, all clients were experiencing homelessness. By 2014–15, almost half (48%) of persistent service users were housed. More than one-third (38%) of persistent service users were experiencing homelessness, including 1 in 5 (21%) living in short-term or emergency accommodation, 5% rough sleeping and 12% couch surfing, while the housing situation of more than 1 in 10 (14%) was unknown.
Who are persistent service users?There were around 1,900 persistent service users in 2011–12. Persistent service users presented to SHS agencies for assistance in each year of the reporting period (2011–12 to 2014–15). That is, they presented to an agency for assistance at least once between 1 July 2011 and 30 June 2012, 1 July 2012 and 30 June 2013, 1 July 2013 and 30 June 2014, and 1 July 2014 and 30 June 2015. It is important to note that some of these clients may have received assistance prior to 1 July 2011 and may have continued receiving assistance beyond 30 June 2015.
18 Couch surfers: a profile of Specialist Homelessness Services clients
Pers
iste
nt s
ervi
ce u
sers
3
Notes
1. Percentages may not always add to 100 due to rounding.
2. All client demographics, except for Indigenous status, are based on the first support period in 2011–12. A client is considered Indigenous if, at any time within the reporting period, they identified as being of Aboriginal and/or Torres Strait Islander origin.
3. For further information on ever reporting experiencing domestic or family violence, ever reporting a mental health issue or ever reporting problematic drug and/or alcohol use, please see Box 1.
4. Data are unweighted and based on a select cohort group; therefore, client counts are not comparable to weighted data in other SHSC publications.
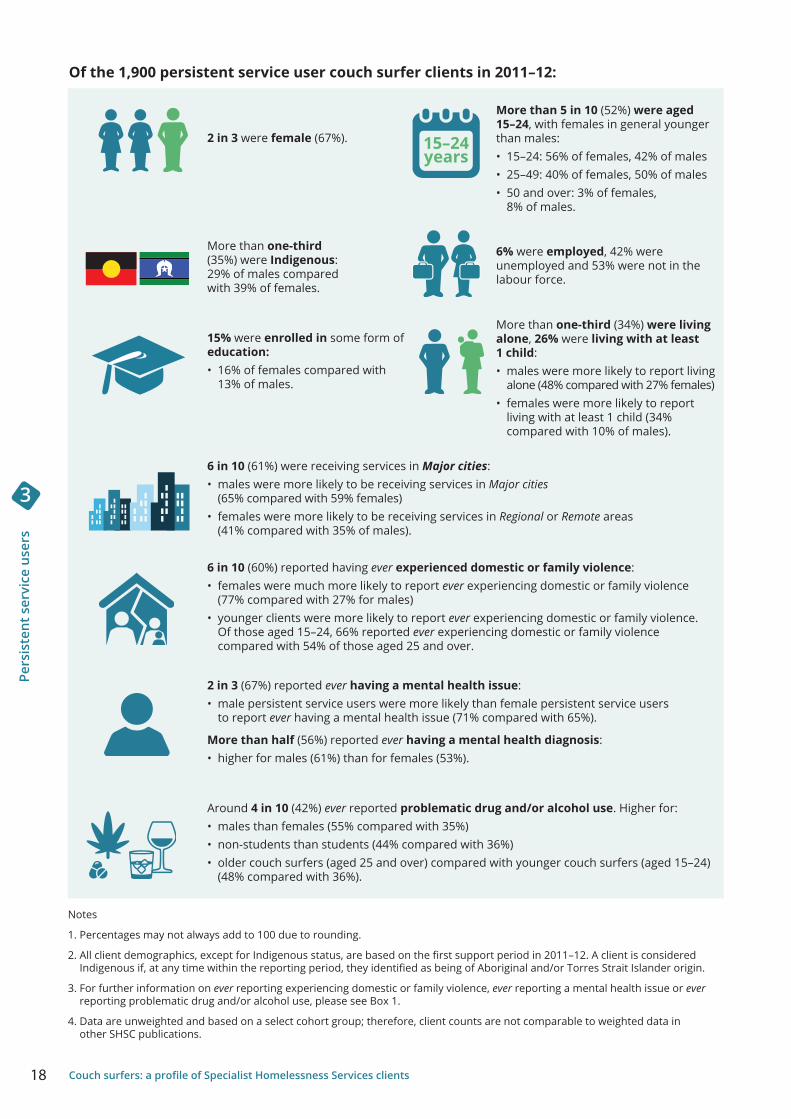
Around 4 in 10 (42%) ever reported problematic drug and/or alcohol use. Higher for: • males than females (55% compared with 35%)• non-students than students (44% compared with 36%)• older couch surfers (aged 25 and over) compared with younger couch surfers (aged 15–24)
(48% compared with 36%).
2 in 3 were female (67%).
More than 5 in 10 (52%) were aged 15–24, with females in general younger than males:• 15–24: 56% of females, 42% of males • 25–49: 40% of females, 50% of males• 50 and over: 3% of females,
8% of males.
More than one-third (35%) were Indigenous: 29% of males compared with 39% of females.
6% were employed, 42% were unemployed and 53% were not in the labour force.
15% were enrolled in some form of education:• 16% of females compared with
13% of males.
More than one-third (34%) were living alone, 26% were living with at least 1 child:• males were more likely to report living
alone (48% compared with 27% females)• females were more likely to report
living with at least 1 child (34% compared with 10% of males).
6 in 10 (60%) reported having ever experienced domestic or family violence: • females were much more likely to report ever experiencing domestic or family violence
(77% compared with 27% for males)• younger clients were more likely to report ever experiencing domestic or family violence.
Of those aged 15–24, 66% reported ever experiencing domestic or family violence compared with 54% of those aged 25 and over.
2 in 3 (67%) reported ever having a mental health issue:• male persistent service users were more likely than female persistent service users
to report ever having a mental health issue (71% compared with 65%).
More than half (56%) reported ever having a mental health diagnosis:• higher for males (61%) than for females (53%).
15–24years
6 in 10 (61%) were receiving services in Major cities:• males were more likely to be receiving services in Major cities
(65% compared with 59% females)• females were more likely to be receiving services in Regional or Remote areas
(41% compared with 35% of males).
Of the 1,900 persistent service user couch surfer clients in 2011–12:
19Couch surfers: a profile of Specialist Homelessness Services clients
Pers
iste
nt s
ervi
ce u
sers
3
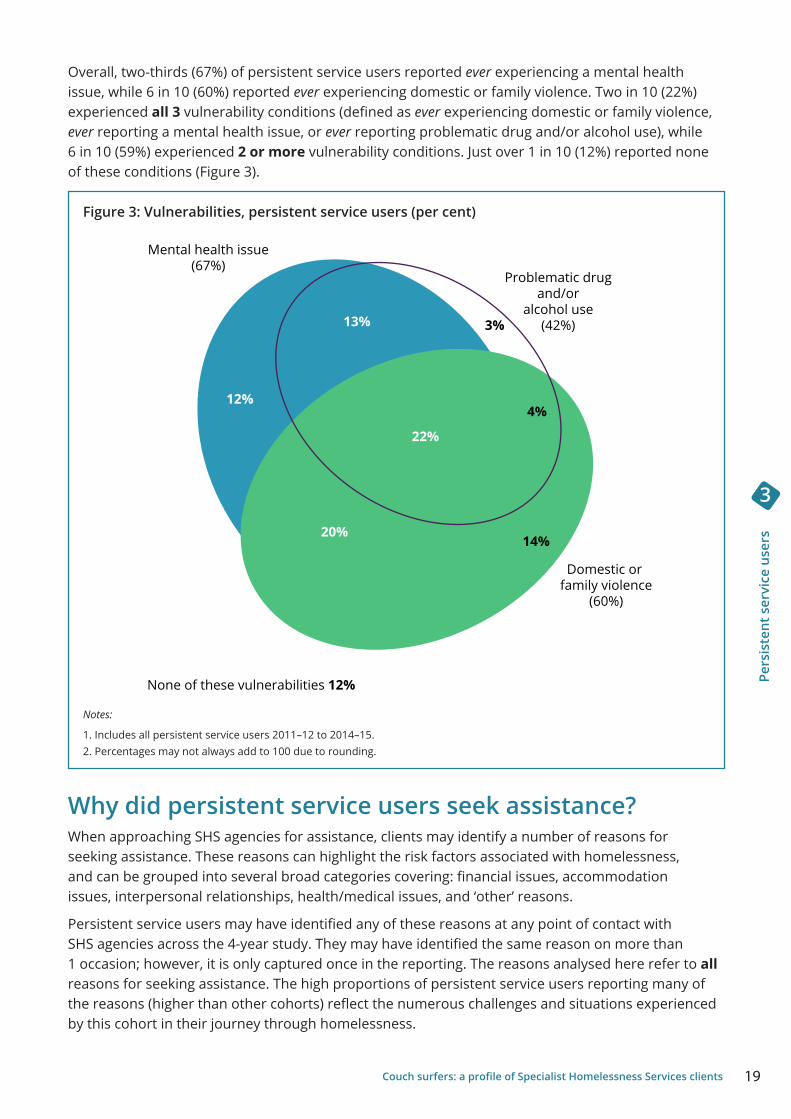
Overall, two-thirds (67%) of persistent service users reported ever experiencing a mental health issue, while 6 in 10 (60%) reported ever experiencing domestic or family violence. Two in 10 (22%) experienced all 3 vulnerability conditions (defined as ever experiencing domestic or family violence, ever reporting a mental health issue, or ever reporting problematic drug and/or alcohol use), while 6 in 10 (59%) experienced 2 or more vulnerability conditions. Just over 1 in 10 (12%) reported none of these conditions (Figure 3).
Figure 3: Vulnerabilities, persistent service users (per cent)
Notes:
1. Includes all persistent service users 2011–12 to 2014–15.2. Percentages may not always add to 100 due to rounding.
Why did persistent service users seek assistance?When approaching SHS agencies for assistance, clients may identify a number of reasons for seeking assistance. These reasons can highlight the risk factors associated with homelessness, and can be grouped into several broad categories covering: financial issues, accommodation issues, interpersonal relationships, health/medical issues, and ‘other’ reasons.
Persistent service users may have identified any of these reasons at any point of contact with SHS agencies across the 4-year study. They may have identified the same reason on more than 1 occasion; however, it is only captured once in the reporting. The reasons analysed here refer to all reasons for seeking assistance. The high proportions of persistent service users reporting many of the reasons (higher than other cohorts) reflect the numerous challenges and situations experienced by this cohort in their journey through homelessness.
None of these vulnerabilities 12%
Mental health issue(67%)
Domestic or family violence
(60%)
Problematic drugand/or
alcohol use(42%)
4%
22%
20%
13% 3%
14%
12%
20 Couch surfers: a profile of Specialist Homelessness Services clients
Pers
iste
nt s
ervi
ce u
sers
3
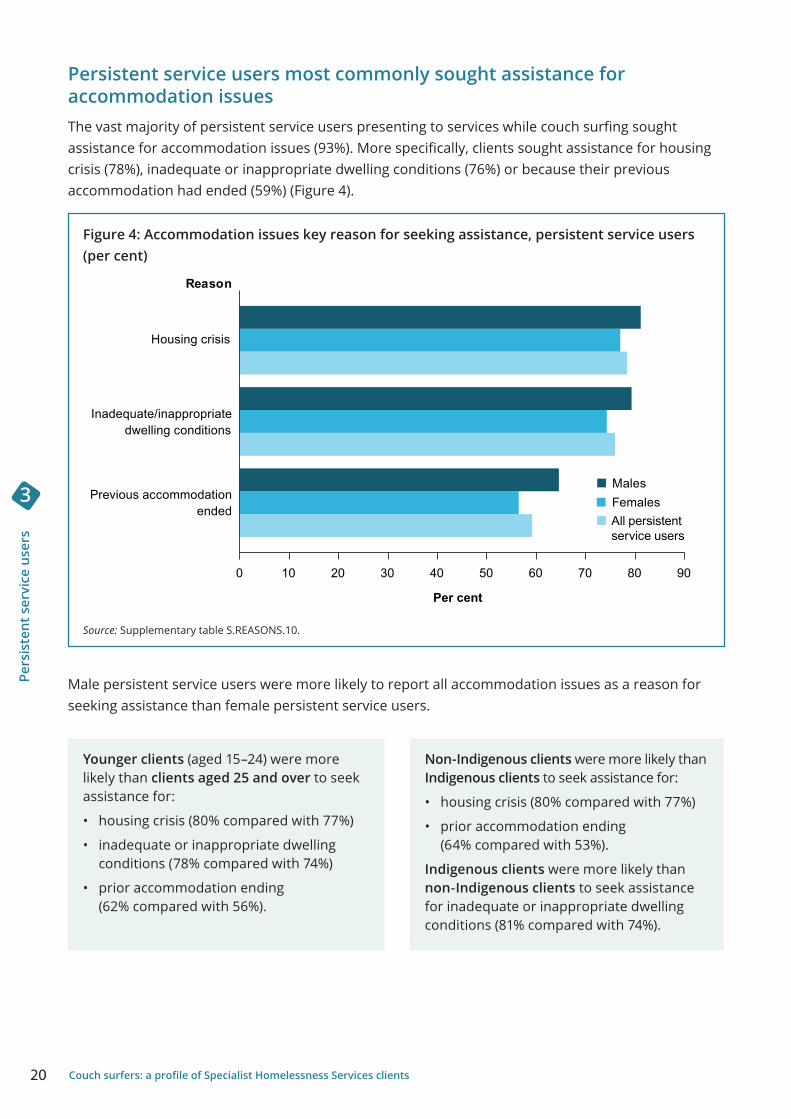
Persistent service users most commonly sought assistance for accommodation issuesThe vast majority of persistent service users presenting to services while couch surfing sought assistance for accommodation issues (93%). More specifically, clients sought assistance for housing crisis (78%), inadequate or inappropriate dwelling conditions (76%) or because their previous accommodation had ended (59%) (Figure 4).
Figure 4: Accommodation issues key reason for seeking assistance, persistent service users (per cent)
Source: Supplementary table S.REASONS.10.
Male persistent service users were more likely to report all accommodation issues as a reason for seeking assistance than female persistent service users.
Younger clients (aged 15–24) were more likely than clients aged 25 and over to seek assistance for:
• housing crisis (80% compared with 77%)
• inadequate or inappropriate dwelling conditions (78% compared with 74%)
• prior accommodation ending (62% compared with 56%).
Non-Indigenous clients were more likely than Indigenous clients to seek assistance for:
• housing crisis (80% compared with 77%)
• prior accommodation ending (64% compared with 53%).
Indigenous clients were more likely than non-Indigenous clients to seek assistance for inadequate or inappropriate dwelling conditions (81% compared with 74%).
endedPrevious accommodation
dwelling conditionsInadequate/inappropriate
Housing crisis
All persistentservice users
FemalesMales
Reason
0 10 20 30 40 50 60 70 80 90
Per cent
21Couch surfers: a profile of Specialist Homelessness Services clients
Pers
iste
nt s
ervi
ce u
sers
3
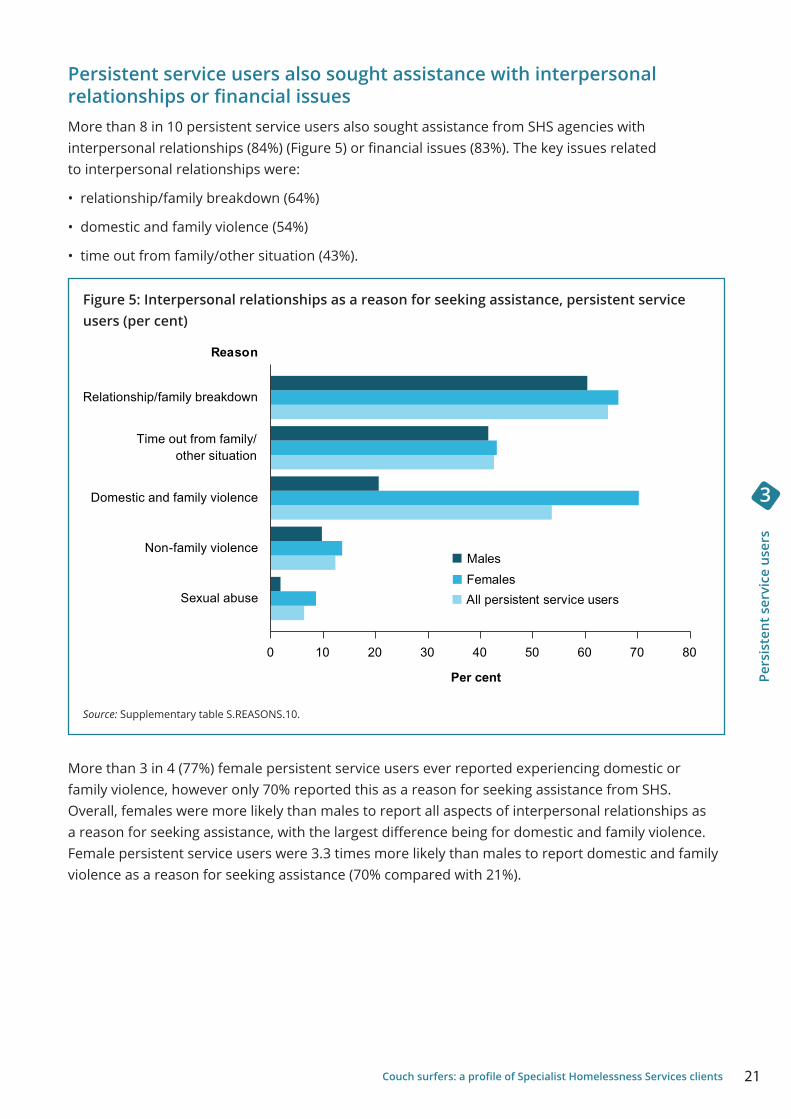
Persistent service users also sought assistance with interpersonal relationships or financial issuesMore than 8 in 10 persistent service users also sought assistance from SHS agencies with interpersonal relationships (84%) (Figure 5) or financial issues (83%). The key issues related to interpersonal relationships were:
• relationship/family breakdown (64%)
• domestic and family violence (54%)
• time out from family/other situation (43%).
Figure 5: Interpersonal relationships as a reason for seeking assistance, persistent service users (per cent)
Source: Supplementary table S.REASONS.10.
More than 3 in 4 (77%) female persistent service users ever reported experiencing domestic or family violence, however only 70% reported this as a reason for seeking assistance from SHS. Overall, females were more likely than males to report all aspects of interpersonal relationships as a reason for seeking assistance, with the largest difference being for domestic and family violence. Female persistent service users were 3.3 times more likely than males to report domestic and family violence as a reason for seeking assistance (70% compared with 21%).
Sexual abuse
Non-family violence
Domestic and family violence
other situationTime out from family/
Relationship/family breakdown
All persistent service usersFemalesMales
Reason
0 10 20 30 40 50 60 70 80
Per cent
22 Couch surfers: a profile of Specialist Homelessness Services clients
Pers
iste
nt s
ervi
ce u
sers
3
Young clients (aged 15–24) were more likely than clients aged 25 and over to seek assistance for most aspects of interpersonal relationships:
• relationship/family breakdown (73% compared with 55%)
• domestic and family violence (57% compared with 50%)
• time out from family/other situation (50% compared with 35%)
Young clients were equally likely as clients aged 25 and over to seek assistance for non-family violence (11% compared with 13%).
Indigenous clients were more likely than non-Indigenous clients to seek assistance for:
• domestic and family violence (60% compared with 50%)
• time out from family/other situation (47% compared with 41%).
Non-Indigenous clients were more likely than Indigenous clients to seek assistance for relationship/family breakdown (67% compared with 61%).
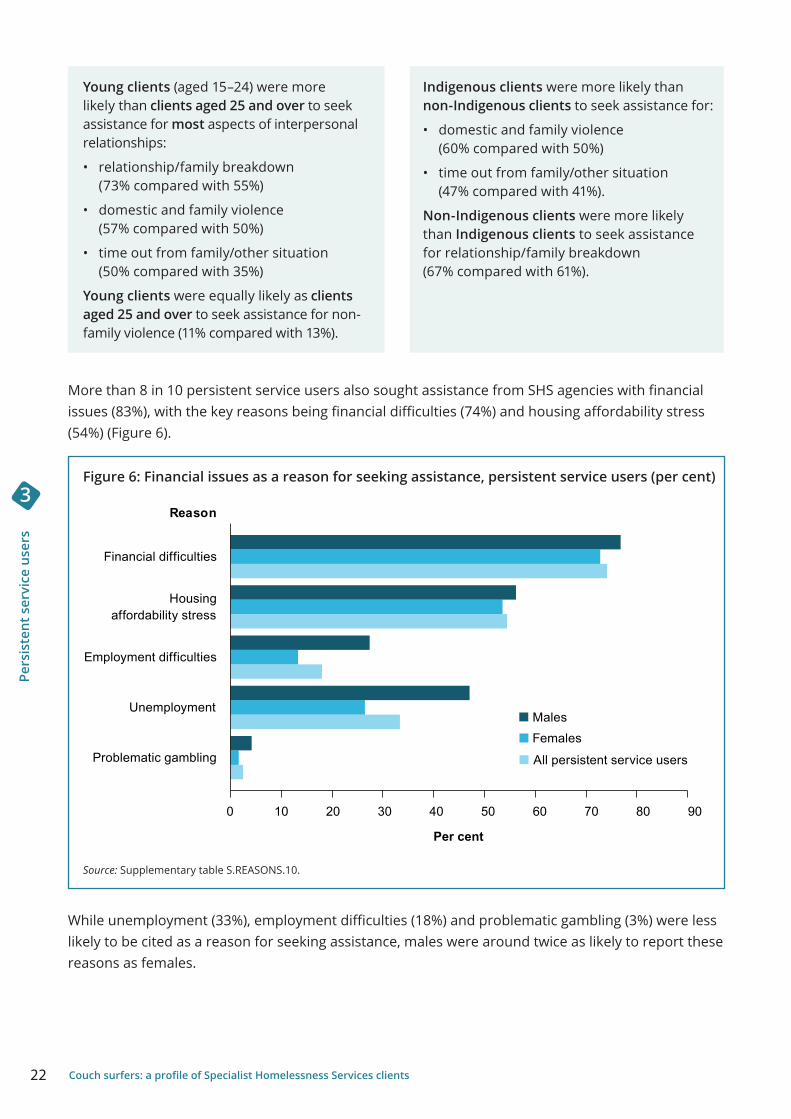
More than 8 in 10 persistent service users also sought assistance from SHS agencies with financial issues (83%), with the key reasons being financial difficulties (74%) and housing affordability stress (54%) (Figure 6).
Figure 6: Financial issues as a reason for seeking assistance, persistent service users (per cent)
Source: Supplementary table S.REASONS.10.
While unemployment (33%), employment difficulties (18%) and problematic gambling (3%) were less likely to be cited as a reason for seeking assistance, males were around twice as likely to report these reasons as females.
Problematic gambling
Unemployment
Employment difficulties
affordability stressHousing
Financial difficulties
Reason
All persistent service users
FemalesMales
0 10 20 30 40 50 60 70 80 90
Per cent
23Couch surfers: a profile of Specialist Homelessness Services clients
Pers
iste
nt s
ervi
ce u
sers
3
Younger clients (aged 15–24) were more likely than clients aged 25 and over to seek assistance for:
• housing affordability stress (58% compared with 50%)
• unemployment (37% compared with 29%)
• employment difficulties (21% compared with 15%).
Clients aged 25 and over were more likely than younger clients to seek assistance for financial difficulties (75% compared with 73%).
Non-Indigenous clients were more likely than Indigenous clients to seek assistance for:
• financial difficulties (78% compared with 69%)
• housing affordability stress (56% compared with 53%)
• employment difficulties (20% compared with 15%)
• unemployment (35% compared with 32%).
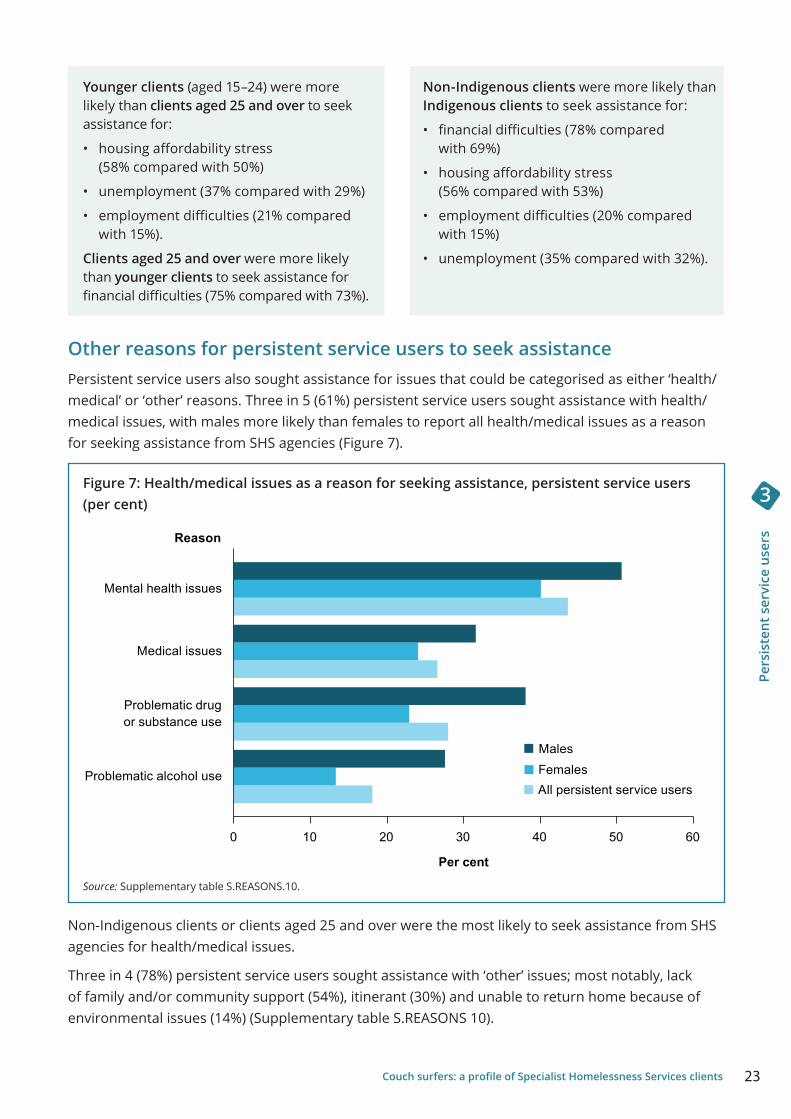
Other reasons for persistent service users to seek assistancePersistent service users also sought assistance for issues that could be categorised as either ‘health/medical’ or ‘other’ reasons. Three in 5 (61%) persistent service users sought assistance with health/medical issues, with males more likely than females to report all health/medical issues as a reason for seeking assistance from SHS agencies (Figure 7).
Figure 7: Health/medical issues as a reason for seeking assistance, persistent service users (per cent)
Source: Supplementary table S.REASONS.10.
Non-Indigenous clients or clients aged 25 and over were the most likely to seek assistance from SHS agencies for health/medical issues.
Three in 4 (78%) persistent service users sought assistance with ‘other’ issues; most notably, lack of family and/or community support (54%), itinerant (30%) and unable to return home because of environmental issues (14%) (Supplementary table S.REASONS 10).
Problematic alcohol use
or substance useProblematic drug
Medical issues
Mental health issues
Reason
All persistent service usersFemalesMales
0 10 20 30 40 50 60
Per cent
24 Couch surfers: a profile of Specialist Homelessness Services clients
Pers
iste
nt s
ervi
ce u
sers
3
What services did persistent service users need?While the focus of SHS support is on providing stable housing or assisting clients to remain housed, agencies provide or refer clients to many other services targeting underlying barriers to sustainable housing. These services range from basic support and assistance, such as meals, shower facilities, laundry and transport, through to more complex and specialist services, such as health and medical services and professional or legal services.
Persistent service users presented to SHS agencies at least once in each financial year of the reporting period (2011–15) and may have reported multiple needs in each support period, or the same need may have been presented on multiple occasions.
Persistent service users are highly likely to need accommodation provisionAccommodation was the service and assistance type most commonly requested by persistent service users, with almost all clients (95%) needing this service. Long-term housing was most commonly requested (79%), followed by short-term or emergency accommodation (77%) and medium-term or transitional housing (75%).
While there was little difference overall between males and females, males were slightly more likely to need short-term or emergency accommodation (80% compared with 76%) or long-term housing (80% compared with 78%). In comparison, males and females were equally likely to need medium-term or transitional housing (76% compared with 75%).
Younger clients (aged 15–24) were more likely to need assistance with accommodation than clients aged 25 and over. Medium-term or transitional housing was requested most frequently by younger clients (81% compared with 69%), followed by long-term housing (80% compared with 77%) and short-term or emergency housing (both at 77%).
Persistent service users are also likely to need ‘general services’ Virtually all clients (1,930 out of 1,931) needed at least 1 ‘general service’; For persistent service users, the most common of these were advice/information (100%), ‘other’ basic assistance (98%), advocacy/liaison (96%) and material aid/brokerage (84%). More than 7 in 10 clients also needed transport (75%) and financial information (71%).
In general, males were more likely than females to need:
• meals (60% compared with 52%)
• laundry/shower facilities (51% compared with 42%)
• recreation facilities (47% compared with 42%)
• employment assistance (37% compared with 30%).
In comparison, females were more likely than males to need:
• transport (77% compared with 71%)
• general financial information (75% compared with 65%)
• family/relationship assistance (63% compared with 45%)
• legal information (53% compared with 37%).
25Couch surfers: a profile of Specialist Homelessness Services clients
Pers
iste
nt s
ervi
ce u
sers
3
Indigenous persistent service users were more likely than non-Indigenous clients to need assistance for domestic/family violence (53% compared with 44%), meals (61% compared with 52%), laundry/shower facilities (50% compared with 43%) and transport (80% compared with 72%).
Persistent service users aged 15–24 were more likely than those aged 25 and over to need assistance with most ‘general services’. Key differences between these age groups were for those needing assistance with:
• living skills/personal development (71% compared with 54%)
• family/relationships (66% compared with 47%)
• education (51% compared with 24%)
• training (39% compared with 16%)
• employment (42% compared with 22%).
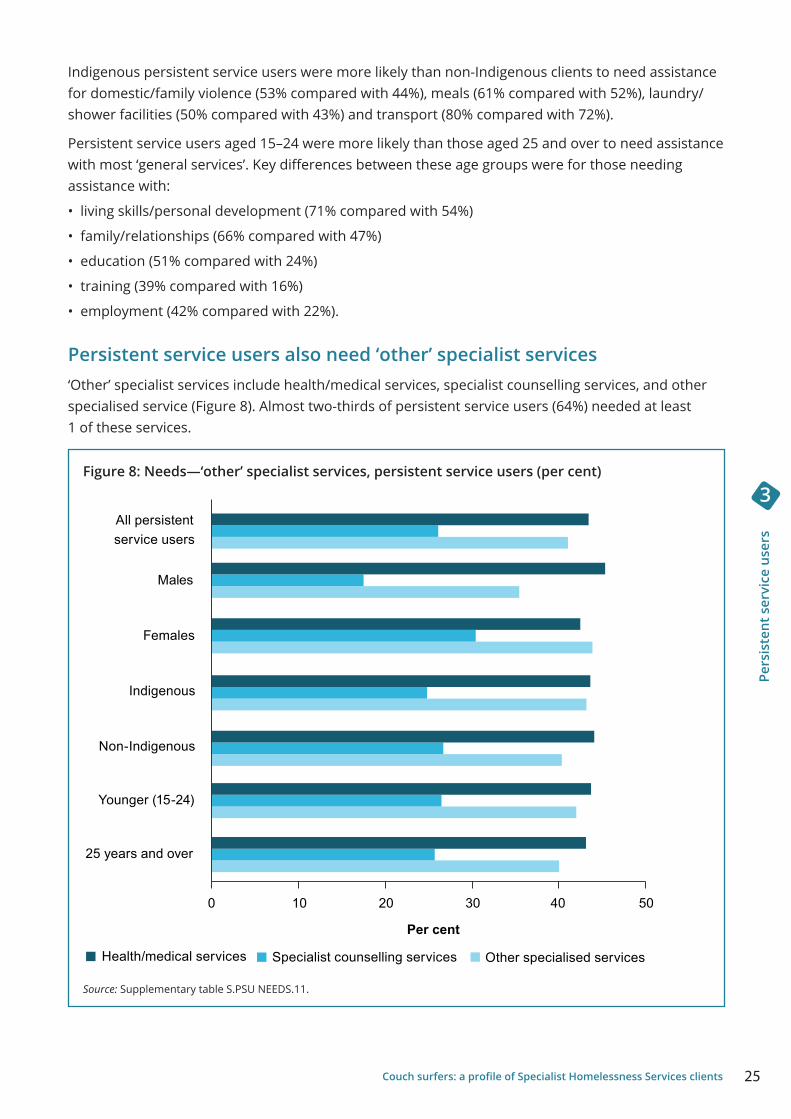
Persistent service users also need ‘other’ specialist services ‘Other’ specialist services include health/medical services, specialist counselling services, and other specialised service (Figure 8). Almost two-thirds of persistent service users (64%) needed at least 1 of these services.
Figure 8: Needs—‘other’ specialist services, persistent service users (per cent)
Source: Supplementary table S.PSU NEEDS.11.
25 years and over
Younger (15-24)
Non-Indigenous
Indigenous
Females
Males
service usersAll persistent
Other specialised servicesSpecialist counselling servicesHealth/medical services
0 10 20 30 40 50
Per cent
26 Couch surfers: a profile of Specialist Homelessness Services clients
Pers
iste
nt s
ervi
ce u
sers
3
Male persistent service users were more likely than female persistent service users to require assistance with health/medical services (45% compared with 43%).
Female persistent service users were more likely than males to require specialist counselling services (30% compared with 18%) and other specialised services (44% compared with 35%).
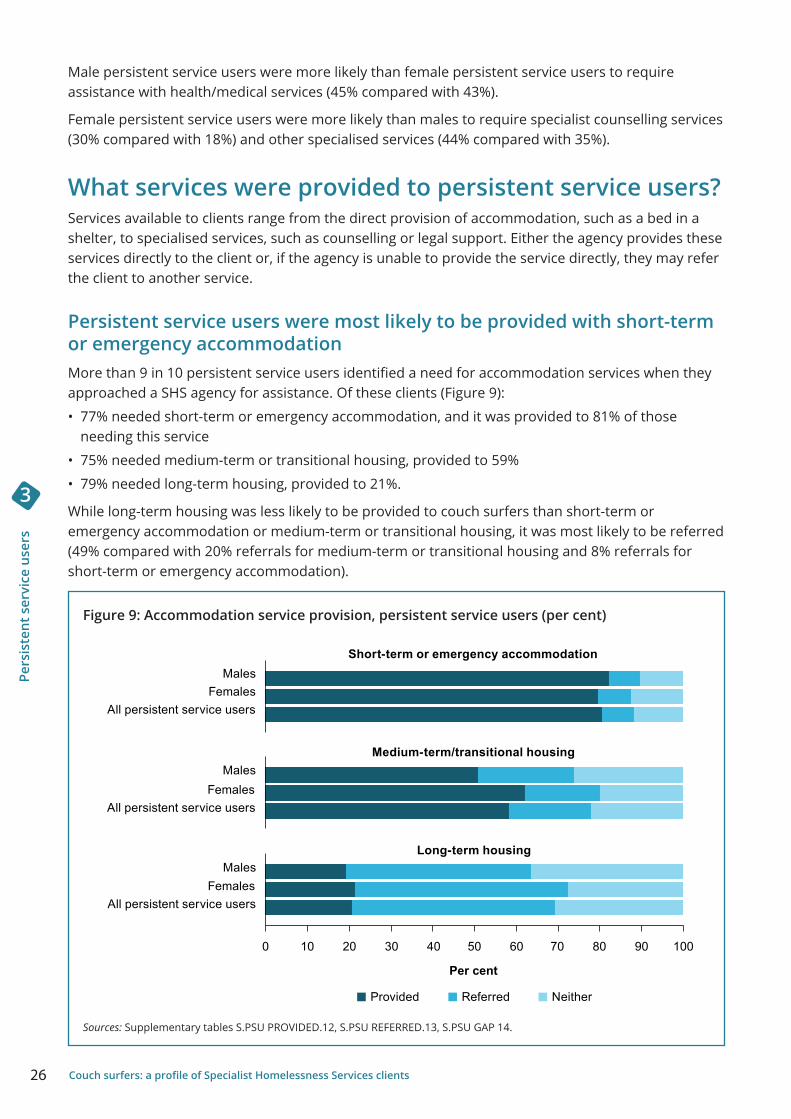
What services were provided to persistent service users?Services available to clients range from the direct provision of accommodation, such as a bed in a shelter, to specialised services, such as counselling or legal support. Either the agency provides these services directly to the client or, if the agency is unable to provide the service directly, they may refer the client to another service.
Persistent service users were most likely to be provided with short-term or emergency accommodationMore than 9 in 10 persistent service users identified a need for accommodation services when they approached a SHS agency for assistance. Of these clients (Figure 9):
• 77% needed short-term or emergency accommodation, and it was provided to 81% of those needing this service
• 75% needed medium-term or transitional housing, provided to 59%
• 79% needed long-term housing, provided to 21%.
While long-term housing was less likely to be provided to couch surfers than short-term or emergency accommodation or medium-term or transitional housing, it was most likely to be referred (49% compared with 20% referrals for medium-term or transitional housing and 8% referrals for short-term or emergency accommodation).
Figure 9: Accommodation service provision, persistent service users (per cent)
Sources: Supplementary tables S.PSU PROVIDED.12, S.PSU REFERRED.13, S.PSU GAP 14.
NeitherReferredProvided
Long-term housing
Medium-term/transitional housing
Short-term or emergency accommodation
All persistent service usersFemales
Males
All persistent service usersFemales
Males
All persistent service usersFemales
Males
0 10 20 30 40 50 60 70 80 90 100
Per cent
27Couch surfers: a profile of Specialist Homelessness Services clients
Pers
iste
nt s
ervi
ce u
sers
3
Indigenous persistent service users were more likely than non-Indigenous clients to be provided with short-term or emergency accommodation (83% compared with 79%) or long term housing (21% compared with 20%). In contrast, medium-term/transitional housing was more likely to be provided to non-Indigenous persistent service users (61% compared with 54% of Indigenous users).
Younger persistent service users (aged 15–24) were more likely than those aged 25 and over to be provided with medium-term or transitional housing (63% compared with 53%) or long-term housing (23% compared with 19%). Short-term or emergency accommodation was more likely to be provided to clients aged 25 and over than younger clients (84% compared with 78%).
While couch surfing upon first presentation to SHS for assistance, the need for ‘assistance to sustain housing tenure’ was commonly required by this cohort and can include mediation and liaison services with roommates or real estate agents and reflects the assistance provided by SHS in the transition from homelessness to becoming housed. Of those persistent service users who needed this assistance (76% or around 1,500 clients), 93% received it.
Male persistent service users were more likely to be provided with drug and alcohol counselling, while female persistent service users were more likely to be provided with psychological services Of those persistent service users who identified a need for drug or alcohol counselling, males (62%) were more likely provided this service than females (57%). Female persistent service users had a higher provision of mental health services (60% compared with 58%), particularly for mental health and psychological services (Table 4).
Table 4: Drug and alcohol counselling and mental health services provided to those clients who needed that service, by sex, persistent service users (per cent)
Service
Drug and alcohol counselling 62% 57%
Mental health 58% 60%
Psychological services 43% 51%
Psychiatric services n.p. 40%
Mental health services 54% 57%
n.p. not publishable because of small numbers, confidentiality or other concerns about the quality of the data.
Note: Data are unweighted and based on a select cohort group; therefore, client counts are not comparable to weighted data in other SHSC publications.
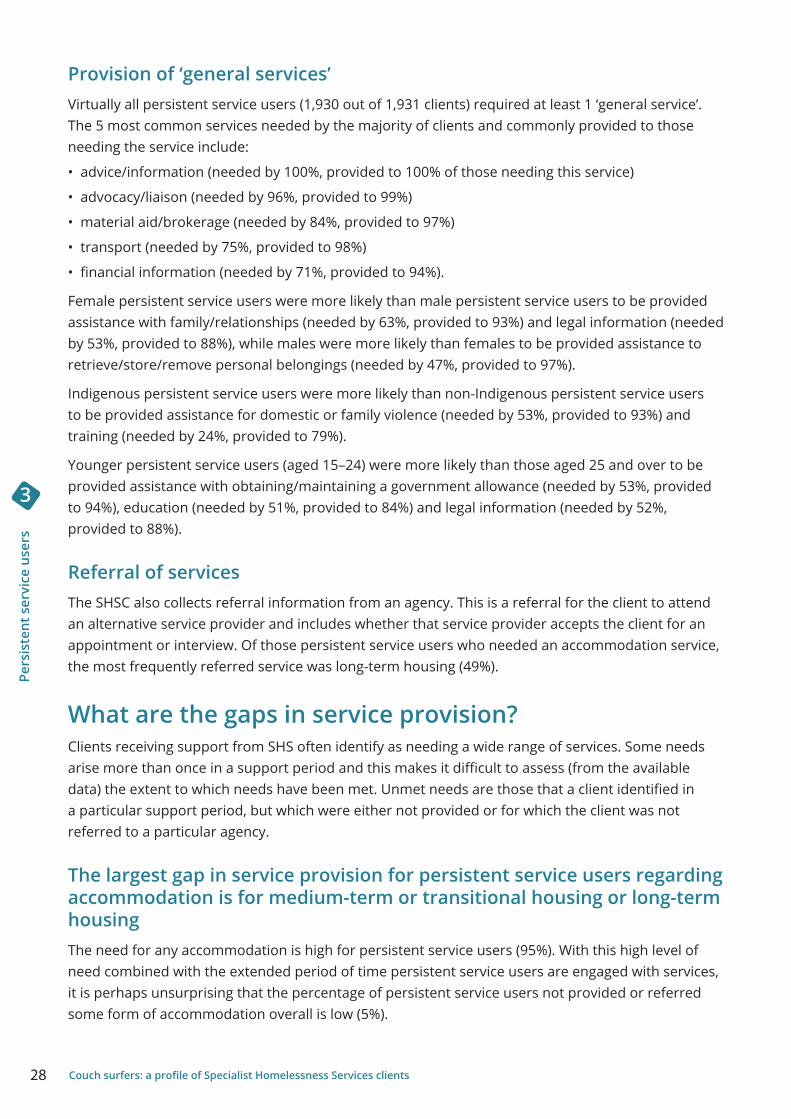
28 Couch surfers: a profile of Specialist Homelessness Services clients
Pers
iste
nt s
ervi
ce u
sers
3
Provision of ‘general services’Virtually all persistent service users (1,930 out of 1,931 clients) required at least 1 ‘general service’. The 5 most common services needed by the majority of clients and commonly provided to those needing the service include:
• advice/information (needed by 100%, provided to 100% of those needing this service)
• advocacy/liaison (needed by 96%, provided to 99%)
• material aid/brokerage (needed by 84%, provided to 97%)
• transport (needed by 75%, provided to 98%)
• financial information (needed by 71%, provided to 94%).
Female persistent service users were more likely than male persistent service users to be provided assistance with family/relationships (needed by 63%, provided to 93%) and legal information (needed by 53%, provided to 88%), while males were more likely than females to be provided assistance to retrieve/store/remove personal belongings (needed by 47%, provided to 97%).
Indigenous persistent service users were more likely than non-Indigenous persistent service users to be provided assistance for domestic or family violence (needed by 53%, provided to 93%) and training (needed by 24%, provided to 79%).
Younger persistent service users (aged 15–24) were more likely than those aged 25 and over to be provided assistance with obtaining/maintaining a government allowance (needed by 53%, provided to 94%), education (needed by 51%, provided to 84%) and legal information (needed by 52%, provided to 88%).
Referral of servicesThe SHSC also collects referral information from an agency. This is a referral for the client to attend an alternative service provider and includes whether that service provider accepts the client for an appointment or interview. Of those persistent service users who needed an accommodation service, the most frequently referred service was long-term housing (49%).
What are the gaps in service provision?Clients receiving support from SHS often identify as needing a wide range of services. Some needs arise more than once in a support period and this makes it difficult to assess (from the available data) the extent to which needs have been met. Unmet needs are those that a client identified in a particular support period, but which were either not provided or for which the client was not referred to a particular agency.
The largest gap in service provision for persistent service users regarding accommodation is for medium-term or transitional housing or long-term housingThe need for any accommodation is high for persistent service users (95%). With this high level of need combined with the extended period of time persistent service users are engaged with services, it is perhaps unsurprising that the percentage of persistent service users not provided or referred some form of accommodation overall is low (5%).
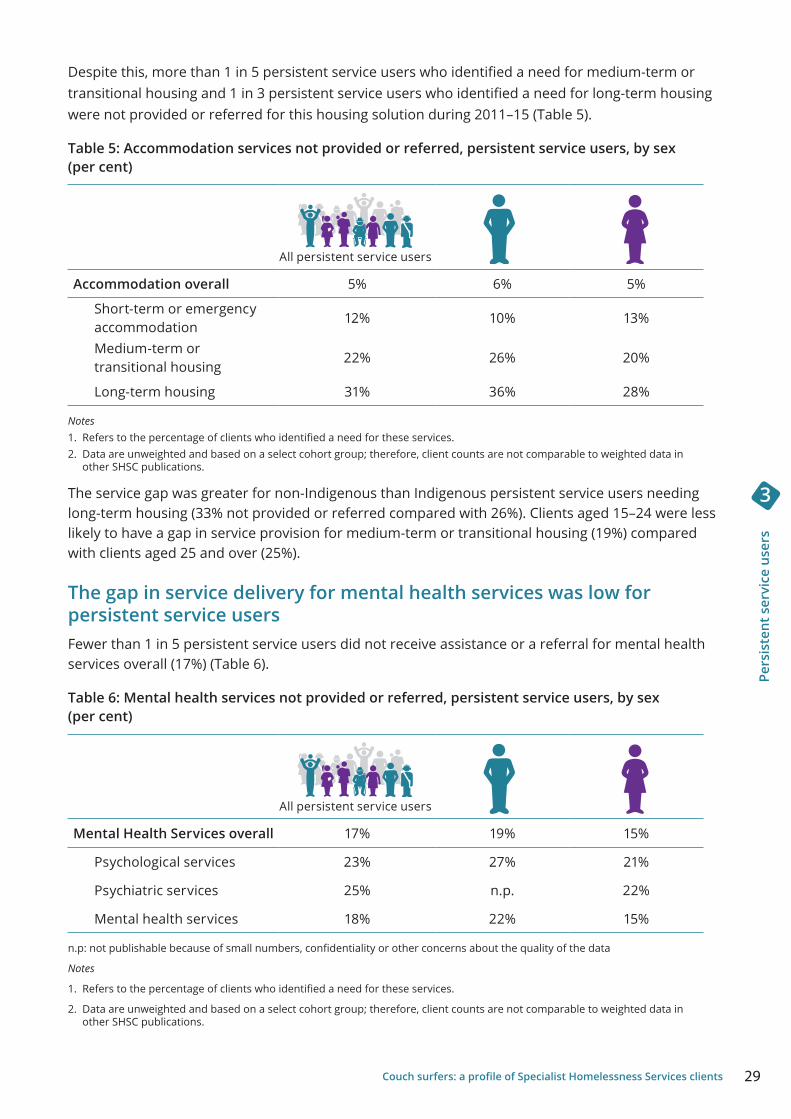
29Couch surfers: a profile of Specialist Homelessness Services clients
Pers
iste
nt s
ervi
ce u
sers
3
Despite this, more than 1 in 5 persistent service users who identified a need for medium-term or transitional housing and 1 in 3 persistent service users who identified a need for long-term housing were not provided or referred for this housing solution during 2011–15 (Table 5).
Table 5: Accommodation services not provided or referred, persistent service users, by sex (per cent)
Accommodation overall 5% 6% 5%
Short-term or emergency accommodation
12% 10% 13%
Medium-term or transitional housing
22% 26% 20%
Long-term housing 31% 36% 28%
Notes1. Refers to the percentage of clients who identified a need for these services. 2. Data are unweighted and based on a select cohort group; therefore, client counts are not comparable to weighted data in
other SHSC publications.
The service gap was greater for non-Indigenous than Indigenous persistent service users needing long-term housing (33% not provided or referred compared with 26%). Clients aged 15–24 were less likely to have a gap in service provision for medium-term or transitional housing (19%) compared with clients aged 25 and over (25%).
The gap in service delivery for mental health services was low for persistent service usersFewer than 1 in 5 persistent service users did not receive assistance or a referral for mental health services overall (17%) (Table 6).
Table 6: Mental health services not provided or referred, persistent service users, by sex (per cent)
Mental Health Services overall 17% 19% 15%
Psychological services 23% 27% 21%
Psychiatric services 25% n.p. 22%
Mental health services 18% 22% 15%
n.p: not publishable because of small numbers, confidentiality or other concerns about the quality of the data
Notes
1. Refers to the percentage of clients who identified a need for these services.
2. Data are unweighted and based on a select cohort group; therefore, client counts are not comparable to weighted data in other SHSC publications.
All persistent service users
All persistent service users
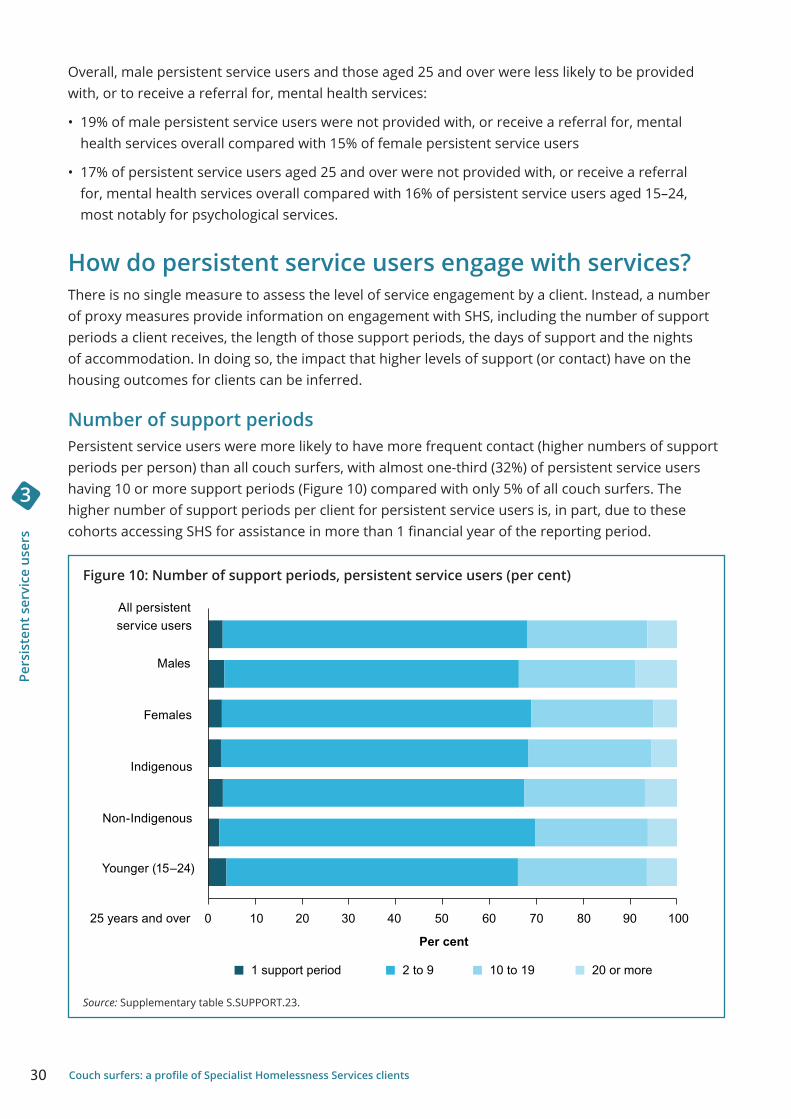
30 Couch surfers: a profile of Specialist Homelessness Services clients
Pers
iste
nt s
ervi
ce u
sers
3
Overall, male persistent service users and those aged 25 and over were less likely to be provided with, or to receive a referral for, mental health services:
• 19% of male persistent service users were not provided with, or receive a referral for, mental health services overall compared with 15% of female persistent service users
• 17% of persistent service users aged 25 and over were not provided with, or receive a referral for, mental health services overall compared with 16% of persistent service users aged 15–24, most notably for psychological services.
How do persistent service users engage with services?There is no single measure to assess the level of service engagement by a client. Instead, a number of proxy measures provide information on engagement with SHS, including the number of support periods a client receives, the length of those support periods, the days of support and the nights of accommodation. In doing so, the impact that higher levels of support (or contact) have on the housing outcomes for clients can be inferred.
Number of support periodsPersistent service users were more likely to have more frequent contact (higher numbers of support periods per person) than all couch surfers, with almost one-third (32%) of persistent service users having 10 or more support periods (Figure 10) compared with only 5% of all couch surfers. The higher number of support periods per client for persistent service users is, in part, due to these cohorts accessing SHS for assistance in more than 1 financial year of the reporting period.
Figure 10: Number of support periods, persistent service users (per cent)
Source: Supplementary table S.SUPPORT.23.
0 10 20 30 40 50 60 70 80 90 100
Per cent
20 or more10 to 192 to 91 support period
25 years and over
Younger (15–24)
Non-Indigenous
Indigenous
Females
Males
service usersAll persistent
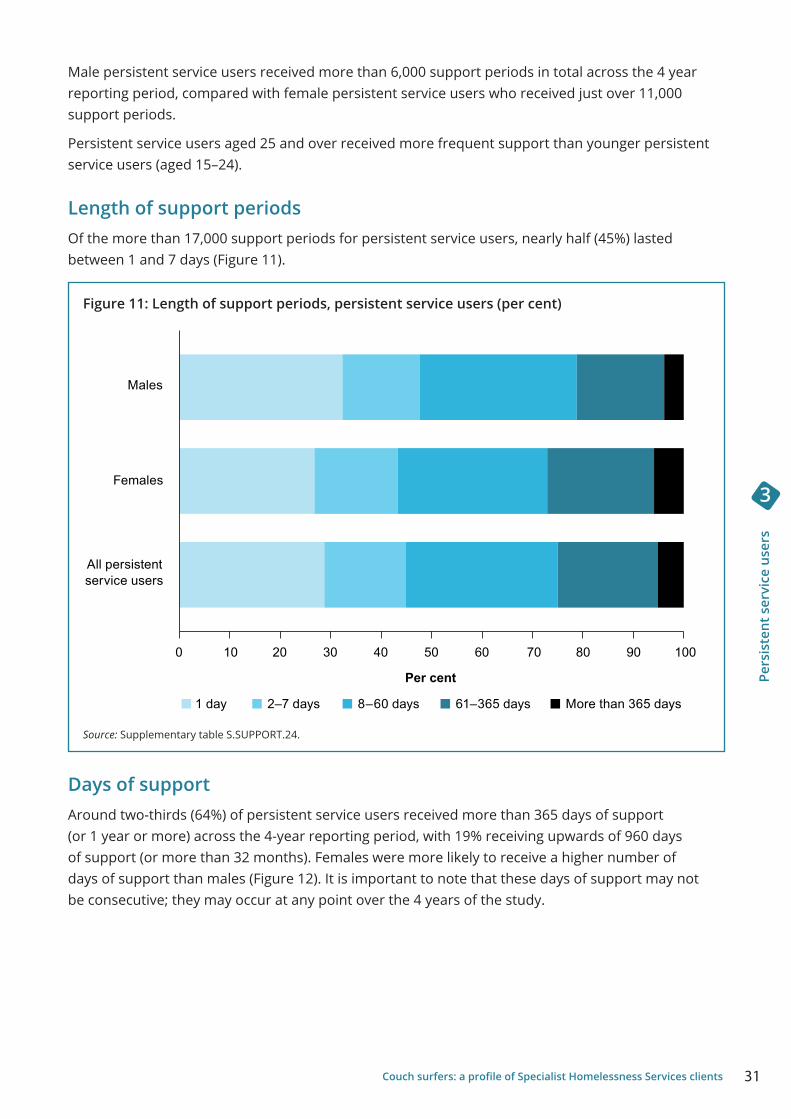
31Couch surfers: a profile of Specialist Homelessness Services clients
Pers
iste
nt s
ervi
ce u
sers
3
Male persistent service users received more than 6,000 support periods in total across the 4 year reporting period, compared with female persistent service users who received just over 11,000 support periods.
Persistent service users aged 25 and over received more frequent support than younger persistent service users (aged 15–24).
Length of support periodsOf the more than 17,000 support periods for persistent service users, nearly half (45%) lasted between 1 and 7 days (Figure 11).
Figure 11: Length of support periods, persistent service users (per cent)
Source: Supplementary table S.SUPPORT.24.
Days of supportAround two-thirds (64%) of persistent service users received more than 365 days of support (or 1 year or more) across the 4-year reporting period, with 19% receiving upwards of 960 days of support (or more than 32 months). Females were more likely to receive a higher number of days of support than males (Figure 12). It is important to note that these days of support may not be consecutive; they may occur at any point over the 4 years of the study.
service usersAll persistent
Females
Males
More than 365 days61–365 days8–60 days2–7 days1 day
0 10 20 30 40 50 60 70 80 90 100
Per cent
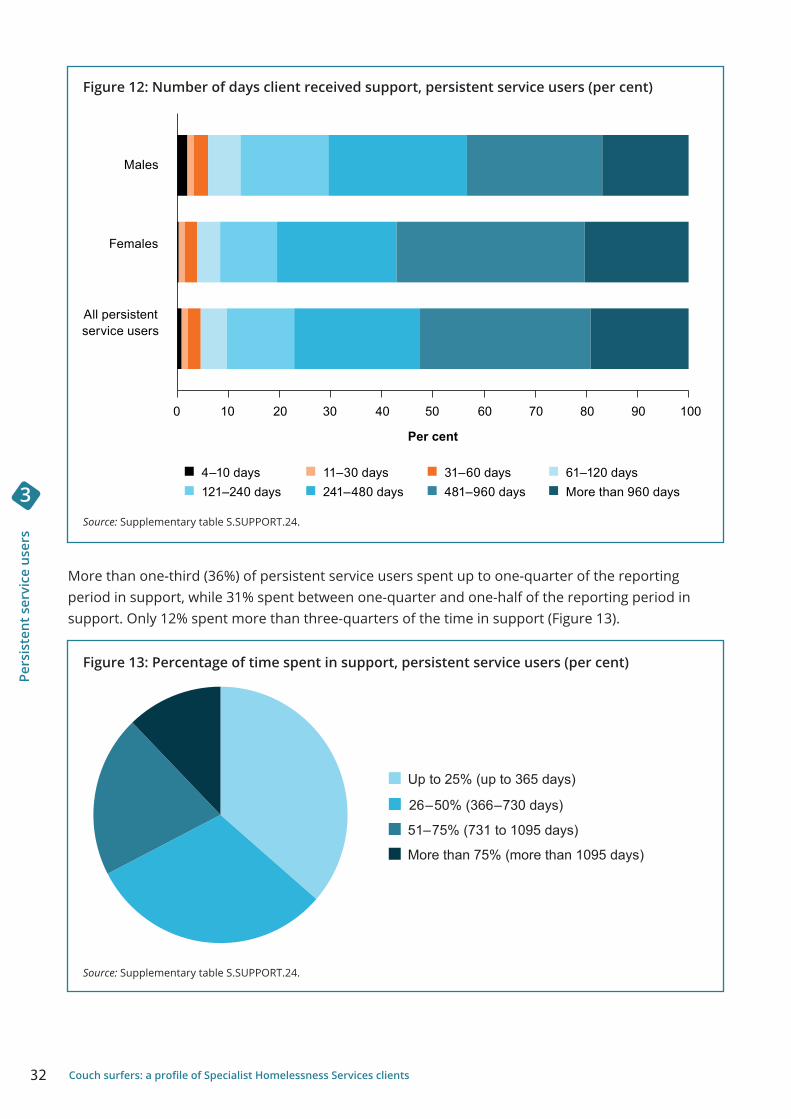
32 Couch surfers: a profile of Specialist Homelessness Services clients
Pers
iste
nt s
ervi
ce u
sers
3
Figure 12: Number of days client received support, persistent service users (per cent)
Source: Supplementary table S.SUPPORT.24.
More than one-third (36%) of persistent service users spent up to one-quarter of the reporting period in support, while 31% spent between one-quarter and one-half of the reporting period in support. Only 12% spent more than three-quarters of the time in support (Figure 13).
Figure 13: Percentage of time spent in support, persistent service users (per cent)
Source: Supplementary table S.SUPPORT.24.
service usersAll persistent
Females
Males
More than 960 days481–960 days241–480 days121–240 days61–120 days31–60 days11–30 days4–10 days
0 10 20 30 40 50 60 70 80 90 100
Per cent
Up to 25% (up to 365 days)
26–50% (366–730 days)
51–75% (731 to 1095 days)
More than 75% (more than 1095 days)
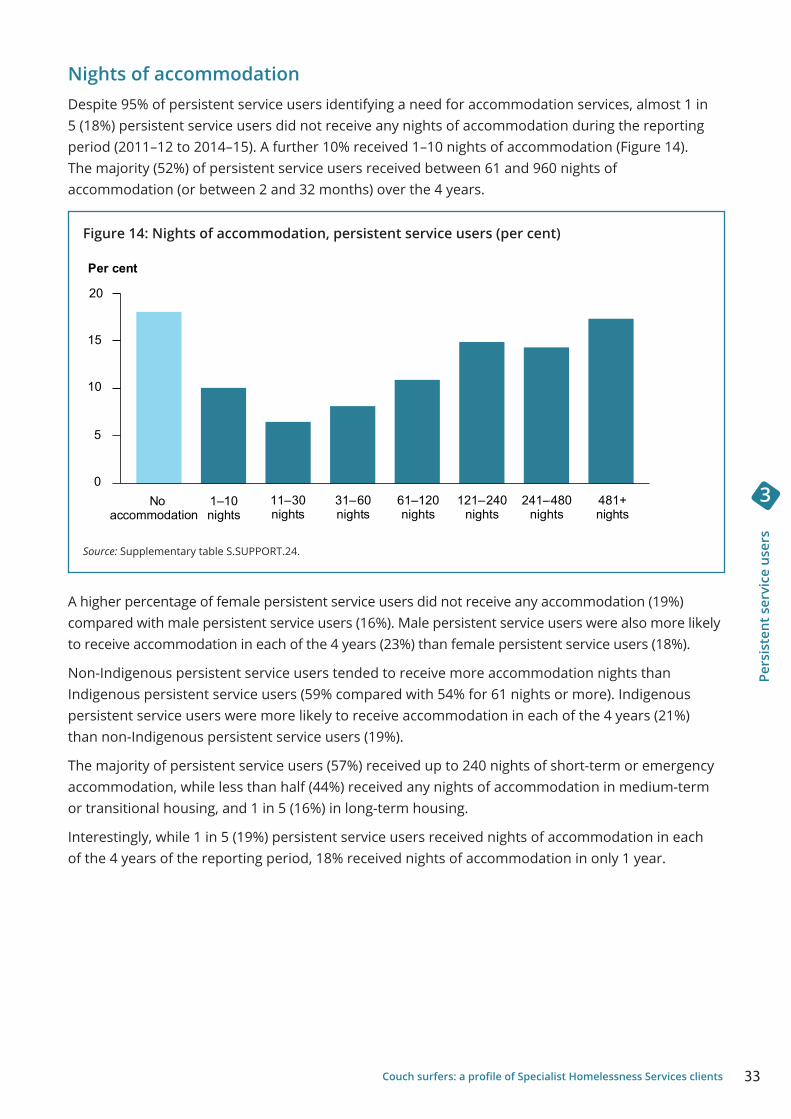
33Couch surfers: a profile of Specialist Homelessness Services clients
Pers
iste
nt s
ervi
ce u
sers
3
Nights of accommodationDespite 95% of persistent service users identifying a need for accommodation services, almost 1 in 5 (18%) persistent service users did not receive any nights of accommodation during the reporting period (2011–12 to 2014–15). A further 10% received 1–10 nights of accommodation (Figure 14). The majority (52%) of persistent service users received between 61 and 960 nights of accommodation (or between 2 and 32 months) over the 4 years.
Figure 14: Nights of accommodation, persistent service users (per cent)
Source: Supplementary table S.SUPPORT.24.
A higher percentage of female persistent service users did not receive any accommodation (19%) compared with male persistent service users (16%). Male persistent service users were also more likely to receive accommodation in each of the 4 years (23%) than female persistent service users (18%).
Non-Indigenous persistent service users tended to receive more accommodation nights than Indigenous persistent service users (59% compared with 54% for 61 nights or more). Indigenous persistent service users were more likely to receive accommodation in each of the 4 years (21%) than non-Indigenous persistent service users (19%).
The majority of persistent service users (57%) received up to 240 nights of short-term or emergency accommodation, while less than half (44%) received any nights of accommodation in medium-term or transitional housing, and 1 in 5 (16%) in long-term housing.
Interestingly, while 1 in 5 (19%) persistent service users received nights of accommodation in each of the 4 years of the reporting period, 18% received nights of accommodation in only 1 year.
No accommodation
1–10nights
11–30nights
31–60nights
61–120nights
121–240nights
241–480nights
481+nights
0
5
10
15
20
Per cent
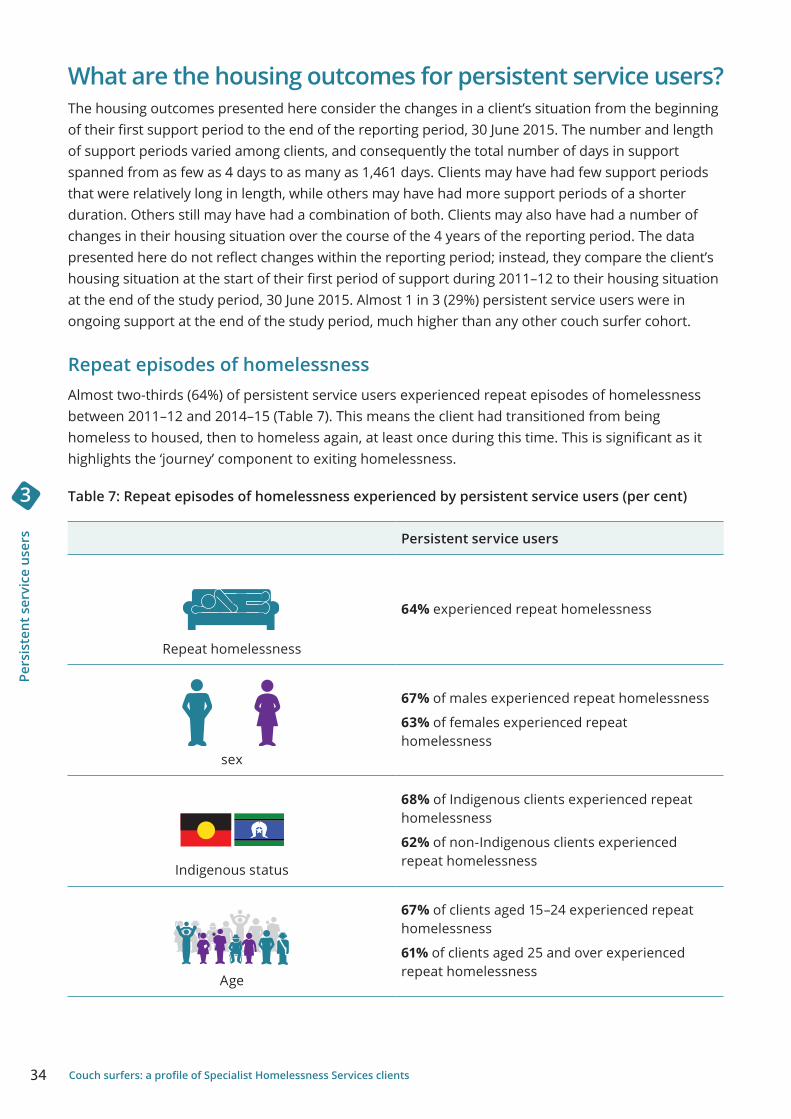
34 Couch surfers: a profile of Specialist Homelessness Services clients
Pers
iste
nt s
ervi
ce u
sers
3
What are the housing outcomes for persistent service users? The housing outcomes presented here consider the changes in a client’s situation from the beginning of their first support period to the end of the reporting period, 30 June 2015. The number and length of support periods varied among clients, and consequently the total number of days in support spanned from as few as 4 days to as many as 1,461 days. Clients may have had few support periods that were relatively long in length, while others may have had more support periods of a shorter duration. Others still may have had a combination of both. Clients may also have had a number of changes in their housing situation over the course of the 4 years of the reporting period. The data presented here do not reflect changes within the reporting period; instead, they compare the client’s housing situation at the start of their first period of support during 2011–12 to their housing situation at the end of the study period, 30 June 2015. Almost 1 in 3 (29%) persistent service users were in ongoing support at the end of the study period, much higher than any other couch surfer cohort.
Repeat episodes of homelessnessAlmost two-thirds (64%) of persistent service users experienced repeat episodes of homelessness between 2011–12 and 2014–15 (Table 7). This means the client had transitioned from being homeless to housed, then to homeless again, at least once during this time. This is significant as it highlights the ‘journey’ component to exiting homelessness.
Table 7: Repeat episodes of homelessness experienced by persistent service users (per cent)
Persistent service users
Repeat homelessness
64% experienced repeat homelessness
sex
67% of males experienced repeat homelessness
63% of females experienced repeat homelessness
Indigenous status
68% of Indigenous clients experienced repeat homelessness
62% of non-Indigenous clients experienced repeat homelessness
Age
67% of clients aged 15–24 experienced repeat homelessness
61% of clients aged 25 and over experienced repeat homelessness
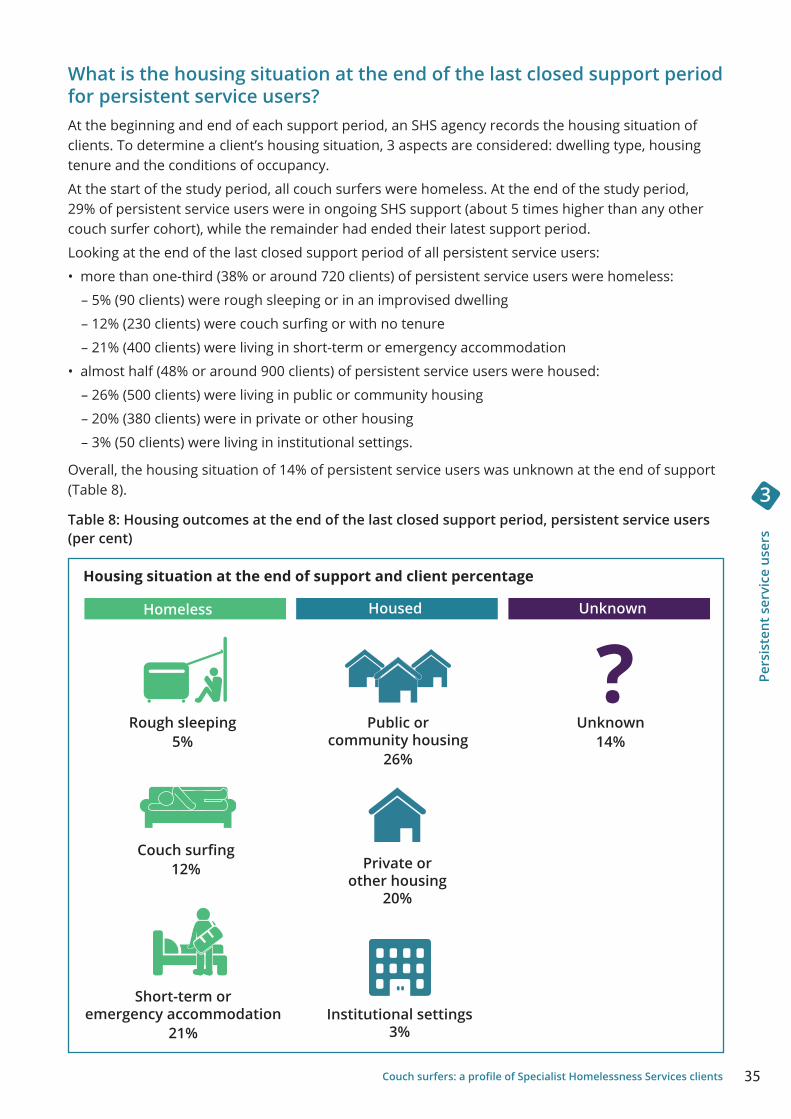
35Couch surfers: a profile of Specialist Homelessness Services clients
Pers
iste
nt s
ervi
ce u
sers
3
What is the housing situation at the end of the last closed support period for persistent service users?At the beginning and end of each support period, an SHS agency records the housing situation of clients. To determine a client’s housing situation, 3 aspects are considered: dwelling type, housing tenure and the conditions of occupancy.
At the start of the study period, all couch surfers were homeless. At the end of the study period, 29% of persistent service users were in ongoing SHS support (about 5 times higher than any other couch surfer cohort), while the remainder had ended their latest support period.
Looking at the end of the last closed support period of all persistent service users:
• more than one-third (38% or around 720 clients) of persistent service users were homeless:
– 5% (90 clients) were rough sleeping or in an improvised dwelling
– 12% (230 clients) were couch surfing or with no tenure
– 21% (400 clients) were living in short-term or emergency accommodation
• almost half (48% or around 900 clients) of persistent service users were housed:
– 26% (500 clients) were living in public or community housing
– 20% (380 clients) were in private or other housing
– 3% (50 clients) were living in institutional settings.
Overall, the housing situation of 14% of persistent service users was unknown at the end of support (Table 8).
Table 8: Housing outcomes at the end of the last closed support period, persistent service users (per cent)
Rough sleeping 5%
Couch surfing 12%
Short-term or emergency accommodation
21%
Housing situation at the end of support and client percentage
Unknown14%
Public or community housing
26%
Private or other housing
20%
Institutional settings 3%
?Homeless Housed Unknown
36 Couch surfers: a profile of Specialist Homelessness Services clients
Pers
iste
nt s
ervi
ce u
sers
3
• Femle persistent service users (53%) were more likely than male persistent service users (39%) to be housed at end of their last closed support period, with nearly 3 in 10 living in public or community housing (29%) and a further 23% in private or other housing.
• In comparison, male persistent service users (47%) were more likely than female persistent service users (33%) to be homeless at the end of their last closed support period (47%), with one-quarter (25%) in short-term or emergency accommodation, more than 1 in 10 (12%) still couch surfing or with no tenure and 10% rough sleeping.
• Clients aged 15–24 were more likely to be housed (48%) at the end of their last closed support period than homeless (36%):
– Of those who were homeless (36%), 19% were in short-term or emergency accommodation, 14% were couch surfing or with no tenure and 3% were rough sleeping or in an improvised dwelling.
– Of those who were housed (48%), almost 1 in 4 (23%) were in private or other housing, with a further 23% in public or community housing.
• As with younger clients, clients aged 25 and over were more likely to be housed (49%) at the end of their last closed support period than homeless (39%):
– Of those who remained homeless (39%), more than 1 in 5 (22%) were in short-term or emergency accommodation, 1 in 10 (10%) were couch surfing or with no tenure and 7% were rough sleeping or in an improvised dwelling.
– Of those who were housed (49%), almost one-third (30%) were in public or community housing and 16% were in private or other housing.
What does this tell us?Persistent service users were the smallest of the 3 cohorts, accounting for just over 1 in 10 couch surfers (12%) in this study. The majority were female and aged 15–24. Two-thirds of this cohort reported ever experiencing a mental health issue, while 3 in 5 ever experienced domestic or family violence. Highlighting the complex needs of this cohort, 1 in 5 experienced all 3 of the vulnerability conditions: domestic or family violence, mental health issue and problematic drug and/or alcohol use, while 3 in 5 experienced at least 2 of the 3.
As with all couch surfer cohorts, accommodation was the key reason that persistent service users sought assistance from SHS—indicating that they were seeking accommodation solutions. Clients aged 15–24 were more likely to need accommodation than those aged 25 and over, and short-term or emergency accommodation was the most common accommodation type provided to persistent service users.
Repeat episodes of homelessness were common in the persistent service user cohort, with almost 2 in 3 clients experiencing homelessness more than once during the reporting period. That is, they had transitioned from homeless to housed, then to homeless again, at least once in the 4 years of the reporting period. This highlights the ‘journey’ nature of exiting homelessness for many homeless clients.
Engagement with SHS does not mean an immediate end to homelessness. At the start of the study period (2011–12), all couch surfers were homeless. By the end of 2014–15, when persistent service users had engaged with SHS over a period of at least 4 years, almost 2 in 5 remained homeless—this is higher than for service cyclers or transitory service users. While almost half of all persistent service users ended support housed, the housing situation for 14% was unknown at the end of the study period.
37Couch surfers: a profile of Specialist Homelessness Services clients
Pers
iste
nt s
ervi
ce u
sers
3
Case study 1: Persistent service userAmelia*, 17, has spent the last 2 nights sleeping at a friend’s place. It is not the first time this has happened and Amelia suspects it will not be the last. She has been living in and out of home since she was 14. As she gets ready for school, she wonders if her mum and dad actually care if she ever goes back. When she is at home, they fight all the time and often it gets physical. It usually ends the same way—she packs a few things and leaves—but she always returns. This time, she is not so sure. She stole money from her dad to buy alcohol. He went right off, and then her mum joined in. Her little brother was watching TV and she remembers wondering what things will be like for him in a few years.
Today, she is going to see a Specialist Homelessness Services agency after school. She has been there a few times before and 1 time they found her some emergency accommodation. However, it was temporary and, with no money, no job and a desperate desire to finish Year 12, eventually Amelia went back to her own bed. She tried to make it work but a few months later, here she is—again.
* This case story is not based on an actual person. It is based on de-identified data collated from the SHSC. It is intended to present an example of a ‘typical’ persistent couch surfer; it is not the intention of the AIHW to stereotype homelessness clients.
38 Couch surfers: a profile of Specialist Homelessness Services clients
Serv
ice
cycl
ers
4
4 Service cyclers
Key findings
Service cyclers are clients who had a least 1 support period between 1 July 2011 and 30 June 2012 and at least 1 other support period between 1 July 2012 and 30 June 2015. This cohort comprised more than 7,100 clients and was the second largest of the 3 cohorts.
Consistent with the broader group of couch surfers:
• the majority of service cyclers were female. Half of service cyclers were aged 15–24. Most received services in Major cities and 1 in 3 reported they were living alone
• the most common reasons for seeking assistance were related to accommodation or interpersonal relationships, and younger clients (aged 15–24) were more likely to report these reasons
• short-term or emergency accommodation was more likely to be provided than medium- or long-term accommodation. Younger clients were most likely to be provided with medium-term or transitional housing
• younger clients (compared with clients aged 25 and over) and male service cyclers (compared with females) were more likely to need and be provided with drug and alcohol services.
Service cyclers were less likely than persistent service users, yet more likely than transitory service users, to:
• experience 2 or 3 of the 3 vulnerability conditions (domestic and family violence, mental health issue, and/or problematic drug and/or alcohol use)
• receive some form of accommodation. Yet, around 2 in 5 who identified a need for long-term housing were not provided with, or referred to an agency for, this accommodation solution
• have frequent contact with SHS
• receive at least 1 night of accommodation (59% compared with 82% of persistent service users). This is still higher, however, than the percentage of other SHS clients (41%)
• experience repeat episodes of homelessness.
At the start of the study period in 2011–12, all clients were experiencing homelessness. By the end of their last closed support period, one-third of service cyclers (33%) were experiencing homelessness, including 1 in 10 (13%) living in short-term or emergency accommodation, 5% rough sleeping and 15% couch surfing. Almost one-quarter (23%) were privately housed, while the housing situation of almost 1 in 4 (22%) was unknown.
Who are service cyclers?There were around 7,100 service cyclers in 2011–12. Service cyclers presented to SHS agencies for assistance in the first financial year of the reporting period (2011–12) and again at least once by 30 June 2015. That is, they presented to an agency for assistance at least once between 1 July 2011 and 30 June 2012, and at least once more between 1 July 2012 and 30 June 2015, but did not appear in each financial year of the reporting period.
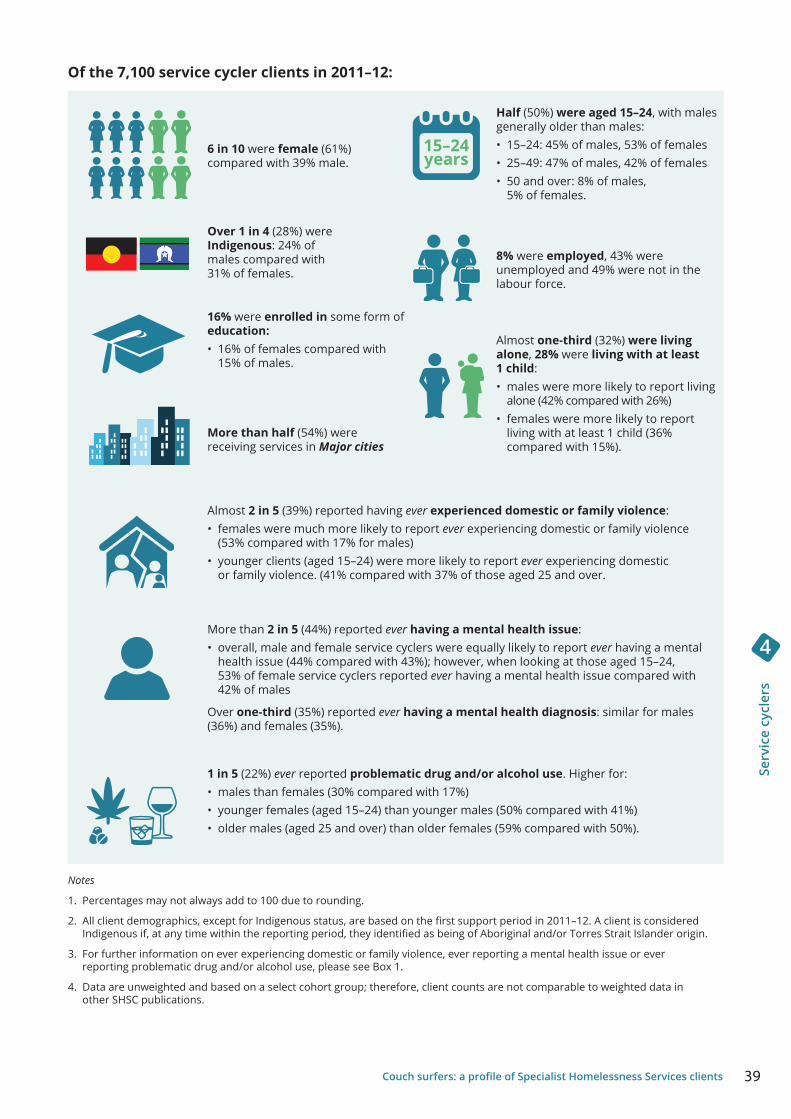
39Couch surfers: a profile of Specialist Homelessness Services clients
Se
rvic
e cy
cler
s
4
Notes
1. Percentages may not always add to 100 due to rounding.
2. All client demographics, except for Indigenous status, are based on the first support period in 2011–12. A client is considered Indigenous if, at any time within the reporting period, they identified as being of Aboriginal and/or Torres Strait Islander origin.
3. For further information on ever experiencing domestic or family violence, ever reporting a mental health issue or ever reporting problematic drug and/or alcohol use, please see Box 1.
4. Data are unweighted and based on a select cohort group; therefore, client counts are not comparable to weighted data in other SHSC publications.
1 in 5 (22%) ever reported problematic drug and/or alcohol use. Higher for: • males than females (30% compared with 17%)• younger females (aged 15–24) than younger males (50% compared with 41%)• older males (aged 25 and over) than older females (59% compared with 50%).
6 in 10 were female (61%) compared with 39% male.
Half (50%) were aged 15–24, with males generally older than males:• 15–24: 45% of males, 53% of females • 25–49: 47% of males, 42% of females• 50 and over: 8% of males,
5% of females.
Over 1 in 4 (28%) were Indigenous: 24% of males compared with 31% of females.
8% were employed, 43% were unemployed and 49% were not in the labour force.
16% were enrolled in some form of education:• 16% of females compared with
15% of males.
Almost one-third (32%) were living alone, 28% were living with at least 1 child:• males were more likely to report living
alone (42% compared with 26%)• females were more likely to report
living with at least 1 child (36% compared with 15%).
Almost 2 in 5 (39%) reported having ever experienced domestic or family violence: • females were much more likely to report ever experiencing domestic or family violence
(53% compared with 17% for males)• younger clients (aged 15–24) were more likely to report ever experiencing domestic
or family violence. (41% compared with 37% of those aged 25 and over.
More than 2 in 5 (44%) reported ever having a mental health issue:• overall, male and female service cyclers were equally likely to report ever having a mental
health issue (44% compared with 43%); however, when looking at those aged 15–24, 53% of female service cyclers reported ever having a mental health issue compared with 42% of males
Over one-third (35%) reported ever having a mental health diagnosis: similar for males (36%) and females (35%).
15–24years
More than half (54%) were receiving services in Major cities
Of the 7,100 service cycler clients in 2011–12:
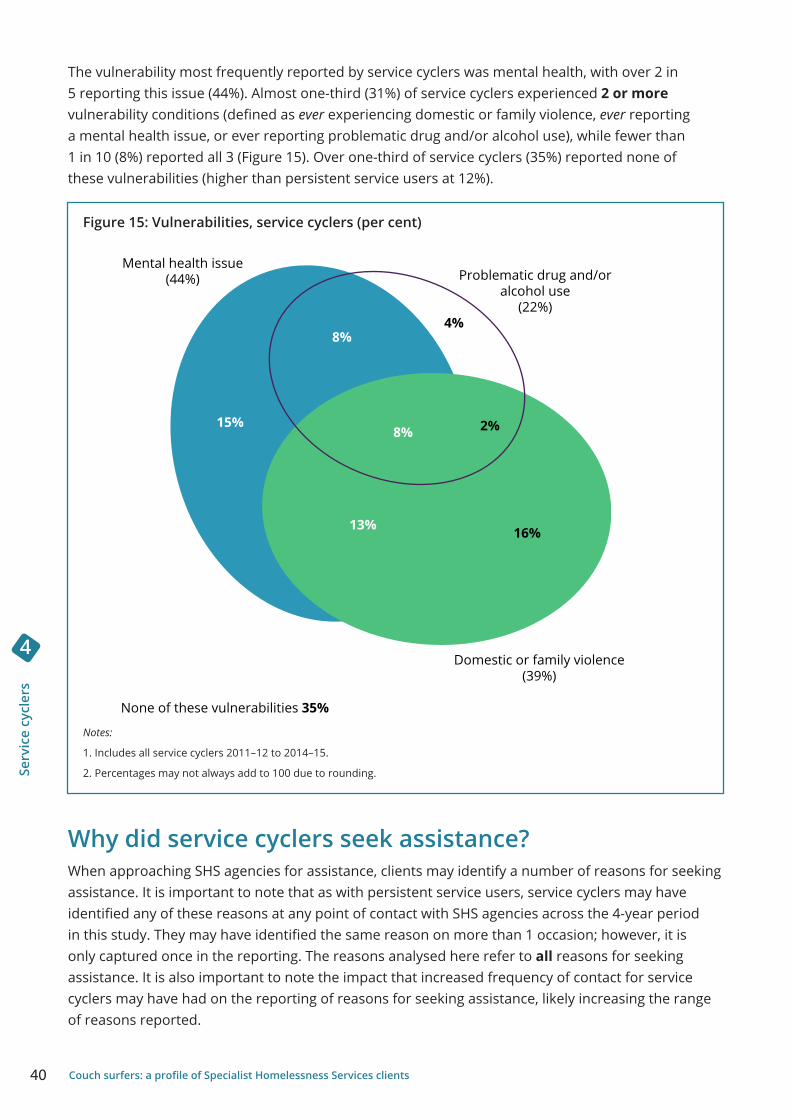
40 Couch surfers: a profile of Specialist Homelessness Services clients
Serv
ice
cycl
ers
4
The vulnerability most frequently reported by service cyclers was mental health, with over 2 in 5 reporting this issue (44%). Almost one-third (31%) of service cyclers experienced 2 or more vulnerability conditions (defined as ever experiencing domestic or family violence, ever reporting a mental health issue, or ever reporting problematic drug and/or alcohol use), while fewer than 1 in 10 (8%) reported all 3 (Figure 15). Over one-third of service cyclers (35%) reported none of these vulnerabilities (higher than persistent service users at 12%).
Figure 15: Vulnerabilities, service cyclers (per cent)
Notes:
1. Includes all service cyclers 2011–12 to 2014–15.
2. Percentages may not always add to 100 due to rounding.
Why did service cyclers seek assistance?When approaching SHS agencies for assistance, clients may identify a number of reasons for seeking assistance. It is important to note that as with persistent service users, service cyclers may have identified any of these reasons at any point of contact with SHS agencies across the 4-year period in this study. They may have identified the same reason on more than 1 occasion; however, it is only captured once in the reporting. The reasons analysed here refer to all reasons for seeking assistance. It is also important to note the impact that increased frequency of contact for service cyclers may have had on the reporting of reasons for seeking assistance, likely increasing the range of reasons reported.
None of these vulnerabilities 35%
Mental health issue(44%)
Domestic or family violence(39%)
Problematic drug and/oralcohol use
(22%)
2%8%
13%
8%4%
16%
15%
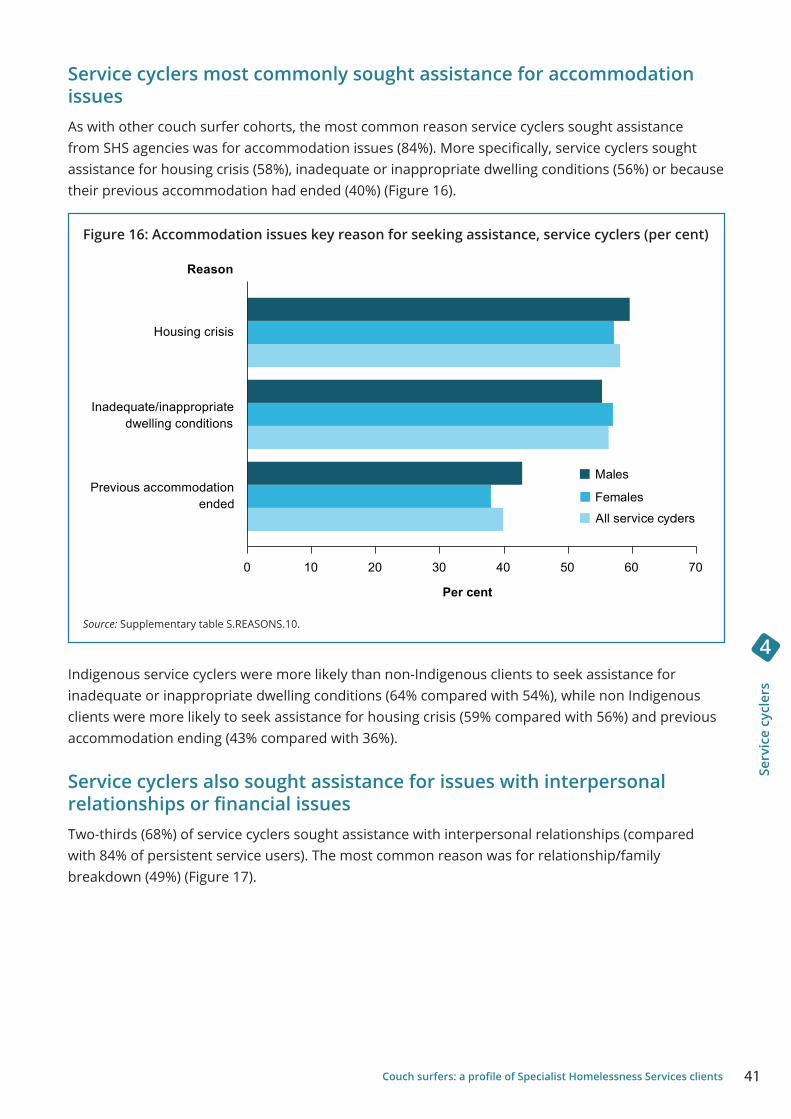
41Couch surfers: a profile of Specialist Homelessness Services clients
Se
rvic
e cy
cler
s
4
Service cyclers most commonly sought assistance for accommodation issuesAs with other couch surfer cohorts, the most common reason service cyclers sought assistance from SHS agencies was for accommodation issues (84%). More specifically, service cyclers sought assistance for housing crisis (58%), inadequate or inappropriate dwelling conditions (56%) or because their previous accommodation had ended (40%) (Figure 16).
Figure 16: Accommodation issues key reason for seeking assistance, service cyclers (per cent)
Source: Supplementary table S.REASONS.10.
Indigenous service cyclers were more likely than non-Indigenous clients to seek assistance for inadequate or inappropriate dwelling conditions (64% compared with 54%), while non Indigenous clients were more likely to seek assistance for housing crisis (59% compared with 56%) and previous accommodation ending (43% compared with 36%).
Service cyclers also sought assistance for issues with interpersonal relationships or financial issuesTwo-thirds (68%) of service cyclers sought assistance with interpersonal relationships (compared with 84% of persistent service users). The most common reason was for relationship/family breakdown (49%) (Figure 17).
endedPrevious accommodation
dwelling conditionsInadequate/inappropriate
Housing crisis
All service cyclersFemales
Males
Reason
0 10 20 30 40 50 60 70
Per cent
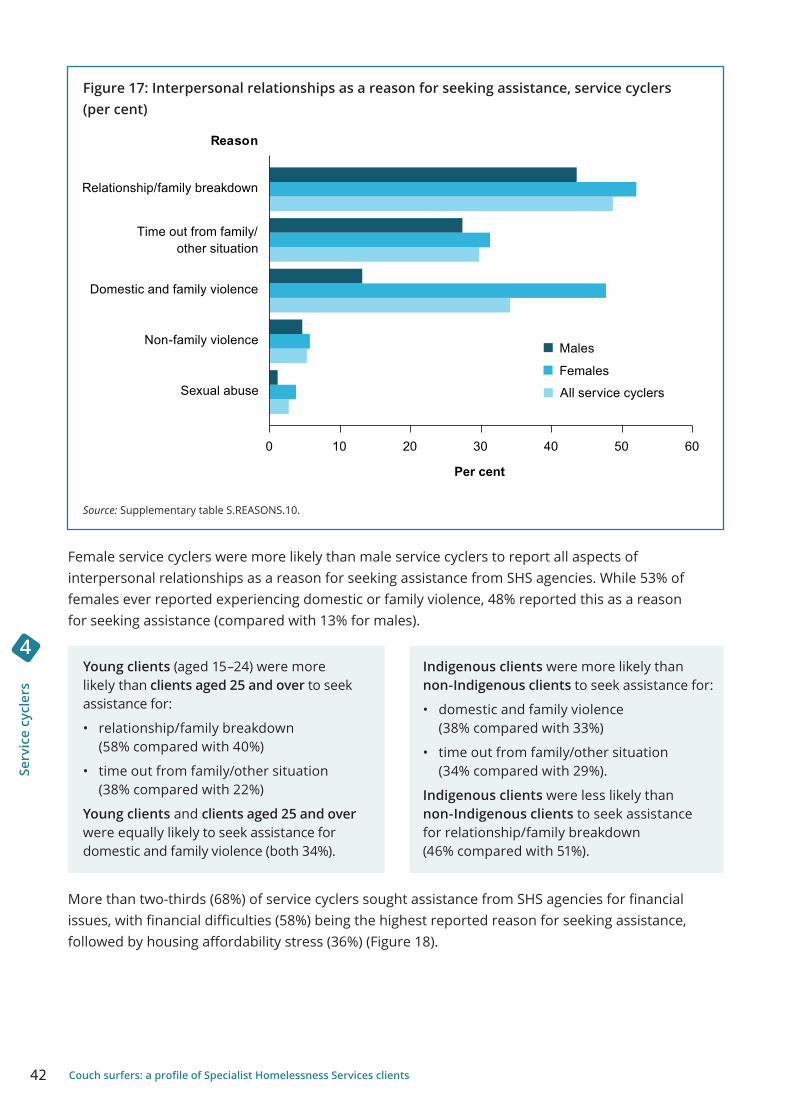
42 Couch surfers: a profile of Specialist Homelessness Services clients
Serv
ice
cycl
ers
4
Figure 17: Interpersonal relationships as a reason for seeking assistance, service cyclers (per cent)
Source: Supplementary table S.REASONS.10.
Female service cyclers were more likely than male service cyclers to report all aspects of interpersonal relationships as a reason for seeking assistance from SHS agencies. While 53% of females ever reported experiencing domestic or family violence, 48% reported this as a reason for seeking assistance (compared with 13% for males).
Young clients (aged 15–24) were more likely than clients aged 25 and over to seek assistance for:
• relationship/family breakdown (58% compared with 40%)
• time out from family/other situation (38% compared with 22%)
Young clients and clients aged 25 and over were equally likely to seek assistance for domestic and family violence (both 34%).
Indigenous clients were more likely than non-Indigenous clients to seek assistance for:
• domestic and family violence (38% compared with 33%)
• time out from family/other situation (34% compared with 29%).
Indigenous clients were less likely than non-Indigenous clients to seek assistance for relationship/family breakdown (46% compared with 51%).
More than two-thirds (68%) of service cyclers sought assistance from SHS agencies for financial issues, with financial difficulties (58%) being the highest reported reason for seeking assistance, followed by housing affordability stress (36%) (Figure 18).
Sexual abuse
Non-family violence
Domestic and family violence
other situationTime out from family/
Relationship/family breakdown
All service cyclers
Females
Males
Reason
0 10 20 30 40 50 60
Per cent
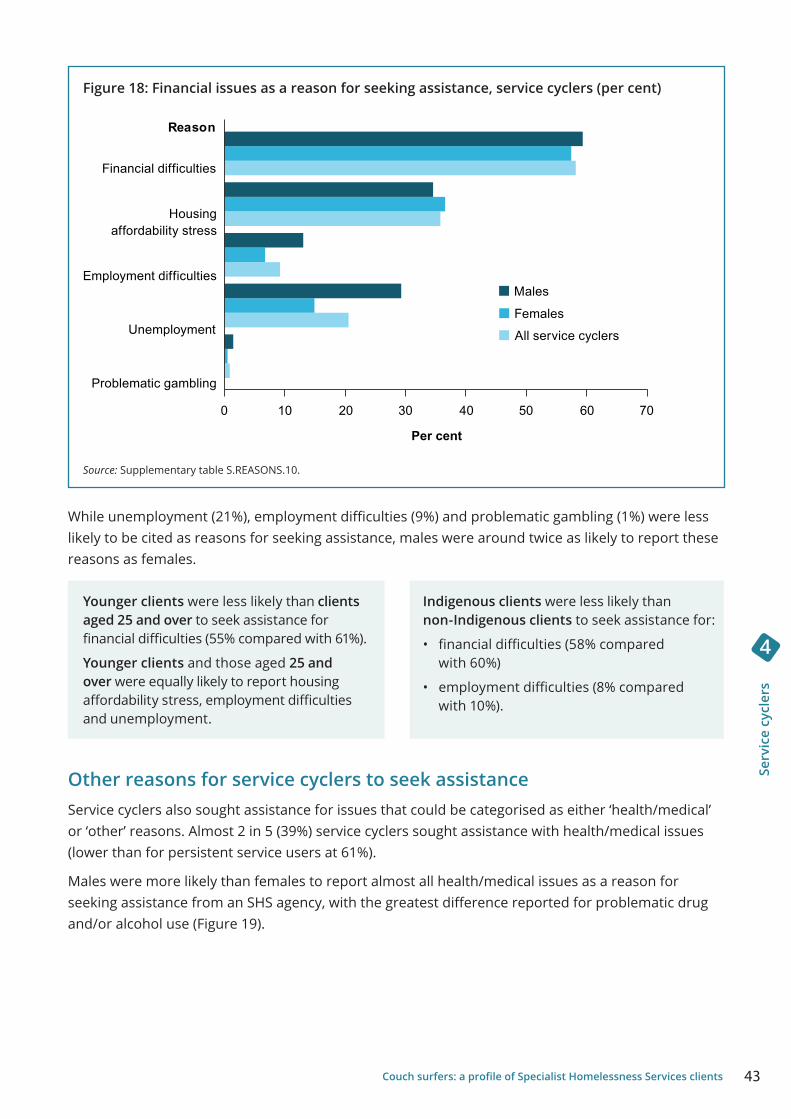
43Couch surfers: a profile of Specialist Homelessness Services clients
Se
rvic
e cy
cler
s
4
Figure 18: Financial issues as a reason for seeking assistance, service cyclers (per cent)
Source: Supplementary table S.REASONS.10.
While unemployment (21%), employment difficulties (9%) and problematic gambling (1%) were less likely to be cited as reasons for seeking assistance, males were around twice as likely to report these reasons as females.
Younger clients were less likely than clients aged 25 and over to seek assistance for financial difficulties (55% compared with 61%).
Younger clients and those aged 25 and over were equally likely to report housing affordability stress, employment difficulties and unemployment.
Indigenous clients were less likely than non-Indigenous clients to seek assistance for:
• financial difficulties (58% compared with 60%)
• employment difficulties (8% compared with 10%).
Other reasons for service cyclers to seek assistanceService cyclers also sought assistance for issues that could be categorised as either ‘health/medical’ or ‘other’ reasons. Almost 2 in 5 (39%) service cyclers sought assistance with health/medical issues (lower than for persistent service users at 61%).
Males were more likely than females to report almost all health/medical issues as a reason for seeking assistance from an SHS agency, with the greatest difference reported for problematic drug and/or alcohol use (Figure 19).
Problematic gambling
Unemployment
Employment difficulties
affordability stressHousing
Financial difficulties
All service cyclers
Females
Males
Reason
0 10 20 30 40 50 60 70
Per cent
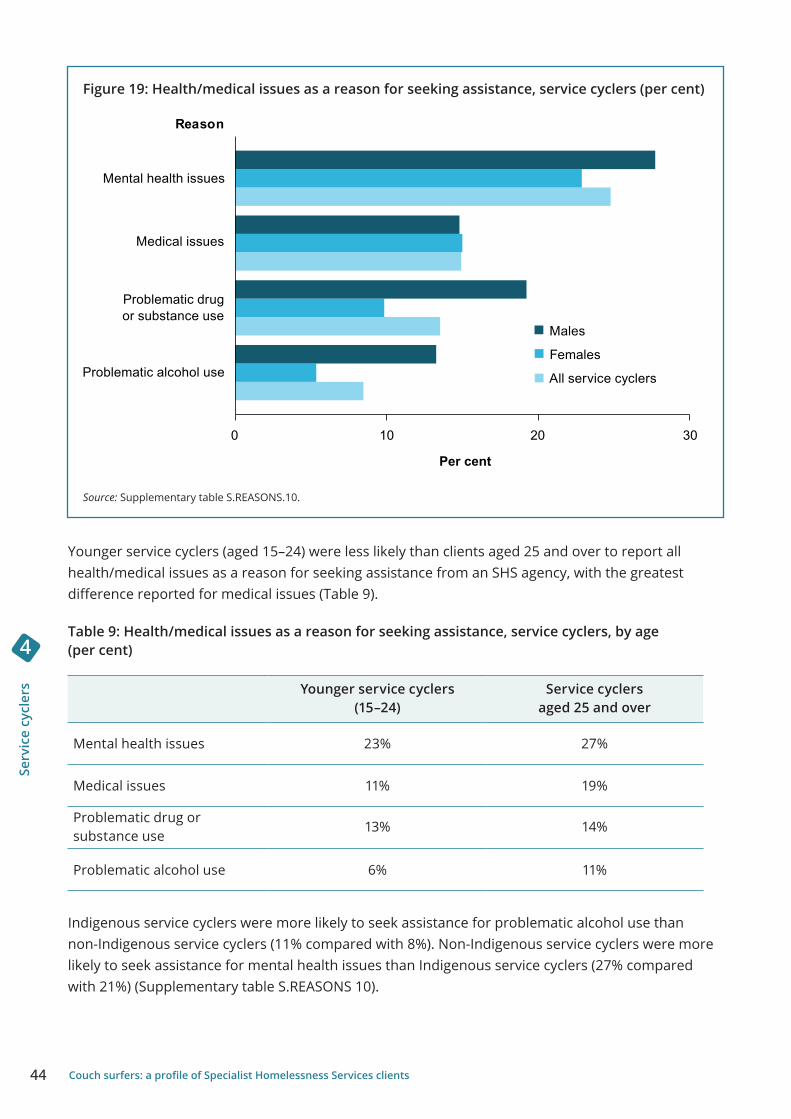
44 Couch surfers: a profile of Specialist Homelessness Services clients
Serv
ice
cycl
ers
4
Figure 19: Health/medical issues as a reason for seeking assistance, service cyclers (per cent)
Source: Supplementary table S.REASONS.10.
Younger service cyclers (aged 15–24) were less likely than clients aged 25 and over to report all health/medical issues as a reason for seeking assistance from an SHS agency, with the greatest difference reported for medical issues (Table 9).
Table 9: Health/medical issues as a reason for seeking assistance, service cyclers, by age (per cent)
Younger service cyclers (15–24)
Service cyclers aged 25 and over
Mental health issues 23% 27%
Medical issues 11% 19%
Problematic drug or substance use
13% 14%
Problematic alcohol use 6% 11%
Indigenous service cyclers were more likely to seek assistance for problematic alcohol use than non-Indigenous service cyclers (11% compared with 8%). Non-Indigenous service cyclers were more likely to seek assistance for mental health issues than Indigenous service cyclers (27% compared with 21%) (Supplementary table S.REASONS 10).
Problematic alcohol use
or substance useProblematic drug
Medical issues
Mental health issues
All service cyclers
Females
Males
Reason
0 10 20 30
Per cent
45Couch surfers: a profile of Specialist Homelessness Services clients
Se
rvic
e cy
cler
s
4
What services did service cyclers need?While the focus of SHS support is on providing stable housing or assisting clients to remain housed, other services are offered that target underlying barriers to sustainable housing. These services range from basic support and assistance, such as meals, shower facilities, laundry and transport, through to more complex and specialist services, such as health and medical services and professional or legal services.
Service cyclers are most likely to need accommodation provisionApart from ‘general services’, accommodation is the service most commonly requested by service cyclers, with almost 9 in 10 (86%) seeking this type of assistance. Service cyclers most commonly requested long-term housing (64%), while almost two-thirds (63%) needed short-term or emergency accommodation. The need for medium-term or transitional housing was lower but still relatively high at 55%.
While there was little difference overall for male service cyclers and female service cyclers, females were more likely to need long-term housing (66% compared with 62%) and medium-term or transitional housing (57% compared with 53%).
While service cyclers had a high need for accommodation services, younger service cyclers (aged 15–24) were slightly more likely to need assistance with accommodation than service cyclers aged 25 and over (87% compared with 84%). Medium-term or transitional housing was requested more frequently by younger service cyclers (62% compared with 49%), followed by long-term housing (66% compared with 63%).
‘General services’ are also commonly needed by service cyclersAs with the other couch surfer cohorts, virtually all service cyclers (99%) needed at least 1 ‘general service’. For service cyclers, the most common ‘general services’ needed were advice/information (96%), advocacy/liaison (81%) and material aid/brokerage (59%). Around half of all service cyclers also needed financial information (47%) and transport (46%).
In general, females were more likely than males to need specific ‘general services’. The largest differences were evident for:
• family/relationship assistance (40% compared with 26%)
• assistance for domestic and family violence (39% compared with 8%)
• assistance for trauma (18% compared with 9%).
Indigenous service cyclers were more likely than non-Indigenous service cyclers to need meals (42% compared with 33%), laundry/shower facilities (36% compared with 27%), transport (56% compared with 43%), recreation (30% compared with 25%), assistance for domestic/family violence (30% compared with 26%), family/relationship assistance (37% compared with 33%) and living skills/personal development (46% compared with 41%).
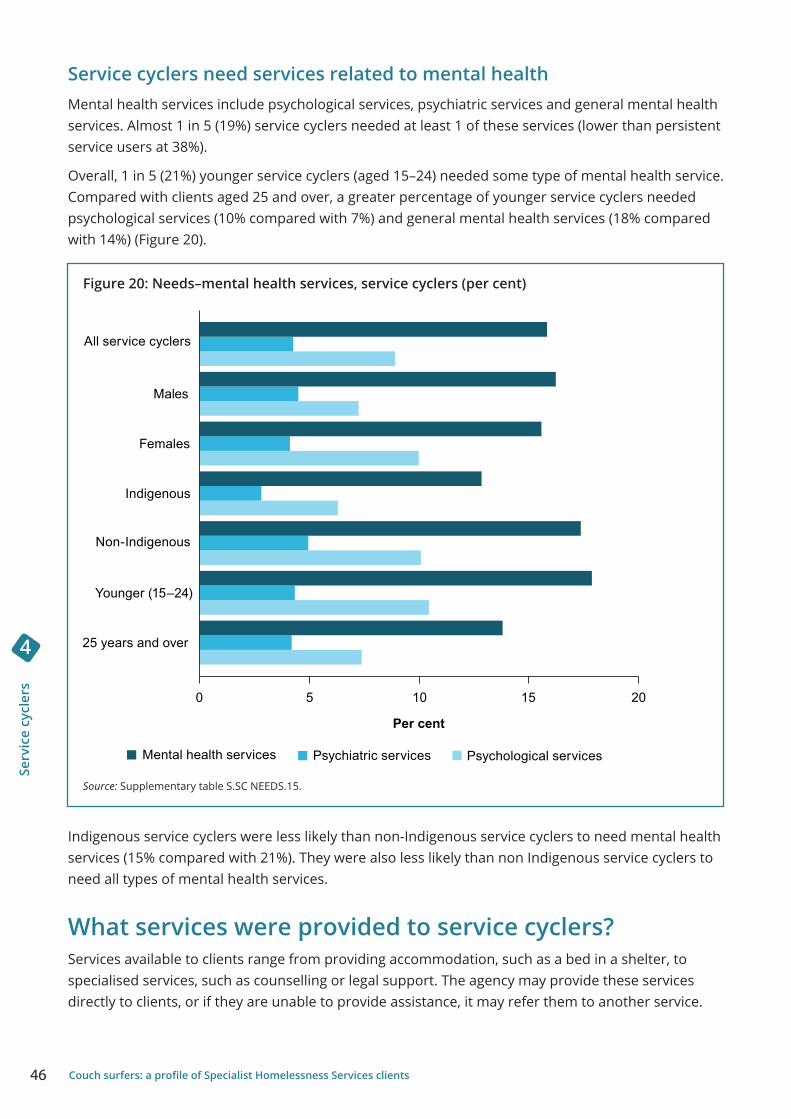
46 Couch surfers: a profile of Specialist Homelessness Services clients
Serv
ice
cycl
ers
4
Service cyclers need services related to mental health Mental health services include psychological services, psychiatric services and general mental health services. Almost 1 in 5 (19%) service cyclers needed at least 1 of these services (lower than persistent service users at 38%).
Overall, 1 in 5 (21%) younger service cyclers (aged 15–24) needed some type of mental health service. Compared with clients aged 25 and over, a greater percentage of younger service cyclers needed psychological services (10% compared with 7%) and general mental health services (18% compared with 14%) (Figure 20).
Figure 20: Needs–mental health services, service cyclers (per cent)
Source: Supplementary table S.SC NEEDS.15.
Indigenous service cyclers were less likely than non-Indigenous service cyclers to need mental health services (15% compared with 21%). They were also less likely than non Indigenous service cyclers to need all types of mental health services.
What services were provided to service cyclers?Services available to clients range from providing accommodation, such as a bed in a shelter, to specialised services, such as counselling or legal support. The agency may provide these services directly to clients, or if they are unable to provide assistance, it may refer them to another service.
25 years and over
Younger (15–24)
Non-Indigenous
Indigenous
Females
Males
All service cyclers
Psychological servicesPsychiatric servicesMental health services
0 5 10 15 20
Per cent
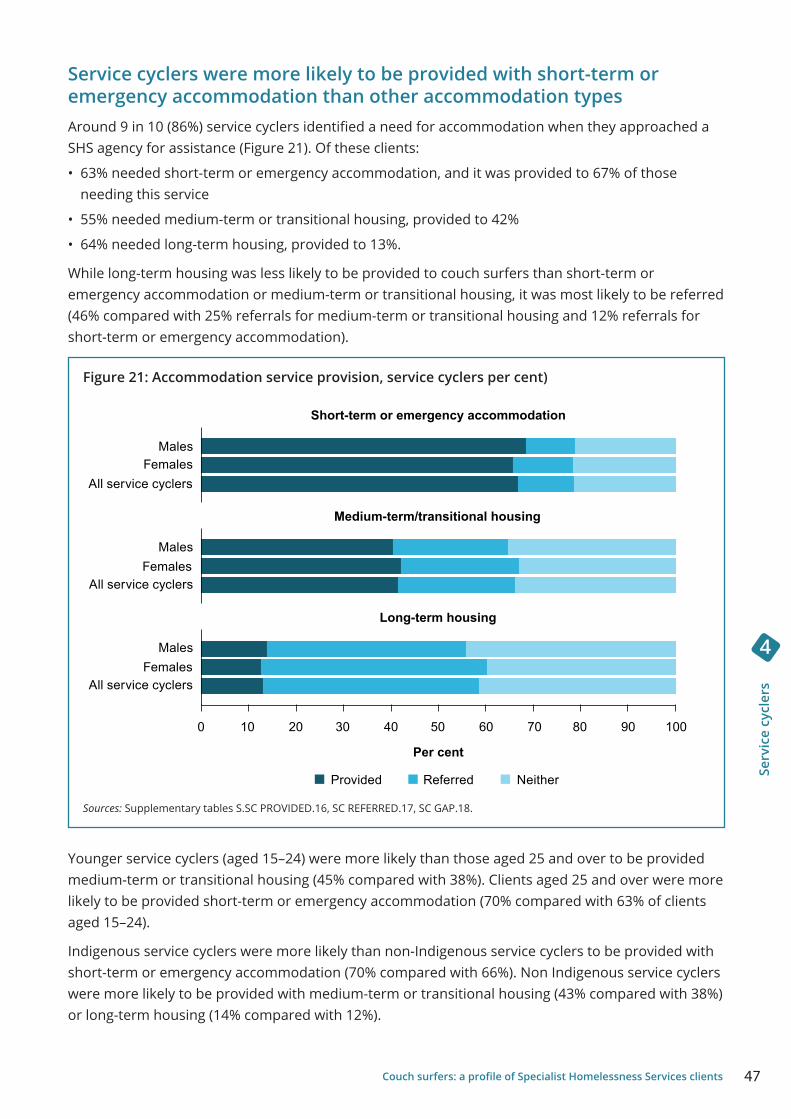
47Couch surfers: a profile of Specialist Homelessness Services clients
Se
rvic
e cy
cler
s
4
Service cyclers were more likely to be provided with short-term or emergency accommodation than other accommodation typesAround 9 in 10 (86%) service cyclers identified a need for accommodation when they approached a SHS agency for assistance (Figure 21). Of these clients:
• 63% needed short-term or emergency accommodation, and it was provided to 67% of those needing this service
• 55% needed medium-term or transitional housing, provided to 42%
• 64% needed long-term housing, provided to 13%.
While long-term housing was less likely to be provided to couch surfers than short-term or emergency accommodation or medium-term or transitional housing, it was most likely to be referred (46% compared with 25% referrals for medium-term or transitional housing and 12% referrals for short-term or emergency accommodation).
Figure 21: Accommodation service provision, service cyclers per cent)
Sources: Supplementary tables S.SC PROVIDED.16, SC REFERRED.17, SC GAP.18.
Younger service cyclers (aged 15–24) were more likely than those aged 25 and over to be provided medium-term or transitional housing (45% compared with 38%). Clients aged 25 and over were more likely to be provided short-term or emergency accommodation (70% compared with 63% of clients aged 15–24).
Indigenous service cyclers were more likely than non-Indigenous service cyclers to be provided with short-term or emergency accommodation (70% compared with 66%). Non Indigenous service cyclers were more likely to be provided with medium-term or transitional housing (43% compared with 38%) or long-term housing (14% compared with 12%).
NeitherReferredProvided
All service cyclersFemales
Males
All service cyclersFemales
Males
All service cyclersFemales
Males
Long-term housing
Medium-term/transitional housing
Short-term or emergency accommodation
0 10 20 30 40 50 60 70 80 90 100
Per cent
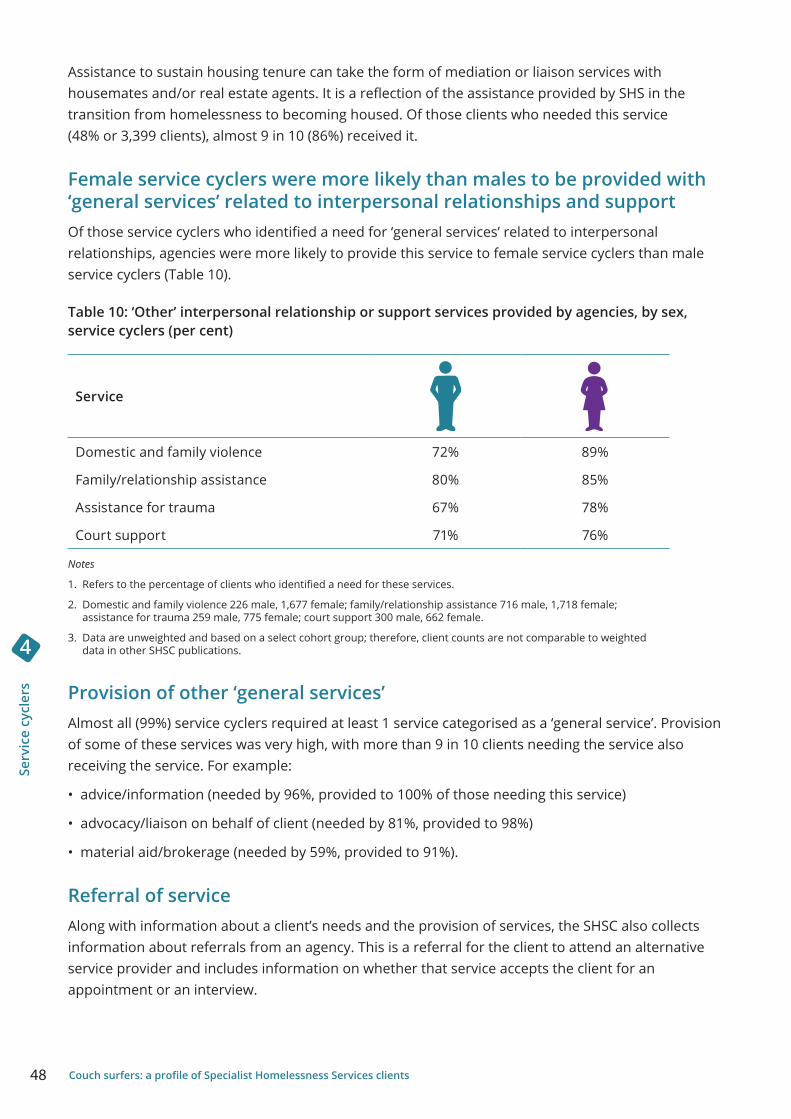
48 Couch surfers: a profile of Specialist Homelessness Services clients
Serv
ice
cycl
ers
4
Assistance to sustain housing tenure can take the form of mediation or liaison services with housemates and/or real estate agents. It is a reflection of the assistance provided by SHS in the transition from homelessness to becoming housed. Of those clients who needed this service (48% or 3,399 clients), almost 9 in 10 (86%) received it.
Female service cyclers were more likely than males to be provided with ‘general services’ related to interpersonal relationships and supportOf those service cyclers who identified a need for ‘general services’ related to interpersonal relationships, agencies were more likely to provide this service to female service cyclers than male service cyclers (Table 10).
Table 10: ‘Other’ interpersonal relationship or support services provided by agencies, by sex, service cyclers (per cent)
Service
Domestic and family violence 72% 89%
Family/relationship assistance 80% 85%
Assistance for trauma 67% 78%
Court support 71% 76%
Notes
1. Refers to the percentage of clients who identified a need for these services.
2. Domestic and family violence 226 male, 1,677 female; family/relationship assistance 716 male, 1,718 female; assistance for trauma 259 male, 775 female; court support 300 male, 662 female.
3. Data are unweighted and based on a select cohort group; therefore, client counts are not comparable to weighted data in other SHSC publications.
Provision of other ‘general services’Almost all (99%) service cyclers required at least 1 service categorised as a ‘general service’. Provision of some of these services was very high, with more than 9 in 10 clients needing the service also receiving the service. For example:
• advice/information (needed by 96%, provided to 100% of those needing this service)
• advocacy/liaison on behalf of client (needed by 81%, provided to 98%)
• material aid/brokerage (needed by 59%, provided to 91%).
Referral of serviceAlong with information about a client’s needs and the provision of services, the SHSC also collects information about referrals from an agency. This is a referral for the client to attend an alternative service provider and includes information on whether that service accepts the client for an appointment or an interview.
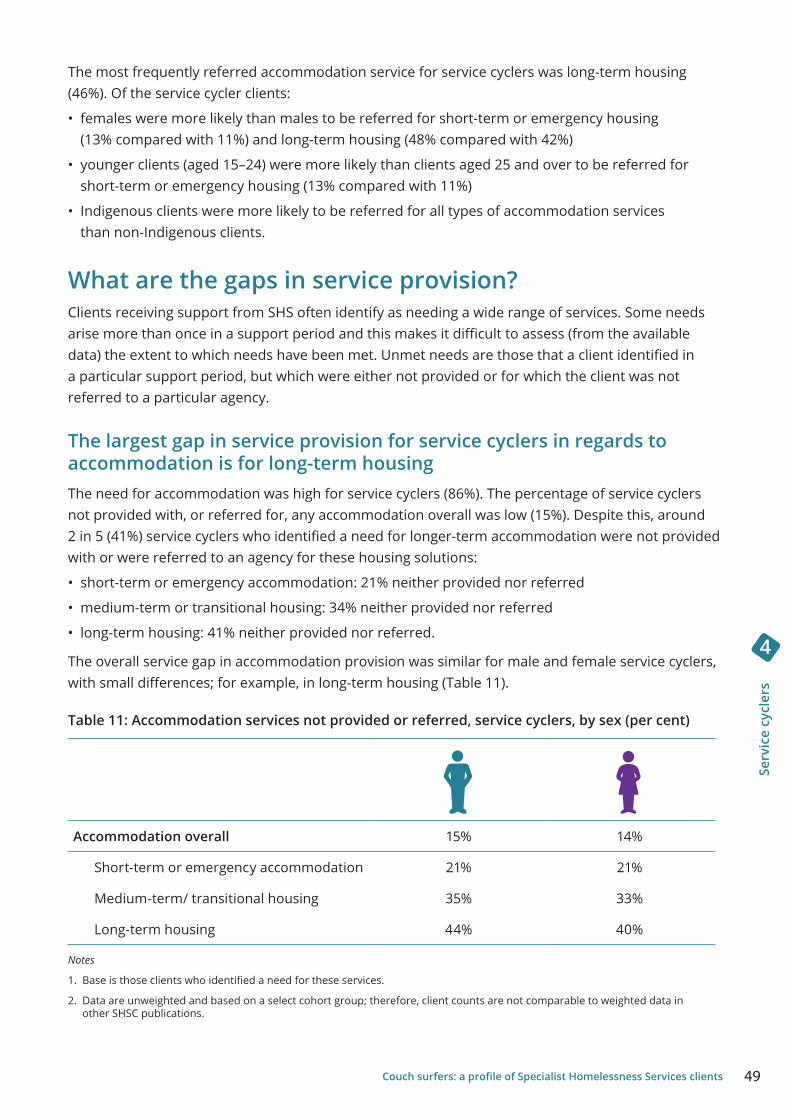
49Couch surfers: a profile of Specialist Homelessness Services clients
Se
rvic
e cy
cler
s
4
The most frequently referred accommodation service for service cyclers was long-term housing (46%). Of the service cycler clients:
• females were more likely than males to be referred for short-term or emergency housing (13% compared with 11%) and long-term housing (48% compared with 42%)
• younger clients (aged 15–24) were more likely than clients aged 25 and over to be referred for short-term or emergency housing (13% compared with 11%)
• Indigenous clients were more likely to be referred for all types of accommodation services than non-Indigenous clients.
What are the gaps in service provision?Clients receiving support from SHS often identify as needing a wide range of services. Some needs arise more than once in a support period and this makes it difficult to assess (from the available data) the extent to which needs have been met. Unmet needs are those that a client identified in a particular support period, but which were either not provided or for which the client was not referred to a particular agency.
The largest gap in service provision for service cyclers in regards to accommodation is for long-term housingThe need for accommodation was high for service cyclers (86%). The percentage of service cyclers not provided with, or referred for, any accommodation overall was low (15%). Despite this, around 2 in 5 (41%) service cyclers who identified a need for longer-term accommodation were not provided with or were referred to an agency for these housing solutions:
• short-term or emergency accommodation: 21% neither provided nor referred
• medium-term or transitional housing: 34% neither provided nor referred
• long-term housing: 41% neither provided nor referred.
The overall service gap in accommodation provision was similar for male and female service cyclers, with small differences; for example, in long-term housing (Table 11).
Table 11: Accommodation services not provided or referred, service cyclers, by sex (per cent)
Accommodation overall 15% 14%
Short-term or emergency accommodation 21% 21%
Medium-term/ transitional housing 35% 33%
Long-term housing 44% 40%
Notes
1. Base is those clients who identified a need for these services.
2. Data are unweighted and based on a select cohort group; therefore, client counts are not comparable to weighted data in other SHSC publications.
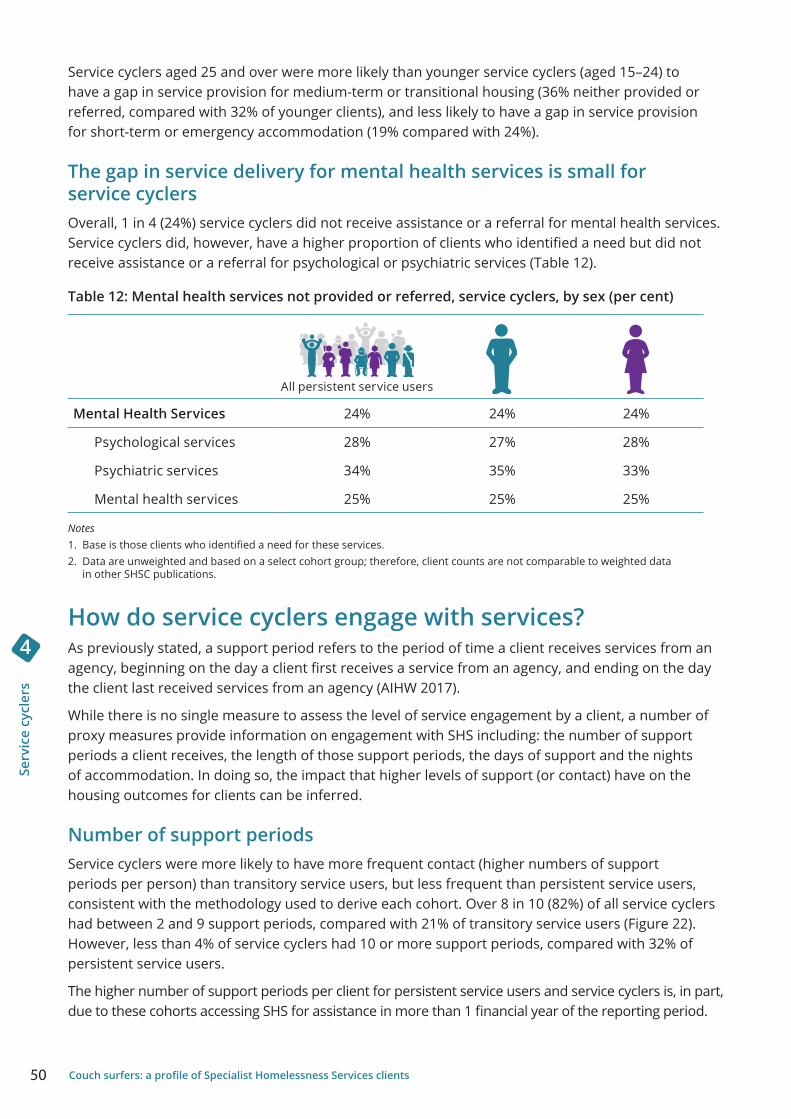
50 Couch surfers: a profile of Specialist Homelessness Services clients
Serv
ice
cycl
ers
4
Service cyclers aged 25 and over were more likely than younger service cyclers (aged 15–24) to have a gap in service provision for medium-term or transitional housing (36% neither provided or referred, compared with 32% of younger clients), and less likely to have a gap in service provision for short-term or emergency accommodation (19% compared with 24%).
The gap in service delivery for mental health services is small for service cyclersOverall, 1 in 4 (24%) service cyclers did not receive assistance or a referral for mental health services. Service cyclers did, however, have a higher proportion of clients who identified a need but did not receive assistance or a referral for psychological or psychiatric services (Table 12).
Table 12: Mental health services not provided or referred, service cyclers, by sex (per cent)
Mental Health Services 24% 24% 24%
Psychological services 28% 27% 28%
Psychiatric services 34% 35% 33%
Mental health services 25% 25% 25%
Notes1. Base is those clients who identified a need for these services. 2. Data are unweighted and based on a select cohort group; therefore, client counts are not comparable to weighted data
in other SHSC publications.
How do service cyclers engage with services?As previously stated, a support period refers to the period of time a client receives services from an agency, beginning on the day a client first receives a service from an agency, and ending on the day the client last received services from an agency (AIHW 2017).
While there is no single measure to assess the level of service engagement by a client, a number of proxy measures provide information on engagement with SHS including: the number of support periods a client receives, the length of those support periods, the days of support and the nights of accommodation. In doing so, the impact that higher levels of support (or contact) have on the housing outcomes for clients can be inferred.
Number of support periodsService cyclers were more likely to have more frequent contact (higher numbers of support periods per person) than transitory service users, but less frequent than persistent service users, consistent with the methodology used to derive each cohort. Over 8 in 10 (82%) of all service cyclers had between 2 and 9 support periods, compared with 21% of transitory service users (Figure 22). However, less than 4% of service cyclers had 10 or more support periods, compared with 32% of persistent service users.
The higher number of support periods per client for persistent service users and service cyclers is, in part, due to these cohorts accessing SHS for assistance in more than 1 financial year of the reporting period.
All persistent service users
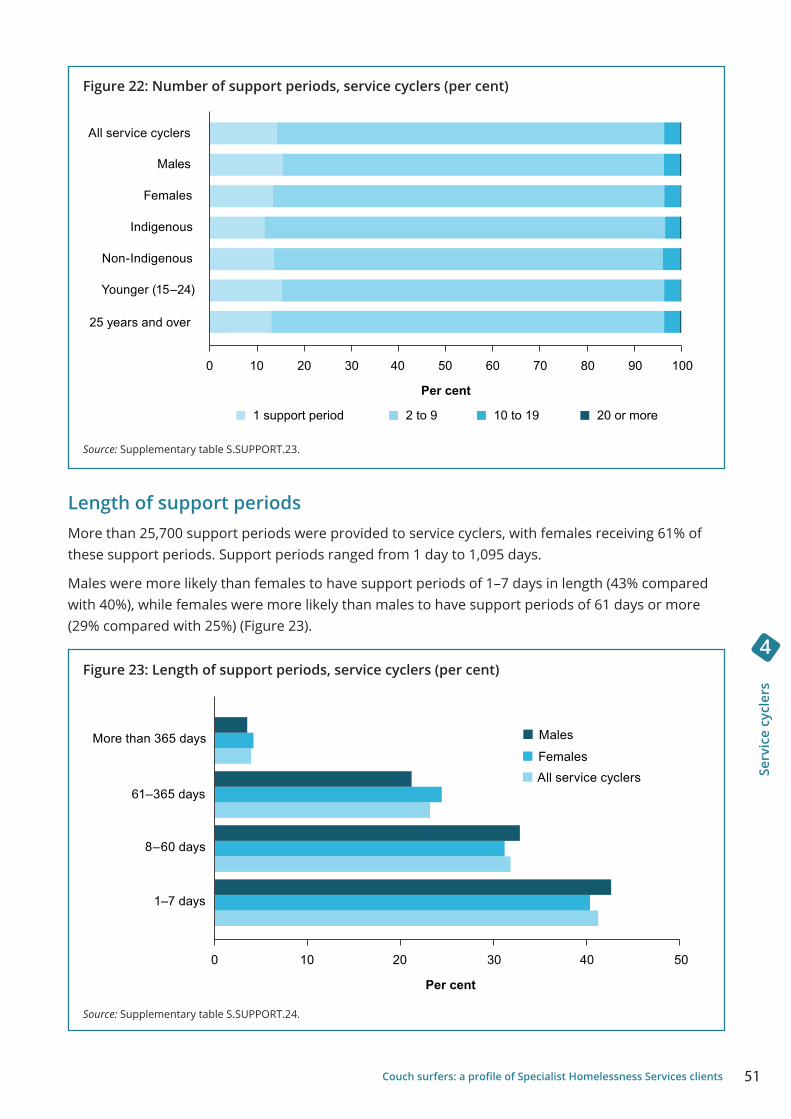
51Couch surfers: a profile of Specialist Homelessness Services clients
Se
rvic
e cy
cler
s
4
Figure 22: Number of support periods, service cyclers (per cent)
Source: Supplementary table S.SUPPORT.23.
Length of support periodsMore than 25,700 support periods were provided to service cyclers, with females receiving 61% of these support periods. Support periods ranged from 1 day to 1,095 days.
Males were more likely than females to have support periods of 1–7 days in length (43% compared with 40%), while females were more likely than males to have support periods of 61 days or more (29% compared with 25%) (Figure 23).
Figure 23: Length of support periods, service cyclers (per cent)
Source: Supplementary table S.SUPPORT.24.
20 or more10 to 192 to 91 support period
25 years and over
Younger (15–24)
Non-Indigenous
Indigenous
Females
Males
All service cyclers
0 10 20 30 40 50 60 70 80 90 100
Per cent
1–7 days
8–60 days
61–365 days
More than 365 days
All service cyclersFemales
Males
0 10 20 30 40 50
Per cent
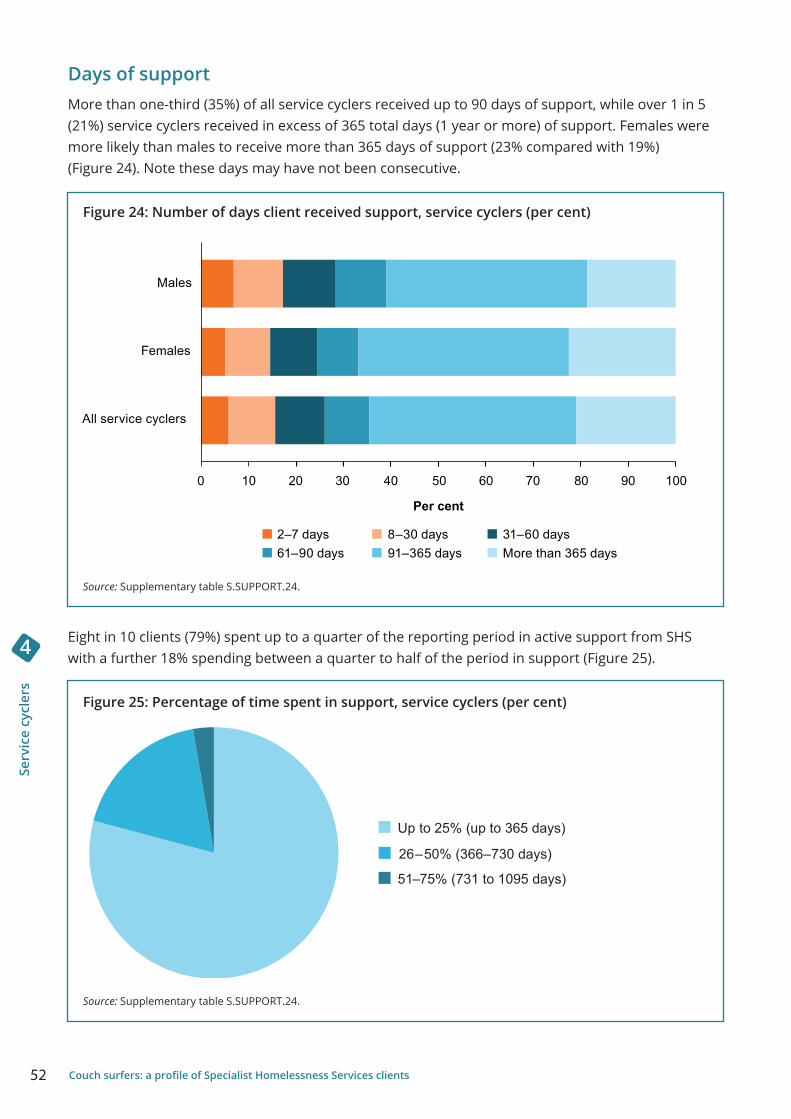
52 Couch surfers: a profile of Specialist Homelessness Services clients
Serv
ice
cycl
ers
4
Days of supportMore than one-third (35%) of all service cyclers received up to 90 days of support, while over 1 in 5 (21%) service cyclers received in excess of 365 total days (1 year or more) of support. Females were more likely than males to receive more than 365 days of support (23% compared with 19%) (Figure 24). Note these days may have not been consecutive.
Figure 24: Number of days client received support, service cyclers (per cent)
Source: Supplementary table S.SUPPORT.24.
Eight in 10 clients (79%) spent up to a quarter of the reporting period in active support from SHS with a further 18% spending between a quarter to half of the period in support (Figure 25).
Figure 25: Percentage of time spent in support, service cyclers (per cent)
Source: Supplementary table S.SUPPORT.24.
All service cyclers
Females
Males
More than 365 days91–365 days61–90 days31–60 days8–30 days2–7 days
0 10 20 30 40 50 60 70 80 90 100
Per cent
Up to 25% (up to 365 days)
26–50% (366–730 days)
51–75% (731 to 1095 days)
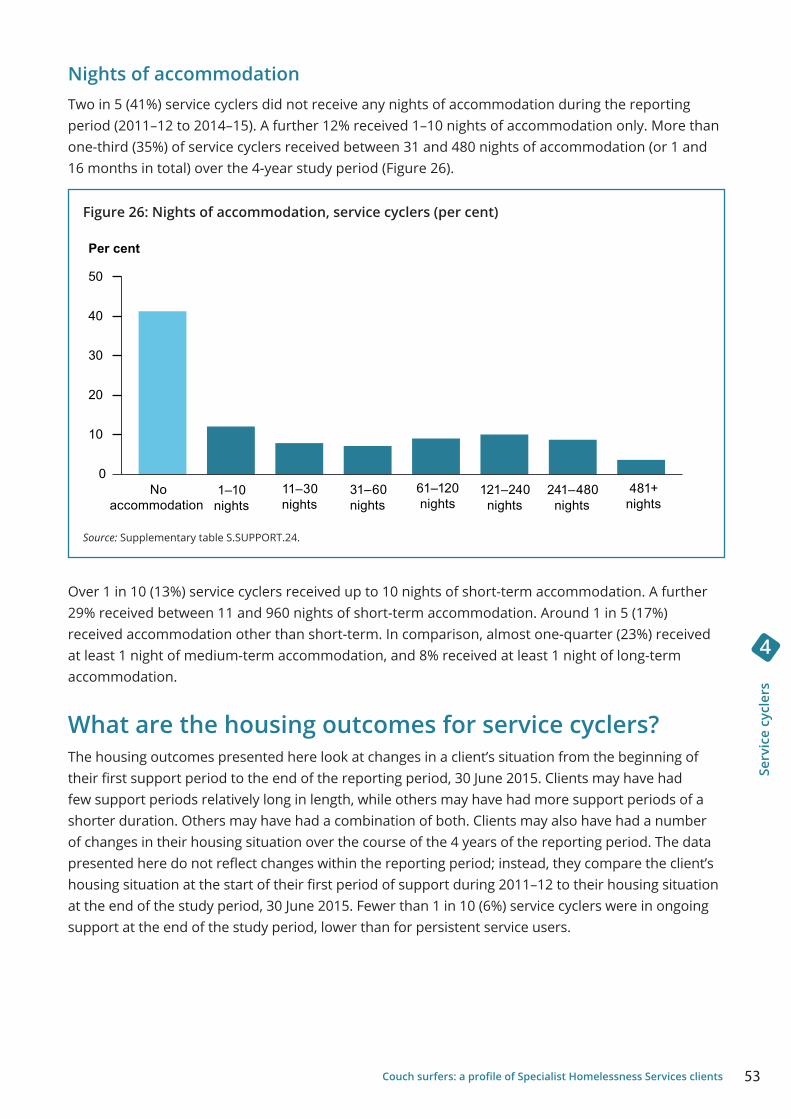
53Couch surfers: a profile of Specialist Homelessness Services clients
Se
rvic
e cy
cler
s
4
Nights of accommodationTwo in 5 (41%) service cyclers did not receive any nights of accommodation during the reporting period (2011–12 to 2014–15). A further 12% received 1–10 nights of accommodation only. More than one-third (35%) of service cyclers received between 31 and 480 nights of accommodation (or 1 and 16 months in total) over the 4-year study period (Figure 26).
Figure 26: Nights of accommodation, service cyclers (per cent)
Source: Supplementary table S.SUPPORT.24.
Over 1 in 10 (13%) service cyclers received up to 10 nights of short-term accommodation. A further 29% received between 11 and 960 nights of short-term accommodation. Around 1 in 5 (17%) received accommodation other than short-term. In comparison, almost one-quarter (23%) received at least 1 night of medium-term accommodation, and 8% received at least 1 night of long-term accommodation.
What are the housing outcomes for service cyclers? The housing outcomes presented here look at changes in a client’s situation from the beginning of their first support period to the end of the reporting period, 30 June 2015. Clients may have had few support periods relatively long in length, while others may have had more support periods of a shorter duration. Others may have had a combination of both. Clients may also have had a number of changes in their housing situation over the course of the 4 years of the reporting period. The data presented here do not reflect changes within the reporting period; instead, they compare the client’s housing situation at the start of their first period of support during 2011–12 to their housing situation at the end of the study period, 30 June 2015. Fewer than 1 in 10 (6%) service cyclers were in ongoing support at the end of the study period, lower than for persistent service users.
No accommodation
1–10 nights
11–30 nights
31–60 nights
61–120 nights
121–240 nights
241–480 nights
481+ nights
0
10
20
30
40
50
Per cent
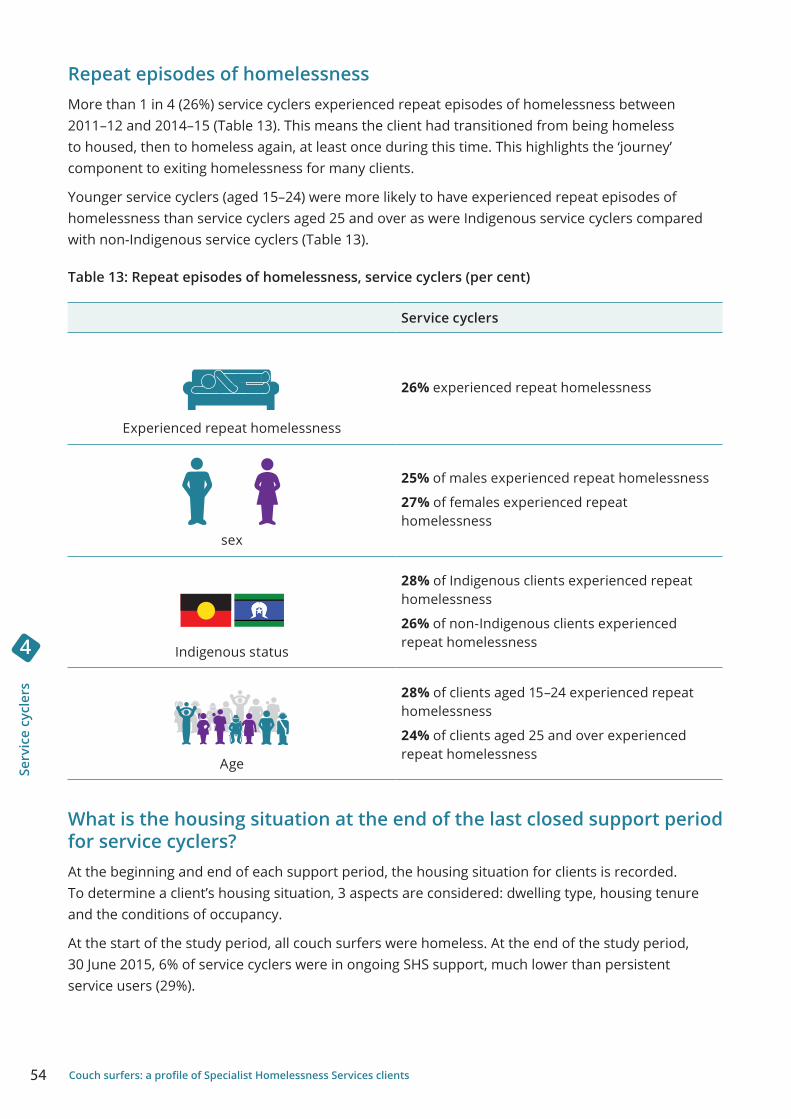
54 Couch surfers: a profile of Specialist Homelessness Services clients
Serv
ice
cycl
ers
4
Repeat episodes of homelessnessMore than 1 in 4 (26%) service cyclers experienced repeat episodes of homelessness between 2011–12 and 2014–15 (Table 13). This means the client had transitioned from being homeless to housed, then to homeless again, at least once during this time. This highlights the ‘journey’ component to exiting homelessness for many clients.
Younger service cyclers (aged 15–24) were more likely to have experienced repeat episodes of homelessness than service cyclers aged 25 and over as were Indigenous service cyclers compared with non-Indigenous service cyclers (Table 13).
Table 13: Repeat episodes of homelessness, service cyclers (per cent)
Service cyclers
Experienced repeat homelessness
26% experienced repeat homelessness
sex
25% of males experienced repeat homelessness
27% of females experienced repeat homelessness
Indigenous status
28% of Indigenous clients experienced repeat homelessness
26% of non-Indigenous clients experienced repeat homelessness
Age
28% of clients aged 15–24 experienced repeat homelessness
24% of clients aged 25 and over experienced repeat homelessness
What is the housing situation at the end of the last closed support period for service cyclers?At the beginning and end of each support period, the housing situation for clients is recorded. To determine a client’s housing situation, 3 aspects are considered: dwelling type, housing tenure and the conditions of occupancy.
At the start of the study period, all couch surfers were homeless. At the end of the study period, 30 June 2015, 6% of service cyclers were in ongoing SHS support, much lower than persistent service users (29%).
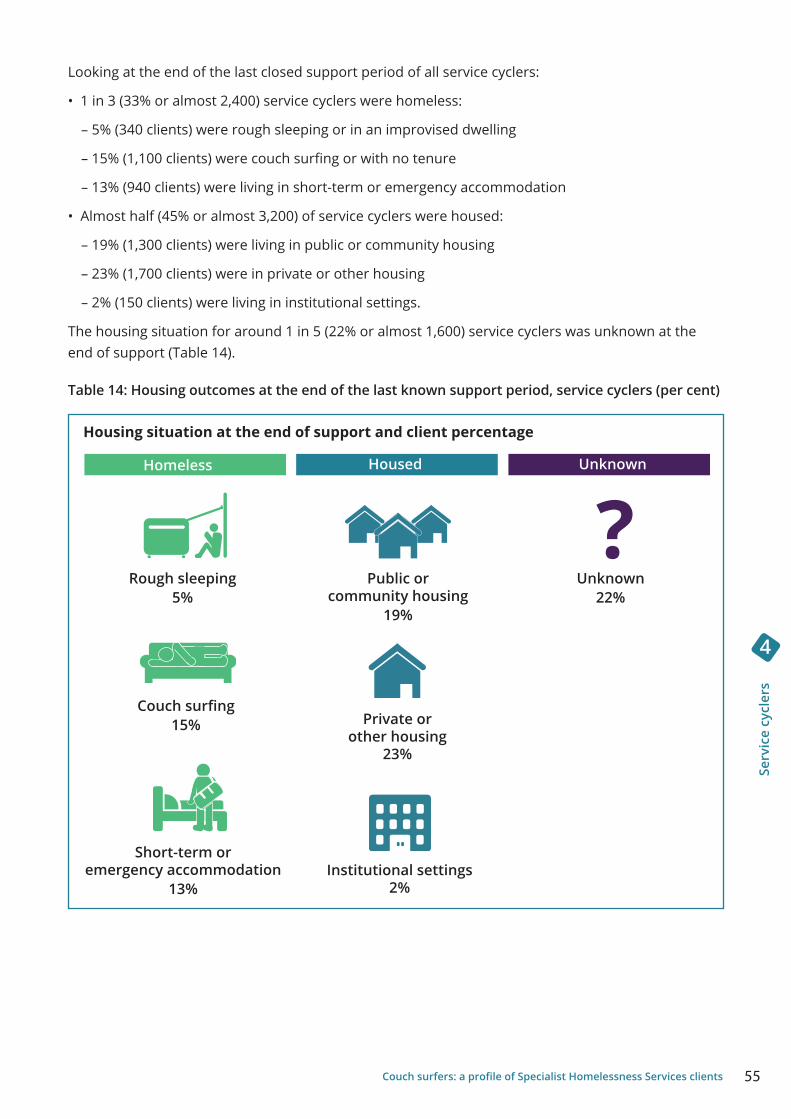
55Couch surfers: a profile of Specialist Homelessness Services clients
Se
rvic
e cy
cler
s
4
Looking at the end of the last closed support period of all service cyclers:
• 1 in 3 (33% or almost 2,400) service cyclers were homeless:
– 5% (340 clients) were rough sleeping or in an improvised dwelling
– 15% (1,100 clients) were couch surfing or with no tenure
– 13% (940 clients) were living in short-term or emergency accommodation
• Almost half (45% or almost 3,200) of service cyclers were housed:
– 19% (1,300 clients) were living in public or community housing
– 23% (1,700 clients) were in private or other housing
– 2% (150 clients) were living in institutional settings.
The housing situation for around 1 in 5 (22% or almost 1,600) service cyclers was unknown at the end of support (Table 14).
Table 14: Housing outcomes at the end of the last known support period, service cyclers (per cent)
Rough sleeping 5%
Couch surfing 15%
Short-term or emergency accommodation
13%
Housing situation at the end of support and client percentage
Unknown22%
Public or community housing
19%
Private or other housing
23%
Institutional settings 2%
?Homeless Housed Unknown
56 Couch surfers: a profile of Specialist Homelessness Services clients
Serv
ice
cycl
ers
4
• Female service cyclers were more likely than male service cyclers to be housed at the end of their last closed support period (49% compared with 39%), with a greater percentage of females living in private or other housing (26% compared with 20% of males).
• Male service cyclers were more likely than female service cyclers to be homeless at the end of support (39% compared with 29%), with 16% couch surfing or with no tenure and 15% in short-term or emergency accommodation.
• Younger service cyclers (aged 15–24) were more likely to be housed at the end of their support (42% housed compared with 34% homeless):
– Of those who were housed (42%): 1 in 4 (24%) were in private or other housing, 17% were in public or community housing and 1% were in institutional settings.
– Of those who were homeless (34%): 18% were couch surfing, 13% were in short term or emergency accommodation, and 4% were rough sleeping or in an improvised dwelling.
• The pattern for service cyclers aged 25 and over was not markedly different to that of younger service cyclers, with 47% housed and 32% homeless:
– Of those who were housed (47%): over 1 in 5 (21%) were in public or community housing and 23% were in private or other housing.
– Of those who remained homeless (32%): 14% were in short-term or emergency accommodation, 12% were couch surfing or with no tenure, and 6% were rough sleeping or in an improvised dwelling.
What does this tell us?The cohort of service cyclers was similar in size to the transitory service users, accounting for just over 4 in 10 (44%) of all couch surfers in this study. Most service cyclers were female and aged 15–24. The level of vulnerability was high in this group, with around 3 in 10 service cyclers experiencing at least 2 of the 3 vulnerability conditions: domestic or family violence, mental health issue, and/or problematic drug and/or alcohol use.
As with the other couch surfer cohorts, accommodation was the key reason that service cyclers sought assistance from SHS—primarily housing crisis or inadequate or inappropriate dwelling conditions. Despite the highest need for service cyclers being accommodation, over two-fifths (41%) did not receive any nights of accommodation during the reporting period.
Females were much more likely to report domestic and family violence as a reason for seeking assistance. Females were also more likely to receive mental health services or drug or alcohol counselling.
Repeat episodes of homelessness were lower for service cyclers than for the persistent service user cohort, but still notable. Over 1 in 4 (26%) service cyclers experienced homelessness more than once during the reporting period. That is, they had transitioned from homeless to housed, then to homeless again, at least once in the 4 years of the reporting period. This again highlights the ‘journey’ nature of exiting homelessness for many couch surfer clients.
57Couch surfers: a profile of Specialist Homelessness Services clients
Se
rvic
e cy
cler
s
4
Engagement with SHS does not mean an immediate end to homelessness. By the end of their last known support period, when service cyclers had engaged with SHS for a period of between 2 and 3 years, almost half (45%) were housed (this is higher than for transitory service users but lower than persistent service users). The remainder were homeless (with males more likely to be homeless than females). The housing outcome for over 1 in 5 (22%) service cyclers was unknown at the end of the reporting period. It is possible that these clients re-engaged with SHS agencies and sought further assistance after 30 June 2015.
Case study 2: Service cyclerFrankie*, 23, is emotionally exhausted, so cannot imagine how her parents are feeling. Her children, Cary, 2, and Abby, 4, are running up and down the hallway, laughing. They love being at nan and pop’s place. It is as if the last month hasn’t happened.
Frankie’s world fell apart the day her husband lost his job. Short-term unemployment turned into long-term unemployment, which turned into arguments, drinking and violence. That was 2 years ago. One night she just left, with a newborn baby and her daughter. She stayed with a friend for a few nights, and then went ‘home’—to her parents. Her friend encouraged her to go to an SHS agency to see what her options were. They found her some temporary accommodation while she worked out what to do next. A few weeks later, she was back with her husband, full of promises and hope.
This time, she is determined to make it on her own. She went back to the SHS agency for financial and housing assistance. Today, she has a part-time job and her parents have said they will mind the kids while she is at work. She now has her sights set on securing a place in public housing—and a permanent bed for her and the kids.
* This case story is not based on an actual person. It is based on de-identified data collated from the SHSC. It is intended to present an example of a ‘typical’ service cycler couch surfer; it is not the intention of the AIHW to stereotype homelessness clients.
58 Couch surfers: a profile of Specialist Homelessness Services clients
Tran
sito
ry s
ervi
ce u
sers
5
5 Transitory service users
Key findings
Transitory service users are clients who had at least 1 support period between 1 July 2011 and 30 June 2012, but did not receive any support from SHS agencies between 1 July 2012 and 30 June 2015. This cohort comprised almost 7,300 clients and was the largest of the 3 cohorts.
Consistent with the broader group of couch surfers:
• the majority of transitory service users were female. Most transitory service users were aged 15–24. They were more likely to receive services in Major cities and more likely to report living alone
• the most common reason for seeking assistance was accommodation. Male transitory service users were more likely than females to seek assistance for financial difficulties and unemployment
• female transitory service users were around 4 times as likely as males to report domestic or family violence as a reason for seeking assistance.
Transitory service users, when compared with persistent service users and service cyclers, were less likely to:
• ever report having a mental health issue, problematic drug and/or alcohol use or experiencing domestic or family violence
• receive some form of accommodation. While 7 in 10 needed accommodation, almost 1 in 3 of these clients did not receive accommodation services
• receive more than 1 support period. Transitory service users were most likely to have only 1 support period, with 1 in 4 clients receiving only 1 day of support and most receiving 30 days or fewer.
Within 1 year, 18% (or around 1,300) of transitory service users were assisted into housing; not returning for SHS assistance in the following 3 years. Despite 3 in 5 being recorded as experiencing homelessness at the end of SHS support and the housing situation of the remaining 21% being unknown, none of these remaining 6,000 clients returned to an SHS agency for assistance.
Who are transitory service users?There were about 7,300 transitory service users in 2011–12. Transitory service users presented to SHS agencies for assistance in only the first financial year of the study. That is, they presented to an agency for assistance at least once between 1 July 2011 and 30 June 2012, and did not present again by 30 June 2015.
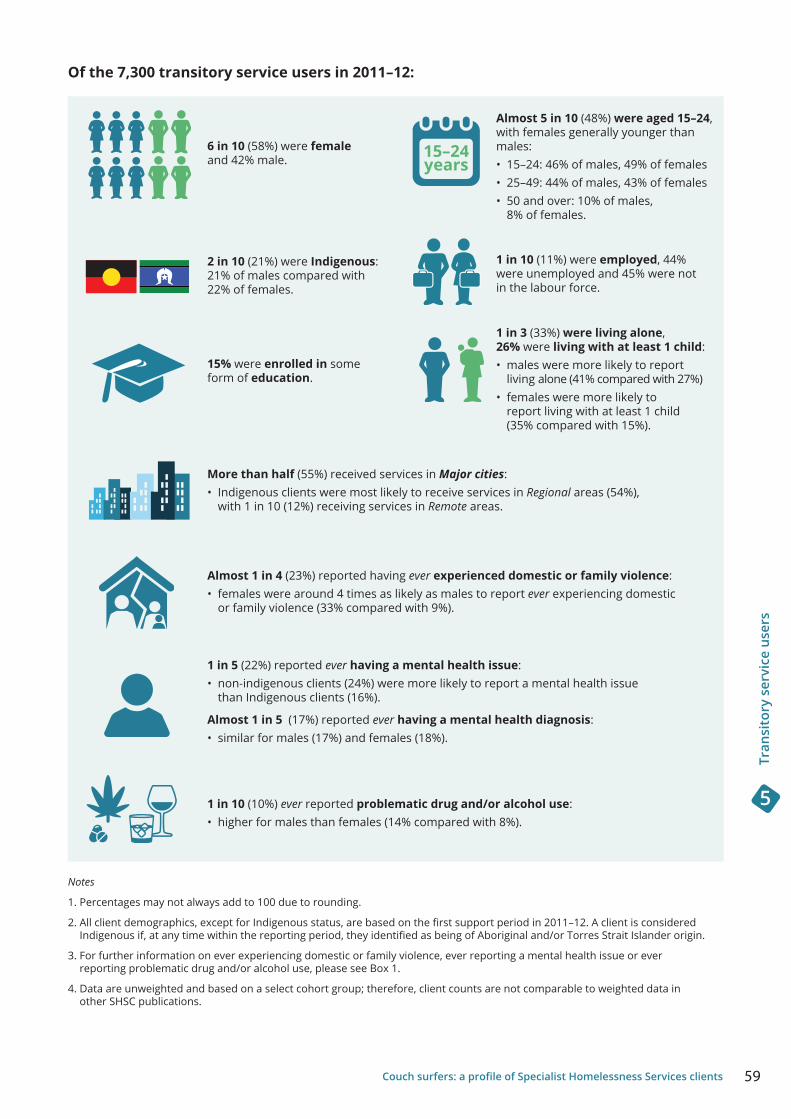
59Couch surfers: a profile of Specialist Homelessness Services clients
Tran
sito
ry s
ervi
ce u
sers
5
Of the 7,300 transitory service users in 2011–12:
Notes
1. Percentages may not always add to 100 due to rounding.
2. All client demographics, except for Indigenous status, are based on the first support period in 2011–12. A client is considered Indigenous if, at any time within the reporting period, they identified as being of Aboriginal and/or Torres Strait Islander origin.
3. For further information on ever experiencing domestic or family violence, ever reporting a mental health issue or ever reporting problematic drug and/or alcohol use, please see Box 1.
4. Data are unweighted and based on a select cohort group; therefore, client counts are not comparable to weighted data in other SHSC publications.
1 in 10 (10%) ever reported problematic drug and/or alcohol use: • higher for males than females (14% compared with 8%).
6 in 10 (58%) were female and 42% male.
Almost 5 in 10 (48%) were aged 15–24, with females generally younger than males:• 15–24: 46% of males, 49% of females • 25–49: 44% of males, 43% of females• 50 and over: 10% of males,
8% of females.
2 in 10 (21%) were Indigenous: 21% of males compared with 22% of females.
1 in 10 (11%) were employed, 44% were unemployed and 45% were not in the labour force.
15% were enrolled in some form of education .
1 in 3 (33%) were living alone, 26% were living with at least 1 child:• males were more likely to report
living alone (41% compared with 27%)• females were more likely to
report living with at least 1 child (35% compared with 15%).
Almost 1 in 4 (23%) reported having ever experienced domestic or family violence: • females were around 4 times as likely as males to report ever experiencing domestic
or family violence (33% compared with 9%).
1 in 5 (22%) reported ever having a mental health issue:• non-indigenous clients (24%) were more likely to report a mental health issue
than Indigenous clients (16%).
Almost 1 in 5 (17%) reported ever having a mental health diagnosis:• similar for males (17%) and females (18%).
15–24years
More than half (55%) received services in Major cities:• Indigenous clients were most likely to receive services in Regional areas (54%),
with 1 in 10 (12%) receiving services in Remote areas.
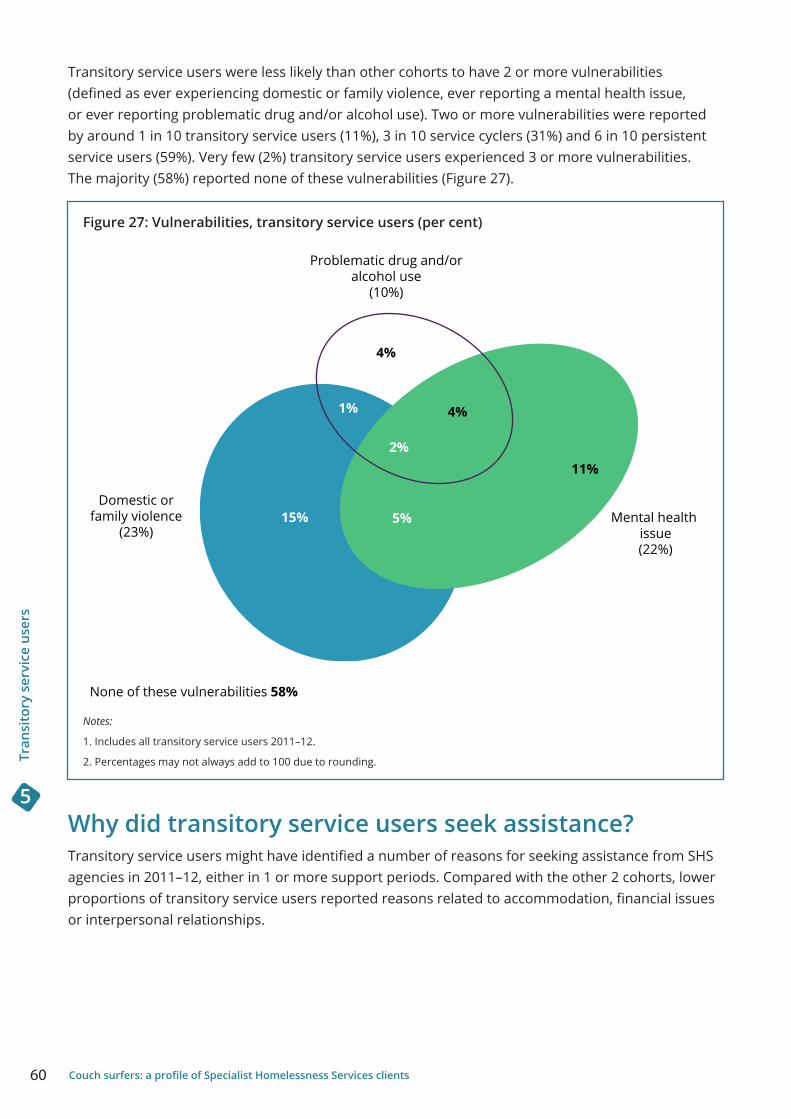
60 Couch surfers: a profile of Specialist Homelessness Services clients
Tran
sito
ry s
ervi
ce u
sers
5
Transitory service users were less likely than other cohorts to have 2 or more vulnerabilities (defined as ever experiencing domestic or family violence, ever reporting a mental health issue, or ever reporting problematic drug and/or alcohol use). Two or more vulnerabilities were reported by around 1 in 10 transitory service users (11%), 3 in 10 service cyclers (31%) and 6 in 10 persistent service users (59%). Very few (2%) transitory service users experienced 3 or more vulnerabilities. The majority (58%) reported none of these vulnerabilities (Figure 27).
Figure 27: Vulnerabilities, transitory service users (per cent)
Notes:
1. Includes all transitory service users 2011–12.
2. Percentages may not always add to 100 due to rounding.
Why did transitory service users seek assistance?Transitory service users might have identified a number of reasons for seeking assistance from SHS agencies in 2011–12, either in 1 or more support periods. Compared with the other 2 cohorts, lower proportions of transitory service users reported reasons related to accommodation, financial issues or interpersonal relationships.
None of these vulnerabilities 58%
Mental health issue(22%)
Domestic orfamily violence
(23%)
Problematic drug and/oralcohol use
(10%)
4%
2%
5%
1%
4%
11%
15%
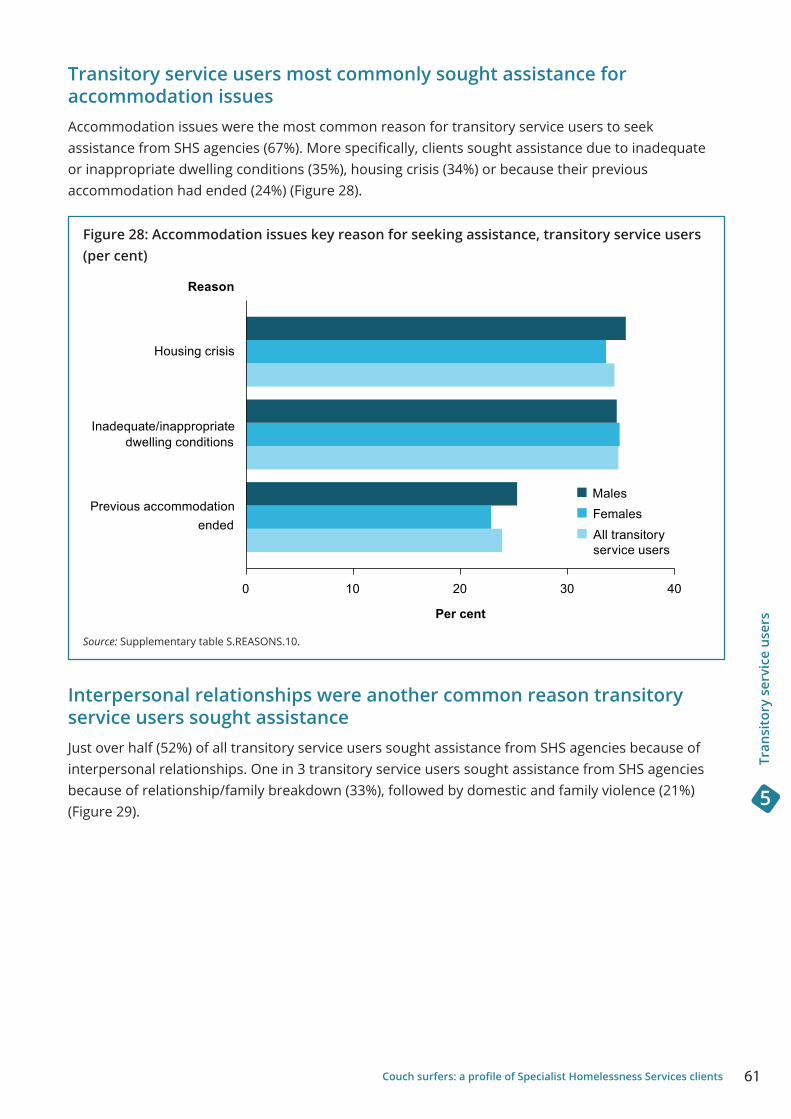
61Couch surfers: a profile of Specialist Homelessness Services clients
Tran
sito
ry s
ervi
ce u
sers
5
Transitory service users most commonly sought assistance for accommodation issuesAccommodation issues were the most common reason for transitory service users to seek assistance from SHS agencies (67%). More specifically, clients sought assistance due to inadequate or inappropriate dwelling conditions (35%), housing crisis (34%) or because their previous accommodation had ended (24%) (Figure 28).
Figure 28: Accommodation issues key reason for seeking assistance, transitory service users (per cent)
Source: Supplementary table S.REASONS.10.
Interpersonal relationships were another common reason transitory service users sought assistanceJust over half (52%) of all transitory service users sought assistance from SHS agencies because of interpersonal relationships. One in 3 transitory service users sought assistance from SHS agencies because of relationship/family breakdown (33%), followed by domestic and family violence (21%) (Figure 29).
endedPrevious accommodation
dwelling conditionsInadequate/inappropriate
Housing crisis
All transitoryservice users
FemalesMales
Reason
0 10 20 30 40
Per cent
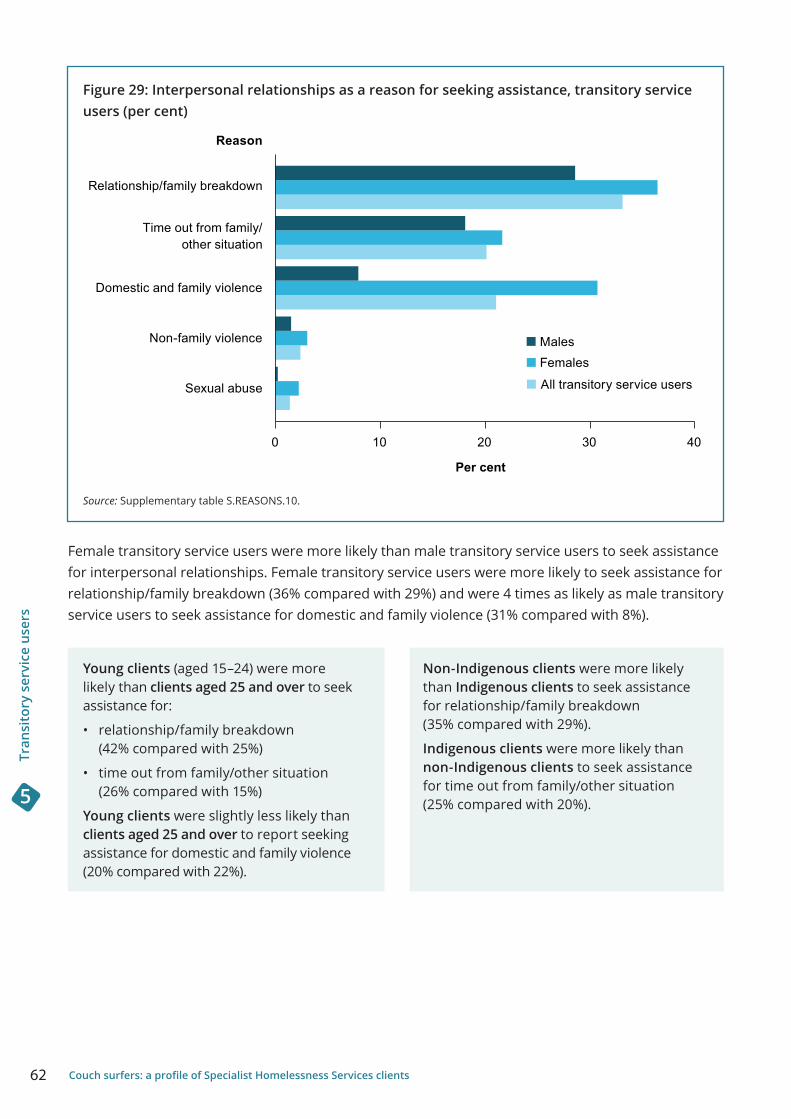
62 Couch surfers: a profile of Specialist Homelessness Services clients
Tran
sito
ry s
ervi
ce u
sers
5
Figure 29: Interpersonal relationships as a reason for seeking assistance, transitory service users (per cent)
Source: Supplementary table S.REASONS.10.
Female transitory service users were more likely than male transitory service users to seek assistance for interpersonal relationships. Female transitory service users were more likely to seek assistance for relationship/family breakdown (36% compared with 29%) and were 4 times as likely as male transitory service users to seek assistance for domestic and family violence (31% compared with 8%).
Young clients (aged 15–24) were more likely than clients aged 25 and over to seek assistance for:
• relationship/family breakdown (42% compared with 25%)
• time out from family/other situation (26% compared with 15%)
Young clients were slightly less likely than clients aged 25 and over to report seeking assistance for domestic and family violence (20% compared with 22%).
Non-Indigenous clients were more likely than Indigenous clients to seek assistance for relationship/family breakdown (35% compared with 29%).
Indigenous clients were more likely than non-Indigenous clients to seek assistance for time out from family/other situation (25% compared with 20%).
Sexual abuse
Non-family violence
Domestic and family violence
other situationTime out from family/
Relationship/family breakdown
Reason
All transitory service users
FemalesMales
0 10 20 30 40
Per cent
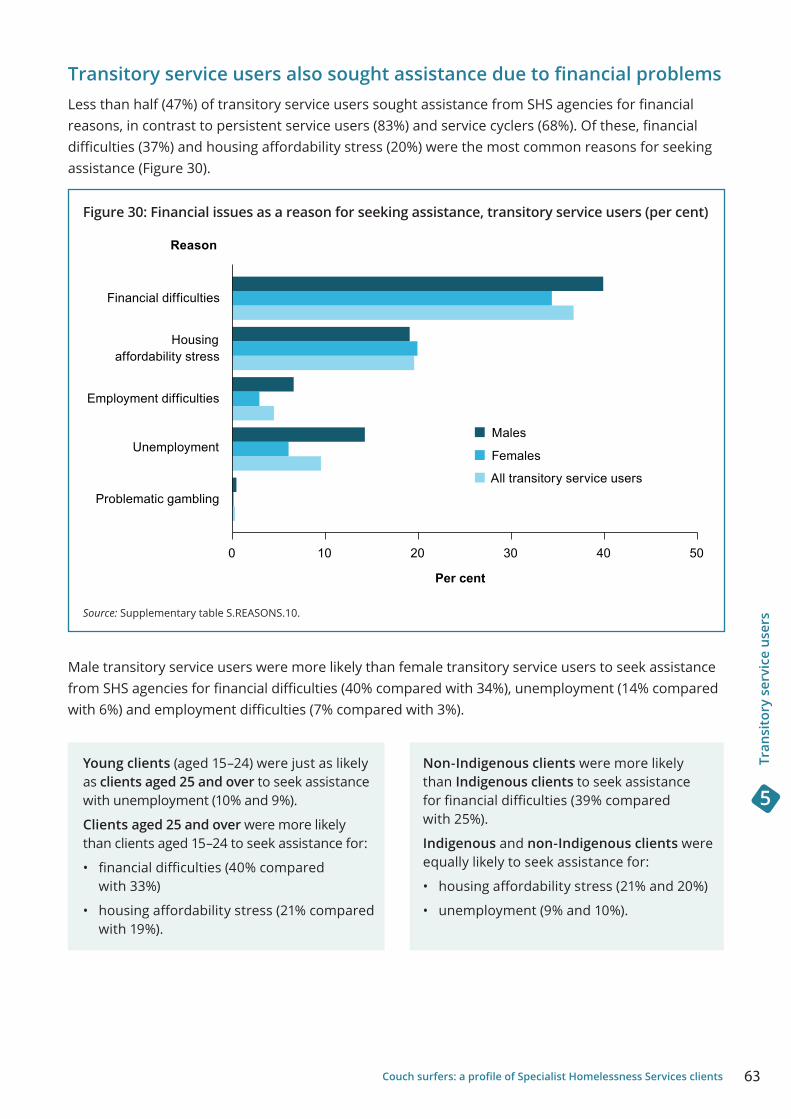
63Couch surfers: a profile of Specialist Homelessness Services clients
Tran
sito
ry s
ervi
ce u
sers
5
Transitory service users also sought assistance due to financial problemsLess than half (47%) of transitory service users sought assistance from SHS agencies for financial reasons, in contrast to persistent service users (83%) and service cyclers (68%). Of these, financial difficulties (37%) and housing affordability stress (20%) were the most common reasons for seeking assistance (Figure 30).
Figure 30: Financial issues as a reason for seeking assistance, transitory service users (per cent)
Source: Supplementary table S.REASONS.10.
Male transitory service users were more likely than female transitory service users to seek assistance from SHS agencies for financial difficulties (40% compared with 34%), unemployment (14% compared with 6%) and employment difficulties (7% compared with 3%).
Young clients (aged 15–24) were just as likely as clients aged 25 and over to seek assistance with unemployment (10% and 9%).
Clients aged 25 and over were more likely than clients aged 15–24 to seek assistance for:
• financial difficulties (40% compared with 33%)
• housing affordability stress (21% compared with 19%).
Non-Indigenous clients were more likely than Indigenous clients to seek assistance for financial difficulties (39% compared with 25%).
Indigenous and non-Indigenous clients were equally likely to seek assistance for:
• housing affordability stress (21% and 20%)
• unemployment (9% and 10%).
Problematic gambling
Unemployment
Employment difficulties
affordability stressHousing
Financial difficulties
All transitory service users
Females
Males
Reason
0 10 20 30 40 50
Per cent
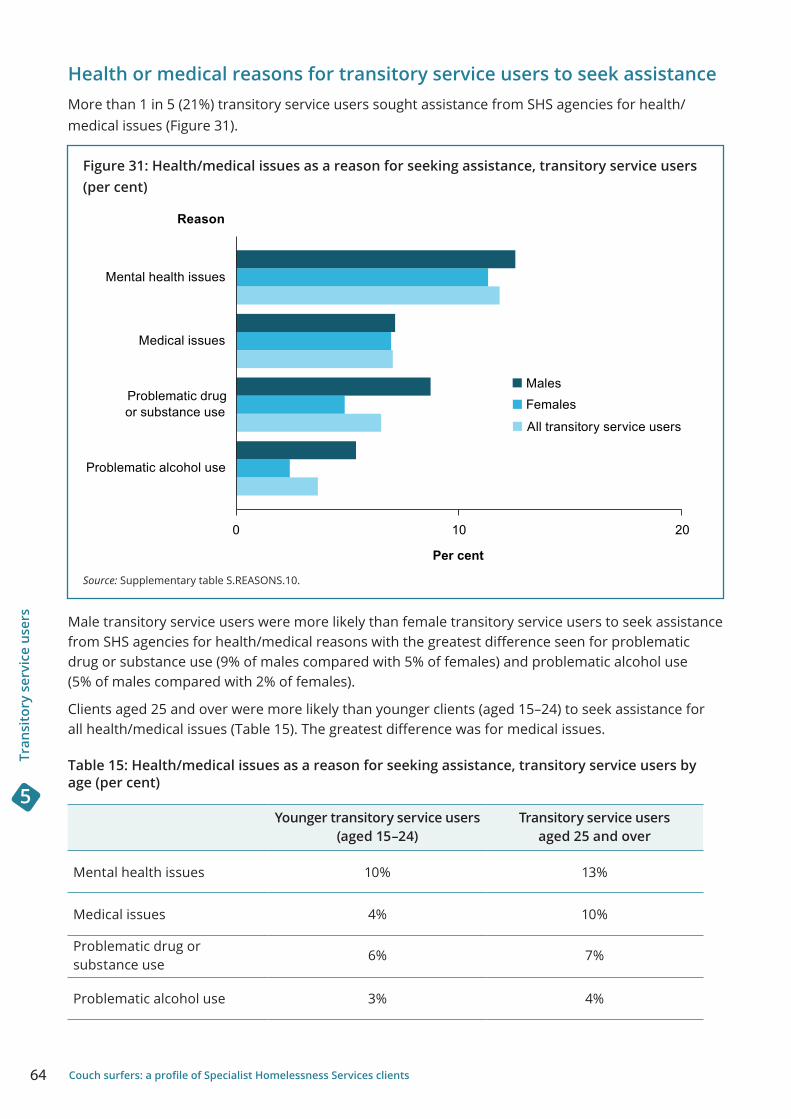
64 Couch surfers: a profile of Specialist Homelessness Services clients
Tran
sito
ry s
ervi
ce u
sers
5
Health or medical reasons for transitory service users to seek assistance More than 1 in 5 (21%) transitory service users sought assistance from SHS agencies for health/medical issues (Figure 31).
Figure 31: Health/medical issues as a reason for seeking assistance, transitory service users (per cent)
Source: Supplementary table S.REASONS.10.
Male transitory service users were more likely than female transitory service users to seek assistance from SHS agencies for health/medical reasons with the greatest difference seen for problematic drug or substance use (9% of males compared with 5% of females) and problematic alcohol use (5% of males compared with 2% of females).
Clients aged 25 and over were more likely than younger clients (aged 15–24) to seek assistance for all health/medical issues (Table 15). The greatest difference was for medical issues.
Table 15: Health/medical issues as a reason for seeking assistance, transitory service users by age (per cent)
Younger transitory service users (aged 15–24)
Transitory service users aged 25 and over
Mental health issues 10% 13%
Medical issues 4% 10%
Problematic drug or substance use
6% 7%
Problematic alcohol use 3% 4%
Problematic alcohol use
or substance useProblematic drug
Medical issues
Mental health issues
Reason
All transitory service users
FemalesMales
0 10 20
Per cent
65Couch surfers: a profile of Specialist Homelessness Services clients
Tran
sito
ry s
ervi
ce u
sers
5
What services did transitory service users need?While the focus of SHS support is on providing stable housing or assisting clients to remain housed, agencies offer many other services targeting underlying barriers to sustainable housing.
Although transitory service users only presented to SHS agencies in the first year (2011–12) of the 4-year reporting period, these clients might have reported multiple needs within 1 or several support periods.
Transitory service users are most likely to need services related to accommodation provision As with other couch surfer cohorts, the need for any accommodation by transitory service users was high (69%). Assistance with short-term or emergency accommodation was requested most frequently (46%), followed by long-term housing (41%), with medium term or transitional housing requested by 3 in 10 (29%) transitory service users.
There was little difference between male and female transitory service users in the need for short-term or emergency accommodation (45% compared with 46%). Female transitory service users were, however, more likely to need long-term housing than male transitory service users (43% compared with 39%) and medium-term or transitional housing (31% compared with 27%).
Indigenous transitory service users were more likely than non-Indigenous transitory service users to need accommodation overall (80% compared with 69%); more specifically, short-term or emergency accommodation (55% compared with 45%) and long-term housing (48% compared with 42%).
There was little difference between younger transitory service users (aged 15–24) and those aged 25 and over in their need for long-term housing (41% compared with 42%). Younger clients, however, had a greater need for medium-term or transitional housing (35% compared with 24% of clients aged 25 and over) and a lower need for short-term or emergency accommodation (44% compared with 47%).
‘General services’ are also commonly needed by transitory service usersThe majority of transitory service users (93%) needed at least 1 ‘general service’, the most common of these being advice/information (80%), advocacy/liaison (47%) and material aid/brokerage (27%). Around 1 in 5 transitory service users needed transport (21%), meals (19%) and laundry/shower facilities (17%).
Female transitory service users were more likely than male transitory service users to need assistance for domestic/family violence (20% compared with 4%), transport services (23% compared with 18%), family/relationship assistance (20% compared with 12%) and legal information (12% compared with 6%).
Younger transitory service users (aged 15–24) were more likely than clients aged 25 and over to need advice/information (82% compared with 79%), transport services (27% compared with 15%), living skills/personal development (27% compared with 12%), financial information (22% compared with 16%) and family/relationship assistance (22% compared with 12%).
Indigenous transitory service users were more likely than non-Indigenous transitory service users to need advocacy/liaison (53% compared with 48%), transport services (30% compared with 20%), meals (25% compared with 19%) and laundry/shower facilities (24% compared with 17%).
66 Couch surfers: a profile of Specialist Homelessness Services clients
Tran
sito
ry s
ervi
ce u
sers
5
Transitory service users needed access to mental health and other specialist servicesTransitory service users were much less likely than persistent service users (38%) or service cyclers (19%) to need access to mental health services (7%). This included access to general mental health services (5%), psychological services (3%) and psychiatric services (1%).
One in 7 (15%) transitory service users needed other specialist services. These services included health/medical services (9%), specialist counselling services (5%) and other specialised services (6%).
What services were provided to transitory service users?Services available to clients range from the direct provision of accommodation to specialised services, such as counselling or legal support. Agencies may provide these services directly to clients, or they may refer them to another service.
Transitory service users were most likely to be provided with short-term or emergency accommodationOver two-thirds (69%) of transitory service users identified a need for accommodation services (Figure 32). Of these clients:
• 46% needed short-term or emergency accommodation, and it was provided to 54% of those needing this service
• 29% needed medium-term or transitional housing, provided to 23%
• 41% needed long-term housing, provided to 7%.
While long-term housing was less likely to be provided to couch surfers than short-term or emergency accommodation or medium-term or transitional housing, it was most likely to be referred (40% compared with 27% referrals for medium-term or transitional housing and 16% referrals for short-term or emergency accommodation).
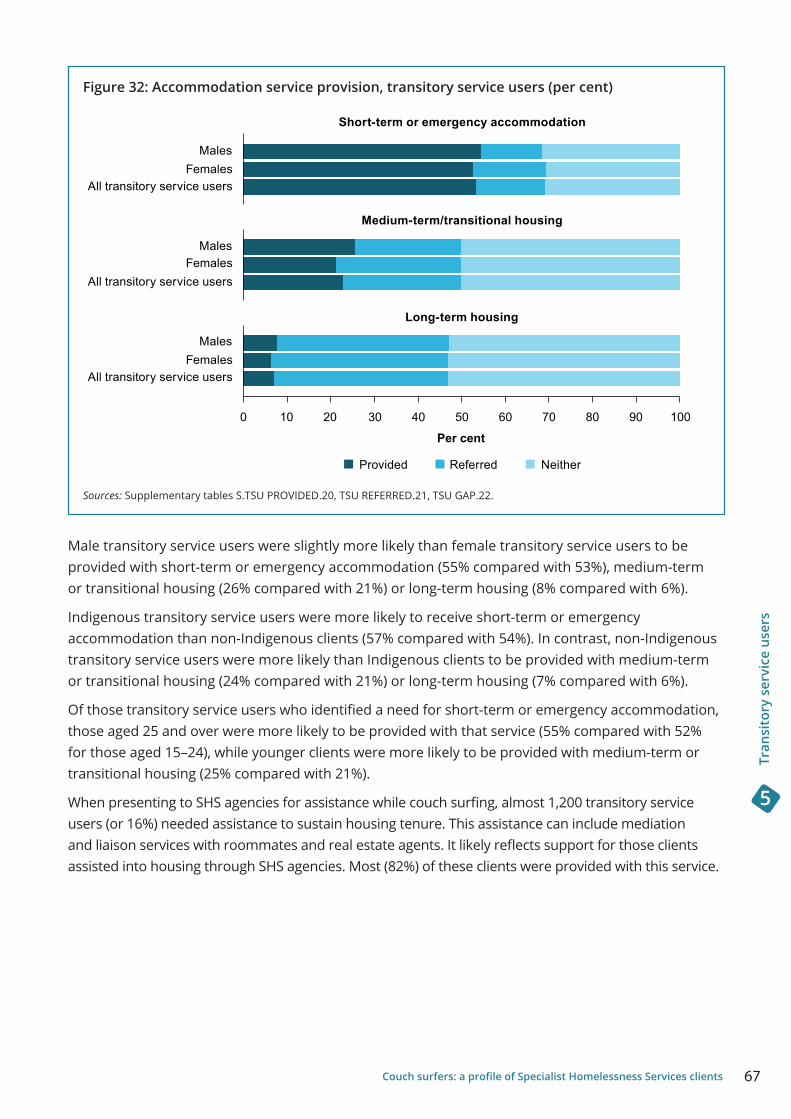
67Couch surfers: a profile of Specialist Homelessness Services clients
Tran
sito
ry s
ervi
ce u
sers
5
Figure 32: Accommodation service provision, transitory service users (per cent)
Sources: Supplementary tables S.TSU PROVIDED.20, TSU REFERRED.21, TSU GAP.22.
Male transitory service users were slightly more likely than female transitory service users to be provided with short-term or emergency accommodation (55% compared with 53%), medium-term or transitional housing (26% compared with 21%) or long-term housing (8% compared with 6%).
Indigenous transitory service users were more likely to receive short-term or emergency accommodation than non-Indigenous clients (57% compared with 54%). In contrast, non-Indigenous transitory service users were more likely than Indigenous clients to be provided with medium-term or transitional housing (24% compared with 21%) or long-term housing (7% compared with 6%).
Of those transitory service users who identified a need for short-term or emergency accommodation, those aged 25 and over were more likely to be provided with that service (55% compared with 52% for those aged 15–24), while younger clients were more likely to be provided with medium-term or transitional housing (25% compared with 21%).
When presenting to SHS agencies for assistance while couch surfing, almost 1,200 transitory service users (or 16%) needed assistance to sustain housing tenure. This assistance can include mediation and liaison services with roommates and real estate agents. It likely reflects support for those clients assisted into housing through SHS agencies. Most (82%) of these clients were provided with this service.
Long-term housing
Medium-term/transitional housing
Short-term or emergency accommodation
All transitory service usersFemales
Males
All transitory service usersFemales
Males
All transitory service usersFemales
Males
NeitherReferredProvided
0 10 20 30 40 50 60 70 80 90 100
Per cent
68 Couch surfers: a profile of Specialist Homelessness Services clients
Tran
sito
ry s
ervi
ce u
sers
5
Provision of ‘general services’The majority (93%) of transitory service users needed at least 1 general service. Most of the ‘general services’ needed by clients were provided:
• advice/information (needed by 80%, provided to 98% of those needing this service)
• advocacy/liaison on behalf of client (needed by 47%, provided to 95%)
• material aid/brokerage (needed by 27%, provided to 83%)
• transport (needed by 21%, provided to 94%)
• meals (needed by 19%, provided to 95%)
• financial information (needed by 19%, provided to 82%).
Referral of servicesAlmost one-quarter (23%) of transitory service users who identified a need for accommodation services received a referral for that service.
For transitory service users, the most frequently referred accommodation service was long term housing, with 40% of clients who needed this type of accommodation referred to an alternative service provider. Additionally, more than 1 in 4 (27%) clients who needed medium-term or transitional housing and 16% of clients who needed short-term or emergency accommodation were referred to another service.
More transitory service users aged 25 and over who reported a need for long-term housing were referred to another service than younger transitory service users (aged 15–24) (43% compared with 37%). Indigenous transitory service users were more likely than non Indigenous transitory service users to be referred for long-term housing (45% compared with 40%).
What are the gaps in service provision?Unmet needs (also referred to as a gap in service provision) are those services that a client identified as needing but did not receive or for which the client was referred to another agency.
Transitory service users accessed support within the first year of the study period only. Therefore, their needs are also assessed within this time period.
The largest gap in service provision for transitory service users was in long term housing, followed by medium-term or transitional housingSimilar to other couch surfer cohorts, many transitory service users needed accommodation services (69%); however, around 1 in 3 (31%) of these clients were neither provided with it nor referred to another agency for assistance. Transitory services users were less likely than persistent service users and service cyclers to receive the accommodation they needed. This unmet need for transitory service users varies across accommodation types:
• short-term or emergency accommodation: 31% neither provided nor referred
• medium-term or transitional housing: 50% neither provided nor referred
• long-term housing: 53% neither provided nor referred.
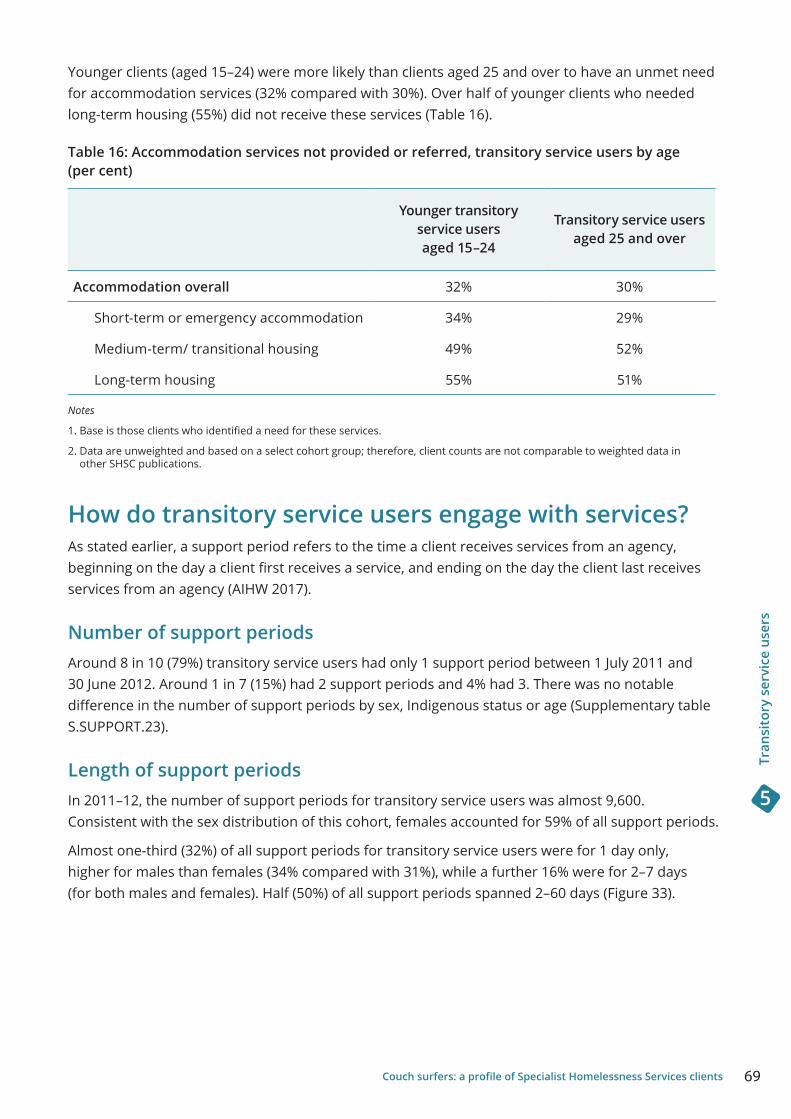
69Couch surfers: a profile of Specialist Homelessness Services clients
Tran
sito
ry s
ervi
ce u
sers
5
Younger clients (aged 15–24) were more likely than clients aged 25 and over to have an unmet need for accommodation services (32% compared with 30%). Over half of younger clients who needed long-term housing (55%) did not receive these services (Table 16).
Table 16: Accommodation services not provided or referred, transitory service users by age (per cent)
Younger transitory service users aged 15–24
Transitory service users aged 25 and over
Accommodation overall 32% 30%
Short-term or emergency accommodation 34% 29%
Medium-term/ transitional housing 49% 52%
Long-term housing 55% 51%
Notes
1. Base is those clients who identified a need for these services.
2. Data are unweighted and based on a select cohort group; therefore, client counts are not comparable to weighted data in other SHSC publications.
How do transitory service users engage with services?As stated earlier, a support period refers to the time a client receives services from an agency, beginning on the day a client first receives a service, and ending on the day the client last receives services from an agency (AIHW 2017).
Number of support periodsAround 8 in 10 (79%) transitory service users had only 1 support period between 1 July 2011 and 30 June 2012. Around 1 in 7 (15%) had 2 support periods and 4% had 3. There was no notable difference in the number of support periods by sex, Indigenous status or age (Supplementary table S.SUPPORT.23).
Length of support periodsIn 2011–12, the number of support periods for transitory service users was almost 9,600. Consistent with the sex distribution of this cohort, females accounted for 59% of all support periods.
Almost one-third (32%) of all support periods for transitory service users were for 1 day only, higher for males than females (34% compared with 31%), while a further 16% were for 2–7 days (for both males and females). Half (50%) of all support periods spanned 2–60 days (Figure 33).
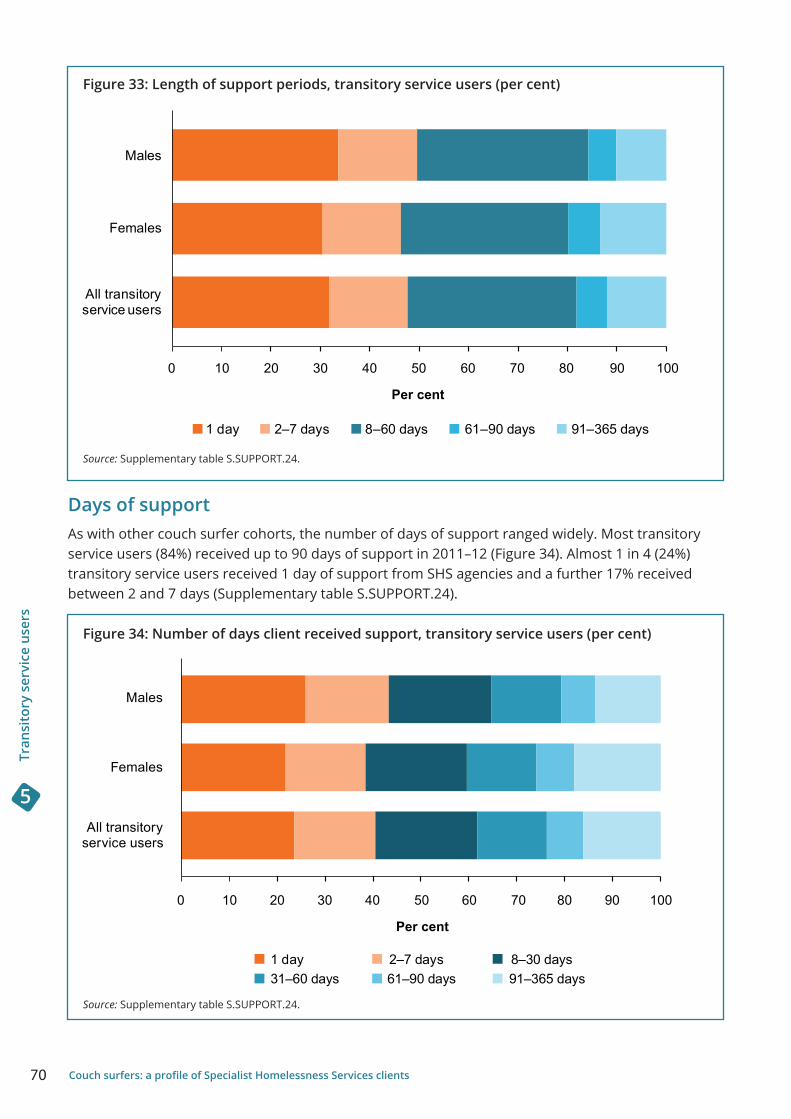
70 Couch surfers: a profile of Specialist Homelessness Services clients
Tran
sito
ry s
ervi
ce u
sers
5
Figure 33: Length of support periods, transitory service users (per cent)
Source: Supplementary table S.SUPPORT.24.
Days of supportAs with other couch surfer cohorts, the number of days of support ranged widely. Most transitory service users (84%) received up to 90 days of support in 2011–12 (Figure 34). Almost 1 in 4 (24%) transitory service users received 1 day of support from SHS agencies and a further 17% received between 2 and 7 days (Supplementary table S.SUPPORT.24).
Figure 34: Number of days client received support, transitory service users (per cent)
Source: Supplementary table S.SUPPORT.24.
service usersAll transitory
Females
Males
91–365 days61–90 days8–60 days2–7 days1 day
0 10 20 30 40 50 60 70 80 90 100
Per cent
service usersAll transitory
Females
Males
91–365 days61–90 days31–60 days8–30 days2–7 days1 day
0 10 20 30 40 50 60 70 80 90 100
Per cent
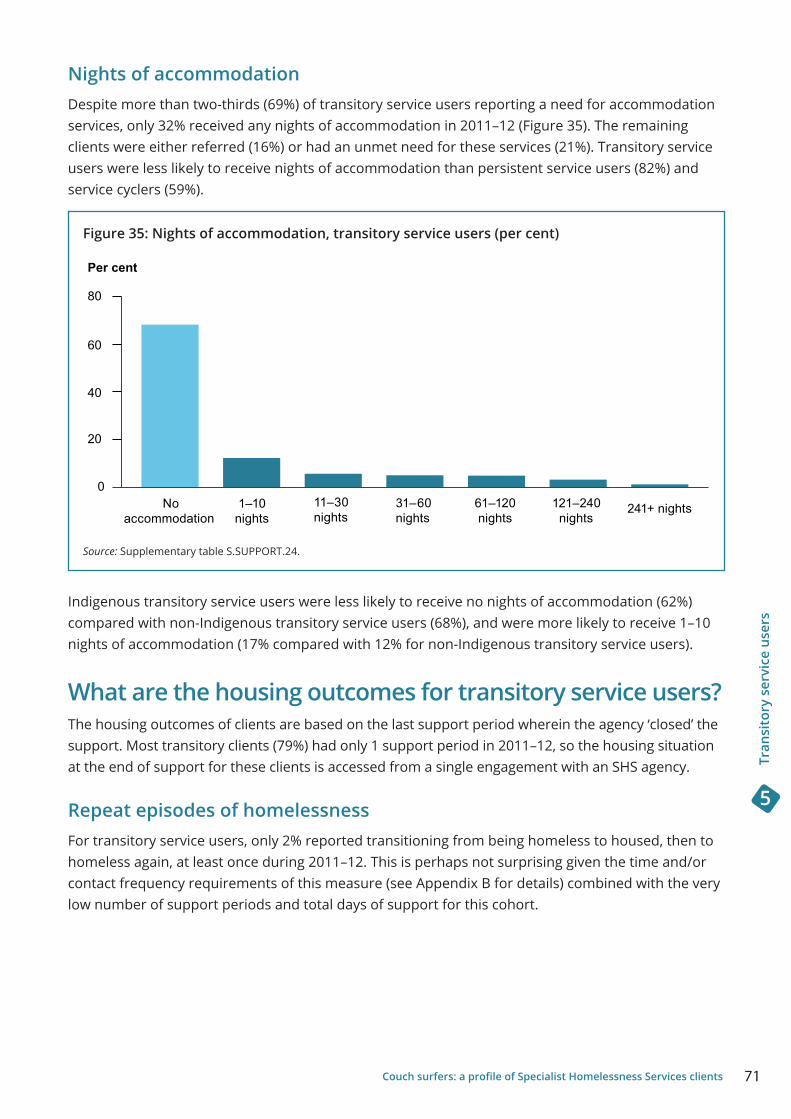
71Couch surfers: a profile of Specialist Homelessness Services clients
Tran
sito
ry s
ervi
ce u
sers
5
Nights of accommodationDespite more than two-thirds (69%) of transitory service users reporting a need for accommodation services, only 32% received any nights of accommodation in 2011–12 (Figure 35). The remaining clients were either referred (16%) or had an unmet need for these services (21%). Transitory service users were less likely to receive nights of accommodation than persistent service users (82%) and service cyclers (59%).
Figure 35: Nights of accommodation, transitory service users (per cent)
Source: Supplementary table S.SUPPORT.24.
Indigenous transitory service users were less likely to receive no nights of accommodation (62%) compared with non-Indigenous transitory service users (68%), and were more likely to receive 1–10 nights of accommodation (17% compared with 12% for non-Indigenous transitory service users).
What are the housing outcomes for transitory service users?The housing outcomes of clients are based on the last support period wherein the agency ‘closed’ the support. Most transitory clients (79%) had only 1 support period in 2011–12, so the housing situation at the end of support for these clients is accessed from a single engagement with an SHS agency.
Repeat episodes of homelessnessFor transitory service users, only 2% reported transitioning from being homeless to housed, then to homeless again, at least once during 2011–12. This is perhaps not surprising given the time and/or contact frequency requirements of this measure (see Appendix B for details) combined with the very low number of support periods and total days of support for this cohort.
No accommodation
1–10 nights
11–30 nights
31–60 nights
61–120 nights
121–240 nights
241+ nights
0
20
40
60
80
Per cent
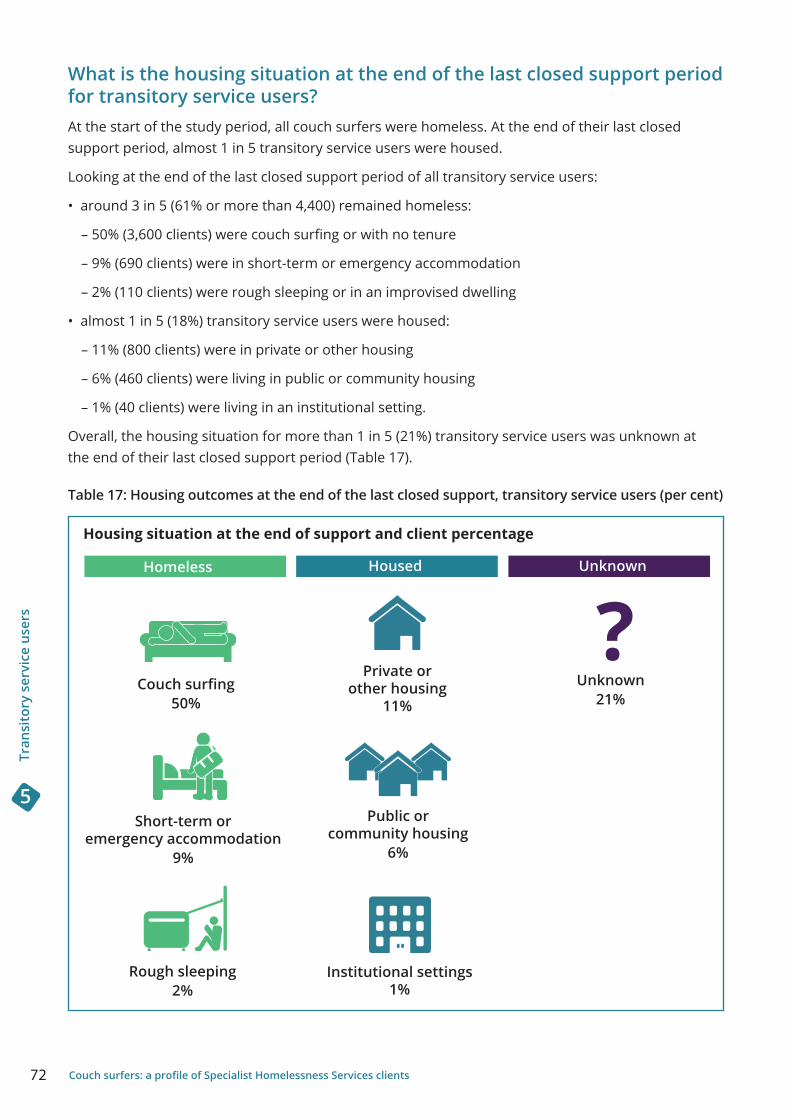
72 Couch surfers: a profile of Specialist Homelessness Services clients
Tran
sito
ry s
ervi
ce u
sers
5
What is the housing situation at the end of the last closed support period for transitory service users?At the start of the study period, all couch surfers were homeless. At the end of their last closed support period, almost 1 in 5 transitory service users were housed.
Looking at the end of the last closed support period of all transitory service users:
• around 3 in 5 (61% or more than 4,400) remained homeless:
– 50% (3,600 clients) were couch surfing or with no tenure
– 9% (690 clients) were in short-term or emergency accommodation
– 2% (110 clients) were rough sleeping or in an improvised dwelling
• almost 1 in 5 (18%) transitory service users were housed:
– 11% (800 clients) were in private or other housing
– 6% (460 clients) were living in public or community housing
– 1% (40 clients) were living in an institutional setting.
Overall, the housing situation for more than 1 in 5 (21%) transitory service users was unknown at the end of their last closed support period (Table 17).
Table 17: Housing outcomes at the end of the last closed support, transitory service users (per cent)
Housing situation at the end of support and client percentage
Unknown21%
Rough sleeping 2%
Couch surfing 50%
Short-term or emergency accommodation
9%
Public or community housing
6%
Institutional settings 1%
Private or other housing
11%
?Homeless Housed Unknown
73Couch surfers: a profile of Specialist Homelessness Services clients
Tran
sito
ry s
ervi
ce u
sers
5
• Male transitory service users were more likely than female transitory service users to be homeless at the end of their last closed support period (64% compared with 59%).
• Female transitory service users were more likely than male transitory service users to be housed at the end of their last closed support period (20% compared with 15%), with 12% of females in private accommodation and 7% of females in public or community housing.
• At the end of their last closed support period, similar percentages of Indigenous and non-Indigenous transitory service users reported being homeless (61% and 60%).
• There was little difference in the housing outcomes when comparing the different age groups, with 60% of transitory service users aged 15–24 remaining homeless compared with 62% of those aged 25 and over. The housing outcome of younger transitory service users was more likely to be unknown (23% compared with 19% for those aged 25 and over).
What does this tell us?Transitory service users were the largest of the 3 cohorts, accounting for 45% of all couch surfers in the study group. During 2011–12, they accessed SHS agencies for fewer and shorter periods of support than the other cohorts and they did not return for assistance in the following 3 years of the study period.
Transitory services users were less likely than other couch surfer cohorts to present to SHS agencies for financial reasons. They were also the least likely to have reported experiencing mental health issues, domestic or family violence and/or problematic drug and/or alcohol use. Many transitory service users reported having none of these vulnerabilities (58%), compared with service cyclers (35%) and persistent service users (12%). This is consistent with the literature suggesting that this group has less complex needs than those who access services for a longer amount of time (Reynolds 2008).
Across the couch surfer cohorts, transitory service users were less likely to be provided the services they needed. Considering accommodation, transitory service users were more likely to have an unmet need (31%), neither being provided with nor referred for the accommodation they needed (compared with 15% for service cyclers and 5% for persistent service users). Furthermore, they were more likely to be homeless (61%) at the end of support (compared with 33% for service cyclers and 38% for persistent service users). The majority of these transitory service user clients were couch surfing (50%). This highlights that engagement with SHS does not mean an immediate end to homelessness.
Beyond receiving support from SHS agencies, the housing journey of these clients cannot be followed further; therefore, it is not possible to determine how long these clients remained homeless or how many became housed after support ended. With the future availability of SHSC longitudinal data sets over longer periods of time and the potential to integrate the SHSC with other administrative data sets, the outcomes of these clients can be better understood.
74 Couch surfers: a profile of Specialist Homelessness Services clients
Tran
sito
ry s
ervi
ce u
sers
5
Case study 3: Transitory service user Mark*, 31, is staying with a friend. In the past 3 weeks, he has slept on a bed, on a couch, on an air mattress on the floor, and in a caravan in the backyard of a friend’s parents. This is the fourth friend he has stayed with since he could no longer afford the rent on his townhouse. His friends have been great, but he feels lost without a home base. He sought tenancy advice from an SHS agency, but they were unable to find him alternative accommodation.
Mark has borrowed his friend’s car to go for a job interview. He sold his car not long after he was laid off so that he could pay his rent. When that money ran out, he knew it was only a matter of time before he would lose the roof over his head. At 31, he never expected to be sleeping on a friend’s couch. He and his friends joke that after all their failed attempts to get him into the ocean, now he is ‘surfing’. Mike knows that if he doesn’t get a job soon, his couch surfing may be a lot more permanent than they all expect.
* This case story is not based on an actual person. It is based on de-identified data collated from the SHSC. It is intended to present an example of a ‘typical’ transitory couch surfer; it is not the intention of the AIHW to stereotype homelessness clients.
75Couch surfers: a profile of Specialist Homelessness Services clients
Appe
ndix
A: B
ackg
roun
d in
form
atio
n
Appendix A: Background information
Specialist Homelessness Services (SHS) assist people who are homeless, or at risk of homelessness, by assessing their needs, providing direct assistance and/or referring clients to other services as required. The Specialist Homelessness Services Collection (SHSC) began on 1 July 2011, replacing the previous Supported Accommodation Assistance Program (SAAP) National Data Collection, which collected data from homelessness agencies from 1996 to 2011. The SHSC is designed to enable monitoring of the assistance provided to people who are either experiencing homelessness or who are at risk of homelessness, and to contribute to the evidence base that shapes policy and service development.
The primary objective of the current project is to create a greater understanding of the use of specialist homelessness services by cohorts of vulnerable people as well as their circumstances and experiences throughout the process. Also examined are the housing outcomes of cohorts of homeless clients and the characteristics of those clients.
Preliminary resultsThe preliminary results of this study are outlined in the web report A profile of Specialist Homelessness Services homeless clients 2011–12 to 2014–15 (AIHW 2016). This web report provided a summary of the key cohorts of interest (rough sleepers, couch surfers and clients in short-term or emergency accommodation) and covered basic demographic details, reasons for seeking assistance, what services were needed, what services were provided and housing outcomes for clients.
Background to the Housing Journeys project
Defining homelessnessThere is no 1 universally agreed definition of homelessness; rather, there are significant complexities in both defining homelessness as well as the characteristics of people who might be considered homeless. Commonly referred to definitions of homelessness include the statistical definition developed by the Australian Bureau of Statistics (ABS), the United Nations definition of homelessness, and the cultural definition of homelessness, developed by Chamberlain and MacKenzie (2008).
The Australian Bureau of Statistics statistical definition of homelessness
The ABS statistical definition of homelessness is informed by an understanding of homelessness as ‘homelessness’ not ‘rooflessness’. Homelessness is a lack of 1 or more of the elements that represent home—which may include a sense of security, stability, privacy, safety and the ability to control living space (ABS 2012).
In brief, the ABS definition states that when a person does not have suitable accommodation alternatives, they are considered homeless if their current living arrangement:
• is in a dwelling that is inadequate; or
• has no tenure, or if their initial tenure is short and not extendable; or
• does not allow them to have control of, and access to, space for social relations.
76 Couch surfers: a profile of Specialist Homelessness Services clients
Appe
ndix
A: B
ackg
roun
d in
form
atio
n
It is important to note that people who lack 1 or more of these elements are not necessarily defined as homeless. While homelessness is not a choice, some people may choose to live in situations that mirror homelessness for a variety of reasons. These people are not included in homelessness counts (ABS 2012).
The United Nations definition of homelessness
The United Nations identifies homeless persons within 2 broad categories:
• primary homelessness (or ‘rooflessness’) which includes persons living on the streets or without a shelter or living quarters
• secondary homelessness which may include persons:
– with no usual place of residence who move frequently between various types of accommodation (including dwellings, shelters or other living quarters)
– persons usually resident in long-term ‘transitional’ shelters or similar arrangements for the homeless
– persons living in private dwellings but reporting ‘no usual address’ on their census form (UNSD 2017).
MacKenzie and Chamberlain’s cultural definition of homelessness
The definition of homelessness widely used in the homelessness sector is that developed by Chamberlain and MacKenzie (2008). According to this definition, people are considered homeless when they live in accommodation that falls below a community’s minimum standards. This definition comprises 3 categories capturing the diversity of the homelessness experience:
• primary homelessness—when people do not have conventional accommodation; for example, sleeping rough or in improvised dwellings, such as sleeping in a car
• secondary homelessness—when people are forced to move from 1 temporary shelter to another; for example, moving between emergency accommodation and refuges. This includes ‘couch surfing’ which is when someone ‘crashes’ at the home of a friend or relative
• tertiary homelessness—when people live in accommodation that falls below minimum standards; for example, single rooms in private boarding houses without their own bathroom, kitchen or security of tenure.
SHSC clients considered to be homeless
For the purposes of the SHSC, clients are considered to be homeless if they are living in any of the following circumstances:
• no shelter or improvised dwelling—including where the dwelling type is no dwelling, street, park, in the open, in a motor vehicle, improvised building/dwelling, caravan, cabin, boat or tent, or tenure type is renting or living rent-free in a caravan park
• house, townhouse or flat (couch surfing or living with no tenure)—tenure type is no tenure, or conditions of occupancy are living with relatives rent-free, couch surfing
• short-term emergency accommodation—dwelling type is boarding/rooming house, emergency accommodation, hotel, motel, bed and breakfast; or tenure type is renting or living rent-free in boarding/rooming house, emergency accommodation or transitional housing.
77Couch surfers: a profile of Specialist Homelessness Services clients
Appe
ndix
A: B
ackg
roun
d in
form
atio
n
These categories align as closely as possible with the ABS statistical definition of homelessness outlined above. However, it is important to note 2 key areas where alignment with the ABS statistical definition may not occur:
• The ABS statistical definition includes people living in severely crowded dwellings and, as no specific question on crowding is included in the SHSC, this group cannot be separately identified (AIHW 2017).
• Those who chose to live in situations that mirror homelessness (for example, students living in halls of residence, people who are travelling or those who may be living in a shed while their house is being built) are excluded from ABS homelessness counts. If people in these circumstances present to specialist homelessness agencies for assistance, they are defined as homeless or as being at risk of homelessness depending on how they report their current housing situation.
Exiting homelessnessThe Melbourne Institute (using the Journeys Home longitudinal data set) employed statistical modelling techniques to test whether people’s exits from homelessness were influenced by the length of time they had been homeless (Cobb-Clark et al. 2014). Two definitions of homelessness were used for modelling:
• cultural homelessness (including people couch surfing and living in caravans, cabins, hostels, boarding houses, hotels and motels)
• literal homelessness (sleeping rough, squatting or emergency accommodation).
The modelling concluded that exit rates out of cultural homelessness initially increase, peaking at the 4–6-month period, then decline over time, while exits out of literal homelessness peak at the 7–9-month period. The modelling also found that the duration people are homeless is influenced by their personal circumstances—sex, age, labour force participation and education.
Just as there are ‘triggers’ for entering homelessness, there are also events that can act as catalysts to prompt long-term homeless people (specifically rough sleepers) into wanting to exit homelessness (Ravenhill 2003). Several catalysts have been identified:
• they felt they had reached rock bottom and the only way was up from that point
• they found the rough sleeping or chronic homeless lifestyle was becoming too much to cope with
• they had a sudden shock or trauma (usually saw or was the victim of assault, rape, disabling accident, near death experience or death of a close street friend)
• they realised that someone cared.
Additional catalysts include doing it for their children and not wanting to be stigmatised for being homeless. Being able to capitalise on a catalyst-event and begin the process of exiting homelessness depend on the homelessness services available to the individual.
78 Couch surfers: a profile of Specialist Homelessness Services clients
Appe
ndix
A: B
ackg
roun
d in
form
atio
n
Further research using the Journeys Home longitudinal data set examined relationships between structural factors, individual characteristics and homelessness. One study used modelling to determine the impact of different factors on an individual’s entry into, or exit out of, homelessness (Johnson et al. 2015). In regard to exit out of homelessness, there were several demographic groups for whom exiting homelessness was less likely than for other groups. The key findings indicated that:
• Men are more likely to enter homelessness, and less likely to exit.
• There are higher rates of older people being homeless, due to their low rates of exit.
• People who are married or in a de facto relationship are less likely to become homeless, but if they do, they are also less likely to exit homelessness (Johnson et al. 2015).
Homeless individuals who have not engaged in the ‘homeless culture’ and have maintained a connection to mainstream society are more likely to exit homelessness and stay housed in the long term if they can secure and afford housing (Ravenhill 2003).
Housing availability and affordability are 2 structural factors to exiting homelessness and tie into the role that different types of housing have in preventing the reoccurrence of homelessness. Due to a lack of affordable housing and long waiting lists for public housing, people often end up living in transitional and emergency accommodation for long periods of time, and sometimes, when the transitional accommodation runs out, return to being homeless. Even if permanent housing is available, sometimes it is not suitable for the individual, due to its quality or location, and preventing reoccurrence of homelessness is then compromised (Johnson 2006).
Couch surfing youth in AustraliaIn Australia, couch surfing is accepted as a ‘norm’ in outer metropolitan areas, such as Wyndham in Victoria (Moore 2017). It is widespread and an early indicator of longer term homelessness; however, it is hidden. The experiences of these young people are not visible to the public, to the local community, to the schools and sometimes to the places they stay (Uhr 2004).
Currently, there is no emergency accommodation (that is, shelter or hostel) in Wyndham, and there is a serious lack of crisis accommodation across the western suburbs of Melbourne (Moore 2017). At the same time, community and social housing is in short supply and the private rental market is increasingly unaffordable or inaccessible for young people (Anglicare Australia 2014). The majority of young people experiencing homelessness in Melbourne’s outer metropolitan areas are required to be relocated to private (often unregistered) rooming houses, caravan parks and motels outside of their locality. Young people are therefore ‘choosing’ to remain homeless and couch surf close to their school and social networks instead of turning to formalised systems outside their local area (Moore 2017).
Analysis of case file data from 62 young people under the age of 25 assisted by the Youth Couch Surfing Clinic (which included outreach locations in Wyndham and the western suburbs of Melbourne) in 2014–15 found ages ranged from 14 to 24, with many clients revealing that they started couch surfing from as young as 12. Two significant groups were teenage males and single mothers: 14 single mothers had left their housing due to family violence committed by their partner. A total of 24 babies and toddlers were identified through the project (Moore 2017).
79Couch surfers: a profile of Specialist Homelessness Services clients
Appe
ndix
A: B
ackg
roun
d in
form
atio
n
Additionally, the Youth Couch Surfing Clinic assisted 10 young people of refugee background, several of whom came to Australia unaccompanied. Some of these young people had spent time in offshore detention centres as well as in community detention. After exiting detention, many of these young people were placed in the community without stable accommodation and were forced to couch surf (often with strangers) as their only option (Moore 2017). Many of the young people assisted had insufficient knowledge of, and an inability to navigate, homelessness and housing service systems.
Data The source of data for this analysis is the SHSC conducted by the Australian Institute of Health and Welfare (AIHW). Data span the period from the commencement of the collection on 1 July 2011 to 30 June 2015 (a period of 4 years).
It is important to note that the SHSC only includes data on those homeless clients or clients at risk of homelessness who presented to services for assistance. It does not represent all of those who are homeless or at risk of homelessness.
All statistics are based on unique adult clients (aged 18 and over) and young people (aged 15–17) presenting alone to SHS for assistance (these clients have been included as they presented to services unaccompanied, without an established support system in place; as such, they are treated as adults).
Scope of the Housing Journeys projectThis report is the second in a 3-part series examining the Housing Journeys of 3 populations of homeless clients. Analysis was restricted to those clients who first presented to SHS agencies for assistance between 1 July 2011 and 30 June 2012.
Each report focuses on 1 of these populations:
• those who identified as ‘rough sleepers’ on presentation to a SHS agency in 2011–12
• those who identified as ‘couch surfers’ on presentation to a SHS agency in 2011–12
• those who were in ‘short-term or emergency accommodation’ on presentation to a SHS agency in 2011–12.
These cohorts were further divided into 3 subgroups to identify clients of interest:
• persistent service users—clients who had at least 1 support period in each financial year between 1 July 2011 and 30 June 2015
• service cyclers—clients who had a least 1 support period between 1 July 2011 and 30 June 2012 and at least 1 other support period between 1 July 2012 and 30 June 2015
• transitory service users—clients who had at least 1 support period between 1 July 2011 and 30 June 2012, and did not receive support in any following financial year to 30 June 2015.
80 Couch surfers: a profile of Specialist Homelessness Services clients
Appe
ndix
A: B
ackg
roun
d in
form
atio
n
Aims of the Housing Journeys projectThe focus of the overall analysis is on developing an understanding of:
• characteristics of persistent service users, service cyclers and transitory service users
• the reasons clients in these cohorts seek assistance
• the services provided to clients (as well as the services not provided—that is, unmet needs)
• the intensity of support (that is, days of support, span of support periods, nights of accommodation, number of support periods)
• the housing outcomes for clients in these cohorts at the end of their support.
The Housing Journeys project aims to improve the knowledge of SHSC clients in terms of demographics, personal circumstances (including housing circumstance, living arrangements and reasons for seeking assistance); service provision (identified needs, length of support and services not provided); and outcomes.
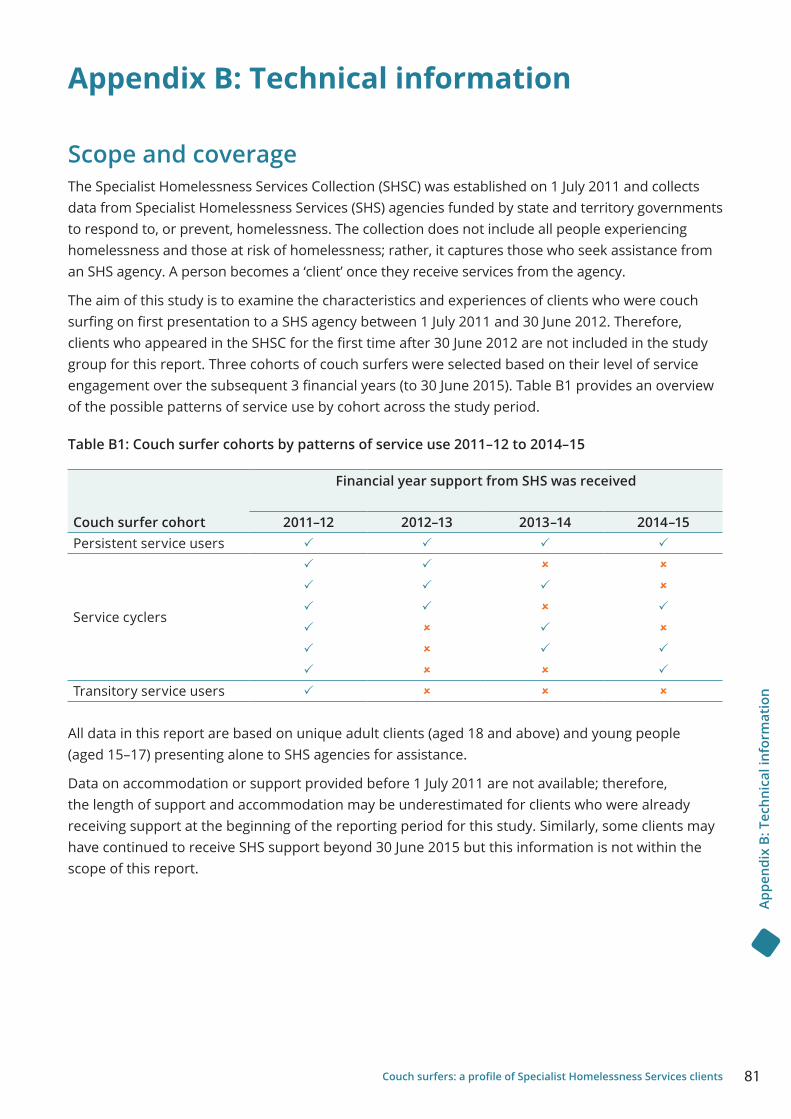
81Couch surfers: a profile of Specialist Homelessness Services clients
Appe
ndix
B: T
echn
ical
info
rmat
ion
Appendix B: Technical information
Scope and coverageThe Specialist Homelessness Services Collection (SHSC) was established on 1 July 2011 and collects data from Specialist Homelessness Services (SHS) agencies funded by state and territory governments to respond to, or prevent, homelessness. The collection does not include all people experiencing homelessness and those at risk of homelessness; rather, it captures those who seek assistance from an SHS agency. A person becomes a ‘client’ once they receive services from the agency.
The aim of this study is to examine the characteristics and experiences of clients who were couch surfing on first presentation to a SHS agency between 1 July 2011 and 30 June 2012. Therefore, clients who appeared in the SHSC for the first time after 30 June 2012 are not included in the study group for this report. Three cohorts of couch surfers were selected based on their level of service engagement over the subsequent 3 financial years (to 30 June 2015). Table B1 provides an overview of the possible patterns of service use by cohort across the study period.
Table B1: Couch surfer cohorts by patterns of service use 2011–12 to 2014–15
Financial year support from SHS was received
Couch surfer cohort 2011–12 2012–13 2013–14 2014–15Persistent service users
Service cyclers
Transitory service users
All data in this report are based on unique adult clients (aged 18 and above) and young people (aged 15–17) presenting alone to SHS agencies for assistance.
Data on accommodation or support provided before 1 July 2011 are not available; therefore, the length of support and accommodation may be underestimated for clients who were already receiving support at the beginning of the reporting period for this study. Similarly, some clients may have continued to receive SHS support beyond 30 June 2015 but this information is not within the scope of this report.
82 Couch surfers: a profile of Specialist Homelessness Services clients
Appe
ndix
B: T
echn
ical
info
rmat
ion
Data quality and Indigenous Australians A client is considered Indigenous if, at any time between 1 July 2011 and 30 June 2015, they identified as being of Aboriginal and/or Torres Strait Islander origin. Data about Indigenous Australians are affected by a number of issues, the most common being the under-identification of Indigenous people. This may happen when:
• people are not asked about their Indigenous status
• people are asked but in an inconsistent way
• information about a person’s Indigenous status is recorded inaccurately.
Under-identification can vary across time and between jurisdictions. In the SHSC, information on Indigenous status is only provided with explicit consent to report this information. Indigenous status was not reported for 7% of the couch surfer population in this study.
Incomplete data Not all in-scope agencies submit data, and not all information sought from SHS clients is provided. This means data may not be completely representative of people receiving SHS. How much this affects the representativeness of the data depends on how much information is missing, and how those people whose information was not collected are distributed among the study group. For this cohort study, an imputation strategy has not been applied to correct for missing or incomplete data. Therefore, all SHSC data used for this analysis are unweighted and client counts are likely to be underestimated. Data from this study are not comparable to the published results of weighted data in other reports using SHSC data.
Further information can be found in the SHSC Data Quality Statements available on the AIHW Metadata Online Registry (METeOR) for each reporting year:
• 2014–15 Specialist Homelessness Services Collection Data Quality Statement <http://meteor.aihw.gov.au/content/index.phtml/itemId/626455>
• 2013–14 Specialist Homelessness Services Collection Data Quality Statement <http://meteor.aihw.gov.au/content/index.phtml/itemId/593778>
• 2012–13 Specialist Homelessness Services Collection Data Quality Statement available in Appendix A of the 2012–13 national data report <http://www.aihw.gov.au/publication-detail/?id=60129545629>
• 2011–12 Specialist Homelessness Services Collection Data Quality Statement available in Appendix B of the 2011–12 national data report <http://www.aihw.gov.au/publication-detail/?id=60129542549>.
83Couch surfers: a profile of Specialist Homelessness Services clients
Appe
ndix
B: T
echn
ical
info
rmat
ion
Key data quality issues, 2011–12The clients in this study first appeared in the SHSC between 1 July 2011 and 30 June 2012. Analysis of the 2011–12 SHSC data identified some data quality issues. In particular, 90% of SHS agencies returned support period data in 2011–12, although many did not return data for all 12 months. This response rate has increased over time and, in 2014–15, 96% of agencies returned data for each month in which they were expected to participate.
In 2011–12, the rate of invalid/’don’t know’/missing responses was high for a number of data items. Data completeness has improved each year and this is important to consider when making comparisons between the cohorts within the study group as they differ based on the number of years for which SHS were accessed.
84 Couch surfers: a profile of Specialist Homelessness Services clients
References
Anglicare Australia 2014. State of the family report 2014: being a/part. Canberra: Anglicare Australia.
ABS (Australian Bureau of Statistics) 2012. Information paper—a statistical definition of homelessness. ABS cat. no. 4922.0. Canberra: ABS.
ABS 2018. Census of Population and Housing: estimating homelessness, 2016. ABS cat. no. 2049.0. Canberra: ABS. Viewed 10 May 2018, <http://www.abs.gov.au/ausstats/[email protected]/mf/2049.0>.
AIHW (Australian Institute of Health and Welfare) 2016. A profile of Specialist Homelessness Services homeless clients 2011–12 to 2014–15. Canberra: AIHW. Viewed 21 October 2018, <https://www.aihw.gov.au/reports/homelessness-services/a-profile-of-specialist-homelessness-services-home/contents/summary-in-cohort>.
AIHW 2017. Specialist Homelessness Services Collection manual. Cat. no. HOU 289. Canberra: AIHW.
Bevitt A, Chigavarzira A, Herault N, Johnson G, Moschion J, Scutella R et al. 2015. Complete findings from Waves 1 to 6. Journeys Home research report no. 6. Melbourne: Melbourne Institute of Applied Economic and Social Research.
Butler J 2017. Shocking rise in older women couchsurfing, sleeping in cars due to homelessness. Sydney: HuffPost Australia. Viewed 8 July 2018, <https://www.huffingtonpost.com.au/2017/08/06/shocking-rise-in-older-women-couchsurfing-sleeping-in-cars-due_a_23067959>.
Chamberlain C & MacKenzie D 2008. Australian Census Analytic Program: Counting the Homeless Australia 2006. ABS cat. no. 2050.0. Canberra: ABS.
Chamberlain C & Johnson G 2011. Pathways into adult homelessness. Journal of Sociology published online 7 November 2011. 49 (1) 60-70.
Cobb-Clark D. Herault N, Scutella R & Tseng Y. 2014. A journey home: what drives how long people are homeless? IZA Discussion Papers no. 8495.
Fitzpatrick S, Bramley G & Johnsen S 2013. Pathways into multiple exclusion homelessness in seven UK cities. Urban Studies 50(1):148–68.
Gaetz S, Barr C, Friesen A, Harris B, Hill C, Kovacs-Burns K et al. 2012. Canadian definition of homelessness. Toronto: Canadian Observatory on Homelessness Press.
Johnson G 2006. On the move: a longitudinal study of pathways in and out of homelessness. PhD thesis, School of Global Studies, Social Science and Planning, RMIT University. Viewed 21 October 2018, <https://core.ac.uk/download/pdf/15615062.pdf>.
Johnson G, Scutella R, Tseng Y & Wood G 2015. Entries and exits from homelessness: a dynamic analysis of the relationship between structural conditions and individual characteristics. AHURI final report no. 248. Melbourne: Australian Housing and Urban Research Institute.
McCoy S & Hug B 2016. Danger zones and stepping stones: young people’s experiences of hidden homelessness. London: Depaul UK.
McDonald P 2017. Homelessness: older women couch surfing, sleeping in cars due to unaffordable housing. ABC News Online, 8 August 2017. Viewed 21 October 2018, <http://www.abc.net.au/news/2017-08-07/older-women-become-hidden-face-of-homelessness/8782816>.
85Couch surfers: a profile of Specialist Homelessness Services clients
MacKenzie D & Chamberlain C 2003. Homeless careers: pathways in and out of homelessness. Melbourne: Salvation Army.
MacKenzie D & Chamberlain C 2008. Youth homelessness in Australia. Hawthorn: Counting the Homeless 2006 project. Viewed 21 October 2018, <https://www.dss.gov.au/our-responsibilities/housing-support/publications-articles/homelessness-youth/youth-homelessness-in-australia?HTML>.
McLoughlin PJ 2013. Couch surfing on the margins: the reliance on temporary living arrangements as a form of homelessness amongst school-aged home leavers. Journal of Youth Studies 16(4):521–45.
Moore S 2017. Couch surfing limbo: legal, policy and service gaps affecting young couch surfers and couch providers in Melbourne’s west. Melbourne: WEstjustce.
Pilinger J 2007. Homeless pathways: developing effective strategies to address pathways into, through and out of homelessness. Dublin: Focus Ireland.
Ravenhill MH 2003. The culture of homelessness: an ethnographic study. PhD thesis, London School of Economics and Political Science. Viewed 21 October 2018, <http://etheses.lse.ac.uk/2665/>.
Reynolds F 2008. To examine programs that assist vulnerable and complex chronically homeless people. Churchill Fellowship report. Canberra: The Winston Churchill Memorial Trust of Australia. Viewed 21 October 2018, <https://www.churchilltrust.com.au/media/fellows/REYNOLDS_Felicity_2007.pdf>.
Uhr R 2004. Couch surfing in the burbs: young hidden and homeless. Brisbane: Brisbane City Council.
UNSD (United Nations Statistical Division) 2017. Number of homeless persons per 100,000 population indicator. Geneva: Office of the United Nations High Commissioner for Human Rights. Viewed 21 October 2018, <http://www.ohchr.org/Documents/Issues/Housing/homelessness.pdf>.
Wood G, Batterham D, Cigdem M & Mallet S 2015. The structural drivers of homelessness in Australia 2001–11. AHURI final report no. 238. Melbourne: Australia Housing and Urban Research Institute.
86 Couch surfers: a profile of Specialist Homelessness Services clients
List of tables
Table 1: Profile of couch surfers and other SHS clients (per cent) . . . . . . . . . . . . . . . . . . . . . . . . . . . . . 4
Table 2: Summary of couch surfer cohort demographics (per cent) . . . . . . . . . . . . . . . . . . . . . . . . . . 13
Table 3: Summary of couch surfer cohort vulnerabilities (per cent) . . . . . . . . . . . . . . . . . . . . . . . . . . 15
Table 4: Drug and alcohol counselling and mental health services provided to those clients who needed that service, by sex, persistent service users (per cent) . . . . . . . . . . . . . . . . . 27
Table 5: Accommodation services not provided or referred, persistent service users, by sex (per cent) . . . . . . . . . . . . . . . . . . . . . . . . . . . . . . . . . . . . . . . . . . . . . . . . . . . . . . . . . . . . . . 29
Table 6: Mental health services not provided or referred, persistent service users, by sex (per cent) . . . . . . . . . . . . . . . . . . . . . . . . . . . . . . . . . . . . . . . . . . . . . . . . . . . . . . . . . . . . . . 29
Table 7: Repeat episodes of homelessness experienced by persistent service users (per cent) . . 34
Table 8: Housing outcomes at the end of the last closed support period, persistent service users . . . . . . . . . . . . . . . . . . . . . . . . . . . . . . . . . . . . . . . . . . . . . . . . . . . . . . . . . . . . . . . . . . . . . . . . 35
Table 9: Health/medical issues as a reason for seeking assistance, service cyclers, by age (per cent) . . . . . . . . . . . . . . . . . . . . . . . . . . . . . . . . . . . . . . . . . . . . . . . . . . . . . . . . . . . . . . . . . . . . 44
Table 10: ‘Other’ interpersonal relationship or support services provided by agencies, by sex, service cyclers (per cent) . . . . . . . . . . . . . . . . . . . . . . . . . . . . . . . . . . . . . . . . . . . . . . . . . . . . . . . 48
Table 11: Accommodation services not provided or referred, service cyclers, by sex (per cent) . . . 49
Table 12: Mental health services not provided or referred, service cyclers, by sex (per cent) . . . . . 50
Table 13: Repeat episodes of homelessness, service cyclers (per cent) . . . . . . . . . . . . . . . . . . . . . . . . 54
Table 14: Housing outcomes at the end of the last known support period, service cyclers . . . . . . . 55
Table 15: Health/medical issues as a reason for seeking assistance, transitory service users by age (per cent) . . . . . . . . . . . . . . . . . . . . . . . . . . . . . . . . . . . . . . . . . . . . . . . . . . . . . . . . . . . . . . 64
Table 16: Accommodation services not provided or referred, transitory service users by age (per cent) . . . . . . . . . . . . . . . . . . . . . . . . . . . . . . . . . . . . . . . . . . . . . . . . . . . . . . . . . . . . . . . . . . . . 69
Table 17: Housing outcomes at the end of the last closed support, transitory service users . . . . . . 72
Table B1: Couch surfer cohorts by patterns of service use 2011–12 to 2014–15 . . . . . . . . . . . . . . . . 81
87Couch surfers: a profile of Specialist Homelessness Services clients
List of figures
Figure 1: Overview of couch surfers and defined service use cohorts, 2011–12 . . . . . . . . . . . . . . . 7
Figure 2: Vulnerabilities, all couch surfers (per cent) . . . . . . . . . . . . . . . . . . . . . . . . . . . . . . . . . . . . . 11
Figure 3: Vulnerabilities, persistent service users (per cent) . . . . . . . . . . . . . . . . . . . . . . . . . . . . . . . 19
Figure 4: Accommodation issues key reason for seeking assistance, persistent service users (per cent) . . . . . . . . . . . . . . . . . . . . . . . . . . . . . . . . . . . . . . . . . . . . . . . . . . . . . . . . . . . . 20
Figure 5: Interpersonal relationships as a reason for seeking assistance, persistent service users (per cent) . . . . . . . . . . . . . . . . . . . . . . . . . . . . . . . . . . . . . . . . . . . . . . . . . . . . . . 21
Figure 6: Financial issues as a reason for seeking assistance, persistent service users (per cent) . . . . . . . . . . . . . . . . . . . . . . . . . . . . . . . . . . . . . . . . . . . . . . . . . . . . . . . . . . . . . . . . . . 22
Figure 7: Health/medical issues as a reason for seeking assistance, persistent service users (per cent) . . . . . . . . . . . . . . . . . . . . . . . . . . . . . . . . . . . . . . . . . . . . . . . . . . . . . . . . . . . . 23
Figure 8: Needs—‘other’ specialist services, persistent service users (per cent) . . . . . . . . . . . . . . 25
Figure 9: Accommodation service provision, persistent service users (per cent) . . . . . . . . . . . . . 26
Figure 10: Number of support periods, persistent service users (per cent) . . . . . . . . . . . . . . . . . . . 30
Figure 11: Length of support periods, persistent service users (per cent) . . . . . . . . . . . . . . . . . . . . 31
Figure 12: Number of days client received support, persistent service users (per cent) . . . . . . . . 32
Figure 13: Percentage of time spent in support, persistent service users (per cent) . . . . . . . . . . . 32
Figure 14: Nights of accommodation, persistent service users (per cent) . . . . . . . . . . . . . . . . . . . . 33
Figure 15: Vulnerabilities, service cyclers (per cent) . . . . . . . . . . . . . . . . . . . . . . . . . . . . . . . . . . . . . . . 40
Figure 16: Accommodation issues key reason for seeking assistance, service cyclers (per cent) . . . . . . . . . . . . . . . . . . . . . . . . . . . . . . . . . . . . . . . . . . . . . . . . . . . . . . . . . . . . . . . . . . 41
Figure 17: Interpersonal relationships as a reason for seeking assistance, service cyclers (per cent) . . . . . . . . . . . . . . . . . . . . . . . . . . . . . . . . . . . . . . . . . . . . . . . . . . . . . . . . . . . . . . . . . 42
Figure 18: Financial issues as a reason for seeking assistance, service cyclers (per cent) . . . . . . . 43
Figure 19: Health/medical issues as a reason for seeking assistance, service cyclers (per cent) . . 44
Figure 20: Needs–mental health services, service cyclers (per cent) . . . . . . . . . . . . . . . . . . . . . . . . . 46
Figure 21: Accommodation service provision, service cyclers per cent) . . . . . . . . . . . . . . . . . . . . . . 47
Figure 22: Number of support periods, service cyclers (per cent) . . . . . . . . . . . . . . . . . . . . . . . . . . . 51
Figure 23: Length of support periods, service cyclers (per cent) . . . . . . . . . . . . . . . . . . . . . . . . . . . . 51
Figure 24: Number of days client received support, service cyclers (per cent) . . . . . . . . . . . . . . . . . 52
Figure 25: Percentage of time spent in support, service cyclers (per cent) . . . . . . . . . . . . . . . . . . . . 52
88 Couch surfers: a profile of Specialist Homelessness Services clients
Figure 26: Nights of accommodation, service cyclers (per cent) . . . . . . . . . . . . . . . . . . . . . . . . . . . . . 53
Figure 27: Vulnerabilities, transitory service users (per cent) . . . . . . . . . . . . . . . . . . . . . . . . . . . . . . . 60
Figure 28: Accommodation issues key reason for seeking assistance, transitory service users (per cent) . . . . . . . . . . . . . . . . . . . . . . . . . . . . . . . . . . . . . . . . . . . . . . . . . . . . . . . . . . . . 61
Figure 29: Interpersonal relationships as a reason for seeking assistance, transitory service users (per cent) . . . . . . . . . . . . . . . . . . . . . . . . . . . . . . . . . . . . . . . . . . . . . . . . . . . . . . 62
Figure 30: Financial issues as a reason for seeking assistance, transitory service users (per cent) . . . . . . . . . . . . . . . . . . . . . . . . . . . . . . . . . . . . . . . . . . . . . . . . . . . . . . . . . . . . . . . . . . 63
Figure 31: Health/medical issues as a reason for seeking assistance, transitory service users (per cent) . . . . . . . . . . . . . . . . . . . . . . . . . . . . . . . . . . . . . . . . . . . . . . . . . . . . . . . . . . . . 64
Figure 32: Accommodation service provision, transitory service users (per cent) . . . . . . . . . . . . . 67
Figure 33: Length of support periods, transitory service users (per cent) . . . . . . . . . . . . . . . . . . . . 70
Figure 34: Number of days client received support, transitory service users (per cent) . . . . . . . . . 70
Figure 35: Nights of accommodation, transitory service users (per cent) . . . . . . . . . . . . . . . . . . . . . 71
89Couch surfers: a profile of Specialist Homelessness Services clients
Related publications
This report, Couch surfers: a profile of Specialist Homelessness Services clients is the second in a 3-part series of the Housing Journeys project. The companion reports can be downloaded free from the AIHW website <http://www.aihw.gov.au/publications/index.cfm/series/405>. The website also includes information on ordering printed copies.
Supplementary tables relating to this report were published separately online as Couch surfers: a profile of Specialist Homelessness Services clients—Supplementary tables . See <http://www.aihw.gov.au/publications/index.cfm/title/12624>.
The following AIHW publications relating to homelessness might also be of interest:
• AIHW 2016. Domestic and family violence and homelessness 2011–12 to 2013–14 (web report). Canberra: AIHW. <https://www.aihw.gov.au/reports/domestic-violence/domestic-family-violence-homelessness-2011-12-to-2013-14/contents/summary>.
• AIHW 2016. Exploring drug treatment and homelessness in Australia: 1 July 2011 to 30 June 2014. Cat. no. CSI 23. Canberra: AIHW.
• AIHW 2016. A profile of Specialist Homelessness Services homeless clients 2011–12 to 2014–15 (web report). Canberra: AIHW. <https://www.aihw.gov.au/reports/homelessness-services/ a-profile-of-specialist-homelessness-services-home/contents/summary-in-cohort>.
• AIHW 2018. Specialist Homelessness Services annual report 2016–17 (web report). Canberra: AIHW. <https://www.aihw.gov.au/reports/homelessness-services/specialist-homelessness-services-2016-17/contents/contents>.
• AIHW 2018. Sleeping rough: a profile of Specialist Homelessness Services clients. Cat. no. HOU 297. Canberra: AIHW.
aihw.gov.au
Stronger evidence, better decisions, improved health and welfare
Couch surfers are among the most hidden groups of people experiencing homelessness. This report explores the circumstances, experiences and housing outcomes of couch surfers who sought assistance from specialist homelessness services between 1 July 2011 and 30 June 2015.
Based on service use patterns across a 4–year period, this comprehensive analysis highlights the diversity and the complexities of the couch surfer population.
Couch surfersA profile of Specialist Homelessness Services clients