Embed Size (px)
Citation preview
Cotton Price EvolutionWhat’s Next for the Market?
Joe NicosiaChief Executive OfficerAllenberg Cotton Co.
Division of Louis Dreyfus Commodities
Massive Upheaval in the World Cotton Market
• In the last few years there has been a series of events each of which rocked the cotton market.
• The diversion of agricultural resources for fuel production caused a major shift in planted area out of cotton and into grain and oilseeds.
• World cotton area went down for 3 years in a row, resulting in a cumulative loss of 10 million acres.
• Lax regulation and unbridled speculation resulted in an unprecedented strain on the resources of the hedging community in March of 2008.
• A recession choked consumption of cotton world-wide, causing the greatest contraction in history in cotton use.
• World trade in cotton fell by over 20%.• And a financial crisis in the fall of 2008 challenged firms
everywhere to find operating capital.

Navigating the Cotton Market Through the Last Three Years
What’s Next for the Cotton Market?

Finally, a Sign of Hope!
Recession Leads to RecoveryMarket Outlook Turns Positive in 2010
• Our market has been in a constant quest to determine whether the outlook is for recession or recovery.
• Two years ago the USDA forecast world cotton demand would reach 129.5 million bales.
• Actual world demand for cotton peaked in 2006/07 at nearly 121 million bales. By 2008/09 demand fell by 11 million bales from the peak to 110 million bales.
• Recovery is underway. Demand is rising to 113 million bales for 2009/10, and to 117 million bales in 2010/11. We need 5 million acres world-wide back into cotton.
• Cotton prices have risen lately in optimism along with the stock market and other commodities.
• Current price levels if maintained will provide the world with more cotton area in 2010/11.
• Higher prices will be required to bring even more area back to cotton in 2011/12.
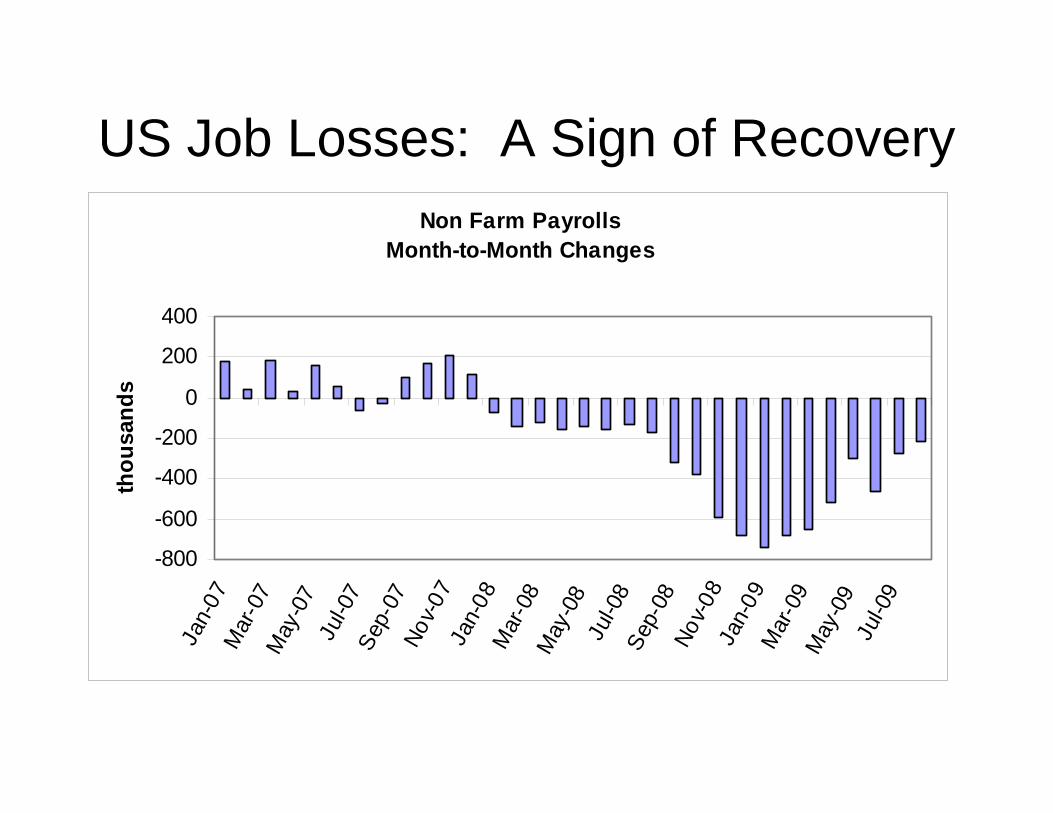
US Job Losses: A Sign of RecoveryNon Farm Payrolls
Month-to-Month Changes
-800
-600
-400
-200
0
200
400
Jan-
07M
ar-0
7M
ay-0
7Ju
l-07
Sep-
07No
v-07
Jan-
08M
ar-0
8M
ay-0
8Ju
l-08
Sep-
08No
v-08
Jan-
09M
ar-0
9M
ay-0
9Ju
l-09
thou
sand
s
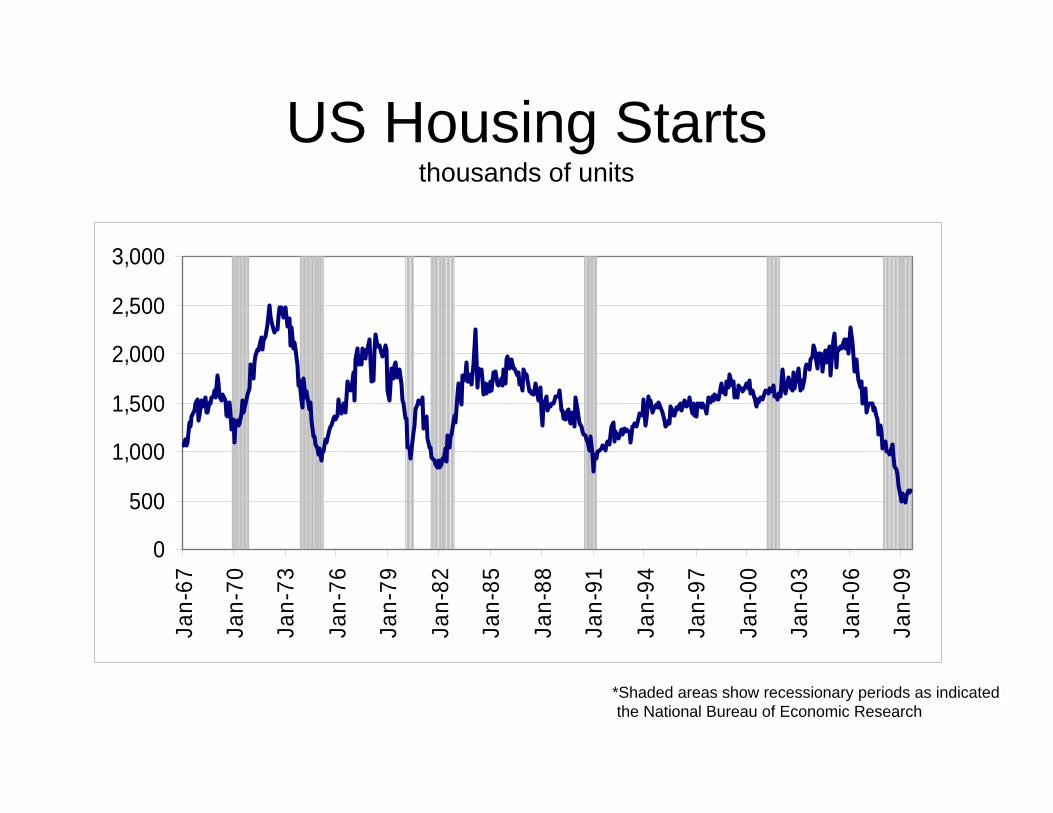
US Housing Startsthousands of units
0
500
1,000
1,500
2,000
2,500
3,000
Jan-
67
Jan-
70
Jan-
73
Jan-
76
Jan-
79
Jan-
82
Jan-
85
Jan-
88
Jan-
91
Jan-
94
Jan-
97
Jan-
00
Jan-
03
Jan-
06
Jan-
09
*Shaded areas show recessionary periods as indicated bthe National Bureau of Economic Research
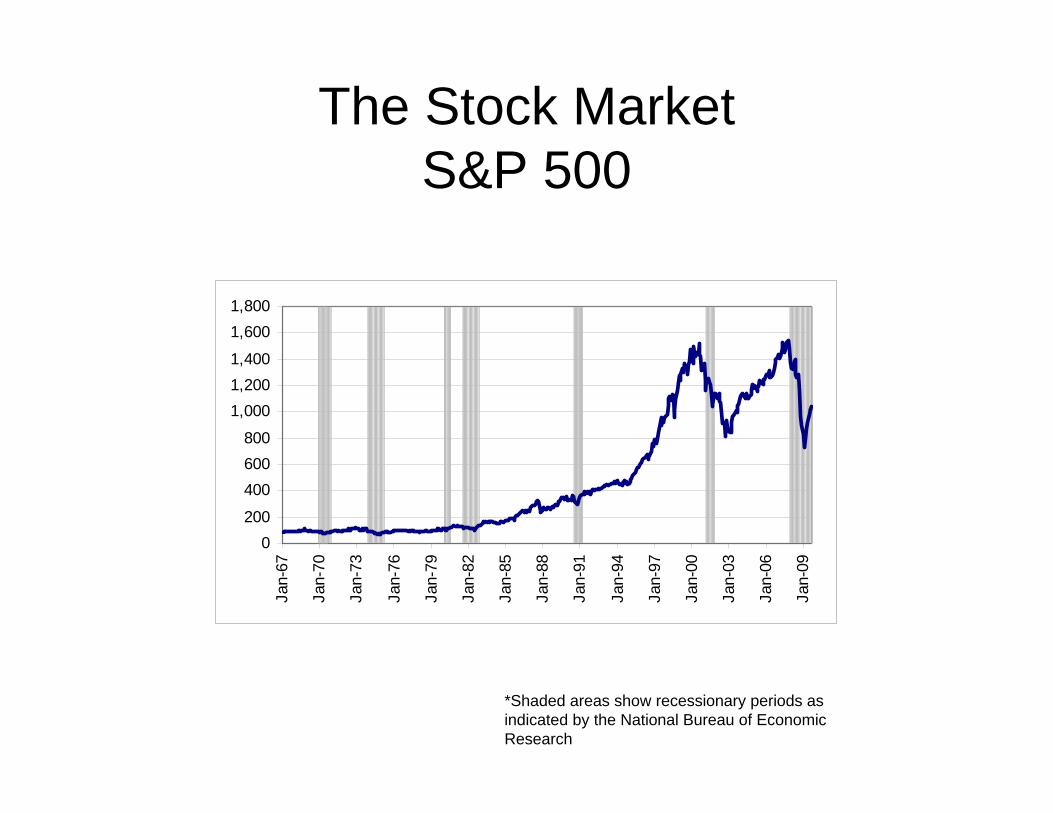
The Stock MarketS&P 500
*Shaded areas show recessionary periods as indicated by the National Bureau of Economic Research
0200
400600800
1,0001,2001,400
1,6001,800
Jan-
67
Jan-
70
Jan-
73
Jan-
76
Jan-
79
Jan-
82
Jan-
85
Jan-
88
Jan-
91
Jan-
94
Jan-
97
Jan-
00
Jan-
03
Jan-
06
Jan-
09
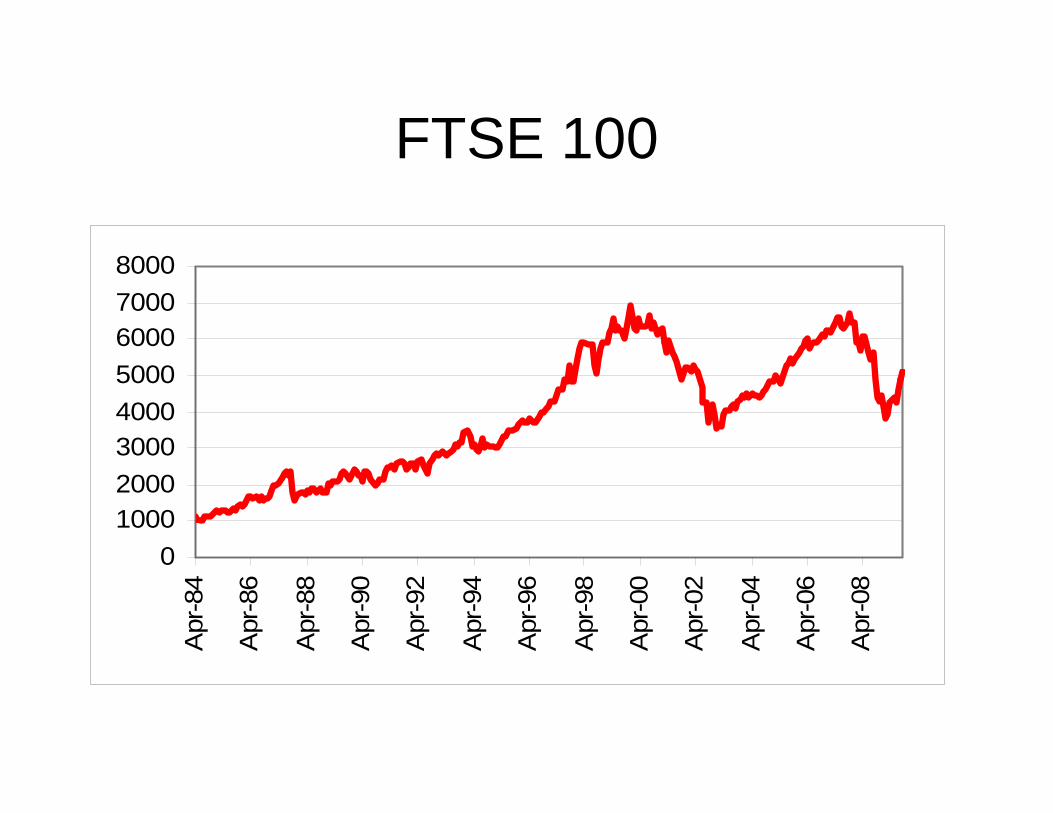
FTSE 100
010002000300040005000600070008000
Apr
-84
Apr
-86
Apr
-88
Apr
-90
Apr
-92
Apr
-94
Apr
-96
Apr
-98
Apr
-00
Apr
-02
Apr
-04
Apr
-06
Apr
-08
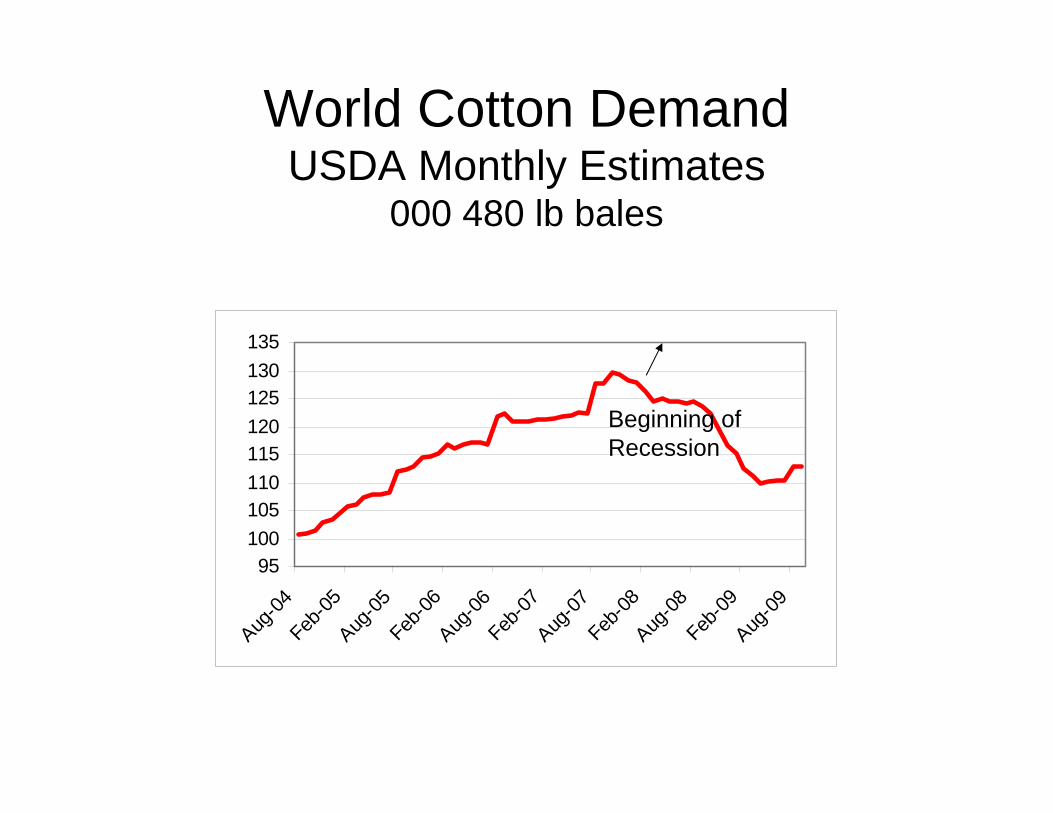
World Cotton DemandUSDA Monthly Estimates
000 480 lb bales
95100105110115120125130135
Aug-04
Feb-05
Aug-05
Feb-06
Aug-06
Feb-07
Aug-07
Feb-08
Aug-08
Feb-09
Aug-09
Beginning ofRecession
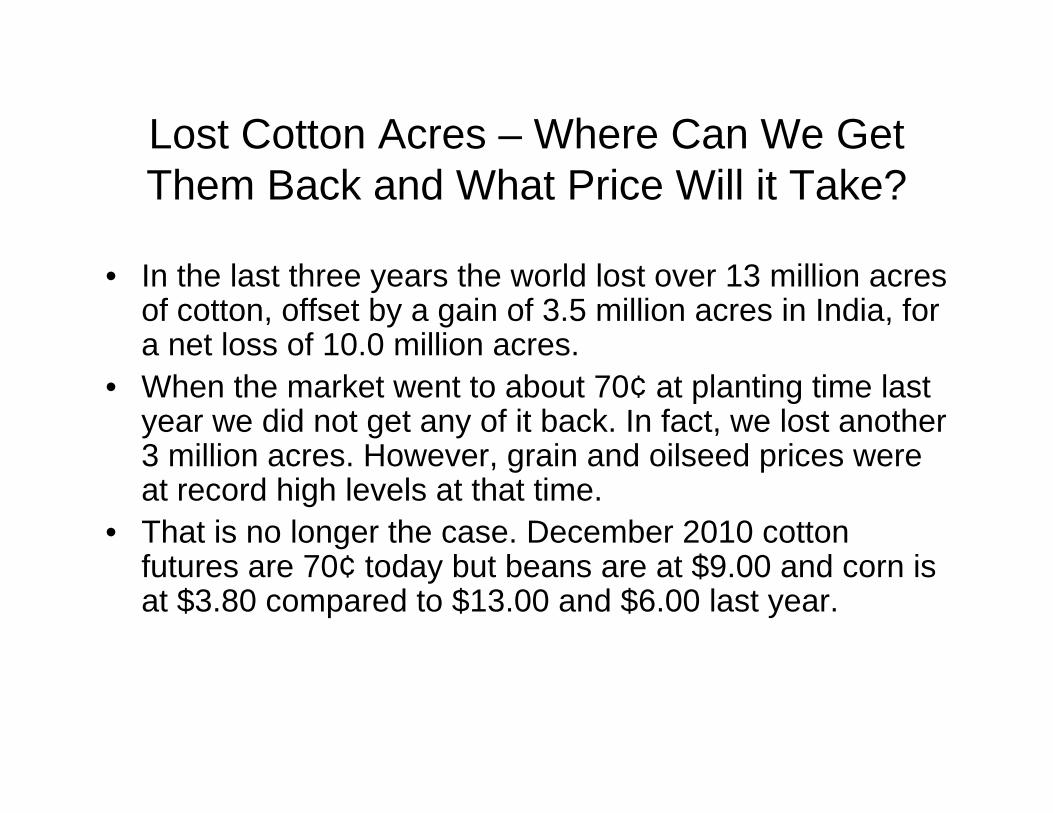
Lost Cotton Acres – Where Can We GetThem Back and What Price Will it Take?
• In the last three years the world lost over 13 million acres of cotton, offset by a gain of 3.5 million acres in India, for a net loss of 10.0 million acres.
• When the market went to about 70¢ at planting time last year we did not get any of it back. In fact, we lost another 3 million acres. However, grain and oilseed prices were at record high levels at that time.
• That is no longer the case. December 2010 cotton futures are 70¢ today but beans are at $9.00 and corn is at $3.80 compared to $13.00 and $6.00 last year.
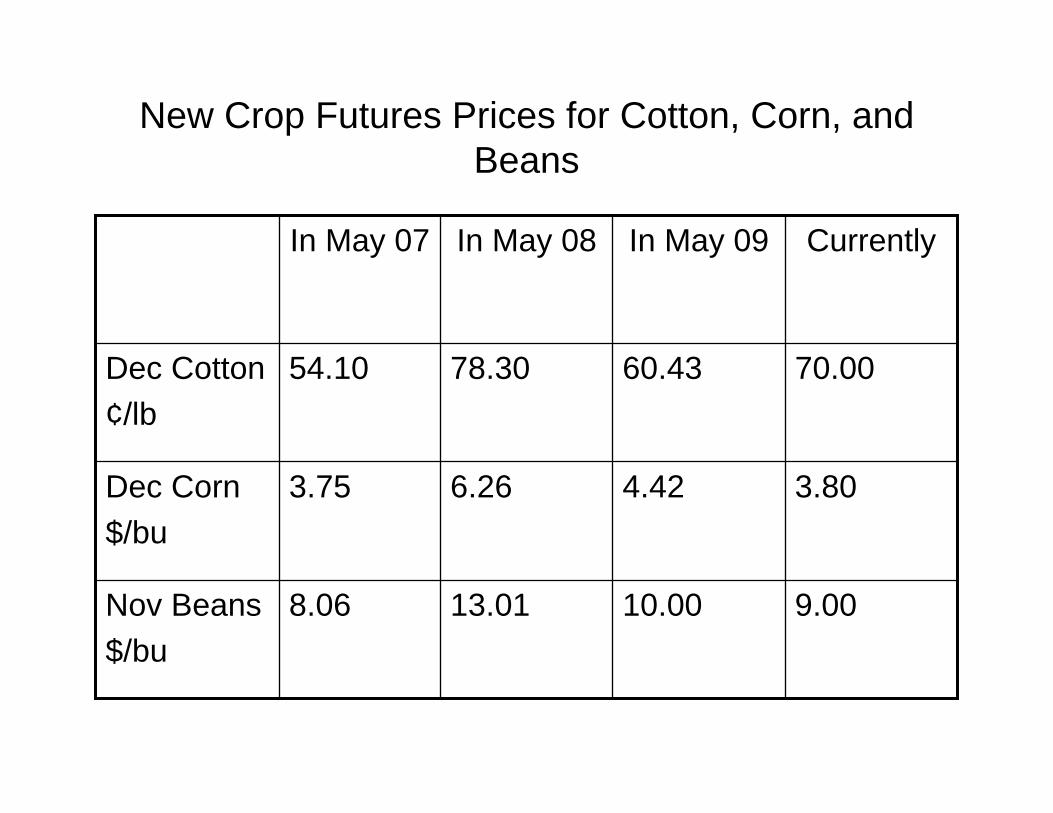
New Crop Futures Prices for Cotton, Corn, and Beans
9.0010.0013.018.06Nov Beans$/bu
3.804.426.263.75Dec Corn$/bu
70.0060.4378.3054.10Dec Cotton¢/lb
CurrentlyIn May 09In May 08In May 07
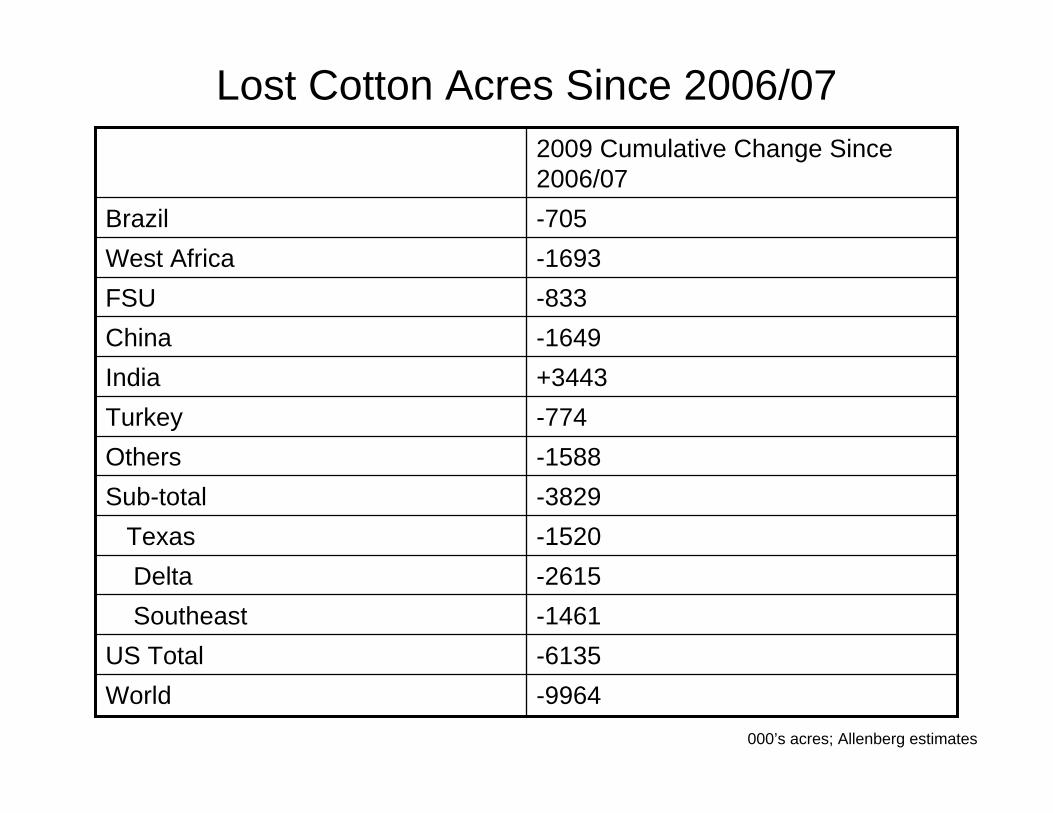
Lost Cotton Acres Since 2006/07
-9964World-6135US Total-1461Southeast-2615Delta-1520Texas-3829Sub-total-1588Others-774Turkey+3443India-1649China-833FSU-1693West Africa-705Brazil
2009 Cumulative Change Since 2006/07
000’s acres; Allenberg estimates
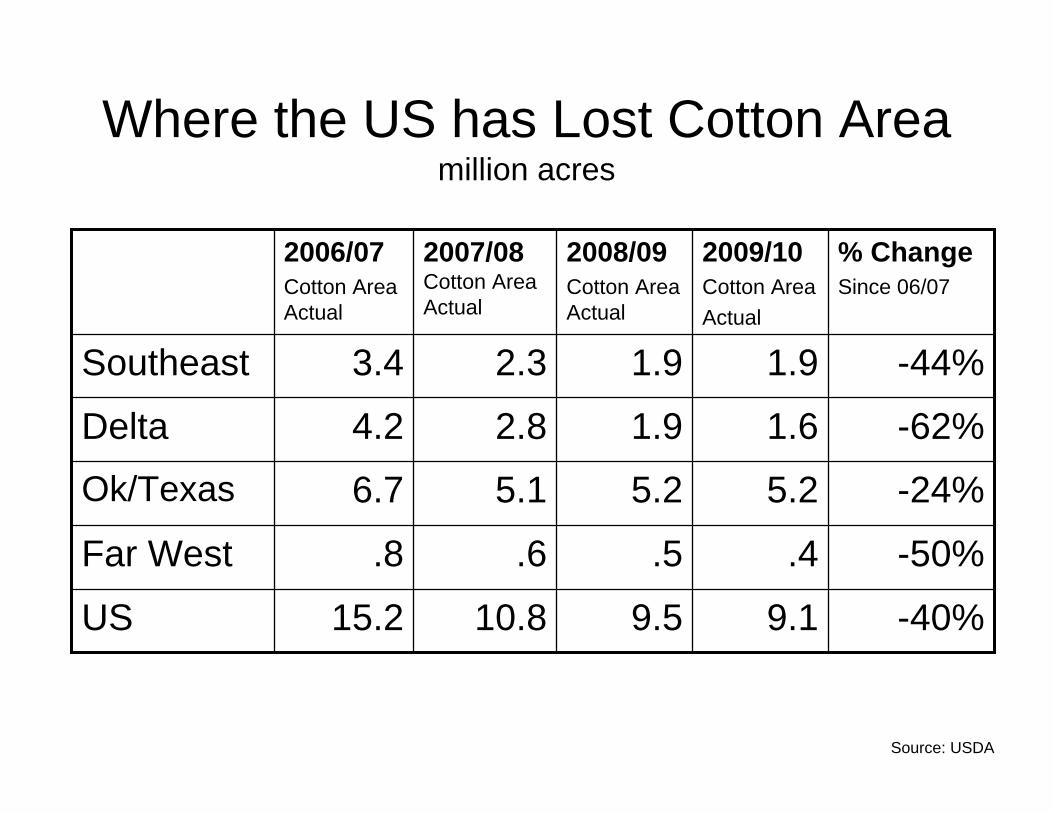
Where the US has Lost Cotton Areamillion acres
15.2
.8
6.7
4.2
3.4
2006/07Cotton Area Actual
9.1
.4
5.2
1.6
1.9
2009/10Cotton AreaActual
-40%9.510.8US
-50%.5.6Far West
-24%5.25.1Ok/Texas
-62%1.92.8Delta
-44%1.92.3Southeast
% ChangeSince 06/07
2008/09 Cotton Area Actual
2007/08 Cotton Area Actual
Source: USDA
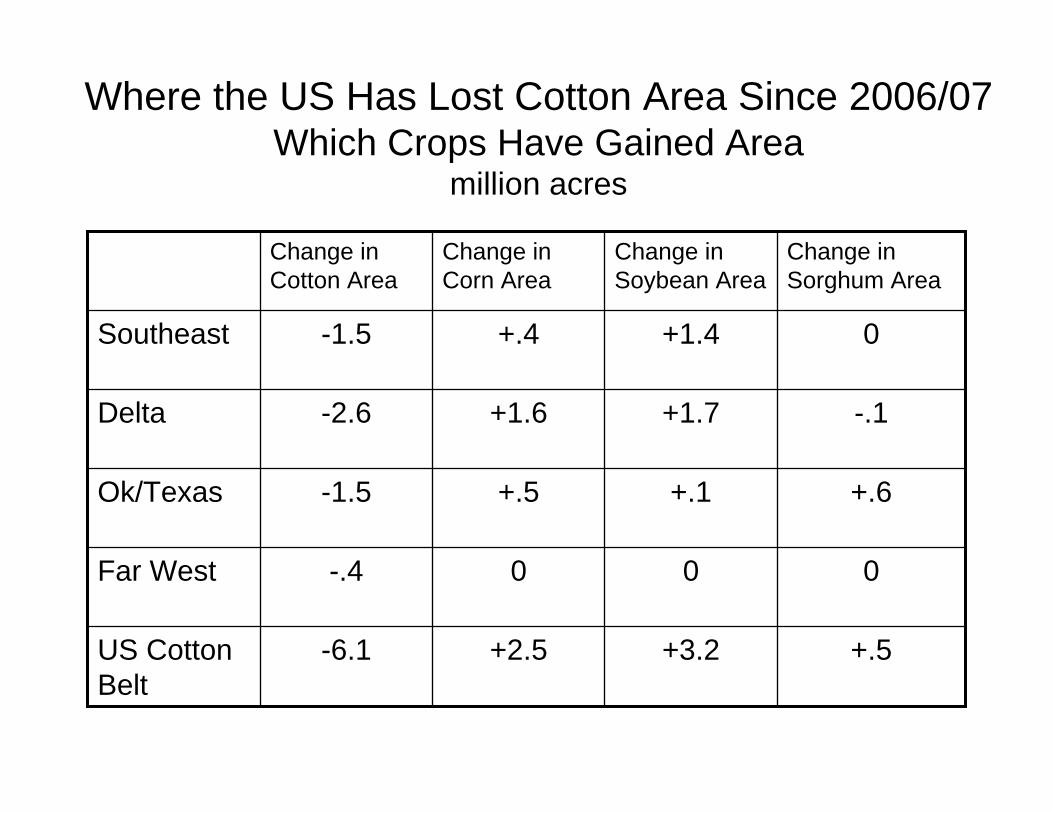
Where the US Has Lost Cotton Area Since 2006/07Which Crops Have Gained Area
million acres
+.5+3.2+2.5-6.1US Cotton Belt
000-.4Far West
+.6+.1+.5-1.5Ok/Texas
-.1+1.7+1.6-2.6Delta
0+1.4+.4-1.5Southeast
Change in Sorghum Area
Change in Soybean Area
Change in Corn Area
Change in Cotton Area
World Cotton Area:Major Rebound in 2010
• World cotton area went down again in 2009/10 as growers continued to switch to alternative crops.
• All major growing areas with the exception of India reduced cotton area.
• In China cotton area went down by 15% this year. Cotton was less profitable than alternative crops.
• At 72-75 cents for December 2010 cotton versus $9 beans and $3.80 corn, cotton will win back 5 million acres world-wide, including a 1.4 million acre gain in the US.
• 10 cent higher prices for cotton would bring another 4.7 million acres world-wide, for a 9.7 million acre increase over 2009/10.
• This would be more than we need thus it puts a cap on how high the deferred months should climb.
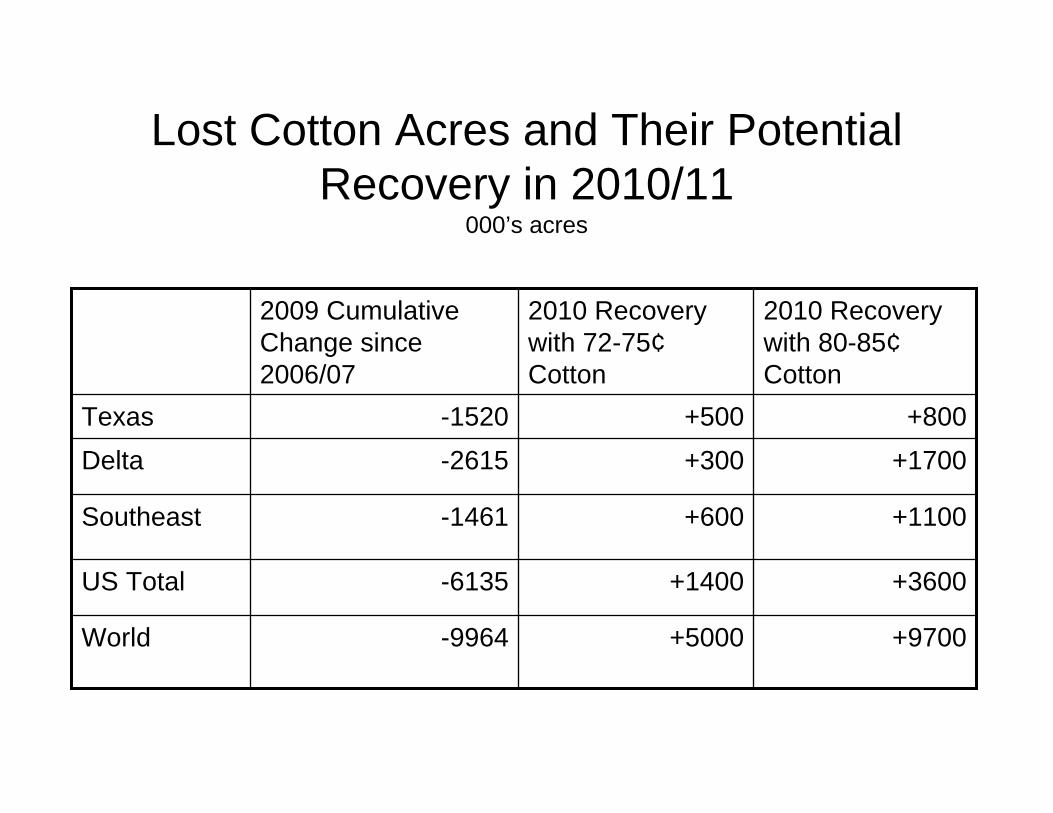
Lost Cotton Acres and Their Potential Recovery in 2010/11
000’s acres
+9700+5000-9964World
+3600+1400-6135US Total
+1100+600-1461Southeast
+1700+300-2615Delta+800+500-1520Texas
2010 Recoverywith 80-85¢Cotton
2010 Recoverywith 72-75¢Cotton
2009 Cumulative Change since 2006/07
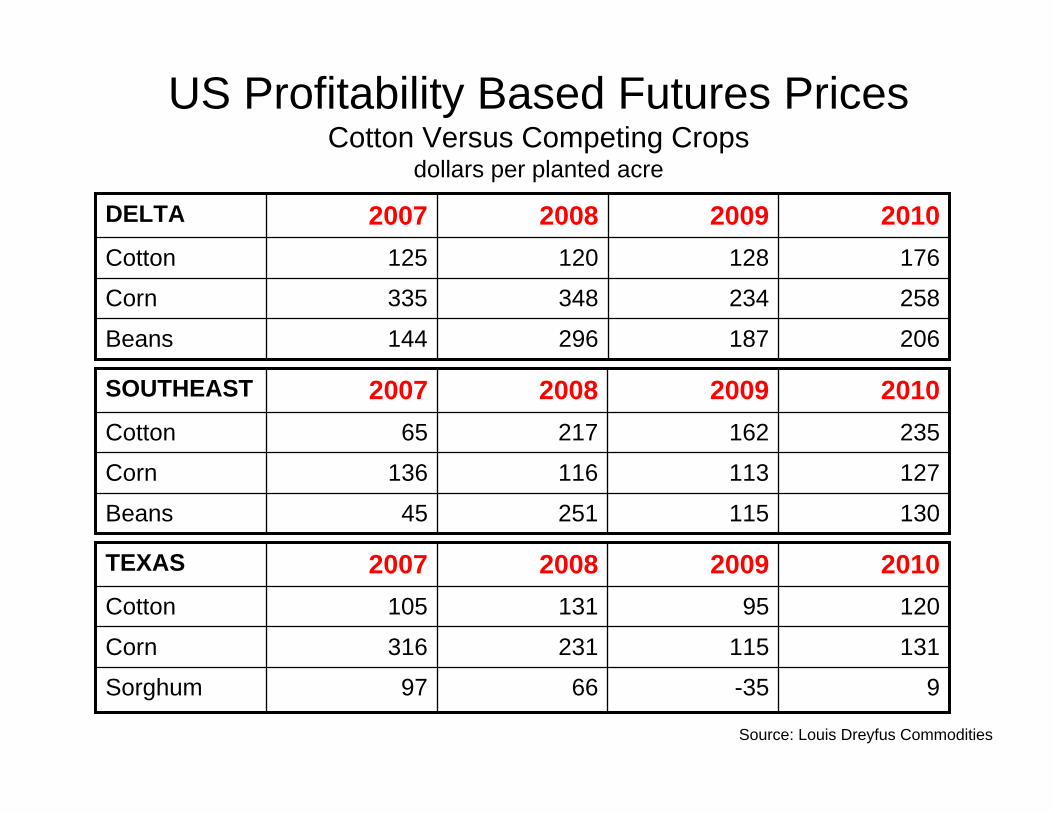
US Profitability Based Futures PricesCotton Versus Competing Crops
dollars per planted acre
206187296144Beans
258234348335Corn
176128120125Cotton
2010200920082007DELTA
13011525145Beans
127113116136Corn
23516221765Cotton
2010200920082007SOUTHEAST
9-356697Sorghum
131115231316Corn
12095131105Cotton
2010200920082007TEXAS
Source: Louis Dreyfus Commodities
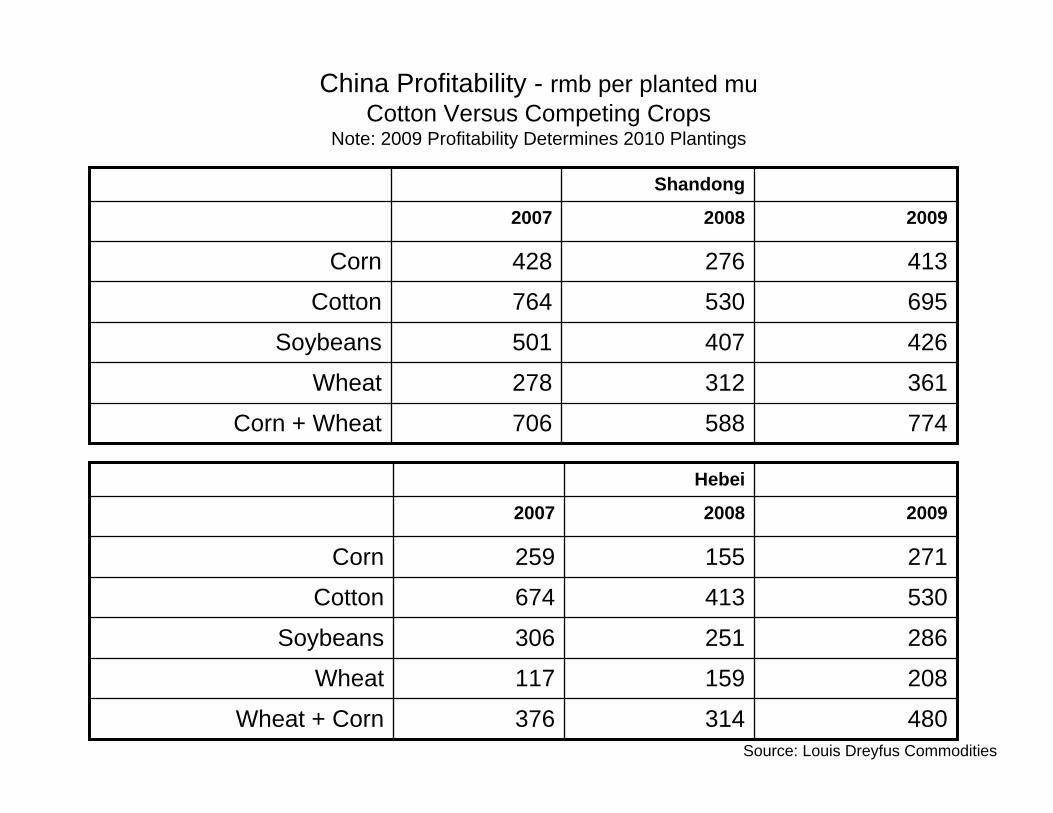
China Profitability - rmb per planted muCotton Versus Competing Crops
Note: 2009 Profitability Determines 2010 Plantings
200920082007
413276428Corn
695530764Cotton
774588706Corn + Wheat
361312278Wheat
426407501Soybeans
Shandong
200920082007
271155259Corn
530413674Cotton
480314376Wheat + Corn
208159117Wheat
286251306Soybeans
Hebei
Source: Louis Dreyfus Commodities
CottonProduction Potential
Cotton Yields: Phenomenal Growth
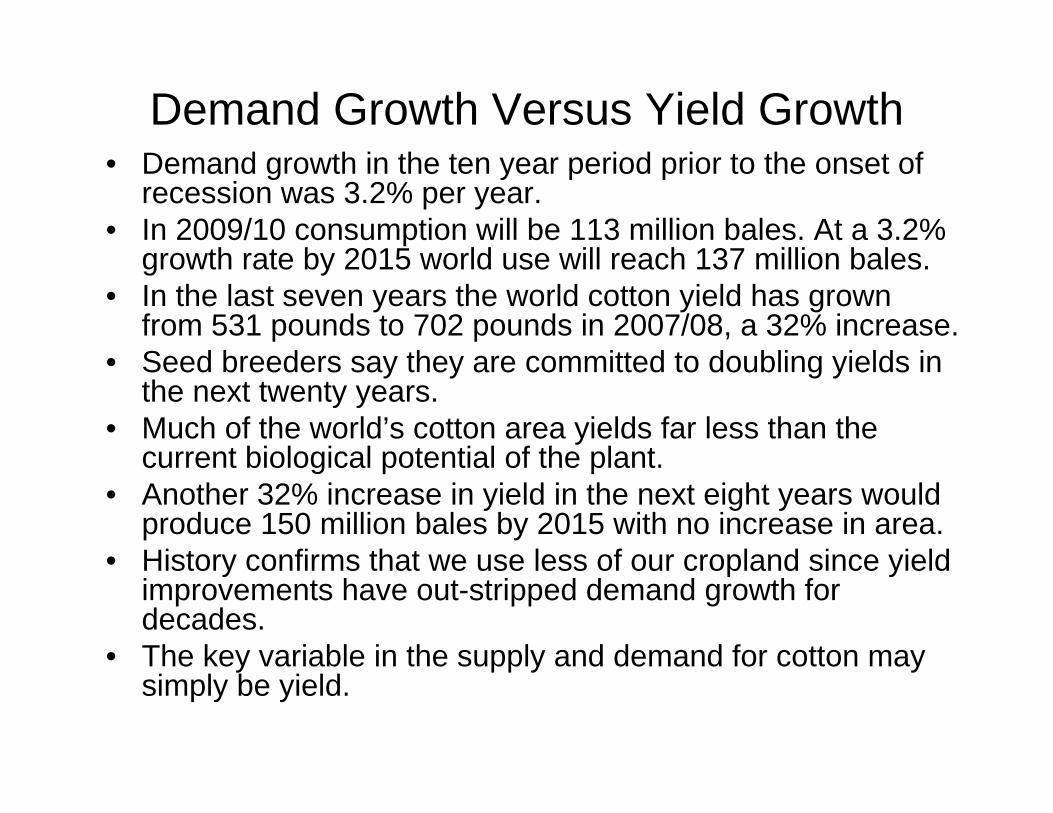
Demand Growth Versus Yield Growth• Demand growth in the ten year period prior to the onset of
recession was 3.2% per year. • In 2009/10 consumption will be 113 million bales. At a 3.2%
growth rate by 2015 world use will reach 137 million bales.• In the last seven years the world cotton yield has grown
from 531 pounds to 702 pounds in 2007/08, a 32% increase.• Seed breeders say they are committed to doubling yields in
the next twenty years.• Much of the world’s cotton area yields far less than the
current biological potential of the plant. • Another 32% increase in yield in the next eight years would
produce 150 million bales by 2015 with no increase in area.• History confirms that we use less of our cropland since yield
improvements have out-stripped demand growth for decades.
• The key variable in the supply and demand for cotton may simply be yield.
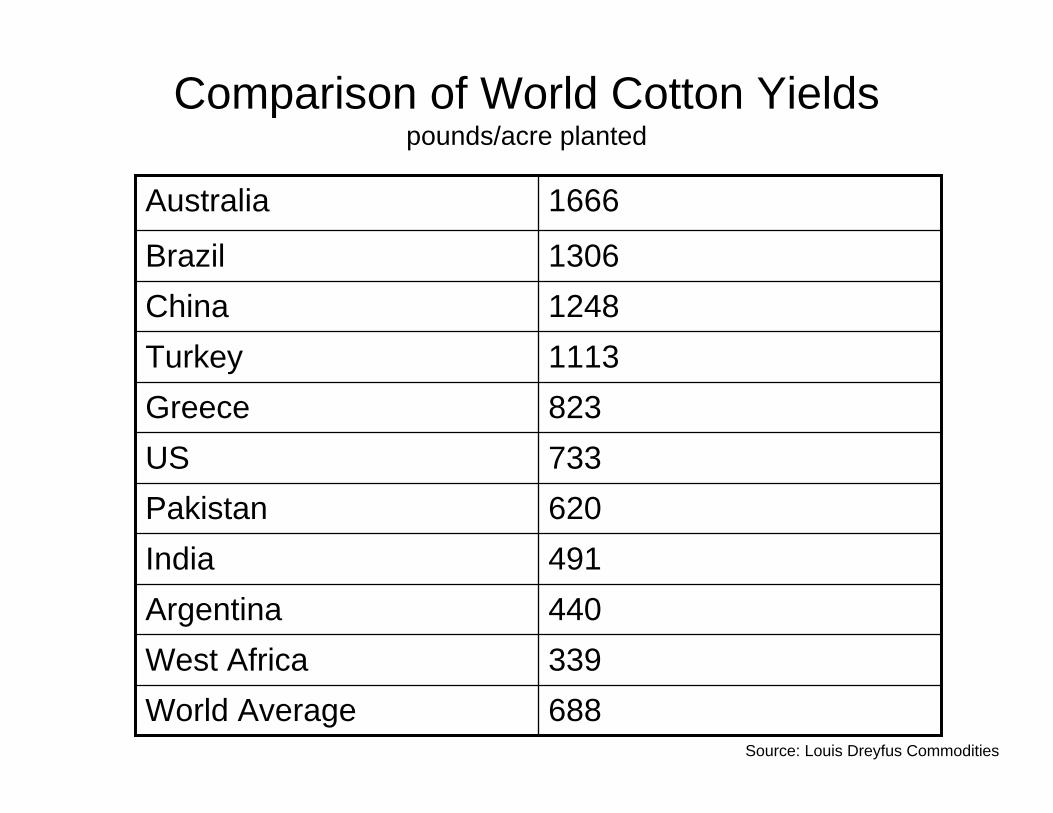
Comparison of World Cotton Yieldspounds/acre planted
339West Africa688World Average
440Argentina491India620Pakistan733US823Greece1113Turkey1248China1306Brazil
1666Australia
Source: Louis Dreyfus Commodities
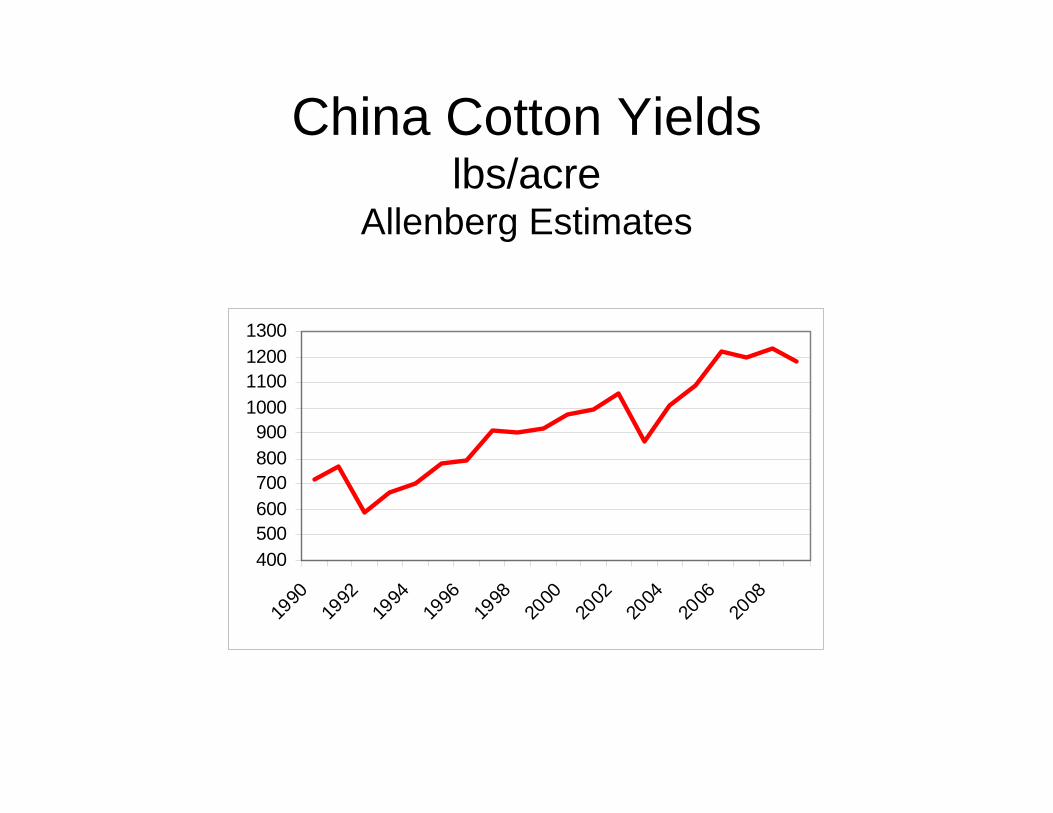
China Cotton Yieldslbs/acre
Allenberg Estimates
400500600700800900
1000110012001300
1990
1992
1994
1996
1998
2000
2002
2004
2006
2008
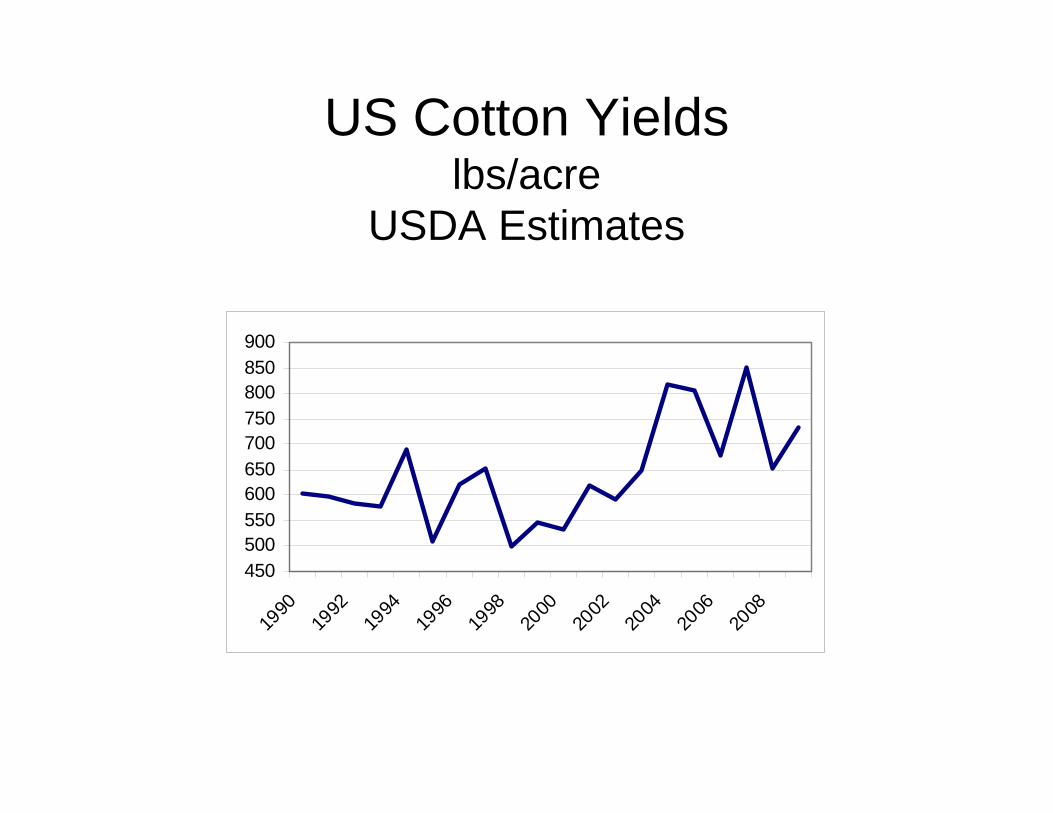
US Cotton Yieldslbs/acre
USDA Estimates
450500550600650700750800850900
1990
1992
1994
1996
1998
2000
2002
2004
2006
2008
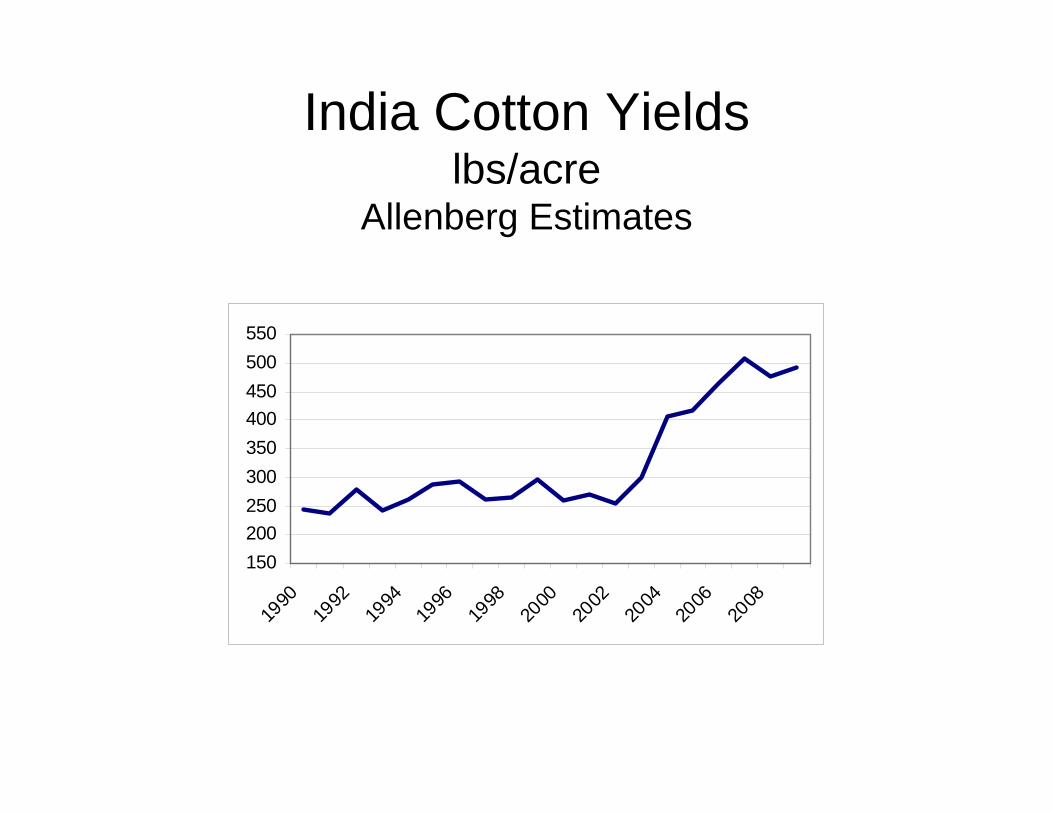
India Cotton Yieldslbs/acre
Allenberg Estimates
150200250300350400450500550
1990
1992
1994
1996
1998
2000
2002
2004
2006
2008
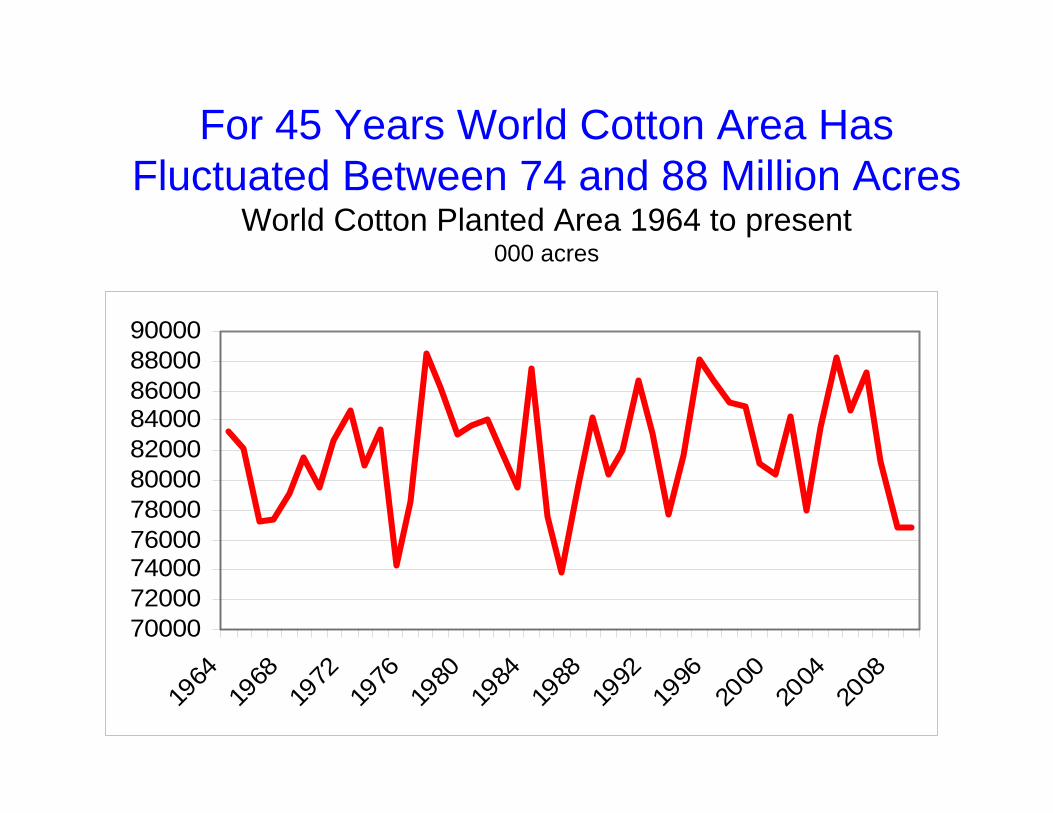
For 45 Years World Cotton Area Has Fluctuated Between 74 and 88 Million Acres
World Cotton Planted Area 1964 to present000 acres
7000072000740007600078000800008200084000860008800090000
1964
1968
1972
1976
1980
1984
1988
1992
1996
2000
2004
2008
Cotton Demand ProspectsHow Much Will We Need in Recovery?
• The recovery is just beginning. Unemployment remains high, spending remains low, and the world’s textile industry continues to operate at a greatly reduced rate.
• This is the first truly global recession. In past contractions of this magnitude major portions of the world were under central planning. The decline that occurred in world cotton use this time is for that reason unprecedented.
• History shows that in the US by the second year following the end of recession the lost demand is typically more than recovered.
• This recession was severe and a complete recovery may not occur until 2012.
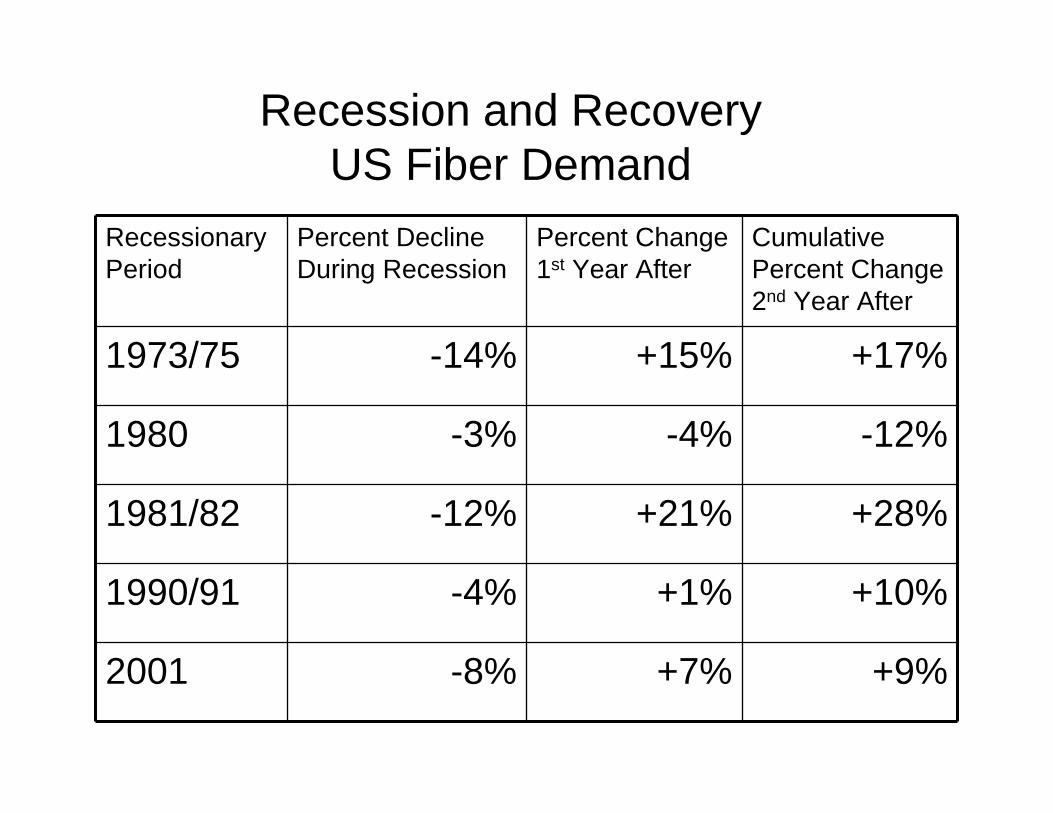
Recession and RecoveryUS Fiber Demand
Recessionary Period
Percent Decline During Recession
Percent Change 1st Year After
Cumulative Percent Change 2nd Year After
1973/75 -14% +15% +17%
1980 -3% -4% -12%
1981/82 -12% +21% +28%
1990/91 -4% +1% +10%
2001 -8% +7% +9%
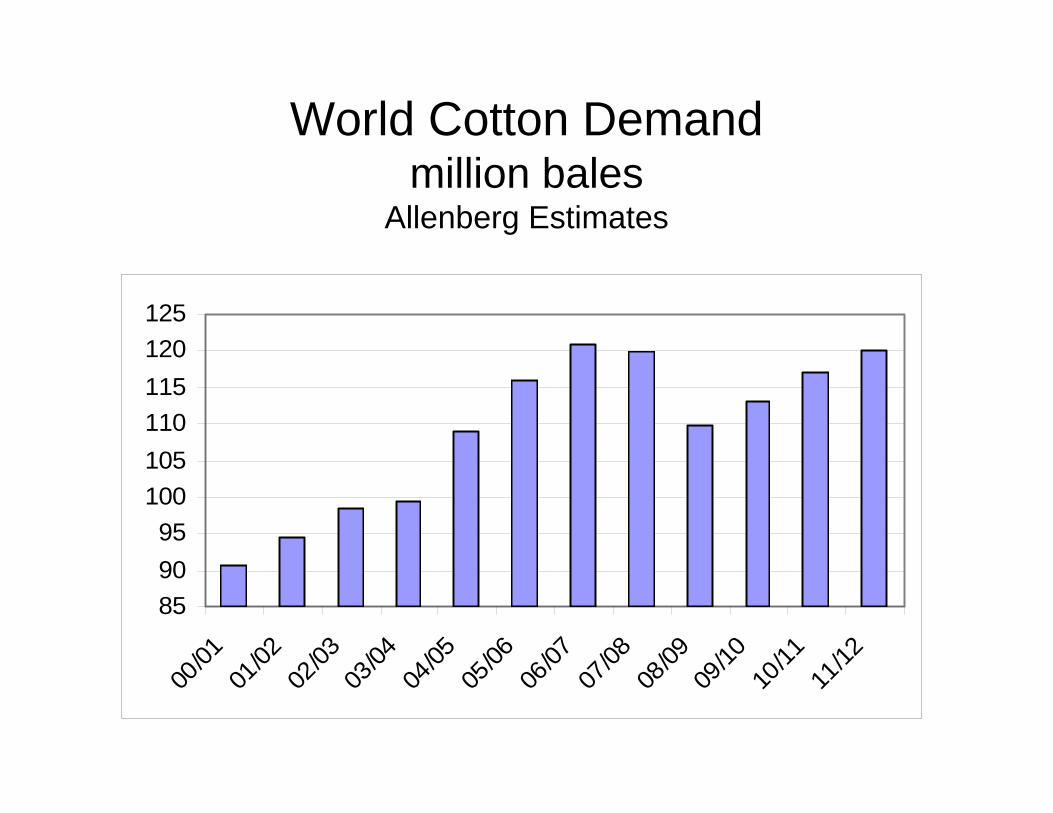
World Cotton Demand million bales
Allenberg Estimates
859095
100105110115120125
00/01
01/02
02/03
03/04
04/05
05/06
06/07
07/08
08/09
09/10
10/11
11/12
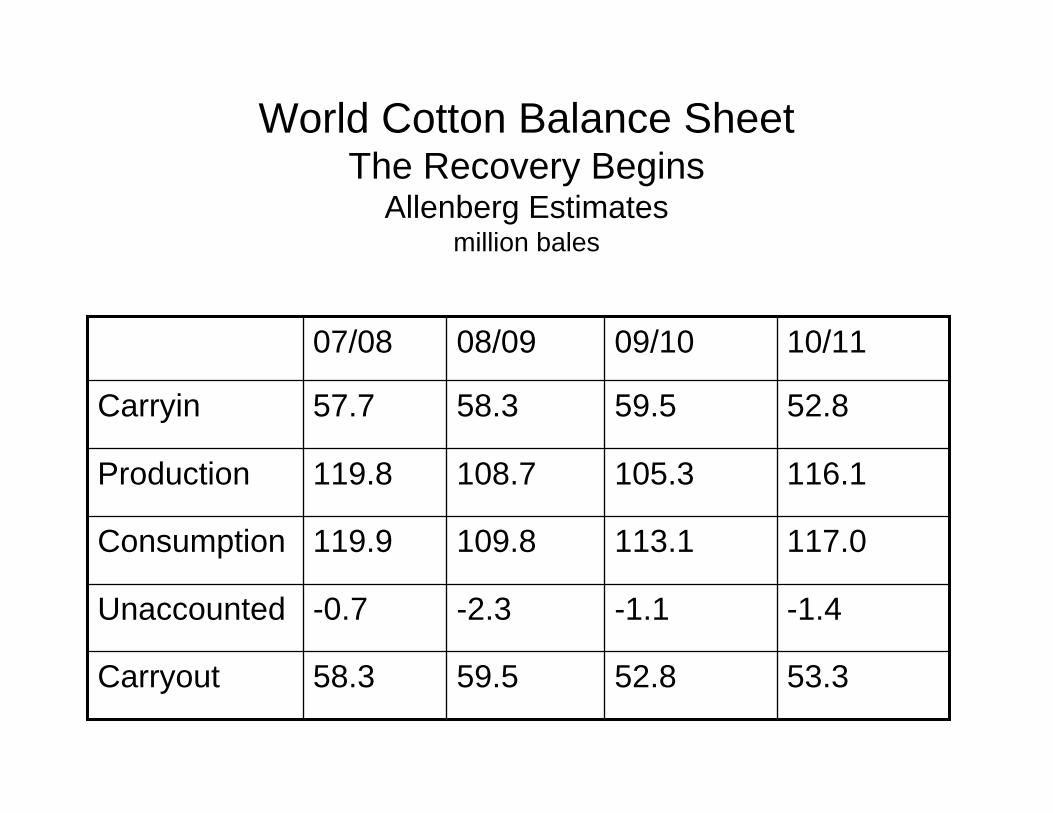
World Cotton Balance SheetThe Recovery Begins
Allenberg Estimatesmillion bales
53.352.859.558.3Carryout
-1.4-1.1-2.3-0.7Unaccounted
117.0113.1109.8119.9Consumption
116.1105.3108.7119.8Production
52.859.558.357.7Carryin
10/1109/1008/0907/08
Market Outlook
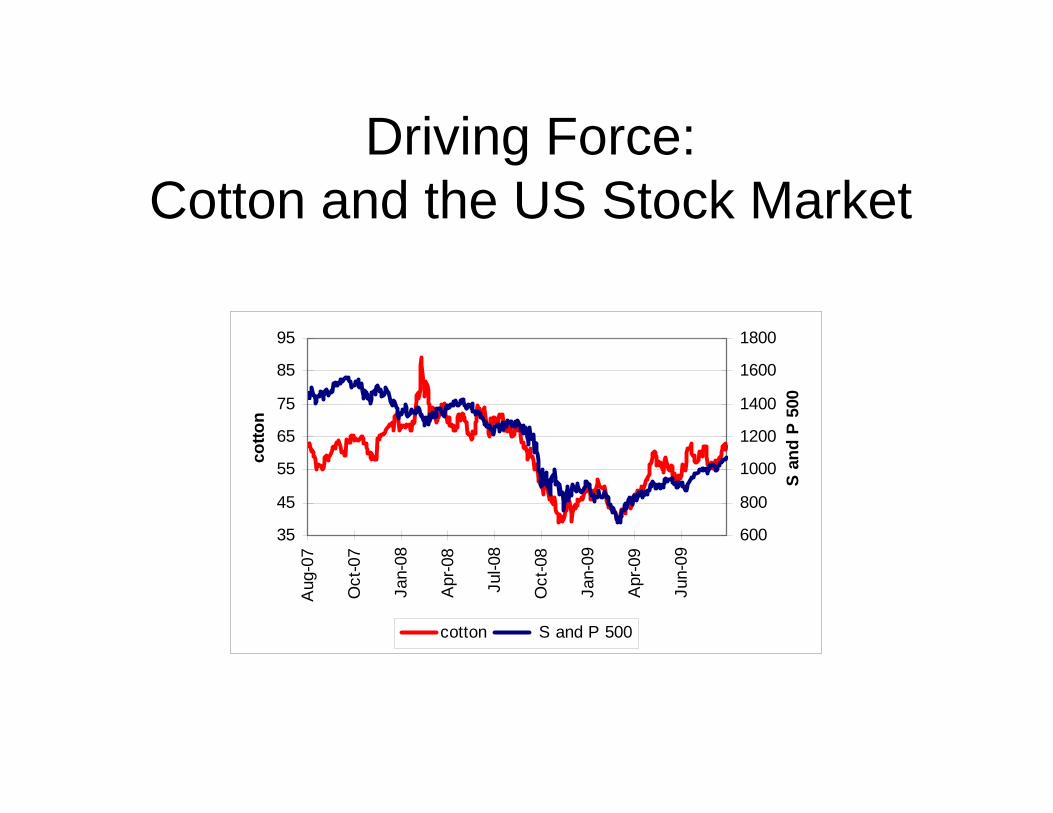
Driving Force: Cotton and the US Stock Market
35
45
55
65
75
85
95
Aug
-07
Oct
-07
Jan-
08
Apr
-08
Jul-0
8
Oct
-08
Jan-
09
Apr
-09
Jun-
09
cotto
n
600
800
1000
1200
1400
1600
1800
S an
d P
500
cotton S and P 500
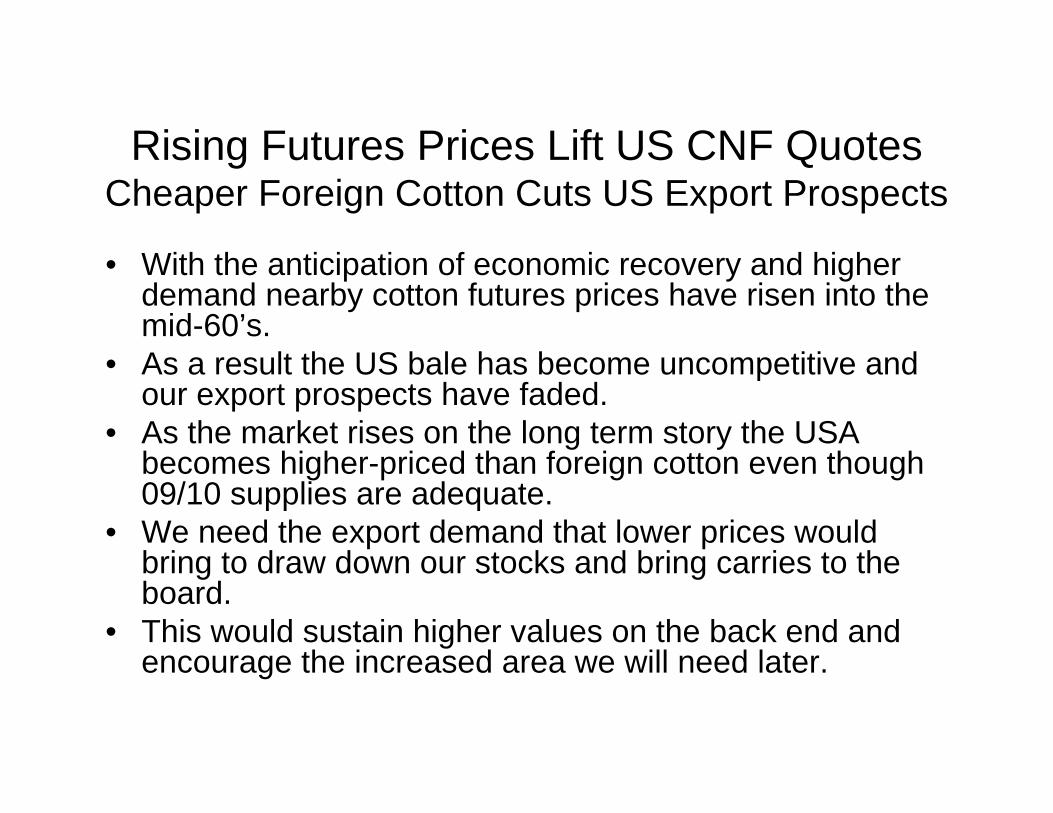
Rising Futures Prices Lift US CNF QuotesCheaper Foreign Cotton Cuts US Export Prospects
• With the anticipation of economic recovery and higher demand nearby cotton futures prices have risen into the mid-60’s.
• As a result the US bale has become uncompetitive and our export prospects have faded.
• As the market rises on the long term story the USA becomes higher-priced than foreign cotton even though 09/10 supplies are adequate.
• We need the export demand that lower prices would bring to draw down our stocks and bring carries to the board.
• This would sustain higher values on the back end and encourage the increased area we will need later.
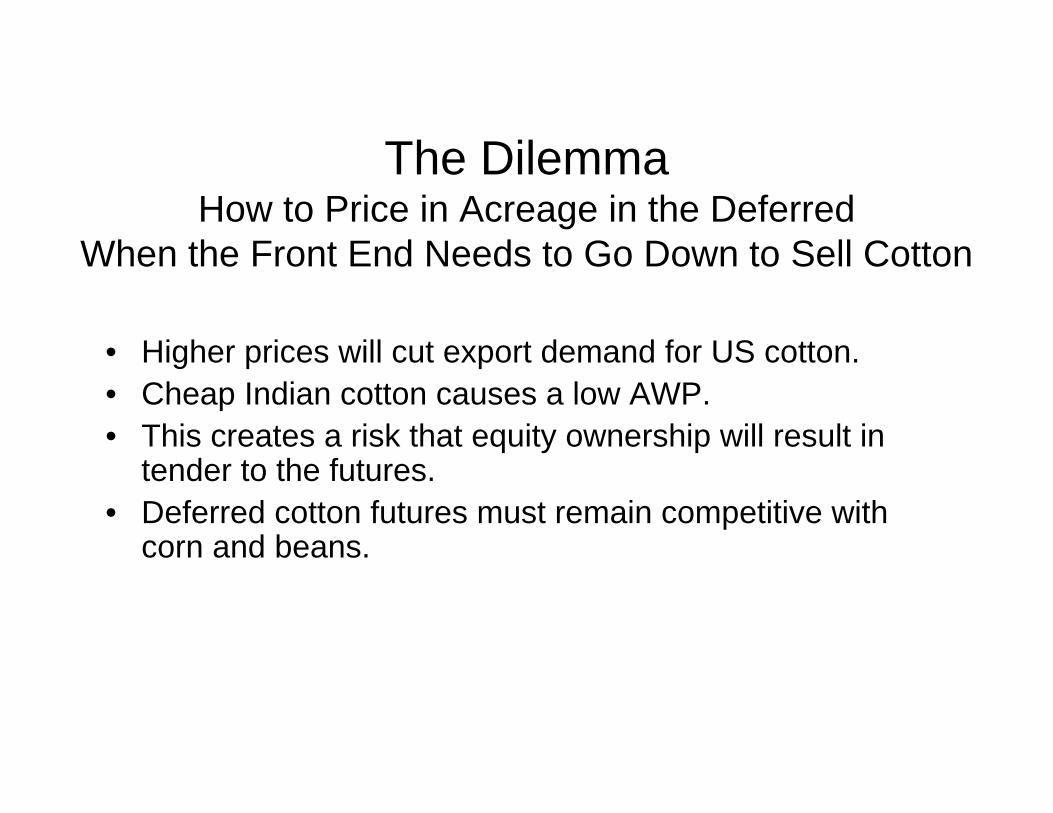
The DilemmaHow to Price in Acreage in the Deferred
When the Front End Needs to Go Down to Sell Cotton
• Higher prices will cut export demand for US cotton.• Cheap Indian cotton causes a low AWP.• This creates a risk that equity ownership will result in
tender to the futures.• Deferred cotton futures must remain competitive with
corn and beans.
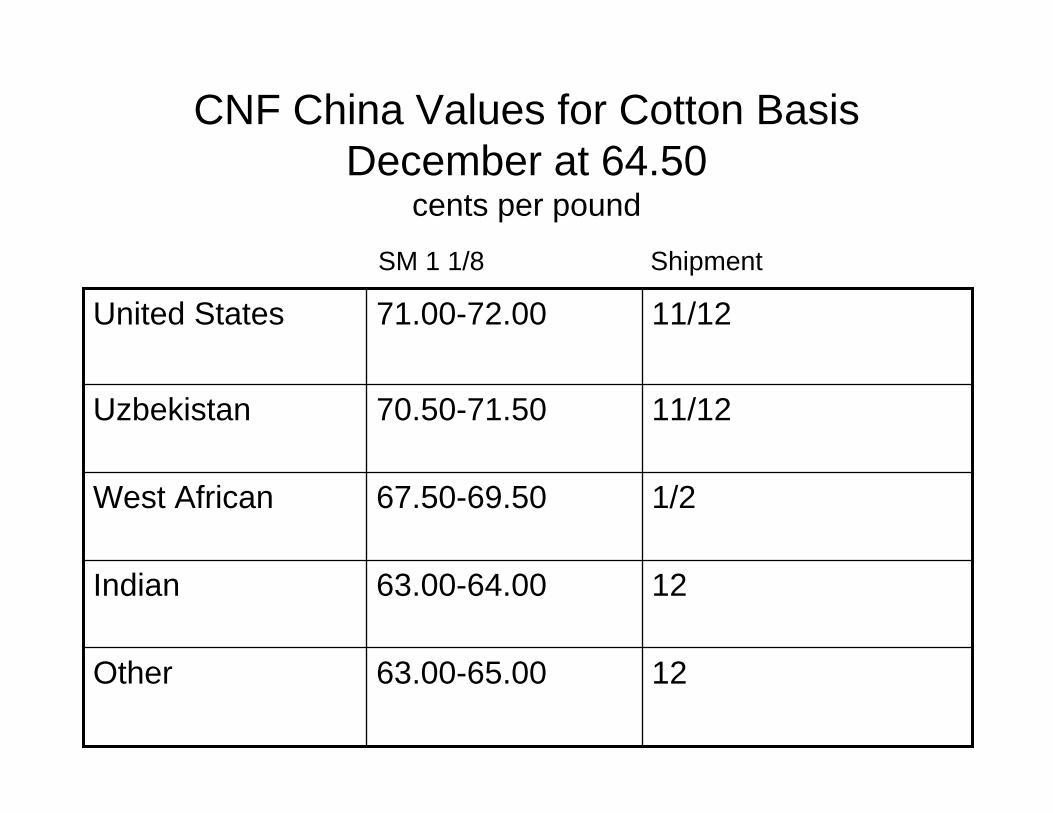
CNF China Values for Cotton Basis December at 64.50
cents per pound
1263.00-64.00Indian
63.00-65.00
67.50-69.50
70.50-71.50
71.00-72.00
12Other
1/2West African
11/12Uzbekistan
11/12United States
ShipmentSM 1 1/8
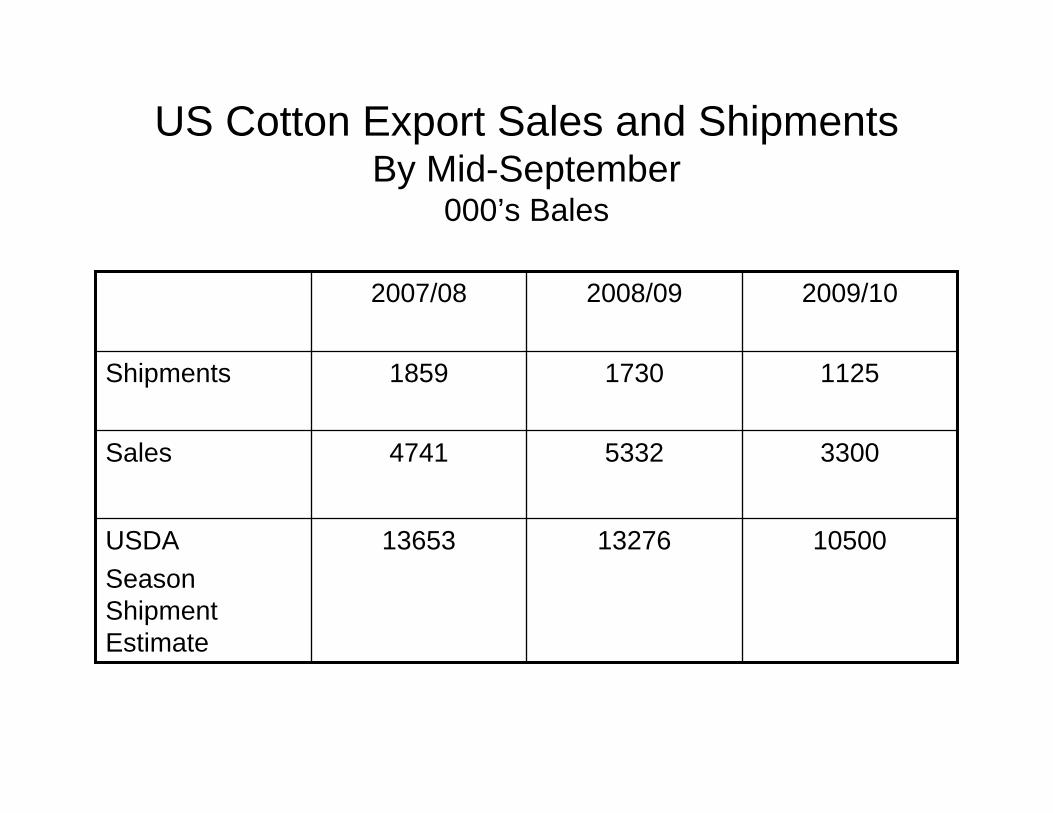
US Cotton Export Sales and ShipmentsBy Mid-September
000’s Bales
105001327613653USDA Season Shipment Estimate
330053324741Sales
112517301859Shipments
2009/102008/092007/08
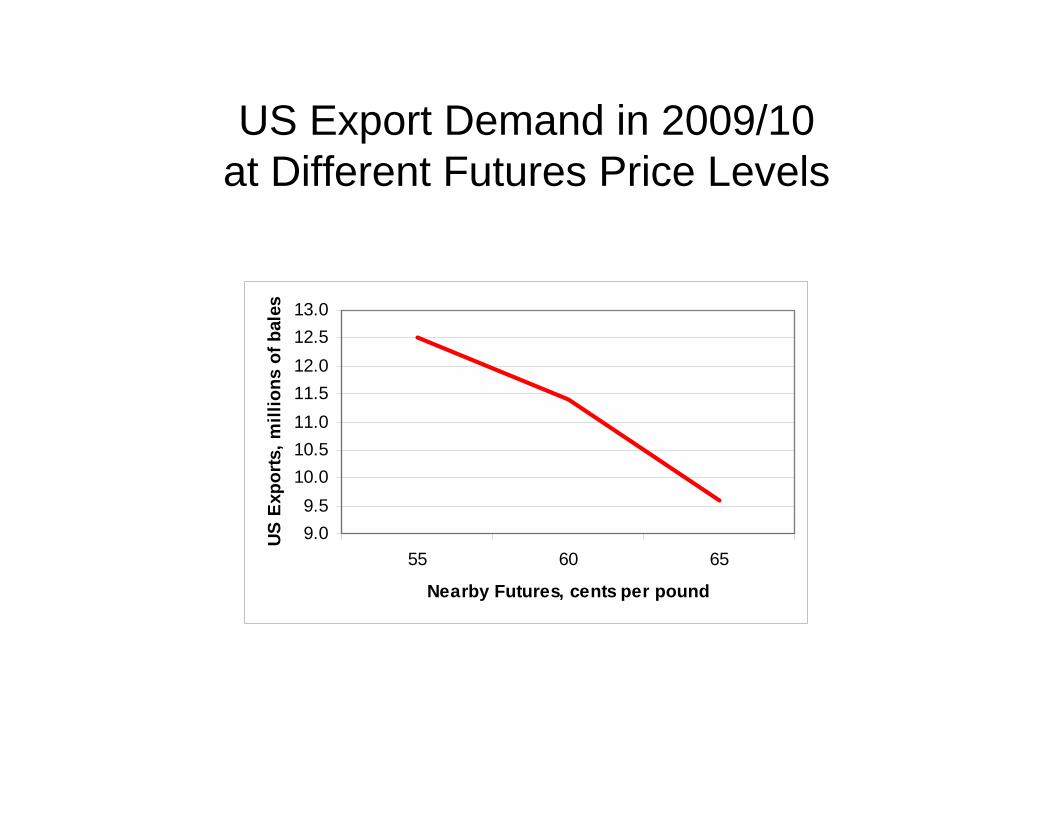
US Export Demand in 2009/10 at Different Futures Price Levels
9.09.5
10.010.511.011.512.012.513.0
55 60 65
Nearby Futures, cents per pound
US
Exp
orts
, mill
ions
of b
ales
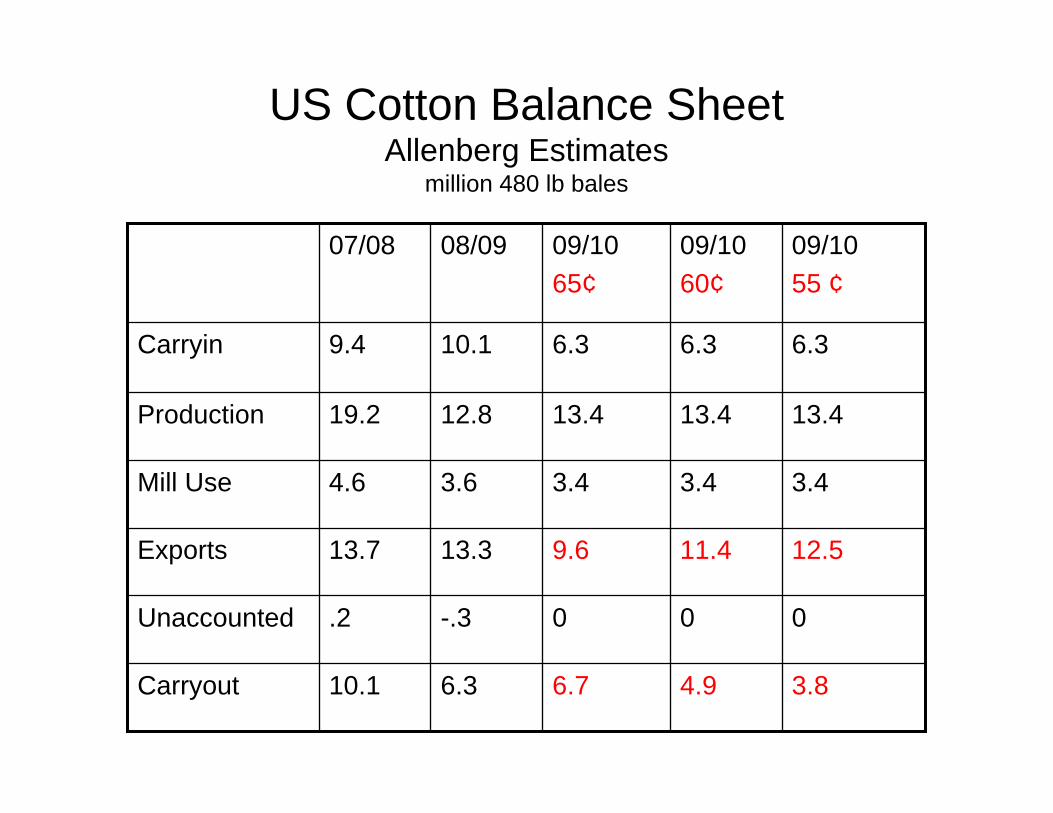
US Cotton Balance SheetAllenberg Estimates
million 480 lb bales
4.9
0
11.4
3.4
13.4
6.3
09/1060¢
3.86.76.310.1Carryout
00-.3.2Unaccounted
12.59.613.313.7Exports
3.43.43.64.6Mill Use
13.413.412.819.2Production
6.36.310.19.4Carryin
09/1055 ¢
09/1065¢
08/0907/08
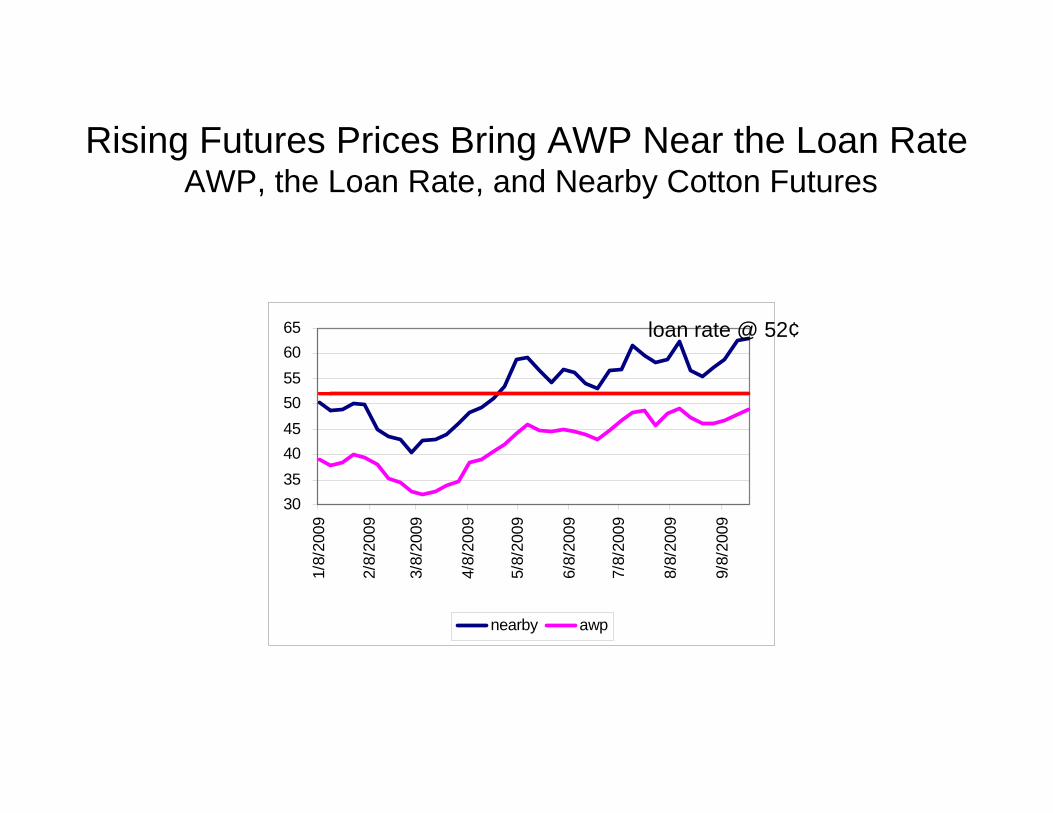
Rising Futures Prices Have Increased US Loan Equity Values
• As the futures market has risen the AWP has also gone up, but not nearly as much.
• The widening AWP-futures spread has enhanced equity values by about 2.5 cents since the beginning of the season.
• This has contributed to uncompetitive pricing for US cotton.
• As the AWP rises towards the loan the prospects for forgiveness of carry diminish.
• US loan changes have increased storage costs.
3035404550556065
1/8/
2009
2/8/
2009
3/8/
2009
4/8/
2009
5/8/
2009
6/8/
2009
7/8/
2009
8/8/
2009
9/8/
2009
nearby awp
Rising Futures Prices Bring AWP Near the Loan RateAWP, the Loan Rate, and Nearby Cotton Futures
loan rate @ 52¢
Three Keys to the Nearby Market:China, India, and the United States
• Nearby market fundamentals depend largely on how much cotton China will import and how much cotton India and/or the US will export.
• China has chosen to sell cotton from the strategic reserve and minimize issuance of import quota at the present time. How long it continues this policy will determine whether world trade continues to be under 30 million bales.
• The US and India combined have an exportable surplus of nearly 20 million bales in 2009/10.
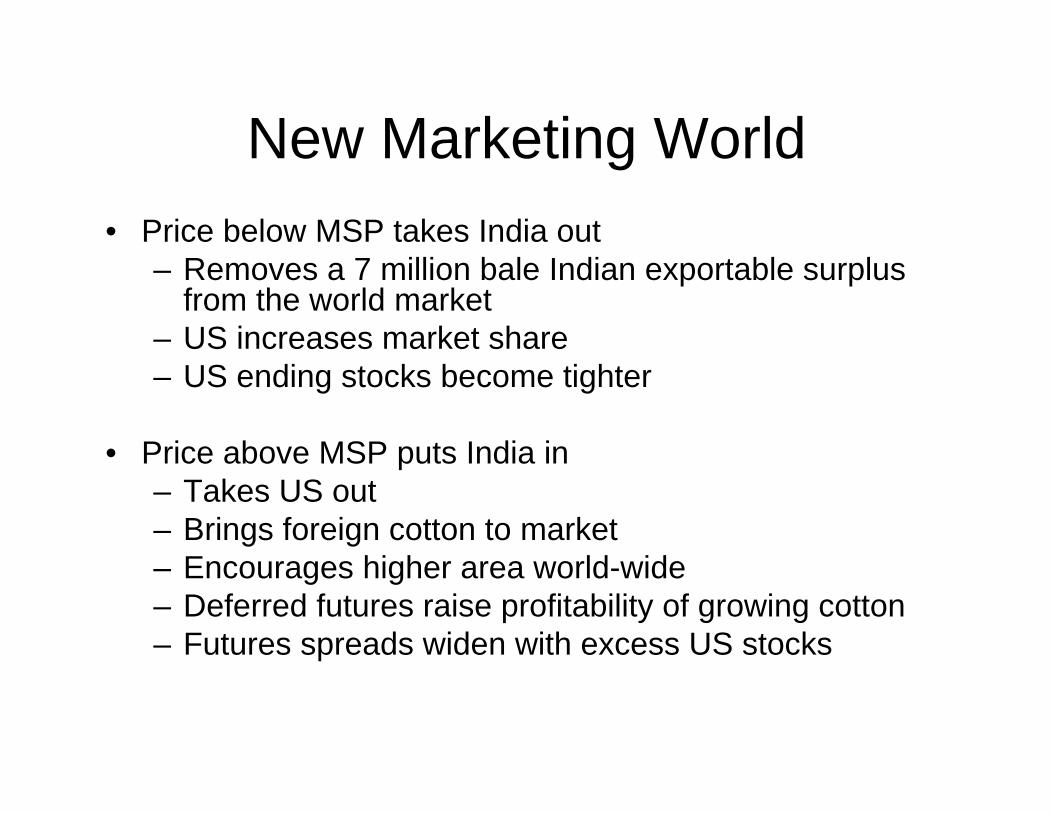
New Marketing World• Price below MSP takes India out
– Removes a 7 million bale Indian exportable surplus from the world market
– US increases market share– US ending stocks become tighter
• Price above MSP puts India in – Takes US out– Brings foreign cotton to market– Encourages higher area world-wide– Deferred futures raise profitability of growing cotton– Futures spreads widen with excess US stocks
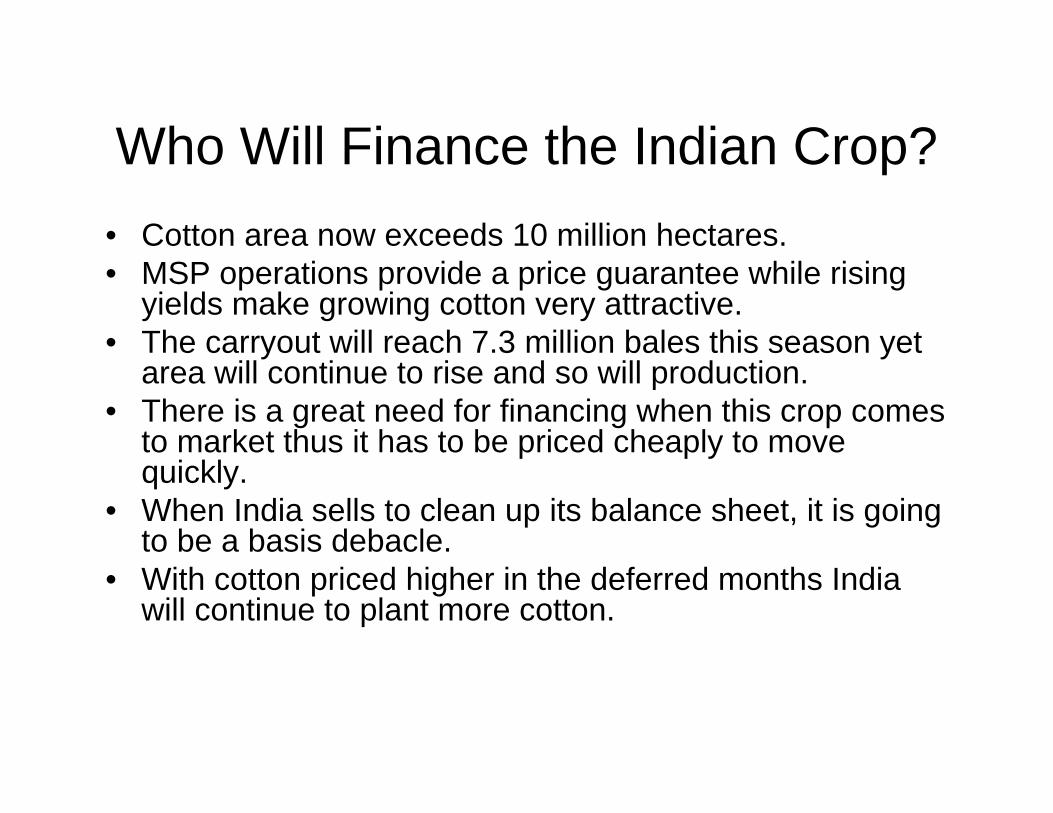
Who Will Finance the Indian Crop?• Cotton area now exceeds 10 million hectares.• MSP operations provide a price guarantee while rising
yields make growing cotton very attractive. • The carryout will reach 7.3 million bales this season yet
area will continue to rise and so will production.• There is a great need for financing when this crop comes
to market thus it has to be priced cheaply to move quickly.
• When India sells to clean up its balance sheet, it is going to be a basis debacle.
• With cotton priced higher in the deferred months India will continue to plant more cotton.
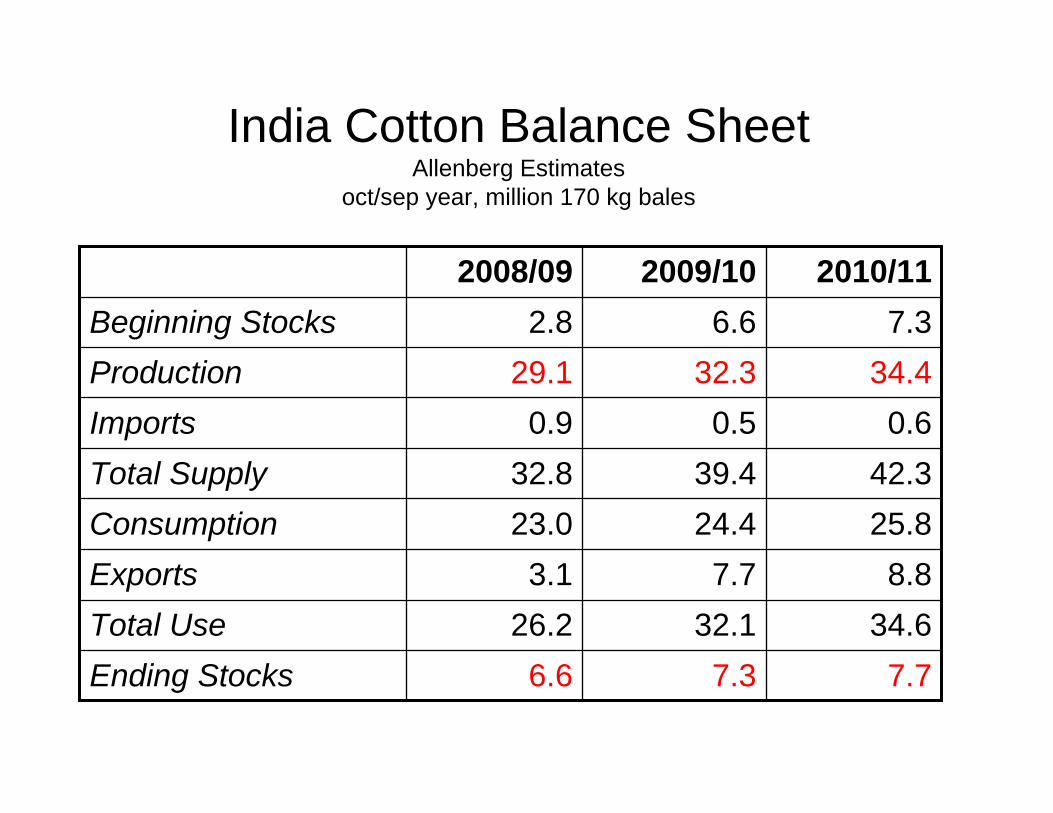
India Cotton Balance SheetAllenberg Estimates
oct/sep year, million 170 kg bales
7.77.36.6Ending Stocks34.632.126.2Total Use
8.87.73.1Exports25.824.423.0Consumption42.339.432.8Total Supply
0.60.50.9Imports34.432.329.1Production
7.36.62.8Beginning Stocks2010/112009/102008/09
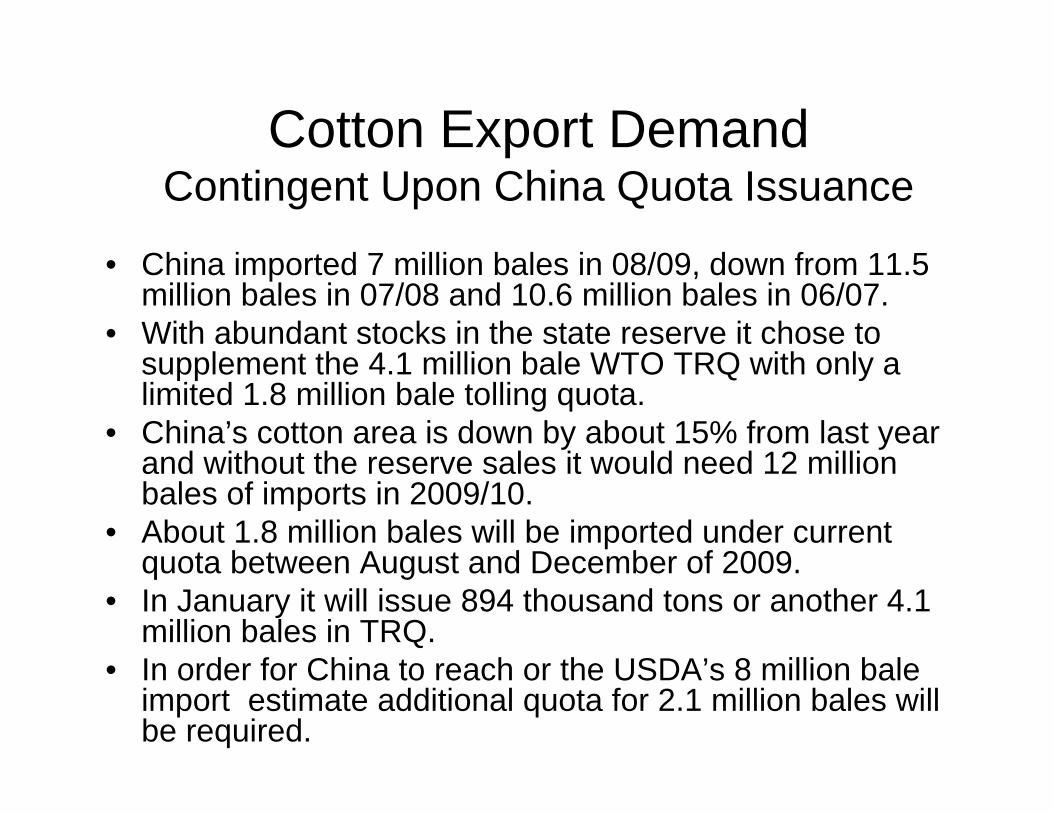
Cotton Export DemandContingent Upon China Quota Issuance
• China imported 7 million bales in 08/09, down from 11.5 million bales in 07/08 and 10.6 million bales in 06/07.
• With abundant stocks in the state reserve it chose to supplement the 4.1 million bale WTO TRQ with only a limited 1.8 million bale tolling quota.
• China’s cotton area is down by about 15% from last year and without the reserve sales it would need 12 million bales of imports in 2009/10.
• About 1.8 million bales will be imported under current quota between August and December of 2009.
• In January it will issue 894 thousand tons or another 4.1 million bales in TRQ.
• In order for China to reach or the USDA’s 8 million bale import estimate additional quota for 2.1 million bales will be required.
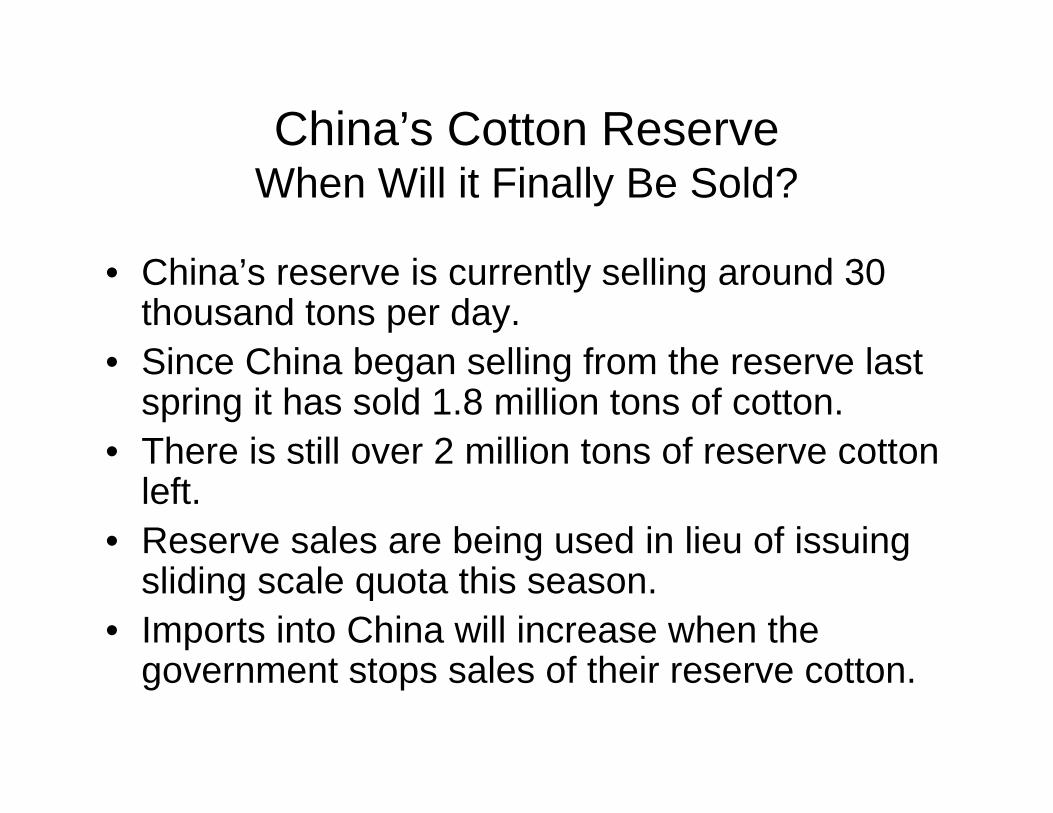
China’s Cotton ReserveWhen Will it Finally Be Sold?
• China’s reserve is currently selling around 30 thousand tons per day.
• Since China began selling from the reserve last spring it has sold 1.8 million tons of cotton.
• There is still over 2 million tons of reserve cotton left.
• Reserve sales are being used in lieu of issuing sliding scale quota this season.
• Imports into China will increase when the government stops sales of their reserve cotton.
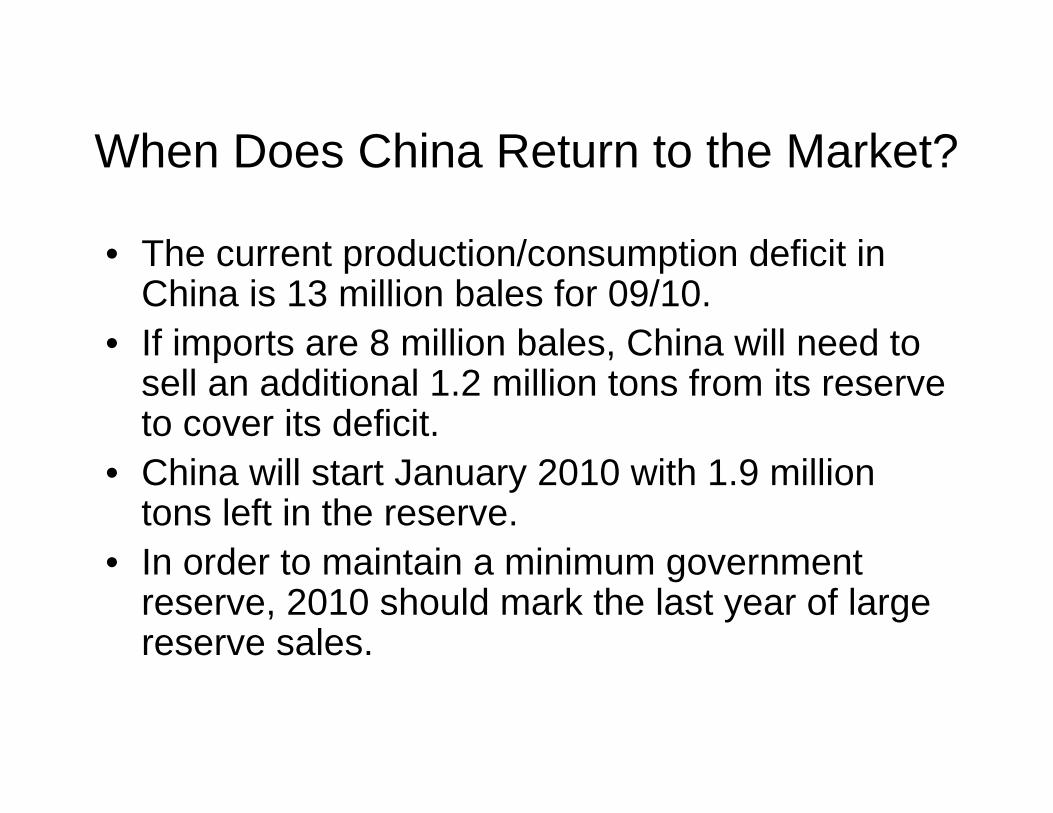
When Does China Return to the Market?
• The current production/consumption deficit in China is 13 million bales for 09/10.
• If imports are 8 million bales, China will need to sell an additional 1.2 million tons from its reserve to cover its deficit.
• China will start January 2010 with 1.9 million tons left in the reserve.
• In order to maintain a minimum government reserve, 2010 should mark the last year of large reserve sales.

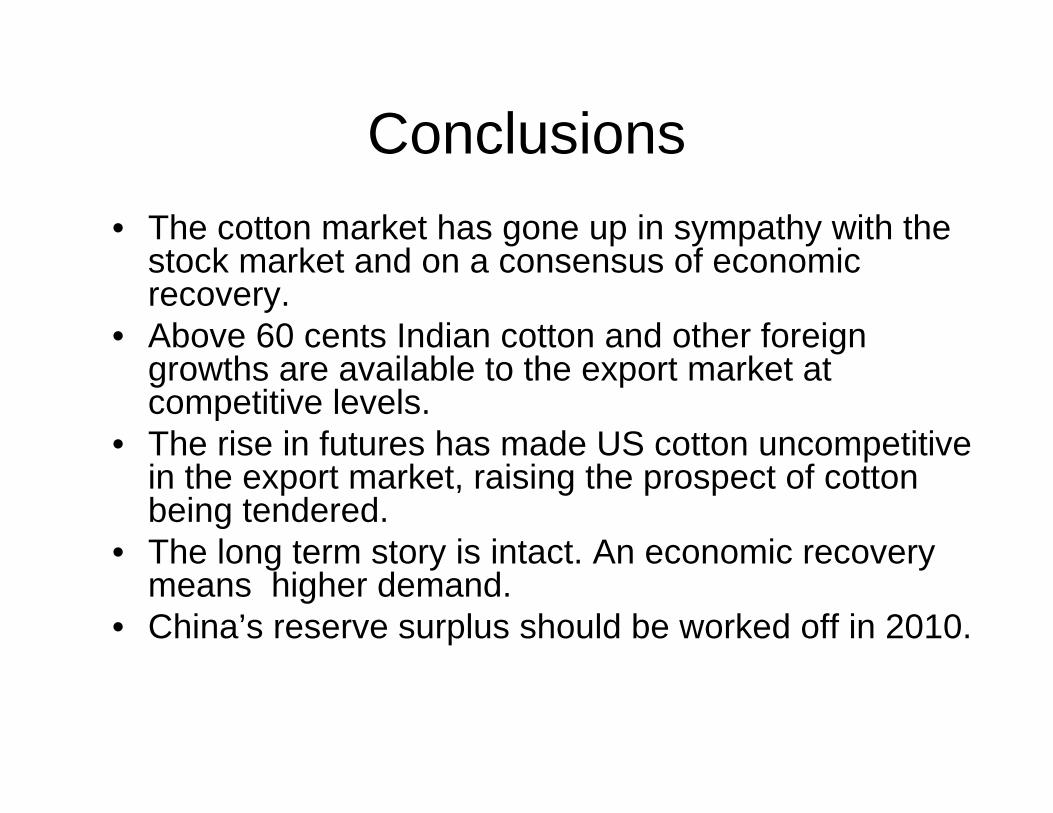
Conclusions• The cotton market has gone up in sympathy with the
stock market and on a consensus of economic recovery.
• Above 60 cents Indian cotton and other foreign growths are available to the export market at competitive levels.
• The rise in futures has made US cotton uncompetitive in the export market, raising the prospect of cotton being tendered.
• The long term story is intact. An economic recovery means higher demand.
• China’s reserve surplus should be worked off in 2010.
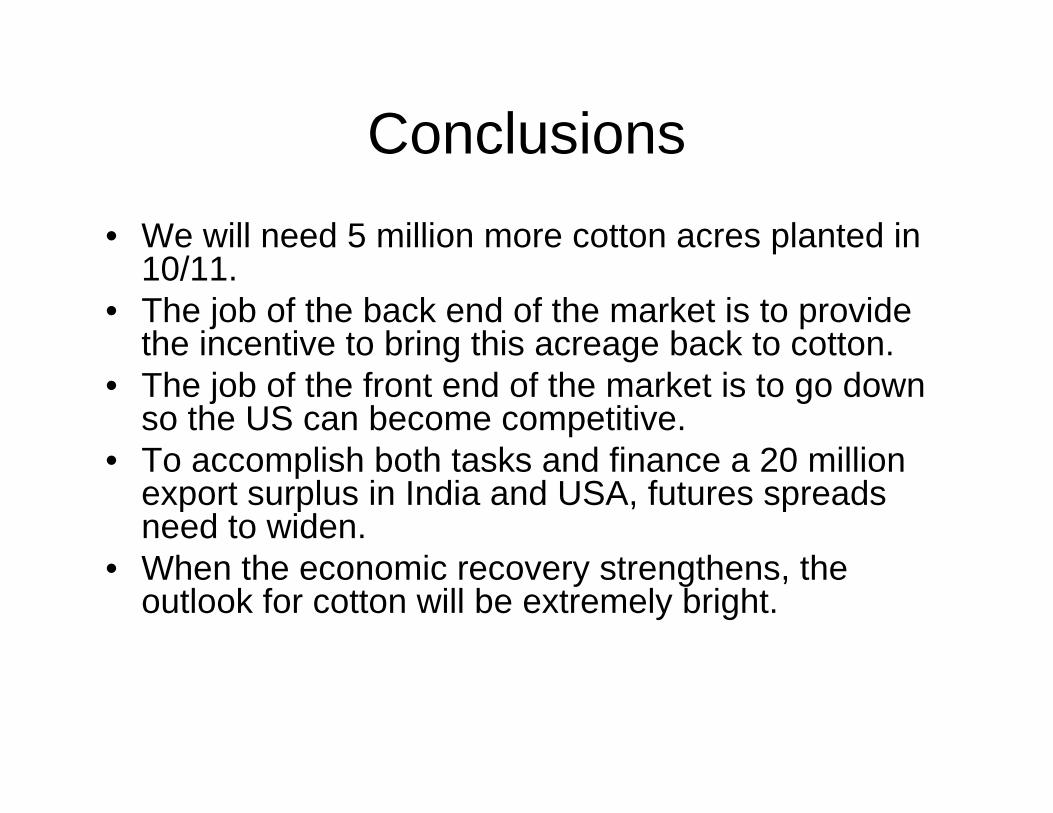
Conclusions• We will need 5 million more cotton acres planted in
10/11.• The job of the back end of the market is to provide
the incentive to bring this acreage back to cotton.• The job of the front end of the market is to go down
so the US can become competitive.• To accomplish both tasks and finance a 20 million
export surplus in India and USA, futures spreads need to widen.
• When the economic recovery strengthens, the outlook for cotton will be extremely bright.

The End