Embed Size (px)
Citation preview
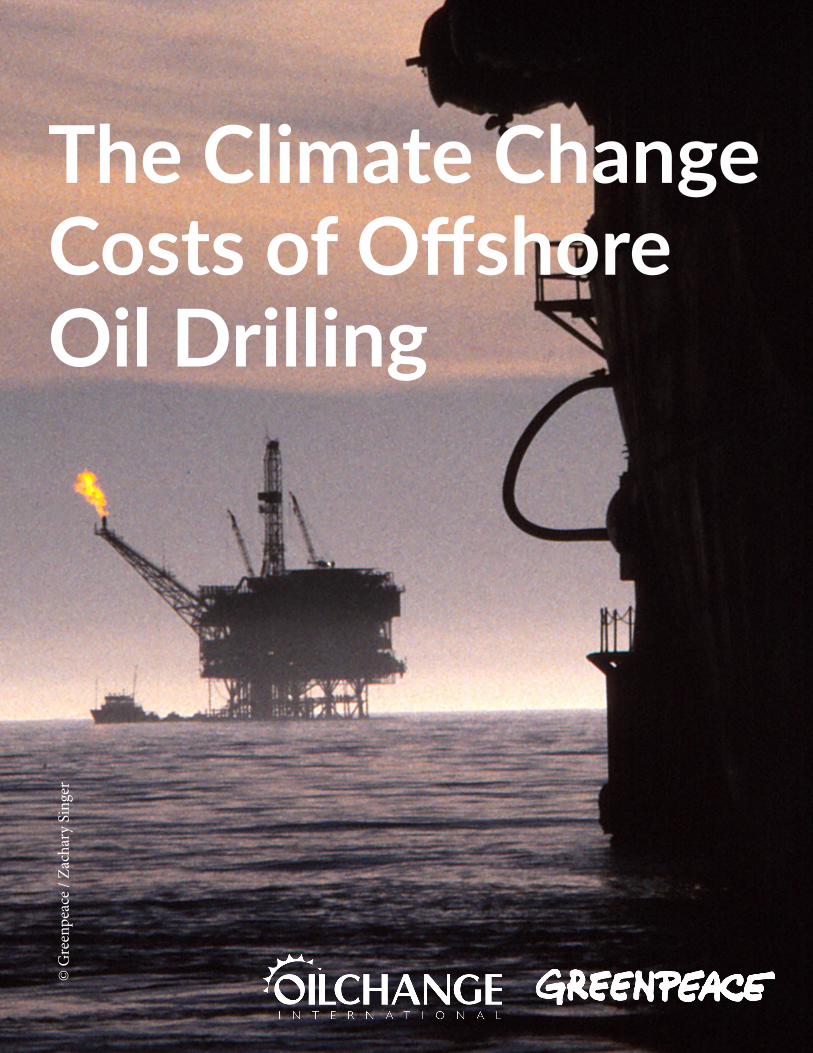
The Climate Change Costs of Offshore Oil Drilling 1
The Climate ChangeCosts of Offshore Oil Drilling
© G
reen
peac
e / Z
acha
ry S
inge
r
June 2016 Written by: Tim Donaghy
For more information contact:Tim Donaghy: [email protected] Stockman: [email protected]
Design and Graphics by: Melodie Monasterios
The Climate Change Costs of Offshore Oil Drilling 3
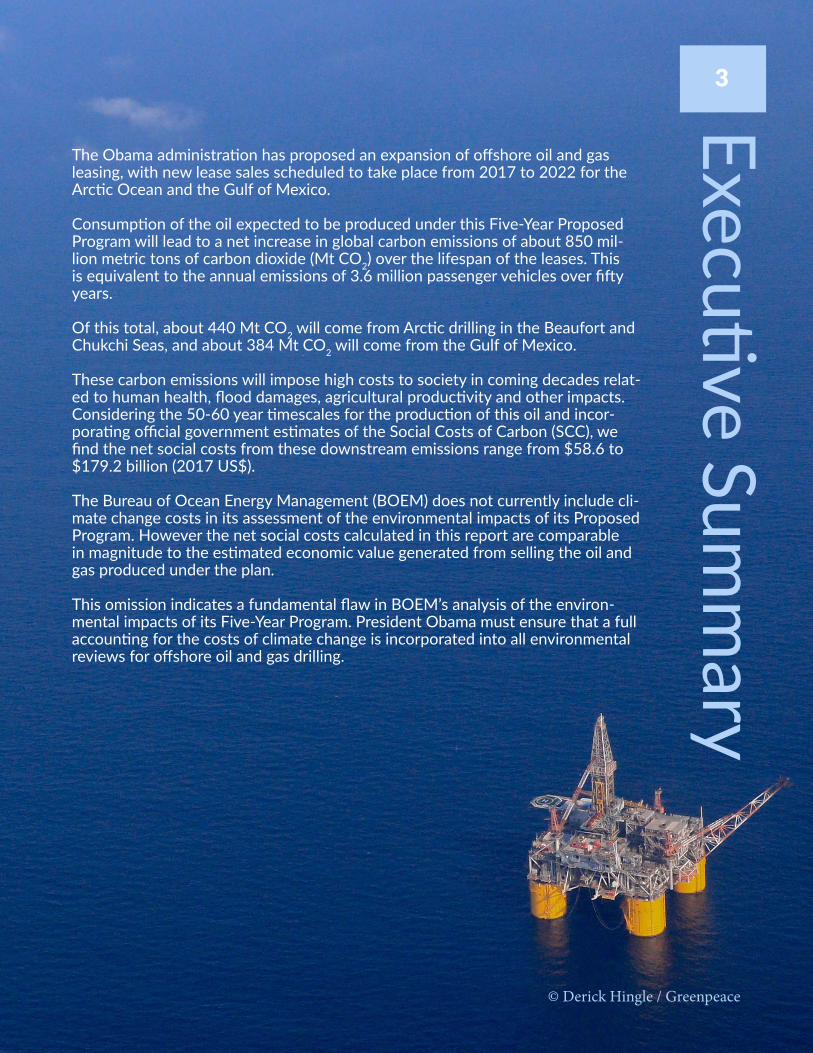
The Obama administration has proposed an expansion of offshore oil and gas leasing, with new lease sales scheduled to take place from 2017 to 2022 for the Arctic Ocean and the Gulf of Mexico.
Consumption of the oil expected to be produced under this Five-Year Proposed Program will lead to a net increase in global carbon emissions of about 850 mil-lion metric tons of carbon dioxide (Mt CO2) over the lifespan of the leases. This is equivalent to the annual emissions of 3.6 million passenger vehicles over fifty years.
Of this total, about 440 Mt CO2 will come from Arctic drilling in the Beaufort and Chukchi Seas, and about 384 Mt CO2 will come from the Gulf of Mexico.
These carbon emissions will impose high costs to society in coming decades relat-ed to human health, flood damages, agricultural productivity and other impacts. Considering the 50-60 year timescales for the production of this oil and incor-porating official government estimates of the Social Costs of Carbon (SCC), we find the net social costs from these downstream emissions range from $58.6 to $179.2 billion (2017 US$).
The Bureau of Ocean Energy Management (BOEM) does not currently include cli-mate change costs in its assessment of the environmental impacts of its Proposed Program. However the net social costs calculated in this report are comparable in magnitude to the estimated economic value generated from selling the oil and gas produced under the plan.
This omission indicates a fundamental flaw in BOEM’s analysis of the environ-mental impacts of its Five-Year Program. President Obama must ensure that a full accounting for the costs of climate change is incorporated into all environmental reviews for offshore oil and gas drilling.
3Executive Summ
ary
© Derick Hingle / Greenpeace
4The Climate Change Costs of Offshore Oil Drilling
Introduction
In December 2015, President Barack Obama joined other world leaders in Paris to agree to an international accord to address climate change. The latest science makes it clear that we must leave the vast majority of known fossil fuel reserves unburned if we are to have any chance at fulfilling that accord and limiting global warming to 2 degrees Celsius.1 President Obama has recognized this fact, stating that “if we’re going to prevent large parts of this Earth from becom-ing not only inhospitable but uninhabitable in our lifetimes, we’re going to have to keep some fossil fuels in the ground.”2
Despite advancing a number of commendable policies to lower emissions of heat-trapping greenhouse gases, the Obama administration has continued to lease out federally-owned lands and waters to fossil fuel companies seeking to extract coal, oil and gas. This policy is coun-ter-productive and threatens to undermine President Obama’s climate legacy. Putting an end to federal fossil fuel leasing would significantly reduce global CO2 emissions and make it easier for the United States to meet the Paris climate targets. While President Obama has opened a programmatic review of the federal coal leasing process, the ultimate policy outcomes of that review are uncertain. Furthermore, his administration is currently drafting a plan to expand off-shore oil and gas drilling.3
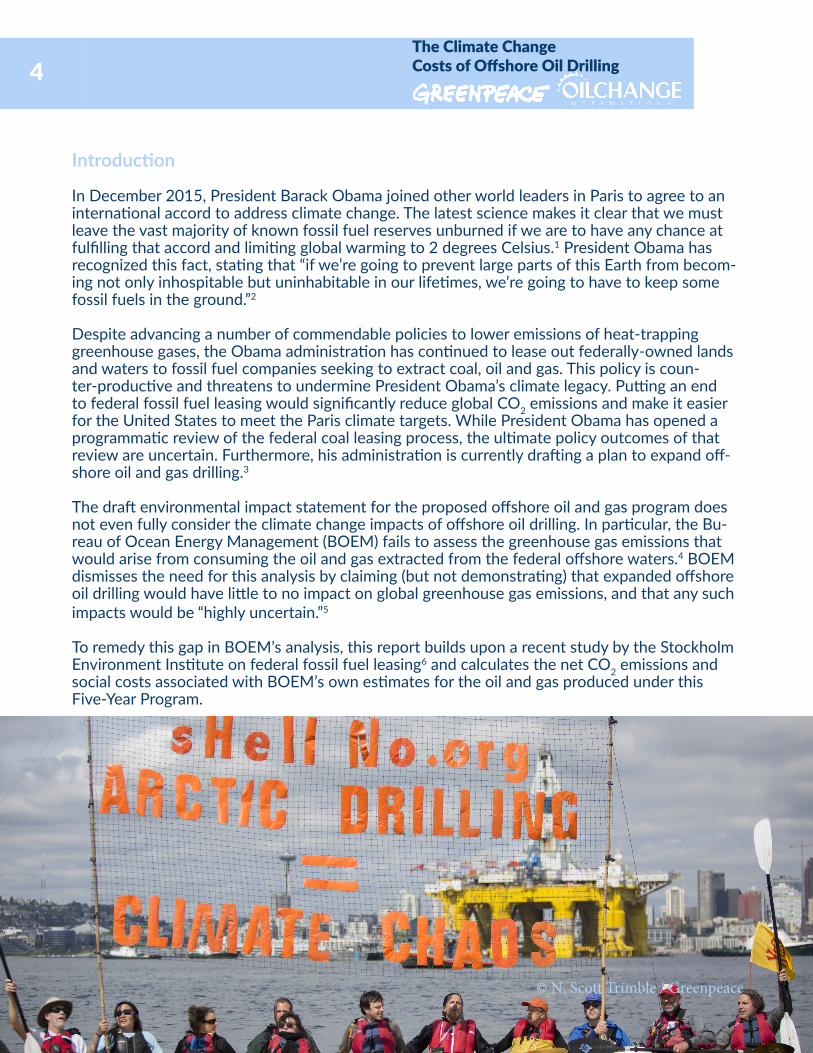
The draft environmental impact statement for the proposed offshore oil and gas program does not even fully consider the climate change impacts of offshore oil drilling. In particular, the Bu-reau of Ocean Energy Management (BOEM) fails to assess the greenhouse gas emissions that would arise from consuming the oil and gas extracted from the federal offshore waters.4 BOEM dismisses the need for this analysis by claiming (but not demonstrating) that expanded offshore oil drilling would have little to no impact on global greenhouse gas emissions, and that any such impacts would be “highly uncertain.”5
To remedy this gap in BOEM’s analysis, this report builds upon a recent study by the Stockholm Environment Institute on federal fossil fuel leasing6 and calculates the net CO2 emissions and social costs associated with BOEM’s own estimates for the oil and gas produced under this Five-Year Program.
© N. Scott Trimble / Greenpeace
The Climate Change Costs of Offshore Oil Drilling 5
Methodology
This report calculates the social costs of carbon emissions associated with the consumption of oil based upon BOEM’s own estimates for the 2017-2022 Five-Year Program.7 BOEM’s pro-duction estimates and timelines8 are converted to net CO2 emissions using the methodology described in Erickson & Lazarus (2016),9 and those net emissions are then converted into net social costs using the findings of the Interagency Working Group (IWG) on the Social Cost of Carbon (SCC).10
1. BOEM Production Scenarios
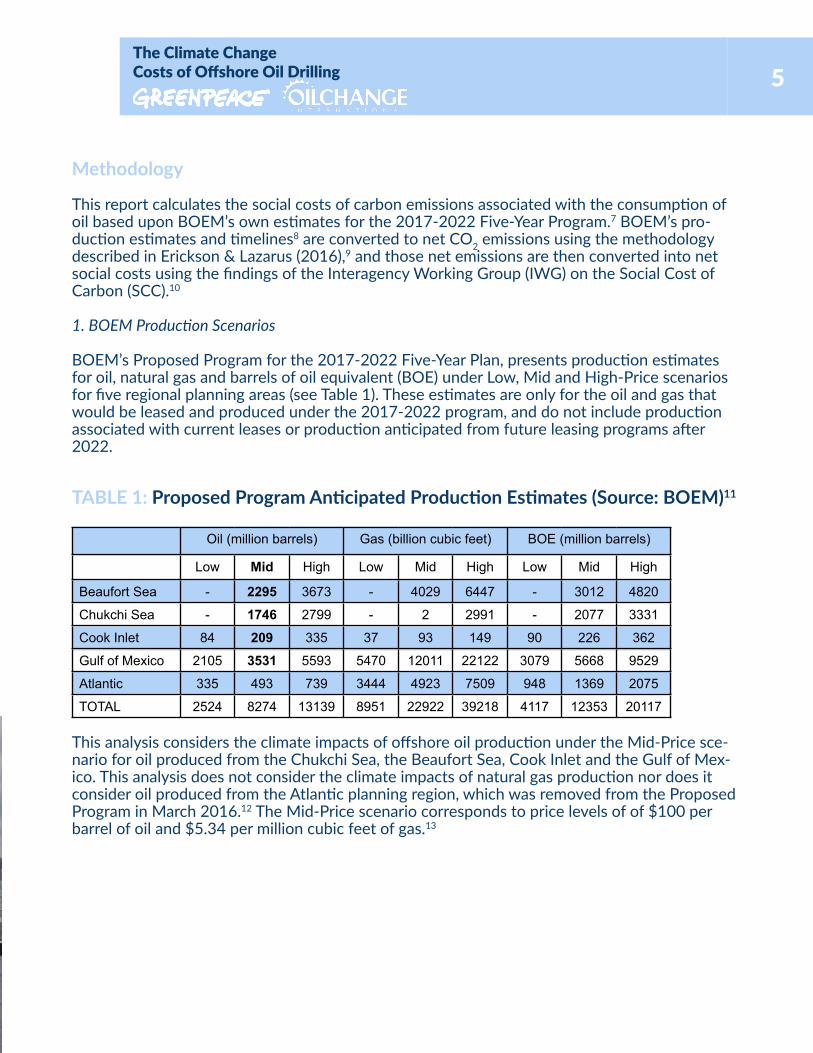
BOEM’s Proposed Program for the 2017-2022 Five-Year Plan, presents production estimates for oil, natural gas and barrels of oil equivalent (BOE) under Low, Mid and High-Price scenarios for five regional planning areas (see Table 1). These estimates are only for the oil and gas that would be leased and produced under the 2017-2022 program, and do not include production associated with current leases or production anticipated from future leasing programs after 2022.
TABLE 1: Proposed Program Anticipated Production Estimates (Source: BOEM)11
Oil (million barrels) Gas (billion cubic feet) BOE (million barrels)
Low Mid High Low Mid High Low Mid High
Beaufort Sea - 2295 3673 - 4029 6447 - 3012 4820
Chukchi Sea - 1746 2799 - 2 2991 - 2077 3331
Cook Inlet 84 209 335 37 93 149 90 226 362
Gulf of Mexico 2105 3531 5593 5470 12011 22122 3079 5668 9529
Atlantic 335 493 739 3444 4923 7509 948 1369 2075
TOTAL 2524 8274 13139 8951 22922 39218 4117 12353 20117
This analysis considers the climate impacts of offshore oil production under the Mid-Price sce-nario for oil produced from the Chukchi Sea, the Beaufort Sea, Cook Inlet and the Gulf of Mex-ico. This analysis does not consider the climate impacts of natural gas production nor does it consider oil produced from the Atlantic planning region, which was removed from the Proposed Program in March 2016.12 The Mid-Price scenario corresponds to price levels of of $100 per barrel of oil and $5.34 per million cubic feet of gas.13
6The Climate Change Costs of Offshore Oil Drilling
Under these assumptions, total oil production from the Proposed Program is 7,781 million barrels (Mbbl).
2. Net CO2 Emissions from Offshore Oil Production
The analysis considers the net impacts on global CO2 emissions in the case that the 2017-2022 Proposed Program is cancelled and none of BOEM’s anticipated production takes place. In particular, it compares global CO2 emissions under the Proposed Program to a “No Sale” option where the scheduled lease sales do not take place and energy markets respond to the changes in global oil and gas supply. Despite BOEM’s claims, the avoided oil production under the “No Sale” option will be partially, but not completely, replaced by fuels from other sources, and this will lead to a net drop in global emissions.
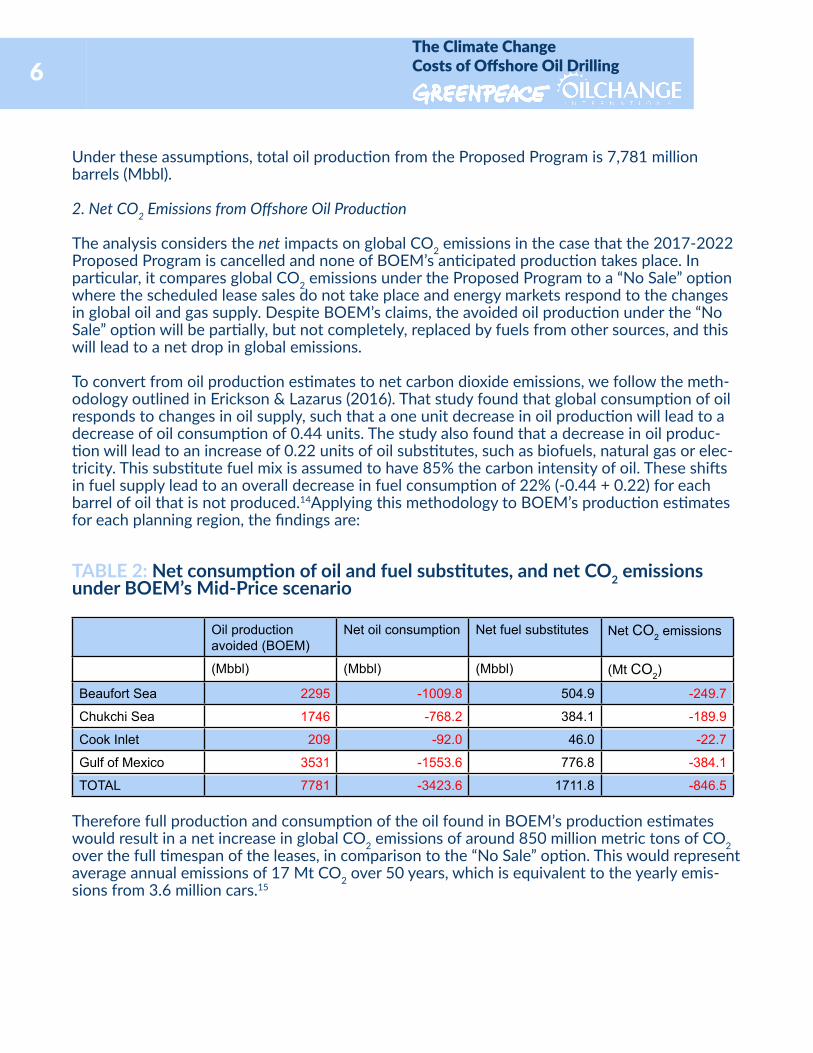
To convert from oil production estimates to net carbon dioxide emissions, we follow the meth-odology outlined in Erickson & Lazarus (2016). That study found that global consumption of oil responds to changes in oil supply, such that a one unit decrease in oil production will lead to a decrease of oil consumption of 0.44 units. The study also found that a decrease in oil produc-tion will lead to an increase of 0.22 units of oil substitutes, such as biofuels, natural gas or elec-tricity. This substitute fuel mix is assumed to have 85% the carbon intensity of oil. These shifts in fuel supply lead to an overall decrease in fuel consumption of 22% (-0.44 + 0.22) for each barrel of oil that is not produced.14Applying this methodology to BOEM’s production estimates for each planning region, the findings are:
TABLE 2: Net consumption of oil and fuel substitutes, and net CO2 emissions under BOEM’s Mid-Price scenario
Oil production avoided (BOEM)
Net oil consumption Net fuel substitutes Net CO2 emissions
(Mbbl) (Mbbl) (Mbbl) (Mt CO2)
Beaufort Sea 2295 -1009.8 504.9 -249.7
Chukchi Sea 1746 -768.2 384.1 -189.9
Cook Inlet 209 -92.0 46.0 -22.7
Gulf of Mexico 3531 -1553.6 776.8 -384.1
TOTAL 7781 -3423.6 1711.8 -846.5
Therefore full production and consumption of the oil found in BOEM’s production estimates would result in a net increase in global CO2 emissions of around 850 million metric tons of CO2 over the full timespan of the leases, in comparison to the “No Sale” option. This would represent average annual emissions of 17 Mt CO2 over 50 years, which is equivalent to the yearly emis-sions from 3.6 million cars.15
The Climate Change Costs of Offshore Oil Drilling 7
These findings are sensitive to how the oil market changes in response to oil production and to assumptions about the availability and carbon intensity of oil substitutes. These assump-tions are modeled by Erickson & Lazarus using a few key parameters.16 This analysis adopts the central values for the parameters used in that report, although we also consider two scenarios where those parameters are varied in order to test other future energy market possibilities. For example, if we were to adopt the assumptions from that study’s “lower carbon world” scenario, net emissions reduction from the “No Sale” option would total 1757 Mt CO2, whereas adopting the assumptions from the “higher carbon world” scenario would lead to emissions reductions of only 117 Mt CO2.
BOEM’s production timelines extend well beyond the 2015-2040 time period considered by Er-ickson & Lazarus. In the years beyond 2040, technological advances and concerted internation-al action to address climate change are likely to create conditions similar to the “lower carbon world” scenario. The assumption that these key parameters remain constant beyond 2040 is therefore likely to be a conservative assumption that understates the emissions reductions from reducing oil production.
BOEM also calculates GHG emissions from production and transport under the Proposed Pro-gram and the “No Sale” option.17 Their methodology finds higher net emissions under the “No Sale” option mainly due to an increase in oil imports to replace the unproduced oil. However, for each program area the decrease in downstream emissions (as calculated here in Table 2) is larger than the increased emissions from production and transport, implying that the net impact of the “No Sale” option is to decrease overall global GHG emissions.
3.BOEM Production Timelines
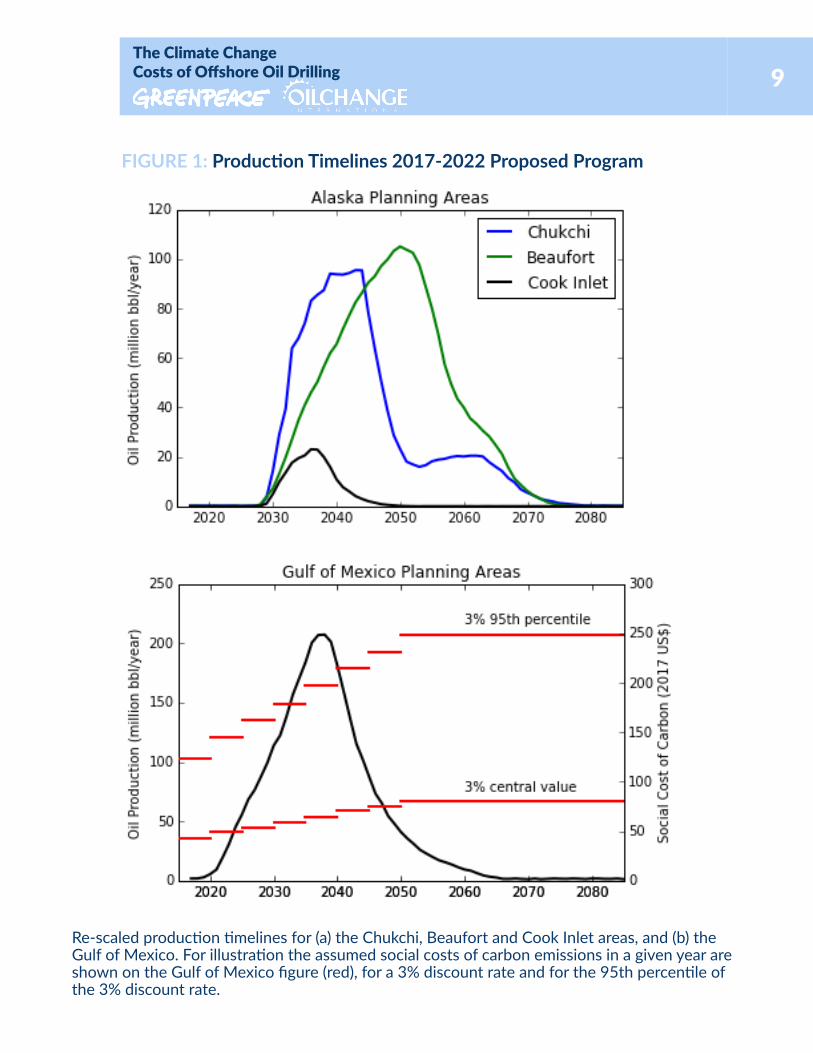
In order to estimate the social costs of producing and consuming the oil in BOEM’s scenarios it is necessary to know when the oil is produced and consumed. BOEM’s Draft Programmatic En-vironmental Impact Statement provides estimated production timelines for the various planning regions under the Mid-Price scenario,18 which were digitized with publicly available software (see Figure 1 below). Separate production timelines for the Western and Central/Eastern Gulf of Mexico were combined to provide one timeline for the entire Gulf.
BOEM’s production timelines show total oil and gas production (in units of million BOE/year) over a 50-60 year timespan for each region. Since this analysis only considers the carbon im-pacts of oil production (rather than oil and gas together) timelines were re-scaled by assuming that the amount of oil produced each year is proportional to the overall fraction of oil produced in the scenario for each region considered. 19
19
© Marcus Donner / Greenpeace
8The Climate Change Costs of Offshore Oil Drilling
4. Social Cost of Carbon
In 2015 the Interagency Working Group on Social Cost of Carbon revised their estimates for the social cost of a metric ton of carbon dioxide emitted in the years from 2010 to 2050.20 The purpose of the social cost of carbon estimates is:
“to allow agencies to incorporate the social benefits of reducing carbon dioxide (CO2) emis-sions into cost-benefit analyses of regulatory actions that impact cumulative global emissions. The SCC is an estimate of the monetized damages associated with an incremental increase in carbon emissions in a given year. It is intended to include (but is not limited to) changes in net agricultural productivity, human health, property damages from increased flood risk, and the value of ecosystem services due to climate change.”
The results are presented for a range of discount rates (5%, 3%, 2.5%), which represent different tradeoffs in how society values future costs and benefits in comparison to the present. These social cost estimates are considered to be incomplete and limited by the ability of the underly-ing models to fully capture the uncertain impacts of climate change in the coming decades.21 To address some of this uncertainty, the Working Group also tabulates the 95th percentile of the 3% discount rate in order to “represent higher-than-expected impacts from temperature change further out in the tails of the SCC distribution.”
Social cost of carbon estimates are reported in five year intervals and increase over time. This increase is due to the fact that the emission of a metric ton of CO2 will be more damaging in the future than it is today, assuming that the cumulative level of CO2 in the atmosphere will be high-er and the “physical and economic systems become more stressed in response to greater levels of climatic change.”22
In its own Net Benefits analysis, BOEM adopts a 3% discount rate. For this analysis, we present social cost estimates using both a 3% discount rate (central value) and the 95th percentile of the 3% discount rate. In 2017 US dollars, the SCC of a metric ton of CO2 rises from $42 in 2015 to $81 in 2050. For the 95th percentile, the SCC rises from $123 in 2015 to $249 in 2050 (see Figure 1b).
Greenpeace sums BOEM’s production timelines in 5-year periods, calculates net CO2 emissions for each period and applies the social cost corresponding to the first year of the period. We also apply the 2050 social cost estimates for all years beyond 2050 (when the IWG estimates stop). Because the social cost of carbon is likely to continue increasing beyond 2050, this assumption leads us to conservatively underestimate the total social costs from BOEM’s scenarios. All eco-nomic costs and benefits are reported in 2017 US$.
The Climate Change Costs of Offshore Oil Drilling 9
Re-scaled production timelines for (a) the Chukchi, Beaufort and Cook Inlet areas, and (b) the Gulf of Mexico. For illustration the assumed social costs of carbon emissions in a given year are shown on the Gulf of Mexico figure (red), for a 3% discount rate and for the 95th percentile of the 3% discount rate.
FIGURE 1: Production Timelines 2017-2022 Proposed Program
10The Climate Change Costs of Offshore Oil Drilling
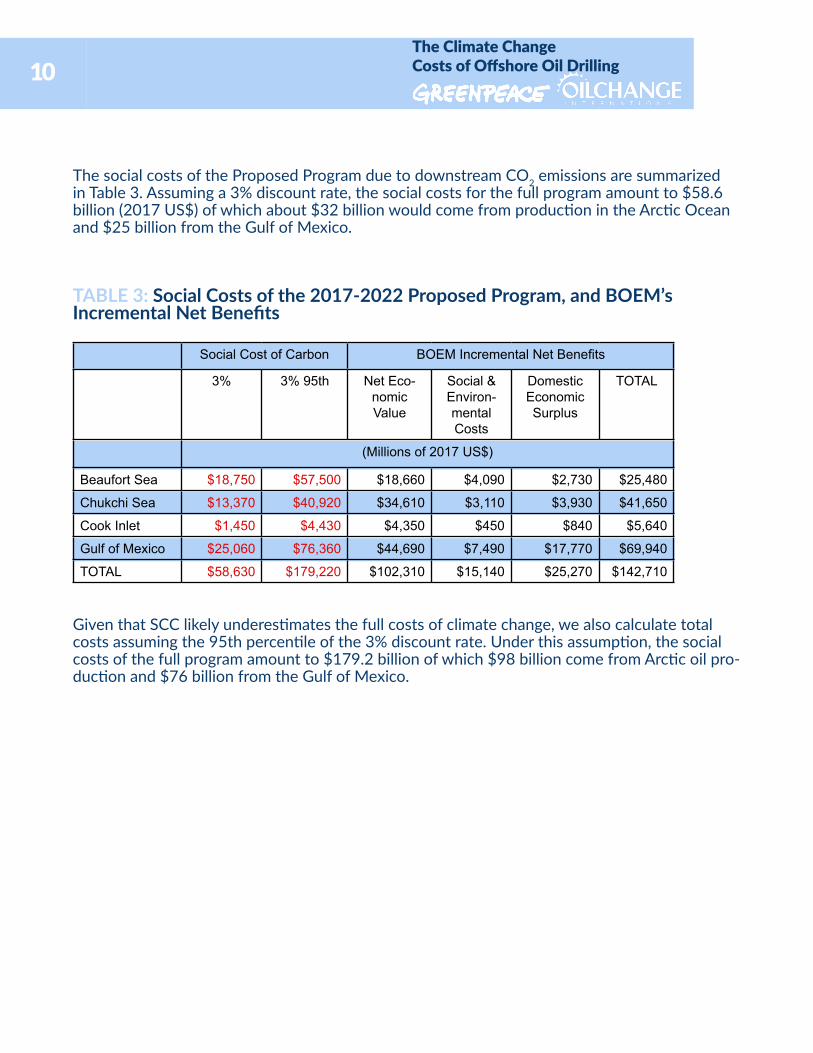
The social costs of the Proposed Program due to downstream CO2 emissions are summarized in Table 3. Assuming a 3% discount rate, the social costs for the full program amount to $58.6 billion (2017 US$) of which about $32 billion would come from production in the Arctic Ocean and $25 billion from the Gulf of Mexico.
TABLE 3: Social Costs of the 2017-2022 Proposed Program, and BOEM’s Incremental Net Benefits
Social Cost of Carbon BOEM Incremental Net Benefits
3% 3% 95th Net Eco-nomic Value
Social & Environ-mental Costs
Domestic Economic Surplus
TOTAL
(Millions of 2017 US$)
Beaufort Sea $18,750 $57,500 $18,660 $4,090 $2,730 $25,480
Chukchi Sea $13,370 $40,920 $34,610 $3,110 $3,930 $41,650
Cook Inlet $1,450 $4,430 $4,350 $450 $840 $5,640
Gulf of Mexico $25,060 $76,360 $44,690 $7,490 $17,770 $69,940
TOTAL $58,630 $179,220 $102,310 $15,140 $25,270 $142,710
Given that SCC likely underestimates the full costs of climate change, we also calculate total costs assuming the 95th percentile of the 3% discount rate. Under this assumption, the social costs of the full program amount to $179.2 billion of which $98 billion come from Arctic oil pro-duction and $76 billion from the Gulf of Mexico.
The Climate Change Costs of Offshore Oil Drilling 11
Discussion
In support of its Proposed Program of expanded offshore oil drilling in the Arctic and the Gulf of Mexico, BOEM conducts a Net Benefits Analysis, which weighs the economic gains of expanded oil and gas production against the environmental and social costs.
BOEM’s Net Benefits are comprised of three components: Net Economic Value (the profits shared by oil companies and governments from selling the produced oil and gas), Environmental & Social Costs23 (negative external costs imposed by production activity) and Domestic Eco-nomic Surplus (benefits that accrue to consumers and producers in the U.S. economy). For each component, the values are compared between the Proposed Program and the “No Sale” option to provide an Incremental Net Benefit resulting from BOEM’s action.24 For the Mid-Price sce-nario and assuming a 3% discount rate, BOEM finds positive net benefits from the Proposed Program (as compared to the “No Sale” option) for each planning region.25 Those net benefit figures are included in Table 3 for com-parison.
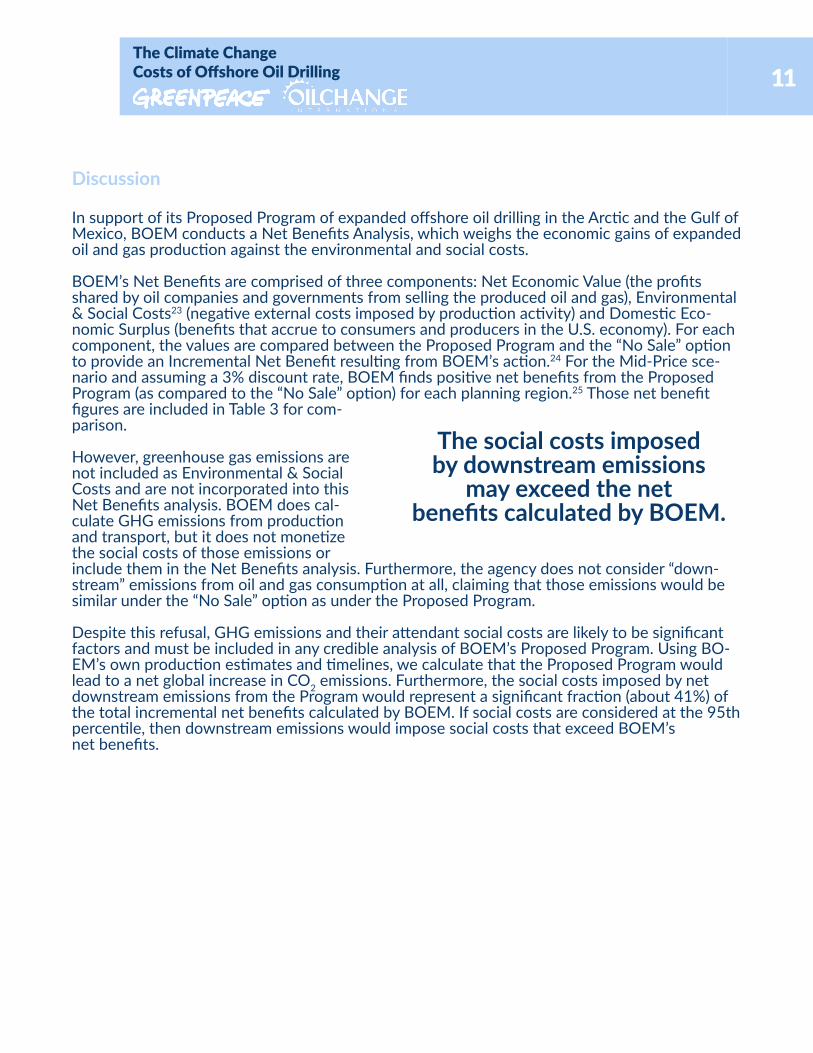
However, greenhouse gas emissions are not included as Environmental & Social Costs and are not incorporated into this Net Benefits analysis. BOEM does cal-culate GHG emissions from production and transport, but it does not monetize the social costs of those emissions or include them in the Net Benefits analysis. Furthermore, the agency does not consider “down-stream” emissions from oil and gas consumption at all, claiming that those emissions would be similar under the “No Sale” option as under the Proposed Program.
Despite this refusal, GHG emissions and their attendant social costs are likely to be significant factors and must be included in any credible analysis of BOEM’s Proposed Program. Using BO-EM’s own production estimates and timelines, we calculate that the Proposed Program would lead to a net global increase in CO2 emissions. Furthermore, the social costs imposed by net downstream emissions from the Program would represent a significant fraction (about 41%) of the total incremental net benefits calculated by BOEM. If social costs are considered at the 95th percentile, then downstream emissions would impose social costs that exceed BOEM’s net benefits.
The social costs imposed by downstream emissions
may exceed the net benefits calculated by BOEM.
12The Climate Change Costs of Offshore Oil Drilling
The case of the Beaufort Sea is instructive. The production timeline for the Beaufort peaks around 2050 -- roughly a decade later than the other planning area timelines. Because BOEM assumes the Beaufort Sea oil is produced and consumed at later dates when SCC values are higher, its downstream emissions impose a higher social cost in comparison to the economic benefits of producing the oil. Once the initial upfront investments in drilling platforms and pipe-lines are made, the cost of pumping each barrel of oil is comparatively cheap and can continue for decades.26 In this way, planning decisions made now risk “locking-in” carbon emissions far into the future when we can no longer afford to pay the price. Additionally, the steadily rising SCC values illustrate that downstream emissions will play an increasingly larger role in any fu-ture Five-Year programs.
However, it is not appropriate to simply subtract the downstream social costs from BOEM’s net benefits. BOEM’s cur-rent methodology is limited in a number of ways that make direct comparison diffi-cult.27 For example, BOEM only considers the domestic costs and benefits of oil and gas production and limits its consideration of various non-domestic costs and bene-fits. However, a significant fraction of the downstream CO2 emissions and social costs calculated in this report are non-domestic.28 Addi-tionally, the social cost estimates in this report do not address emissions from production and transport, or emissions from natural gas or natural gas substitutes.
Nonetheless, these results indicate that the omissions of downstream emissions is a significant flaw in BOEM’s analysis. Climate change is an inherently global phenomenon and oil and gas are traded on global markets, yet BOEM’s analysis narrowly assesses domestic impacts and ignores costs that could potentially swamp any net benefits. Such a myopic perspective cuts against the spirit of the National Environmental Policy Act and contradicts guidance drafted by the Council on Environmental Quality on incorporating climate change into environmental assessments.29 The U.S. public and government policy makers deserve to have this information available. Should BOEM decide to conduct a comprehensive climate analysis of its activities, it might well reach different conclusions regarding the value of offshore oil drilling.
The U.S. public and policy makers deserve to have
complete information about climate change impacts
of oil drilling.
The Climate Change Costs of Offshore Oil Drilling 13
Furthermore, BOEM’s analysis of the anticipated production and market response to the Pro-posed Program is based on “policy-neutral” energy forecasts provided by the U.S. Energy Infor-mation Administration (EIA) in their Annual Energy Outlook.30 The EIA’s Reference Case does not incorporate the climate commitments agreed to in Paris and forecasts a high-level of demand for fossil fuels in the coming decades. As a result, greenhouse gas emissions in 2050 under the Reference Case are over 400% higher than official U.S. climate goals.31 Given President Obama’s high-level commitments to fight climate change, the use of such “business as usual” assump-tions is inappropriate.
A full analysis of the costs and benefits of offshore oil and gas drilling is beyond the scope of this report, but the magnitude of the missing downstream analysis strongly indicates that BO-EM’s current modeling is inadequate. A comprehensive climate analysis would seek to assess BOEM’s policies in the context of our international climate commitments and the latest scientif-ic information, with the goal of providing the information necessary for policy makers to apply a “climate test” to energy policy decisions. Such an analysis must encompass global impacts, direct and indirect emissions, and should include a range of scenarios to capture the uncertainties in both markets and future policies. At least one such scenario must assess the program in the context of limiting global warming to 2 degrees Celsius.
Given that President Obama has committed the United States to addressing climate change at the highest level, it remains a serious dereliction of duty for BOEM to provide less-than-com-plete information to the public and policy makers.
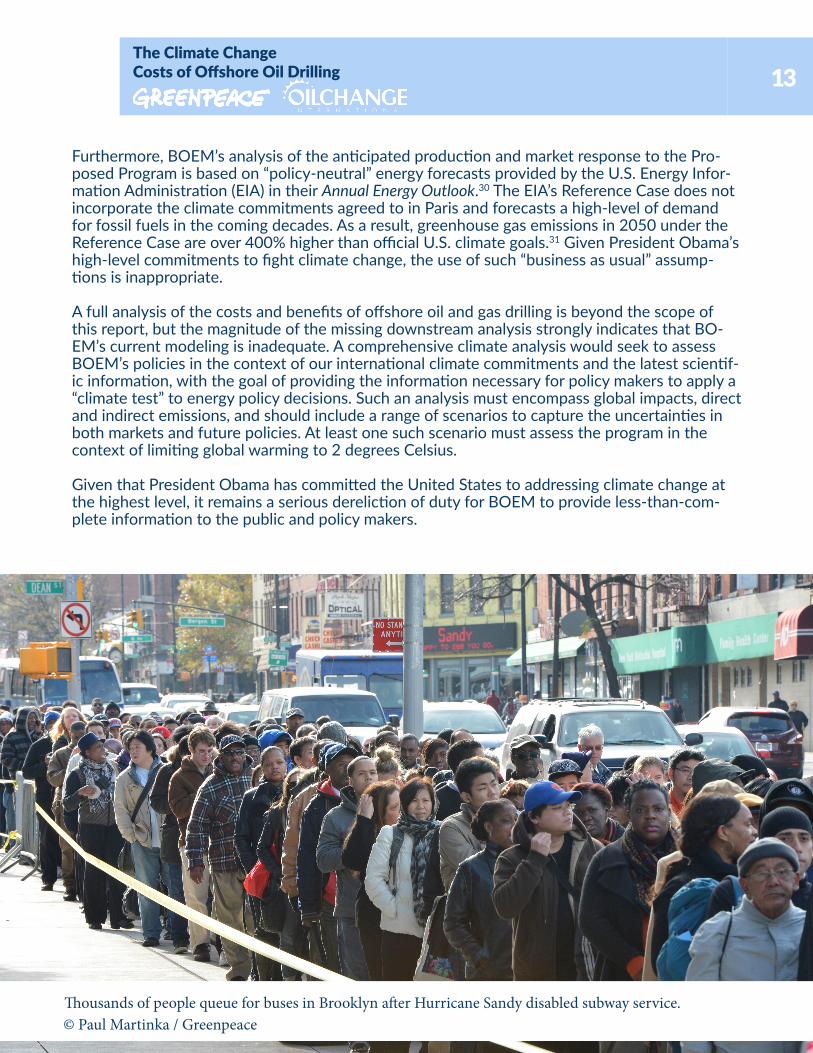
Thousands of people queue for buses in Brooklyn after Hurricane Sandy disabled subway service.© Paul Martinka / Greenpeace

14The Climate Change Costs of Offshore Oil Drilling
1.McGlade, C. & P. Ekins. 2015. The geographical distribution of fossil fuels unused when limiting global warming to 2° C. Nature, 517:187-190.
2. Obama, B. 2015. Statement by the President on the Keystone XL Pipe-line. November 6. Online at < https://www.whitehouse.gov/the-press-of-fice/2015/11/06/statement-president-keystone-xl-pipeline >
3. U.S. Bureau of Ocean Energy Management (BOEM). 2016b. 2017-2022 Outer Continental Shelf Oil and Gas Leasing Proposed Pro-gram. U.S. Departmentof the Interior. Online at < http://www.boem.gov/2017-2022-Proposed-Program-Decision/>
4. U.S. Bureau of Ocean Energy Management (BOEM). 2016c. Draft Economic Analysis Methodology for the 2017-2022 Oil and Gas Leasing Program (“Draft EAM”). U.S. Department of the Interior. Online at < http://www.boem.gov/Economic-Analysis-Methodology/>
5. BOEM 2016c. Draft EAM, p. 3-1 to 3-2. BOEM states that the “analysis does not consider the impact of the consumption of any of the fuel sourcesas they are assumed to be roughly equivalent under both the Program and No Sale Option” and further notes that “any estimates of emissions would be highly uncertain.”
6. Erickson, P. & M. Lazarus. 2016. How would phasing out U.S. feder-al leases for fossil fuel extraction affect CO2 emissions and 2°C goals? Stockholm Environment Institute, Working Paper 2016-02. Online at < https://www.sei-international.org/publications?pid=2937 >
7. Full calculations are available upon request
8. U.S Bureau of Ocean Energy Management (BOEM). 2016a. Outer Con-tinental Shelf Oil and Gas Leasing Program: 2017-2022 Draft Program-matic Environmental Impact Statement (“Draft PEIS”). U.S. Department of the Interior.Online at < http://boemoceaninfo.com/review/ >
9. Erickson & Lazarus 2016
10. Interagency Working Group on Social Cost of Carbon (IWG). 2015. Technical Support Document: Technical Update of the Social Cost of Carbon for Regulatory Impact Analysis Under Executive Order 12866. Washington, DC. Online at < https://www.whitehouse.gov/sites/default/files/omb/inforeg/scc-tsd-finaljuly-2015.pdf >
11. BOEM 2016c. Draft EAM, p. 1-10, Table 2
12. By removing the Atlantic from the Proposed Program, President Obama avoided the production of 493 million barrels of oil and reduced future global emissions by 54 Mt CO2, according to the methodology used in this report.
13. BOEM 2016c. Draft EAM, p. 1-9, Table 1
14. Erickson & Lazarus 2016, p. 23-26
END
NO
TES
© D
anie
l Bel
trá
/ Gre
enpe
ace
The Climate Change Costs of Offshore Oil Drilling 1515. U.S. Environmental Protection Agency (EPA). Greenhouse Gas Equiv-
alencies Calculator. Online at < https://www.epa.gov/energy/green-house-gas-equivalencies-calculator >
16.Erickson & Lazarus 2016, p. 36-39, Appendix B
17. BOEM 2016c. Draft EAM, p. 3-1, Table 16
18. BOEM 2016a. Draft PEIS, p. 3-6 to 3-25, Figures 3.1-5, 3.1-7, 3.1-8, 3.1-9,3.1-1519.
19. This assumption may overstate the social costs from oil consump-tion. BOEM indicates that oil will be produced earlier in the production scenario than gas, however BOEM does not provide separate production timelines for oil and gas in each region.
20.IWG 201520.
21.Howard, P. 2014. Omitted Damages: What’s Missing From the Social Cost of Carbon. Environmental Defense Fund, Institute for Policy Integri-ty & Natural Resources Defense Council. Online at < http://costofcarbon.org/files/Omitted_Damages_Whats_Missing_From_the_Social_Cost_of_Carbon.pdf >
22. U.S. Environmental Protection Agency (EPA). 2015. EPA Fact Sheet: Social Cost of Carbon. Online at < https://www3.epa.gov/climatechange/Downloads/EPAactivities/social-cost-carbon.pdf >
23. Environmental & Social Costs are subtracted from the other two com-ponents to calculate Net Benefits. However, because BOEM finds higher Environmental & Social Costs under the “No Sale” option than the Pro-posed Program,the values are presented as positive in Table 3.
24. BOEM 2016c. Draft EAM p. 1-3 to 1-4
25. BOEM 2016c. Draft EAM p. 1-27, Table 8
26. Erickson, P., M. Lazarus & K. Tempest. 2015. Discussion Brief: Car-bon lockin from fossil fuel supply infrastructure. Stockholm Environ-ment Institute. Online at < https://www.sei-international.org/publica-tions?pid=2805 >
27. BOEM 2016c. Draft EAM p. 1-23 to 1-24
28. Erickson, P. 2016. “U.S. again overlooks top CO2 impact of expand-ing oil supply… but that might change.” Stockholm Environment Institute. Online at < https://www.sei-international.org/blog-articles/3388 >
29. Council on Environmental Quality. 2014. Revised Draft Guidance forGreenhouse Gas Emissions and Climate Change Impacts. Washington, DC.Online at < https://www.whitehouse.gov/administration/eop/ceq/ini-tiatives/nepa/ghg-guidance >
30. U.S. Energy Information Administration. 2015. Annual Energy Out-look.Online at < http://www.eia.gov/forecasts/aeo/ >
31. Stockman, L. 2016. Government Assumes U.S. Will Fail Climate Goals In ItsFive-Year Offshore Drilling Proposal. Oil Change International and Greenpeace.Online at < http://priceofoil.org/content/uploads/2016/04/5YearPlan-ClimateTest.pdf >
END
NO
TES
© D
anie
l Bel
trá
/ Gre
enpe
ace
16The Climate Change Costs of Offshore Oil Drilling