Embed Size (px)
Citation preview
Costs and Benefits of Plant Responses to Disease: Resistance and ToleranceAuthor(s): Ellen L. Simms and Jim TriplettSource: Evolution, Vol. 48, No. 6 (Dec., 1994), pp. 1973-1985Published by: Society for the Study of EvolutionStable URL: http://www.jstor.org/stable/2410521 .
Accessed: 13/11/2013 16:05
Your use of the JSTOR archive indicates your acceptance of the Terms & Conditions of Use, available at .http://www.jstor.org/page/info/about/policies/terms.jsp
.JSTOR is a not-for-profit service that helps scholars, researchers, and students discover, use, and build upon a wide range ofcontent in a trusted digital archive. We use information technology and tools to increase productivity and facilitate new formsof scholarship. For more information about JSTOR, please contact [email protected].
.
Society for the Study of Evolution is collaborating with JSTOR to digitize, preserve and extend access toEvolution.
http://www.jstor.org
This content downloaded from 148.61.13.133 on Wed, 13 Nov 2013 16:05:54 PMAll use subject to JSTOR Terms and Conditions
Evolution, 48(6), 1994, pp. 1973-1985
COSTS AND BENEFITS OF PLANT RESPONSES TO DISEASE: RESISTANCE AND TOLERANCE
ELLEN L. SIMMS1 AND JIM TRIPLETT2 3
'Department of Ecology and Evolution, University of Chicago, 1101. East 57th Street, Chicago, Illinois 60637 E-mail: [email protected]
2Department of Biology, Box 7325 Reynolda Station, Wake Forest University, Winston-Salem, North Carolina 27109
Abstract.-A major assumption of models of the evolution of plant resistance to disease is that plant resistance involves fitness costs. To test this assumption, a field experiment was performed so that a quantitative-genetic analysis could be used to detect fitness costs to Ipomoea purpurea of resistance to different fungal isolates of Colletotrichum dematium, a pathogenic fungus causing the disease anthracnose. This experiment yielded no evidence that resistance to anthracnose in- volves direct fitness costs. Nevertheless, trade-offs in plant fitness that were unrelated to resistance were detected between different disease environments. Tolerance, defined as the ability to com- pensate in part for fitness decrements caused by disease, was found to involve fitness costs. Half- sib families that were more tolerant of disease had lower fitness in the absence of disease. The possibility that the cost of tolerance could obscure fitness costs of resistance is explored.
Key words. - Coevolution, Colletotrichum dematium, compensatory growth, herbivory, Ipomoea purpurea, pathogen.
Received October 4, 1993. Accepted April 11, 1994.
One of the main objectives of evolutionary biology is understanding the mechanisms main- taining genetic diversity in natural populations. Host and pathogen populations commonly pos- sess strikingly high levels of genetic variation for resistance and virulence (Burdon and Muller 1987). Haldane (1949) was the first to suggesi that negative frequency-dependent selection be- tween hosts and pathogens may be largely re- sponsible for this variation. It subsequently has been postulated that such selection also is im- portant in the establishment and maintenance of sexual reproduction in hosts (Jaenike 1978: Hamilton 1980; Hamilton et al. 1990).
Coevolutionary models suggest that fitness costs associated with resistance determine the allele frequency of virulence in the pathogen. whereas fitness costs associated with virulence determine the allele frequency of resistance in the host, and that such costs are in part respon- sible for the maintenance of genetic variation in both traits (Mode 1958; Leonard 1977; Leonard and Czocher 1980). Thus, an important goal foi further understanding both host-pathogen co- evolution and the maintenance of genetic vari- ation in natural populations is determining how
3Present address: J.T., Section of Ecology and Sys- tematics, Cornell University, 4124 Comstock Hall, Ith- aca, New York 14850.
commonly costs are associated with resistance and virulence.
It is not clear whether such costs are common features of either agricultural or natural plant- pathogen systems. Suggestive evidence for costs of virulence or resistance may be obtained by observing biogeographical patterns of alleles at loci controlling these traits (Endler 1986). For example, if resistance involves a fitness cost, then alleles coding for resistance should be rare or nonexistent in environments that do not favor disease epidemics (Burdon 1987). Furthermore, Vanderplank (1984) predicted that a cost of vir- ulence would lead to a positive association, across time and space, between the frequency of resis- tance and virulence alleles at complementary loci. However, the validity of this method of detecting costs has been much debated (Nelson 1973; Crill 1977; Parlevliet 1981), and subsequent analysis suggests that costs of resistance and virulence in natural populations cannot be determined by spatial analysis of matching gene frequencies (Frank 1993). In any case, observation of such patterns still would not provide conclusive evi- dence that costs of resistance had caused them (Endler 1986; Simms 1993).
Alternatively, manipulative experiments can detect costs of resistance or virulence (Burdon 1987; Berenbaum et al. 1 986; Simms and Raush- er 1987). Fitness trade-offs associated with re- sistance can occur via several mechanisms that
1973
? 1994 The Society for the Study of Evolution. All rights reserved.
This content downloaded from 148.61.13.133 on Wed, 13 Nov 2013 16:05:54 PMAll use subject to JSTOR Terms and Conditions
1974 E. L. SIMMS AND J. TRIPLETT
A
CD
0 CZ
a) O-5
B
a)
0 C
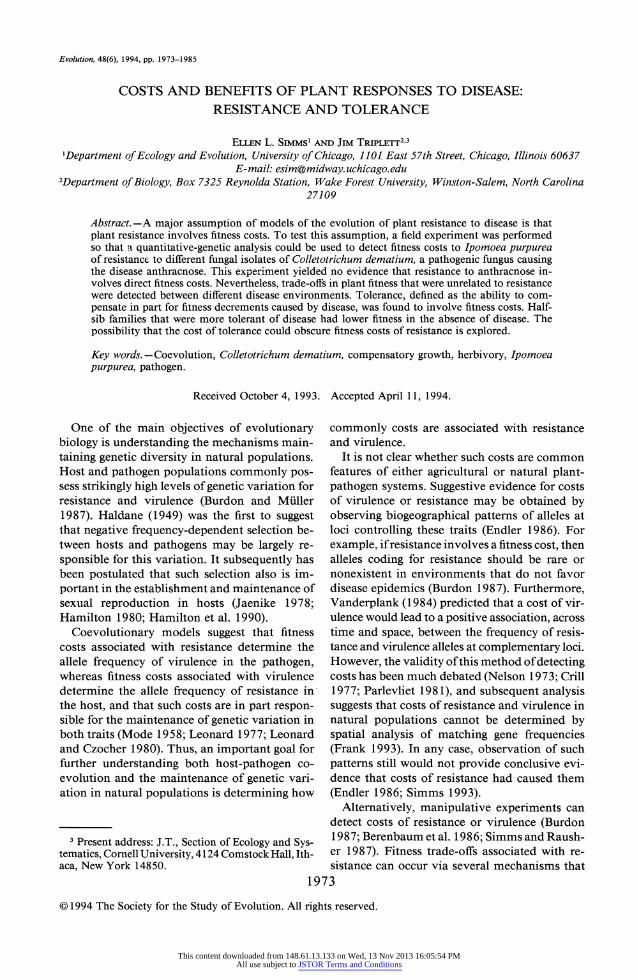
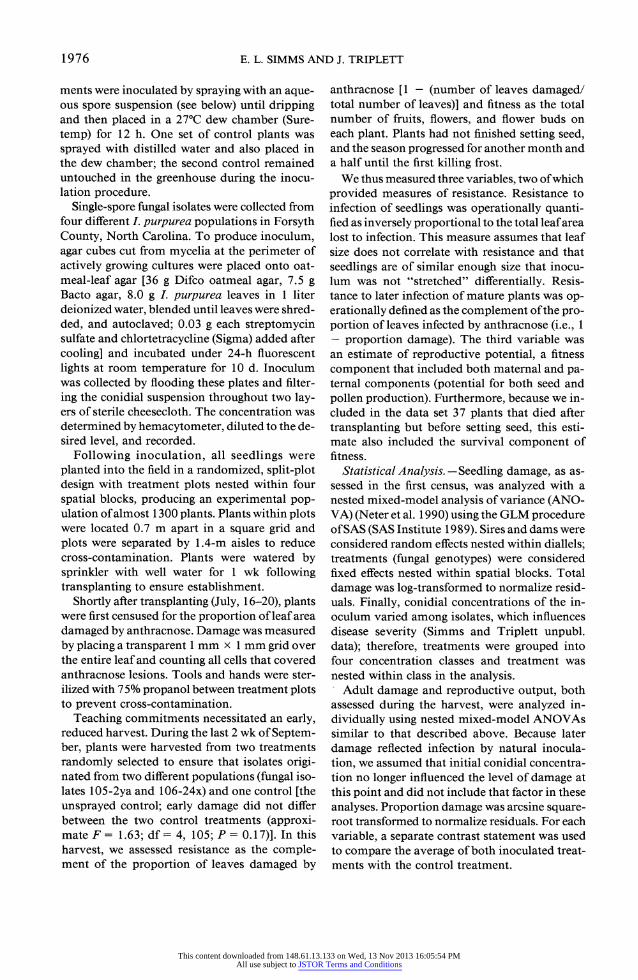
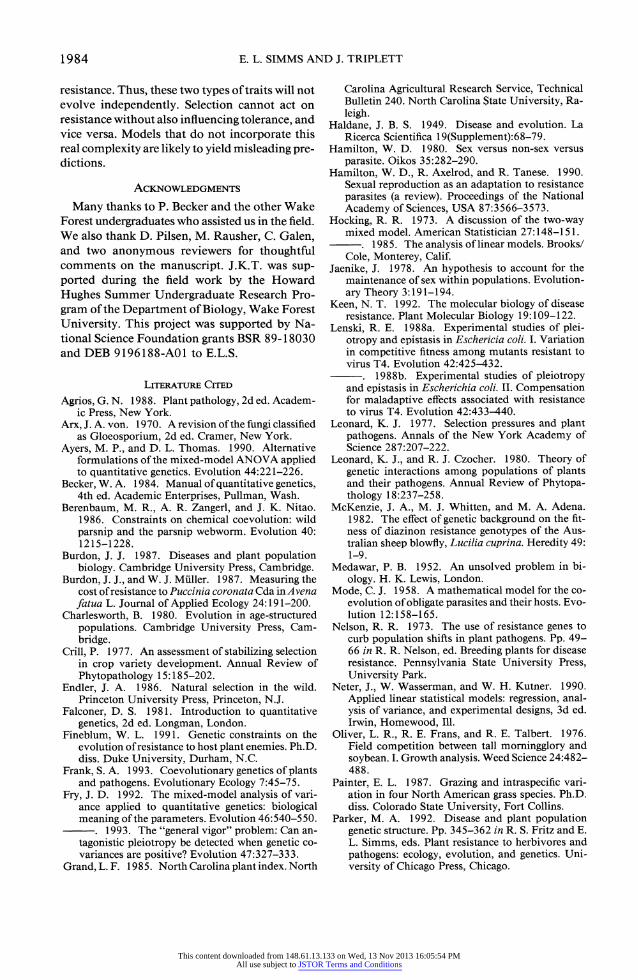
Resistance FIG. 1. Postulated genetic correlation between disease resistance and tolerance in the presence of disease (A) in the absence of fitness costs and (B) if both resistance and tolerance are costly (redrawn from Fineblum 199 1).
are not mutually exclusive, and detecting costs incurred by different mechanisms requires dif- ferent manipulations (Simms 1992). For sim- plicity, costs can be divided into three opera- tional categories. First, plants that are resistant to one pathogen taxon are less likely to be resis- tant to another. Resistance to pathogen strains is frequently highly specific (Burdon 1987), and models commonly assume the existence of trade- offs between resistances to different virulence ge- notypes (Parker 1992). Such trade-offs can be detected as negative pairwise additive genetic correlations between resistances to different pathogen genotypes (Simms and Rausher 1987).
The second category of costs involves trade- offs between resistance expressed early in life and that expressed late in life. Such costs represent a special case of the prediction by the antagonistic pleiotropy theory of the evolution of senescence that genes enhancing early fitness components may be favored by selection even if they reduce
the survival and/or reproductive success of old individuals (Medawar 1952; Williams 1957; Charlesworth 1980).
Finally, a third category of costs occurs when plants that possess resistance may incur fitness decrements that are absent in susceptible plants. Although such costs may be generated by (1) self- inflicted toxicity; (2) disruption of previous func- tions of biochemical pathways that become in- volved in resistance; (3) devotion of resources to resistance and away from other fitness-enhancing functions (allocation costs, sensu Simms 1992); or (4) other unknown pleiotropic effects of genes involved in resistance (we shall lump these all under the term "allocation costs"; sensu Simms and Rausher 1987). These types of costs produce a trade-off in fitness between a disease-free en- vironment and that in which disease is present. When the trade-off is directly caused by resis- tance, it also may be detected as a negative ad- ditive genetic correlation between the fitness of plants grown in the absence of the relevant pathogen and resistance to that pathogen (Bur- don and Muller 1987; Simms and Rausher 1987). However, costs directly caused by resistance may be obscured by trade-offs associated with other traits that are correlated with resistance (Fry 1993). In particular, under certain circumstanc- es, costs of tolerance could obscure costs of re- sistance.
We define tolerance here as the ability of a plant genotype to sustain a particular level of tissue damage with relatively less fitness decre- ment than other genotypes experiencing the same level of damage (Burdon 1987, p. 18 1; Fineblum 1991). Tolerance is therefore an alternative to resistance as an evolutionary response to selec- tion imposed by pathogens. In the presence of disease, these two traits are expressed epistatical- ly. Tolerance can be expressed only if a plant experiences damage, that is, in genotypes with low levels of resistance. Conversely, genotypes with high tolerance will experience little selection for resistance because damage produces little or no fitness decrement. Because of this epistatic relationship, simultaneous selection by patho- gens for increased resistance and tolerance can create a weak negative genetic correlation be- tween these traits (fig. lA) (Fineblum 1991). Fur- thermore, if tolerance and resistance each in- volve fitness costs, this negative genetic corre- lation will be strengthened (Fineblum 1991). Highly resistant genotypes will benefit little from tolerance because they so rarely experience dam-
This content downloaded from 148.61.13.133 on Wed, 13 Nov 2013 16:05:54 PMAll use subject to JSTOR Terms and Conditions
DISEASE RESISTANCE AND TOLERANCE 1975
age, and because tolerance is costly, selection by pathogens will be mainly directional against tol- erance. Conversely, in the presence of pathogens, highly tolerant genotypes will benefit little from resistance because damage has little effect on fit- ness. Thus, if resistance is costly, selection will favor tolerant genotypes with low resistance. If resistance and tolerance are both costly, their epistatic expression will produce a selection re- gime that favors plants with either tolerance or resistance but not high levels of both (fig. 1 B). Fineblum (1991) found such a trade-off when investigating resistance to and tolerance of dam- age to the apical meristem by insect herbivores on Ipomoea purpurea.
A negative genetic correlation between resis- tance and tolerance could prevent detection of resistance costs if the costs of tolerance were equal to or greater than the costs of resistance (Fine- blum 1991). Because all genotypes will be either resistant or tolerant, all genotypes will incur a cost of either resistance or tolerance. If both costs were equal, each would obscure the other: fitness in the absence of disease would be correlated with neither resistance nor with tolerance. If the cost of tolerance was greater than the cost of resistance, there could be a positive genetic cor- relation between resistance and fitness in the ab- sence of disease but a negative genetic correlation between fitness in the presence of disease and fitness in the disease-free environment. Fine- blum (1991) invoked this argument to explain the apparent absence of cost of resistance to api- cal damage by insect herbivores in I. purpurea.
Here, we present the results of a manipulative experiment designed to examine whether tall morning glory, L purpurea, experiences any fit- ness trade-offs associated with resistance to and tolerance of anthracnose, a disease caused by the fungal pathogen Colletotrichum dematium.
MATERLALS AND METHODS
Experimental Organisms and Study Site Ipomoea purpurea Roth (Convolvulaceae) is a
self-compatible annual vine commonly found as an agricultural weed throughout the southern United States (Oliver et al. 1976). One of the major pathogens of L purpurea is Colletotrichum dematium Pers. ex Fr. f. ipomoea v. Arx (Deu- teromycotina), which causes anthracnose (Simms 1993). Although C. dematium has been reported on several genera of plants (Grand 1985; Arx 1970), this form is confined to L purpurea and
has been considered as a potential biocontrol agent for this important weed (G. Van Dyke pers. comm. 1989). The fungus overwinters on dried infected leaves in the soil (Agrios 1988, pp. 385- 389) and infects I. purpurea via asexual spores (conidia) after warm summer rains, causing char- acteristic regular lesions on the leaves (Simms 1993). Anthracnose is a localized disease that can spread to new plant parts only by reinfection. Young leaves are more vulnerable to infection (Simms and Vision 1995), but because plants grow indeterminately, infection can occur throughout the season.
The study site was a newly plowed field on the Wake Forest University Campus in Forsyth County, North Carolina. Prior to plowing, the field had been a mown lawn for at least 30 yr. No L purpurea seedlings emerged after plowing, indicating that any seed bank that might have existed from previous cultivation was no longer viable. The field was surrounded on three sides by secondary-growth pine forest and on the fourth side by extensive lawns and housing with no gar- dens. The nearest I. purpurea population was approximately 1-km away through pine forest. Because none of the reported hosts of C. de- matium (Grand 1985) were present in the lawn or adjacent habitat, and because the form of C. dematium found on I. purpurea is apparently confined to this host (G. Van Dyke pers. comm. 1989), we assumed that the soil harbored no C. dematium, ensuring that control plants would remain healthy and that disease observed on in- oculated plants was caused by our treatments and not indigenous fungus.
Experimental Design and Protocol
In summer 1988, 12 seeds were collected from different individuals in an L purpurea population occupying a large truck garden near Pfafftown in Forsyth County, North Carolina. Seedlings were raised in the greenhouse at Wake Forest Uni- versity during winter 1988-1989 and used as parents in three complete four-by-four diallel crosses (Falconer 1981; Becker 1984) to produce 36 full-sib families within 12 paternal and 12 maternal half-sib families.
In early July, 1990, offspring from these dial- lels were germinated in the greenhouse. After 2 wk, four seedlings from each full-sib family were assigned to each of nine treatments. Treatments consisted either of inoculation by one of seven different fungal genotypes or one of two different uninoculated controls. Plants in fungal treat-
This content downloaded from 148.61.13.133 on Wed, 13 Nov 2013 16:05:54 PMAll use subject to JSTOR Terms and Conditions
1976 E. L. SIMMS AND J. TRIPLETT
ments were inoculated by spraying with an aque- ous spore suspension (see below) until dripping and then placed in a 27?C dew chamber (Sure- temp) for 12 h. One set of control plants was sprayed with distilled water and also placed in the dew chamber; the second control remained untouched in the greenhouse during the inocu- lation procedure.
Single-spore fungal isolates were collected from four different I. purpurea populations in Forsyth County, North Carolina. To produce inoculum, agar cubes cut from mycelia at the perimeter of actively growing cultures were placed onto oat- meal-leaf agar [36 g Difco oatmeal agar, 7.5 g Bacto agar, 8.0 g L purpurea leaves in 1 liter deionized water, blended until leaves were shred- ded, and autoclaved; 0.03 g each streptomycin sulfate and chlortetracycline (Sigma) added after cooling] and incubated under 24-h fluorescent lights at room temperature for 10 d. Inoculum was collected by flooding these plates and filter- ing the conidial suspension throughout two lay- ers of sterile cheesecloth. The concentration was determined by hemacytometer, diluted to the de- sired level, and recorded.
Following inoculation, all seedlings were planted into the field in a randomized, split-plot design with treatment plots nested within four spatial blocks, producing an experimental pop- ulation of almost 1300 plants. Plants within plots were located 0.7 m apart in a square grid and plots were separated by 1.4-m aisles to reduce cross-contamination. Plants were watered by sprinkler with well water for 1 wk following transplanting to ensure establishment.
Shortly after transplanting (July, 16-20), plants were first censused for the proportion of leaf area damaged by anthracnose. Damage was measured by placing a transparent 1 mm x 1 mm grid over the entire leaf and counting all cells that covered anthracnose lesions. Tools and hands were ster- ilized with 75% propanol between treatment plots to prevent cross-contamination.
Teaching commitments necessitated an early, reduced harvest. During the last 2 wk of Septem- ber, plants were harvested from two treatments randomly selected to ensure that isolates origi- nated from two different populations (fungal iso- lates 105-2ya and 106-24x) and one control [the unsprayed control; early damage did not differ between the two control treatments (approxi- mate F= 1.63; df=4, 105; P = 0.17)]. In this harvest, we assessed resistance as the comple- ment of the proportion of leaves damaged by
anthracnose [1 - (number of leaves damaged/ total number of leaves)] and fitness as the total number of fruits, flowers, and flower buds on each plant. Plants had not finished setting seed, and the season progressed for another month and a half until the first killing frost.
We thus measured three variables, two of which provided measures of resistance. Resistance to infection of seedlings was operationally quanti- fied as inversely proportional to the total leaf area lost to infection. This measure assumes that leaf size does not correlate with resistance and that seedlings are of similar enough size that inocu- lum was not "stretched" differentially. Resis- tance to later infection of mature plants was op- erationally defined as the complement of the pro- portion of leaves infected by anthracnose (i.e., 1 - proportion damage). The third variable was an estimate of reproductive potential, a fitness component that included both maternal and pa- ternal components (potential for both seed and pollen production). Furthermore, because we in- cluded in the data set 37 plants that died after transplanting but before setting seed, this esti- mate also included the survival component of fitness.
Statistical Analysis. -Seedling damage, as as- sessed in the first census, was analyzed with a nested mixed-model analysis of variance (ANO- VA) (Neter et al. 1990) using the GLM procedure of SAS (SAS Institute 1989). Sires and dams were considered random effects nested within diallels; treatments (fungal genotypes) were considered fixed effects nested within spatial blocks. Total damage was log-transformed to normalize resid- uals. Finally, conidial concentrations of the in- oculum varied among isolates, which influences disease severity (Simms and Triplett unpubl. data); therefore, treatments were grouped into four concentration classes and treatment was nested within class in the analysis. - Adult damage and reproductive output, both assessed during the harvest, were analyzed in- dividually using nested mixed-model ANOVAs similar to that described above. Because later damage reflected infection by natural inocula- tion, we assumed that initial conidial concentra- tion no longer influenced the level of damage at this point and did not include that factor in these analyses. Proportion damage was arcsine square- root transformed to normalize residuals. For each variable, a separate contrast statement was used to compare the average of both inoculated treat- ments with the control treatment.
This content downloaded from 148.61.13.133 on Wed, 13 Nov 2013 16:05:54 PMAll use subject to JSTOR Terms and Conditions
DISEASE RESISTANCE AND TOLERANCE 1977
There are two competing formulations of the mixed-model ANOVA that differ in how the variance component caused by the random effect is defined (Hocking 1985). In Model II (Hocking 1973), which we shall call the Hocking model (called the "SAS" model in Ayers and Thomas [1990] and Fry [1992]), the expected mean square caused by the random effect includes the inter- action term (Hocking 1985, p. 323), whereas in Model I, also called the Scheffe model (Scheffe 1959), it does not (Hocking 1985, p. 331). The F-value calculated to test for a random effect, as well as the biological interpretation of the effect differ between the models (Hocking 1985, pp. 330-334; Fry 1992). In particular, consider a simple experiment in which the damage incurred by different offspring of a random sample of pa- ternal half-sib families is evaluated in the pres- ence of two pathogen isolates. In this case, sire is a random effect, whereas disease environment may be considered a fixed effect. Testing for the sire main effect over the error mean square (Scheffe model) then indicates whether there is variation in damage among families, averaged over the two disease environments. In contrast, testing for the sire main effect over the interac- tion mean square (Hocking model) indicates whether the damage each family incurs in the presence of one isolate is correlated with that experienced with the other isolate (Fry 1992). Thus, the latter F-test provides a method of es- timating the significance of the additive genetic covariance for damage between the two envi- ronments and its associated variance component is an estimate of that covariance. In both models, the fixed effect (disease environment) is tested over the interaction mean square (Hocking 1985, pp. 323, 331). Because of our interest in detecting fitness trade-offs associated with disease resis- tance, we report here the results of ANOVAs using the Hocking model. Results of analyses using the Scheffe model will be reported in a forthcoming manuscript.
The complexity of our experimental design precluded simply using the interaction mean square to test for additive genetic covariances of resistance and fitness across disease environ- ments. However, the RANDOM option in the GLM procedure of SAS provides the necessary expected mean squares for estimating the vari- ance components according to the Hocking mod- el (SAS Institute 1989). We used these expected mean squares to estimate additive genetic co- variances and Satterthwaite approximate F-tests
were used to test their significance (Neter et al. 1 990).
Two operational definitions of tolerance were available with our data. First, we defined toler- ance for each half-sib family as the slope of a regression of fitness on the level of damage sus- tained by each sibling. Because of the significant block effects observed in this experiment, we es- timated these slopes after factoring out the block effect on reproductive potential. This definition was first proposed by Pilson (pers. comm. 1993) and has the advantage that it provides a method for estimating the fitness cost of tolerance. This cost may be estimated as the half-sib family mean correlation between fitness in the absence of dis- ease and tolerance (Pilson pers. comm. 1993). Our second definition of tolerance is simply the difference in reproductive performance between the diseased and disease-free environments. With this definition, we used the family-by-treatment interaction in the ANOVA of reproductive po- tential to estimate the additive genetic compo- nent of tolerance to disease. The advantage of this definition is that it reflects the differences in fitness between two experimentally manipulated levels of damage.
Pairwise paternal and maternal half-sib family mean correlations were calculated using the Spearman rank method to estimate genetic cor- relations between harvest variables in the dis- eased and disease-free environments and be- tween seedling and adult resistance measures (Simms and Rausher 1992; Via 1984). In addi- tion, the Hocking (1985) ANOVA model and Satterthwaite approximate F-tests were used as described above to test for a significant genetic covariance between reproductive potentials in the two environments.
RESULTS
Seedling Damage Because early damage did not differ between
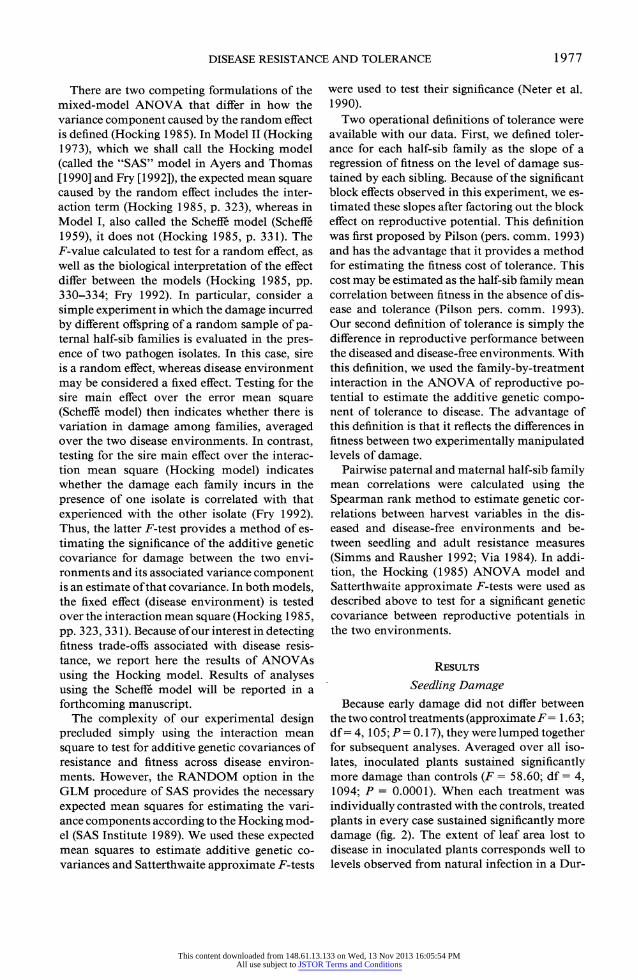
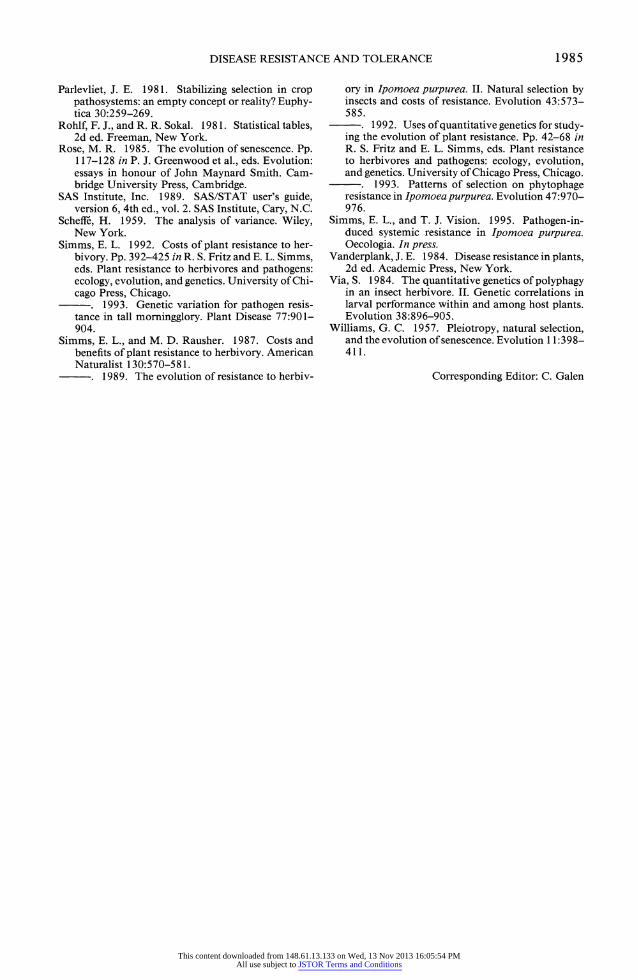
the two control treatments (approximate F= 1.63; df= 4, 105; P = 0.17), they were lumped together for subsequent analyses. Averaged over all iso- lates, inoculated plants sustained significantly more damage than controls (F = 58.60; df = 4, 1094; P = 0.0001). When each treatment was individually contrasted with the controls, treated plants in every case sustained significantly more damage (fig. 2). The extent of leaf area lost to disease in inoculated plants corresponds well to levels observed from natural infection in a Dur-
This content downloaded from 148.61.13.133 on Wed, 13 Nov 2013 16:05:54 PMAll use subject to JSTOR Terms and Conditions
1978 E. L. SIMMS AND J. TRIPLETT
3.5-
3-
E 2.5
C) ,,, 2 2
CZ 1.5
CZ 1 CD
o.5
0 con 5-2ya 5-14xa 6-12y 6-24x 7-25 7-31 8-4x
Treatment
FIG. 2. Average total damage to seedlings observed in each treatment during the early census. Each indi- vidual contrast of treatment with control ("con") was significant [P = 0.0007 for each contrast, after Bon- ferroni adjustment for multiple comparisons (Neter et al. 1990)].
ham County, North Carolina, Ipomoea purpurea population (range: 0-3.6 cm2; Simms and Rausher 1993).
Among inoculated plants (excluding controls), the covariance components associated with the maternal and paternal effects on early damage did not differ significantly from zero (table 1), but the nearly significant maternal half-sib fam- ily within-diallel effect suggests the possibility of a positive maternal covariance between damage levels caused by different fungal isolates. Inoc- ulum concentration significantly influenced damage, but even after differences in inoculum concentration were taken into account, damage varied significantly among treatments (fig. 2), in- dicating that fungal isolates differ in virulence. Significant block effects indicate the presence of spatial variation in environmental factors that
TABLE 2. Mean (and 1 standard error) for harvest variables by treatment. F-tests are for specific contrasts between control and inoculated treatments.
Treatment
Variable Control Inoculated
Percent of leaves damaged by anthracnose 1.6 (0.4) 8.2 (0.7)*
Reproductive potential (number of pods, flow- ers, and buds at har- vest) 88.3 (9.2) 62.1 (4.9)t * F = 53.94; df = 1, 151; P = 0.0001. tF = 14.30; df = 1, 152; P = 0.0002.
also influenced damage severity. Finally, there were no significant interactions of treatment with sire or dam or between sire and dam.
Adult Damage Late in the season, inoculated plants still sus-
tained significantly more damage than did con- trols (approximate F = 5 3.94; df = 1, 15 1; P = 0.0001, table 2). Damage to inoculated plants was within the range (00/o-25%) observed for nat- urally infected plants in a Durham County, North Carolina, I. purpurea population but above the mean level of damage for that population (0.2%; Simms and Rausher 1993). A minor amount of disease among control plants suggests that some contamination occurred between plots. Contam- ination may have occurred through soil sticking to our shoes or by sheet flow of rain water during storms. In any case, the level of disease in the control plots suggests that such contamination represented less than 20% of diseased leaves on inoculated plants.
Among inoculated plants (excluding controls),
TABLE 1. Analysis of variance table for early damage on all inoculated plants (excluding controls).
Source df Type III SS F P
Block 3 15.6534 15.73 0.0001 Conc(Blk) 12 91.6667 23.03 0.0001 Conc-Trt(Blk) 12 45.7927 9.28* 0.0001 Diallel 2 1.8043 2.72 0.07 Sire(Dial) 9 2.1065 lO5t 0.4 Dam(Dial) 9 4.0784 1.80t 0.07 Sire-Dam(Dial) 15 2.9759 0.60 0.9 TrtPSire-Dial(Blk) 243 86.6930 1.08 0.3 TrtPDam-Dial(Blk) 243 93.8359 1.16 0.1 Error 386 0.3317
* Satterthwaite approximate F, df = 12, 388.0. t Satterthwaite approximate F, df = 9, 229.8. t Satterthwaite approximate F, df = 9, 239.0.
This content downloaded from 148.61.13.133 on Wed, 13 Nov 2013 16:05:54 PMAll use subject to JSTOR Terms and Conditions
DISEASE RESISTANCE AND TOLERANCE 1979
TABLE 3. Analysis of variance table for late damage on plants inoculated by either isolates 105-2ya or 106- 24x.
Source df Type III SS F P
Block 3 0.8336 5.93 0.001 Trt(Blk) 4 0.5651 3.33* 0.01 Diallel 2 0.1270 1.35 0.3 Sire(Dial) 9 0.9439 5.04t 0.0001 Dam(Dial) 9 0.1257 0.52t 0.9 Sire-Dam(Dial) 15 0.3910 0.56 0.9 TrtPSire-Dial(Blk) 63 2.6206 0.89 0.7 TrtPDam-Dial(Blk) 63 3.0110 1.02 0.5 Error 91 4.2651 Dam(Dial) 137.9 1.93? 0.411
* Satterthwaite approximate F, df = 4, 211.3. t Satterthwaite approximate F, df = 9, 135.4. t Satterthwaite approximate F, df = 9, 137.9. ? Satterthwaite approximate F, df = 137.9, 9. 11 F-test with composite mean square as numerator and Dam(Dial) as denominator to determine whether the covariance
component caused by Dam(Dial) is significantly different from zero (Rohlf and Sokal 1981, p. 108).
a significant paternal half-sib family component of variance in resistance, defined as the comple- ment of proportion damage, indicated a signifi- cant genetic covariance between resistances to the two fungal isolates (table 3). Because of a negative estimate for the interaction variance [Var(Trt x Dial x Sire[Blk]) = -0.0022], the correlation was positive (rg > 1.0, table 3). This outcome persisted even if the sire component of variance was estimated separately for each en- vironment, as suggested by Fry (1992). Thus, genotypes heavily damaged by isolate 106-24x also sustained much damage from isolate 105- 2ya. In contrast, the dam effect was not signifi- cant. A significant treatment effect indicates that isolates 105-2ya and 106-24x produce differing levels of damage.
Contrary to the prediction of the antagonistic- pleiotropy model of the evolution of senescence, we found no evidence that families with high seedling resistance were more likely to be sus- ceptible later. Half-sib family mean correlations between seedling and adult resistance were not significant (rpatemnai = 0. 23, P = 0.5; rmatemaj = 0.27, P = 0.4), and if anything, suggested that families with high seedling resistance also were more like- ly to be resistant as adults.
Reproduction At harvest, plants in the control treatment had
produced 42% more capsules, flowers, and buds than had those inoculated by isolates 105-2ya and 106-24x (approximate F = 6.21; df = 1, 296.76; P = 0.01; table 2), indicating a significant
fitness cost to I. purpurea of anthracnose infec- tion.
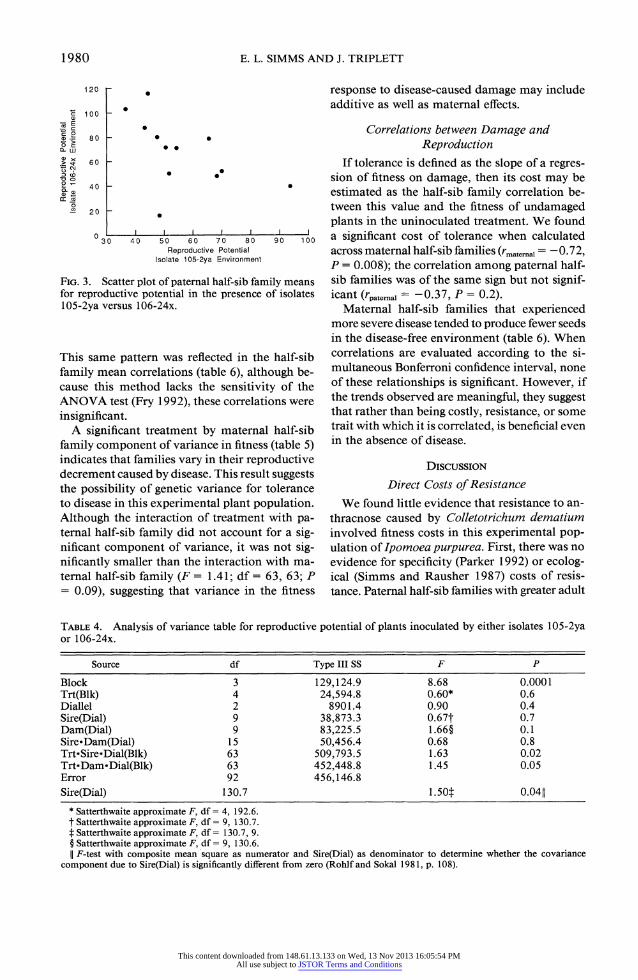
Among inoculated plants (excluding controls), the sire main effect yielded a weak but significant negative genetic correlation between fitnesses in the two diseased environments (rg = -0.12, fig. 3). This result suggests the possibility of a fitness trade-off between the two environments. Fungal isolate did not explain a significant component of variance in reproductive potential (approxi- mate F = 0.6; df = 4, 192.6; P = 0.6), but a significant interaction of sire with fungal isolate indicates that anthracnose infection by the two isolates differentially affected fitness in families (table 4).
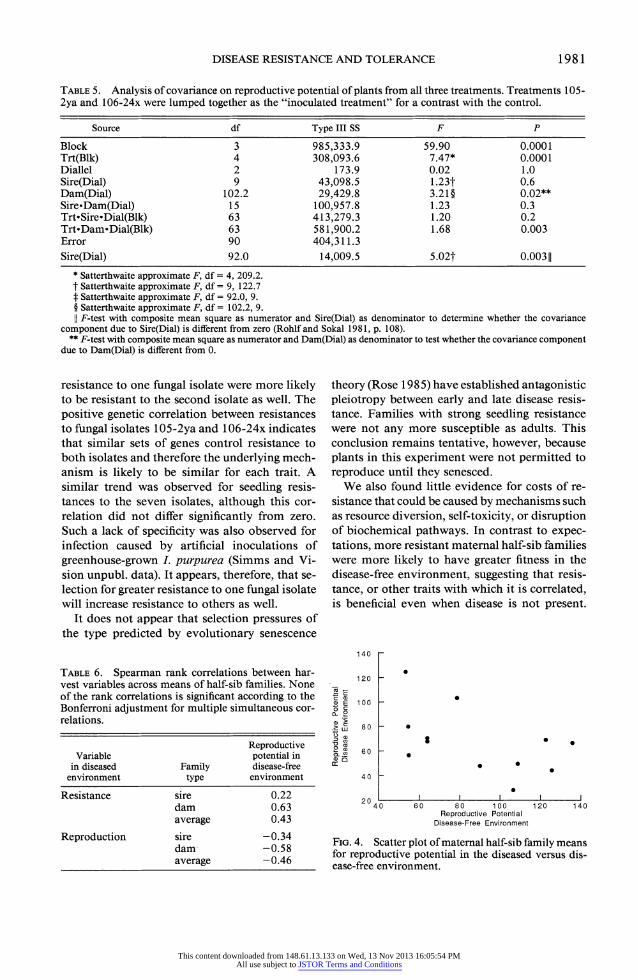
When inoculated plants were lumped into a single disease-present treatment and compared with uninoculated plants, the variance compo- nents associated with sire and dam effects were each significantly different from zero when tested with a two-tailed F-test (Rohlf and Sokal 1981, p. 108) using a composite mean square for the numerator (table 5). Under the Hocking inter- pretation of the mixed-model ANOVA, each of these tests indicates the presence of a negative genetic covariance of fitness in the diseased en- vironment with that in the disease-free environ- ment. In particular, the sire effect produced a significant negative correlation of high magni- tude (rg < -1.0). The correlation associated with the dam effect was also significantly less than zero but of lower magnitude (rg = -0.3). These cor- relations indicate that families with high fitness in the presence of disease tend to have lower fitness in the disease-free environment (fig. 4).
This content downloaded from 148.61.13.133 on Wed, 13 Nov 2013 16:05:54 PMAll use subject to JSTOR Terms and Conditions
1980 E. L. SIMMS AND J. TRIPLETT
120
E 00
80 0 _
Dw >' N 60
-o C.0
CL a) 2 0
406 -' 20_
30 40 50 60 70 80 90 100 Reproductive Potential
Isolate 1 05-2ya Environment
FIG. 3. Scatter plot of paternal half-sib family means for reproductive potential in the presence of isolates 105-2ya versus 106-24x.
This same pattern was reflected in the half-sib family mean correlations (table 6), although be- cause this method lacks the sensitivity of the ANOVA test (Fry 1992), these correlations were insignificant.
A significant treatment by maternal half-sib family component of variance in fitness (table 5) indicates that families vary in their reproductive decrement caused by disease. This result suggests the possibility of genetic variance for tolerance to disease in this experimental plant population. Although the interaction of treatment with pa- ternal half-sib family did not account for a sig- nificant component of variance, it was not sig- nificantly smaller than the interaction with ma- ternal half-sib family (F = 1.41; df = 63, 63; P = 0.09), suggesting that variance in the fitness
response to disease-caused damage may include additive as well as maternal effects.
Correlations between Damage and Reproduction
If tolerance is defined as the slope of a regres- sion of fitness on damage, then its cost may be estimated as the half-sib family correlation be- tween this value and the fitness of undamaged plants in the uninoculated treatment. We found a significant cost of tolerance when calculated across maternal half-sib families (rmate = -0.72, P = 0.008); the correlation among paternal half- sib families was of the same sign but not signif- icant (rpate,maj = -0.37, P = 0.2).
Maternal half-sib families that experienced more severe disease tended to produce fewer seeds in the disease-free environment (table 6). When correlations are evaluated according to the si- multaneous Bonferroni confidence interval, none of these relationships is significant. However, if the trends observed are meaningful, they suggest that rather than being costly, resistance, or some trait with which it is correlated, is beneficial even in the absence of disease.
DISCUSSION
Direct Costs of Resistance
We found little evidence that resistance to an- thracnose caused by Colletotrichum dematium involved fitness costs in this experimental pop- ulation of Ipomoea purpurea. First, there was no evidence for specificity (Parker 1992) or ecolog- ical (Simms and Rausher 1987) costs of resis- tance. Paternal half-sib families with greater adult
TABLE 4. Analysis of variance table for reproductive potential of plants inoculated by either isolates 105-2ya or 106-24x.
Source df Type III SS F P
Block 3 129,124.9 8.68 0.0001 Trt(Blk) 4 24,594.8 0.60* 0.6 Diallel 2 8901.4 0.90 0.4 Sire(Dial) 9 38,873.3 0.67t 0.7 Dam(Dial) 9 83,225.5 1.66? 0.1 Sire-Dam(Dial) 15 50,456.4 0.68 0.8 TrtPSire-Dial(Blk) 63 509,793.5 1.63 0.02 TrtPDam-Dial(Blk) 63 452,448.8 1.45 0.05 Error 92 456,146.8 Sire(Dial) 130.7 1.50: 0.0411
* Satterthwaite approximate F, df = 4, 192.6. t Satterthwaite approximate F, df = 9, 130.7. t Satterthwaite approximate F, df = 130.7, 9. ? Satterthwaite approximate F, df = 9, 130.6. 11 F-test with composite mean square as numerator and Sire(Dial) as denominator to determine whether the covariance
component due to Sire(Dial) is significantly different from zero (Rohlf and Sokal 1981, p. 108).
This content downloaded from 148.61.13.133 on Wed, 13 Nov 2013 16:05:54 PMAll use subject to JSTOR Terms and Conditions
DISEASE RESISTANCE AND TOLERANCE 1981
TABLE 5. Analysis of covariance on reproductive potential of plants from all three treatments. Treatments 105- 2ya and 106-24x were lumped together as the "inoculated treatment" for a contrast with the control.
Source df Type III SS F P
Block 3 985,333.9 59.90 0.0001 Trt(Blk) 4 308,093.6 7.47* 0.0001 Diallel 2 173.9 0.02 1.0 Sire(Dial) 9 43,098.5 1.23t 0.6 Dam(Dial) 102.2 29,429.8 3.21 ? 0.02** Sire-Dam(Dial) 15 100,957.8 1.23 0.3 TrtPSire-Dial(Blk) 63 413,279.3 1.20 0.2 TrtPDam*Dial(Blk) 63 581,900.2 1.68 0.003 Error 90 404,311.3 Sire(Dial) 92.0 14,009.5 5.02t 0.00311
* Satterthwaite approximate F, df = 4, 209.2. t Satterthwaite approximate F, df = 9, 122.7 t Satterthwaite approximate F, df = 92.0, 9. ? Satterthwaite approximate F, df = 102.2, 9. 11 F-test with composite mean square as numerator and Sire(Dial) as denominator to determine whether the covariance
component due to Sire(Dial) is different from zero (Rohlf and Sokal 1981, p. 108). ** F-test with composite mean square as numerator and Dam(Dial) as denominator to test whether the covariance component
due to Dam(Dial) is different from 0.
resistance to one fungal isolate were more likely to be resistant to the second isolate as well. The positive genetic correlation between resistances to fungal isolates 105-2ya and 106-24x indicates that similar sets of genes control resistance to both isolates and therefore the underlying mech- anism is likely to be similar for each trait. A similar trend was observed for seedling resis- tances to the seven isolates, although this cor- relation did not differ significantly from zero. Such a lack of specificity was also observed for infection caused by artificial inoculations of greenhouse-grown I. purpurea (Simms and Vi- sion unpubl. data). It appears, therefore, that se- lection for greater resistance to one fungal isolate will increase resistance to others as well.
It does not appear that selection pressures of the type predicted by evolutionary senescence
TABLE 6. Spearman rank correlations between har- vest variables across means of half-sib families. None of the rank correlations is significant according to the Bonferroni adjustment for multiple simultaneous cor- relations.
Reproductive Variable potential in
in diseased Family disease-free environment type environment
Resistance sire 0.22 dam 0.63 average 0.43
Reproduction sire -0.34 dam -0.58 average -0.46
theory (Rose 1985) have established antagonistic pleiotropy between early and late disease resis- tance. Families with strong seedling resistance were not any more susceptible as adults. This conclusion remains tentative, however, because plants in this experiment were not permitted to reproduce until they senesced.
We also found little evidence for costs of re- sistance that could be caused by mechanisms such as resource diversion, self-toxicity, or disruption of biochemical pathways. In contrast to expec- tations, more resistant maternal half-sib families were more likely to have greater fitness in the disease-free environment, suggesting that resis- tance, or other traits with which it is correlated, is beneficial even when disease is not present.
1 40 -
120 -
a) E 1 00
?U 8 0 6 4> ] 80 0
? a) 60-
20 40 _~~~~~~~~~~
40 60 80 100 120 140 Reproductive Potential
Disease-Free Environment
FIG. 4. Scatter plot of maternal half-sib family means for reproductive potential in the diseased versus dis- ease-free environment.
This content downloaded from 148.61.13.133 on Wed, 13 Nov 2013 16:05:54 PMAll use subject to JSTOR Terms and Conditions
1982 E. L. SIMMS AND J. TRIPLETT
Paternal half-sib families exhibited a qualita- tively similar but nonsignificant correlation.
Several hypotheses may be proposed to ex- plain our inability to detect direct fitness costs of resistance to anthracnose in I. purpurea. First, resistance may not involve substantial fitness costs. Simms (1992) argued that resistance may be costly when it first evolves, but that subse- quent selection can reduce or eliminate those costs. This phenomenon has been observed for resistance traits in populations under strong se- lection. For example, 10 yr after sheep blow flies (Lucilia cuprina) evolved resistance to diazinon, resistant flies had lower fitness relative to sus- ceptibles in the absence of the pesticide (Mc- Kenzie et al. 1982). At this point, the pesticide was abandoned. Nevertheless, after 10 yr more in a diazinon-free environment, these same pop- ulations were close to fixation for resistance, and resistance no longer involved any fitness decre- ment relative to susceptibility. A similar exam- ple involving resistance to phage in Escherichia coli is provided by Lenski (1988a,b). It is con- ceivable that I. purpurea and C. dematium have coevolved for a sufficiently long time that selec- tion has reduced the fitness costs associated with resistance in L purpurea to levels undetectable by our methods. This hypothesis can explain the lack of evidence for both allocation and speci- ficity costs of resistance but fails to explain either why resistant families are more fit in the absence of disease or why families with high fitness in the presence of disease do poorly in its absence.
Another explanation for our results is that re- sistance may be inducible. If costs were a func- tion of the level to which resistance is induced, then plants in the disease-free environment would not express resistance and therefore might not incur any allocation costs. Our experiment can- not measure the allocation costs associated with inducible resistance if they are not expressed in the disease-free environment. There is substan- tial evidence from the literature that resistance to pathogens often involves inducible steps (Keen 1992). Although we do not know whether local- ized resistance to C. dematium in L purpurea involves inducible components, experimental evidence suggests that resistance to anthracnose is likely to involve several different mechanisms, including inducible systemic acquired resistance (Simms and Vision 1995). Thus, in this experi- ment, when we defined resistance operationally as the extent of tissue damaged, we confounded our results by lumping all types of resistance into
one category. If systemic acquired resistance were an important component of variation in this op- erational measure, then our method would not measure the allocation cost of the most impor- tant component of resistance (Simms and Raush- er 1992).
A third explanation for our inability to detect direct fitness costs of resistance is that there was simply inadequate genetic variation in resistance in the experimental population to observe ge- netic correlations between resistance and fitness. This result could be due to two possible causes. First, the base population from which the ex- perimental population was drawn may have lacked such variation. If so, this current defi- ciency would not preclude the possibility that costs might be associated with resistance char- acters that were genetically variable in the past or may become so in the future (Simms and Rausher 1989). It is also possible that the pop- ulation possessed such variation but our sample was too small to incorporate it. Finally, resis- tance may be costly only under specific environ- mental conditions that were not present in this experiment.
Other Types of Trade-offs Despite the absence of direct evidence that
resistance is costly, we nonetheless found fitness trade-offs for I. purpurea growing in different dis- ease environments. For example, paternal half- sib families with higher fitness in the 105-2ya treatment had lower fitness when inoculated with isolate 106-24x. Furthermore, families with higher fitness in the presence of disease (averaged over both inoculation treatments) tended to be less fit in the disease-free environment.
One possible explanation for these results is that families might vary in their tolerance of dis- ease, and that tolerance might involve fitness costs. We found significant variance among ma- ternal half-sib families for an operational mea- sure of tolerance. Other researchers have ob- served variance in tolerance of herbivory in I. purpurea (Fineblum 1991; Eitzman unpubl. data; Simms and Dudley unpubl. data).
Tolerance of anthracnose also appears costly. Maternal families with high levels of tolerance had lower fitness in the disease-free environ- ment. Costs of tolerance have been reported pre- viously. For example, Painter (1987) observed that plants from grazing-tolerant populations were competitively inferior to those of grazing- intolerant populations when grown in the ab-
This content downloaded from 148.61.13.133 on Wed, 13 Nov 2013 16:05:54 PMAll use subject to JSTOR Terms and Conditions
DISEASE RESISTANCE AND TOLERANCE 1983
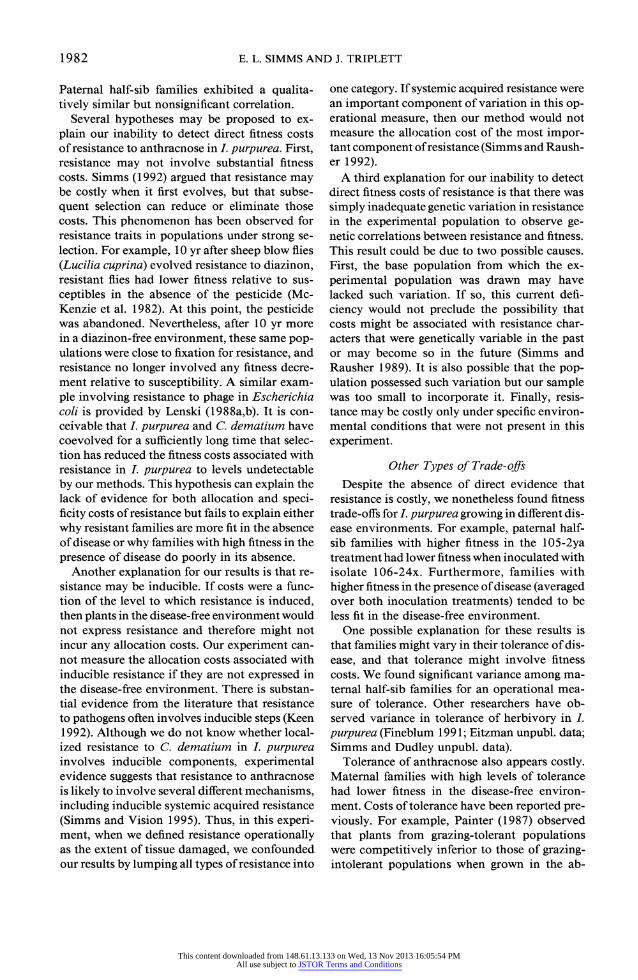
sence of herbivores. This fitness trade-off asso- ciated with tolerance might explain why families with higher fitness in the presence of disease (highly tolerant) had lower fitness in the disease- free environment where they paid a cost of tol- erance but received no benefit (fig. 5) (Fineblum 1991). In particular, if tolerance is negatively ge- netically correlated with resistance, susceptible genotypes will tend to be more tolerant (fig. 5A). These genotypes pay little cost of resistance, but they do incur a cost of tolerance (fig. 5C). Con- versely, resistant genotypes pay a cost of resis- tance (fig. 5B) but, because they tend to be less tolerant, they incur little cost of tolerance. In the absence of disease, any genotype would experi- ence either a high cost of resistance or a high cost of tolerance, but not both. If each trait involved the same magnitude of cost, then all individuals, whether resistant or tolerant, would pay the same cost and there would be neither a correlation between fitness in the absence of disease and resistance, nor a correlation between fitness in the absence of disease and tolerance (fig. 5D). If the cost of tolerance was greater than that of resistance, there might even be a positive genetic correlation between resistance and fitness in the absence of disease but a negative genetic corre- lation between fitness in the presence of disease and fitness in the disease-free environment.
Fineblum's hypothesis thus predicts some of the patterns we have observed: (1) families with higher disease resistance nevertheless had higher fitness in the disease-free environment, and (2) families with higher fitness in the presence of disease (averaged over both inoculation treat- ments) tended to be less fit in the disease-free environment. However, this hypothesis cannot explain the negative genetic correlation in repro- ductive potential we observed between the two treatments with different fungal isolates. More- over, although Fineblum (1991) found evidence for a trade-off in I. purpurea between resistance to insect herbivores that damaged the apical mer- istem and tolerance to their herbivory, we found no evidence for a negative correlation between resistance to C. dematium and tolerance of the anthracnose it produces (rpatemad = 0.3 1, P = 0.3; rmate.al = 0.1 1, P = 0.7).
Conclusions Our results suggest that the coevolution of
plants and pathogens is far more complex than current theory has considered. Resistance and tolerance traits interact in determining how dis-
A
0 C\
Resistance
B
4) o 7 0 7 cn a) cii
C
Resistance
C
cn 0
aI) ci)
Tolerance
D .
o " 0
U) N
a/) Z
"
High Tolerance Low Low Resistance High
FIG. 5. Graphical illustration of how costly disease tolerance can obscure detection of fitness costs of dis- ease resistance. A. Predicted genetic correlation be- tween resistance and tolerance. B. Fitness cost of re- sistance, alone. C. Fitness cost of tolerance, alone. D. Relationship between fitness and resistance or toler- ance when both traits are negatively genetically cor- related as illustrated in (A) and costs are as illustrated in (B) and (C).
ease influences plant fitness. Resistance is ben- eficial only when disease reduces fitness, which does not occur if plants are tolerant, and toler- ance can be expressed only when disease causes damage, which does not occur if plants possess
This content downloaded from 148.61.13.133 on Wed, 13 Nov 2013 16:05:54 PMAll use subject to JSTOR Terms and Conditions
1984 E. L. SIMMS AND J. TRIPLETT
resistance. Thus, these two types of traits will not evolve independently. Selection cannot act on resistance without also influencing tolerance, and vice versa. Models that do not incorporate this real complexity are likely to yield misleading pre- dictions.
ACKNOWLEDGMENTS
Many thanks to P. Becker and the other Wake Forest undergraduates who assisted us in the field. We also thank D. Pilsen, M. Rausher, C. Galen, and two anonymous reviewers for thoughtful comments on the manuscript. J.K.T. was sup- ported during the field work by the Howard Hughes Summer Undergraduate Research Pro- gram of the Department of Biology, Wake Forest University. This project was supported by Na- tional Science Foundation grants BSR 89-18030 and DEB 9196188-AO1 to E.L.S.
LITERATURE CITED
Agrios, G. N. 1988. Plant pathology, 2d ed. Academ- ic Press, New York.
Arx, J. A. von. 1970. A revision ofthe fungi classified as Gloeosporium, 2d ed. Cramer, New York.
Ayers, M. P., and D. L. Thomas. 1990. Alternative formulations of the mixed-model ANOVA applied to quantitative genetics. Evolution 44:221-226.
Becker, W. A. 1984. Manual of quantitative genetics, 4th ed. Academic Enterprises, Pullman, Wash.
Berenbaum, M. R., A. R. Zangerl, and J. K. Nitao. 1986. Constraints on chemical coevolution: wild parsnip and the parsnip webworm. Evolution 40: 1215-1228.
Burdon, J. J. 1987. Diseases and plant population biology. Cambridge University Press, Cambridge.
Burdon, J. J., and W. J. Muller. 1987. Measuring the cost of resistance to Puccinia coronata Cda in Avena fatua L. Journal of Applied Ecology 24:191-200.
Charlesworth, B. 1980. Evolution in age-structured populations. Cambridge University Press, Cam- bridge.
Crill, P. 1977. An assessment of stabilizing selection in crop variety development. Annual Review of Phytopathology 15:185-202.
Endler, J. A. 1986. Natural selection in the wild. Princeton University Press, Princeton, N.J.
Falconer, D. S. 1981. Introduction to quantitative genetics, 2d ed. Longman, London.
Fineblum, W. L. 1991. Genetic constraints on the evolution of resistance to host plant enemies. Ph.D. diss. Duke University, Durham, N.C.
Frank, S. A. 1993. Coevolutionary genetics of plants and pathogens. Evolutionary Ecology 7:45-75.
Fry, J. D. 1992. The mixed-model analysis of vari- ance applied to quantitative genetics: biological meaning of the parameters. Evolution 46:540-550.
1993. The "general vigor" problem: Can an- tagonistic pleiotropy be detected when genetic co- variances are positive? Evolution 47:327-333.
Grand, L. F. 1985. North Carolina plant index. North
Carolina Agricultural Research Service, Technical Bulletin 240. North Carolina $tate University, Ra- leigh.
Haldane, J. B. S. 1949. Disease and evolution. La Ricerca Scientifica 1 9(Supplement):68-79.
Hamilton, W. D. 1980. Sex versus non-sex versus parasite. Oikos 35:282-290.
Hamilton, W. D., R. Axelrod, and R. Tanese. 1990. Sexual reproduction as an adaptation to resistance parasites (a review). Proceedings of the National Academy of Sciences, USA 87:3566-3573.
Hocking, R. R. 1973. A discussion of the two-way mixed model. American Statistician 27:148-151.
1985. The analysis of linear models. Brooks/ Cole, Monterey, Calif.
Jaenike, J. 1978. An hypothesis to account for the maintenance of sex within populations. Evolution- ary Theory 3:191-194.
Keen, N. T. 1992. The molecular biology of disease resistance. Plant Molecular Biology 19:109-122.
Lenski, R. E. 1988a. Experimental studies of plei- otropy and epistasis in Eschericia coli. I. Variation in competitive fitness among mutants resistant to virus T4. Evolution 42:425-432.
1988b. Experimental studies of pleiotropy and epistasis in Escherichia coli. II. Compensation for maladaptive effects associated with resistance to virus T4. Evolution 42:433-440.
Leonard, K. J. 1977. Selection pressures and plant pathogens. Annals of the New York Academy of Science 287:207-222.
Leonard, K. J., and R. J. Czocher. 1980. Theory of genetic interactions among populations of plants and their pathogens. Annual Review of Phytopa- thology 18:237-258.
McKenzie, J. A., M. J. Whitten, and M. A. Adena. 1982. The effect of genetic background on the fit- ness of diazinon resistance genotypes of the Aus- tralian sheep blowfly, Lucilia cuprina. Heredity 49: 1-9.
Medawar, P. B. 1952. An unsolved problem in bi- ology. H. K. Lewis, London.
Mode, C. J. 1958. A mathematical model for the co- evolution of obligate parasites and their hosts. Evo- lution 12:158-165.
Nelson, R. R. 1973. The use of resistance genes to curb population shifts in plant pathogens. Pp. 49- 66 in R. R. Nelson, ed. Breeding plants for disease resistance. Pennsylvania State University Press, University Park.
Neter, J., W. Wasserman, and W. H. Kutner. 1990. Applied linear statistical models: regression, anal- ysis of variance, and experimental designs, 3d ed. Irwin, Homewood, Ill.
Oliver, L. R., R. E. Frans, and R. E. Talbert. 1976. Field competition between tall momingglory and soybean. I. Growth analysis. Weed Science 24:482- 488.
Painter, E. L. 1987. Grazing and intraspecific vari- ation in four North American grass species. Ph.D. diss. Colorado State University, Fort Collins.
Parker, M. A. 1992. Disease and plant population genetic structure. Pp. 345-362 in R. S. Fritz and E. L. Simms, eds. Plant resistance to herbivores and pathogens: ecology, evolution, and genetics. Uni- versity of Chicago Press, Chicago.
This content downloaded from 148.61.13.133 on Wed, 13 Nov 2013 16:05:54 PMAll use subject to JSTOR Terms and Conditions
DISEASE RESISTANCE AND TOLERANCE 1985
Parlevliet, J. E. 1981. Stabilizing selection in crop pathosystems: an empty concept or reality? Euphy- tica 30:259-269.
Rohlf, F. J., and R. R. Sokal. 1981. Statistical tables, 2d ed. Freeman, New York.
Rose, M. R. 1985. The evolution of senescence. Pp. 117-128 in P. J. Greenwood et al., eds. Evolution: essays in honour of John Maynard Smith. Cam- bridge University Press, Cambridge.
SAS Institute, Inc. 1989. SAS/STAT user's guide, version 6, 4th ed., vol. 2. SAS Institute, Cary, N.C.
ScheffEe, H. 1959. The analysis of variance. Wiley, New York.
Simms, E. L. 1992. Costs of plant resistance to her- bivory. Pp. 392-425 in R. S. Fritz and E. L. Simms, eds. Plant resistance to herbivores and pathogens: ecology, evolution, and genetics. University of Chi- cago Press, Chicago.
* 1993. Genetic variation for pathogen resis- tance in tall momingglory. Plant Disease 77:901- 904.
Simms, E. L., and M. D. Rausher. 1987. Costs and benefits of plant resistance to herbivory. American Naturalist 130:570-581.
. 1989. The evolution of resistance to herbiv-
ory in Ipomoea purpurea. II. Natural selection by insects and costs of resistance. Evolution 43:573- 585.
. 1992. Uses of quantitative genetics for study- ing the evolution of plant resistance. Pp. 42-68 in R. S. Fritz and E. L. Simms, eds. Plant resistance to herbivores and pathogens: ecology, evolution, and genetics. University of Chicago Press, Chicago.
. 1993. Patterns of selection on phytophage resistance in Ipomoea purpurea. Evolution 47:970- 976.
Simms, E. L., and T. J. Vision. 1995. Pathogen-in- duced systemic resistance in Ipomoea purpurea. Oecologia. In press.
Vanderplank, J. E. 1984. Disease resistance in plants, 2d ed. Academic Press, New York.
Via, S. 1984. The quantitative genetics of polyphagy in an insect herbivore. II. Genetic correlations in larval performance within and among host plants. Evolution 38:896-905.
Williams, G. C. 1957. Pleiotropy, natural selection, and the evolution of senescence. Evolution 11:398- 411.
Corresponding Editor: C. Galen
This content downloaded from 148.61.13.133 on Wed, 13 Nov 2013 16:05:54 PMAll use subject to JSTOR Terms and Conditions


![Damage tolerance of carbon-carbon composites in aerospace ... tolerance of... · in aerospace industries [1e3]. Superior thermal stability, wear resistance, heat transferability,](https://img.pdfslide.us/doc/110x75/60654cf5470fd52c9b794589/damage-tolerance-of-carbon-carbon-composites-in-aerospace-tolerance-of.jpg)


![Chuck Stephens Dave Newtonnebula2.deanza.edu/~newton/4B/4BLabManualClassic.pdfthe % tolerance. [RESISTANCE COLOR CODE] [TOLERANCE COLOR CODE] COLOR DIGIT MULT'R COLOR TOLERANCE Black](https://img.pdfslide.us/doc/110x75/5f84bc0ff3dc4445d62368c4/chuck-stephens-dave-newton4b4blabmanualclassicpdf-the-tolerance-resistance.jpg)